
POPULATION FLOW MONITORING NIGERIA 30 April 2019 - Flow...In Nigeria, FMPs were established in March...
5
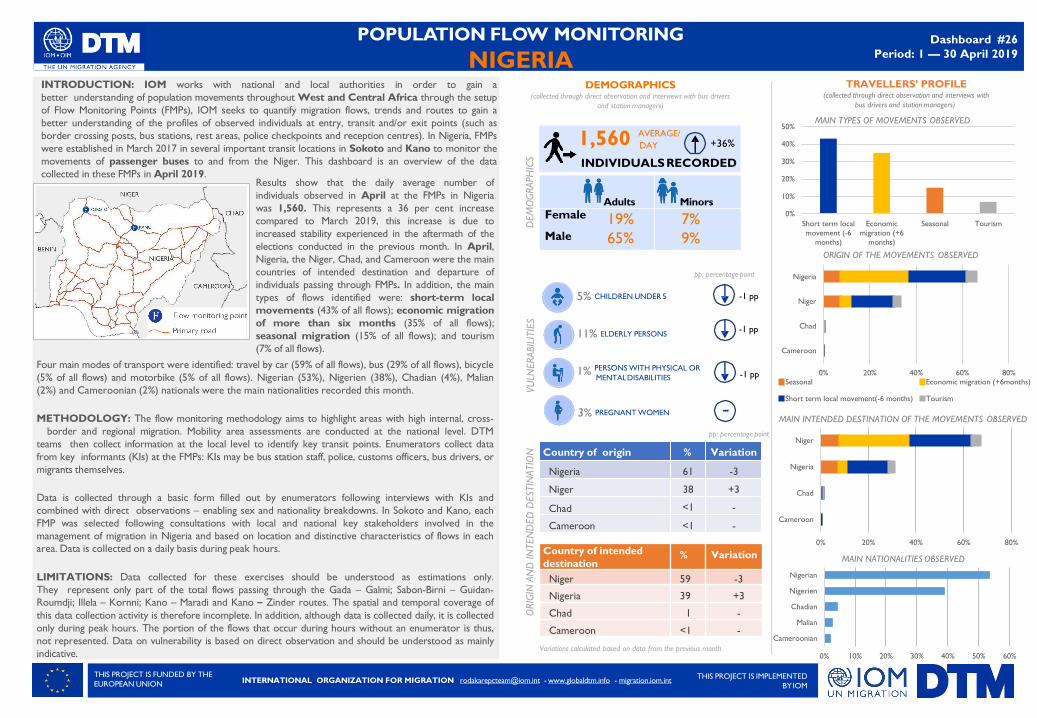
POPULATION FLOW MONITORING NIGERIA Dashboard #26 Period: 1 — 30 April 2019 INDIVIDUALS RECORDED 1,560 AVERAGE/ DAY +36% Country of origin % Variation Nigeria 61 -3 Niger 38 +3 Chad <1 - Cameroon <1 - Female Male Adults Minors 19% 65% 7% 9% INTRODUCTION: IOM works with national and local authorities in order to gain a better understanding of population movements throughout West and Central Africa through the setup of Flow Monitoring Points (FMPs), IOM seeks to quantify migration flows, trends and routes to gain a better understanding of the profiles of observed individuals at entry, transit and/or exit points (such as border crossing posts, bus stations, rest areas, police checkpoints and reception centres). In Nigeria, FMPs were established in March 2017 in several important transit locations in Sokoto and Kano to monitor the movements of passenger buses to and from the Niger. This dashboard is an overview of the data collected in these FMPs in April 2019. Results show that the daily average number of individuals observed in April at the FMPs in Nigeria was 1,560. This represents a 36 per cent increase compared to March 2019, this increase is due to increased stability experienced in the aftermath of the elections conducted in the previous month. In April, Nigeria, the Niger, Chad, and Cameroon were the main countries of intended destination and departure of individuals passing through FMPs. In addition, the main types of flows identified were: short-term local movements (43% of all flows); economic migration of more than six months (35% of all flows); seasonal migration (15% of all flows); and tourism (7% of all flows). Four main modes of transport were identified: travel by car (59% of all flows), bus (29% of all flows), bicycle (5% of all flows) and motorbike (5% of all flows). Nigerian (53%), Nigerien (38%), Chadian (4%), Malian (2%) and Cameroonian (2%) nationals were the main nationalities recorded this month. METHODOLOGY: The flow monitoring methodology aims to highlight areas with high internal, cross- border and regional migration. Mobility area assessments are conducted at the national level. DTM teams then collect information at the local level to identify key transit points. Enumerators collect data from key informants (KIs) at the FMPs: KIs may be bus station staff, police, customs officers, bus drivers, or migrants themselves. Data is collected through a basic form filled out by enumerators following interviews with KIs and combined with direct observations – enabling sex and nationality breakdowns. In Sokoto and Kano, each FMP was selected following consultations with local and national key stakeholders involved in the management of migration in Nigeria and based on location and distinctive characteristics of flows in each area. Data is collected on a daily basis during peak hours. LIMITATIONS: Data collected for these exercises should be understood as estimations only. They represent only part of the total flows passing through the Gada – Galmi; Sabon-Birni – Guidan- Roumdji; Illela – Kornni; Kano – Maradi and Kano – Zinder routes. The spatial and temporal coverage of this data collection activity is therefore incomplete. In addition, although data is collected daily, it is collected only during peak hours. The portion of the flows that occur during hours without an enumerator is thus, not represented. Data on vulnerability is based on direct observation and should be understood as mainly indicative. DEMOGRAPHICS (collected through direct observation and interviews with bus drivers and station managers) 11% ELDERLY PERSONS 5% CHILDREN UNDER 5 3% PREGNANT WOMEN 1% PERSONS WITH PHYSICAL OR MENTALDISABILITIES VULNERABILITIES DEMOGRAPHICS ORIGIN AND INTENDED DESTINATION ORIGIN OF THE MOVEMENTS OBSERVED MAIN INTENDED DESTINATION OF THE MOVEMENTS OBSERVED THIS PROJECT IS FUNDED BY THE EUROPEAN UNION THIS PROJECT IS IMPLEMENTED BYIOM MAIN NATIONALITIES OBSERVED Variations calculated based on data from the previous month TRAVELLERS’ PROFILE (collected through direct observation and interviews with bus drivers and station managers) MAIN TYPES OF MOVEMENTS OBSERVED pp: percentage point INTERNATIONAL ORGANIZATION FOR MIGRATION [email protected] - www.globaldtm.info - migration.iom.int pp: percentage point -1 pp Country of intended destination % Variation Niger 59 -3 Nigeria 39 +3 Chad 1 - Cameroon <1 - -1 pp - -1 pp 0% 10% 20% 30% 40% 50% Short term local movement (-6 months) Economic migration (+6 months) Seasonal Tourism 0% 20% 40% 60% 80% Cameroon Chad Niger Nigeria Seasonal Economic migration (+6months) Short term local movement(-6 months) Tourism 0% 20% 40% 60% 80% Cameroon Chad Nigeria Niger 0% 10% 20% 30% 40% 50% 60% Cameroonian Malian Chadian Nigerien Nigerian
Transcript of POPULATION FLOW MONITORING NIGERIA 30 April 2019 - Flow...In Nigeria, FMPs were established in March...
POPULATION FLOW MONITORING
NIGERIADashboard #26
Period: 1 — 30 April 2019
INDIVIDUALS RECORDED
1,560 AVERAGE/
DAY +36%
Country of origin % Variation
Nigeria 61 -3
Niger 38 +3
Chad <1 -
Cameroon <1 -
Female
Male
Adults Minors
19%
65%
7%
9%
INTRODUCTION: IOM works with national and local authorities in order to gain a
better understanding of population movements throughout West and Central Africa through the setup
of Flow Monitoring Points (FMPs), IOM seeks to quantify migration flows, trends and routes to gain a
better understanding of the profiles of observed individuals at entry, transit and/or exit points (such as
border crossing posts, bus stations, rest areas, police checkpoints and reception centres). In Nigeria, FMPs
were established in March 2017 in several important transit locations in Sokoto and Kano to monitor the
movements of passenger buses to and from the Niger. This dashboard is an overview of the data
collected in these FMPs in April 2019.Results show that the daily average number of
individuals observed in April at the FMPs in Nigeria
was 1,560. This represents a 36 per cent increase
compared to March 2019, this increase is due to
increased stability experienced in the aftermath of the
elections conducted in the previous month. In April,
Nigeria, the Niger, Chad, and Cameroon were the main
countries of intended destination and departure of
individuals passing through FMPs. In addition, the main
types of flows identified were: short-term local
movements (43% of all flows); economic migration
of more than six months (35% of all flows);
seasonal migration (15% of all flows); and tourism
(7% of all flows).
Four main modes of transport were identified: travel by car (59% of all flows), bus (29% of all flows), bicycle
(5% of all flows) and motorbike (5% of all flows). Nigerian (53%), Nigerien (38%), Chadian (4%), Malian
(2%) and Cameroonian (2%) nationals were the main nationalities recorded this month.
METHODOLOGY: The flow monitoring methodology aims to highlight areas with high internal, cross-
border and regional migration. Mobility area assessments are conducted at the national level. DTM
teams then collect information at the local level to identify key transit points. Enumerators collect data
from key informants (KIs) at the FMPs: KIs may be bus station staff, police, customs officers, bus drivers, or
migrants themselves.
Data is collected through a basic form filled out by enumerators following interviews with KIs and
combined with direct observations – enabling sex and nationality breakdowns. In Sokoto and Kano, each
FMP was selected following consultations with local and national key stakeholders involved in the
management of migration in Nigeria and based on location and distinctive characteristics of flows in each
area. Data is collected on a daily basis during peak hours.
LIMITATIONS: Data collected for these exercises should be understood as estimations only.
They represent only part of the total flows passing through the Gada – Galmi; Sabon-Birni – Guidan-
Roumdji; Illela – Kornni; Kano – Maradi and Kano – Zinder routes. The spatial and temporal coverage of
this data collection activity is therefore incomplete. In addition, although data is collected daily, it is collected
only during peak hours. The portion of the flows that occur during hours without an enumerator is thus,
not represented. Data on vulnerability is based on direct observation and should be understood as mainly
indicative.
DEMOGRAPHICS(collected through direct observation and interviews with bus drivers
and station managers)
11% ELDERLY PERSONS
5% CHILDREN UNDER 5
3% PREGNANT WOMEN
1% PERSONS WITH PHYSICAL OR
MENTALDISABILITIES
VU
LNERABIL
ITIE
SD
EM
OG
RAPH
ICS
ORIG
INAN
D IN
TEN
DED
DESTIN
ATIO
N
ORIGIN OF THE MOVEMENTS OBSERVED
MAIN INTENDED DESTINATION OF THE MOVEMENTS OBSERVED
THIS PROJECT IS FUNDED BY THE
EUROPEAN UNIONTHIS PROJECT IS IMPLEMENTED
BYIOM
MAIN NATIONALITIES OBSERVED
Variations calculated based on data from the previous month
TRAVELLERS’ PROFILE(collected through direct observation and interviews with
bus drivers and station managers)
MAIN TYPES OF MOVEMENTS OBSERVED
pp: percentage point
INTERNATIONAL ORGANIZATION FOR MIGRATION [email protected] - www.globaldtm.info - migration.iom.int
pp: percentage point
-1 pp
Country of intended
destination% Variation
Niger 59 -3
Nigeria 39 +3
Chad 1 -
Cameroon <1 -
-1 pp
-
-1 pp
0%
10%
20%
30%
40%
50%
Short term local
movement (-6
months)
Economic
migration (+6
months)
Seasonal Tourism
0% 20% 40% 60% 80%
Cameroon
Chad
Niger
Nigeria
Seasonal Economic migration (+6months)
Short term local movement(-6 months) Tourism
0% 20% 40% 60% 80%
Cameroon
Chad
Nigeria
Niger
0% 10% 20% 30% 40% 50% 60%
Cameroonian
Malian
Chadian
Nigerien
Nigerian
POPULATION FLOW MONITORING
NIGERIA - SokotoDashboard #26
Period: 1 — 30 April 2019
INDIVIDUALS RECORDED
454 AVERAGE/
DAY +16%
Country of origin % Variation
Niger 62 -
Nigeria 38 -
Female
Male
Adults Minors
23%
63%
5%
9%
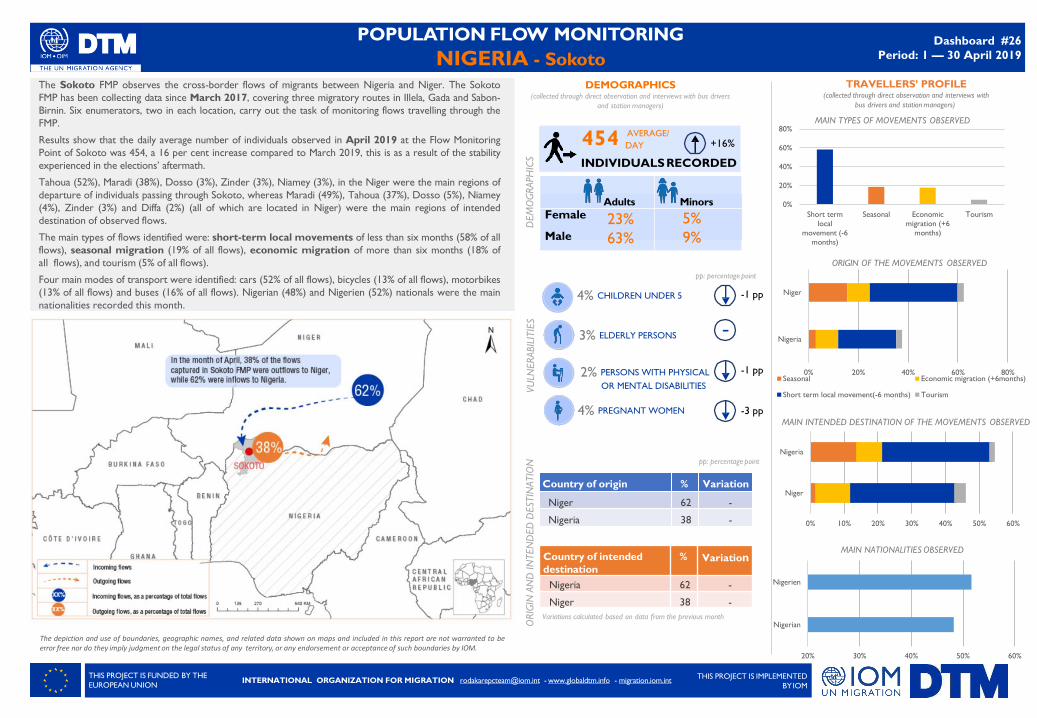
The Sokoto FMP observes the cross-border flows of migrants between Nigeria and Niger. The Sokoto
FMP has been collecting data since March 2017, covering three migratory routes in Illela, Gada and Sabon-
Birnin. Six enumerators, two in each location, carry out the task of monitoring flows travelling through the
FMP.
Results show that the daily average number of individuals observed in April 2019 at the Flow Monitoring
Point of Sokoto was 454, a 16 per cent increase compared to March 2019, this is as a result of the stability
experienced in the elections’ aftermath.
Tahoua (52%), Maradi (38%), Dosso (3%), Zinder (3%), Niamey (3%), in the Niger were the main regions of
departure of individuals passing through Sokoto, whereas Maradi (49%), Tahoua (37%), Dosso (5%), Niamey
(4%), Zinder (3%) and Diffa (2%) (all of which are located in Niger) were the main regions of intended
destination of observed flows.
The main types of flows identified were: short-term local movements of less than six months (58% of all
flows), seasonal migration (19% of all flows), economic migration of more than six months (18% of
all flows), and tourism (5% of all flows).
Four main modes of transport were identified: cars (52% of all flows), bicycles (13% of all flows), motorbikes
(13% of all flows) and buses (16% of all flows). Nigerian (48%) and Nigerien (52%) nationals were the main
nationalities recorded this month.
DEMOGRAPHICS(collected through direct observation and interviews with bus drivers
and station managers)
3% ELDERLY PERSONS
4% CHILDREN UNDER 5
4% PREGNANT WOMEN
2% PERSONS WITH PHYSICAL
OR MENTAL DISABILITIESVU
LNERABIL
ITIE
SD
EM
OG
RAPH
ICS
Country of intended
destination
% Variation
Nigeria 62 -
Niger 38 -
ORIG
INAN
DIN
TEN
DED
DESTIN
ATIO
N
ORIGIN OF THE MOVEMENTS OBSERVED
MAIN INTENDED DESTINATION OF THE MOVEMENTS OBSERVED
THIS PROJECT IS FUNDED BY THE
EUROPEAN UNIONTHIS PROJECT IS IMPLEMENTED
BYIOM
MAIN NATIONALITIES OBSERVED
Variations calculated based on data from the previous month
TRAVELLERS’ PROFILE(collected through direct observation and interviews with
bus drivers and station managers)
MAIN TYPES OF MOVEMENTS OBSERVED
pp: percentage point
INTERNATIONAL ORGANIZATION FOR MIGRATION [email protected] - www.globaldtm.info - migration.iom.int
pp: percentage point
The depiction and use of boundaries, geographic names, and related data shown on maps and included in this report are not warranted to beerror free nor do they imply judgment on the legal status of any territory, or any endorsement or acceptance of such boundaries by IOM.
-3 pp
-1 pp
-1 pp
-
20% 30% 40% 50% 60%
Nigerian
Nigerien
0% 10% 20% 30% 40% 50% 60%
Niger
Nigeria
0% 20% 40% 60% 80%
Nigeria
Niger
Seasonal Economic migration (+6months)
Short term local movement(-6 months) Tourism
0%
20%
40%
60%
80%
Short term
local
movement (-6
months)
Seasonal Economic
migration (+6
months)
Tourism
Base Map Source : ESRI. The maps in this report are for illustration purposes only. The depiction and use of boundaries, geographic names, and related data shown on maps and included in this report are not warranted to be error free nor do they imply judgment on the legal status of any territory, or any endorsement or acceptance of such boundaries by IOM.
POPULATION FLOW MONITORING
NIGERIA - SokotoDashboard #26
Period: 1 — 30 April 2019
EVOLUTION OF THE NUMBER OF OBSERVED INDIVIDUALS DURING APRIL 2019Data collected for these exercisesshould be understood as estimationsonly. IOM does not make anywarranties or representations as to theappropriateness, quality, reliability,timeliness, accuracy or completeness ofthe data included in this report.
Credentials: For any informationextracted from this document,whether quoted, paraphrased or used inany way, the source must bementioned as follows : “Source:International Organization forMigration, [Month, Year],Displacement Tracking Matrix (DTM)”.
THIS PROJECT IS FUNDED BY THE
EUROPEAN UNIONTHIS PROJECT IS IMPLEMENTED
BYIOMINTERNATIONAL ORGANIZATION FOR MIGRATION [email protected] - www.globaldtm.info - migration.iom.int
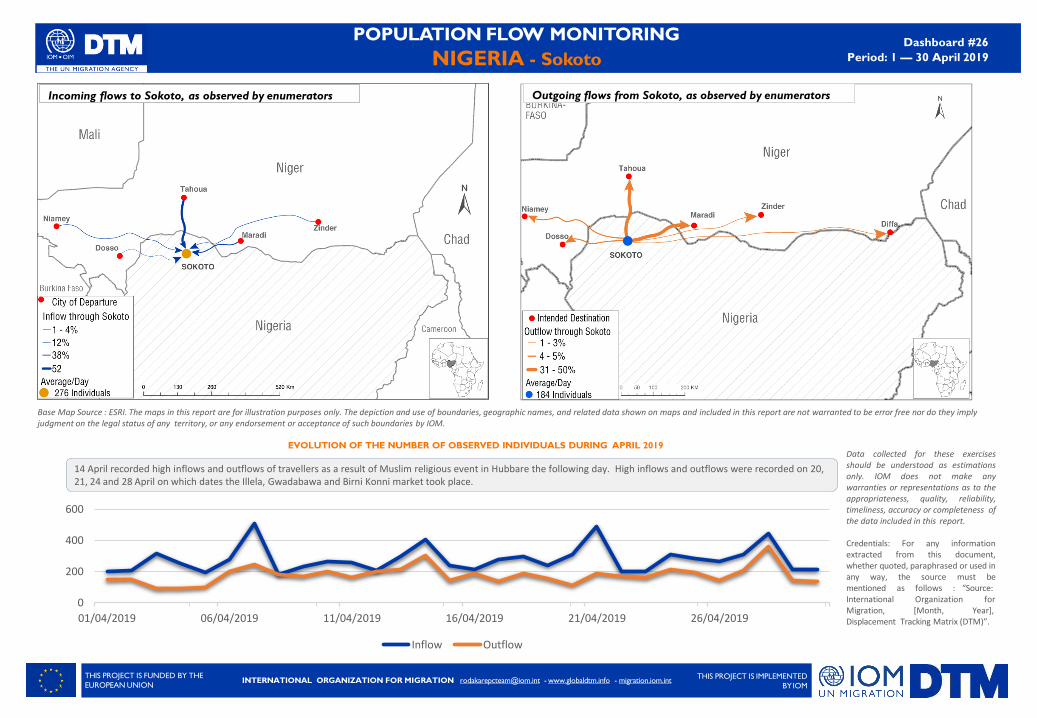
14 April recorded high inflows and outflows of travellers as a result of Muslim religious event in Hubbare the following day. High inflows and outflows were recorded on 20,21, 24 and 28 April on which dates the Illela, Gwadabawa and Birni Konni market took place.
Incoming flows to Sokoto, as observed by enumerators Outgoing flows from Sokoto, as observed by enumerators
0
200
400
600
01/04/2019 06/04/2019 11/04/2019 16/04/2019 21/04/2019 26/04/2019
Inflow Outflow
POPULATION FLOW MONITORING
NIGERIA - Kano
Dashboard #26
Period: 1 — 30 April 2019
1106INDIVIDUALS RECORDED
AVERAGE/ DAY
Country of origin % Variation
Nigeria 75 -1pp
Niger 24 +1pp
Chad <1 -
Cameroon <1 -
Female
Male
Adults Minors
17%
66%
8%
9%
DEMOGRAPHICS(collected through direct observation and interviews with bus drivers
and station managers)
pp: percentage point
15% ELDERLY PERSONS
5% CHILDREN UNDER 5
1% PERSONS WITH PHYSICAL
OR MENTAL DISABILITIES
VU
LNERABIL
ITIE
SD
EM
OG
RAPH
ICS
Country of intended
destination
% Variation
Niger 73 +1 pp
Nigeria 24 -
Chad 2 -1 pp
Cameroon 1 -
ORIG
INAN
DIN
TEN
DED
DESTIN
ATIO
N
ORIGIN OF THE MOVEMENTS OBSERVED
MAIN INTENDED DESTINATION OF THE MOVEMENTS OBSERVED
THIS PROJECT IS FUNDED BY THE
EUROPEAN UNIONTHIS PROJECT IS IMPLEMENTED
BYIOM
MAIN NATIONALITIES OBSERVED
Variations calculated based on data from the previous month
TRAVELLERS’ PROFILE(collected through direct observation and interviews with
bus drivers and station managers)
MAIN TYPES OF MOVEMENTS OBSERVED
+11%
INTERNATIONAL ORGANIZATION FOR MIGRATION [email protected] - www.globaldtm.info - migration.iom.int
-1 pp
pp: percentage point
-
-
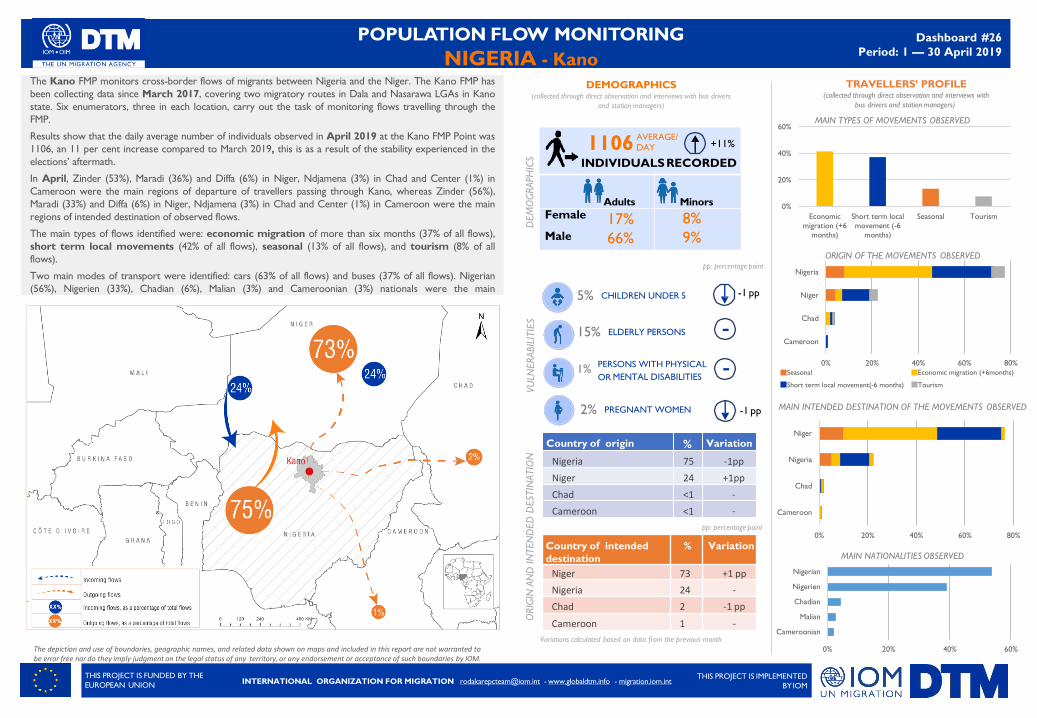
The Kano FMP monitors cross-border flows of migrants between Nigeria and the Niger. The Kano FMP has
been collecting data since March 2017, covering two migratory routes in Dala and Nasarawa LGAs in Kano
state. Six enumerators, three in each location, carry out the task of monitoring flows travelling through the
FMP.
Results show that the daily average number of individuals observed in April 2019 at the Kano FMP Point was
1106, an 11 per cent increase compared to March 2019, this is as a result of the stability experienced in the
elections’ aftermath.
In April, Zinder (53%), Maradi (36%) and Diffa (6%) in Niger, Ndjamena (3%) in Chad and Center (1%) in
Cameroon were the main regions of departure of travellers passing through Kano, whereas Zinder (56%),
Maradi (33%) and Diffa (6%) in Niger, Ndjamena (3%) in Chad and Center (1%) in Cameroon were the main
regions of intended destination of observed flows.
The main types of flows identified were: economic migration of more than six months (37% of all flows),
short term local movements (42% of all flows), seasonal (13% of all flows), and tourism (8% of all
flows).
Two main modes of transport were identified: cars (63% of all flows) and buses (37% of all flows). Nigerian
(56%), Nigerien (33%), Chadian (6%), Malian (3%) and Cameroonian (3%) nationals were the main
nationalities recorded this month.
The depiction and use of boundaries, geographic names, and related data shown on maps and included in this report are not warranted tobe error free nor do they imply judgment on the legal status of any territory, or any endorsement or acceptance of such boundaries by IOM.
-1 pp2% PREGNANT WOMEN
0% 20% 40% 60%
Cameroonian
Malian
Chadian
Nigerien
Nigerian
0% 20% 40% 60% 80%
Cameroon
Chad
Nigeria
Niger
0% 20% 40% 60% 80%
Cameroon
Chad
Niger
Nigeria
Seasonal Economic migration (+6months)
Short term local movement(-6 months) Tourism
0%
20%
40%
60%
Economic
migration (+6
months)
Short term local
movement (-6
months)
Seasonal Tourism

Base Map Source : ESRI. The maps in this report are for illustration purposes only. The depiction and use of boundaries, geographic names, and related data shown on maps and included in this report are not warranted to be error free nor do they imply judgment on the legal status of any territory, or any endorsement or acceptance of such boundaries by IOM.
Data collected for these exercises
POPULATION FLOW MONITORING
NIGERIA - Kano
Dashboard #26
Period: 1 — 30 April 2019
EVOLUTION OF THE NUMBER OF OBSERVED INDIVIDUALS DURING APRIL 2019 should be understood as estimationsonly. IOM does not make anywarranties or representations as to theappropriateness, quality, reliability,timeliness, accuracy or completeness ofthe data included in this report.
Credentials: For any informationextracted from this document,whether quoted, paraphrased or used inany way, the source must bementioned as follows : “Source:International Organization forMigration, [Month, Year],Displacement Tracking Matrix (DTM)”.
THIS PROJECT IS FUNDED BY THE
EUROPEAN UNIONTHIS PROJECT IS IMPLEMENTED
BYIOMINTERNATIONAL ORGANIZATION FOR MIGRATION [email protected] - www.globaldtm.info - migration.iom.int
Incoming flows to Kano, as
observed by enumeratorsOutgoing flows from Kano,
as observed by enumerators
8 – 10 April recorded high outflows and inflows as a result of the market days; traders from Zinder in the Niger came to Nigerian markets to buy and sellgoods27 April recorded high outflows as a result of the market in Zinder, hence the reduced outflows observed on the previous day (26 April).
0
500
1000
1500
4/1/2019 4/6/2019 4/11/2019 4/16/2019 4/21/2019 4/26/2019
Inflow Outflow


![KALKI Communication Technologies Limited Bangalore, India · EPCL Nigeria, Load flow, short circuit studies [Conventional/IEC 60909], Relay coordination, Transient Stability, Insulation](https://static.fdocuments.us/doc/165x107/5ac8f1e67f8b9aa3298c8b67/kalki-communication-technologies-limited-bangalore-nigeria-load-flow-short-circuit.jpg)