
Popular Annual Financial Report - SC Public Employee ... · Fiduciary Performance Audit . ......
21
Popular Annual Financial Report South Carolina Retirement Systems For the fiscal year ended June 30, 2015 Pension trust funds of the State of South Carolina
Transcript of Popular Annual Financial Report - SC Public Employee ... · Fiduciary Performance Audit . ......

Popular Annual Financial Report
South Carolina Retirement Systems For the fiscal year ended June 30, 2015
Pension trust funds of the State of South Carolina


POPULAR ANNUAL FINANCIAL REPORT
Table of Contents Introduction ................................................................................................................................................................ 1
Profile of the Systems ................................................................................................................................................. 2
Membership and Annuitant Composition .................................................................................................................. 3
Fiscal Year 2015 Highlights ......................................................................................................................................... 4
Summary of Financial Condition................................................................................................................................. 6
Statement of Fiduciary Net Position .......................................................................................................................... 8
Statement of Changes in Fiduciary Net Position ........................................................................................................ 9
Fiduciary Net Position – Five Years Ended 6/30/2015 ............................................................................................. 10
Summary of Additions and Deductions – Five Years Ended 6/30/2015 ................................................................... 10
Investments Overview .............................................................................................................................................. 11
List of Largest Assets Held ........................................................................................................................................ 15
GFOA Award for Outstanding Achievement............................................................................................................. 16
PPCC Public Pension Standards 2015 Award ............................................................................................................ 16

POPULAR ANNUAL FINANCIAL REPORT 1
South Carolina Public Employee Benefit Authority Retirement Division
South Carolina Retirement Systems
Popular Annual Financial Report For the Fiscal Year Ended June 30, 2015
Pension Trust Funds of the State of South Carolina
To our Members We are pleased to present to you the South Carolina Retirement Systems’ twelfth annual popular report. This report is intended to provide a summary of the Systems’ annual financial information in an easily understandable format that supplements the more thorough Comprehensive Annual Financial Report (CAFR).
Data presented in this report was derived from the fiscal year 2015 CAFR, which was prepared in accordance with Generally Accepted Accounting Principles. To learn more about the Systems’ financial activities, please visit our website at www.peba.sc.gov.
The CAFR contains more detailed information and may be viewed online or downloaded from our website on the “Facts and Figures” page at www.peba.sc.gov. For any other questions or assistance, please contact Customer Contact Center at 803.737.6800 or 888.260.9430, or visit www.peba.sc.gov.
Peggy G. Boykin, CPA Travis J. Turner, CPA, CISA Tammy B. Nichols, CPA Executive Director Chief Financial Officer Retirement Finance Director
S.C. Public Employee Benefit Authority 202 Arbor Lake Drive Columbia, SC 29223 www.peba.sc.gov
Duplication of this report, either in part or in whole, is forbidden without the express written permission of the S.C. Public Employee Benefit Authority.
© 2015 S.C. Public Employee Benefit Authority
POPULAR ANNUAL FINANCIAL REPORT 2
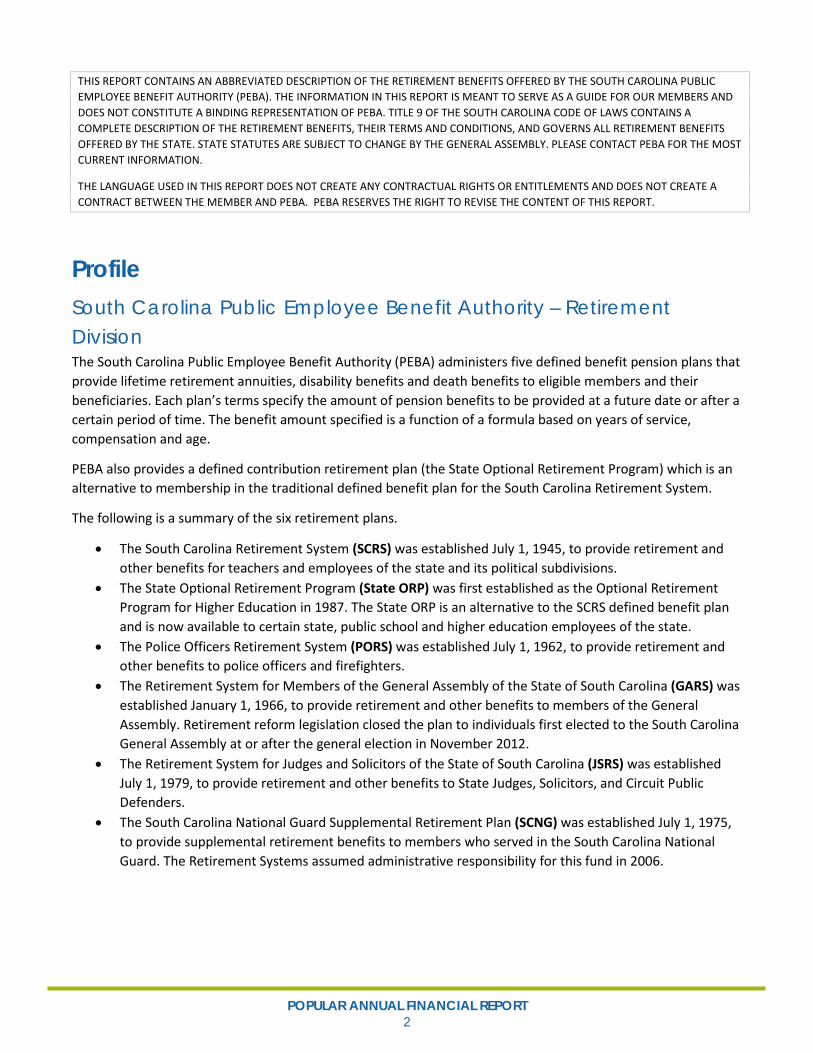
THIS REPORT CONTAINS AN ABBREVIATED DESCRIPTION OF THE RETIREMENT BENEFITS OFFERED BY THE SOUTH CAROLINA PUBLIC EMPLOYEE BENEFIT AUTHORITY (PEBA). THE INFORMATION IN THIS REPORT IS MEANT TO SERVE AS A GUIDE FOR OUR MEMBERS AND DOES NOT CONSTITUTE A BINDING REPRESENTATION OF PEBA. TITLE 9 OF THE SOUTH CAROLINA CODE OF LAWS CONTAINS A COMPLETE DESCRIPTION OF THE RETIREMENT BENEFITS, THEIR TERMS AND CONDITIONS, AND GOVERNS ALL RETIREMENT BENEFITS OFFERED BY THE STATE. STATE STATUTES ARE SUBJECT TO CHANGE BY THE GENERAL ASSEMBLY. PLEASE CONTACT PEBA FOR THE MOST CURRENT INFORMATION.
THE LANGUAGE USED IN THIS REPORT DOES NOT CREATE ANY CONTRACTUAL RIGHTS OR ENTITLEMENTS AND DOES NOT CREATE A CONTRACT BETWEEN THE MEMBER AND PEBA. PEBA RESERVES THE RIGHT TO REVISE THE CONTENT OF THIS REPORT.
Profile South Carolina Public Employee Benefit Authority – Retirement Division The South Carolina Public Employee Benefit Authority (PEBA) administers five defined benefit pension plans that provide lifetime retirement annuities, disability benefits and death benefits to eligible members and their beneficiaries. Each plan’s terms specify the amount of pension benefits to be provided at a future date or after a certain period of time. The benefit amount specified is a function of a formula based on years of service, compensation and age.
PEBA also provides a defined contribution retirement plan (the State Optional Retirement Program) which is an alternative to membership in the traditional defined benefit plan for the South Carolina Retirement System.
The following is a summary of the six retirement plans.
• The South Carolina Retirement System (SCRS) was established July 1, 1945, to provide retirement and other benefits for teachers and employees of the state and its political subdivisions.
• The State Optional Retirement Program (State ORP) was first established as the Optional Retirement Program for Higher Education in 1987. The State ORP is an alternative to the SCRS defined benefit plan and is now available to certain state, public school and higher education employees of the state.
• The Police Officers Retirement System (PORS) was established July 1, 1962, to provide retirement and other benefits to police officers and firefighters.
• The Retirement System for Members of the General Assembly of the State of South Carolina (GARS) was established January 1, 1966, to provide retirement and other benefits to members of the General Assembly. Retirement reform legislation closed the plan to individuals first elected to the South Carolina General Assembly at or after the general election in November 2012.
• The Retirement System for Judges and Solicitors of the State of South Carolina (JSRS) was established July 1, 1979, to provide retirement and other benefits to State Judges, Solicitors, and Circuit Public Defenders.
• The South Carolina National Guard Supplemental Retirement Plan (SCNG) was established July 1, 1975, to provide supplemental retirement benefits to members who served in the South Carolina National Guard. The Retirement Systems assumed administrative responsibility for this fund in 2006.

POPULAR ANNUAL FINANCIAL REPORT 3
Membership and Annuitant Composition As of June 30, 2015
Total Membership
South Carolina Retirement
System
Police Officers
Retirement System
General Assembly
Retirement System 1
Judges and Solicitors
Retirement System2
South Carolina National Guard Supplemental
Retirement Plan
Active 187,386 26,582 106 137 12,167 Inactive 160,259 12,705 55 2 2,068 Retirees & Beneficiaries3 134,634 16,810 362 206 4,648
Active Members Average Age 45 39 55 55 35 Average Years of Service 10 9 13 13 12 Average Annual Salary $37,724 $37,776 $22,269 $129,465 N/A4
Annuitants and Beneficiaries Average Current Age 69 65 73 71 70 Average Age at Retirement5 59 55 61 60 60 Average Years of Service at Retirement 23 19 20 26 26 Average AFC6 at Retirement $42,677 $44,201 $21,701 $116,817 N/A Average Current Annual Benefit7 $19,774 $19,638 $18,436 $81,180 $914
1There were 170 GARS positions in in fiscal year 2015. 2There were 153 JSRS positions in fiscal year 2015. 3Represents members who retired, including those who participate in the Teacher and Employee Retention Incentive (TERI) program or who returned to employment as a working retiree, and surviving beneficiaries of former members. 4The South Carolina National Guard Supplemental Retirement Plan is non-contributory; therefore, active member salaries are not reported to the Systems. 5Represents retired members who are currently receiving annuity benefits, including members who may have received benefits under a deferred retirement option (i.e. TERI). Disability retirees and surviving beneficiary payees are excluded. 6Average Final Compensation (AFC) is a component used in the formula for calculating annuity benefits. 7Includes benefit adjustments applied since retirement.

POPULAR ANNUAL FINANCIAL REPORT 4
Fiscal Year 2015 Highlights PEBA’s Organizational Structure A major focus during fiscal year 2015 was the review and assessment of the reasonableness and adequacy of PEBA’s organizational structure as it related to administration of the retirement and insurance programs. In an effort to streamline the flow of communication, merge common core business functions, and maintain sufficient staffing, the agency was restructured and many positions that had previously been left vacant were filled. Operational consolidation was necessary in some areas to eliminate overlapping responsibilities. As a result, the previously separate Insurance Benefits and Retirement Benefits operational functions were consolidated under the management of the Chief Financial Officer position. Organizational changes were designed to make PEBA function more efficiently, effectively, and most importantly, responsively to its stakeholder groups. This goal was also the mitigating factor behind the creation of the new Employer Services Unit which is still being developed.
Fiduciary Performance Audit Beginning in October 2014, Funston Advisory Services (FAS), with oversight from the South Carolina Office of the State Inspector General (SIG), conducted a fiduciary performance audit of PEBA. The purpose of the audit was to critically evaluate the fiduciary roles and responsibilities of PEBA and staff; the relationship with other fiduciaries of the Retirement Systems; and the operational policies and practices of PEBA. The goal of the audit was to identify areas of strengths and weaknesses, provide comparison with leading practices of other retirement plans and make recommendations for improvement.
The final FAS report, which was issued on January 16, 2015, contained 113 recommended improvements. Of the recommendations presented, 102 can be addressed by PEBA directly; however, legislative changes by the General Assembly will be needed for the remaining 11. After the final FAS report was issued, PEBA staff incorporated the audit recommendations into PEBA’s strategic action plans for the organization. The Board of Directors adopted the action plans during its March 2015 retreat. As of June 30, 2015, PEBA had completed 47 of the recommendations. In summary, PEBA’s efforts to continue implementation of recommendations from FAS’ fiduciary audit report, include a plan to complete 28 of the tasks in fiscal year 2016; 11 in fiscal year 2017; and six in fiscal year 2018.
PEBA Operational Assessment During fiscal year 2015, PEBA began a broad operational assessment to evaluate its business processes and procedures for consolidating the Insurance and Retirement information technology systems. One of the goals of the assessment is to increase the availability of online services for employers and members. PEBA will also ensure that its information technology resources are deployed in the safest and most secure manner feasible. The initial assessment is scheduled to be completed by June 2016 and will include a roadmap and recommendations for implementation moving forward.
Cost Effectiveness Measurement (CEM) In March 2015, results from PEBA’s participation in Cost Effectiveness Measurement (CEM), Inc.’s benchmarking survey for the Retirement Systems for fiscal year 2014 were communicated to the Board and management. Results indicated that the Retirement Systems’ annual administrative cost per active member and annuitant was $31 which was a 12.4 percent decrease over the past fiscal year and $47 below the peer median of $78. The Retirement Systems’ cost per member was lower in all pension administration categories and was the 4th lowest overall cost in CEM’s universe. Primary reasons for the differences in total cost were lower costs per full

POPULAR ANNUAL FINANCIAL REPORT 5
time equivalent (FTE) position and lower costs for back office activities. PEBA also experienced a decreased allocation of FTE’s to pension administration responsibilities during FY2014. Additionally, the survey results reported that the Retirement Systems’ total service score of 76 was below the peer median of 80. Service scores are based on turnaround times, availability, choices, content and quality. Trends in pension administration include improved electronic communication and transactions, targeting and segmentation of membership and retirement preparedness. Recommendations for improving service scores are being evaluated.
Electronic Employer Services (EES) PEBA also unveiled a new feature on our secure Electronic Employer Services (EES) website that allows participating employers to initiate and submit retirement enrollment elections for newly hired employees through EES. The online enrollment should eliminate most paper forms and processes.
GASB 68 Update During fiscal year 2015, PEBA staff continued to work closely with the external actuary and participating employers to provide education and information to participating employers in order for them to implement the requirements of Governmental Accounting Standards Board (GASB) Statement 68. The first GASB 68 Special Audit as of the June 30, 2014, Measurement Date was completed by our external audit firm for which an unmodified opinion was issued. Staff also continued to enhance PEBA’s online GASB resource center.
PEBA’s Unique Identity PEBA put forth significant effort to introduce and promote a unique identity for the agency. PEBA introduced a distinctive graphic element and tagline as tools to help educate stakeholders about the agency and reflect the consolidation of the administration of the state’s public employee insurance and retirement benefits programs. The new identity elements are part of a broader educational campaign to inform stakeholders of PEBA’s existence as a state agency and to clarify that the agency is responsible for both the state’s employee insurance programs and the retirement systems. The new identity elements have been incorporated into this year’s Popular Annual Financial Report.
Summary of Financial Condition The main funding objective of the pension trust funds is to meet future benefit obligations of retirees and beneficiaries through employee and employer contributions and investment earnings. Each year, the external consulting actuaries determine the actuarial soundness of the plans based on long term obligations and the sufficiency of current contribution levels to fund the liabilities of each plan over a reasonable time frame. As of the July 1, 2014 valuations, funding levels of all the plans are such that annual expected contributions are sufficient to maintain a funding period that does not exceed 30 years; however, because the market value of assets is less than the actuarial value of assets, there are currently deferred investment losses that will either be offset by future investment gains or be recognized as investment losses in future years. The changes in the levels of funding do not affect the availability of funds or resources for future use and actuarial projections indicate that unfunded liabilities should be amortized and funded within acceptable funding guidelines.
The July 1, 2014, actuarial valuations, adopted by the PEBA Board and subsequently provided to the S.C. State Fiscal Accountability Authority, determined the actuarial status of each plan and concluded that the employee and employer contribution requirements for fiscal year 2017 will remain unchanged from the rates scheduled to be in effect for fiscal year 2016.

POPULAR ANNUAL FINANCIAL REPORT 6
The funded ratios of the five plans as of July 1, 2014, range from a low of 38.7 percent for SCNG to a high of 69.5 percent for PORS. The funded ratio for SCRS, which represents the largest membership of the five plans, increased from 62.5 percent to 62.7 percent while PORS went up from 69.2 percent to 69.5 percent. Changes in funded ratios were primarily due to increased contribution levels and the recognition of investment gains and losses which are recognized using a five-year smoothing method. Based on the current funding policy and absent future unfavorable experience, the funded ratio (on an actuarial value of asset basis) is expected to remain relatively constant for the next several years then begin to gradually improve. The funded ratio of SCNG continues to be very low because at one time, the plan was not funded on an actuarially sound basis. However, since 2006 when the General Assembly transferred administrative responsibility to the Retirement Division, their commitment to ensure the SCNG plan would be sufficiently funded prospectively has been maintained and the funded ratio has steadily improved. Each year recurring funds are set aside in the state’s annual budget to fund SCNG over an amortization period that does not exceed 30 years, so continued future improvement in the funded ratio is expected.
As of July 1, 2014, the unfunded actuarial accrued liability for SCRS increased from $15.4 billion to $16.0 billion and PORS increased from $1.74 billion to $1.80 billion. The largest source of increase was the result of continual recognition of deferred investment losses in the actuarial value of assets. Absent significant favorable investment experience, those deferred losses will continue to be reflected, or smoothed, in the actuarial value of assets over the next few years. Other non-investment related experience activity such as mortality, salary experience, payroll growth and turnover, which are considered normal within the course of plan experience, contributed to other actuarial gains and losses, as actual experience cannot be precisely predicted and will never exactly match the estimated assumptions.
Actuarial smoothing techniques which defer investment gains and losses help to dampen the short-term volatility inherent in investment markets by allowing only a portion of investment gains and losses to be recognized each year. Although actual investment returns for fiscal year 2014 were greater than the assumed rate of return, using smoothing techniques, all of the Systems recognized a net actuarial loss on investment returns for the valuation year. For SCRS, the smoothing methodology resulted in a net amount of $1.2 billion in excess investment losses being deferred as of the July 1, 2014 valuation.
The chart on Page 7 illustrates actuarial funded ratios over the past five years for each of the five defined benefit plans.

POPULAR ANNUAL FINANCIAL REPORT 7
Actuarial Funded Ratios (Actuarial assets as a percentage of actuarial accrued liabilities)
0.0%
10.0%
20.0%
30.0%
40.0%
50.0%
60.0%
70.0%
80.0%
SCRS PORS GARS JSRS SCNG
July 1, 2010
July 1, 2011(Updated forLegislative Reform)July 1, 2012
July 1, 2013
July 1, 2014

POPULAR ANNUAL FINANCIAL REPORT 8
Statement of Fiduciary Net Position The Statement of Fiduciary Net Position presents the Systems’ assets and liabilities and the resulting net position restricted for pensions. This statement reflects a year-end snapshot of the Systems’ investments, at fair value, along with cash and short-term investments, receivables and other assets and liabilities.
Total fiduciary net position for all five defined benefit plans of the Systems combined, decreased by $622 million or just over two percent during fiscal year 2015. The net position of the plans is impacted by contributions to the plans, investment returns, and benefit payments out of the system. It is important to note that growth in fiduciary net position depends on both investment performance and contributions from employers and employees. The plans are in a net cash outflow position with benefit payments exceeding contributions, therefore, investment performance must first make up this gap before fiduciary net position can grow. The decrease in net position from $29.9 billion to $29.3 billion was primarily attributable to reduced investment performance and the net cash outflow situation.
The Systems’ investment portfolio continues to participate in a securities lending program, managed by BNY Mellon (Securities Lending Program), whereby securities are loaned for the purpose of generating additional income. BNY Mellon is responsible for making loans of securities on a collateralized basis from the Systems’ investment portfolio to various third party broker-dealers and financial institutions. The gross securities lending revenue for the fiscal year was $1.98 million, an increase from $1.73 million in the prior year. As reported by BNY Mellon, at June 30, 2015, the fair value of securities on loan was $179.61 million, the fair value of the invested cash collateral was $70.18 million, and the securities lending obligations were $117.72 million. The reported difference in the value of the invested cash collateral and the securities lending obligations in the securities lending program is reflected within “Other Liabilities” on the Retirement Systems’ Statement of Fiduciary Net Position, consistent with information reported on accounting statements provided by BNY Mellon as the custodial bank.
South Carolina Retirement Systems Fiduciary Net Position
June 30, 2015 and 2014 (Amounts expressed in thousands)
Increase / % Increase /Assets 2015 2014 (Decrease) (Decrease)Cash & cash equivalents, receivables, and prepaid expenses 3,622,210$ 4,063,173$ (440,963)$ -10.85%Investments, at fair value 27,093,961 26,754,819 339,142 1.27%Securities lending cash collateral invested 70,177 72,645 (2,468) -3.40%Capital Assets, net of accumulated depreciation 3,005 2,912 93 3.19%Total Assets 30,789,353 30,893,549 (104,196) -0.34%
LiabilitiesDeferred retirement benefits 68,104 56,901 11,203 19.69%Obligations under securities lending 70,177 72,645 (2,468) -3.40%Other accounts payable 1,345,382 836,292 509,090 60.87%Total Liabilities 1,483,663 965,838 517,825 53.61%Total Fiduciary Net Position Restricted for Pensions 29,305,690$ 29,927,711$ (622,021)$ -2.08%

POPULAR ANNUAL FINANCIAL REPORT 9
Statement of Changes in Fiduciary Net Position The Statement of Changes in Fiduciary Net Position presents information showing how the Systems’ net position restricted for pensions changed during the year. This statement includes additions for contributions by members and employers and investment earnings and deductions for annuity payments, refunded contributions, death benefit payments and administrative expenses.
The rise over the prior fiscal year in the amount of employee and employer contributions collected is largely attributable to increased contribution rates. Employee contribution rates for SCRS and PORS rose from 7.50 to 8.00 percent and 7.84 to 8.41 percent, respectively, effective July 1, 2014. Base employer contributions rates for SCRS and PORS also increased proportionately, effective July 1, 2014, from 10.45 to 10.75 percent and 12.44 to 13.01 percent, respectively.
For the fiscal year ended June 30, 2015, the net of fee investment performance return provided by the custodial bank, BNY Mellon was 1.60 percent. This
return reflects performance of the Systems, at the aggregate for the pooled investments of the consolidated pension trust funds, after the deduction of manager fees and/or expenses. This fiscal year’s performance was well below the prior year’s return of 15.29 percent and will be recognized as an actuarial loss as it was less than the 7.5 percent actuarial investment rate of return assumed for the plans.
The total number of retired members and beneficiaries receiving monthly annuity benefits from the Systems increased from approximately 153,000 to just under 157,000 annuitants during the year. Additionally, eligible SCRS & PORS annuitant payees received an annual benefit adjustment equal to the lesser of 1 percent or $500 on July 1, 2014. The increase in the number of new annuitants added to the payroll during the year coupled with the retiree benefit adjustment resulted in an overall increase of 5 percent in the dollar amount of annuity benefits paid to annuitants compared to the prior the year.
South Carolina Retirement Systems Changes in Fiduciary Net Position
For the Years Ended June 30, 2015 and 2014 (Amounts expressed in thousands)
Increase / % Increase /Additions 2015 2014 (Decrease) (Decrease)Employee contributions 826,483$ 751,467$ 75,016$ 9.98%Employer contributions 1,203,313 1,132,128 71,185 6.29%State-appropriated contributions 4,591 4,586 5 0.11%Net Investment income 435,886 4,083,023 (3,647,137) -89.32%Other income 1,883 3,083 (1,200) -38.92%Total Additions 2,472,156 5,974,287 (3,502,131) -58.62%DeductionsAnnuity benefits 2,943,355 2,803,084 140,271 5.00%Refunds 112,557 106,475 6,082 5.71%Death benefits 22,319 21,680 639 2.95%Administrative & other expenses 15,946 16,150 (204) -1.26%Total Deductions 3,094,177 2,947,389 146,788 4.98%Increase (Decrease) in Fiduciary Net Position (622,021) 3,026,898 (3,648,919) -120.55%Beginning Fiduciary Net Position 29,927,711 26,900,813 3,026,898 11.25%Ending Fiduciary Net Position Restricted for Pensions 29,305,690$ 29,927,711$ (622,021)$ -2.08%

POPULAR ANNUAL FINANCIAL REPORT 10
The following graph reflects Fiduciary Net Position restricted for pensions for the five consolidated defined benefit plans over the past five fiscal years:
South Carolina Retirement Systems Fiduciary Net Position
Five Years Ended June 30, 2015 (Amounts expressed in millions)
$25,892 $24,979 $26,901
$29,928 $29,306
$-
$5,000
$10,000
$15,000
$20,000
$25,000
$30,000
2011 2012 2013 2014 2015Fiscal Years
The following graph represents additions from all sources and deductions (annuities, refunds, death benefits, administrative expense and depreciation) from Fiduciary Net Position over the past five fiscal years:
South Carolina Retirement Systems Summary of Additions and Deductions
Five Years Ended June 30, 2015 (Amounts expressed in millions)
$5,7
46
$1,7
79
$4,4
30
$5,9
74
$2,4
72
$2,5
45
$2,6
91
$2,8
35
$2,9
47
$3,0
94
$0
$1,000
$2,000
$3,000
$4,000
$5,000
$6,000
$7,000
2011 2012 2013 2014 2015Fiscal Years
Additions
Deductions

POPULAR ANNUAL FINANCIAL REPORT 11
Investments Overview As of June 30, 2015, the custodial bank reported that assets of the pension trust funds, invested and managed by the Retirement System Investment Commission (RSIC), were valued at $29.2 billion. The plans are in a negative cash flow position as benefit payments in the amount of $3.5 billon (on a cash flow basis) significantly exceeded the receipt of only $2.4 billion in contributions (on a cash flow basis). This resulting negative net cash outflow of $1.1 billion in net benefit obligations during the year represents approximately 3.6 percent of the portfolio’s assets.
Capital markets during the fiscal year were challenging for the Plan as broad US equity indices showed modest gains, domestic fixed income showed mixed results, and international and emerging markets, both equity and fixed income, were generally negative. Real estate and private equity asset classes posted strong positive returns. The RSIC Plan assets earned a return of 1.60 percent net of fees on a time-weighted calculation basis for the fiscal year ending June 30, 2015, compared to the Policy benchmark’s return of 1.21 percent. This is sixth consecutive year that the fund has experienced a positive annual return. The three-year annualized net of fees return was 8.81 percent as of the fiscal year end compared to the Policy benchmark return of 7.74 percent. The Plan’s actuarial assumed rate of return is 7.50 percent.
The plan assets are invested by the Commission in a manner consistent with a long-term investment time horizon. While the financial markets continue to experience significant volatility, the assets of the Retirement Systems are invested in a broadly diversified manner in an effort to mitigate risk. Although member benefits accrued and payable under the Retirement Systems’ defined benefit plans are not dependent on individual member account balances, investment returns are a critical overall funding component.
An optimally diversified investment portfolio is designed to generate long-term returns sufficient to ensure the program’s financial stability. While the Systems’ investment performance was historically constrained by state constitution and state statute, the Commission has implemented a fully diversified asset allocation policy. With the help of the retained investment consultant, Aon Hewitt Investment Consulting, the RSIC manages investments across an asset allocation designed to generate attractive long-term risk-adjusted returns at a prudent level of risk.

POPULAR ANNUAL FINANCIAL REPORT 12
Summary of Investment Performance As of June 30, 2015
1.60%
8.81% 8.87%
5.06%
7.50%
2.75%
0.04%
1.32%1.85% 2.09%
0.00%1.00%2.00%3.00%4.00%5.00%6.00%7.00%8.00%9.00%
10.00%
2015 3-year Annualized 5-Year Annualized 10-Year Annualized
Actual Performance Annualized Actuarial Assumed Rate of Return
Actuarial Inflation Component US CPI Urban Consumers SA
1Plan returns are from BNY Mellon and are time-weighted, total return calculations, net of fees and expenses. All returns are expressed in U.S. Dollars. Periods greater than one year are annualized. 2The actuarial assumed rate of return is 7.50 percent starting with returns after July 1, 2011, and is composed of an assumed 2. 75 percent Inflation rate and a 4.75 percent real rate of return, net of investment and administrative expenses.

POPULAR ANNUAL FINANCIAL REPORT 13
Portfolio Exposure as of June 30, 2014
Global Public Equities, 30.8%
Private Equity, 9.0%
Commodities, 2.1%
Real Estate, 3.6%GTAA / Risk
Parity, 10.6%
Hedge Funds (Low Beta), 8.3%
Mixed Credit (HY, Loans, Structured), 6.6%
Emerging Markets Debt, 4.2%
Private Debt, 5.7%
Core Fixed Income, 8.7%
Global Fixed Income, 3.7%
Cash and Short-Duration (net of overlays), 6.7%
Portfolio Exposure as of June 30, 2015
Global Public Equities, 32.30%
Private Equity, 8.84%
Commodities, 2.97%
Real Estate, 3.96%GTAA / Risk
Parity, 10.37%
Hedge Funds (Low Beta), 8.98%
Mixed Credit (HY, Loans, Structured), 7.41%
Emerging Markets Debt, 5.01%
Private Debt, 5.67%
Core Fixed Income, 9.66%
Global Fixed Income, 1.26%
Cash and Short-Duration (net of overlays), 3.57%
Global Equity Real Assets Opportunistic Global Public Equities* Commodities* GTAA/Risk Parity* Private Equity Real Estate Hedge Funds (Low Beta)* Diversified Credit Conservative Fixed Income Mixed Credit (HY, Loans, Structured)* Core Fixed Income Emerging Markets Debt* Global Fixed Income Private Debt* Short-Duration (net of overlays) Cash (net of overlays) Note: Values rounded for presentation purposes. Portfolio exposure includes both adjustments made by managers that invest across asset classes and exposure from the RSICs derivative overlay program. *Asset classes in which hedge funds can be used, up to a maximum of 15% across the entire portfolio

POPULAR ANNUAL FINANCIAL REPORT 14
Target Asset Allocation
31.0
%
9.0%
3.0%
5.0%
10.0
%
8.0%
6.0%
6.0% 7.
0%
7.0%
3.0%
3.0%
2.0%
0
0.05
0.1
0.15
0.2
0.25
0.3
0.35
Note: Target Asset Allocation in effect since July 1, 2013 - adopted and amended by the Commission on September 26, 2013. *Asset classes in which hedge funds can be used, up to a maximum of 15% across the entire portfolio.
Global Equity Real Assets Opportunistic Global Public Equities* Commodities* GTAA/Risk Parity* Private Equity Real Estate Hedge Funds (Low Beta)* Diversified Credit Conservative Fixed Income Mixed Credit (HY, Loans, Structured)* Core Fixed Income Emerging Markets Debt* Global Fixed Income Private Debt* Short-Duration (net of overlays) Cash (net of overlays)

POPULAR ANNUAL FINANCIAL REPORT 15
South Carolina Retirement Systems List of Largest Assets Held
As of June 30, 2015 SCRS held units in the following index funds:
Units Description SCRS PORS GARS JSRS SCNG Fair Value128,309,554 Blackrock MSCI World Index 1,760,710,872$ 277,123,432$ 2,153,537$ 10,048,117$ 1,487,031$ 2,051,522,989$
22,921,176 Daily MSCI USA Index NL Fund 526,088,346 82,802,583 643,462 3,002,308 444,315 612,981,014 4,910,972 MSCI EAFE Index NL Fund (FD12) 353,100,864 55,575,577 431,880 2,015,094 298,216 411,421,631
463,573 MSCI CAD Index NL Fund (CA-12) 33,121,835 5,213,142 40,512 189,021 27,973 38,592,483 Total 3,114,518,117$
Top Ten Equity HoldingsUnits Description SCRS PORS GARS JSRS SCNG Fair Value
222,937 Apple Inc 23,998,159$ 3,777,140$ 29,352$ 136,954$ 20,268$ 27,961,873$ 155,537 CVS Health Corp 14,000,323 2,203,552 17,124 79,898 11,824 16,312,721 127,097 UnitedHealth Group Inc 13,307,816 2,094,556 16,277 75,946 11,239 15,505,834 124,683 Gilead Sciences Inc 12,528,573 1,971,909 15,324 71,499 10,581 14,597,886 285,174 Altria Group Inc 11,970,692 1,884,102 14,641 68,315 10,110 13,947,860 238,579 Wells Fargo & Co 11,515,669 1,812,485 14,085 65,718 9,726 13,417,683
64,500 Costar Group Inc 11,141,120 1,753,533 13,627 63,581 9,409 12,981,270 281,811 Microsoft Corp 10,678,256 1,680,682 13,061 60,939 9,018 12,441,956 111,199 Home Depot Inc 10,605,811 1,669,279 12,972 60,526 8,957 12,357,545 188,000 Jack Henry & Associates Inc 10,439,358 1,643,081 12,768 59,576 8,817 12,163,600
Total 151,688,228$
Top Ten Fixed Income HoldingsPar Value Description SCRS PORS GARS JSRS SCNG Fair Value
5,600,000$ iShares Emerging Markets Local Currency Bond ETF
210,029,898$ 33,057,220$ 256,889$ 1,198,610$ 177,383$ 244,720,000$
1,200,000 iShares JP Morgan USD Emerging Market Bond ETF
113,206,046 17,817,831 138,463 646,050 95,610 131,904,000
122,950,000 Commit To Purchase FNMA 4.000% due 07/01/2045
111,797,722 17,596,170 136,741 638,013 94,420 130,263,066
103,400,000 US Treasury Note 2.750% due 02/15/2024
92,132,578 14,501,016 112,688 525,787 77,812 107,349,881
75,000,000 US Treasury Note 1.000% due 08/31/2016
64,831,240 10,203,978 79,296 369,982 54,754 75,539,250
84,915,000 US Treasury Bond 2.500% due 02/15/2045
64,138,415 10,094,933 78,448 366,028 54,169 74,731,993
68,000,000 US Treasury Note 1.000% due 09/15/2017
58,698,036 9,238,655 71,794 334,981 49,574 68,393,040
56,500,000 Federal Farm Credit Bank 1.125% due 12/18/2017
48,683,877 7,662,498 59,546 277,832 41,117 56,724,870
46,231,568 US Treasury - CPI Inflation 0.125% due 07/15/2024
38,695,221 6,090,354 47,328 220,828 32,681 45,086,412
44,730,000 US Treasury Note 2.125% due 06/30/2022
38,551,336 6,067,707 47,152 220,007 32,559 44,918,761
Total 979,631,273$
Note: A complete list of portfolio holdings is available upon request.

POPULAR ANNUAL FINANCIAL REPORT 16
Fiscal Year 2014 GFOA Award The South Carolina Retirement Systems’ Popular Annual Financial Report for the fiscal year ended June 30, 2014, received an Award for Outstanding Achievement in Popular Annual Financial Reporting from the Government Finance Officers Association (GFOA) of the United States and Canada.
This is a prestigious national award recognizing conformance with the highest standards for preparation of state and local government popular reports.
To receive an Award for Outstanding Achievement in Popular Annual Financial Reporting, a government unit must publish a Popular Annual Financial Report in which the content conforms to program standards of creativity, presentation, understandability, and reader appeal.
This award is valid for a period of one year only. The Systems has received the Award for Outstanding Achievement for each of the last 11 consecutive years (fiscal years ended 2004-2014). We believe our current report continues to conform to the GFOA’s Popular Annual Financial Reporting requirements and are submitting it for consideration.
2015 PPCC Award The South Carolina Retirement Systems received the Public Pension Coordinating Council’s Public Pension Standards 2015 Award.
It is the twelfth consecutive year during which the S.C. Public Employee Benefit Authority applied for and received the Council’s award in recognition of meeting professional plan design and administration standards.
The Public Pension Coordinating Council is a confederation of the National Association of State Retirement Administrators, the National Conference on Public Employee Retirement Systems, and the National Council on Teacher Retirement.


202 Arbor Lake DriveColumbia, SC 29223
803.737.6800 | 888.260.9430www.peba.sc.gov
SCPEBA 122015


