
POPULAR ANNUAL FINANCIAL REPORT - Canton, Ohio PAFR.pdf · The Popular Annual Financial Report is a...
20
POPULAR ANNUAL FINANCIAL REPORT Richard A. Mallonn II • Auditor, City of Canton For The Year Ended December 31, 2011 Joseph J. Carbenia Memorial Fire Station #4 City of Canton • 2504 Cleveland Avenue NW
Transcript of POPULAR ANNUAL FINANCIAL REPORT - Canton, Ohio PAFR.pdf · The Popular Annual Financial Report is a...
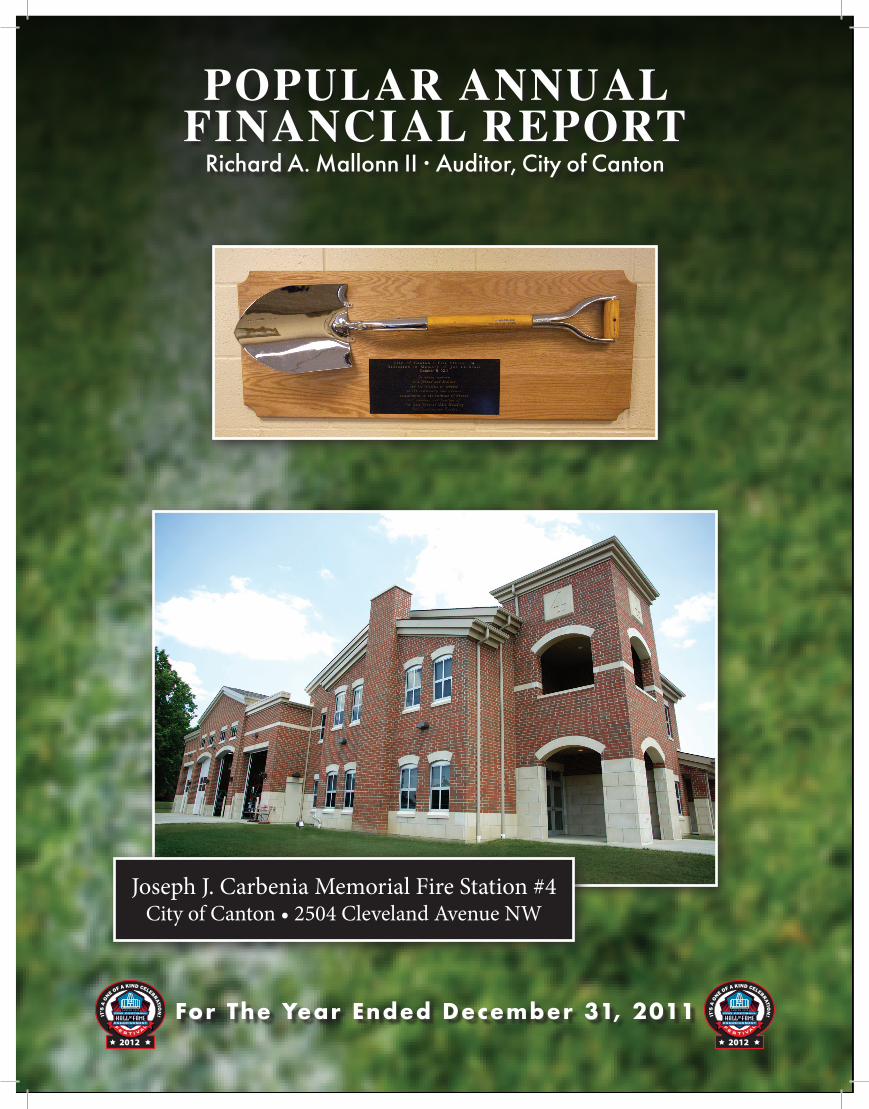
POPULAR ANNUALFINANCIAL REPORT
Richard A. Mallonn II • Auditor, City of Canton
For The Year Ended December 31, 2011
Joseph J. Carbenia Memorial Fire Station #4City of Canton • 2504 Cleveland Avenue NW
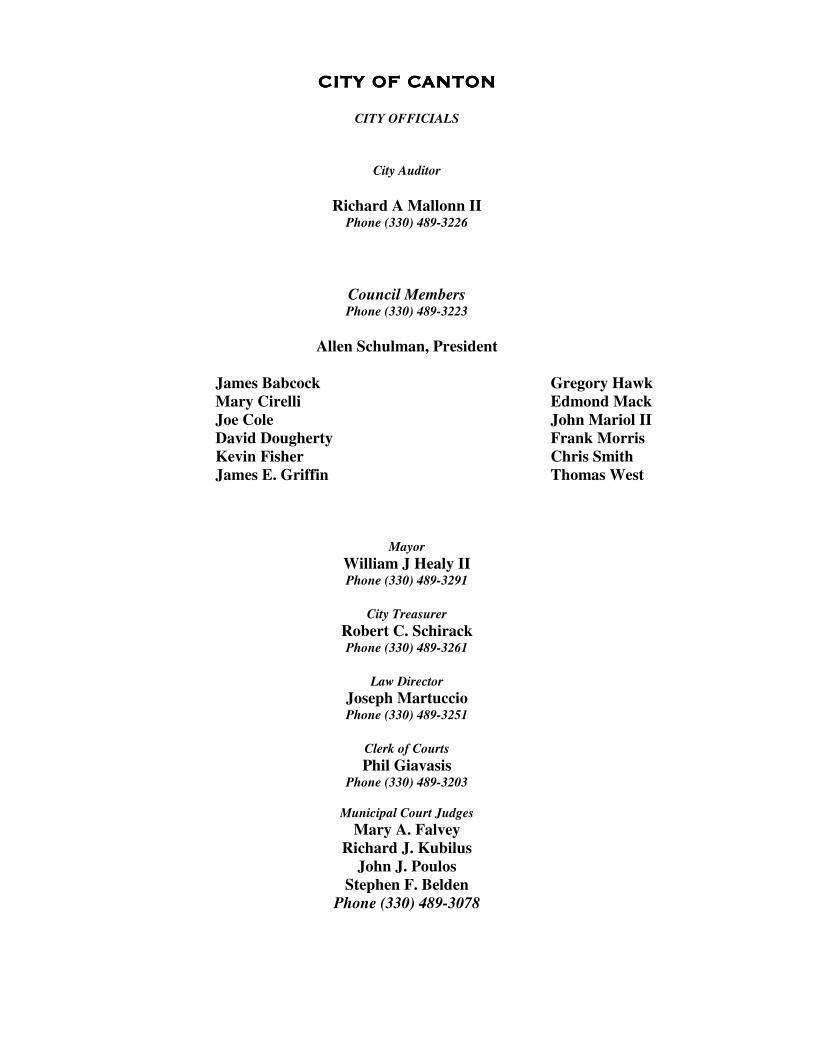
CITY OF CANTONCITY OF CANTONCITY OF CANTONCITY OF CANTON
CITY OFFICIALS
City Auditor
Richard A Mallonn II Phone (330) 489-3226
Council Members Phone (330) 489-3223
Allen Schulman, President
James Babcock Gregory Hawk
Mary Cirelli Edmond Mack
Joe Cole John Mariol II
David Dougherty Frank Morris
Kevin Fisher Chris Smith
James E. Griffin Thomas West
Mayor
William J Healy II Phone (330) 489-3291
City Treasurer
Robert C. Schirack Phone (330) 489-3261
Law Director
Joseph Martuccio Phone (330) 489-3251
Clerk of Courts
Phil Giavasis Phone (330) 489-3203
Municipal Court Judges
Mary A. Falvey
Richard J. Kubilus
John J. Poulos
Stephen F. Belden
Phone (330) 489-3078
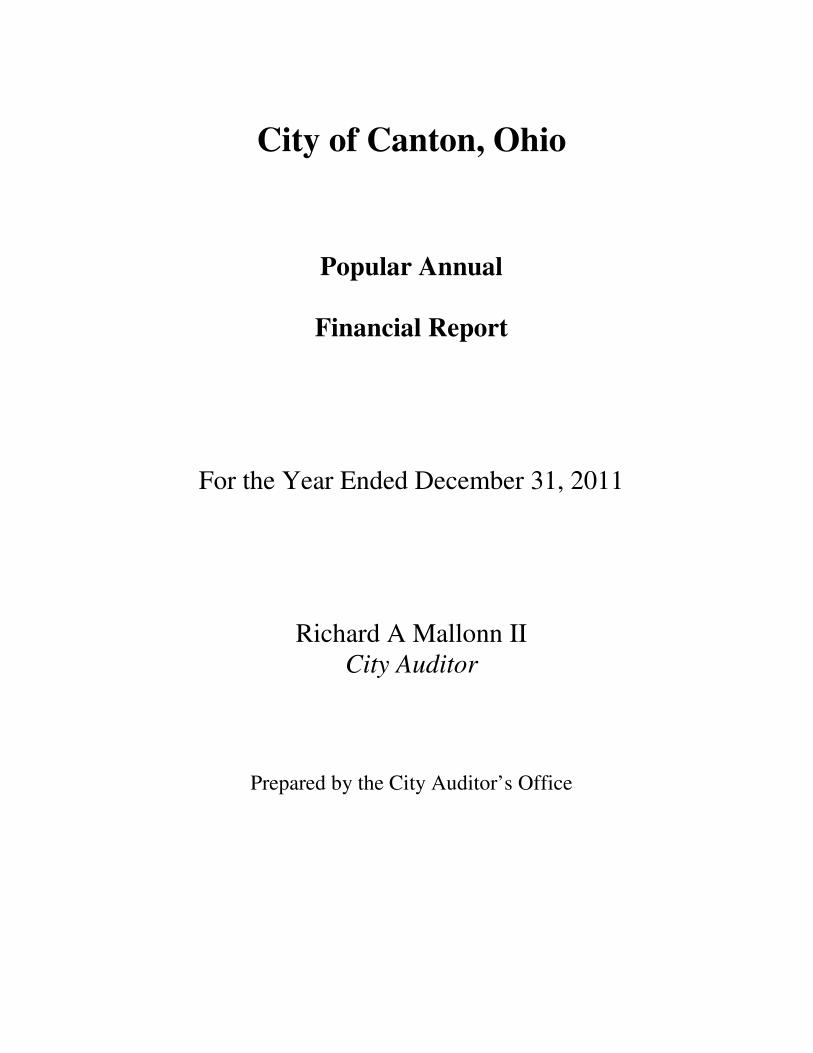
City of Canton, Ohio
Popular Annual
Financial Report
For the Year Ended December 31, 2011
Richard A Mallonn II
City Auditor
Prepared by the City Auditor’s Office
-1-
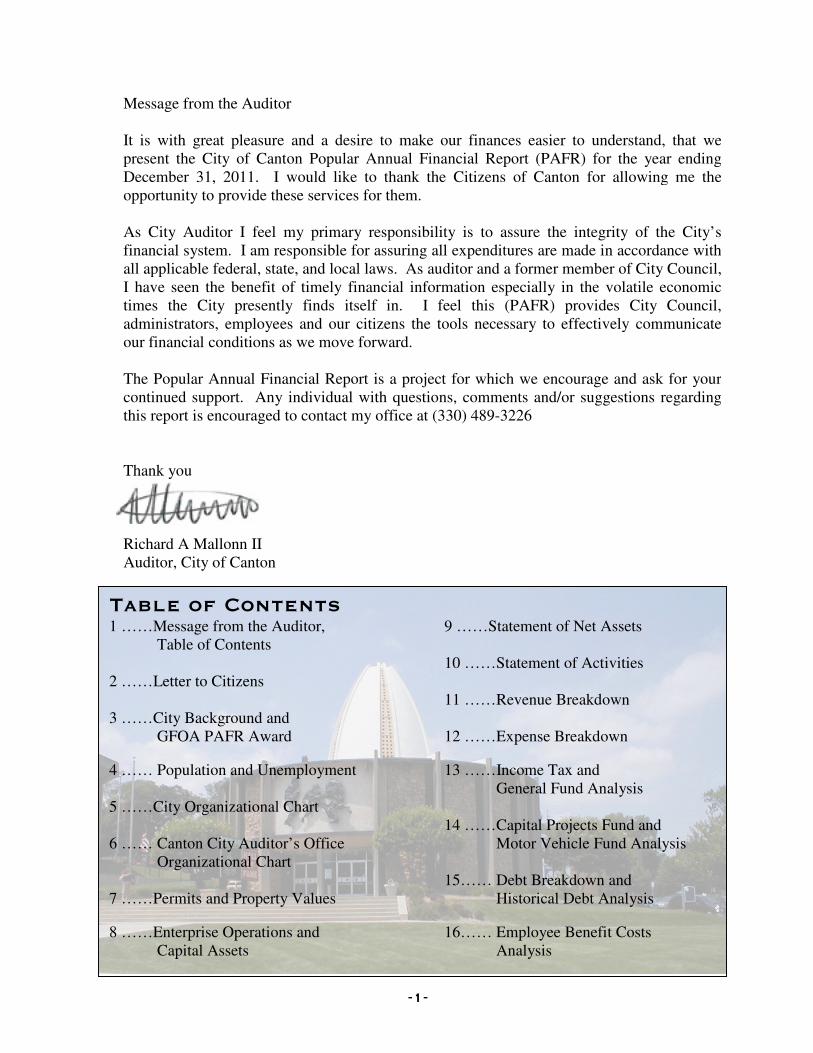
Table of Contents 1 ……Message from the Auditor, 9 ……Statement of Net Assets
Table of Contents
10 ……Statement of Activities
2 ……Letter to Citizens
11 ……Revenue Breakdown
3 ……City Background and
GFOA PAFR Award 12 ……Expense Breakdown
4 …… Population and Unemployment 13 ……Income Tax and
General Fund Analysis
5 ……City Organizational Chart
14 ……Capital Projects Fund and
6 …… Canton City Auditor’s Office Motor Vehicle Fund Analysis
Organizational Chart
15…… Debt Breakdown and
7 ……Permits and Property Values Historical Debt Analysis
8 ……Enterprise Operations and 16…… Employee Benefit Costs
Capital Assets Analysis
Message from the Auditor
It is with great pleasure and a desire to make our finances easier to understand, that we
present the City of Canton Popular Annual Financial Report (PAFR) for the year ending
December 31, 2011. I would like to thank the Citizens of Canton for allowing me the
opportunity to provide these services for them.
As City Auditor I feel my primary responsibility is to assure the integrity of the City’s
financial system. I am responsible for assuring all expenditures are made in accordance with
all applicable federal, state, and local laws. As auditor and a former member of City Council,
I have seen the benefit of timely financial information especially in the volatile economic
times the City presently finds itself in. I feel this (PAFR) provides City Council,
administrators, employees and our citizens the tools necessary to effectively communicate
our financial conditions as we move forward.
The Popular Annual Financial Report is a project for which we encourage and ask for your
continued support. Any individual with questions, comments and/or suggestions regarding
this report is encouraged to contact my office at (330) 489-3226
Thank you
Richard A Mallonn II
Auditor, City of Canton
June 30, 2012
Citizens of the City of Canton, Ohio
We are pleased to present the City of Canton, Ohio’s Popular Annual Financial Report (PAFR) for the fiscal year
ended December 31, 2011. This report provides an analysis of the financial position of the City, where the revenues come
from to operate the City and where those same dollars are spent. Above all else, our goal is to better communicate the
results of financial operations from the City in a more easily understandable report.
The PAFR is intended to summarize the financial activities of the City of Canton and was drawn from the
financial information appearing in the 2011 Comprehensive Annual Financial Report (CAFR). The financial statements
appearing in the CAFR were prepared in conformance with Generally Accepted Accounting Principles (GAAP) and
audited by the State Auditor Mary Taylor’s office receiving an unqualified (or clean) opinion. The numbers within the
CAFR were arrived at by employing accrual and modified accrual accounting techniques as prescribed by the
Governmental Accounting Standards Board (GASB). The financial information presented in the CAFR goes into much
greater detail on the City’s financial status at the end of 2011. Among other things, it provides greater detail on the
individual funds the City uses and presents information on where the City is going in the future. For readers wishing to
obtain a complete copy of the City’s CAFR contact the Auditor’s Office at 218 Cleveland SW, Canton, Ohio 44702,
(330) 489-3226. A complete version of the CAFR and PAFR is available on the City’s website www.cityofcanton.com.
Canton’s PAFR is un-audited and presented on a GAAP basis consistent with the rules defined by GASB. The
major differences between GAAP and non-GAAP reporting deals with the presentation of segregated funds as well as full
disclosure of all material financial and non-financial events in notes to the financial statements. Since the amounts in the
PAFR are drawn from the larger CAFR, the method of accounting employed is the same except where noted within the
report. The statements contained on pages nine and ten, as well as references to the individual amounts on all intervening
pages, contain all funds used by the City to account for its financial affairs as well as comparative statements from 2010
unless otherwise noted within the report. Citizens who desire to review audited GAAP basis, full disclosure financial
statements, or information on the City’s component unit (which is not included in this document) should refer to the
City’s audited financial statements, which is contained in the CAFR and available from the City’s Auditor’s Office.
The Government Finance Officers Association of the United States and Canada (GFOA) has given an Award for
Outstanding Achievement in Popular Annual Financial Reporting to the City of Canton for its Popular Annual Financial
Report for the fiscal year ended December 31, 2011. The Award for Outstanding Achievement in Popular Annual
Financial Reporting is a prestigious national award recognizing conformance with the highest standards for preparation of
state and local government popular reports.
In order to receive an Award for Outstanding Achievement in Popular Annual Financial Reporting, a government
unit must publish a Popular Annual Financial Report, whose contents conform to program standards of creativity,
presentation, understandability and reader appeal.
An Award for Outstanding Achievement in Popular Annual Financial Reporting is valid for a period of one year
only. We believe our current report continues to conform to the Popular Annual Financial Reporting requirements, and
we are submitting it to GFOA.
The Popular Annual Financial Report of the City of Canton, Ohio is presented as a means of increasing public
awareness of the operations for the City. Citizens deserve accountability for the use of their tax dollars and this report is
designed to provide a vehicle for a better understanding of the City’s finances. We are proud to serve the citizens of
Canton and consider this report to be a notable achievement as we seek to increase the level of accountability offered to
our taxpayers. We urge your support of this project and appreciate your taking the time to review its contents. Do not
hesitate to contact us with any question or comments at (330) 489-3226.
Sincerely,
Richard A Mallonn II
City Auditor
City of Canton, Ohio
-2-
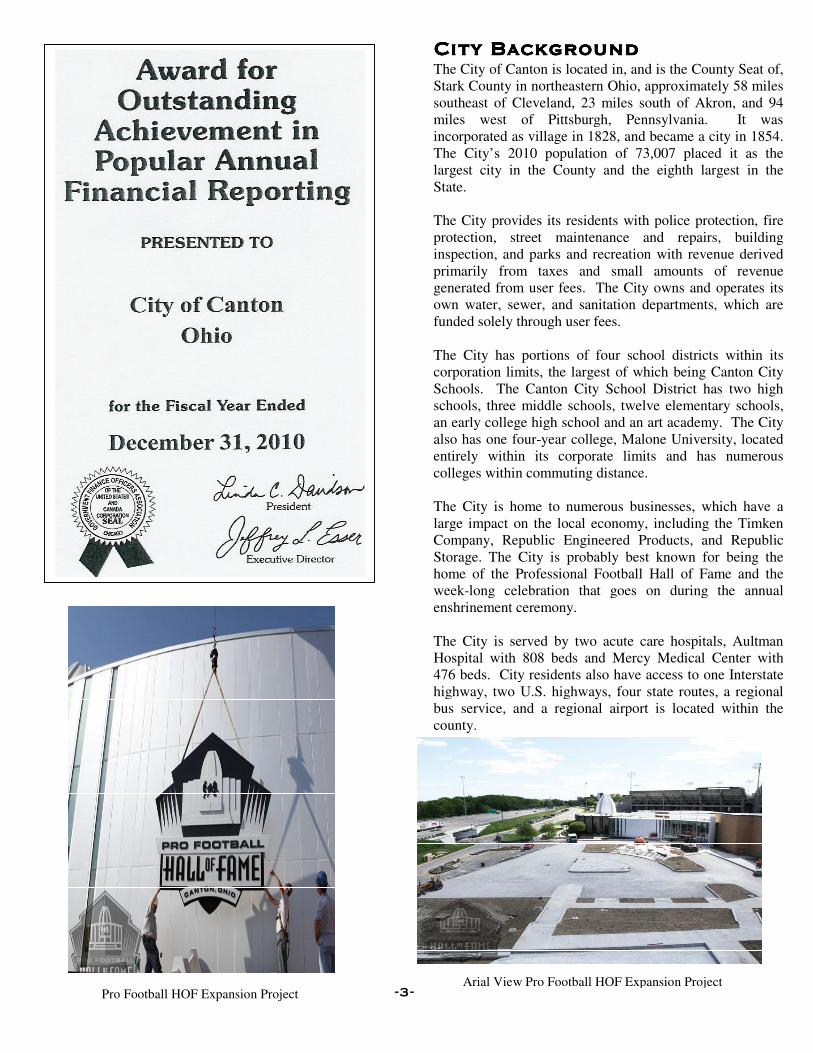
City Background City Background City Background City Background The City of Canton is located in, and is the County Seat of,
Stark County in northeastern Ohio, approximately 58 miles
southeast of Cleveland, 23 miles south of Akron, and 94
miles west of Pittsburgh, Pennsylvania. It was
incorporated as village in 1828, and became a city in 1854.
The City’s 2010 population of 73,007 placed it as the
largest city in the County and the eighth largest in the
State.
The City provides its residents with police protection, fire
protection, street maintenance and repairs, building
inspection, and parks and recreation with revenue derived
primarily from taxes and small amounts of revenue
generated from user fees. The City owns and operates its
own water, sewer, and sanitation departments, which are
funded solely through user fees.
The City has portions of four school districts within its
corporation limits, the largest of which being Canton City
Schools. The Canton City School District has two high
schools, three middle schools, twelve elementary schools,
an early college high school and an art academy. The City
also has one four-year college, Malone University, located
entirely within its corporate limits and has numerous
colleges within commuting distance.
The City is home to numerous businesses, which have a
large impact on the local economy, including the Timken
Company, Republic Engineered Products, and Republic
Storage. The City is probably best known for being the
home of the Professional Football Hall of Fame and the
week-long celebration that goes on during the annual
enshrinement ceremony.
The City is served by two acute care hospitals, Aultman
Hospital with 808 beds and Mercy Medical Center with
476 beds. City residents also have access to one Interstate
highway, two U.S. highways, four state routes, a regional
bus service, and a regional airport is located within the
county.
-3-
Quarry Housing Development
Arial View Pro Football HOF Expansion Project
Pro Football HOF Expansion Project
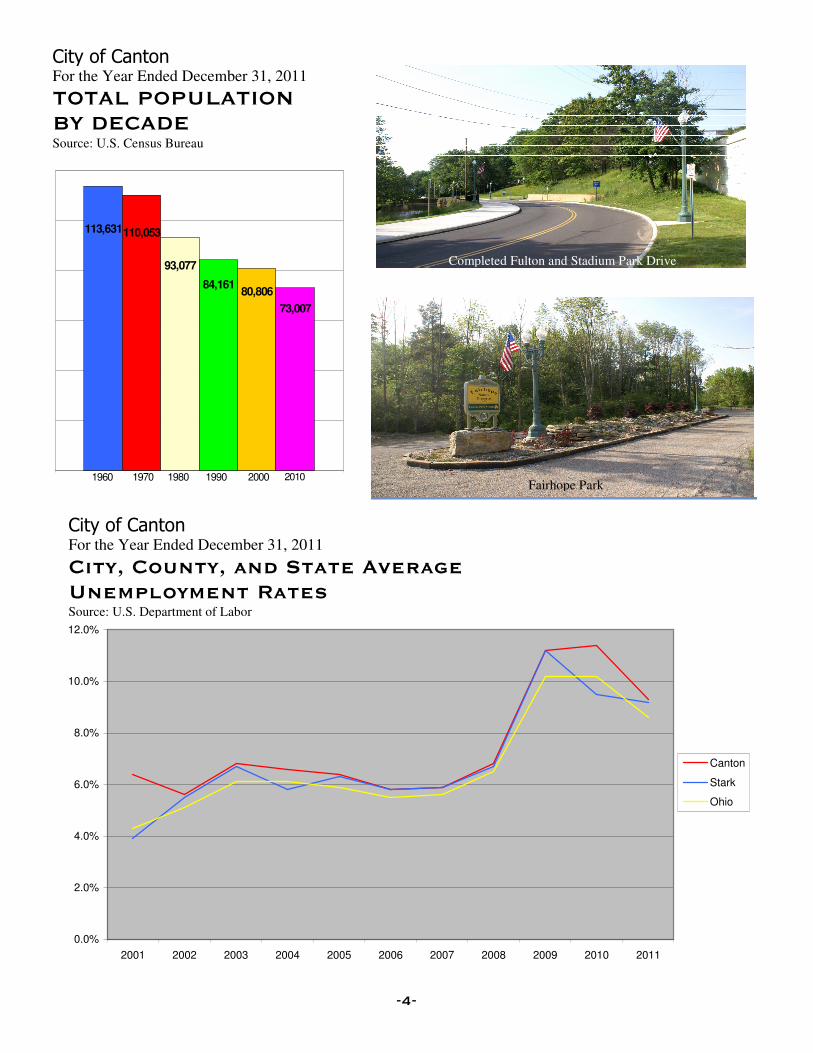
113,631110,053
93,077
84,16180,806
73,007
1960 1970 1990 20001980 2010
City of Canton For the Year Ended December 31, 2011
City, County, and State Average Unemployment Rates Source: U.S. Department of Labor
0.0%
2.0%
4.0%
6.0%
8.0%
10.0%
12.0%
2001 2002 2003 2004 2005 2006 2007 2008 2009 2010 2011
Canton
Stark
Ohio
-4-
City of Canton For the Year Ended December 31, 2011
TOTAL POPULATION BY DECADE Source: U.S. Census Bureau
Fairhope Park
Completed Fulton and Stadium Park Drive
-5-
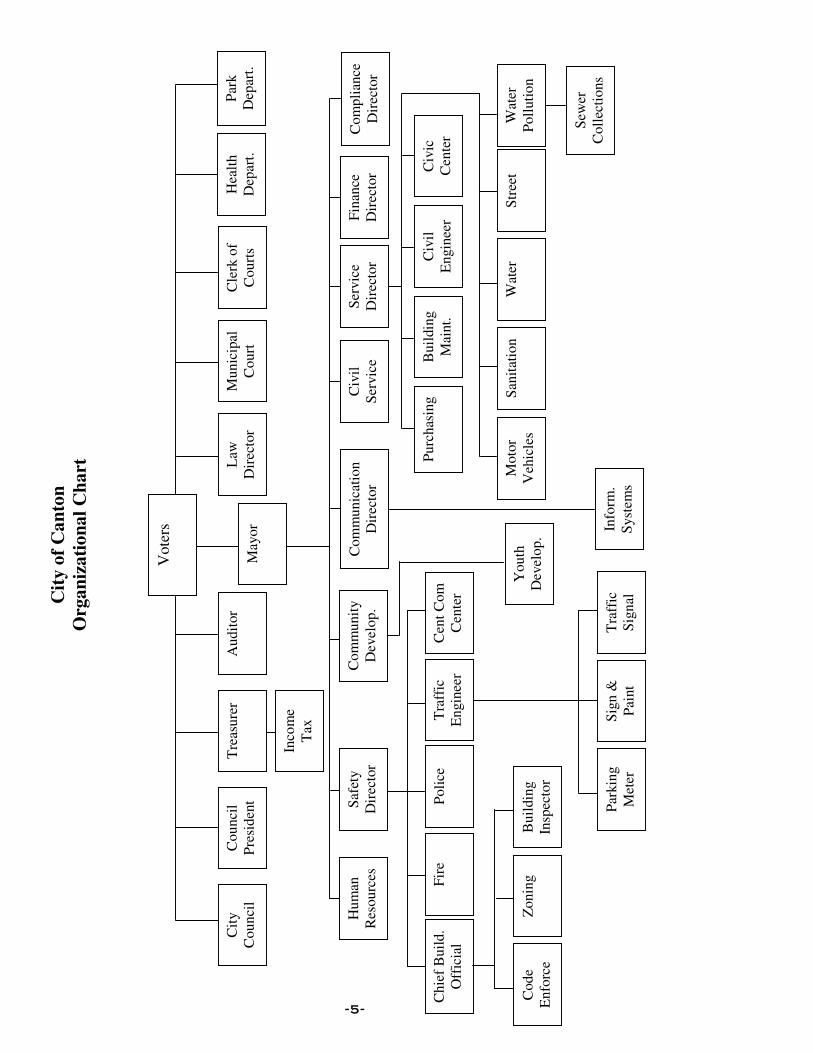
Vote
rs
Counci
l
Pre
siden
t M
unic
ipal
Court
Tre
asure
r A
udit
or
Law
Dir
ecto
r C
lerk
of
Court
s
Saf
ety
Dir
ecto
r C
om
munic
atio
n
Dir
ecto
r
Zonin
g
Poli
ce
Fir
e
Chie
f B
uil
d.
Off
icia
l C
ent
Com
Cen
ter
Buil
din
g
Insp
ecto
r
Youth
Dev
elop.
Info
rm.
Syst
ems
Purc
has
ing
Buil
din
g
Mai
nt.
Civ
il
Engin
eer
Civ
ic
Cen
ter
Str
eet
Wat
er
Poll
uti
on
Moto
r
Veh
icle
s S
anit
atio
n
Wat
er
Sew
er
Coll
ecti
ons
Cit
y o
f C
an
ton
Org
an
iza
tio
na
l C
hart
Par
k
Dep
art.
Hea
lth
Dep
art.
Civ
il
Ser
vic
e F
inan
ce
Dir
ecto
r C
om
pli
ance
Dir
ecto
r
Ser
vic
e
Dir
ecto
r H
um
an
Res
ourc
es
Com
munit
y
Dev
elop.
Inco
me
Tax
Code
Enfo
rce
Par
kin
g
Met
er
Sig
n &
Pai
nt
Tra
ffic
Sig
nal
May
or
Tra
ffic
Engin
eer
Cit
y
Counci
l
-6-
Tim
oth
y L
ars
on
Ap
pli
cati
on D
evel
op
ment
Ad
min
istr
ato
r
11
Yrs
of
Cit
y S
ervic
e
Fin
anci
al S
yst
em
Up
gra
de
Dev
elo
pm
ent
and
Sup
po
rt
Gary
You
ng
Chie
f D
eputy
Aud
ito
r
27
Yrs
of
Cit
y S
ervic
e
Bud
get
/Acc
ou
nti
ng
Pay
roll
Man
agem
ent
An
nual
Fin
anci
al
Rep
ort
ing &
Pre
par
atio
n
Off
ice
Man
agem
ent
Info
rmati
on S
yst
em
Managem
ent
Bu
dg
et
Pa
yro
ll
Tec
hn
ica
l
Kim
ber
ly B
aca
D
eputy
Aud
ito
r I
14
Yrs
of
Cit
y S
ervic
e
Sharo
n L
endon
Dep
uty
Aud
ito
r I
21
Yrs
of
Cit
y S
ervic
e
Sharo
n T
oney
D
eputy
Aud
ito
r I
22
Yrs
of
Cit
y S
ervic
e
Lyn
n S
tieb
D
eputy
Aud
ito
r II
16
Yrs
of
Cit
y S
ervic
e
Ric
hard
A. M
all
on
n I
I
Cit
y A
ud
itor
Elo
nda E
ford
D
eputy
Aud
ito
r I
12
Yrs
of
Cit
y S
ervic
e
Tyr
a H
anle
D
eputy
Aud
ito
r II
11
Yr
of
Cit
y S
erv
ice
Hea
ther
Lock
e D
eputy
Aud
ito
r I
17 Y
rs o
f C
ity
Ser
vice
Joh
n S
leb
od
nik
C
hie
f In
form
ati
on O
ffic
er
8 Y
rs o
f C
ity S
ervic
e
Pay
roll
Sta
ff M
anagem
ent
Dw
ayn
e K
nig
ht
Dep
uty
Aud
ito
r II
I
1 Y
rs o
f C
ity S
ervic
e
Bud
get
Sta
ff M
gm
t
An
nual
Fin
anci
al
Rep
ort
ing &
Pre
par
atio
n
Ch
rist
ine
Bagle
y
Inte
rnal
Aud
ito
r
9 Y
rs o
f C
ity S
ervic
e
Bud
get
Sta
ff S
up
po
rt &
Aud
itin
g
Fin
anci
al R
epo
rt/P
rep
1,071
819
4,097
2,449
1,364
Number of Permits
2007
2009
2008
2010
2011 68,127,054
$59,247,514
90,644,571
73,780,733
42,510,483
Represented in the graph above, is the total number of building permits issued since 2005, with the value of the projects for that year.
Primary Property Taxpayers Source: Stark County Auditor’s Office
Value of
Property
Ohio Power Company 40,619,960$
SL Canton LLC 4,841,660
Wal-Mart Stores East LP 3,968,490
West Tuscarawas Prop. Management LLC 3,886,350
Walmart Real Estate Business Trust 3,745,010
CSE Canton LLC 3,714,130
Sno Frost Inc 3,112,970
Centro Bradley SPE 8 LLC 2,912,260
The Timken Company ** 2,645,790
Iron Rock Capital Incorporated 2,440,660 Total 71,887,280$
**Top ten income taxpayer
Total City
Assessed Percentage
Property Values Change
2002 973,144,447$
2003 927,030,289$ -4.74%
2004 1,018,434,116$ 9.86%
2005 1,039,538,953$ 2.07%
2006 1,010,727,658$ -2.77%
2007 1,055,242,673$ 4.40%
2008 993,257,116$ -5.87%
2009 941,498,070$ -5.21%
2010 875,505,940$ -7.01%2011 866,458,270$ -1.03%
Assessed Property Values with Net Change Source: Stark County Auditor’s Office
-7-
City of Canton For the Year Ended December 31, 2011
Property Values & Construction Permits Source: City of Canton Building Dept. and Stark County Auditor’s Office
City Hall during Renovation
City of Canton For the Year Ended December 31, 2011
Utility Operations
Water Sewer Refuse
Operating Revenue 13,842,633$ 13,371,229$ 6,097,490$
Nonoperating Revenue 15,933 (15,610) 29,256
Total Revenue 13,858,566 13,355,619 6,126,746
Operating Expenses 11,581,886 12,943,732 5,532,632
Nonoperating Expenses 896,124 280,642 -
Total Expenses 12,478,010 13,224,374 5,532,632
Net Revenues Over/ (Under) Expenses 1,380,556$ 131,245$ 594,114$
Construction in
Progress
$10,112,093
Water Assets
$50,236,731
Sewer Assets
$44,169,506
Land
$8,396,817
Building
$23,364,006
Vehicles &
Equipment
$8,854,256
Infrastructure
$58,659,473
Refuse Assets
$733,940
The operating results for the Water, Sewer, and Refuse Departments for the year ending December 31, 2011 are presented on a full accrual GAAP basis.
-8-
City of Canton For the Year Ended December 31, 2011
Total Capital Assets (shown net of depreciation)
Revenue Operating Revenue – This is revenue generated directly from the services provided by each department. Nonoperating Revenue – This is revenue the department receives that is not generated by providing services. An example is money gained or (lost) from selling an old piece of equipment.
Expenses Operating Expenses – These are costs incurred by the department to provide a service. Nonoperating Expenses – These are costs that are not created as a result of generating a service. An example is interest expenses incurred on long-term debt.
Assets Cash – Cash represents how much actual cash the City has in its bank accounts at year-end. Receivables – Receivables are the amounts of money owed to the City from outside entities, whether they are businesses or other governments. Receivables are expected to be collected within the following year. Capital Assets – Capital Assets are items that can be used for several years. This category includes things such as vehicles, buildings, land, traffic lights, roads, and storm sewers. Liabilities Current and Other Liabilities – This amount represents what the City owes to other entities. Portions are owed to businesses, other governments, and the City’s own employees. This amount is expected to be paid off within a year. Long-Term Liabilities – Long-Term Liabilities is the amount of money the city has borrowed by issuing tax-exempt bonds for various construction projects and now must pay back over time. The portion labeled Due Within One Year will be paid off next year. The remaining portion (Due Within More Than One Year) will paid off over several years. See page 15 for more details about debt. Net Assets
Net Assets – Net Assets are basically what you would have left if you had to use all of your assorted assets to payoff your liabilities.
Governmetal
Activities
2011 2010
Assets
Cash 20.8$ 24.6$
Receivables 34.7 32.6
Capital Assets, Net 110.5 109.4
Total Assets 166.0$ 166.6$
Liabilities
Current and Other Liabilities 11.6$ 12.4$
Due Within One Year 4.7 4.6
Long-Term Liabilities:
Due Within More Than One Year 20.8 23.3
Total Liabilities 37.1 40.3
Net Assets 128.9$ 126.3$
The Statement of Net Assets, also known as a “Balance Sheet”, reports assets (items available to provide services) against liabilities (amounts for which the City must pay in the future) and equity (the net value of the City’s assets after liabilities are subtracted). The Statement of Net Assets reflects only Governmental Activities not Business-Type Activities (Water, Sewer, and Refuse) or the City’s component unit. Governmental Activities accounts for most of the City’s basic services like police, fire, mayor, capital improvement, vehicle acquisition, parks and recreation. Income taxes, property taxes, undivided local government, ambulance user fees and federal grants finance most of these activities. All numbers are reported on a full GAAP accounting basis and are compliant with GASB standards with one exception. Unrestricted and Restricted Net Assets were combined into one category called “Net Assets” in order to make the statement easier to read. The amounts shown employ the same method of accounting as and were summarized in the audited financial statements within the 2011 CAFR
City of Canton For the Year Ended December 31, 2011
Statement of Net Assets (in millions)
-9-
Summit Area Housing Project
The charts on page 9 and 10 show the continued recovery of the global recession, is gradually improving the state of the City’s finances. In 2011, the City saw a drop in its cash position of over $3.8 million dollars. The cause can be seen in the chart on page 10, which shows an overall decline in revenue of $2.0 including decreased revenue; charges for service of $0.4 million and capital grants and contributions of $1.6 million. Total revenue increased by $5.10 million, led primarily by a $4.0 million increase in City income tax revenue. The City’s average yearly unemployment rate climbed from 11.4% in 2010 to 8.6% in 2011. Fortunately, the fourth quarter 2011 saw slight reductions with similar trends at the county and state level. This incremental rebound provides a sliver of optimism that the gradual recovery is translating into actual employment growth. The affects of the increased revenue have a positive affect on the City’s net assets as illustrated on page 10. This table detailing program expenses demonstrates that the City has increase general government functions by $0.6 million and increased security of persons and property by $1.8 million. Unfortunately, the City has also had to decrease the resources used on public health, transportation, and leisure time activity by a combined reduction of $1.5 million. The community development expenses decrease by $0.6 million due to final usage of several 2009 stimulus programs. The City of Canton continues to seek federal and state grant opportunities to subsidize the City’s governmental activities.
Analytical Analysis
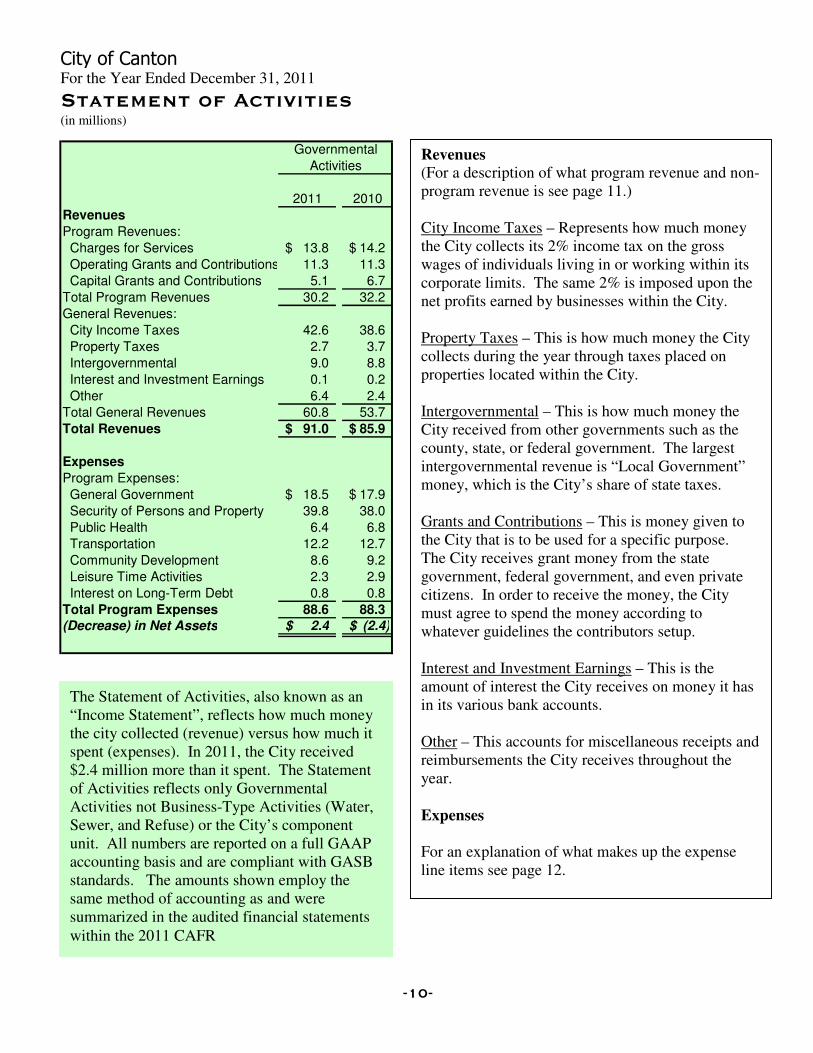
The Statement of Activities, also known as an “Income Statement”, reflects how much money the city collected (revenue) versus how much it spent (expenses). In 2011, the City received $2.4 million more than it spent. The Statement of Activities reflects only Governmental Activities not Business-Type Activities (Water, Sewer, and Refuse) or the City’s component unit. All numbers are reported on a full GAAP accounting basis and are compliant with GASB standards. The amounts shown employ the same method of accounting as and were summarized in the audited financial statements within the 2011 CAFR
-10-
City of Canton For the Year Ended December 31, 2011
Statement of Activities (in millions)
Governmental
Activities
2011 2010
Revenues
Program Revenues:
Charges for Services 13.8$ 14.2$
Operating Grants and Contributions 11.3 11.3
Capital Grants and Contributions 5.1 6.7
Total Program Revenues 30.2 32.2
General Revenues:
City Income Taxes 42.6 38.6
Property Taxes 2.7 3.7
Intergovernmental 9.0 8.8
Interest and Investment Earnings 0.1 0.2
Other 6.4 2.4
Total General Revenues 60.8 53.7
Total Revenues 91.0$ 85.9$
Expenses
Program Expenses:
General Government 18.5$ 17.9$
Security of Persons and Property 39.8 38.0
Public Health 6.4 6.8
Transportation 12.2 12.7
Community Development 8.6 9.2
Leisure Time Activities 2.3 2.9
Interest on Long-Term Debt 0.8 0.8
Total Program Expenses 88.6 88.3 (Decrease) in Net Assets 2.4$ (2.4)$
Revenues (For a description of what program revenue and non-program revenue is see page 11.) City Income Taxes – Represents how much money the City collects its 2% income tax on the gross wages of individuals living in or working within its corporate limits. The same 2% is imposed upon the net profits earned by businesses within the City. Property Taxes – This is how much money the City collects during the year through taxes placed on properties located within the City. Intergovernmental – This is how much money the City received from other governments such as the county, state, or federal government. The largest intergovernmental revenue is “Local Government” money, which is the City’s share of state taxes. Grants and Contributions – This is money given to the City that is to be used for a specific purpose. The City receives grant money from the state government, federal government, and even private citizens. In order to receive the money, the City must agree to spend the money according to whatever guidelines the contributors setup. Interest and Investment Earnings – This is the amount of interest the City receives on money it has in its various bank accounts. Other – This accounts for miscellaneous receipts and reimbursements the City receives throughout the year. Expenses For an explanation of what makes up the expense line items see page 12.
City of Canton For the Year Ended December 31, 2011
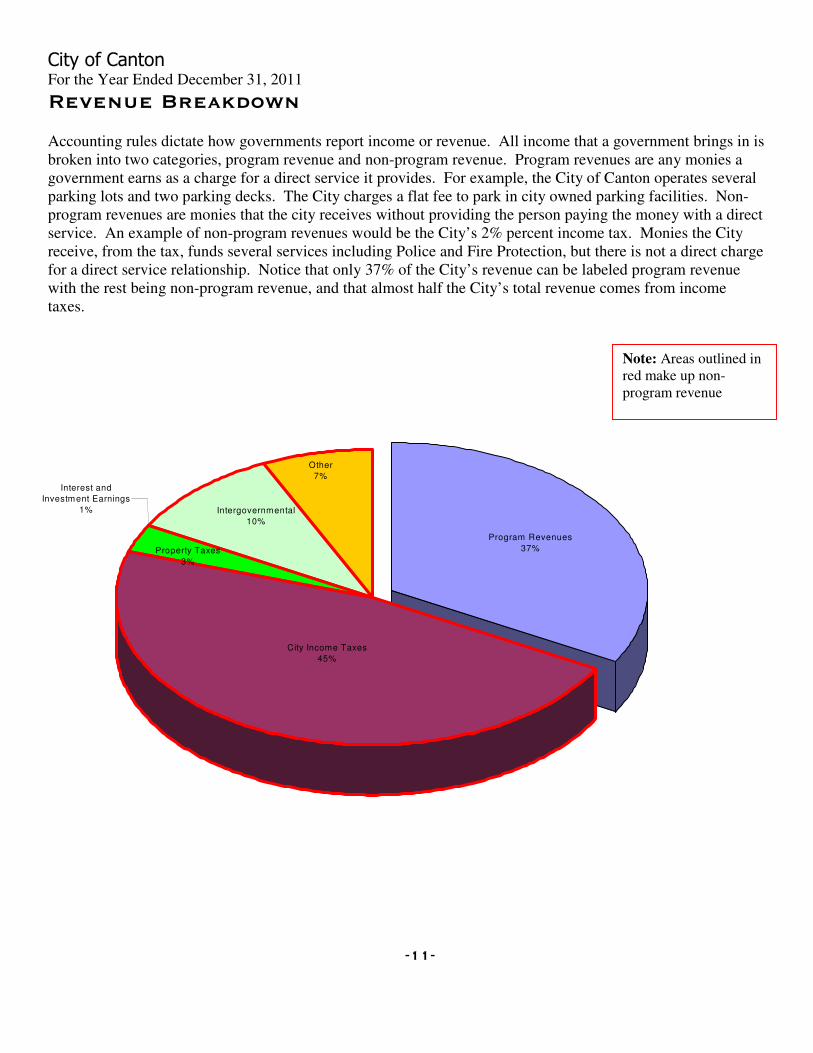
Revenue Breakdown Accounting rules dictate how governments report income or revenue. All income that a government brings in is broken into two categories, program revenue and non-program revenue. Program revenues are any monies a government earns as a charge for a direct service it provides. For example, the City of Canton operates several parking lots and two parking decks. The City charges a flat fee to park in city owned parking facilities. Non-program revenues are monies that the city receives without providing the person paying the money with a direct service. An example of non-program revenues would be the City’s 2% percent income tax. Monies the City receive, from the tax, funds several services including Police and Fire Protection, but there is not a direct charge for a direct service relationship. Notice that only 37% of the City’s revenue can be labeled program revenue with the rest being non-program revenue, and that almost half the City’s total revenue comes from income taxes.
-11-
Interest and
Investment Earnings
1%
City Income Taxes
45%
Program Revenues
37%Property Taxes
3%
Intergovernmental
10%
Other
7%
Note: Areas outlined in red make up non-program revenue
City of Canton For the Year Ended December 31, 2011
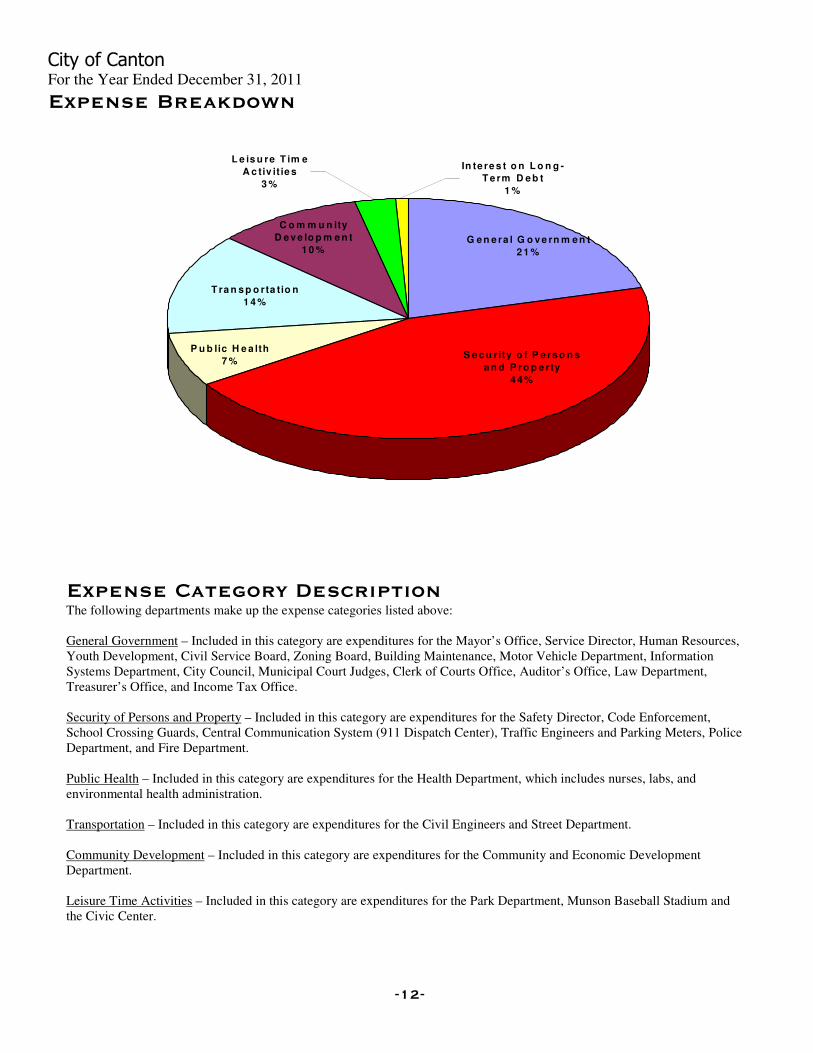
Expense Breakdown
In te re s t o n L o n g -
T e rm D e b t
1 %
L e is u re T im e
A c tiv it ie s
3 %
C o m m u n ity
D e v e lo p m e n t
1 0 %
T ra n s p o rta tio n
1 4 %
P u b lic H e a lth
7 %S e c u rity o f P e rs o n s
a n d P ro p e rty
4 4 %
G e n e ra l G o v e rn m e n t
2 1 %
Expense Category Description
The following departments make up the expense categories listed above: General Government – Included in this category are expenditures for the Mayor’s Office, Service Director, Human Resources, Youth Development, Civil Service Board, Zoning Board, Building Maintenance, Motor Vehicle Department, Information Systems Department, City Council, Municipal Court Judges, Clerk of Courts Office, Auditor’s Office, Law Department, Treasurer’s Office, and Income Tax Office. Security of Persons and Property – Included in this category are expenditures for the Safety Director, Code Enforcement, School Crossing Guards, Central Communication System (911 Dispatch Center), Traffic Engineers and Parking Meters, Police Department, and Fire Department. Public Health – Included in this category are expenditures for the Health Department, which includes nurses, labs, and environmental health administration. Transportation – Included in this category are expenditures for the Civil Engineers and Street Department. Community Development – Included in this category are expenditures for the Community and Economic Development Department. Leisure Time Activities – Included in this category are expenditures for the Park Department, Munson Baseball Stadium and the Civic Center. Interest on Long Term Debt – Included in this category are interest payments on the City’s outstanding debt.
-12-
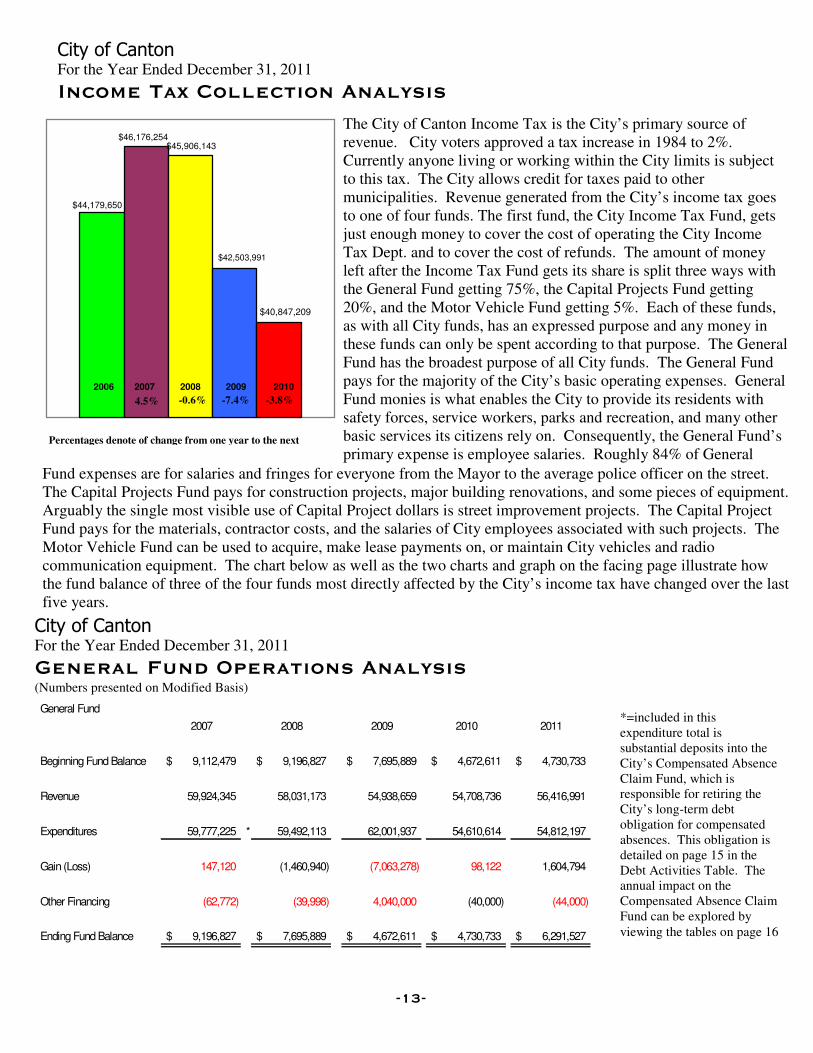
$44,179,650
$46,176,254$45,906,143
$42,503,991
$40,847,209
20102006 2007 2008 2009
General Fund
2007 2008 2009 2010 2011
Beginning Fund Balance 9,112,479$ 9,196,827$ 7,695,889$ 4,672,611$ 4,730,733$
Revenue 59,924,345 58,031,173 54,938,659 54,708,736 56,416,991
Expenditures 59,777,225 * 59,492,113 62,001,937 54,610,614 54,812,197
Gain (Loss) 147,120 (1,460,940) (7,063,278) 98,122 1,604,794
Other Financing (62,772) (39,998) 4,040,000 (40,000) (44,000)
Ending Fund Balance 9,196,827$ 7,695,889$ 4,672,611$ 4,730,733$ 6,291,527$
Fund expenses are for salaries and fringes for everyone from the Mayor to the average police officer on the street. The Capital Projects Fund pays for construction projects, major building renovations, and some pieces of equipment. Arguably the single most visible use of Capital Project dollars is street improvement projects. The Capital Project Fund pays for the materials, contractor costs, and the salaries of City employees associated with such projects. The Motor Vehicle Fund can be used to acquire, make lease payments on, or maintain City vehicles and radio communication equipment. The chart below as well as the two charts and graph on the facing page illustrate how the fund balance of three of the four funds most directly affected by the City’s income tax have changed over the last five years.
The City of Canton Income Tax is the City’s primary source of revenue. City voters approved a tax increase in 1984 to 2%. Currently anyone living or working within the City limits is subject to this tax. The City allows credit for taxes paid to other municipalities. Revenue generated from the City’s income tax goes to one of four funds. The first fund, the City Income Tax Fund, gets just enough money to cover the cost of operating the City Income Tax Dept. and to cover the cost of refunds. The amount of money left after the Income Tax Fund gets its share is split three ways with the General Fund getting 75%, the Capital Projects Fund getting 20%, and the Motor Vehicle Fund getting 5%. Each of these funds, as with all City funds, has an expressed purpose and any money in these funds can only be spent according to that purpose. The General Fund has the broadest purpose of all City funds. The General Fund pays for the majority of the City’s basic operating expenses. General Fund monies is what enables the City to provide its residents with safety forces, service workers, parks and recreation, and many other basic services its citizens rely on. Consequently, the General Fund’s primary expense is employee salaries. Roughly 84% of General
City of Canton For the Year Ended December 31, 2011
Income Tax Collection Analysis
City of Canton For the Year Ended December 31, 2011
General Fund Operations Analysis (Numbers presented on Modified Basis)
-0.6% -3.8% 4.5% -7.4%
Percentages denote of change from one year to the next
-13-
*=included in this expenditure total is substantial deposits into the City’s Compensated Absence Claim Fund, which is responsible for retiring the City’s long-term debt obligation for compensated absences. This obligation is detailed on page 15 in the Debt Activities Table. The annual impact on the Compensated Absence Claim Fund can be explored by viewing the tables on page 16
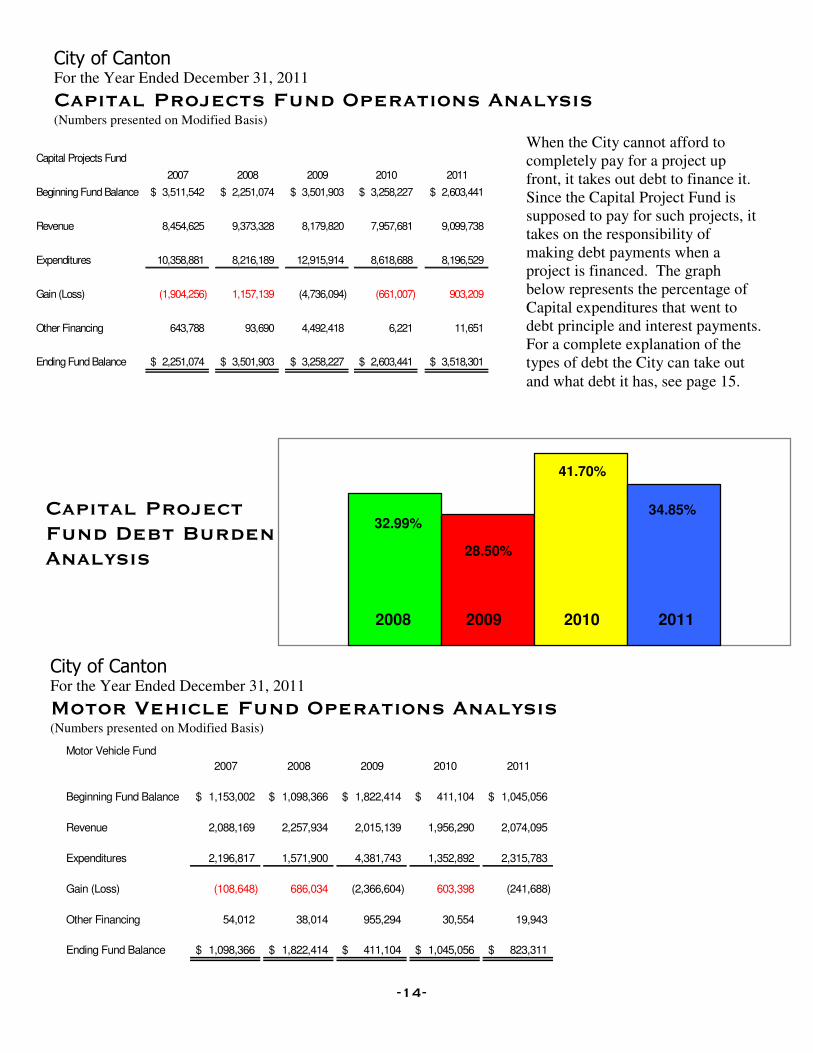
Motor Vehicle Fund
2007 2008 2009 2010 2011
Beginning Fund Balance 1,153,002$ 1,098,366$ 1,822,414$ 411,104$ 1,045,056$
Revenue 2,088,169 2,257,934 2,015,139 1,956,290 2,074,095
Expenditures 2,196,817 1,571,900 4,381,743 1,352,892 2,315,783
Gain (Loss) (108,648) 686,034 (2,366,604) 603,398 (241,688)
Other Financing 54,012 38,014 955,294 30,554 19,943
Ending Fund Balance 1,098,366$ 1,822,414$ 411,104$ 1,045,056$ 823,311$
City of Canton For the Year Ended December 31, 2011
Capital Projects Fund Operations Analysis (Numbers presented on Modified Basis)
City of Canton For the Year Ended December 31, 2011
Motor Vehicle Fund Operations Analysis (Numbers presented on Modified Basis)
-14-
When the City cannot afford to completely pay for a project up front, it takes out debt to finance it. Since the Capital Project Fund is supposed to pay for such projects, it takes on the responsibility of making debt payments when a project is financed. The graph below represents the percentage of Capital expenditures that went to debt principle and interest payments. For a complete explanation of the types of debt the City can take out and what debt it has, see page 15.
Capital Project Fund Debt Burden Analysis
32.99%
28.50%
41.70%
34.85%
20112008 2009 2010
Capital Projects Fund
2007 2008 2009 2010 2011
Beginning Fund Balance 3,511,542$ 2,251,074$ 3,501,903$ 3,258,227$ 2,603,441$
Revenue 8,454,625 9,373,328 8,179,820 7,957,681 9,099,738
Expenditures 10,358,881 8,216,189 12,915,914 8,618,688 8,196,529
Gain (Loss) (1,904,256) 1,157,139 (4,736,094) (661,007) 903,209
Other Financing 643,788 93,690 4,492,418 6,221 11,651
Ending Fund Balance 2,251,074$ 3,501,903$ 3,258,227$ 2,603,441$ 3,518,301$
City of Canton For the Year Ended December 31, 2011
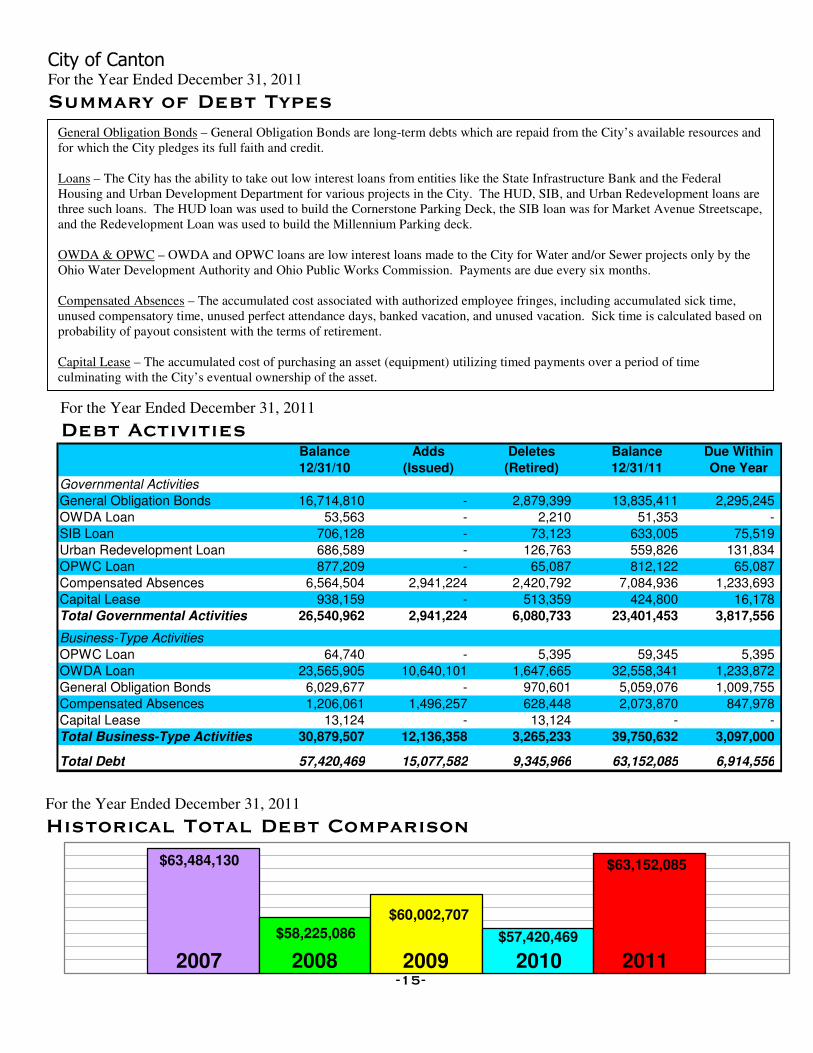
Summary of Debt Types
Balance Adds Deletes Balance Due Within
12/31/10 (Issued) (Retired) 12/31/11 One Year
Governmental Activities
General Obligation Bonds 16,714,810 - 2,879,399 13,835,411 2,295,245
OWDA Loan 53,563 - 2,210 51,353 -
SIB Loan 706,128 - 73,123 633,005 75,519
Urban Redevelopment Loan 686,589 - 126,763 559,826 131,834
OPWC Loan 877,209 - 65,087 812,122 65,087
Compensated Absences 6,564,504 2,941,224 2,420,792 7,084,936 1,233,693
Capital Lease 938,159 - 513,359 424,800 16,178
Total Governmental Activities 26,540,962 2,941,224 6,080,733 23,401,453 3,817,556
Business-Type Activities
OPWC Loan 64,740 - 5,395 59,345 5,395
OWDA Loan 23,565,905 10,640,101 1,647,665 32,558,341 1,233,872
General Obligation Bonds 6,029,677 - 970,601 5,059,076 1,009,755
Compensated Absences 1,206,061 1,496,257 628,448 2,073,870 847,978
Capital Lease 13,124 - 13,124 - -
Total Business-Type Activities 30,879,507 12,136,358 3,265,233 39,750,632 3,097,000
Total Debt 57,420,469 15,077,582 9,345,966 63,152,085 6,914,556
General Obligation Bonds – General Obligation Bonds are long-term debts which are repaid from the City’s available resources and for which the City pledges its full faith and credit. Loans – The City has the ability to take out low interest loans from entities like the State Infrastructure Bank and the Federal Housing and Urban Development Department for various projects in the City. The HUD, SIB, and Urban Redevelopment loans are three such loans. The HUD loan was used to build the Cornerstone Parking Deck, the SIB loan was for Market Avenue Streetscape, and the Redevelopment Loan was used to build the Millennium Parking deck. OWDA & OPWC – OWDA and OPWC loans are low interest loans made to the City for Water and/or Sewer projects only by the Ohio Water Development Authority and Ohio Public Works Commission. Payments are due every six months. Compensated Absences – The accumulated cost associated with authorized employee fringes, including accumulated sick time, unused compensatory time, unused perfect attendance days, banked vacation, and unused vacation. Sick time is calculated based on probability of payout consistent with the terms of retirement. Capital Lease – The accumulated cost of purchasing an asset (equipment) utilizing timed payments over a period of time culminating with the City’s eventual ownership of the asset.
-15-
$63,484,130
$58,225,086
$60,002,707
$57,420,469
$63,152,085
2007 2008 2009 2010 2011
For the Year Ended December 31, 2011
Debt Activities
For the Year Ended December 31, 2011
Historical Total Debt Comparison
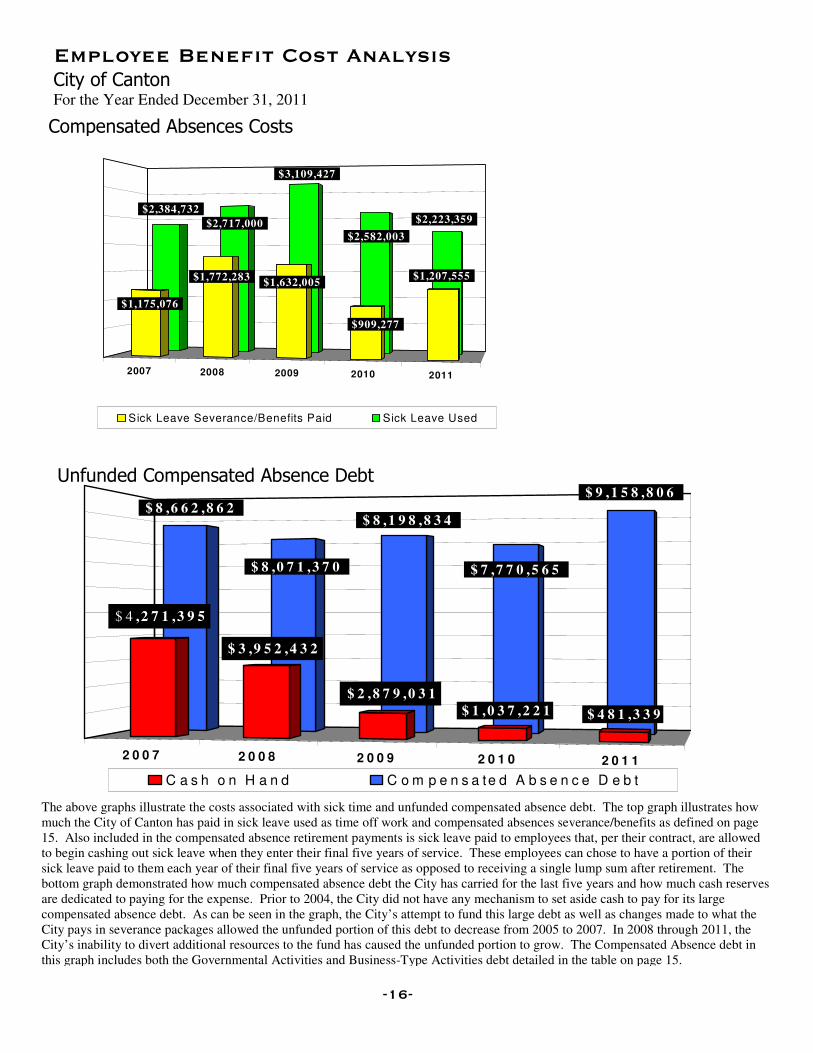
The above graphs illustrate the costs associated with sick time and unfunded compensated absence debt. The top graph illustrates how much the City of Canton has paid in sick leave used as time off work and compensated absences severance/benefits as defined on page 15. Also included in the compensated absence retirement payments is sick leave paid to employees that, per their contract, are allowed to begin cashing out sick leave when they enter their final five years of service. These employees can chose to have a portion of their sick leave paid to them each year of their final five years of service as opposed to receiving a single lump sum after retirement. The bottom graph demonstrated how much compensated absence debt the City has carried for the last five years and how much cash reserves are dedicated to paying for the expense. Prior to 2004, the City did not have any mechanism to set aside cash to pay for its large compensated absence debt. As can be seen in the graph, the City’s attempt to fund this large debt as well as changes made to what the City pays in severance packages allowed the unfunded portion of this debt to decrease from 2005 to 2007. In 2008 through 2011, the City’s inability to divert additional resources to the fund has caused the unfunded portion to grow. The Compensated Absence debt in this graph includes both the Governmental Activities and Business-Type Activities debt detailed in the table on page 15.
-16-
Employee Benefit Cost Analysis City of Canton For the Year Ended December 31, 2011
2 0 0 7 2 0 0 8 2 0 0 9 2 0 1 0 2 0 1 1
$ 8 ,6 6 2 ,8 6 2
$ 8 ,0 7 1 ,3 7 0
$ 8 ,1 9 8 ,8 3 4
$ 7 ,7 7 0 ,5 6 5
$ 9 ,1 5 8 ,8 0 6
$ 4 ,2 7 1 ,3 9 5
$ 3 ,9 5 2 ,4 3 2
$ 2 ,8 7 9 ,0 3 1
$ 1 ,0 3 7 ,2 2 1 $ 4 8 1 ,3 3 9
C a s h o n H a n d C o m p e n s a te d A b s e n c e D e b t
Unfunded Compensated Absence Debt
2007 2008 2009 2010 2011
$2,384,732
$2,717,000
$3,109,427
$2,582,003
$2,223,359
$1,175,076
$1,772,283$1,632,005
$909,277
$1,207,555
Sick Leave Severance/Benefits Paid Sick Leave Used
Compensated Absences Costs
POPULAR ANNUALFINANCIAL REPORT
CITY OF CANTON, OHIO
logo art provided byPRO FOOTBALL HALL OF FAME ENSHRINEMENT FESTIVAL


![Popular Financial Functions [Finatics]](https://static.fdocuments.us/doc/165x107/577cded71a28ab9e78afe902/popular-financial-functions-finatics.jpg)