Poornima Varma Centre for Management in Agriculture ...ageconsearch.umn.edu/bitstream/235806/2/AAEA...
29
1 Agricultural Technology Adoption under Multiple Constraints: An Analysis of System of Rice Intensification (SRI) in India Poornima Varma Centre for Management in Agriculture, Indian Institute of Management, Ahmedabad, India Email:[email protected] Selected Paper prepared for presentation at the 2016 Agricultural & Applied Economics Association Annual Meeting, Boston, Massachusetts, July 31-August 2 Copyright 2016 by Poornima Varma. All rights reserved. Readers may make verbatim copies of this document for non-commercial purposes by any means, provided that this copyright notice appears on all such copies.
Transcript of Poornima Varma Centre for Management in Agriculture ...ageconsearch.umn.edu/bitstream/235806/2/AAEA...

1
Agricultural Technology Adoption under Multiple Constraints: An Analysis of System
of Rice Intensification (SRI) in India
Poornima Varma
Centre for Management in Agriculture,
Indian Institute of Management, Ahmedabad, India
Email:[email protected]
Selected Paper prepared for presentation at the 2016 Agricultural & Applied Economics
Association Annual Meeting, Boston, Massachusetts, July 31-August 2
Copyright 2016 by Poornima Varma. All rights reserved. Readers may make verbatim copies of this
document for non-commercial purposes by any means, provided that this copyright notice appears on
all such copies.

2
Agricultural Technology Adoption under Multiple Constraints: An Analysis of System
of Rice Intensification (SRI) in India
Abstract
The study analyses the role of multiple binding constraints such as information, extension
services, availability of labourers and irrigation in conditioning System of Rice
Intensification (SRI) adoption by rice farmers in selected rice producing districts of India.
The multiple thresholds that farmers need to overcome are analysed using a multi-hurdle
model which explicitly incorporates the impact of constraints in adoption decisions. The
results showed that age of the farmer reduced the access to information whereas the size of
the farm increased the access to information. Gender of the head of the household, education,
membership in farmer organisations etc. was crucial in getting access to extension services.
Age of the household head, full time farming etc. increased the availability of labourers. Type
of soil and terrain were found to be important in getting access to irrigation facility. District
wise disparities showed that the disparities were the highest in the case of accessing
information and followed by extension services. Although factors influencing the intensity (in
terms of acres) as well as the depth of adoption (in terms of packages) were slightly different
household assets, number of improved rice varieties known, membership in farmer
organisations, risk etc. were significant in influencing the adoption decisions.
JEL Classifications: Q10, Q16, Q18, O31, O33.
Keywords: Natural Resource Management; System of Rice Intensification; Multi-Hurdle
Model; Conditional Mixed Process; India.

3
Introduction
The System of Rice Intensification (SRI) is widely considered as a promising systemic
approach to increase rice production at affordable costs for small-scale producers without
harming the environment. SRI originated in Madagascar as a way to increase the productivity
of rice paddies while simultaneously decreasing water and other input requirements,
benefiting Malagasy smallholder farmers who have few economic resources. SRI introduces
changes in a range of management practices consisting of (1) use of young seedlings that are
8-12 days old; (2) shallow planting (1-2 cm) of one or two seedlings; (3) sparse planting in a
square grid (more than 20 x 20 cm); and (4) intermittent irrigation (Takahashi and Barrett,
2014). It is expected to enhance rice yield and substantially reduce expenditure (Stoop et al.,
2002; Uphoff, 2002, 2003) by altering plants, soil, water and nutrients management practices
(Satyanarayana et al., 2007). Thus, SRI comprises of three major principles such as soil
management, plant management and water management.1
In India, SRI is becoming popular with farmers and taking firm root with about 1 million
hectares of area under SRI cultivation making it 2.42% of total area under rice cultivation in
the country (Gujja and Thiyagarajan, 2013). Field trials are being conducted in all the major
rice-producing states of India like West Bengal, Punjab, Gujarat, Uttar Pradesh, Andhra
Pradesh, and Tamil Nadu; there is also a widening involvement of farmers, government
institutions, research agencies, and funding agencies to work together for a large-scale
adoption of SRI. Out of 564 rice-growing districts in India, SRI is being practiced by farmers
in about 216 districts (ICRISAT, 2008). Moreover, SRI is regarded as a key means of
boosting national rice production under the Government of India’s National Food Security
Mission (NFSM).2
1 Soil management: The use of organic matter to improve soil quality and performing
weeding using a mechanical rotary weeder. Plant management: Planting single young
seedlings (between 8-12 days old) carefully, gently and horizontally into the soil with wider
spacing. Water management: Keep the soil moist but not continuously flooded during the
plants’ vegetative growth phase, until the stage of flowering and grain production.
2 The National Food Security Mission (NFSM) was launched in 2007 as a centrally-sponsored scheme to
enhance food security through targeted production of rice, wheat, and pulses and coarse cereals. Various
interventions for commercial crops have also been proposed.

4
Although several studies have highlighted the high-yield and low-cost benefits of SRI the rate
of adoption remains low (Reddy et al, 2005). Studies find SRI to be labour intensive (Noltze
et al., 2012). As per the literature the reasons for poor rate of adoption and high non-adoption
rates are the labour-intensive nature of SRI and the skill of farming that it requires (Barrett et
al., 2004; Palanisami et al., 2013). The major constraints in the adoption of SRI/modified SRI
practices are lack of skilled manpower available in time for planting operations, poor water
control in the fields, and unsuitable soils. Studies point out that the yield realisation under full
adoption of SRI is significantly higher than partial adoption (Palanisami et al., 2013).
Aversion to risk by farmers has also been highlighted by some studies as the reason for poor
adoption (Johnson and Vijayaraghavan, 2011).
The available studies on SRI in general and that for India in particular point out various
constraints faced by farmers in adopting SRI despite the proven benefits. In practice, even
farmers with positive demand for adoption may not be able to adopt a new technology due to
the multiple constraints in adoption (Shiferaw et al., 2015). Nonetheless, studies investigating
adoption of agricultural technologies in the context of multiple binding constraints are very
limited. In fact, many adoption decision studies, including some of the studies mentioned
above, assume that farmers function in a perfect information setting and, therefore, enjoy an
unconstrained access to technology. According to Shiferaw et al. (2015), under such
conditions of the zero (non-adoption) generating process, an adoption decision is modelled
using probit and logit models for non-divisible technologies and tobit type models for
divisible technologies.
Even in a perfect information setting, farmers with positive desired demand for adoption may
fail to realise this potential demand owing to various constraints (Croppenstedt et al., 2003;
Shiferaw et al., 2008; Shiferaw et al., 2015). The relaxation of constraints may lead to an
increased adoption of new technology and, therefore, modelling technology adoption by
dividing farmers into adopters and non-adopters fail to bring out the difference between
actual and desired demand (Shiferaw et al., 2015). This may lead to inconsistency in
estimated parameters.
Although there are studies analysing the factors influencing the adoption of technology under
multiple constraints (Shiferaw et al., 2008; Shiferaw et al., 2015), there are hardly any such
studies in the context of SRI. An understanding of the factors influencing adoption of

5
environmental friendly methods such as SRI is pertinent to overcome the hurdles that farmers
face in the process. The present study analyses the role of information, extension services,
irrigation, and the availability of labourers in conditioning technology adoption by rice
farmers in selected States of India. Although the present study focuses mainly on SRI
adoption, the study intends to make a contribution to agricultural technology adoption in
general and SRI adoption literature in particular. Our study analyses the adoption SRI by
studying the probability for adoption of SRI conditional upon availability of information,
availability of extension services, availability of irrigation, and availability of labour. The
joint probability for adoption is estimated using conditional (recursive) mixed process
estimator (CMP) developed by Roodman (2009 & 2011).
The remainder of the article is organized as follows. Section 2 presents the data, study area
and the socio-economic profile of the sample households. Section 3 provides conceptual
framework for household technology adoption in the presence of multiple binding constraints
along with variable description and hypothesized relationships. Section 4 deals with the
model specification and the main analytical results are presented and discussed in section 5.
Concluding observations and policy implications are presented in section 6.
Study Area, Data collection and Socio-Economic Profile of the Households
Among the rice-producing States, the highest differences in gross margin and yield between
traditional rice cultivation and SRI method were noticed in the case of three States
(Palanisami et al., 2013) namely, Karnataka, Orissa and Madhya Pradesh. Subsequently, 2
districts from each of these three States that belong to the same agro-climatic zones are
identified. Out of these two districts, one district has promotion of SRI through NFSM.
For Karnataka, Hassan (SRI-NFSM) and Chikmagalur (SRI) districts are identified.
Similarly, for Orissa, Keonjhar (SRI-NFSM) and Mayurbhanj (SRI) districts are identified.
For Madhya Pradesh, Sidhi (SRI) and Sahdol (SRI-NFSM) districts are selected.
The primary data is collected through a comprehensive household survey. A stratified
random sampling technique has been adopted for selecting farm households. Rice-farming
households were identified in the selected blocks/taluks of the districts and stratified into SRI

6
farmers and non-SRI farmers.3 The list of SRI farmers were obtained from the district
agricultural offices of the respective districts.
A random sample of SRI adopters and non-adopters from each block/taluk was selected. The
total number of households interviewed was 386. The total sample consists of equal number
of adopters and non-adopters. Agriculture was the main occupation and livelihood strategy
for most of the farm households in the study districts. Majority of the farm households
interviewed were either marginal farmers or small farmers. Marginal farmers were around
45%, small farmers were around 36%, semi-medium farmers were around 16%, medium
farmers were around 3% and large farmers were less than 1%.
Conceptual Framework
Knowledge and perception of innovations are fundamental and integral parts of the
underlying decision-making process of adoption (Rogers, 2003). Farmers’ decision to adopt
innovations has been extensively studied in a wide range of literature (Feder et al., 1985;
Shiferaw et al., 2008; Teklewold et al., 2013; Kassie et al., 2013; Shiferaw et al., 2015;
Manda et al., 2015; Kassie et al., 2015).
The farmers’ decision on whether to adopt a new technology or not is based on utility
maximisation (Rahm and Huffman, 1984; Shiferaw et al., 2015). The ith farmer will go for
new technology if the utility derived from the new technology is greater than the old
technology, i.e., U1i > U0i. By denoting A for adoption decision we can write:
𝐴𝑑 = {1 𝑖𝑓 𝑈0𝑖 < 𝑈1𝑖
0 𝑖𝑓 𝑈1𝑖 ≥ 𝑈0𝑖 (1)
In the first scenario (Ad=1) the utility from the new technology is higher whereas in the
second scenario (Ai=0) the utility is smaller than or equal to the old technology. The
probability that the farmer adopts superior technology (Ai=1) depends on a set of explanatory
variables.
𝑃𝑖 = 𝑃𝑟(𝐴𝑑 = 1) = 𝑃𝑟(𝑈1𝑖 > 𝑈0𝑖)
= 𝑃𝑟[𝛼1𝐹𝑖(𝑅𝑖𝑌𝑖) + 𝑒1𝑖 > 𝛼0 𝐹𝑖(𝑅𝑖𝑌𝑖) + 𝑒𝑜,𝑖 (2)
= 𝑃𝑟[𝑒1𝑖 − 𝑒0,𝑖 > 𝐹𝑖(𝑅𝑖, 𝐿𝑖)(𝛼1 − 𝛼0)]
= 𝑃𝑟(𝜇𝑖 > −𝐹𝑖(𝑅𝑖𝐿𝑖)𝛽)
3 Alur, Hassan and Sakleshpur blocks from Hassan; Chikmagalur block from Chikmagalur; Sadar, Patna, and
Harichandapur from Keonjhar; Karanjia and Jashipur from Mayurbhanj; Sidhi and Sihawal from Sidhi; Gohapru
and Sohajpur from Shahdol were selected.
7
= 𝐹𝑖(𝑋𝑖𝛽)
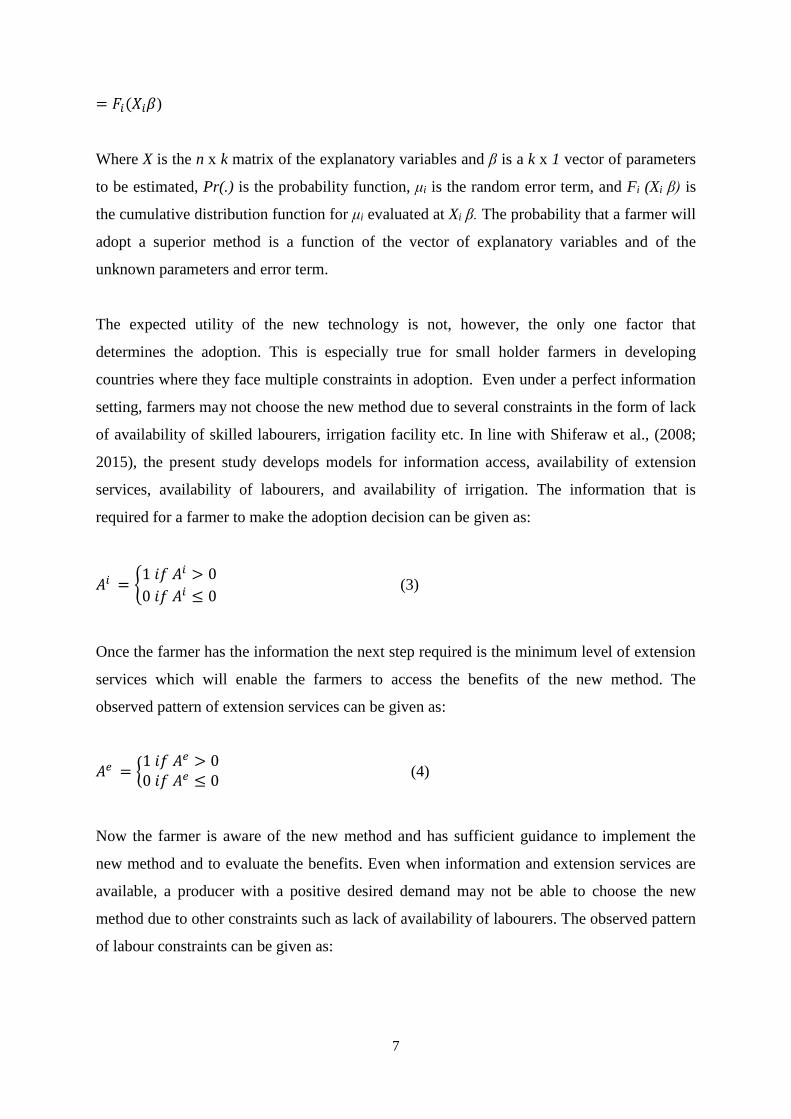
Where X is the n x k matrix of the explanatory variables and β is a k x 1 vector of parameters
to be estimated, Pr(.) is the probability function, μi is the random error term, and Fi (Xi β) is
the cumulative distribution function for μi evaluated at Xi β. The probability that a farmer will
adopt a superior method is a function of the vector of explanatory variables and of the
unknown parameters and error term.
The expected utility of the new technology is not, however, the only one factor that
determines the adoption. This is especially true for small holder farmers in developing
countries where they face multiple constraints in adoption. Even under a perfect information
setting, farmers may not choose the new method due to several constraints in the form of lack
of availability of skilled labourers, irrigation facility etc. In line with Shiferaw et al., (2008;
2015), the present study develops models for information access, availability of extension
services, availability of labourers, and availability of irrigation. The information that is
required for a farmer to make the adoption decision can be given as:
𝐴𝑖 = {1 𝑖𝑓 𝐴𝑖 > 0
0 𝑖𝑓 𝐴𝑖 ≤ 0 (3)
Once the farmer has the information the next step required is the minimum level of extension
services which will enable the farmers to access the benefits of the new method. The
observed pattern of extension services can be given as:
𝐴𝑒 = {1 𝑖𝑓 𝐴𝑒 > 00 𝑖𝑓 𝐴𝑒 ≤ 0
(4)
Now the farmer is aware of the new method and has sufficient guidance to implement the
new method and to evaluate the benefits. Even when information and extension services are
available, a producer with a positive desired demand may not be able to choose the new
method due to other constraints such as lack of availability of labourers. The observed pattern
of labour constraints can be given as:
8
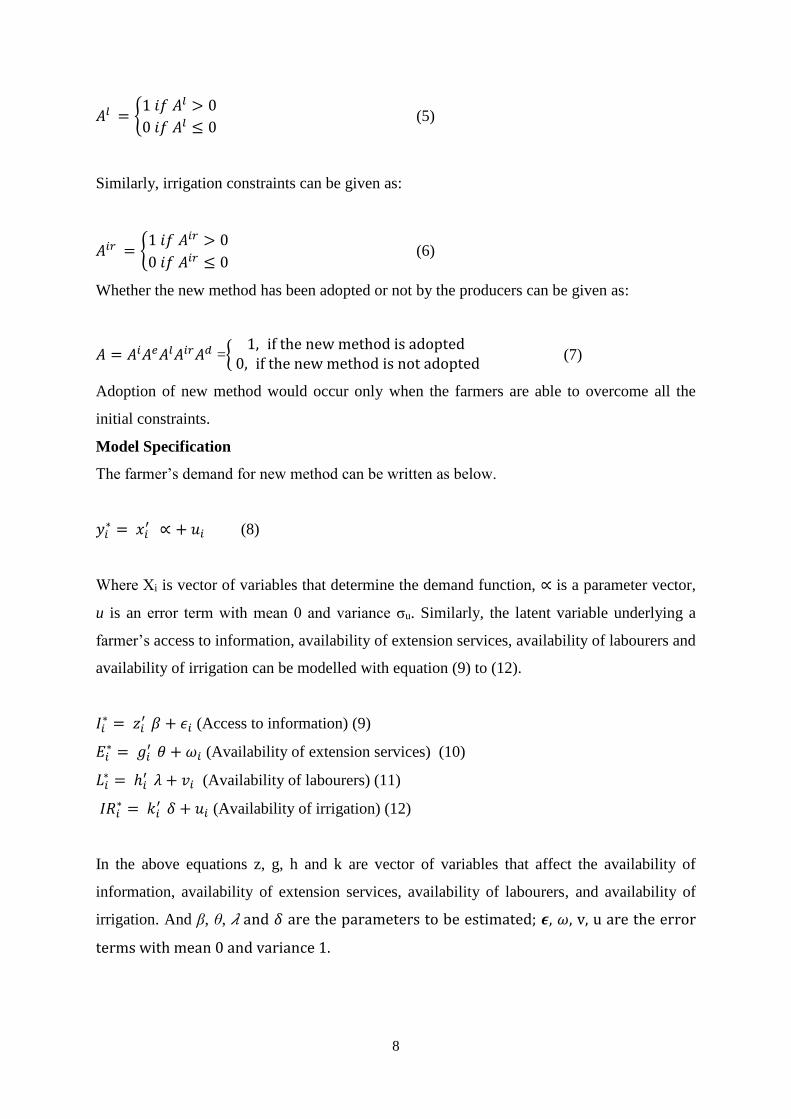
𝐴𝑙 = {1 𝑖𝑓 𝐴𝑙 > 0
0 𝑖𝑓 𝐴𝑙 ≤ 0 (5)
Similarly, irrigation constraints can be given as:
𝐴𝑖𝑟 = {1 𝑖𝑓 𝐴𝑖𝑟 > 0
0 𝑖𝑓 𝐴𝑖𝑟 ≤ 0 (6)
Whether the new method has been adopted or not by the producers can be given as:
𝐴 = 𝐴𝑖𝐴𝑒𝐴𝑙𝐴𝑖𝑟𝐴𝑑 ={ 1, if the new method is adopted
0, if the new method is not adopted (7)
Adoption of new method would occur only when the farmers are able to overcome all the
initial constraints.
Model Specification
The farmer’s demand for new method can be written as below.
𝑦𝑖∗ = 𝑥𝑖
′ ∝ + 𝑢𝑖 (8)
Where Χi is vector of variables that determine the demand function, ∝ is a parameter vector,
u is an error term with mean 0 and variance σu. Similarly, the latent variable underlying a
farmer’s access to information, availability of extension services, availability of labourers and
availability of irrigation can be modelled with equation (9) to (12).
𝐼𝑖∗ = 𝑧𝑖
′ 𝛽 + 𝜖𝑖 (Access to information) (9)
𝐸𝑖∗ = 𝑔𝑖
′ 𝜃 + 𝜔𝑖 (Availability of extension services) (10)
𝐿𝑖∗ = ℎ𝑖
′ 𝜆 + 𝑣𝑖 (Availability of labourers) (11)
𝐼𝑅𝑖∗ = 𝑘𝑖
′ 𝛿 + 𝑢𝑖 (Availability of irrigation) (12)
In the above equations z, g, h and k are vector of variables that affect the availability of
information, availability of extension services, availability of labourers, and availability of
irrigation. And β, θ, 𝜆 and 𝛿 are the parameters to be estimated; 𝝐, 𝜔, v, u are the error
terms with mean 0 and variance 1.

9
The observed demand for new method by a farmer (Yi) is characterised by the interaction of
model (8) to (12). The adoption of new method is observed only when all the initial hurdles
have been overcome. This comprises the first group-adopters. Group 2 consists of farmers
who do not have any information about SRI and hence cannot adopt SRI irrespective of
whether they have availability of labourers or irrigation. In such case they will be indifferent
to extension services. The third group will have availability of information but do not have
sufficient knowledge in adoption due to lack of extension services. The fourth group consists
of those farmers who have information and access to extension services and therefore have
positive demand but are unable to adopt the new method due to the lack of availability of
labourers. The fifth group will have information, extension services etc., and therefore
positive demand but unable to adopt due to the lack of irrigation facility. The last group do
not have positive demand for adoption of SRI and hence information, availability of labourers
etc., are irrelevant for them.
In line with Shiferaw et al. (2008; 2015), the probability for adopting a new method can be
given as:
𝑃(𝐴) = 𝑃(𝐴)𝑑 ∗ 𝑃(𝐴)𝑖 ∗ 𝑃(𝐴)𝑒 ∗ 𝑃(𝐴)𝑙 ∗ 𝑃(𝐴)𝑖𝑟 (13)
The model estimated through CMP will analyse the joint probability of adoption of SRI by
incorporating multiple constraints in the model. CMP estimates multi-equation, recursive
mixed process models. "Mixed process" means that different equations can have different
kinds of dependent variables. CMP can only fit “recursive" models with clearly defined
stages. A and B can be determinants of C and C a determinant of D--but D cannot be a
determinant of A, B, or C (Roodman. 2011). Equations from 9 to 12 are estimated using
probit models while a truncated normal model estimates the intensity as well as the depth of
adoption (equation 8, where Yi represents the adoption of farmer in terms of both the
intensity of adoption as well as the depth of adoption). The depth of adoption is defined in
terms of the number of SRI packages adopted by a farmer4. The intensity of adoption is
defined as the number of acres devoted for SRI cultivation by a farmer.
4 The depth of adoption of SRI is analysed using the total packages as dependent variable. The SRI emerged as
a set of six practices. They are as follows:
1. Transplanting of young seedlings
2. Shallow planting of seedlings
3. Single seedling at wider spacing

10
Description of variables
The selection of variables included in our analysis is based on literature review and insights
from other studies on farm household behaviour under imperfect market setting (Shiferaw et
al., 2008; Shiferaw et al., 2015). Imperfect information, labour markets etc., will have direct
impact on adoption as marginal cost of adoption will be higher for those households that face
these constraints (Shiferaw et al., 2015). Therefore, we include many household and farm
characteristics that have an impact on adoption decisions. Several studies have included
household characteristics such as age of the head of the household, gender of the head of
the household, size of the household, education etc., as important factors influencing the
adoption decision by farmers (Feder et al., 1985; Uaiene, 2011; Teklewold et al., 2013;
Ogada et al., 2014; Manda et al., 2015). Another important human capital which is relevant in
influencing the adoption and the extent of adoption is number of active family labourers
(Langyintuo and Mungoma, 2008; Noltze et al., 2012). Adoption of a new technology can be
less attractive to those who do not have sufficient family labourers (Langyintuo and
Mungoma, 2008). Also the household size is used as a proxy to capture labour endowment
(Pender and Gebremedhin, 2008). As far as the importance of total farm size is concerned,
studies on SRI shows a positive relationship between the size of the farm and intensity of SRI
in Timor Leste (Noltze et al., 2012), whereas studies on the adoption of improved maize
varieties in Zambia showed a negative relationship (Langyintuo and Mungoma, 2008).
Higher initial Assets owned by the farmer is expected to relax many of the above-mentioned
constraints and, therefore, is an important factor in deciding the adoption (Langyintuo and
Mungoma, 2008). Also, we consider the impact of farmers who have farming as main
occupation on adoption decisions. The study by Noltze et al. (2013) show that household
heads whose main occupation is farming are much less likely to adopt SRI. Access to off-
farm activities and income in general are expected to have a positive impact on adoption
decisions (Davis et al., 2009). The study by Langyintuo and Mungoma (2008) found a
4. Weeding by mechanical weeder
5. Use of organics
6. Efficient water management: Alternate wetting and drying
For the purpose of our analysis, we have decided to split the third package into two—single seedling and wider
spacing. We observed that many farmers, although allowing wider spacing, were planting more than one
seedling.
11
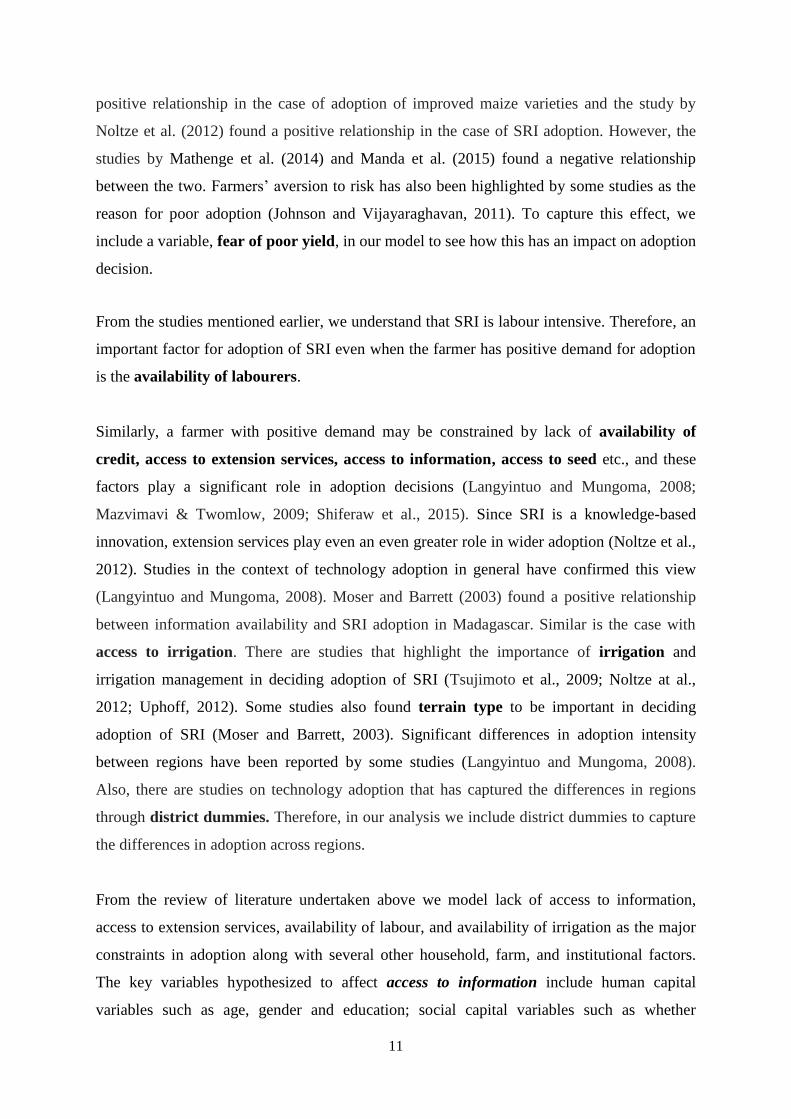
positive relationship in the case of adoption of improved maize varieties and the study by
Noltze et al. (2012) found a positive relationship in the case of SRI adoption. However, the
studies by Mathenge et al. (2014) and Manda et al. (2015) found a negative relationship
between the two. Farmers’ aversion to risk has also been highlighted by some studies as the
reason for poor adoption (Johnson and Vijayaraghavan, 2011). To capture this effect, we
include a variable, fear of poor yield, in our model to see how this has an impact on adoption
decision.
From the studies mentioned earlier, we understand that SRI is labour intensive. Therefore, an
important factor for adoption of SRI even when the farmer has positive demand for adoption
is the availability of labourers.
Similarly, a farmer with positive demand may be constrained by lack of availability of
credit, access to extension services, access to information, access to seed etc., and these
factors play a significant role in adoption decisions (Langyintuo and Mungoma, 2008;
Mazvimavi & Twomlow, 2009; Shiferaw et al., 2015). Since SRI is a knowledge-based
innovation, extension services play even an even greater role in wider adoption (Noltze et al.,
2012). Studies in the context of technology adoption in general have confirmed this view
(Langyintuo and Mungoma, 2008). Moser and Barrett (2003) found a positive relationship
between information availability and SRI adoption in Madagascar. Similar is the case with
access to irrigation. There are studies that highlight the importance of irrigation and
irrigation management in deciding adoption of SRI (Tsujimoto et al., 2009; Noltze at al.,
2012; Uphoff, 2012). Some studies also found terrain type to be important in deciding
adoption of SRI (Moser and Barrett, 2003). Significant differences in adoption intensity
between regions have been reported by some studies (Langyintuo and Mungoma, 2008).
Also, there are studies on technology adoption that has captured the differences in regions
through district dummies. Therefore, in our analysis we include district dummies to capture
the differences in adoption across regions.
From the review of literature undertaken above we model lack of access to information,
access to extension services, availability of labour, and availability of irrigation as the major
constraints in adoption along with several other household, farm, and institutional factors.
The key variables hypothesized to affect access to information include human capital
variables such as age, gender and education; social capital variables such as whether

12
household members hold an official position; number of assets owned; communication
technology (ICT) such as radio, TV and mobile; farm size; and number of other crops
cultivated. Similarly, access to extension services is expected to depend upon human capital
variables mentioned above as well as social capital variable such as membership in input
supply cooperatives, ICT variables, farm size, whether farming is main occupation, and other
crops cultivated. Access to labourers is expected to link with the wage rates, human capital
variables, number of family labourers, access to off-farm activity, assets etc. Similarly,
availability of irrigation is expected to depend upon assets and human capital variables
(assets, age, gender, education etc.), experience in agriculture, soil and terrain type,
availability of credit etc. The final equation of intensity of SRI adoption (in terms of acres
allotted for SRI) after overcoming multiple hurdles is expected to depend upon human capital
variables, experience in agriculture, assets, credit, number of improved varieties known etc.
Similarly, the depth of adoption in terms of the number of packages is estimated within the
same constraints. 5
Estimation Results and Discussion
Descriptive Statistics
Total sample size was 386, of which 193 households were non-adopters of SRI. Among non-
adopters around 38 farmers didn’t have any information about SRI. This is interesting as it
shows that around 80% of farmers were aware of SRI. Therefore, the lack of information did
not play a role in non-adoption. Rather it points to the role of other constraints. Among the
non-adopters, around 122 farmers didn’t have any sort of extension services, 115 farmers
faced difficulty with respect to irrigation, and 117 farmers reported difficulty in getting
labourers. Availability of labourers was a problem even among the adopters of SRI.
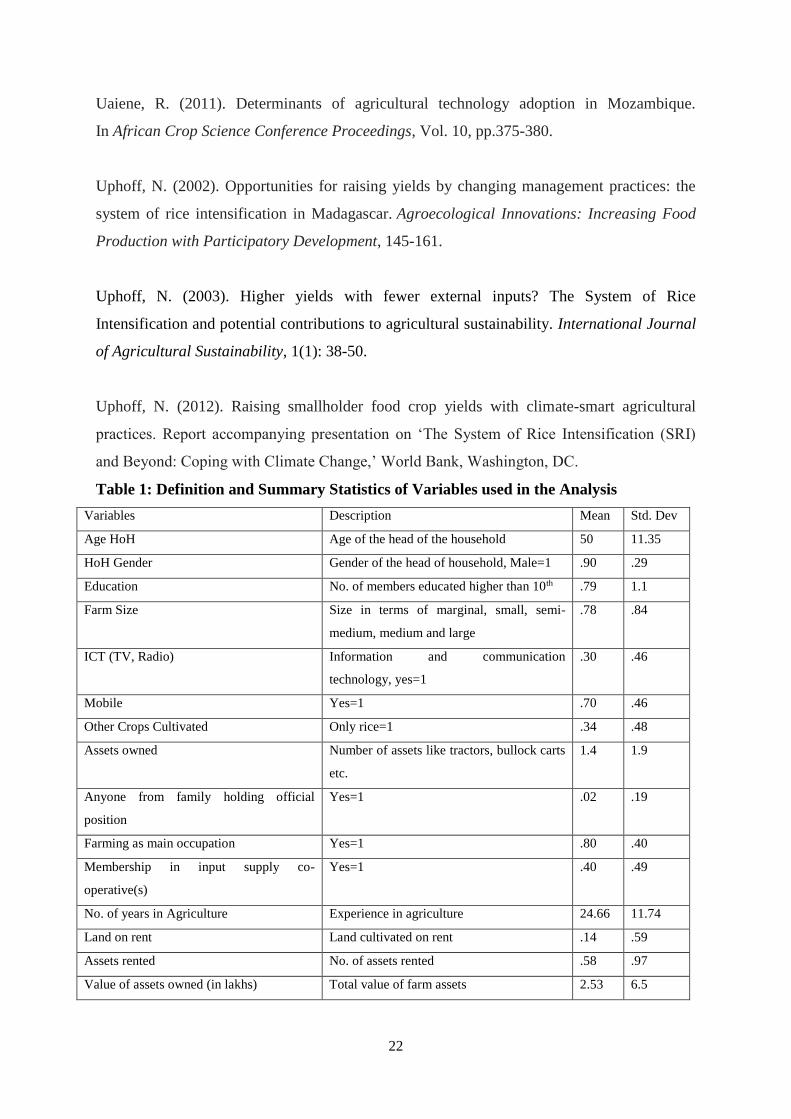
Descriptive statistics of the explanatory variables that are hypothesised to influence the
constraints as well as the adoption of SRI are presented in Table 1.
5 Although credit can be a major constraint in adoption even for a farmer with positive demand, we do not
consider credit constraint as a hurdle in our present analysis. Rather we include it as a factor deciding adoption
decision. This is due to the fact that our field-level observations did not find credit as a major constraint faced by
farmers. Rather non-adopted farmers highlighted the reasons such as lack of availability of labourers, lack of
information, irrigation etc., as the major reasons for non-adoption. This is intuitively true. Unlike other
technologies SRI do not drastically change the cost of cultivation. Similarly, access to seed is considered as an
important hurdle that need to be overcome to adopt technology in the context of improved maize or other
varieties (Shiferaw et al., 2015). This hurdle makes sense as the adoption of a new variety depends on the access
to seed. However, in our case we do not treat seed access as a hurdle as SRI is not specific to any particular rice
variety.

13
Multiple Hurdles in terms of the Intensity of Adoption (in terms of acres of land under
SRI)
The multiple hurdle model results for intensity of SRI adoption are presented in Table 2. The
information access model results showed that size of the farm increased the access to
information whereas the age of the farmer reduced the access to information. The result for
farm size is in line with existing studies on technology adoption in agriculture (Shiferaw et
al., 2015). The dummy variables for the districts showed that as compared to Chikmagalur,
the availability of information was significantly lower in districts such as Hassan, Shahdol,
and Keonjhar. Interestingly, Hassan, Shahdol and Keonjhar are the districts selected by the
Government of India to promote SRI within the National Food Security Mission. As
compared to Chikmagalur, Sidhi had better information about SRI.
Education did not play a major role in getting access to information. Nonetheless, education
was found to be important in getting access to extension services. Apart from education,
membership in input supply cooperatives, access to off-farm activities etc., were also found
to have a positive impact in getting access to extension services. Those farmers who had
farming as main occupation also had greater access to extension services indicating the
importance of the amount of time that a full-time farmer is able to devote for agriculture. As
far as dummy variables for districts are concerned, although Chikmagalur was a relatively
better informed district, the availability of extension services were higher in Hassan, Shahdol,
and Keonjhar. Therefore, better extension services were noted in those districts where SRI is
promoted under government’s food security mission.
Age, cultivation of only rice, farming as main occupation, and access to off-farm activities
were found to be significant in providing greater availability of labourers. As compared to
Chikmagalur, access to labour was significantly higher in Sidhi. Soil type, terrain type and
farming as main occupation had a positive impact on having access to irrigation. It has been
pointed out that SRI is mainly suitable for environments with high acid, iron-rich soil
availability (Dobermann, 2004). Studies in the Indian context also show the importance of
soil type in adoption of SRI (Palanisami et al., 2013). Terrain type is also very crucial to have
the type of irrigation required for SRI. Land selected for SRI should be well levelled and
should not have the problem of waterlogging. Also, when the plot is irrigated the water
should spread uniformly across the field. As compared to Chikmagalur, access to irrigation
was higher in Keonjhar.
14
Although farm size had a positive impact in accessing information, it had a negative impact
on the intensity of SRI adoption. This indicates that more small farmers adopt SRI than do
large farmers. SRI, which originated in Madagascar, was aimed at promoting rice production
among small farmers. However, as mentioned earlier, studies on SRI showed a positive
relationship between the size of the farm and adoption of SRI in terms of area in Timor Leste
(Noltze et al., 2012) whereas studies on the adoption of improved maize varieties in Zambia
showed a negative relationship between farm size and adoption (Langyintuo and Mungoma,
2008). Assets owned and rented and number of improved varieties of rice known had a
positive and significant impact on the intensity of SRI adoption. There is consensus in the
literature on technology adoption on the view that higher initial assets owned by the farmer is
expected to relax many of the constraints such as credit and, therefore, is an important factor
in making the adoption decision (Langyintuo and Mungoma, 2008).
However, the fear of poor yield is negatively related to the intensity of SRI adoption.
Aversion to risk by farmers is highlighted as one of the reasons for poor adoption of SRI
(Johnson and Vijayaraghavan, 2011). As far as the district dummies are concerned, there
have been no major differences in the intensity of adoption among the districts except for the
fact that Shahdol and Mayurbhanj had greater intensity of adoption of SRI as compared to
Chikmagalur. Interestingly, Shahdol is an NFSM district where SRI is promoted under
NFSM whereas Mayurbhanj is not. The results indicate that promotion of SRI through NFSM
is effective only in some districts and not in all districts.
Multiple Hurdles in Terms of the Depth of Adoption (in terms of number of packages)
The multiple hurdle model results for intensity of SRI adoption are presented in Table 3. The
results for the initial four hurdles were more or less the same in both the models. The only
striking difference was in the case of access to extension services by a male head of the
household in package adoption. The results show that access to extension services is better
when head of the household is a male (see Table 3).
As far as the depth of adoption of SRI is concerned, wage rates, assets of the households,
membership in farmers’ organisations, cultivation of only rice etc., had significant impact.
Interestingly, wage rates for male labourers had a positive impact whereas wage rates for
female labourers had negative impact. Majority of labourers employed in paddy cultivation in

15
the selected districts were female labourers. The weeding operations under conventional rice
cultivation have been traditionally done by women. However, as a result of SRI adoption,
rice farmers hire more and more of male labourers for mechanical weeding (Senthilkumar et
al., 2008). Therefore, the shift from manual weeding to mechanical weeding resulted in
greater demands for male labourers, leading to a positive relationship between male wage
rates and SRI adoption. This also points out the skill-intensive nature of SRI adoption and
gender-biased technical change.
The relationship between the number of years farmers are in agriculture and the SRI adoption
was negative and statistically significant. Perhaps this indicates a clear preference for SRI by
young farmers. There was a positive and significant relationship between farmers with
farming as main occupation and the intensity of adoption of SRI. Nonetheless, the result
contradicts the findings of Noltze et al. (2013) for Timor Leste. As per the study by Noltze et
al. (2013), the household head whose main occupation is farming is much less likely to adopt
SRI. The contradictory results point out the fact that the nature, intensity, and the factors
contributing to it can vary quite considerably across regions.
Assets owned and rented also had a positive impact on adoption. This finding is in line with
the existing studies (Langyintuo and Mungoma, 2008). Number of improved varieties known,
membership in input supply cooperatives, and cultivation of only rice had positive impact on
adoption. However, higher the fear of poor yields lesser was the intensity of adoption. The
result that was contrary to our expectation was the distance from main market. The results
showed that distance from main market had a positive impact on adoption of SRI. However,
the results are not counter-intuitive. We noticed that small farmers, farmers who have
farming as main occupation as well as those who are cultivating only rice were more
enthusiastic about adopting SRI. So it is obvious that farmers who are remotely located from
the market are adopting SRI as a survival strategy. Unlike other technology adoption, SRI
does not require any particular variety of seeds as it can be implemented using any rice
variety. So apart from information and extension services, SRI is not market dependent.
Therefore, this could explain why distance has a positive impact on adoption. In addition to
this, farmers with proximity to main market will have greater tendency to produce and sell
those crops, other than rice, in the market for better prices. None of the distance dummies
were significant, indicating only little difference in depth of adoption across these districts.
Conclusion
16
The article analysed the determinants of adoption of SRI in India. The study observed that
adoption of SRI in the selected districts of India is constrained by imperfect markets for
information, and access to extension services, labourers and irrigation facility. Most of the
previous studies assume that markets are perfect and thereby non-adopters of a technology
are not interested in adoption. However, the studies fail to capture the reality of farmers’ lack
of information and access to some of the factors which are crucial for adoption. Therefore,
even a farmer with positive demand for adoption may not be able to adopt owing to several
constraints. These lacunae may lead to inconsistent parameter estimates (Shiferaw et al.,
2008; Shiferaw et al., 2015). Therefore, in line with some of the recent studies (Shiferaw et
al, 2008; Shiferaw et al., 2015), the present study makes use of a multi-hurdle model. There
have not been any such attempts to analyse the multiple constraints in the context of SRI,
which is especially true for India.
The results showed that age and farm size are important in getting access to information
indicating that younger and large farmers had greater access to information. Gender of the
head of the household, education, membership in farmers’ organisations was crucial in
getting access to extension services. Age of the head of the household, cultivation of only
rice, farming as main occupation, access to off-farm activity etc., are found to be important
when it comes to the availability of labourers. Those who have farming as main occupation
and rice as main farming crop find it relatively easier to get labourers indicating the important
role of social network. Full-time farmers, especially rice farmers, might have developed a
rapport with the labourers.
District-wise analysis of constraints showed that the disparities were the highest in the case of
accessing information, followed by extension services. This highlights the important role of
extension services in wider dissemination of SRI practices.
After overcoming the hurdles of information access, access to extension services, availability
of labourers and irrigation, the final decisions relating to the number of acres and packages
will be made by the farmers. The results showed that the factors influencing the intensity (in
terms of acres of land for SRI) of SRI adoption were slightly different from the factors
influencing the depth of SRI adoption (in terms of packages). Nonetheless, the common
factors that influenced both intensity and depth were assets owned and rented, number of
improved rice varieties known, membership in input supply cooperatives, and fear of poor

17
yield. So, it is clear that financial capital such as initial wealth and social capital such as
membership in farmers’ organisations are very crucial in affecting the adoption of SRI. Wage
rates for labourers were crucial in the depth of adoption of SRI. Wage rates of woman labours
were negatively related to adoption whereas wage rate for male labourers were positively
related to adoption. This is perhaps due to the fact that the shift away from manual weeding
to mechanical weeding creates more demand for male labourers. So, the skill-intensive nature
of mechanical weeding is leading to higher demand for male labourers and thus higher
wages. It points to the possibility of a gender-biased technical change.
References
Adesina, A. A., and M. M. Zinnah (1993). Technology characteristics, farmers' perceptions
and adoption decisions: A Tobit model application in Sierra Leone. Agricultural
Economics, 9(4), 297-311.
Barrett, C. B., C. M. Moser, O. V. McHugh, and J. Barison (2004). Better Technology, Better
Plots or Better Farmers? Identifying Changes in Productivity and Risk Among Malagasy Rice
Farmers. American Journal of Agricultural Economics, 86(4), 869-889.
Cragg, J. (1971). Some Statistical Models for Limited Dependent Variables with Application
to the Demand for Durable Goods. Econometrica, 39(5), 829-844.
Croppenstedt, A., M. Demeke, and M. M. Meschi (2003). Technology adoption in the
presence of constraints: the case of fertilizer demand in Ethiopia. Review of Development
Economics, 7, 58-70.
Davis, B., P. Winters, T. Reardon, and K. Stamoulis (2009). Rural nonfarm employment and
farming: household‐level linkages. Agricultural Economics, 40(2), 119-123.
FAOSTAT (2014). Food and Agriculture Organization of the United Nations Statistics
Division, Available at: http://faostat3.fao.org/.
Feder, G. (1982). Adoption of interrelated agricultural innovations: Complementarity and the
impacts of risk, scale, and credit. American Journal of Agricultural Economics, 94-101.

18
Feder, G., R. E. Just, and D. Zilberman (1985). Adoption of agricultural innovations in
developing countries: A survey. Economic development and cultural change, 255-298.
Gujja, B., and T. M. Thiyagarajan (2013). New Hope for Indian Food Security? The System
of Rice Intensification. The gatekeeper series of the Natural Resources Group at IIED,
Available at http://pubs.iied.org/pdfs/14587IIED.pdf, Accessed on 2 November 2015.
Haldar, S., Honnaiah and G. Govindaraj (2012). System of Rice Intensification (SRI) method
of rice cultivation in West Bengal (India): An Economic analysis. Selected Poster prepared
for presentation at the International Association of Agricultural Economists (IAAE) Triennial
Conference, Foz do Iguaçu, Brazil, 18-24 August 2012, Available at
http://ageconsearch.umn.edu/bitstream/126234/2/IAAE%20conference%20paper%20on%20
SRI-uploading.pdf, Accessed on 16 November 2015.
ICRISAT, (2008). System of Rice Intensification. Available at http://www.sri-
india.net/html/aboutsri.html, Accessed on 22 October 2015.
International Food Policy Research Institute, IFPRI (2009). Millions fed: Proven successes in
agricultural development. Washington, DC: International Food Policy Research Institute
(IFPRI).
Johnson, B., and K. Vijayaragavan (2011). Diffusion of System of Rice Intensification (SRI)
Across Tamil Nadu and Andhra Pradesh in India. Indian Research Journal of Extension
Education, 11(3), 72-79.
Jones, A. (1989). A double-hurdle model of cigarette consumption. Journal of Applied
Econometrics, 4(1), 23-39.
Just, R. E., and D. Zilberman (1983). Stochastic structure, farm size and technology adoption
in developing agriculture. Oxford Economic Papers, 307-328.

19
Kassie, M., M. Jaleta, B. Shiferaw, F. Mmbando, and M. Mekuria (2013). Adoption of
interrelated sustainable agricultural practices in smallholder systems: Evidence from rural
Tanzania. Technological forecasting and social change, 80(3), 525-540.
Kassie, M., H. Teklewold, M. Jaleta, P. Marenya, and O. Erenstein (2015). Understanding the
adoption of a portfolio of sustainable intensification practices in eastern and southern
Africa. Land Use Policy, 42, 400-411.
Khandker, V., and V.P. Gandhi (2012). Introduction of New Technologies in Agriculture: A
Study of the Challenges in the Adoption of Hybrid Rice in India, paper prepared for
presentation at the 56th AARES annual conference, Fremantle, Western Australia, February
7-10, 2012, Available at
http://ageconsearch.umn.edu/bitstream/124325/2/2012AC%20Khandker%20CP.pdf,
Accessed on 1 October 2015.
Langyintuo, A. S., and C. Mungoma (2008). The effect of household wealth on the adoption
of improved maize varieties in Zambia. Food policy, 33(6), 550-559.
Mal, P., A.R. Anik, S. Bauer, and P.M. Schmitz (2012). Bt Cotton Adoption: A Double-
hurdle Approach for North Indian Farmers. AgBioForum, 15(3), 294-302.
Manda, J., A.D. Alene, C. Gardebroek, M. Kassie, and G. Tembo (2015). Adoption and
Impacts of Sustainable Agricultural Practices on Maize Yields and Incomes: Evidence from
Rural Zambia. Journal of Agricultural Economics, DOI: 10.1111/1477-9552.12127.
Mathenge, M. K., M. Smale, and D. Tschirley (2015). Off‐farm Employment and Input
Intensification among Smallholder Maize Farmers in Kenya. Journal of Agricultural
Economics, 66(2), 519-536.
Mazvimavi, K., and S. Twomlow (2009). Socioeconomic and institutional factors influencing
adoption of conservation farming by vulnerable households in Zimbabwe. Agricultural
systems, 101(1), 20-29.

20
Moser, C. M., and C. B. Barrett (2003). The disappointing adoption dynamics of a yield-
increasing, low external-input technology: the case of SRI in Madagascar. Agricultural
Systems, 76(3), 1085-1100.
Noltze, M., S. Schwarze, and M. Qaim (2012). Understanding the adoption of system
technologies in smallholder agriculture: The system of rice intensification (SRI) in Timor
Leste. Agricultural systems, 108, 64-73.
Noltze, M., S. Schwarze, and M. Qaim (2013). Impacts of natural resource management
technologies on agricultural yield and household income: The system of rice intensification in
Timor Leste. Ecological Economics, 85, 59-68.
Ogada, M. J., G. Mwabu, and D. Muchai (2014). Farm technology adoption in Kenya: a
simultaneous estimation of inorganic fertilizer and improved maize variety adoption
decisions. Agricultural and Food Economics, 2(1), 1-18.
Palanisami, K., K.R. Karunakaran, U. Amarasinghe, and C.R. Ranganathan (2013). Doing
Different Things or Doing it Differently? Rice Intensification Practices in 13 States of India.
Economic and Political Weekly, Vol. XLVIII No. 8, 51-58.
Pender, J., and B. Gebremedhin (2008). Determinants of agricultural and land management
practices and impacts on crop production and household income in the highlands of Tigray,
Ethiopia. Journal of African Economies, 17(3), 395-450.
Rahm, M. R., and W. E. Huffman (1984). The adoption of reduced tillage: the role of human
capital and other variables. American journal of agricultural economics, 66(4), 405-413.
Reddy, V.R., P.P. Reddy, M.S. Reddy, and D.S. Rama Raju (2005). Water Use Efficiency: A
Study of System of Rice Intensification (SRI) Adoption in Andhra Pradesh. Indian Journal of
Agricultural Economics, 60(3): 458-472.
Rogers, E. (2003). Diffusion of innovations, New York: Free press.

21
Roodman, D. (2009). Estimating fully observed recursive mixed-process models with
cmp, Available at http://papers.ssrn.com/sol3/papers.cfm?abstract_id=1392466
Roodman, D. (2011). Fitting fully observed recursive mixed-process models with cmp. The
Stata Journal, 11(2), 159-206.
Senthilkumar, K., P. S. Bindraban, T. M. Thiyagarajan, N. De Ridder, and K. E. Giller
(2008). Modified rice cultivation in Tamil Nadu, India: yield gains and farmers’ (lack of)
acceptance. Agricultural Systems, 98(2), 82-94.
Shiferaw, B. A., T. A. Kebede, and L. You (2008). Technology adoption under seed access
constraints and the economic impacts of improved pigeonpea varieties in
Tanzania. Agricultural Economics, 39(3), 309-323.
Shiferaw, B., T. Kebede, M. Kassie, and M. Fisher (2015). Market imperfections, access to
information and technology adoption in Uganda: challenges of overcoming multiple
constraints. Agricultural Economics, 46(4), 475-488.
Stoop, W. A., Uphoff, N., & Kassam, A. (2002). A review of agricultural research issues
raised by the system of rice intensification (SRI) from Madagascar: opportunities for
improving farming systems for resource-poor farmers. Agricultural systems, 71(3), 249-274.
Takahashi, K and C. Barrett (2014). The System of Rice Intensification and its Impacts on
Household Income and Child Schooling: Evidence from Rural Indonesia. American Journal
of Agricultural Economics, 96(1), 269-289.
Teklewold, H., M. Kassie, and B. Shiferaw (2013a). Adoption of multiple sustainable
agricultural practices in rural Ethiopia. Journal of agricultural economics, 64(3), 597-623.
Tsujimoto, Y., T. Horie, H. Randriamihary, T. Shiraiwa, and K. Homma (2009). Soil
management: The key factors for higher productivity in the fields utilizing the system of rice
intensification (SRI) in the central highland of Madagascar. Agricultural Systems, 100(1), 61-
71.
22
Uaiene, R. (2011). Determinants of agricultural technology adoption in Mozambique.
In African Crop Science Conference Proceedings, Vol. 10, pp.375-380.
Uphoff, N. (2002). Opportunities for raising yields by changing management practices: the
system of rice intensification in Madagascar. Agroecological Innovations: Increasing Food
Production with Participatory Development, 145-161.
Uphoff, N. (2003). Higher yields with fewer external inputs? The System of Rice
Intensification and potential contributions to agricultural sustainability. International Journal
of Agricultural Sustainability, 1(1): 38-50.
Uphoff, N. (2012). Raising smallholder food crop yields with climate-smart agricultural
practices. Report accompanying presentation on ‘The System of Rice Intensification (SRI)
and Beyond: Coping with Climate Change,’ World Bank, Washington, DC.
Table 1: Definition and Summary Statistics of Variables used in the Analysis
Variables Description Mean Std. Dev
Age HoH Age of the head of the household 50 11.35
HoH Gender Gender of the head of household, Male=1 .90 .29
Education No. of members educated higher than 10th .79 1.1
Farm Size Size in terms of marginal, small, semi-
medium, medium and large
.78 .84
ICT (TV, Radio) Information and communication
technology, yes=1
.30 .46
Mobile Yes=1 .70 .46
Other Crops Cultivated Only rice=1 .34 .48
Assets owned Number of assets like tractors, bullock carts
etc.
1.4 1.9
Anyone from family holding official
position
Yes=1 .02 .19
Farming as main occupation Yes=1 .80 .40
Membership in input supply co-
operative(s)
Yes=1 .40 .49
No. of years in Agriculture Experience in agriculture 24.66 11.74
Land on rent Land cultivated on rent .14 .59
Assets rented No. of assets rented .58 .97
Value of assets owned (in lakhs) Total value of farm assets 2.53 6.5

23
Distance from main market (in km) Distance from main market 11.48 10.58
Active family labourers No. of active family labourers 2.51 1.26
Access to off-farm activity Yes=1 .32 .47
Wage rate for female Wage rate in rupees 138.51 59.77
Wage rate for male Wage rate in rupees 167.51 75.50
Soil type 1. White and Black 2. Red 3. Black 4.
Sandy mix 5. Red & Black 6. Red & sandy.
3.92 1.55
Terrain type Levelled=1, step=0 .29 .45
Agricultural loan Yes=1 .40 .49
No. of improved varieties known In terms of number of rice varieties known
by farmer
.68 .83
Fear of poor yield Yes=1 .66 .47
No. of Observations: 386
Table 2: Multiple-Hurdle Model for Intensity of Adoption (no. of acres for SRI)
A. Information Coefficient Z-Statistic Marginal Effects
Age of head -.012(.007) -1.79* -.004
Male head (yes=1) -.265(.256) -1.04 -.076
Education -.099(.076) -1.30 -.028
Farm Size .203(.102) 1.99** .058
ICT (Radio, TV) (yes=1) .116(.253) .46 .033
ICT (Mobile) (yes=1) .095(.169) .56 .027
Other crops cultivated (only rice=1) .213(.165) 1.29 .061
Assets owned (numbers) -.022(.038) -0.59 -.006
Anyone holding official position
(yes=1)
-.019(.360) -0.05 -.005
Hassan -1.08(.313) -3.47*** -.312
Shahdol -1.73(.381) -4.53*** -.497
Sidhi .688(.405) 1.70* .198
Keonjhar -.899(.330) -2.72** -.258
Mayurbhanj .274(.341) 0.80 .079
Constant .971(.501) 1.94**
B. Extension services
Age of head -.005(.008) -0.64 -.001
Male head (yes=1) .413(.299) 1.38 .099

24
Education .170(.083) 2.05** .041
Farm Size .051(.112) 1.46 .012
ICT (Radio, TV) (yes=1) -.152(.272) -0.56 -.037
ICT (Mobile) (yes=1) .199(.185) 1.08 .048
Other crops cultivated (only rice=1) -.055(.182) -0.30 -.013
Assets owned (numbers) -.020(.041) -0.49 -.005
Membership in input supply
cooperatives (yes=1)
1.54(.176) 8.78 .373
Farming as main occupation .370(.209) 1.77* .089
Hassan 1.09(.336) 3.25*** .264
Shahdol 1.20(.426) 2.82** .290
Sidhi -.153(.429) -0.36 -.037
Keonjhar .800(.368) 2.17** .193
Mayurbhanj .356(.365) 0.98 .086
Constant -1.44(.556) -2.59**
C. Labourers
Age of head -.018(.007) -2.54** -..005
Male head (yes=1) -.367(.251) -1.46 .111
Education .088(.071) 1.23 .026
Active family labourers .061(.057) 1.07 .019
Other crops cultivated (only rice=1) .359(.160) 2.24** .108
Assets owned .008(.037) 0.22 .002
Assets rented .034(.086) 0.40 .011
Farming as main occupation (yes=1) .559(.266) 2.10** .169
Access to off-farm activity (yes=1) .630(.223) 2.82** .190
Wage Female -.004(.003) -1.13 -.001
Wage Male .001(.004) 0.26 .003
Hassan -.252(.323) -0.78 -.076
Shahdol .136(.468) 0.29 .041
Sidhi 1.66(.539) 3.08*** .502
Keonjhar -.633(.428) -1.48 -.191
Mayurbhanj .083(.441) 0.19 .025
Constant .553(.780) 0.71
D. Irrigation
Age of head -.003(.008) -0.41 -.001

25
Male head (yes=1) -.373(.242) 1.54 .132
Education .022(.068) 0.32 .008
Active family labourers .004(.055) 0.07 .001
No. of years in agriculture -.008(.007) -1.16 -.003
Farm Size .090(.104) 0.86 .032
Rented land (in acres) -.034(.115) -0.30 -.012
Soil type .190(.051) 3.67*** .067
Terrain type .710(.207) 3.42*** .251
Other crops cultivated (only rice=1) -.116(.157) -0.74 -.041
Value of assets in lakhs .0004(.012) 0.04 .000
Farming main occupation (yes=1) .314(.184) 1.70* .111
Agricultural loan (yes=1) .03(.156) 0.47 .026
Hassan -.384(.308) -1.25 -.136
Shahdol .226(.296) 0.76 .080
Sidhi .231(.323) 0.72 .082
Keonjhar .489(.283) 1.73* .173
Mayurbhanj .078(.284) 0.27 .028
Constant -1.13(.476) -2.37**
E. Intensity of SRI adoption
Age of head -.002(.001) -1.50 -.001
Male head (yes=1) .015(.026) 0.58 .006
Education .007(.011) 0.62 .003
Farm size -.057(.016) -3.71*** -.023
No. of years in agriculture -.0003(.001) -0.27 -.000
Rented land (in acres) 0007(.018) 0.37 .003
Terrain type .036(.030) 1.19 .014
Wage Female -.0004(.0006) -0.69 -.000
Wage Male .0002(0005) 0.43 .000
Assets owned .010(.005) 1.87* .004
Assets rented .029(.013) 2.23** .012
Farming as main occupation (yes=1) .028(.027) 1.05 .011
No. of improved varieties known .042(.016) 2.64** .017
Other crops cultivated (only rice=1) -.018(.023) -0.77 -.007
Membership in input supply
cooperatives
.072(.024) 2.99*** .028

26
Distance from main market .001(.001) 0.93 .000
Fear of poor yield -.045(.023) -1.93** -.017
Hassan -.019(.050) -0.39 -.008
Shahdol .130(.072) 1.80* .051
Sidhi .089(.074) 1.19 .035
Keonjhar .105(.066) 1.59 .041
Mayurbhanj .122(.070) 1.74* .048
Constant .112(.109) 1.02
No. of observations 386 LR chi2(85) 507.49
Log Likelihood -695.7997 Prob>Chi2 0.000
Note: *, **, and *** indicate significance levels at 10%, 5%, and 1% level respectively. Standard errors are in
parenthesis.
Table 3: Multiple Hurdle Model for Depth of Adoption (SRI Packages)
A. Information Coefficient Z-Statistic Marginal Effects
Age of head -.013(.007) -1.81* -.004
Male head (yes=1) -.275(.254) 1.08 -.079
Education -.100(.076) -1.31 -.029
Farm Size .208(.102) 2.04** .060
ICT (Radio, TV) (yes=1) .120(.254) 0.47 .034
ICT (Mobile) (yes=1) .079(.169) 0.47 .023
Other crops cultivated (only
rice=1)
.216(.165) 1.31 .062
Assets owned (numbers) -.022(.038) -0.58 -.006
Anyone holding official position
(yes=1)
-.029(.359) -0.08 -.008
Hassan -1.08(.314) -3.44*** -.310
Shahdol -1.73(.382) -4.55*** -.498
Sidhi .696(.404) 1.72* .200
Keonjhar -.888(.330) -2.69** -.255
Mayurbhanj .277(.340) 0.82 .080
Constant .973(.500) 1.94**
B. Extension services
Age of head -.004(.008) -0.46 -.001
Male head (yes=1) .503(.299) 1.68* .121

27
Education .152(.086) 1.86* .037
Farm Size .050(.112) 0.45 .012
ICT (Radio, TV) (yes=1) -.202(.267) -0.76 -.049
ICT (Mobile) (yes=1) .230(.184) 1.25 .055
Other crops cultivated (only
rice=1)
-.063(.182) -0.35 -.015
Assets owned (numbers) -.020(.042) -0.49 -.005
Membership in input supply
cooperatives (yes=1)
1.56(.176) 8.80*** .374
Farming as main occupation .373(.209) 1.79* .090
Hassan 1.11(.334) 3.32*** .267
Shahdol 1.14(.424) 2.70** .275
Sidhi -.232(.426) -0.55 -.056
Keonjhar .734(.365) 2.01** .176
Mayurbhanj .337(.361) 0.93 .081
Constant -1.45(.552) -2.64**
C. Labourers
Age of head -.017(.007) -2.45** -.005
Male head (yes=1) -.284(.250) -1.13 .086
Education .085(.071) 1.20 .026
Active family labourers .063(.058) 1.10 .019
Other crops cultivated (only
rice=1)
.355(.160) 2.22** .108
Assets owned .008(.037) 0.22 .002
Assets rented .037(.087) 0.43 .011
Farming as main occupation
(yes=1)
.540(.267) 2.02** .164
Access to off-farm activity
(yes=1)
.620(.224) 2.77** .188
Wage Female .001(.004) 0.34 .000
Wage Male -.004(.004) -1.21 -.001
Hassan -.239(.321) -0.74 -.072
Shahdol .136(.469) 0.29 .041

28
Sidhi 1.64(.541) 3.05*** .500
Keonjhar -.626(.428) -1.46 -.190
Mayurbhanj .101(.441) 0.23 .031
Constant .529(.777) 0.68
D. Irrigation
Age of head -.002(.008) -0.32 -.001
Male head (yes=1) -.326(.241) -1.35 .116
Education .019(.068) 0.27 .007
Active family labourers -.001(.055) -0.02 -.000
No. of years in agriculture -.008(.007) -1.22 -.003
Farm Size .090(.104) 0.86 .032
Rented land (in acres) -.034(.115) -0.30 -.012
Soil type .185(.052) 3.58*** .066
Terrain type .714(.207) 3.44*** .253
Other crops cultivated (only
rice=1)
-.113(.156) -0.72 -.040
Value of assets in lakhs -.001(.011) -0.05 -.000
Farming as main occupation
(yes=1)
.319(.184) 1.74* .113
Agricultural loan (yes=1) .070(.156) 0.44 .025
Hassan -.377(.309) -1.22 -.134
Shahdol .223(.296) 0.75 .079
Sidhi .225(.324) 0.70 .080
Keonjhar .494(.283) 1.75* .175
Mayurbhanj .086(.285) 0.30 .031
Constant -1.12(.477) -2.34**
E. Depth of SRI Adoption
Age of head -.005(.007) -0.76 -.001
Male head (yes=1) -.017(.159) 0.11 -.003
Education .006(.067) 0.10 .001
Farm size -.010(.096) -0.11 -.002
No. of years in agriculture -.015(.006) -2.48** -.003

29
Rented land (in acres) .080(.112) 0.71 .016
Terrain type -.010(.185) -0.05 -.002
Wage Female -.008(.003) -2.26** -.001
Wage Male .006(.003) 2.03** .001
Assets owned .171(.033) 5.08*** .034
Assets rented .206(.081) 2.55** .042
Farming as main occupation
(yes=1)
.552(.169) 3.26*** .111
No. of improved varieties known .196(.099) 1.99** .040
Other crops cultivated (only
rice=1)
-.255(.146) -1.75* -.051
Membership in input supply
cooperatives
.472(.147) 3.21*** .095
Distance from main market .013(.006) 2.11** .003
Fear of poor yield -.266(.140) -1.89** -.054
Hassan -.252(.314) -0.80 -.051
Shahdol .151(.446) 0.34 .030
Sidhi -.001(.459) -0.00 -.000
Keonjhar -.133(.408) -0.32 -.027
Mayurbhanj -.050(.431) -0.12 -.010
Constant .907(.673) 1.35
No. of observations 386 LR chi2(85) 544.90
Log Likelihood -1392.70 Prob>Chi2 0.0000
Note: *, **, and *** indicate significance levels at 10%, 5%, and 1% level respectively. Standard errors are in
parenthesis.