POLYUNSATURATED FATTY ACIDSir.cftri.com/9949/1/Mamatha_S_S_Thesis_Final.pdfI express my deep sense...
326
1 POLYUNSATURATED FATTY ACIDS (PUFAs) OF MUCOR SP. WITH SPECIAL REFERENCE TO GAMMA LINOLENIC ACID (GLA) THESIS Submitted to the UNIVERSITY OF MYSORE For the award of Degree of Doctor of Philosophy In MICROBIOLOGY By Mamatha S.S., M.Sc. Food Microbiology Department Central Food Technological Research Institute Mysore-570020 Guide Dr. G. Venkateswaran Scientist (F) Food Microbiology Department Central Food Technological Research Institute Mysore-570020 November- 2009 PDF created with pdfFactory Pro trial version www.pdffactory.com
Transcript of POLYUNSATURATED FATTY ACIDSir.cftri.com/9949/1/Mamatha_S_S_Thesis_Final.pdfI express my deep sense...

1
POLYUNSATURATED FATTY ACIDS (PUFAs) OF MUCOR SP. WITH SPECIAL REFERENCE TO GAMMA LINOLENIC
ACID (GLA)
THESIS
Submitted to the UNIVERSITY OF MYSORE
For the award of Degree of Doctor of Philosophy
In MICROBIOLOGY
By
Mamatha S.S., M.Sc. Food Microbiology Department
Central Food Technological Research Institute Mysore-570020
Guide
Dr. G. Venkateswaran Scientist (F)
Food Microbiology Department Central Food Technological Research Institute
Mysore-570020
November- 2009
PDF created with pdfFactory Pro trial version www.pdffactory.com

2
Dedicated To
My Parents and my teachers
PDF created with pdfFactory Pro trial version www.pdffactory.com

3
ACKNOWLEDGEMENT
My mentor and guide, I would extend my heartfelt gratitude to Dr. G. Venkateswaran,
Scientist &Deputy Director, Food Microbiology Department, CFTRI, Mysore-20 for his
constant, invaluable and meticulous guidance, keen interest and for enabling me to grow with
the freedom of thoughts and expression throughout my tenure.
My sincere thanks goes to Dr. V. Prakash, Director, CFTRI, Mysore for permitting me to
work for my Ph.D programme at Food Microbiology Department, CFTRI, Mysore.
I am immensely thankful to Dr. S. Umesh Kumar, Deputy Director & Head, Food
Microbiology Department, CFTRI, Mysore for his constant support and encouragement
throughout the course.
I am grateful to University of Mysore, RGNF (UGC) and CSIR, New Delhi for
providing me the research fellowships which rendered me to carry out this work very
successfully.
I am thankful to Prof. S. Shankar Bhat, Prof, K.A Raveesha, Prof, G.A. Shivamurthy,
the then Chairmen, Department of studies in Botany/Microbiology, Manasagangotri, Mysore
Dr. Ravishankar Rai, Chairman, Department of Microbiology and all administrative staff for
their kind help and co-operation that helped me in getting my financial aid from the University
of Mysore.
I immensely thank Dr. M.C. Varadaraj, Head, HR Dept. for his kind help during my
tenure.
I am immensely thankful to Dr. Praksh M Halami, for guidance to carry Molecular
work in his lab and all his kind helpful suggestions, constructive criticism and constant
support through out my tenure.
I thank all the staff of Central Instrumentation Facilities & Services for helping me in
carrying out all analyses related to fatty acid profile studies and others.
My sincere thanks also goes to Dr.S.P. MuthuKumar, Scientist, Biochemistry and
Nutrition, (Animal house facility), CFTRI, Mysore, for his assistance in carryout animal
experiments.
My sincere thanks also goes to Mr. Ravi R, Sensory Science CFTRI, Mysore for his
assistance in statistical analysis.
PDF created with pdfFactory Pro trial version www.pdffactory.com

4
I would like to extend my thanks to all the scientific & non- scientific staff of Food
Microbiology Department, CFTRI, Mysore for extending their helping hand in one or the other
way which helped me a lot in completing my Ph.D work successfully.
I thank Dr. (Mrs). Girija Bai R for her help in statistical analyses, useful suggestions
on various aspects and constant support pertaining to my research works.
I extend my sincere thanks to the staff of CFTRI, Library for their help. My sincere
thanks goes to Mr. L. Jesuraj and My aunt Mrs. Kamakshi A.R., and staff of Electrical &
Mechanical Maintenance and all the departments for their constant help.
My heartfelt thanks goes to all my friends, Dr. (Mrs.) Gunashree, B.S., , Ms. A. Nisha,
Mrs. H.P. Mohana Kumari, Dr.(Ms.) P. Shobha Rani, Ms. M. Snigdha, Ms. D.V.
Prathibha, Mrs. Divyashree, Mrs UshaRani, Dr. (Mrs) Jayalakshmi K,
Mrs. Manjulatha, Mr. T. V. Logaraj, Mr. Badrinath V, Mr. Raghavendra P.,
Mr. Suryachandra rao, Dr. Kumaresan, Mr. Anbarasu, Mr. Deepak, Mr. Devaraju and for
all others who created a healthy and joyful environment for me to complete my Ph.D work with
a great success.
My special thanks are due to Mr. Khayoum,PS, and Mr. Gurusiddaiah, Food
Microbiology Department for their encouragement, support and various help during my
tenure
I extend my heartful thanks to Mr. Somanayak, S., for his constant support and
encouragement through my tenure.
I express my deep sense gratitude to Sri Pathanjali Yoga Shikshana Samithi and its
instructors for providing a good health fit during my tenure.
I extend my sincere thanks to all my aunts, uncles and cousins, for their constant
support and encouragement through my Ph.D. tenure.
I extend my heartful thanks to our house owner family for their constant support and
encouragement through my stay and Mr. Krishna, I-café Browsing centre, Saraswathipuram,
Mysore, for their help to complete this thesis.
Last but not the least my sincere gratitude also goes to my Grand-Parents, Parents,
Brother AnanthaRamu S.S., Sisters, Brother in law, Sister in law and two kids for the fun,
criticism, their constant encouragement and boosting up confidence in me.
Mamatha S.S.
PDF created with pdfFactory Pro trial version www.pdffactory.com

5
CERTIFICATE
I, Mamatha S.S., certify that this thesis is the result of the research work done by
me under the supervision of Dr. G. Venkateswaran, Scientist-F at Food
Microbiology Department, Central Food Technological Research Institute
(CFTRI), Mysore-20. I am submitting this thesis for possible award of Doctor of
Philosophy (Ph.D.) degree in Microbiology of the University of Mysore.
I further certify that this thesis has not been submitted by me for award of any
other degree/diploma of this or any other University.
Signature of Doctoral candidate
Signed me on
Signature of Guide Counter signed by
Date: Date:
Signature of Chairperson/Head of Department/ Institution with name and official seal.
PDF created with pdfFactory Pro trial version www.pdffactory.com

6
TABLE OF CONTENTS
CHAPTER 1.
INTRODUCTION 1-5
SCOPE OF THE INVESTIGATION 5-6
CHAPTER 2.
REVIEW OF LITERATURE 7-98
LIPID AND FATTY ACIDS 7-11
ESSENTIAL FATTY ACIDS 12-14
Major Functions of EFAs 14
POLYUNSATURATED FATTY ACIDS (PUFAs) 14-19
Sources of PUFA 16-18
Application of PUFAs 19
GAMMA LINOLENIC ACID (GLA 18:3 omega 6) 20-49
Sources of GLA 21-23
Screening for the best GLA producing fungus 23-25
Potential Sources of GLA 26
Mucor species 26-28
Mucor spp. in GLA production 28-29
GLA biosynthesis and ∆6 -desaturase 29-33
Functions of GLA in Human 33-49
Mechanism of GLA action in human 33-34
Nutritional uses of GLA 35-37
Medical uses of GLA 37-49
OLEAGINOUS MICROORGANISMS AND SINGLE CELL OIL 50-61 Pattern of lipid synthesis in oleaginous microorganism 52-53
Biochemistry of oil-accumulation in oleaginous microorganisms 53-56
Biosynthesis of PUFAs in fungi 57-59
Advantages of Microbes as SCO source 60
Disadvantages of Fish and Plant oils 61
PDF created with pdfFactory Pro trial version www.pdffactory.com

7
INFLUENCE OF PHYSIOLOGICAL ASPECTS ON LIPID AND PUFAs
PRODUCTION 61-73
pH (in the culture medium) 62-63
Growth temperature 63-65
Shaking speed and dissolved oxygen levels 65-66
Carbon sources 66-68
Nitrogen sources 68-70
C:N ratio 70-71
Minerals supplements 71-72
Supplements on lipid and PUFA production 72-73
FERMENTATION 74-76
Solid-state fermentation for PUFA production 74-75
Submerged fermentation for PUFA production 75-76
METHODS OF LIPID EXTRACTION 77-81
Cell disintegration/ Disruption techniques 78-79
Mechanical methods 78
Biological methods 79
Chemical methods 79
Extraction with organic solvents 79-80
Extraction with supercritical fluid extraction (SCF) 80-81
Purification of PUFAs 81
STRAIN IMPROVEMENT IN OLEAGINOUS MICROORGANISMS
82-94
Mutation Techniques 83-84
Application of mutation for modification of fatty acids in microbes
83-84
Hybridization Studies 84-90
Protoplast isolation 85-86
Osmotic stabilizer 86-87
Methods of protoplast fusion 87-88
PDF created with pdfFactory Pro trial version www.pdffactory.com
8
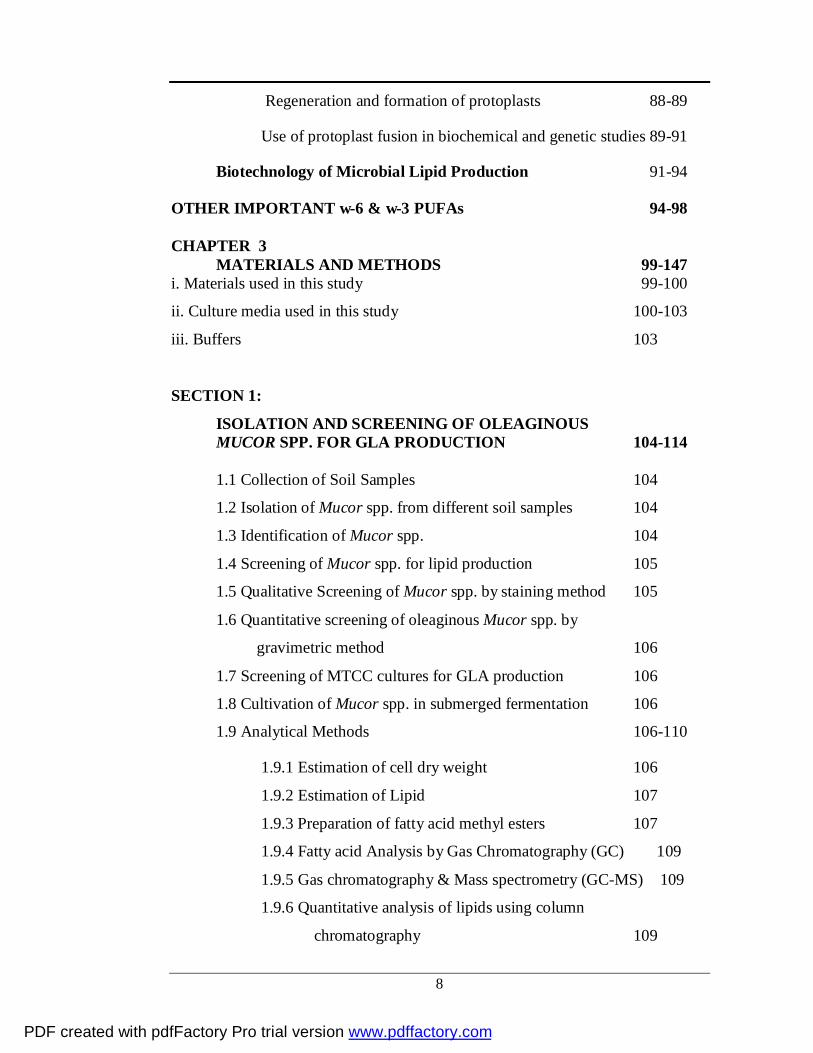
Regeneration and formation of protoplasts 88-89
Use of protoplast fusion in biochemical and genetic studies 89-91
Biotechnology of Microbial Lipid Production 91-94
OTHER IMPORTANT ω-6 & ω-3 PUFAs 94-98 CHAPTER 3
MATERIALS AND METHODS 99-147 i. Materials used in this study 99-100
ii. Culture media used in this study 100-103
iii. Buffers 103
SECTION 1:
ISOLATION AND SCREENING OF OLEAGINOUS MUCOR SPP. FOR GLA PRODUCTION 104-114
1.1 Collection of Soil Samples 104
1.2 Isolation of Mucor spp. from different soil samples 104
1.3 Identification of Mucor spp. 104
1.4 Screening of Mucor spp. for lipid production 105
1.5 Qualitative Screening of Mucor spp. by staining method 105
1.6 Quantitative screening of oleaginous Mucor spp. by
gravimetric method 106
1.7 Screening of MTCC cultures for GLA production 106
1.8 Cultivation of Mucor spp. in submerged fermentation 106
1.9 Analytical Methods 106-110
1.9.1 Estimation of cell dry weight 106
1.9.2 Estimation of Lipid 107
1.9.3 Preparation of fatty acid methyl esters 107
1.9.4 Fatty acid Analysis by Gas Chromatography (GC) 109
1.9.5 Gas chromatography & Mass spectrometry (GC-MS) 109
1.9.6 Quantitative analysis of lipids using column
chromatography 109
PDF created with pdfFactory Pro trial version www.pdffactory.com

9
1.9.7 Qualitative method of lipids using thin layer
chromatography 110
1.9.8 Analysis of residual sugar in the medium 110
1.10 Solid- State Fermentation (SSF) 110-111
1.10.1 Media preparation
1.10.2 Inoculum preparation
1.10.3 Determination of moisture content in the Fermented bran
1.10.4 Extraction of Lipid
1.11 Statistical analysis 111
SECTION 2:
MOLECULAR CHARACTERIZATION OF MUCOR Sp. CFR-G15 PRODUCING GLA 112-124
2.1Genomic DNA extraction 112-114
2.1.1 Method 1
2.1.2 Method 2
2.2 Analysis of DNA 114
2.3 Polymerase chain Reaction (PCR) 115-118
2.3.1 The PCR Reaction
2.3.2 Purification of PCR product
2.3.3 A-tailing of PCR product
2.3.4 Ligation/cloning of purified PCR product to pTZ57r/T
vector using Ins T/A clone PCR product cloning kit
2.4 Competent cell preparation and transformation 118-121
2.4.1 Preparation of E. coli DH5 α competent cells by
DMSO-PEG method
2.4.2 Transformation of E. coli DH5 α
2.4.3 Selection of transformants/recombinants
2.5 Analysis of transformants/recombinants 121-123
2.5.1 Isolation of recombinants plasmid
2.5.2 Restriction digestion of plasmid DNA
PDF created with pdfFactory Pro trial version www.pdffactory.com

10
2.6 Nucleotide sequence analysis 124
2.7 Phylogenetic analysis 124
SECTION 3:
OPTIMIZATION OF CULTURAL CONDITIONS FOR BIOMASS, LIPID AND GAMMA LINOLEIC ACID (GLA) CONTENT OF MUCOR ROUXII CFR-G15 125-133
3.1 Fungal strain 125
3.2 Cultural condition 125
3.3 Media optimization 125
3.4 Physical Parameters 126
3.4.1 pH optimization 126
3.4.2 Temperature optimization 126
3.4.3 Aeration optimization 126
3.4.4 Inoculum size optimization 126
3.5 Chemical Parameters 127-128
3.5.1 Optimization of different carbon source 127
3.5.2 Optimization of different nitrogen source 127
3.5.3 C:N ratio optimization 127
3.5.4 Metal ion supplementation 128
3.5.5 Plant Oil supplementation to medium 128
3.6 Medium optimization by RSM method 128-131
3.6.1 Experimental design
3.6.2 RSM optimization
3.7 Analytical Methods 132
3.8 Selection of lipid extraction methods with solvent systems 132-133
3.8.1 Folch method
3.8.2 Bligh and Dyer method
3.8.3 Soxhlet method
3.9 Statistical Analysis 133
PDF created with pdfFactory Pro trial version www.pdffactory.com

11
SECTION 4:
GENETIC STUDIES ON M. ROUXII CFR-G15 WITH SPECIAL EMPHASIS ON GLA PRODUCTION 134-147 4.1 Strains used 134
4.2 Reagents for protoplast fusion experiments 134
4.3 Mutation
4.3.1 Mutagenesis by Ultraviolet radiation (UV) 135
4.3.2 Mutagenesis by Ethyl Methane Sulphonate (EMS) 136
4.3.3 Mutagenesis by N-methyl N’-nitro N-nitrosoguanidine
(NTG) 136
4.3.4 Characterization of putative mutants for Biomass,
lipid and GLA production 137
4.3.5 Screening of auxotrophic mutants 137
4.4 Protoplast fusion techniques 138
4.4.1 Harvesting the fungal mycelium for protoplasting 138
4.4.2 Protoplast formation 138
4.4.3 Regeneration of protoplasts 142
4.4.4 Protoplast fusion 142
4.4.5 Selection of putative hybrids 143
4.4.6 Characterization of putative hybrids 143
4.4.7 Protein estimation of hybrids 143
4.4.8 Total sugar estimation of hybrids 146
4.5 Statistical Analysis 147
CHAPTER 4.
RESULTS AND DISCUSSION 148-269
SUMMARY AND CONCLUSION 270-276 BIBLIOGRAPHY 277-299
PDF created with pdfFactory Pro trial version www.pdffactory.com
12
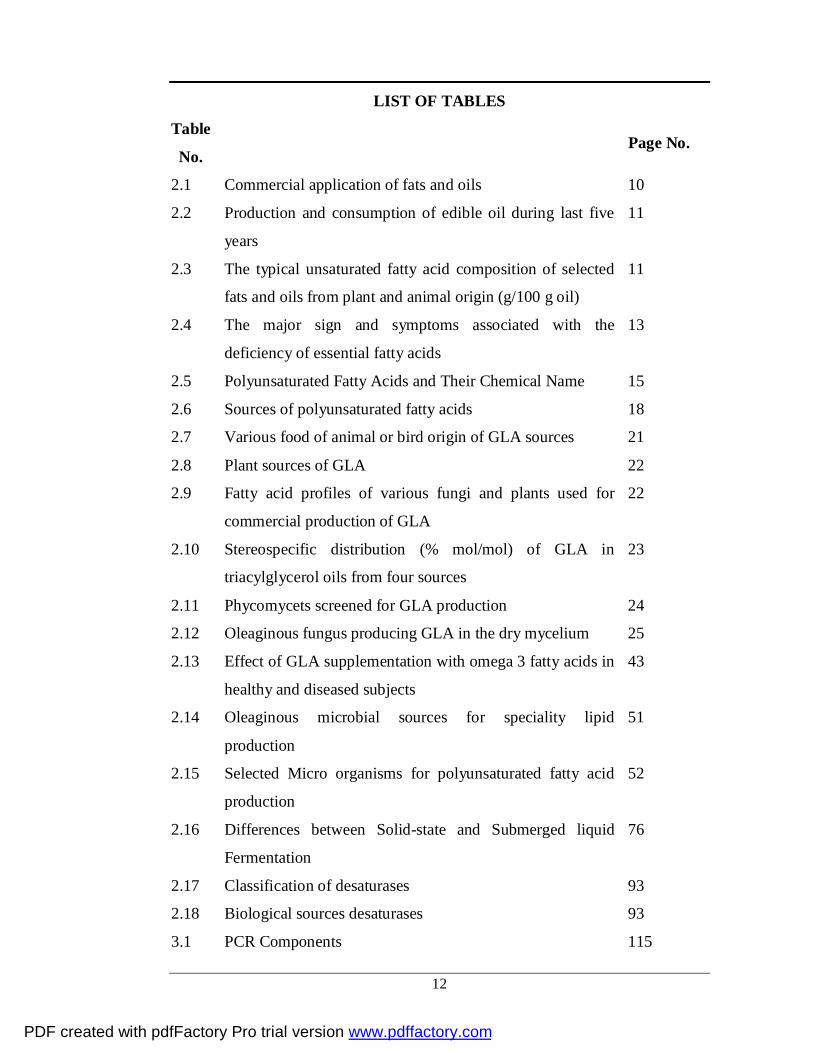
LIST OF TABLES
Table
No. Page No.
2.1 Commercial application of fats and oils 10
2.2 Production and consumption of edible oil during last five
years
11
2.3 The typical unsaturated fatty acid composition of selected
fats and oils from plant and animal origin (g/100 g oil)
11
2.4 The major sign and symptoms associated with the
deficiency of essential fatty acids
13
2.5 Polyunsaturated Fatty Acids and Their Chemical Name 15
2.6 Sources of polyunsaturated fatty acids 18
2.7 Various food of animal or bird origin of GLA sources 21
2.8 Plant sources of GLA 22
2.9 Fatty acid profiles of various fungi and plants used for
commercial production of GLA
22
2.10 Stereospecific distribution (% mol/mol) of GLA in
triacylglycerol oils from four sources
23
2.11 Phycomycets screened for GLA production 24
2.12 Oleaginous fungus producing GLA in the dry mycelium 25
2.13 Effect of GLA supplementation with omega 3 fatty acids in
healthy and diseased subjects
43
2.14 Oleaginous microbial sources for speciality lipid
production
51
2.15 Selected Micro organisms for polyunsaturated fatty acid
production
52
2.16 Differences between Solid-state and Submerged liquid
Fermentation
76
2.17 Classification of desaturases 93
2.18 Biological sources desaturases 93
3.1 PCR Components 115
PDF created with pdfFactory Pro trial version www.pdffactory.com

13
3.2 PCR primers used in this study 116
3.3 Boundaries of experimental domain and spacing of levels
expressed in coded and natural units
129
3.4 Design of experiments: Central composite design of
variables
130
4.1 Biomass, lipid and GLA content in the mycelium of
selected Mucor isolates
151
4.2 Fatty acid composition of isolates of Mucor isolates 153
4.3a Dry weight, lipid accumulation and GLA content in total
fatty acids of lipid produced by Mucor sp. CFR-G15
cultivated on solid state substrate.
162
4.4 Lipid composition of Mucor sp. CFR-G15 166
4.5 Fatty acid profile of M. rouxii CFR-G15 in different media 184
4.6 Effect of pH on fatty acid profile of M. rouxii CFR-G15 189
4.7 Effect of incubation temperature on Biomass, Lipid and
GLA production of M. rouxii CFR-G15 on 6th day of
cultivation.
192
4.8 Effect of aeration on fatty acid profile of M. rouxii
CFR-G15
199
4.9 Influence of inoculum size on fatty acid profile of
M. rouxii CFR-G15
203
4.10 Effect of different carbon source on fatty acid profile in
M. rouxii CFR-G15
207
4.11 Effect of initial glucose concentration on fatty acid profile
in M. rouxii CFR-G15
210
4.12 Effect of different nitrogen sources on fatty acid profile
of M. rouxii CFR-G15
215
4.13 Optimization of C:N ratio on fatty acid profile of M. rouxii
CFR-G15
219
4.14 Fatty Acid profile of the M. rouxii CFR-G15 with or
without plant oils
229
PDF created with pdfFactory Pro trial version www.pdffactory.com
14
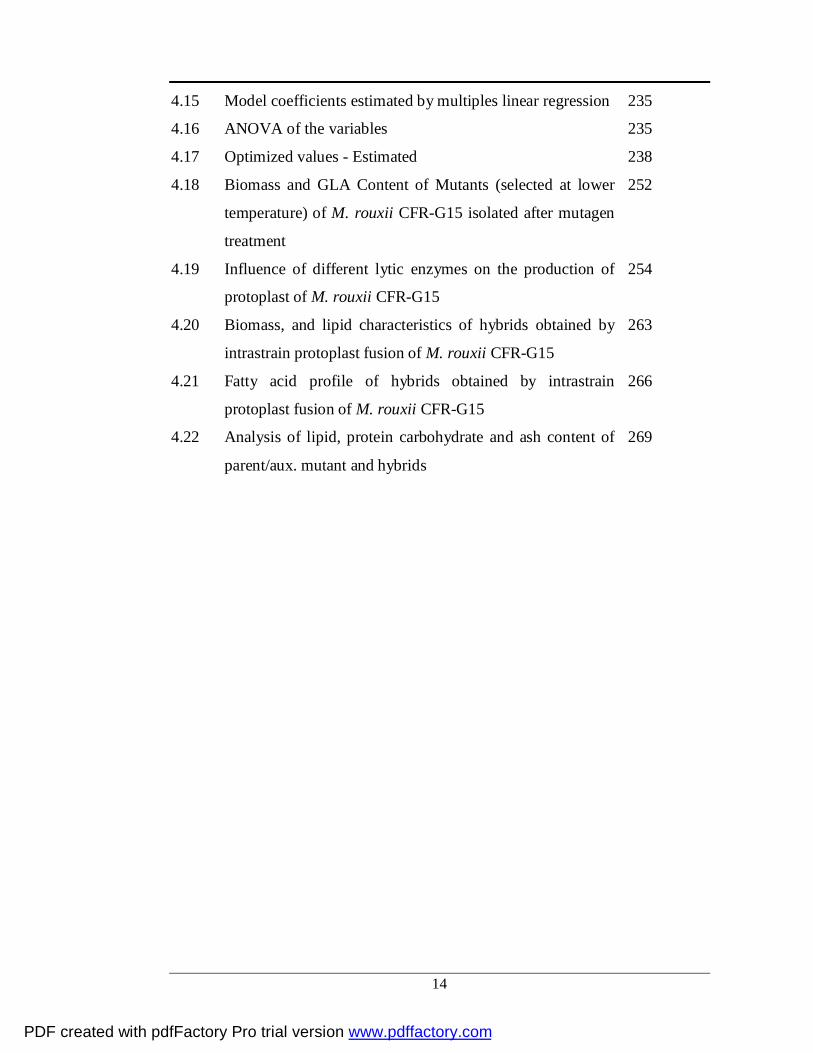
4.15 Model coefficients estimated by multiples linear regression 235
4.16 ANOVA of the variables 235
4.17 Optimized values - Estimated 238
4.18 Biomass and GLA Content of Mutants (selected at lower
temperature) of M. rouxii CFR-G15 isolated after mutagen
treatment
252
4.19 Influence of different lytic enzymes on the production of
protoplast of M. rouxii CFR-G15
254
4.20 Biomass, and lipid characteristics of hybrids obtained by
intrastrain protoplast fusion of M. rouxii CFR-G15
263
4.21 Fatty acid profile of hybrids obtained by intrastrain
protoplast fusion of M. rouxii CFR-G15
266
4.22 Analysis of lipid, protein carbohydrate and ash content of
parent/aux. mutant and hybrids
269
PDF created with pdfFactory Pro trial version www.pdffactory.com

15
LIST OF FIGURES
Fig
No.
Page
no.
2.1 The structure of triacylglycerol 7
2.2 The general structure of fatty acids 8
2.3 Classification of Fats (lipids) 8
2.4 ω-3 and ω-6 fatty acids. (PUFA-polyunsaturated fatty acid). 12
2.5 Structure and metabolism of ω-3 and ω-6 PUFAs 16
2.6 Structure of Gamma linolenic acid (GLA) 20
2.7 Activity of ∆6 desaturase on linoleic acid 30
2.8 Omega-6 pathway and inhibitors of GLA synthesis 31
2.9 Production of eicosanoids from PUFAs 34
2.10 Scheme of single cell oil process 51
2.11 Scheme showing how the proposed citrate/malate cycle and the
cytosolic ‘transhydrogenase’ cycle
56
2.12 Schematic representation of Lipid accumulation in oleaginous
microorganisms
56
2.13 Biosynthesis of PUFAs in eukaryotes (Fungi) 59
2.14 Strategy for the Modification of microbial PUFA 82
3.1 General schematic representation of protoplast formation,
fusion and regeneration
140
3.2 Apparatus used for protoplast harvesting 141
4.1 Fungal mycelia on PDA plate a. Mucor rouxii MTTC-386; b.
Mucor sp. CFR-G15 isolate
149
4.2 Photomicrograph of Mucor sp. CFR-G15
a. Mycelia with sporangiospores and lipid globules
b. Mycelia Stained with Sudan Black B (Box indicates
lipid globules stained in dark color)
149
4.3 Isolates of Mucor species on PDA slants 150
4.4 Chromatogram showing a. GLA standard b. M. rouxii CFR-15 154
PDF created with pdfFactory Pro trial version www.pdffactory.com

16
showing fatty acid profile with GLA
4.5 Mass chromatogram of GLA a. Standard; b. M. rouxii CFR-
G15
154
4.6 Submerged fermentation a. Non-fermented broth (FPM); b.
Mucor sp. CFR-G15 in submerged fermentation (SmF)
c. Dry biomass of Mucor sp. CFR-G15
158
4.7 a. Growth Characteristic of Mucor sp. CFR-G15 during 10
days of cultivation
b. Fatty acid profile of Mucor sp. CFR-G15 during 10 days of
cultivation.
159
4.8 Solid state fermentation
a. Non-fermented wheat bran
b. Fermented moldy bran of Mucor sp. CFR-G15
160
4.9 Lipid and Fatty acid profile of Mucor sp. CFR-G15 during 10
days cultivation on solid state fermentation
163
4.10 Multiple sequence alignment sequence
a. 18S rRNA b. 6 ∆6 DES gene
168
4.11 a. Gel analysis of genomic DNA from Mucro rouxii CFR-G15
b. Restriction digestion
169
4.12 a. PCR amplification of 18S rRNA and ∆6 DES gene of
b. M. rouxii CFR-G15.
172
4.13 Analysis of Recombinants
a. Plasmid isolation
b. Restriction digestion of plasmid
c. PCR amplification of ∆6 DES gene in recombinants
174
4.14 Phylogenetic analysis of 18S rRNA taxonomy 177
4.15 Phylogenetic analysis of ∆6 DES gene diversity between the
GLA producers
178
4.16 Effect of different media on biomass, lipid and residual sugar
in M. rouxii CFR-G15
182
PDF created with pdfFactory Pro trial version www.pdffactory.com

17
4.17 Effect of initial pH on biomass, lipid and reducing sugar in
M. rouxii CFR-G15
187
4.18 Effect of incubation temperature on biomass and lipid
production by M. rouxii CFR-G15.
191
4.19 Effect of incubation temperature on Fatty Acid Profiles of
M. rouxii CFR-G15.
192
4.20 Effect of growth temperature and addition of glucose on
biomass, lipid and GLA production by M. rouxii CFR-G15
195
4.21 Effect of aeration on biomass, lipid and residual sugar in
M. rouxii CFR-G15
197
4.22 Effect of inoculum size on biomass, lipid and residual sugar in
M. rouxii CFR-G15
201
4.23 Effect of different carbon sources on biomass and lipid
production in M. rouxii CFR-G15
205
4.24 Effect of initial concentration of glucose on biomass, lipid in
M. rouxii CFR-G15
209
4.25 Effect of different nitrogen sources on biomass, lipid and
residual sugar of M. rouxii CFR-G15
212
4.26 Optimization of C:N ratio on biomass, lipid and reducing sugar
of M. rouxii CFR-G15
217
4.27 Effect of different Minerals on biomass production in
M. rouxii CFR-G15
221
4.28 Effect of different Minerals on Total Lipid Content of
M. rouxii CFR-G15
223
4.29 Effect of different Minerals on GLA content in
M. rouxii CFR-G15
224
4.30 Effect of different plant oils on biomass, lipid production in
M. rouxii CFR-G15
227
4.31 Effect of Different Concentration of Niger seed oil on
a. biomass and total lipid production in M. rouxii CFR-G15.
b. Fatty acid composition in M. rouxii CFR-G15
231
PDF created with pdfFactory Pro trial version www.pdffactory.com
18
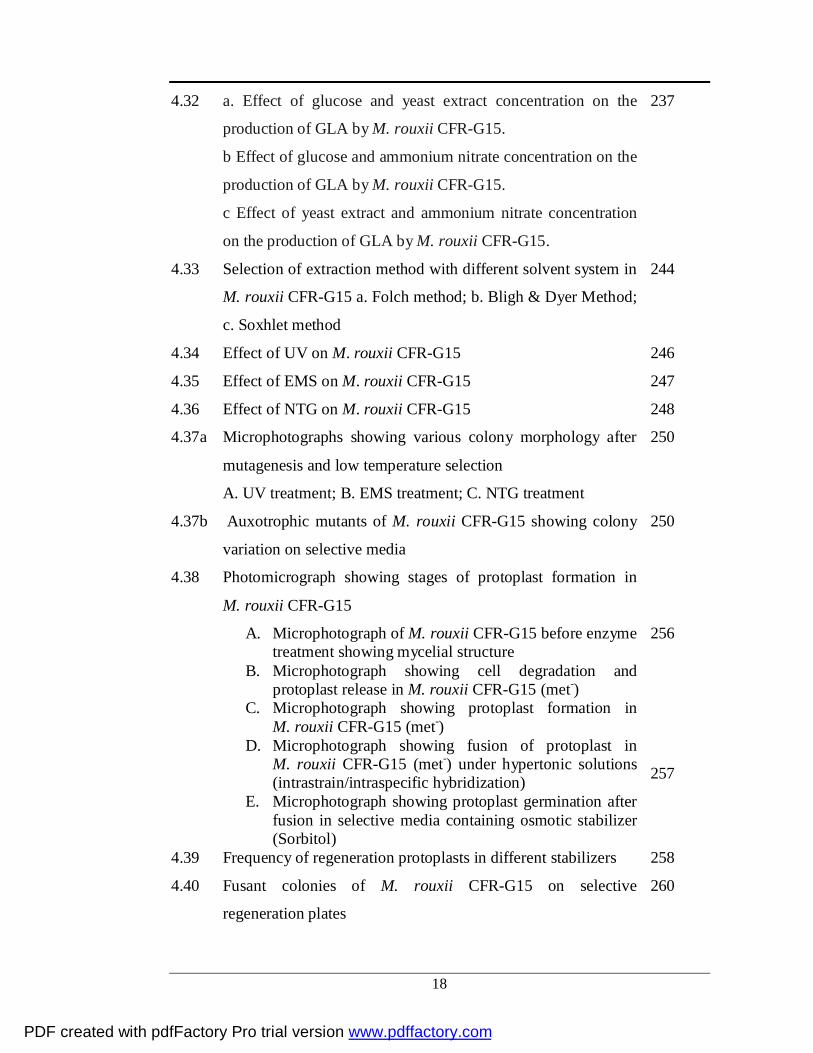
4.32 a. Effect of glucose and yeast extract concentration on the
production of GLA by M. rouxii CFR-G15.
b Effect of glucose and ammonium nitrate concentration on the
production of GLA by M. rouxii CFR-G15.
c Effect of yeast extract and ammonium nitrate concentration
on the production of GLA by M. rouxii CFR-G15.
237
4.33 Selection of extraction method with different solvent system in
M. rouxii CFR-G15 a. Folch method; b. Bligh & Dyer Method;
c. Soxhlet method
244
4.34 Effect of UV on M. rouxii CFR-G15 246
4.35 Effect of EMS on M. rouxii CFR-G15 247
4.36 Effect of NTG on M. rouxii CFR-G15 248
4.37a Microphotographs showing various colony morphology after
mutagenesis and low temperature selection
A. UV treatment; B. EMS treatment; C. NTG treatment
250
4.37b Auxotrophic mutants of M. rouxii CFR-G15 showing colony
variation on selective media
250
4.38 Photomicrograph showing stages of protoplast formation in
M. rouxii CFR-G15
A. Microphotograph of M. rouxii CFR-G15 before enzyme treatment showing mycelial structure
B. Microphotograph showing cell degradation and protoplast release in M. rouxii CFR-G15 (met-)
C. Microphotograph showing protoplast formation in M. rouxii CFR-G15 (met-)
D. Microphotograph showing fusion of protoplast in M. rouxii CFR-G15 (met-) under hypertonic solutions (intrastrain/intraspecific hybridization)
E. Microphotograph showing protoplast germination after fusion in selective media containing osmotic stabilizer (Sorbitol)
256
257
4.39 Frequency of regeneration protoplasts in different stabilizers 258
4.40 Fusant colonies of M. rouxii CFR-G15 on selective
regeneration plates
260
PDF created with pdfFactory Pro trial version www.pdffactory.com
19
4.41 Selected Hybrid cultures 260
4.42 Plate 1: A. Parent colony grown in 28°C (RT) B. Hybrid colony grown in 28°C (RT)
Plate 2: A. Parent colony grown in 15°C (LT); B. Hybrid colony grown in 15°C (LT)
261
4.43 Gas chromatogram showing the increased GLA a. Parent b. Auxotroph mutant c. Hybrid culture
265
4.44 Photomicrograph of Parent, Mutant and Hybrid culture of M. rouxii CFR-G15 in FPM agar slants
267
PDF created with pdfFactory Pro trial version www.pdffactory.com

20
ABSTRACT
PDF created with pdfFactory Pro trial version www.pdffactory.com
21
ABSTRACT
Lipids are one of the main classes of macronutrients required for human
growth and nourishment. In order to obtain native isolate for GLA production, soil
samples were collected from various habitats for screening the Mucor spp. in
nutrient rich medium. Based on the external morphology and microscopic
observation Mucor spp. were isolated, compared with the standard cultures and
comparisons were also made with the Gilman manual of soil fungi
These isolates were screened for their oleagenicity both qualitatively and
quantitatively, staining with Sudan black-B and gravimetric method respectively.
All the selected Mucor spp. and standard cultures were cultivated on submerged
fermentation to study the growth characteristics, lipid and GLA contents. The
results indicated that the highest biomass, lipid and GLA content were observed in
M. rouxii CFR-G15. The presence of GLA in the lipid of this isolate was
confirmed by the mass spectrometric method.
By using gene specific primers, 18S rRNA and ∆6 DES genes were amplified
by PCR technique. Nucleotide sequences of 18S rRNA and ∆6 DES genes
exhibited 98% homology with M. rouxii ATCC 24905 (accession no.AF117923
and AF296076) respectively, suggesting taxonomic identity. A nucleotide
sequences determined in this study was submitted to the GenBank and obtained
the accession numbers EU927296 and EU526025 for 18SrRNA and ∆6 DES genes
respectively.
Cultivation conditions were selected for GLA production by optimizing
appropriate selection of both physical and chemical parameters such as pH,
temperature, aeration, inoculum concentration, medium composition, carbon and
nitrogen sources, C:N ratio combination, different vegetable oils, and different
concentration of minerals in growth media. It was concluded in this study that pH
5.5, temperature at 28±2°C, glucose, yeast extract & ammonium nitrate as carbon
and nitrogen sources and C:N ratio of 60 produced maximum biomass, lipid
production and GLA content in this strain. A CCR design was used for
PDF created with pdfFactory Pro trial version www.pdffactory.com

22
optimizing the levels of carbon and nitrogen sources to maximize the GLA
production by RSM. By using different solvent extraction, this study concluded
that chloroform and methanol in 2:1 ratio gave maximum recovery of lipid.
The M. rouxii CFR-G15 was subjected to mutation through physical and
chemical methods (UV, EMS & NTG) and after several screening, a met-
auxotroph was obtained and this amino acid marker was used for hybridization
studies to obtain stable hybrids. Putative hybrids were qualitatively characterized
for high lipid and GLA production. Hybrid CFR-HyG 9 showed highest GLA
content of 23.34 ±1.23 % in 42.46±2.41% of lipid content which was 1.5 fold
higher than the parent culture in basal medium. Thus, the various experiments
carried out in this study, ultimately aimed to increase the biomass, total lipid
content and maximizing the GLA production.
Plants beings the conventional sources of essential fatty acids have some
limitations/disadvantages that can be over ruled by microorganisms. Hence
microorganisms of GRAS status are now being exploited genetically as sources of
PUFAs and tailored for maximum productivity. The potential also exists in
selecting the microbial strains producing large proportions of lipid that can meet
the present market demand of omega-6 fatty acids, the GLA for nutritional and
pharmaceutical supplementation.
PDF created with pdfFactory Pro trial version www.pdffactory.com

23
CHAPTER -1 INTRODUCTION
PDF created with pdfFactory Pro trial version www.pdffactory.com

24
INTRODUCTION Fats and oils, being essential ingredients in human diet serve as an
important raw material for the industry. Presently the bulk of fats and oils are
obtained mainly from plant and animal sources. The demands for fats and oils for
edible and non-edible purposes are ever increasing and that from the conventional
sources are unable to supply for the increasing world population. Search is going
on for alternative to conventional sources. Lipid from microbes have been found
to be promising to meet these requirements as some strains accumulate more than
20 to 70% lipids inside the cell, which can be extracted economically.
Microbial lipids containing high proportion of polyunsaturated fatty acids
(PUFAs) of nutritional and pharmaceutical importance, which are similar in
composition to those of edible and non edible oils obtained from plants and
animal sources are known as single cell oil (SCO). PUFAs have diverse functions
in living cells and influence membrane composition and function, eicosanoid
synthesis, cellular signaling and regulation of gene expression (Gill & Valivety
1997; Horrobin 1992; Tapiero et al. 2002; Wallis 2002). Lipids rich in PUFAs,
present in sufficient quantities in microorganisms, plant and animals are known as
speciality lipids. Their production has been known from 100 years. For the last
two decades many attempts have been made to understand the process of lipid
accumulation in oleaginous species. All microorganisms don’t have the capacity
to accumulate lipid, in the form of triacylglycerols. A number of prokaryotic and
eukaryotic microorganisms can accumulate triacylglcerol as cellular storage from
20 to 70% of the dry biomass and are known as oleaginous species (Ratledge
2003; Waltermann et al. 200). In oleaginous microorganisms, when nitrogen is
exhausted in the culture medium, it triggers lipid accumulation, but glucose
continues to be assimilated. Isocitrate dehydrogenase ctivity within the
mitochondrion slower due to the diminution of adenosine mono phosphate (AMP)
within the cells. This leads to the accumulation of citrate, which is transported
into the cytosol and cleaved to acetyl-CoA by ATP: citrate lyase, an enzyme that
does not occur in non-oleaginous species. In particular, oleaginous molds have the
PDF created with pdfFactory Pro trial version www.pdffactory.com

25
ability to accumulate large amount of lipids, and serve as alternative source for the
production of pharmaceutical grade PUFAs (Aggeslis & Sourdis 1997).
Demands for PUFAs are constantly increasing while the sources producing
them are not increasing in the same pace (Wallis et al. 2002). Various alternative
sources are being explored which yield these essential elements for health. These
lead to the screening of new strains and better understanding of lipid production in
microorganisms. It was found that
Ø The numbers of microorganisms that accumulate more than 20% of
biomass weight were relatively small when compared to total number of
species.
Ø Yeast, fungi, and a few bacteria are the major oil accumulating
microorganisms and produce extractable oil
Ø The oil produced from these microorganisms are very similar to plant oils
mainly composed of triacylglycerol having the same composition as that of
plant fatty acids
Ø Algae are considered as one of the main sources for lipid production with
high proportion of PUFAs, but this lipid tended to be more complex than
those yeast and fungi, and some PUFAs were observed similar to those
found in fish oils (Grahame et al. 2004; Van der Westhuizen et al. 1994).
The productions of microbial lipids rich in PUFAs are of current interest
from an industrial point of view (Ratledge 1991; 2004). PUFAs are classified into
two groups, the omega-6 (n-6) or the omega-3 (n-3) fatty acids, depending on the
position of the double bond (n) closest to the methyl end of the fatty acid chain. In
mammals, PUFAs cannot be synthesized by de novo and they must be supplied
through diet. They are essential fatty acids, linoleic acid (LA, 18:2n6) and alpha-
linolenic acid (ALA, 18:3n3). PUFAs are produced from these fatty acids through
a series of desaturation and elongation reactions catalyzed by desaturase and
elongase enzymes, respectively (Certik & Shimizu 1999; Uttaro 2006).
PDF created with pdfFactory Pro trial version www.pdffactory.com

26
Gamma-linolenic acid (GLA, C18:3, 6,9,12) is known as a conditional
essential fatty acid in n-6 series PUFAs, because of high impacts on both its
pharmaceutical and nutraceutical interest (Fan & Chapkin 1998; Harbige 2003).
GLA is commercially produced from plant seed oils, which includes evening
primrose (Oenothers bennis), borage (Borago officinalis) and black currant (Ribes
nigrum). The inconsistency of the fatty acid composition and low GLA content of
these plant oils, depending on seasonal and geographic variations are the major
drawbacks in production these oils (Gill & Valivety 1997).
Fungal lipids are the preferred sources of pure gamma-linolenic acid
(GLA) because the competing plant oils contain high amounts of other PUFAs
that hinder GLA’s purification (Ratledge & Wynn 2002). GLA is very important
in therapeutic uses because it has selective anti-cancer properties and it also
alleviates a number of diseases (Das 2004; Kenny et al. 2000). The
biotechnological approach for production of SCO especially the GLA is always of
importance because of the capacity of oleaginous micro-organisms to convert
agro-industrial raw materials into valuable lipids, in solid-state or liquid-
submerged fermentations (Certik et al. 1997; Chen & Chang 1996; Gema et al.
2002; Papanikolaou et al. 2001; 2002a, b; Papanikolaou & Aggelis 2003;
Strendaska et al. 2000b). Microorganisms like Mucor circinelloides as a source of
GLA, Mortierella alpina for achidonic acid (AA), and Crypthecodinium cohnii
and Schizochytrium spp. for docosahexaenoic acid (DHA) production have been
used commercially to produce the various SCO, being grown in stirred tank
fermenters (Ratledge 2002). The first process that was developed for microbial oil
with high level of GLA in industrial scale was by biotechnological means using
Mucor circinelloides (Certik & Shimizu 1999; Ratledge 1994). The process
provided an important milestone and bench mark for all future microbial oil
productions. Today large scale commercial processes are operated for the
production of oils rich in either arachidonic acid or docosahexaenoic acid using
various microorganisms.
PDF created with pdfFactory Pro trial version www.pdffactory.com

27
There are many published reports about fungal species and strains
producing GLA. Sofar, only members of the lower fungi belonging to the order
Mucorales are found to be promising GLA producers (especially Mortierella spp.
Mucor spp., Cunninghamella spp. Pythium spp. and Rhizopus spp.) and
fermentations have been developed for improving productivity of the GLA-rich
oils (Jang et al. 2005; Mukherjee 1999; Stredansky et al. 2000a, b; Suzuki et al.
1981; Van der Westhuizen et al. 1994). Two large-scale processes have been
developed for the commercial production of GLA from Mortierella isabellina and
Mucor javanicus (Ratledge 2003). Widespread interest in this acid for dietary and
pharmacological uses has inspired numerous research groups to keep on searching
for particularly effective fungal strains and developing optimal conditions for their
production. Since microbial production has certain advantages over plant tissue
and algal cultures, efforts have been directed toward research.
Mucoraceous fungi especially the Mucor spp. has been reported to be an
interesting organism for the production of GLA-rich oils (Aggelis & Sourdis
1997; Komaitis et al. 2001; Mamatha et al. 2008; Somashekar et al. 2002), since
GLA is of great pharmaceutical interest (Das et al. 2004; Fakas et al. 2006;
Horrrobin 1992). In spite of their significance, little is known about the details of
biosynthesis of PUFAs in oleaginous molds, as the most studies are limited to
yeast and plants (Ratledge & Wynn 2002). Furthermore the research on the details
of lipid biosynthesis in the fungi mucorales and its regulation are just emerging
areas (Certiik & Shimadzu 1999; Fakas et al. 2006) with special emphasis given
to the role of lipid bodies in triacylglycerols (TAG) biosynthesis and storage
(Aggelis & Sourdins 1997; Fakas et al. 2006; Papanikolaou et al. 2002;
Waltermann et al. 2000). Some of the Mucor spp. are dimorphic in nature with
ability to grow as yeast as well as filamentous forms depending on the
environmental conditions (Orlowski 1991). Mucor spp. are thought to be more
advantageous to produce fatty acids than algal, moss and protozoal sources (Botha
et al. 1995; Ratledge 1993). Enzyme ∆6-desaturase catalyzes, conversion of
linoleic acid (C18:2 n6) and alpha linoleic acid (C18:3 n3) into GLA (C18:3 n6)
and stearcodonic acid (C18:4, n3) respectively (Huang et al. 2001; Sakuradani et
PDF created with pdfFactory Pro trial version www.pdffactory.com
28
al. 1999). ∆6-desaturase enzyme is a membrane bound front-end desaturase having
molecular weight of 66 kDa and it inserts the double bond inbetween 6 and 7
carbon atoms of linoleic acid forming GLA (Das et al. 2001). Identification of
genes involved in synthesis of GLA helped for the characterization of organisms
in relation to the taxonomy and phylogeny (Das et al. 2001; Sakuradani et al.
1999). Additionally, GLA can be used as a chemotaxonomic marker to
differentiate between the genera and the species in zygomycetes (Stahl & Klug
1996).
SCOPE OF THE INVESTIGATION
Gamma linoleic acid (GLA) is an important ω-6 fatty acid and it is a
precursor of long chain polyunsaturated fatty acids. Dietary supplementation with
GLA is reported to be effective in treating a number of diseases like atopic
eczema, diabetes, neuropathy, viral infections and cancer. It indicates that GLA
has applications in both nutraceutical and pharmaceutical industries. GLA is
obtained mainly from plant seed oils like Borage spp (Borago officinalis L, GLA:
10-25%), and evening primrose (Oenothera biennis L, GLA: 7-10%). The
productions of GLA from plant sources are generally low and vary with season,
climate and geographical locations. Hence, the quantity and quality of
conventional sources of GLA may fall short of the market demand. Due to
aforesaid drawbacks and increasing importance of GLA in pharmaceutical and
nutraceutical industries, a need for an alternative source for the production of
GLA which can compete in cost and quality with conventional sources was
thought of from oleaginous microbial sources.
Oleaginous microorganisms have greater advantages over the other sources
i.e. fast growth, easy of manipulating the organisms and also an appropriate
vehicle for cloning foreign genes for the production of specific PUFAs.
Zygomycetes especially mucorales are able to synthesize GLA and accumulate in
large amounts within the mycelium. Microbial production of lipids that contain
PDF created with pdfFactory Pro trial version www.pdffactory.com

29
unusual fatty acids like PUFAs with potential commercial application has been
aimed at this study with the selection of organisms by screening and optimization.
The scope of the present investigation is screening and isolation of Mucor spp.
from local soil samples and to explore the potential strain for GLA production.
Mucor sp. CFR-G15 strain was selected after systematic screening among the
cultures and this strain was subjected to both sub-merged and solid-state
fermentation studies for its biomass, total lipid and fatty profile. Taxonomic
identification of Mucor sp. CFR-G15 was carried out through molecular method
i.e. 18s rRNA sequencing. Phylogeny of ∆6-desaturase enzymes
was studied to understand its diversity. Physiology of lipid accumulation and
GLA production in M. rouxii CFR-G15 has been studied through variations of
growth conditions. Physical and chemical parameters like pH, temperature,
aeration, carbon source, nitrogen source, C:N ratio, supplementation of metal ions
and oils were evaluated in order to produce high biomass, lipid yield, and GLA
content. Statistical optimization of medium components was also carried out by
response surface methodology for increased production of GLA in mycelium of
M. rouxii CFR-G15. A genetic study of M. rouxii CFR-G15 culture was carried
out by mutation and protoplast fusion. This experiment was aimed to produce
strains increased with lipid production and GLA content. UV radiation, chemical
mutagens like EMS and NTG treatments were used to mutagenise the culture. The
hybrids obtained through protoplast fusion were characterized with high lipid and
GLA content in fatty acids. Thus, high GLA producing hybrids of M. rouxii CFR-
G15 were identified.
PDF created with pdfFactory Pro trial version www.pdffactory.com

30
CHAPTER -2 REVIEW OF LITERATURE
PDF created with pdfFactory Pro trial version www.pdffactory.com

31
REVIEW OF LITERATURE
LIPIDS AND FATTY ACIDS
Fats, also known as lipids are the esters of glycerol and fatty acids. They
are one of the major nutrients along with protein and carbohydrates in human diet.
Lipid stored in the cell membrane as oil droplets acts as energy reservoir. The
major component of lipids is triacylglycerol (TG). Which consist of three fatty
acids attached to a glycerol backbone as sn-1, sn-2 and sn-3 position as shown in
Fig. 2.1. Triacylglycerol and fatty acid compositions can vary both within and
between organisms in cell membrane. Phospholipids, glycolipids and sterols form
a complex that occurs in association with the protein (Lehninger 1993; Willis et
al. 1998).
Fig.2.1 The structure of triacylglycerol. The fatty acids in the sn-1, sn-2 and sn-3 positions (F1, F2 and F3) will, most likely, be different.
Fatty acids are long chain of aliphatic acids (alkanoic acids) varying in
chain length from, normally, C12 to C22. In most cells like microbial, plant and
animals, predominant chain lengths are 16 and 18. The chain length influences the
characteristics of a fatty acid, as does the presence or absence of double bonds
between carbon atoms. The structure of fatty acid represented by a simple
notation system-X:Y, where X is the total number of carbon atoms and Y is the
number of double bonds. Fatty acids are made up of a backbone of carbon atoms,
with a methyl group (CH3) at one end [the omega (ω) or n-end] and a carboxyl
group (COOH) at the other [the delta (Δ) end] [Fig. 2.2]. Hydrogen atoms are
joined to the string of carbon atoms, forming a hydrocarbon chain. The fatty acids
are classified as follows.
PDF created with pdfFactory Pro trial version www.pdffactory.com

32
Fig. 2.2 The general structure of fatty acids
Fig. 2.3 Classification of Fats (lipids)
• If all of the carbons in the fatty acid chain are linked by single bonds is
known as saturated fatty acid (SFA).
• If one or more double bonds are present in the fatty acid chain, it is
considered to be an unsaturated fatty acid.
• If there is only one double bond present in an unsaturated fatty acid, it is
said to be a monounsaturated fatty acid (MUFA).
• If there is more than one double bond present, the fatty acid is said to be a
polyunsaturated fatty acids (PUFAs) [Fig. 2.3].
Saturated Unsaturated Polyunsaturated
Trans
Omega-3 Omega-6
FAT
PDF created with pdfFactory Pro trial version www.pdffactory.com

33
Fats and oils, being an essential constituent in human diet are also
important raw materials for the industry. At present the bulk of fats and oils are
obtained from plant sources. The edible and non-edible uses of fats and oils are
presented in Table 2.1. Demand for oils and fats both for edible and industrial
purpose is continuously increasing [Table 2.2]. The demand for oils and fats is
largely met by plant sources. Animal and marine sources contribute less than 25%
of total production of fat. Production of oils and fats [Table 2.3] is mainly from
seven major plant crops: soybean, groundnut, cottonseed, rapeseed, palm, coconut
and sunflower. In India groundnut, sunflower, cotton seed and coconut are grown
as oil crops. In USA soy bean, sunflower and cotton seed are major oil producing
plants. In Europe, only rapeseed is grown as an oil crop. Plants and animals, the
conventional sources of edible fats and oils are unable to meet the demands of
consumer and industries. Microorganisms are looked upon as an alternative or
additional source of oils. As yeasts are having their long association with human
diet, they, in particular appear to be the most likely source for bio oils. They
produce oils similar to the composition of edible oils and are highly suitable for
animal and human diet (Nigam 1999; Willis et al. 1998).
PDF created with pdfFactory Pro trial version www.pdffactory.com

34
Table 2.1 Commercial application of fats and oils
(A) Oil source Products (edible)
Soybean oil, groundnut oil, Margarine
cottonseed oil, sunflower Cooking fat
oil, rapeseed oil, sesame oil, Cooking oils palm oil, some fish oils, Salad oils/mayonnaise/table oils olive oil, castor oil, Ice cream
lard and tallow Confectionery
Coconut oil, palm kernel oil, castor oil
Pharmaceuticals
(B) Oil source Products (non-edible) Palm kernel, coconut oil Detergents and surfactants Palm oil Soaps, metallic soaps, synthetic
waxes Linseed oil, tung oil, soybean oil, sunflower oil
Paints and coatings
Linseed oil, tung oil Varnishes and lacquers Various, mainly castor oil Inks Various, mainly soybean oil Plastics and additives Castor oil, coconut oil Lubricants and cutting oils Tung oil Wood dressings, polishes Fish oils Leather dressing Palm oil and tallow Metal industry Various, mainly soybean oil Agrochemicals, long-chain
quaternary compounds as herbicides, insecticides and fungicides
Fatty alcohols from any source
Evaporation retardants
Tallow Fabric softeners (Source: Nigam 1999)
Fats provide energy; indeed it is the most energy dense of all the
macronutrients, it does play an important role in energy requirements and enables
the absorption of fat-soluble vitamins A, D, E, and β-carotene in humans and
animals (Lunn & Theoblad 2006). Lipids act as principal components of cell
membranes and serve as barrier to separate from constituents and are vital for
maintaining cellular integrity, shape, and flexibility. Fat is needed by all cell
membranes-nerve, brain, eye, heart, adrenal and thyroid cells to function. Lipids
involved in the maintenance of the vascular wall, in regulating blood pressure and
in the production of eicosanoids, the family of hormone like compounds regulate
PDF created with pdfFactory Pro trial version www.pdffactory.com
35
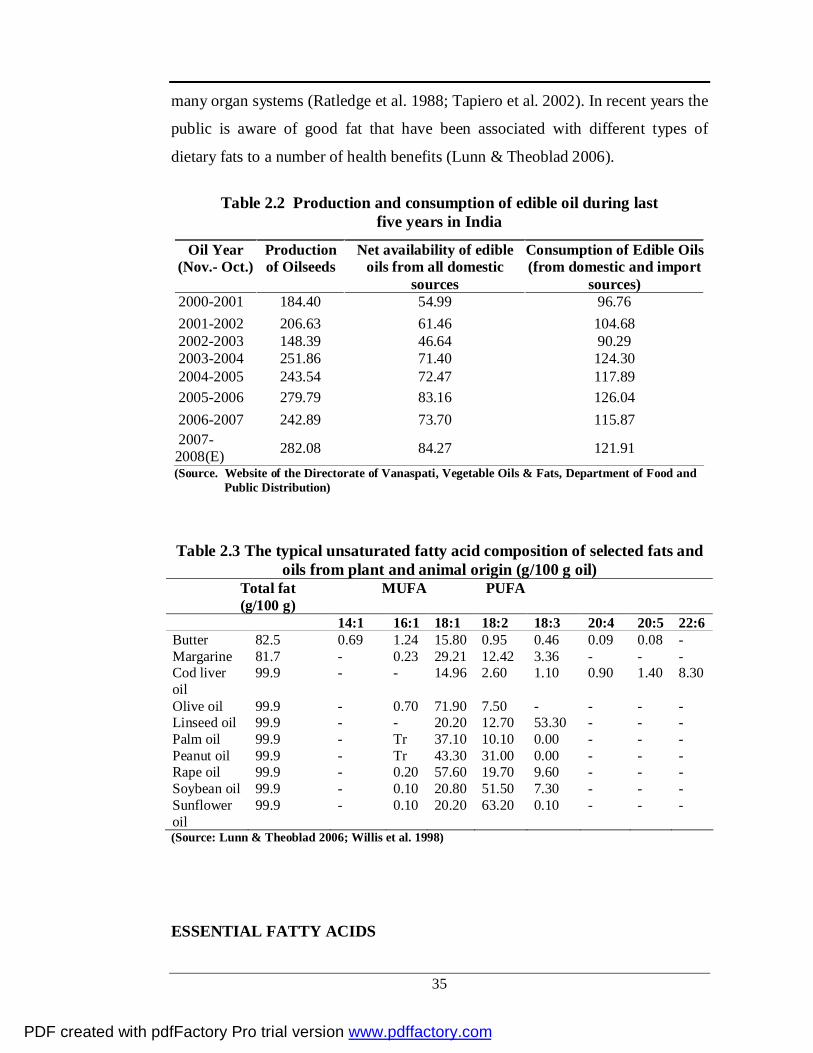
many organ systems (Ratledge et al. 1988; Tapiero et al. 2002). In recent years the
public is aware of good fat that have been associated with different types of
dietary fats to a number of health benefits (Lunn & Theoblad 2006).
Table 2.2 Production and consumption of edible oil during last five years in India
Oil Year (Nov.- Oct.)
Production of Oilseeds
Net availability of edible oils from all domestic
sources
Consumption of Edible Oils (from domestic and import
sources) 2000-2001 184.40 54.99 96.76 2001-2002 206.63 61.46 104.68 2002-2003 148.39 46.64 90.29 2003-2004 251.86 71.40 124.30 2004-2005 243.54 72.47 117.89 2005-2006 279.79 83.16 126.04 2006-2007 242.89 73.70 115.87 2007- 2008(E) 282.08 84.27 121.91
(Source. Website of the Directorate of Vanaspati, Vegetable Oils & Fats, Department of Food and Public Distribution)
Table 2.3 The typical unsaturated fatty acid composition of selected fats and oils from plant and animal origin (g/100 g oil)
Total fat MUFA (g/100 g)
PUFA
14:1 16:1 18:1 18:2 18:3 20:4 20:5 22:6 Butter 82.5 0.69 1.24 15.80 0.95 0.46 0.09 0.08 - Margarine 81.7 - 0.23 29.21 12.42 3.36 - - - Cod liver oil
99.9 - - 14.96 2.60 1.10 0.90 1.40 8.30
Olive oil 99.9 - 0.70 71.90 7.50 - - - - Linseed oil 99.9 - - 20.20 12.70 53.30 - - - Palm oil 99.9 - Tr 37.10 10.10 0.00 - - - Peanut oil 99.9 - Tr 43.30 31.00 0.00 - - - Rape oil 99.9 - 0.20 57.60 19.70 9.60 - - - Soybean oil 99.9 - 0.10 20.80 51.50 7.30 - - - Sunflower oil
99.9 - 0.10 20.20 63.20 0.10 - - -
(Source: Lunn & Theoblad 2006; Willis et al. 1998)
ESSENTIAL FATTY ACIDS
PDF created with pdfFactory Pro trial version www.pdffactory.com

36
Essential fatty acids (EFAs) are those fatty acids that are required for
normal physiological human health but are not synthesized by de novo pathway in
the body; they must be obtained from dietary sources. There are two essential
fatty acids, Linoleic acid (n-6, C18:2 cis LA) and alpha linolenic acid (ALA, n-3,
C18:3 cis) [Fig. 2.4]. EFAs play a role in every life process of our body and life
without them is unfeasible. Like vitamins EFAs are essential to human health. The
major signs and symptoms associated with the deficiency EFAs are shown in
Table 2.4.
Fig. 2.4 ω-3 and ω-6 fatty acids (PUFAs-polyunsaturated fatty acids).
PDF created with pdfFactory Pro trial version www.pdffactory.com

37
Table 2.4 The major sign and symptoms associated with the deficiency of essential fatty acids
Signs & Symptoms Fatty acid
association Action
Emaciation, weakness, disorientation Caloric deprivation
Add balanced of fat, protein, and CHO.
Reduced growth, renal dysplasia, reproductive deficiency, scaly skin
Classic essential fatty acid deficiency
Add good quality fats and oils
Eczema-like skin eruptions, loss of hair, liver degeneration, behavioral disturbances, kidney degeneration, increased thirst, frequent infections, poor wound healing, sterility (m) or miscarriage (f), arthralgia, cardiovascular d., Growth retardation
Linoleic acid insufficiency
Add corn or safflower oils
Growth retardation, weakness, impairment of vision, learning disability, poor coordination, tingling in arms / legs, behavioral changes, mental disturbances, low metabolic rate, high blood pressure, immune dysfunction
Alpha or gamma linolenic acid insufficiency
Add flax, primrose, borage, or black currant oils.
Depression, anxiety, slower behavioral and visual development or Cardiovascular disease risk
Long chain PUFA-dependent neuromembrane function Prostanoid balance
Add fish oils Avoid hydrogenated oils
Cancer Low stearic to oleic ratio, Prostanoid imbalance
Add omega-3 PUFAs Use omega-6 PUFAs with caution
Rheumatoid arthritis Low GLA & DGLA
Add primrose oil
Myelinated nerve degeneration Increased very long chain FAs
Add high-erucate rape or mustard oils
Fatty liver Saturated and omega-9 accumulation in liver
Restrict alcohol Add lecithin Increase Met
Accelerated aging High PUFA intake without increased antioxidants
Add vit. E and C and Se, Mn, and Zn
(Source: www.7 007b.com fats and essential fatty acids?)
PDF created with pdfFactory Pro trial version www.pdffactory.com
38
Major functions of EFAs
§ It forms the membrane barrier that surrounds our cells and intracellular
factories.
§ Determine the fluidity and chemical reactivity of membranes.
§ Increasing oxidation rate, metabolic rate and energy level
§ Keeps exocrine and endocrine glands active
§ Precursors for all prostaglandins series, three families of short lived
hormones determines the health of our cardiovascular system, kidney
function and platelet aggregation, blood pressure
§ Transport cholesterol
§ Strengthen the immune system to fight infection by enhancing peroxide
production
§ Prevents the development of allergies
o Essential fats are necessary for normal reproduction and growth
o ω-6 fat converts into GLA with the help of an enzyme
∆6 -desaturase, thus manufacturing a hormone like substrate PGE1
(prostaglandins1) that plays a critical role in prevention and
beneficial response to numerous health disorders.
§ EFAs play a role in every life process of our body and life without them is
unfeasible. Consuming EFAs poor diet, it diverts health (Lunn & Theoblad
2006; Simonopoulos 1991; Willis et al. 1998)
POLYUNSATURATED FATTY ACIDS (PUFAs)
Polyunsaturated fatty acids (PUFAs) are fatty acids with two or more
double bond in cellular lipids such as triglycedies and phospholipids. PUFAs can
be further classified as either ω-3, (n-3, omega 3) or ω-6 (n-6, omega 6) PUFAs,
depending on the position of the first double bond in the fatty acid chain. All
members of the ω-6 family of fatty acids contain their first double bond between
the sixth and seventh carbon atoms from the terminal methyl group, while all
PDF created with pdfFactory Pro trial version www.pdffactory.com

39
members of the ω-3 family of fatty acids have their first double bond between the
third and fourth carbon atoms. They are usually named in abbreviated form as
X:YnZ, where X stands for the number of carbon atoms of the chain, Y the
number of double bonds, and Z the position of the first double bond counted from
the methyl end (the n system of numbering). ω-6 or n-6 fatty acids are the
predominating fatty acids in plants and animals where as, ω-3 or n-3 fatty acids
are commonly found in marine foods, animals and phytoplanktons. The major
PUFAs and their structures are given in Table 2.5 and Fig. 2.5. Linoleic acid
(18:2) and alpha linolenic acid (18:3) are the essential dietary fatty acids, and are
precursors for a number of PUFAs, such as, Arachidonic acid (AA, 20:4, ω-6),
Eicosapentaenoic Acid (EPA, 20:5, n-3), Docosapentaenoic Acid (DPA,22:5, n-
3), Docosahexaenoic Acid ( DHA, 22:6, n-3).
Table 2.5 Polyunsaturated Fatty Acids and Their Chemical Name
(Source : Leninhger 1993; Lopez Alonso & Garcia Maroto 2000)
Formula IUPAC Name Common Name Abbre- -viation
18:2n6 9, 12 cis, cis octadecadienoic acid
Linoleic acid LA
18:3n6 6, 9, 12 cis, cis, cis octadecatrienoic acid
ϒ-linolenic acid GLA
18:3n3 9, 12, 15 cis, cis, cis octadecatrienoic acid
Α-linolenic acid ALA
20:3n6 6, 9, 12 cis, cis, cis eicosatrienoic acid
Dihomo-ϒ- linoelinic acid
DGLA (DHGLA)
20:4n6 4, 7, 12, 14 cis, cis, cis, cis Eicosatetraenoic acid
Arachidonic acid AA
20:5n3 cis, cis, cis, cis, cis Eicosapentaenoic acid
Eicosapentaenoic acid
EPA
22:6n3 cis, cis, cis, cis, cis, cis Eicosahexaenoic acid
Docosahexanoic acid DHA
PDF created with pdfFactory Pro trial version www.pdffactory.com

40
FFiigg.. 22..55 SSttrruuccttuurree aanndd mmeettaabboolliissmm ooff ω-3 and ω-6 PPUUFFAAss
Sources of PUFAs
Currently PUFAs are obtained from a various sources like higher plants,
animal entrails, and oily fish. In recent years the demand for PUFAs in market is
increasing but it has become evident that PUFAs productions from current sources
are inadequate (Gill & Valivety 1997; Lopez et al. 2000; Napier et al. 1999; 2005;
Wallis et al. 2002). The plant seed oils are the major commercial sources of C18
PUFAs. The plants cannot synthesise above C18 PUFAs due to a lack of the
required enzymes in the cell system (Wallis et al. 2002). The long chain fatty acid
like AA is mainly obtained from animal sources. EPA and DHA are commercially
obtained from marine fish oils. The production of PUFAs from agricultural and
PDF created with pdfFactory Pro trial version www.pdffactory.com

41
animals sources are generally low in content and vary with season, climate and
geographical location. Marine fish oil, have disadvantages of objectionable taste
and odours, high cholesterol and small amounts of potential toxic impurities that
are difficult to remove. Therefore, the quantity and quality of conventional
sources of PUFAs may come across problems meeting an increasing market
demand (Napier et al. 1999; 2005; Ratledge 2003; Cohen & Ratledge 2005).
Because of these drawbacks, new sources of PUFAs are needed that can compete
in cost and quality with the conventional sources. A diversity of PUFAs presence
has been determined in microorganisms which includes bacteria, fungi, algae and
mosses (Gill & Valivet 1997; Hirano et al. 1990; Ratledge 2004; Van der
Westhuizen et al. 1994). The conventional and non conventional sources of
PUFAs are given in Table 2.6. These organisms are thought to be very promising
and alternative producers of PUFAs because of their high growth rate on simple
media and the simplicity of their manipulation (Shimizu et al. 1988;
Yongmanitchai & Ward 1989; Bajpai & Bajpai 1992; Barclay et al. 1994;
Somashekar et al. 2002; Papanikolaou et al. 2007). The diversity of microbial
species can facilitate the selection of strains producing lipids with the target fatty
acids. In recent years alternatives to conventional sources of oil production from
oleaginous micro organisms have been intensively studied (Certik & Shimizu
1999). Bacteria associated with higher marine organisms like Bacillus subtilis
have emerged as better source of highly pure PUFAs oils than fish and plant oils
(Pantnayak & Sree 2005). A few bacterial species belonging to the genera
Mycobacterium, Streptomyces, Nocardia and Rhodococcus are also the potential
bioresources for the production of triacylglycerols (Pantnayak & Sree 2005;
Waltermann et al. 2000). Fungal microorganisms like Mortierella and Pythium
species are studied more intensively and found to produce high amounts of GLA,
AA and EPA (Bajpai & Bajpai 1993; Certik & Shimizu 1999; Fakas et al. 2008;
Shinmen et al. 1992). Single cell oil (SCO), presents a potential industrial interest
for the food and pharmaceutical industries owing to their specific characteristics
like pharmaceutical grade oil (Ratledge 1993; 2002; Cohen & Ratledge 2005).
The most obvious target of the research in the field of microbial lipids is the
PDF created with pdfFactory Pro trial version www.pdffactory.com

42
production of oil equivalent to edible oil in composition and structure i. e. lipid
rich in PUFAs of medical interest (Dhyaneswar et al. 2006; du Preeze et al. 1997;
Papanikolaou et al. 2001; Ratledge 1991).
Table 2.6 Sources of polyunsaturated fatty acids
PUFA CONVENTIONAL SOURCES
MICROBIAL SOURCES
GLA
Plant seeds (Evening primrose, Borage, Black currant)
Fungi (Mucor rouxii. M. circinelloides, M.mucedo, Mortierella isabellina, M.romanniana, Cunninghamella elegans, Rhizopus arrhizus) Algae (Spirulina platensis, Chlorella vulgaris)
DGLA
Human milk, Animal tissue, Fish (Scomber scombus), Mosses (Pogonatum urnigerum)
Fungi (Mortierella spp., Conidiobolus nanodes, Saprolegnia freox), mosses (Ctenidium molluscum)
AA
Animal tissues (Porcine liver), fish (Brevoortia, Clupea), mosses (Ctenidium molluscum)
Fungi (Mortierella, Pythium spp.), algae: (Porphyridium spp.), mosses (Rhytidiadelphus, Brachythecium, Eurhynchium spp)
EPA
Fish (Herring, Menhaden) Shell-fish (Blue crab, Oyster, Lobster, Mussel)
Fungi (Mortierella, Pythium spp.), algae: (Chlorella, Monodus, Porphyridium, Nannochloropsis, Cryptoleura, Schizymenia, Navicula spp.), mosses (Brachythecium, Eurhynchium, Scleropodium spp), bacteria (Rhodopseudomonas, Shewanella spp.)
DHA
Fish (Tuna, Herring, Cod, Sardine, Salmon, Menhaden), Shell-fish (Blue crab, Oyster, Lobster, Mussel)
Fungi (Thraustochytrium aureum, T.roseum, Schizochytrium aggregatum, Entomophthora Spp.), Algae (Microalgae MK8805, Gonyaulax,Gyprodinium nelsoni, Cryptoconidium spp), Bacteria (Vibrio sp. Rhodopseudomonas spp. Shewanella spp.)
(Source: Certik & Shimizu 1999; Gill & Valivety 1997)
PDF created with pdfFactory Pro trial version www.pdffactory.com

43
Applications of PUFAs
The PUFAs play a role in phase transition and permeability of membranes
and modulating the behavior of membrane bound proteins and ion channels. In
addition PUFAs control the expression of certain genes, biosynthesis of
cholesterol and transport in the body. These PUFAs being important as structural
lipids are precursors for eicosanoids such as prostaglandins, leukotrienes and
thromboxanes, collectively known as eicosanoids, which mediate vasodilation,
fever, inflammations, blood pressure, clotting, pain, neurotransmission and
modulate the cholesterol biosynthesis (Gill 2002; Johnson et al. 1997; Moreton
1988; Pullman-Mooar et al. 1990; Puri 2007; Tapiero et al. 2002). PUFAs
deficiencies lead to abnormalities in the spine, nervous system, immune and
inflammatory systems, cardiovascular systems, endocrine systems and kidneys.
PUFAs are also used for retarding the growth of tumour cells in respirosystems
and reproductive systems from last decades (Das 2004; Huang et al. 200;
1Simonopoulos 2002). Another important role of PUFAs in the diet is to enable
the fat-soluble vitamins A, D, E and K to be absorbed from food and for body
cholesterol metabolism (Das 2004).
As the PUFAs composition of cell membranes is greatly dependent on the
dietary intake, the balance of ω-6 and ω3 fatty acids can be modified by
supplementing the diet with oils enriched in ω3 PUFAs Simonopulous 1991;
2002). This could compensate the unfavourable ratio of ω-3/ω-6 fatty acids of the
western diet and so lead to decreases in many chronic diseases like arthritis,
diabetes, inflammation, cancer and cardiovascular disease and improvement in
mental health. It is probable in man’s evolutionary development that there has
always been the proper balance between ω-3 and ω-6 fatty acids (Das et al. 2001;
Gill & Valivet 1997; Graham et al. 2004; Horrobin et al. 1992; Simonopoulos
1991; 2001).
PDF created with pdfFactory Pro trial version www.pdffactory.com

44
GAMMA LINOLENIC ACID (GLA, 18:3, ω-6)
There are two isomers of linolenic acid found in all organisms they are
alpha linoleic acid (ALA) and gamma linoleic acid (GLA). ALA is a ω-3 essential
fatty acid, comprised of 18 carbon atoms with three double bonds at 9, 12 and 15
positions. GLA is an important conditional ω-6 essential fatty acid. The fatty acid
molecule is comprised of 18 carbon atoms with three double bonds at 6, 9, and 12
positions. It is also known as 18:3n-6: 6, 9, 12-octadecatrienoic acid: cis-6, cis-9,
cis-12-octadecatrienoic acid: and gamolenic acid [Fig. 2.6].
12 9 6
Fig. 2.6 Structure of Gamma linolenic acid (GLA)
GLA has a very long history of use, occurring as it does in the seed oil of
the evening primrose (Oenothera biennis, EPO). EPO has been used as quasi
medicinal oil for centuries; it is known as “Kings cure all” and thus has been
recommended for the alleviation of a wide variety numbers of illness (Horrobin
1992; Huang & Mills 1996; Ratledge 1992a, b). In 1949, Riley re-examined the
unsaturated fatty acids present in evening primrose oil and proved that GLA is
other polyunsaturated fatty acid (Gunstone 1992; Horrobin 1992).
SOURCES OF GLA
COOHOHH
PDF created with pdfFactory Pro trial version www.pdffactory.com

45
GLA is found naturally in human milk and small amounts in a wide variety
of common foods, notably it is found relatively high in organ meats or bird origin
[Table2.7] (Horrobin 1992). GLA is present naturally in the fatty acid fractions of
some plant seed oils [Table 2.8]. Most notably sources of GLA include evening
primrose oil (EPO), borage oil, black currant oil, and hemp seed oil. Significant
amounts of GLA have been found in the plant families Onagraceae,
Saxifragaceae and Scrophulariaceae, but Boraginaceae is probably the best
source. Commercial production of GLA sources [Table 2.9] are almost limited to
seed oils from three plants: evening primrose, 9.6% GLA of total fatty acids
(Hudson 1984; Ratledge 2003), borage, 23% GLA of total fatty acids (Guil-
Guerrero et al. 2000; 2001a; 2001b) and black currant, 15±20% GLA of total fatty
acids (Ratledge 2002a; Traitler et al. 1984) and some microbial sources, as Mucor
javanicus (15±18%) and Spirulina platensis (21%) (Kamisaka et al. 1990;
Ratledge 2004).
Table 2.7 Various food of animal or bird origin of GLA sources
Source % lipid % GLA in lipid
mg GLA/100g source
Beef Learn-raw 2.0 0.11 2.2 Fat-raw 60.4 0.10 60.4 Kidney-raw 3.1 5.0 5.0 Liver-raw 4.6 10.1 10.1 Chicken Learn-raw 2.9 0.13 3.8 Fat-raw 59.7 0.13 77.6 Pork Learn-raw 3.3 Trace Trace Fat-raw 69.7 0.03 20.9 Egg Yolk Free range hens 29.8 0.07 20.9 Commercial hens 31.5 0.06 18.9
(Source: Gunstone 1992; Horrobin 1992)
PDF created with pdfFactory Pro trial version www.pdffactory.com
46
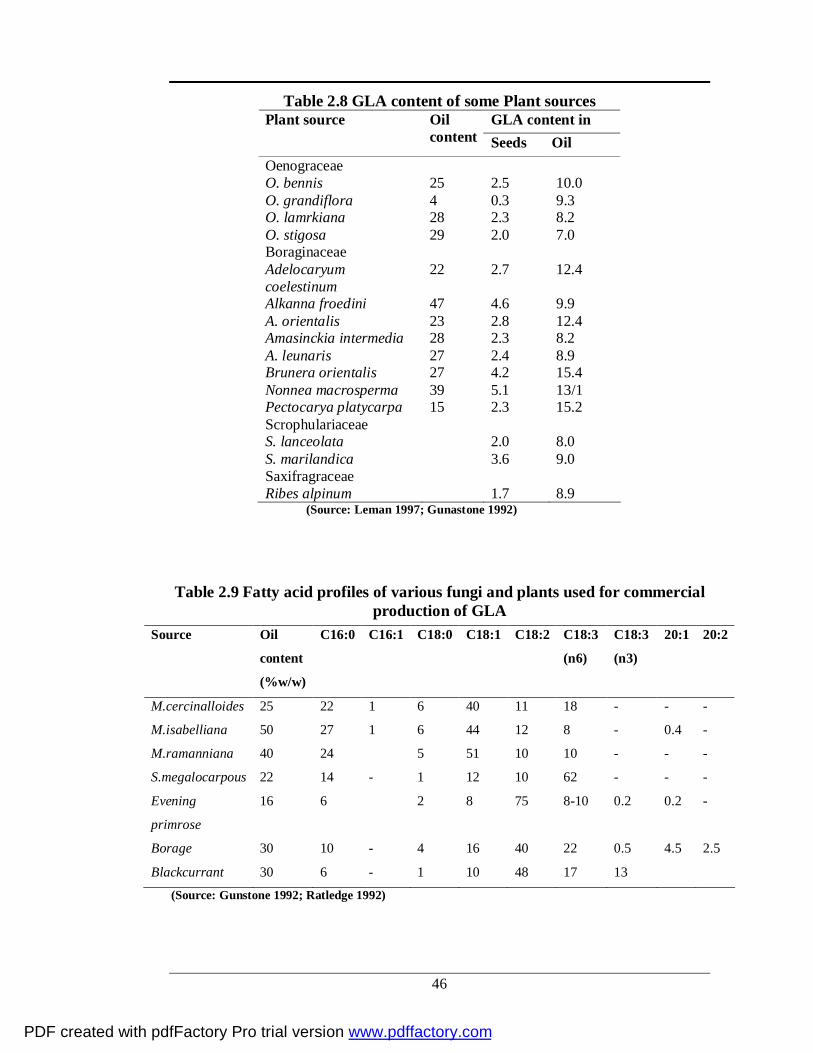
Table 2.8 GLA content of some Plant sources GLA content in Plant source Oil
content Seeds Oil Oenograceae O. bennis 25 2.5 10.0 O. grandiflora 4 0.3 9.3 O. lamrkiana 28 2.3 8.2 O. stigosa 29 2.0 7.0 Boraginaceae Adelocaryum coelestinum
22 2.7 12.4
Alkanna froedini 47 4.6 9.9 A. orientalis 23 2.8 12.4 Amasinckia intermedia 28 2.3 8.2 A. leunaris 27 2.4 8.9 Brunera orientalis 27 4.2 15.4 Nonnea macrosperma 39 5.1 13/1 Pectocarya platycarpa 15 2.3 15.2 Scrophulariaceae S. lanceolata 2.0 8.0 S. marilandica 3.6 9.0 Saxifragraceae Ribes alpinum 1.7 8.9
(Source: Leman 1997; Gunastone 1992)
Table 2.9 Fatty acid profiles of various fungi and plants used for commercial production of GLA
(Source: Gunstone 1992; Ratledge 1992)
Source Oil
content
(%w/w)
C16:0 C16:1 C18:0 C18:1 C18:2 C18:3
(n6)
C18:3
(n3)
20:1 20:2
M.cercinalloides 25 22 1 6 40 11 18 - - -
M.isabelliana 50 27 1 6 44 12 8 - 0.4 -
M.ramanniana 40 24 5 51 10 10 - - -
S.megalocarpous 22 14 - 1 12 10 62 - - -
Evening
primrose
16 6 2 8 75 8-10 0.2 0.2 -
Borage 30 10 - 4 16 40 22 0.5 4.5 2.5
Blackcurrant 30 6 - 1 10 48 17 13
PDF created with pdfFactory Pro trial version www.pdffactory.com

47
Borage and EPO are the most popular commercial sources available of the
GLA oils among consumers. The growing conditions are ideal for high production
of GLA in the seed oil. Borage leaves have traditionally been used in salads.
Historically, herbalists have claimed that the consumption of borage leaves and
flowers can treat depression and liver disorders. In addition, parts of the borage
plant have diuretic characteristics which have encouraged its use for treating
kidney and bladder inflammation. Traditional use of EPO has included parts of
the whole plant, externally to heal wounds and to soothe the skin inflammation
and internally to control coughs, as a sedative, pain killer and diuretic (Gill 2002;
Gunstone 1992; Horrobin 1992; Ratledge 1992 a, b).
BIOCHEMISTRY OF GLA The stereo specificity of GLA varies from source to source. In EPO and
black currant oil, GLA is concentrated in the n-3 position, while in borage oil it is
concentrated in the n-2 position. GLA is concentrated evenly in both the n-2 and
n-3 positions of fungal oils [Table 2.10] (Gunstone 1992; Ratledge 2002).
Table 2.10 Stereospecific distribution (% mol/mol) of GLA in triacylglycerol oils from four sources
Position EPO Borage oil Blackcurrant oil M. cercinelloides oil
All 9.3 24.8 15.9 17.9
sn-1 3.6 4.0 4.1 13.3
sn-2 10.7 40.4 17.4 19.6
sn-3 13.5 30.1 25.8 19.6 (Source: o 1992; Gunstone 1992)
SCREENING FOR THE BEST GLA PRODUCING FUNGUS The high biological activity of γ-linoleic acid and increasing need for
essential lipids containing this acid led to search for alternative new natural
sources. The presence of GLA in phycomyces fungi has been known since 1940
(Ratledge 1992a). It was subsequently found to be common fatty acids in fungi
PDF created with pdfFactory Pro trial version www.pdffactory.com

48
classified as lower fungi, which includes the genus of phycomyces [Table 2.11]
(Shaw 1965; 1966; 1966). The lower fungi are sometimes known collectively as
the phycomycetes order but are more correctly classified into two subgroups;
Mastigomycotina and zygomycotina, with members of both groups producing
GLA in their lipids. Interestingly in recent years it has been reported that
organisms like protozoa, marine and fresh water algae, bacteria, and higher fungi
also produce GLA (Aggelis 1996; Barcaly et al. 1994; Dyal & Narine 2005;
Gosselin 1989; Hirano et al. 1990; Patnayak & Sree 2005; Ratledge 2004).
Table 2.11 Phycomycets screened for GLA production
Absidia
Basiodiomycees
Chaoenephora
Cunninghamella
Delacroixia
Entomopthora
Mortirella
Mucor
Phlyctochytrium
Phycomyces
Pythium
Rhizopus
zygorrinchus (Source: Ratledge 1992a; 2004)
With the reports on occurrence of GLA in fungal microorganisms, it was
attractive to consider a biotechnological route for its production (Ratledge 1993;
2003).
v The criteria used to evaluate GLA producing organisms in screening process are as follows;
v The organisms should grow readily in submerged fermentation. It should not create any problems for extensive filamentous growth or pellet formation.
v It should have extractable oil not less than 20% of the biomass. v It should have a GLA content of the total fatty acids near to 20% and
above. v The oil should be over 90% triacylglycerol. v The organisms should not have any toxic substances or no records of any
causing allergic reaction or toxicity. v The organisms should grow at room temperature or above since the low
temperature is cost effective for large scale production.
PDF created with pdfFactory Pro trial version www.pdffactory.com

49
There are many reports on fungal species and strains producing lipid and a
few important GLA producers. These are shown in Table 2.12. Oleaginous fungi,
especially zygomycetes have been recognized as candidate producers of PUFAs
with high value (Certik et al. 1997; Kavadia et al. 2001; Kennedy et al. 1993;
Komaitis et al. 2001). So far, only members of the lower fungi belonging to the
order Mucorales are found to be promising GLA producers especially Mortierella
spp. Mucor spp., Rhizopus spp. and Cunninghamella spp (Bandyopadhyay et al.
2001; Emelyanova 1997; Kennedy et al. 1993; Papanikolaou et al. 2004a; 2007;
Torlanova et al. 1992). Two large-scale processes have been developed for the
commercial production of GLA from Mortierella isabellina and Mucor javanicus
(Ratledge & Wynn 2002). As fatty acids and lipids are growth-associated
metabolites, many researches have attempted to search for new strain and
optimized the culture conditions to improve the yield of microbial oils rich in
GLA (Ahmed et al. 2006; Dyal et al. 2005; Hiruta et al. 1996; Lindberg &
Hansson 1991; Somashekar et al. 2002). Since microbial production has certain
advantages over plant tissue and algal cultures, most researches have been
directed towards this development.
Table 2.12 Oleaginous fungus producing GLA in the dry mycelium
Fungus GLA (%)
Mucor javanicus 9.00 Mortierella isabellina 9.20 Mucor cercinalooides 10.00 Cunninghamella. Echinulata 8.90 Mucor japonica 10.20 Conidiolbolus 7.70 Mortierella ramanniana 10.20 Mucor inaquiporus 9.80 Mucor hiemalis 8.80 Rhizopus oryzae 8.00 Absidia 7.90 Mucor genevensis 18.00 Mucor mucedo 15.4 Mucor racemosus 17.9 Rhizopus stolonifer 15.4 Mucor rouxii 19.4
(Source: Dyal et al. 2005; Ratledge 2003)
PDF created with pdfFactory Pro trial version www.pdffactory.com

50
POTENTIAL SOURCES OF GLA
The knowledge of microbial biotechnology has advanced rapidly and this
has opened up new possibilities for production of PUFAs by recombinant
technology (Gill & Valivety 1997; Napier et al. 2004; 2005). Oleaginous
microorganisms are attractive because of their high oil productivity. Also, well-
established methods exist for commercial recovery of the oil (Dyaneswar 2006;
Ratledge 1993). Thus, the genetic modification of microbes and oilseed crops to
produce PUFAs is an attractive opportunity to produce GLA in high percentage in
lipid biotechnology (Gill & Valivety 1997; Khoomrung et al. 2007; Ratledge
1993). Research on microbial PUFAs production was basically aimed at
improving economic competitiveness of microbial lipids compared to plant and
animal-derived lipids. Emphasis was placed on screening for more efficient
strains, increasing the product value, using inexpensive substrates, and reducing
the processing steps necessary for lipids recovered from the cells (Dyal & Narine
2005; Gema et al. 2002; Jang et al. 2000; Jangbua 2009; Jeennor et al.
2006; Papanikolaou et al. 2007).
MUCOR SPECIES
The species of Mucor continue to be the focus of study by a considerable
number of microbiologists and mycologists with wide application in both basic
and applied areas of biological research (Funtikova 2002; Orlowsky 1991). Mucor
spp. are generally highly saprophytic and proteolytic, resulting in their ubiquitous
presence in wide variety of substrates (Michinaka 2003; Orlowsky 1991).
The genus Mucor belongs to the order Mucorales within the class
Zygomycetes (phylum Zygomycota). This order also includes the genera Rhizopus
and Mortierella. Generally, fungi within this order are best known as saprophytes
which favor simple sugars as opposed to more complex molecules. Organisms
that implement a selected growth strategy have quick generation times that
involve rapid growth, absorption of sugars, and proliferation. In addition to this
PDF created with pdfFactory Pro trial version www.pdffactory.com

51
rapid cycle of growth and proliferation, the fatty acid profiles obtained from some
Mucor, Mortierella and Rhizopus spp.have been found to have relatively high
EFAs contents when compared to current industrial sources like evening primrose
and borage seed oil (Carter 1988; Emelyanova 1997; Weete et al. 1998; Ward
1995; Yamada et al.1992). Furthermore, research has shown that the growth
conditions of these fungi can be manipulated to give higher yields of specific
EFAs.
Property of dimorphism, one characteristic which makes Mucor spp.
distinct from other zygomycetes. Differential hyphal morphologies, mainly
associated with the production of arthrospores, sporangispores or zygospores,
only those that can grow in the form of spherical multipolar budding yeasts are
referred to as dimorphic (Botha et al. 1997; Da Silva 2003; Orlowski 1991; Pohl
1997). Mucor sp. which show dimorphic characteristic includes M. racemosus, M.
rouxii, M. genevensis, and M. bacilliformis. Other Mucor spp. like M. miehei, M.
pusillus, M. ramannianus M. mucedo and M. hiemalis show monomorphic
characteristic (Orlwosky 1991).
Metabolites produced from Mucor spp. have potential uses in food
industry. These organisms are commonly used to produce wines fermented from
rice in the orient and for the production of ethylaclohol in Europe (Orlowski
1991). Starins of Mucor have been used to produce sufu, tempeh (fermented
soyabean food products), alpha amylase, fusidic acid and proteolytic enzyme
rennin used in cheese making. Mucor spp. are also associated with the retting of
flax and hemp, and decomposing of leathers (Botha et al. 1997; Orlowsky 1991).
Mucor spp. are most important in genetic studies on mating types (sexual
reproduction) and regulatory mechanisms at the molecular level. The elucidation
of zygospore formation and involvement of trisporic acid have been studied well
in the M. mucedo. M. racemosus has been employed to study the relationship
between overall cellular growth rate, protein synthesis, ribosome function, and
PDF created with pdfFactory Pro trial version www.pdffactory.com

52
amino acid synthesis during starvation. M. rouxii has been used very well to study
the role, regulation of chitinase synthesis in cell wall (Orlowsky 1991)
Mucor spp. in GLA production
Mucor spp. are the main organisms for the production of lipids rich in GLA
and other PUFAs. Comparisons of total lipid fractions in M. genevensis and M.
rouxii had much higher levels of sterols than yeast. Study of growth conditions is
an approach toward better understanding of fatty acid metabolism and the role of
fatty acids in cell growth and development of M. rouxii (Certik et al., 1997;
Conti et al., 2001; Lindberg & Hansson, 1991).
M. rouxii, which is a non-pathogenic dimorphic fungus, is able to alternate
its morphology between yeast-like and filamentous forms depending on its
environment (Orlowski 1991; Certik et al. 1991; Michninaka et al. 2003). Most
work involving fatty acid synthesis has been done on the mycelial form of Mucor
(Botha et al. 1997; Emelyanova 1997; Hasson & Dostalek 1988; Somashekar et
al. 2002). During fermentation, the high biomass of the mycelia limits oxygen and
nutrient transfer. The control of cell morphology is therefore required to achieve
good bioreactor performance for GLA production. With the advance of its
morphogenesis, the yeast-like cells of M. rouxii are thought to be a candidate for
developing an efficient GLA production process commercially. Since fatty acids
are generally required for cell growth, development and response to
environmental conditions (Botha et al. 1997; Da Silva et al. 2003; Khunyoshyeng et
al. 2002), several factors which induce the formation of the yeast like cells of M.
rouxii, may have an effect on its fatty acid composition and lipid content. It has
been reported that the intracellular fatty acids of this fungus are mainly C16 and
C18 acyl chains (49.0% of total fatty acids) with a substantial proportion of
unsaturated fatty acids (Laoteng et al. 1999). Interestingly, the accumulation of
relatively high levels of GLA has also been found in M. rouxii (Hansson et al.
1989). However, different fatty acid profiles have been found during growth and
development of spores and mycelium (Jeennor et al. 2006; Khunyoshyeng et al.
PDF created with pdfFactory Pro trial version www.pdffactory.com
53
2002; Laoteng et al. 1999; Mysyakina & Funtikova 2003). The GLA proportion
was highly concentrated in sporangiospores (Khunyoshyengb et al. 2002;
Mysyakina & Funtikova 2003) and at early stages of mycelial growth in M. rouxii
(Laoteng et al. 1999). Reduced GLA content was found in association with an
increase of oleic acid (C18:1, ω9) at the late logarithmic, stationary phases and
also in the cells exposed to nutrient and oxygen limitations. Similar to other
microorganisms, variation in culture conditions, such as medium composition,
temperature and gas supply, highly influences the growth and fatty acid profiles of
M. rouxii (Jeennor et al. 2006; Laoteng et al. 1999; Serrano et al. 2001). However,
the feasibility of GLA production in large-scale fermentation should also be
considered. Widespread interest in GLA for dietary and pharmacological uses has
inspired numerous research groups to keep on searching for particularly effective
fungal strains and developing optimal conditions for its production. In addition,
GLA is the end product of PUFAs in Mucor sp., which differs from other
Mucorales fungi, such as Mortierella sp. However, the production of microbial
oils is so far not cost-competitive to the plant sources. Due to ability of the fungal
cells to produce extracellular enzymes, such as saccharolytic and proteolytic
enzymes, this fungus can use a wide range of substrates in either liquid or solid
forms (Jangbua 2009). Moreover, some agricultural byproducts are being used as
feed component for animals and fish. Therefore, the agricultural by-products
derived from some factories, such as soybean meal, spent malt grain, orange peel,
apple pomace, tomato waste hydrolysate, wheat bran, rice bran and cereals were
also subjected to the fungal fermentation in order to introduce a cost-attractive
process (Chen et al. 1999; Fakas et al. 2008; Gema et al. 2002; Papanikolaou et al.
2007; Stredansky et al. 2000).
GLA BIOSYNTHESIS AND ∆6 -DESATURASE
GLA is synthesized from linoleic acid by the action of a ∆6 -desaturase in
both prokaryotes and eukaryotes. GLA represents the first product on the ω-6
PUFAs pathway [Fig. 2. 5]. Once formed, GLA is rapidly elongated to DGLA, by
PDF created with pdfFactory Pro trial version www.pdffactory.com
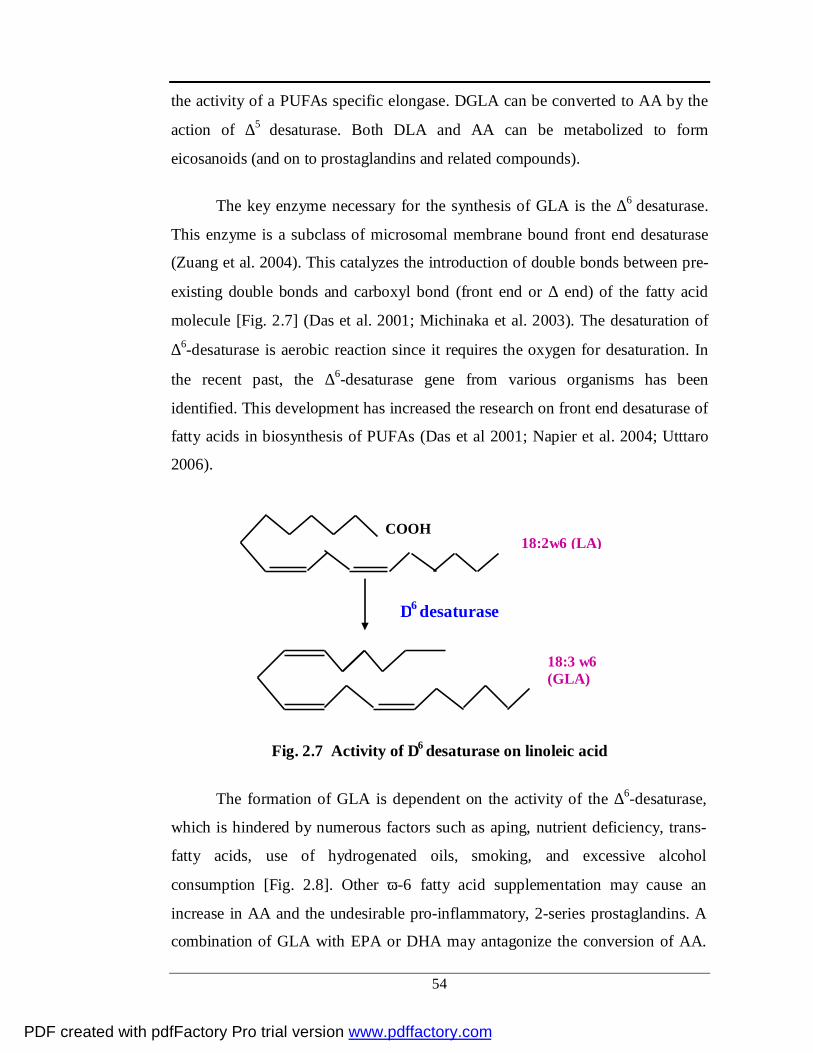
54
the activity of a PUFAs specific elongase. DGLA can be converted to AA by the
action of ∆5 desaturase. Both DLA and AA can be metabolized to form
eicosanoids (and on to prostaglandins and related compounds).
The key enzyme necessary for the synthesis of GLA is the ∆6 desaturase.
This enzyme is a subclass of microsomal membrane bound front end desaturase
(Zuang et al. 2004). This catalyzes the introduction of double bonds between pre-
existing double bonds and carboxyl bond (front end or ∆ end) of the fatty acid
molecule [Fig. 2.7] (Das et al. 2001; Michinaka et al. 2003). The desaturation of
∆6-desaturase is aerobic reaction since it requires the oxygen for desaturation. In
the recent past, the ∆6-desaturase gene from various organisms has been
identified. This development has increased the research on front end desaturase of
fatty acids in biosynthesis of PUFAs (Das et al 2001; Napier et al. 2004; Utttaro
2006).
Fig. 2.7 Activity of ∆6 desaturase on linoleic acid
The formation of GLA is dependent on the activity of the ∆6-desaturase,
which is hindered by numerous factors such as aping, nutrient deficiency, trans-
fatty acids, use of hydrogenated oils, smoking, and excessive alcohol
consumption [Fig. 2.8]. Other ω-6 fatty acid supplementation may cause an
increase in AA and the undesirable pro-inflammatory, 2-series prostaglandins. A
combination of GLA with EPA or DHA may antagonize the conversion of AA.
COOH 18:2ω6 (LA)
18:3 ω6 (GLA)
∆6 desaturase
PDF created with pdfFactory Pro trial version www.pdffactory.com

55
These effects will be more favourable with an increase in anti-inflammatory and
antithrombotic effects (Huang & Ziboh 1997; Napier et al. 2004; 2005; 2006;).
Fig 2.8 Omega-6 pathway and inhibitors of GLA synthesis
Characteristic of ∆6-desaturase enzyme
Front end desaturases are fatty acids either esterified to glycerolipids or to
CoA depending on the availability of the substrate in different organisms (Das et
al. 2001; Na-Ranong et al. 1994; Tocher et al. 1998;). In Cyanobacteria the ∆6-
desaturase is believed to be esterified on C18 at Sn-1 in the thylakoids membrane
and desaturation occurs to link to monogalactosyl diacylglycerol. In lower
eukaryotes like fungi, the fatty acids are linked to phospholipids. In higher plants
only on C18 chains on both Sn-1 and Sn-2 in the endoplasmic reticulum mainly
linked to phosphatidylcholine (Ratledge & Wynn 2002). While in animals, ∆6-
desaturase generally utilizes the CoA linked substrates in the endoplasmic
reticulum (Na-Ranong 1994; 2006; Tocher et al. 1998; Uttaro 2006). The ∆6-
desaturation step has been found to be the rate limiting step in the metabolic
pathway of the ω-6 and ω-3 pathway i.e. LA and ALA to AA and EPA
respectively ( Das et al 2001; Uttaro 2006).
γ-Linolenic acid (18:3)
Anti-inflammatory metabolites
Linoleic acid (18:2)
Dihomo-γ-linolenic acid
Inhibitors:
Aging Diabetes Cholesterol Alcohol Eczema Deficiencies
Anti-inflammatory metabolites
Linoleic acid (18:2)
Dihomo-γ-linolenic acid
Inhibitors:
Aging Diabetes Cholesterol Alcohol Eczema Deficiencies
Anti-inflammatory metabolites
Linoleic acid (18:2)
Dihomo-γ-linolenic acid
Inhibitors:
Aging Diabetes Cholesterol Alcohol Eczema Deficiencies
Anti-inflammatory metabolites
Linoleic acid (18:2)
Dihomo-γ-linolenic acid
Inhibitors:
Aging Diabetes Cholesterol Alcohol Eczema Deficiencies
PDF created with pdfFactory Pro trial version www.pdffactory.com

56
Identification of ∆6-desaturase in fungi
Fungal ∆6 -desaturase has been identified from M. alpine and M. rouxii
(Huang et al. 1999; Laoteng et al. 2000). The predicted proteins showed all the
characteristics of microsomal membrane bound, front end fatty acid desaturase.
The M. alpine ∆6 desaturase has been functionally expressed in yeast (S.
cereveceae) as well as fungi (A. oryzae) (Huang et al. 1999; Sakuradani et al.
1999) and pnats (brassica juncea) (Huang et al. 2002). M. rouxii ∆6 desaturase
differs from that of M. alpine and other fungus, it is larger and more similar to
plant ∆6 desaturase than to fungal or animal ∆6 desaturase. It contains a unusual
histidine rich motif ‘HKHHSH’ down stream of cytochrome b5 domain, lying
within the region of amino acid sequence that is absent in other ∆6 desaturases.
This region is thought to be essential for enzyme activity (Michinaka et al. 2003;
Na-Ranong et al. 2006; Sakuradanai et al. 1999; Zhang et al. 2004). The reaction
involves a microsomal membrane bound, cytochrome b5 reductase and fatty acid
desaturase (Uttaro 2006). ∆6 desaturases also studied in borage, nematode, rodents
and animals (Aki et al. 1999; Napier et al. 1998; Sayanova et al. 1997). ∆6
desaturase from M. cercinelloides showed substrate specificity, i.e it acts only on
glycerolipid-linked LA (Kendrik & Ratledge 1992a).
∆6 desaturase gene from M. alpine has been functionally expressed in
mammalian cells resulted in an increase in the endogenous levels of DGLA and
AA (Das 2004). Functional expression of the M. alpine and Mucor rouxii
desaturase gene showed their viability in plants, generating oilseeds rich in
PUFAs. In Brassica napus both ∆12 and ∆6 desaturase genes co-expressed from
M. alpine. These genes expressed simultaneously and resulted in the accumulation
of GLA in the transgenic canola oil (Lopez & Gracia 2000; Napier et al. 2006;
Pereira et al. 2003). M. alpina is a fungus that can produce large amount of C20
PUFAs, upto 40-70% AA, depending on the strain. Intermediates in the pathway
such as LA, GLA, DGLA presence indicates that Mortierella sp. express
substantial amount of ∆6-desaturase activity along with ∆12 and ∆15 desaturase
PDF created with pdfFactory Pro trial version www.pdffactory.com

57
(Hunag et al. 1999; Sakuradani et al. 1999) However, the complete enzymology
of Mortierella spp. has been going on to study desatursase system for
biotechnological application (Certik & Shimizu 1999; Sakuradani et al.
1999).Therefore, through genetic modification it is possible to manipulate the
fatty acid biosynthesis pathway in vivo and ex vivo, to enhance the production of
PUFAs and their derivatives (Brown 2005; Napier et al. 2006).
Inhibitors of ∆6 -desaturase in Human
Ø High levels of carbohydrates in the bloodstream, which slow down ∆6-DES
activity and decrease GLA production;
Ø Trans fatty acids which inhibit ∆6-desaturase
Ø Viral diseases
Ø Elevated adrenaline (decreases ∆6-desaturase) and cortisol (due to stress)
levels which increase insulin levels and lead to excess arachidonic acid
production via activation of ∆5-desaturase enzyme. Since activation of ∆5-
desaturase depends on insulin, and insulin is balanced by glucagons (which
inhibits ∆5-desaturase), it is critical that insulin/glucogon levels are kept in
balance.
FUNCTIONS OF GLA IN HUMAN
Mechanism of GLA Action in human
GLA is metabolized to the 20-carbon polyunsaturated fatty acid DGLA,
which is cyclooxygenated to prostaglandin E1 (PGE1). Prostaglandin E1, exhibits
anti-inflammatory, antithrombotic, antiproliferative, and lipid-lowering potential
[Fig. 2.9]. It also enhances the activities by binding to surface receptors on smooth
muscle cells, increasing intracellular cAMP and vasodilation. In addition, EFAs
including GLA are important constituents of membrane phospholipids, including
the mitochondrial membrane, where they enhance the integrity and the fluidity of
the membrane (Berry 2001; Horrobin 1992; Westhuizen et al. 1994). GLA and
PDF created with pdfFactory Pro trial version www.pdffactory.com

58
DGLA are not normally found in the freestate, but occur as components of
phospholipids, triglycerides, neutral lipids, and cholesterol esters, mainly in cell
membranes. PGE1 is metabolized to smaller prostaglandin remnants--primarily
dicarboxylic acids. The majority of metabolites are excreted in the urine (GLA-
Monograph).
Fig. 2.9 Production of eicosanoids from PUFAs
EPA
Diet
GROUP3 Prostanoids PGD1 PGE1 PGF1 PGI3 TXA1 Leukotrienes LTA2 LTB2 LTC2
ALA
n-3
GROUP1 Prostanoids PGE1 PGF1 TXA1 Leukotrienes LTA2 LTC2 LTD2
LA
GLA
DGLA
GROUP2 Prostanoids PGD PGE1 PGF1 PGI3 TXA1 Leukotrienes Lipoxins LTA2 LXA LTB2 LXB LTC2 LXC LTE4 LXD EET5 LXE
AA
Diet
n-3
PDF created with pdfFactory Pro trial version www.pdffactory.com

59
The following are the major applications of GLA:
NUTRITIONAL USES OF GLA
The daily intake of LA can be converted into GLA and further elongated
and desaturated to produce long chain-PUFAs (LC-PUFAs). If an adult should
consume 5-20 g/day LA, then the conversion of GLA in endogenous will be 250-
10000 mg/day. Human breast milk contains 100-400 mg/L of GLA and DGLA. If
a baby consume 1L of milk then this suggests that the daily intake of
GLA+DGLA in a fully breast fed infant is of the order of 20-80 mg/Kg/day
(Horrobin 1992).
Infant Nutrition
A breast fed infant is presumably getting most of the nutrients, it requires
during the 6 months and so from small only. The artificial formulae confirm as
closely to the composition of human milk are being marketing in the recent years
(Horrobin 1992). Human milk is unusually rich in EFAs, by ∆6 -
desaturation body produced GLA, DGLA, AA, EPA and DHA in both the ω-6
and ω-3 series pathway (Das et al. 2001 a, b). Infants appear to lack sufficient ∆6-
desaturase activity and it is a rate limiting step in the PUFAs pathway (Fan &
Chapkin 1998). Whereas breast milk is high in GLA and DGLA, but infant
formula is lacking of these fatty acids. This can lead to a deficiency state in
formula-fed infants, particularly skim milk-based formula (Horobin 1992). In
order to assure normal development of brain, eyes, and other tissue, the human
infant need to consume these EFAs through diet. Sub clinical deficiency of EFAs
has been studied in pre-term and term infants. The fatty acid composition of
structural membrane lipids can impact membrane function by modifying overall
membrane fluidity, affecting membrane thickness, or by influencing the
interaction of fatty acids with membrane proteins. Changes in neuronal
membranes that affect membrane excitability have also been noted. The babies
fed with artificial formulae have lower activity of ∆6 desaturase in blood than the
PDF created with pdfFactory Pro trial version www.pdffactory.com
60
breast fed babies (Fan & Chapkin 1998). This support the limiting rate of ∆6
desaturase may be inadequate to support a babies needs if the only EFAs are
available in the food are LA and ALA. Therefore there is a strong
recommendation to add GLA and EPA in the preparation of infant formulae. The
toxicology studies on GLA obtained from EPO showed that it is an appropriate
source to add in the infant foods (Horrobin 1992; Wu et al. 1999). In Japan, Snow
Brand produces baby milk to which EPO has been added to provide GLA
(Horrobin 1992; Ratledge 1992a).
Ageing
In animal studies, evidence showed that the ability to ∆6-desaturation in old
animals and humans can be bypassed by supplementing GLA directly. When
GLA provided in the diet it not only bypasses the GLA route but it also enhances
the ∆6 desaturase indirectly. ∆6 desaturase also enhanced the ALA to Stearidonic
acid in n-3 fatty acids inturn produce EPA and DHA (Berry 2001; Fan & Chapkin
1998; Sakurandani et al. 1999; Uttaro 2006). After 60 years the formation and
activity of ∆6 desaturase will be reduced, when nutritionally supplementation in
the range of 125-500 mg/day brings up the supply of GLA available to the body to
normal (Huang & Ziboh 2001).
Stress
When the human being exposed to stress, adrenal hormones inhibit the
activity of ∆6 desaturase. In animal experiment it was demonstrated that GLA can
prevent stress induced blood pressure rises. Evidence showed that the formation
of GLA decreases during stress and supplementation of GLA in diet can attenuate
some of the consequences (Fan & Chapkin 1998; Uttaro 2006).
Poor diet
PDF created with pdfFactory Pro trial version www.pdffactory.com

61
Processed foods (junk foods) may contain trans fatty acids and also
isomers of LA which can inhibit the ∆6 desaturase activity. A poor diet may also
lead to elevated level of cholesterol which can also inhibit ∆6 desaturase. Some of
the junk foods may contain metallic ions like magnesium, calcium, zinc and
peroxide which acts as cofactors for EFAs metabolism. Such individuals may
benefit from supplementation of GLA in the diet (Horrobin 1992).
Alcoholism
Usually, high alcohol consumption depletes the formation of EFAs in
human body and inhibits desaturation of LA. Therefore, the person drinking too
much of alcohol, have deficiency of EFAs metabolism. So they should increase
the uptake of EFAs especially GLA (omega 6) in the diet (Berry 2001; Das 2004;
Horrobin 1992).
MEDICAL USES OF GLA
Some clinicians and preliminary research suggest using GLA as an
unusually low risk approach to the management of several diseases and is
attracting increasing interest in the pharmaceutical areas. EPO has very long
history of use for various diseases like skin diseases, eczema, well being of the
elderly. It contains EFAs especially GLA in substantial amount. It has been used
as quasi-medicinal use for centuries. It is also known as “king of cure all” and
thus recommended for use in a wide number of illness (Horrobin 1992; Moreton
1988). Traditional use of EPO has included parts of the whole plant, externally to
heal wounds and to soothe skin inflammation and internally to control coughs, as
a sedative, pain killer and diuretic. Historically, herbalists have claimed that the
consumption of borage leaves and flowers can treat depression, liver disorders,
kidney and bladder inflammation (Gill & Valivety 1997; Guil-Guerrero 2001a b;
Horrobin 1992).
Skin Diseases
PDF created with pdfFactory Pro trial version www.pdffactory.com

62
The first clinical use of EFAs was the curing effect of LA on skin
inflammation. GLA and DGLA are important structural components of the upper
skin (epidermal) layer which regulates moisture loss from the surface of the skin
(Horrobin 1992; Gill 1997). Membranes surrounding the cells of skin, GLA and
DGLA help in stabilizing the membrane and to reduce water loss from the surface
of the skin. Several early studies suggest that EPO (rich in GLA) was more
beneficial at relieving symptoms associated with skin conditions such as itching,
redness and scaling (Horrobin 1993; 2000). However, blood levels of GLA,
DGLA, and AA below normal indicating either reduced conversion of LA to GLA
(Horrobin 1993). The eicosanoids synthesized from AA, in particular
prostaglandins E2 (PGE2) and leukotrienes B4, are involved in inflammatory
reactions in the skin, and are in part responsible for the redness, pain, and intense
itching common in such conditions as atopic dermatitis (AD), eczema and
psoriasis in both children and adults (Belch & Hill 2000; James et al. 2000;
Johnson et al. 1997). Increased level of GLA in the diet enhances rate of
conversion of GLA to LC-PUFAs in the system. PGE1, on the other hand, shows
potent anti-inflammatory effects in the skin. PGE1 is also important for
maintaining healthy skin by regulating water loss and protecting skin from injury
and infection (Flieder, 2005; Horrobin 1993). In extensive research of EPO and
borage oil in eczema, randomised double blind, placebo, controlled trials have
been found to be of use in all features of the disease (Horrobin 1993). Finally in
view of the importance of EFAs in the skin, there is a possibility that GLA may a
role in the management of other skin disorders such as psoriasis and urticaria
(Horrobin 1992; 2003; Uttaro 2006)
Atopic Eczema
Atopic eczema is an inherited form of dermatitis that almost develops in
one year old babies. Patients with atopic eczema are more susceptible than normal
to viral infections and to allergic reactions of various types. They have abnormal
immune function (Horrobin 1993). Alterations in LA metabolism have been
demonstrated in atopic conditions such as eczema (Horrobin 1992). Conversion
PDF created with pdfFactory Pro trial version www.pdffactory.com

63
of LA to GLA is inhibited in individuals with atopic dermatitis (Horrobin 2003).
Studies revealed that use of GLA obtained from EPO and borage seed oil showed
improvements in eczema such as decreased inflammation and itching (Horrobin
2000; Van Gool et al. 2003).
In multicentric trials, 179 patients with atopic dermatitis were treated with
4 g of EPO daily. After 12 weeks, 62 % of patients demonstrated a significant
clinical response based on a standardized clinical assessment form (Steward et al.
1991). Infants with a maternal history of atopic skin disease received a borage oil
supplement (100 mg GLA) or placebo (sunflower oil) daily for the first six
months of life. Outcome was based on incidence and severity of atopic dermatitis
as well as total serum immunoglobulin E (IgE). Clinically, severity of atopic
dermatitis was decreased favourably in the borage-oil group, although atopy was
still present. Additionally, GLA had no effect on IgE levels during the first year
(Leu et al. 2004).
Diabetic neuropathy
Diabetics have been shown to require higher amounts of EFAs, specifically
GLA, because of impairments in ∆6desaturase activity, which result in reductions
in both GLA and DGLA levels in cell membranes ( 1993). DGLA is a major
constituent of nerve cells and is required for normal neuronal cell membrane
structure, normal regulation of nerve conduction, and for the release of
eicosanoids involved in nerve microcirculation (Berry 1997; Tapiero et al. 2002).
Diabetic neuropathy, a common complication of both insulin-dependent and non-
insulin-dependent diabetes mellitus, is a condition where nerves degenerate and
symptoms of pain and numbness follow (Berry 1997; Horrobin 1993; 2000).
There are multiple abnormalities of EFAs and eicosanoid metabolism in
diabetes because ∆6 desaturase activity is also impaired and there is block in the
conversion of DGLA to PGE1. Because of this reason diabetic patients need more
PDF created with pdfFactory Pro trial version www.pdffactory.com

64
EFAs than non-diabetics patients (Horrobin 1992; 1993; Pullman-Mooar 1990;
Puri et al. 2007; Tapiero et al. 2002). Supplementation of GLA from EPO or
borage or other sources may assist nerve function and help to prevent nerve
disease in diabetic patient (called peripheral neuropathy and felt as numbness,
tingling, pain, burning, or lack of sensation in the feet and/or legs). The
consistency of animal experiments, human studies and biochemical analyses
shows that GLA is likely to become a valuable treatment for diabetic neuropathy
(Das 2006).
The effects of GLA on the prevention and treatment of diabetic neuropathy has
been extensively studied. Patients receiving 360 mg GLA obtained from EPO showed
statistically significant improvement in a number of parameters of neuropathy over the
placebo control group (Horrobin 1993). Positive effects of GLA on diabetic neuropathy
in a study in which 84 patients received GLA (480 mg/day as 12 capsules of EPO) for
one year in randomized, double-blind, placebo-controlled parallel design. Sixteen
parameters (neurophysical, neurological and biochemical) were evaluated quarterly. For
all 16 parameters, the change over one year in response to GLA was more favorable than
the change with placebo. GLA had a beneficial effect on the course of diabetic
neuropathy, was not associated with important adverse events and may offer an advance
in the management of diabetic neuropathy (Das et al. 2001; Fan & Chapkin 1998).
Horrobin (1997) conducted a large scale trial on the beneficial effects of GLA on human
diabetic neuropathy, involving 400 patients supplemented with 480 mg/ day GLA in the
form of 6 g of EPO/day. It was reported that GLA supplementation improved a number
of parameters of neuropathophysiology. Clinical measurements of thermal threshold also
improved. These improvements increased over time from 3 to 12 months. In contrast, in
the placebo treated group, all parameters were negatively affected. After treatment was
continued for a second year, further improvements were noted in the GLA treated
patients. The mechanism responsible for the positive effects of GLA may be due to a
restoration of normal nerve conduction velocity.
Eye Disease
PDF created with pdfFactory Pro trial version www.pdffactory.com

65
GLA may be beneficial in dry-eye conditions such as Sjögren's syndrome
(a condition with symptoms of dry eyes, dry mouth, and, often, arthritis). Sjögren
syndrome is a common autoimmune, chronic inflammatory disorder that is often
associated with rheumatoid arthritis (Barham et al. 2000; Sharam et al. 2006).
Osteoporosis
Deficiency of EFAs including GLA and EPA, an ω-3 fatty acid can lead to
severe bone loss and osteoporosis. Studies have shown that supplements of GLA
and EPA together help maintain or increase bone mass (Horrobin 1992). EFAs
may also enhance calcium absorption, increase calcium deposits in bones,
diminish calcium loss in urine, improve bone strength, and enhance bone growth,
(Gill & Valivety 1997; Dyaneswar 2006).
GLA in Reproductive disorders
Breast pain and premenstrual syndrome (PMS)
Breast pain and PMS are related to disorders about 0-80% of women.
Breast pain and PMS are both usually relieved by the nature or induced
suppression of secretion of ovarian hormones. Abnormal sensitivity of breast and
other tissues in women prevents normal level of circulating hormones. Breast pain
and PMS are common in women with intake of fat which is more of saturated
fatty acids and less common in more unsaturated fatty acids (Horrobin 1992).
Clinical studies of the use of GLA in breast pain and PMS have shown that in
most cases GLA is more effective than placebo in relieving symptoms (Chenoy et
al. 1994). Studies on PMS, results suggested that some women were relieved their
PMS symptoms when GLA containing EPO supplement or other source like
borage (Fan & Chapkin 1998; Gill & Valivety 1997). The symptoms are breast
tenderness, feeling of depression, irritability and swelling, bloating from fluid
retention. Breast tenderness other than PMS may also improve with use of GLA
(Horrobin 1992).
PDF created with pdfFactory Pro trial version www.pdffactory.com
66
Inflammation and auto immune disorders
Chronic disorder of inflammation is always associated with the
immunological disorders. These disorders are associated with the activation of the
AA cascade and change in production of cytokines such as interleukins, necrosis
factors and the interferons. The studies showed that GLA is precursors to PGE1.
Prostaglandins (PGE1) was required to normal immune response at low
concentration but inhibited that immune response at high concentration (Herbige
et al. 1995; Horrobin 1992). PGE1 found to be an anti inflammatory in variety of
invitro systems and animal models by using GLA as a precursor of both PGE1
and of the other anti inflammatory metabolite 15-OH-DGLA (Fan & Chapkin
1998). This is has been demonstrated in in vivo and in vitro studies of
inflammation including adjuvants arthritis, experimental allergic
encephalomyelitis naturally according auto-immuno inflammatory disease,
Salmonella-associated arthritis and urate induced inflammation (Barham et al.
2000; Herbige 1995). Recent studies of only GLA administration to patient and
GLA along with EPA (fish source oil) has shown the same type of results in
rheumatoid arthritis (Belch & Hill 2000; Zurier et al. 1996; Ziboh & Fletcher
1992). Apart from this GLA has outstanding to side effects.
Rheumatoid Arthritis
Rheumatoid arthritis is one of the more common chronic diseases.
Conventional arthritis therapy treats the condition, but does not cure it.
Treatments used in rheumatoid arthritis usually include anti-inflammatory drugs
and corticosteroids which can lead to kidney and liver damage and gastrointestinal
problems. Some preliminary information indicates that GLA, from EPO, borage
oil, or black currant seed oil, may diminish joint pain, swelling, and morning
stiffness. GLA may also allow for reduction in the amount of pain medication
used by those with rheumatoid arthritis. Additional research would be helpful,
including testing a proposed theory that using GLA and EPA (an ω-3 fatty acid
from fish and fish oil) together would be helpful for rheumatoid arthritis [Table
PDF created with pdfFactory Pro trial version www.pdffactory.com
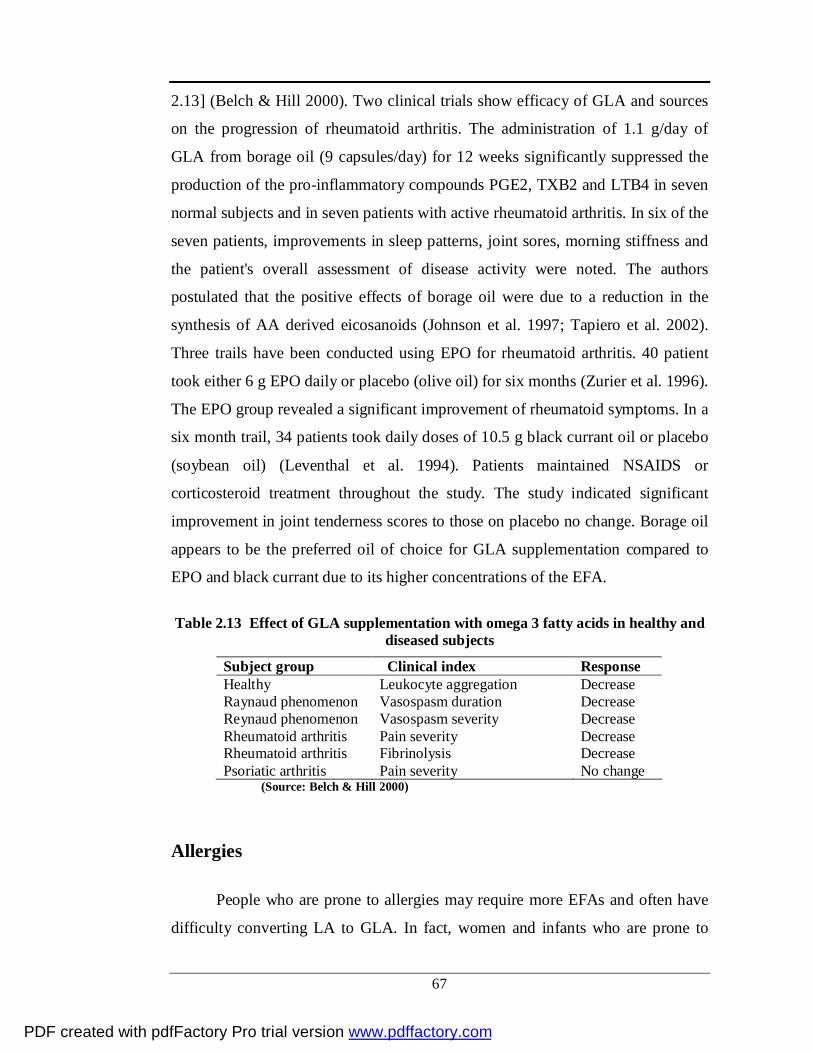
67
2.13] (Belch & Hill 2000). Two clinical trials show efficacy of GLA and sources
on the progression of rheumatoid arthritis. The administration of 1.1 g/day of
GLA from borage oil (9 capsules/day) for 12 weeks significantly suppressed the
production of the pro-inflammatory compounds PGE2, TXB2 and LTB4 in seven
normal subjects and in seven patients with active rheumatoid arthritis. In six of the
seven patients, improvements in sleep patterns, joint sores, morning stiffness and
the patient's overall assessment of disease activity were noted. The authors
postulated that the positive effects of borage oil were due to a reduction in the
synthesis of AA derived eicosanoids (Johnson et al. 1997; Tapiero et al. 2002).
Three trails have been conducted using EPO for rheumatoid arthritis. 40 patient
took either 6 g EPO daily or placebo (olive oil) for six months (Zurier et al. 1996).
The EPO group revealed a significant improvement of rheumatoid symptoms. In a
six month trail, 34 patients took daily doses of 10.5 g black currant oil or placebo
(soybean oil) (Leventhal et al. 1994). Patients maintained NSAIDS or
corticosteroid treatment throughout the study. The study indicated significant
improvement in joint tenderness scores to those on placebo no change. Borage oil
appears to be the preferred oil of choice for GLA supplementation compared to
EPO and black currant due to its higher concentrations of the EFA.
Table 2.13 Effect of GLA supplementation with omega 3 fatty acids in healthy and diseased subjects
Subject group Clinical index Response Healthy Leukocyte aggregation Decrease Raynaud phenomenon Vasospasm duration Decrease Reynaud phenomenon Vasospasm severity Decrease Rheumatoid arthritis Pain severity Decrease Rheumatoid arthritis Fibrinolysis Decrease Psoriatic arthritis Pain severity No change
(Source: Belch & Hill 2000)
Allergies
People who are prone to allergies may require more EFAs and often have
difficulty converting LA to GLA. In fact, women and infants who are prone to
PDF created with pdfFactory Pro trial version www.pdffactory.com

68
allergies appear to have lower levels of GLA in breast milk and blood.
Supplements, such as GLA from EPO or other sources, have an ancient history of
folk use for allergies. The supplement improves symptoms, may be vary with
individuals (Horrobin 1992; 1993).
Attention Deficit/Hyperactivity Disorder (ADHD)
Studies on supplying GLA from EPO or other sources to children with
ADHD, however, have been mixed and, not conclusive. Research to date has
suggested that an improvement in symptoms and behaviours related to ADHD
from supplements of n-3 fatty acids (Richardson 2000). In the meantime, ensuring
a healthier balance of ω-3 to ω-6 fatty acids in the diet seems worthwhile for those
with this behavioral condition (Carter 1988; Clader 2001). In children with
borderline zinc status, EPO can improve or compensate for a mild deficiency,
possibly because zinc is a cofactor in the conversion of LA to GLA (Horrobin
1992)
Cancer
Studies have being carried out about the relationship between ω6 fatty
acids to cancer. While ω3 fatty acids such as LA and AA were showed to promote
cancer in studies of colon, breast, and other cancers, but GLA has showed some
benefit for breast cancer in certain studies (Clader & Zurier 2001; Flieder 2005;
Kankaapaa et al. 2001). GLA had showed promise in the treatment of cancer, both
as a cytotoxic agent and as an adjunct to chemotherapy. In the treatment of breast
cancer, GLA, when used in combination with tamoxifen, was found to down-
regulate estrogen receptor expression, both in an animal (Kenny et al. 2001) and
clinical (Kenny et al. 2000) trials. Additionally, animal studies have showed that
GLA, specifically from borage oil, can inhibit a mammary tumorigenic response
by increasing the activity of ornithine decarboxylase in mammary tumors. (Bunce
et al. 1990) In vitro studies demonstrate various EFAs, particularly GLA, can
enhance the effect of paclitaxel, a chemotherapy drug used for breast and ovarian
PDF created with pdfFactory Pro trial version www.pdffactory.com

69
cancers (Plumb et al. 1993; GLA-Monograph). In a small trial on human gliomas,
a moderate improvement in patient survival was observed after 1 mg GLA was
administered via cerebral reservoir for seven day (Das 2004). GLA also
demonstrated a synergistic effect with gemcitabine against pancreatic
adenocarcinoma cell lines (Horrobin 1993). Intravesicular GLA has been shown
to be cytotoxic in superficial bladder cancer, with a response rate of 43 %,
demonstrating a cytotoxic effect against transitional cell carcinoma (Das 2004).
The safe and best way to reduce the cancer is to have a diet with proper balance of
ω-3 to ω-6 fatty acids starting from a young age (James et al. 2000; Flieder 2005).
Weight Loss
A study suggests that if the supplement is going to work, it does so mainly
for overweight individuals for whom obesity runs in the family. In addition, a few
other small studies suggest that the more overweight, the more level of borage oil
helps in reduction of weight in obese person (Horrobin 1992).
High Blood Pressure and Heart Disease
Four major factors involved in increasing risk of both coronary heart
diseases (CHD) namely elevated level of cholesterol, elevated level of
triglycerides, hypertension and enhanced platelet aggregation (plaque formation in
blood vessel), and the fifth factor is diabetes. All these factors seem to be
associated with the effect of each other risk factors. High cholesterol level inhibit
the ∆6 desaturase activity, supplementation of GLA bypasses the GLA synthesis
and produces other LC-PUFAs which inturn produce leukotrienes, thromboxanes
and prostaglandins series (Das 2007; Demaison & Moreau 2002). Dietary
supplementation with GLA alone yielded variable results on circulating lipid
levels (Horrobin 1992; Fan & Chapkin 1998). Animal studies suggest that GLA,
either alone or in combination with two important ω-3 fatty acids such as EPA
and DHA both found in fish and fish oil, may lower the plasma lipids (Laidlaw &
Holub 2003; Tadaka et al. 1994; von Schacky 2000). Both animal and human
PDF created with pdfFactory Pro trial version www.pdffactory.com

70
studies suggest that GLA, DGLA and EPA have been found to be effective in
inhibiting platelet aggregation (Guivernau et al. 1994; Laidlaw & Holub 2003;
Tadaka et al. 1994). DGLA enhances the conversion of EPA to PGE13, while
EPA enhances the conversion of DGLA to PGE1(Clastro et al. 2007; Laidlaw &
Holub 2003).
Atherosclerosis
Studies suggested that plaque formation in the blood vessel lead to block
the flow of blood and tissue becomes functionless this can be prevented by the
supplementation of GLA alone and also combination with EPA (Das 2006; 2007;
Leng et al. 1998).
Another study evaluating people with peripheral artery disease blockage in
the blood vessels in the legs from atherosclerosis [plaque] causing cramping pain
when supplementation of EPA and GLA in combination releases the pain and it
prevents the formation of plaque (Das 2007). GLA alone may not be the
conferring the benefit at all but the ω-3 fatty acids, such as EPA, DPA and DHA
are better known for improving blood pressure and the risks for heart disease, may
be individually or combination responsible (Fan & Chapkin 1992; Demaison &
Moreau 2002; Tadaka et al. 1994). Studies on 32 women of ages 36-68, assessed
the effects of different combinations of EFAs on serum lipids. Received either 4 g
EPA + DHA: 4 g EPA + DHA plus 1 g GLA (4:1): 4 g EPA + DHA plus 2 g GLA
(4:2): or 4 g EPA + DHA plus 4 g GLA (4:4) daily for 28 days. At the end of the
28-day period, the ratio of total-to-HDL cholesterol was significantly reduced in
all four groups, by 11-, 9.6-, 14-, and 14.7%, respectively. Mean group reductions
in LDL:HDL ratios from days 0-28 were statistically significant in the 4:1-, 4:2-,
and most dramatically in the 4:4 group, with a 19.9 % reduction. Triglyceride
concentration was most predominantly lowered in the 4:2 groups. The study
demonstrated a combination of GLA and marine oils may be beneficial in
improving lipid profiles (GLA-Monograph).
PDF created with pdfFactory Pro trial version www.pdffactory.com

71
Ulcers
Very preliminary evidence from test tube and animal studies suggest that
GLA from EPO may have anti-ulcer properties ( 1992). Further studies are needed
to treat people with GLA, stomach or intestinal ulcers or gastritis (inflammation
of the stomach).
Acute Respiratory Distress Syndrome
The anti-inflammatory mechanism of GLA has successfully been evaluated
in treating critically ill patients suffering with acute respiratory distress syndrome.
Results of a randomized, double-blind, controlled, multicentre trial found that,
nutrition supplemented with EPA, GLA, and antioxidants significantly reduced
pulmonary neutrophil recruitment and inflammation compared to a control diet
(Zurier et al. 1996). The EFAs and antioxidants also benefited the amount of gas
exchange, requirement for mechanical ventilation, length of intensive care unit
stay, and reduction of new organ failure (Uttaro 2006).
Asthma
A randomized, double-blind, placebo-controlled trial in patients with mild-
to-moderate asthma examined the effectiveness of supplementing an EPA/GLA
combination to stimulate leukotriene biosynthesis. No other clinically significant
changes were noted in four weeks, suggesting the need for longer patient follow-
up (GLA-Monograph; Ziboh & Fletcher 1992).
Antimicrobial Activity (Infections)
Immune Booster. GLA production decreases with viral infection or illness.
Supplementing with GLA helps safeguard immune defenses (Horrobin 1992).
Human viral infections are associated with reduced levels of LA and even further
PDF created with pdfFactory Pro trial version www.pdffactory.com

72
reduced levels of LA metabolites, indicating reduced LA desaturation. Since PGs
seem to be required to allow interferon’s to exert its antiviral effects, a strategy of
inhibiting LA desaturation may be a part of viral strategy of blocking host
defenses. A reduced supply of PG precursors, DGLA and AA would reduce a
cells ability to respond to interferon in defending against viral attack. When GLA
along with EPA supplemented in AIDS has shown important degrees of
improvement both in symptoms and in CD4 lymphocytes levels. When GLA with
EPA was given to chronic fatigue sufferers, their symptoms improved
dramatically (Uttaro 2006).
The studies on GLA in vivo, is not only the gatekeeper to our health, but to
our appearance as well. It actually increases cell resilience and moistens the fatty
layer beneath the skin, delivering a multitude of beautifying benefits such as:
• Producing a dewy complexion
• Aiding collagen loss
• Soothing dry, scaly skin
• Combating wrinkles
• Nourishing straw-like hair
• Strengthening brittle nails
• Helping to prevent dandruff
• It reduces the tendency of blood platelets to aggregate and thereby reduces
the risk of blood clots
• It expands contract blood vessels, which may alleviate pains associated
with angina pectoris (Angina)
• It expands the respiratory passages, prevents mucous formation, infections
and asthma attacks
• It reduces cholesterol production
• It reinforces the effects of insulin
• It improves the activity of the immune system (primarily via its influence
on the T-Lymphocytes)
PDF created with pdfFactory Pro trial version www.pdffactory.com
73
• Disorders in the central nervous system: in schizophrenia and disseminated
sclerosis the patient often has abnormally low PGE1 levels
• For hangovers and other withdrawal symptoms after excessive alcohol
consumption
• Alcoholic liver damage
• Chest pains, aches and fluid build ups (Oedema)
• Menstrual pains caused by increased activity of harmful prostaglandins
• Premenstrual tension
• Hyperactivity in children
GLA acts as a health promoter, beautifier, and hormone balancer. Because
of all this importance now days GLA is one of the giant nutrient
(Source;thttp://www.myhealthsense.com/;
http://www.fatsforhealth.com/index.php
OLEAGINOUS MICROORGANISMS AND SINGLE CELL OIL (SCO)
Lipid-producing organisms have been known for many years. Oleaginous
microorganisms are defined as organisms that contain more than 25% of their dry
biomass in the form of lipids (Ratledge 1988; Murphy 1991; Dyal & Narine
2005). Yeasts, molds, bacteria and algae are considered as potential interest in
production of speciality lipids [Table 2.14]. Oil obtained from microorganisms
PDF created with pdfFactory Pro trial version www.pdffactory.com

74
has been considered as single cell oil (SCO) because it synthesizes the oils with
high purification and less expensive than agricultural and animal sources (Certik
& Shimazu 2003; Ratledge 2003; Cohen & Ratledge 2005 ). The term single cell
oil formulated by Ratledge as an obvious parallel to the term Single Cell Protein
(SCP, i.e. production of edible protein in the form of microorganisms) (Moreton
1988). The term SCO was similarly meant to define edible oils being produced by
unicellular organisms and allowed their use for consumption without specifically
mentioning that they were derived from microorganisms (Davies 1992; Ratledge
1988). Research has shown that some moulds can store up to 80% of their
biomass as lipids (Dyal & Narine 2005; Ratledge 2002). Increasing demand for
commercially valuable lipids has resulted in production of PUFAs for health and
dietary applications (Dyanshwesar et al. 2002; Gill & Valivety 1997; Johnson et
al. 1997; Simonopoulos 1991).
Lipids obtained from moulds i.e. eukaryotic strains of microorganisms are
similar to the plants lipid which contain mainly C16 and C18 fatty acids esterified
in the form of TG (Ratledge 1994; 2002). The scheme obtaining for SCO from
oleaginous microorganism is shown in the Fig. 2.10. Remarkable diversity of fatty
acids occurs in the microbes shown in Table 2.15
Table 2.14 Oleaginous microbial sources for speciality lipid production
Microorganisms Speciality lipids Resemblance Apiotrichum curvatum (yeast) Oleic acid, palmitic acid,
stearic acid and linolenic acid Cocoa butter
Aspergillus niger (mold) Oleic acid and unsat-urated fatty acids
Groundnut
Aspergillus sp. (mold) Oleic acid and unsat-urated fatty acids
Seed fat of Meduca latifolia
PDF created with pdfFactory Pro trial version www.pdffactory.com

75
A. sydowii (mold) Oleic acid Groundnut Bacillus subtilis (Marine bacteria from Aurora globostellata marine sponge)
γ-Linolenic acid, eicosapentaenoic acid and branched chain fatty acids
-
Crypthecodinium cohnii (microalga)
Docosahexaenoic acid -
Fusarium oxysporium (mold) Saturated and unsaturated fatty acids
Groundnut
F. equisetti (mold) Saturated fatty acid Palm oil Mucor circinelloides (mold) γ- Linolenic acid - Mortierella alpine (mold) Arachidonic acid - Pseudomonas sp. (Marine bacteria from Heteronema erecta marine-a sponge)
γ- Linolenic acid -
Schizochytrium sp. (mold) Docosahexaenoic acid - (Source: Certik & Shimizzu 1999; Leonard & Theoblad 2006)
Fig. 2.10 Scheme of single cell oil process
Table 2.15 Selected Micro organisms for polyunsaturated fatty acid production
PUFA formation PUFA Strain TL/DCW
(%) % in oil % in DCW g/L
GLA M. ramanniana M. isabellina M. cercinelloedes
50 53 20-25
17.6 4.5 15-18
8.9 2.2 ND
5.5 3.4 ND
Biomass Production
Oil Recovery
Cell Separation
Oil Purification
PDF created with pdfFactory Pro trial version www.pdffactory.com

76
M. rouxii 20-40 2.3 DGLA C. nanodes
M. alpina M. alpina
34 45 50
24.3 18.3 26.8
6.2 10.7 20.5
1.6 2.6 4.1
AA M. alpina M. alpina
45 44
42 50
22 23
13.0 11.1
ETA M. alpina M. alpina
30 26
26 37
7.7 9.7
1.6 2.3
EPA M. alpina M. alpina M. elongata P. ultimum
55 32 ND 18
12 20 15.1 20
6.7 6.4 ND 3.4
1.9 1.0 0.6 0.4
DPA Schyzochytrium SR21
53
7.4 4.8 1.0
DHA Schyzochytrium SR21 C. cohini T. roseum
70 60 23
37.3 39 48.8
26.2 25.0 11.7
15.5 8.0 2.0
18:2 n9 M. alpina M. alpina
40 40
14 16
6.0 6.3
1.1
20:2 n9 M. alpina 44 25 11.0 1.7 MA M. alpina 43 33 14.1 1.9
(Source: Certik & Shimazu 1999)
PATTERN OF LIPID ACCUMULATION IN OLEAGINOUS MICROORGANISM
The crucial importance for the future development of SCO process is the
understanding of the mechanism of fatty acids synthesis and accumulation of
higher oil content in the mycelium of microorganisms (Ratledge 2004).
Oleaginous microorganisms are able to grow on fats, accumulate lipids during
cellular growth, regardless of the nitrogen concentration in the medium. However,
after the depletion of carbon source from the culture medium, oleaginous
microorganisms degrade reserve lipids for maintenance purpose and production of
new cell material (Aggelis & Sourdis 1997; Holdsworth & Ratledge 1988b).
Therefore, the process of lipid synthesis-degradation is regulated by extra-cellular
fat concentration: high extra-cellular fat concentration inhibits cellular oil
degradation. However, the biotransformation of the storage lipid to protein also
depends on the availability of some other nutrient essential for microbial growth,
such as nitrogen. Since accumulation of cellular oil from fat occurred in the first
steps of microbial growth, independently of the nutrient starvation, the microbial
culture rapidly consume extra-cellular fat, and therefore, enter to a state favouring
PDF created with pdfFactory Pro trial version www.pdffactory.com

77
storage material degradation. In general, degradation of storage lipid could be
considered as phenomenon commonly met among oleaginous microorganisms, in
cultures growing on fats (Aggelis & Sourdis 1997; Papanikolaou et al. 2001a;
2003a).
Biochemistry of oil-accumulation in oleaginous microorganisms
In recent years studies on metabolism of lipid synthesis has created more
interest, because the wide range of lipid accumulation from 20->70% in different
microorganisms. All living organisms must synthesise a minimum amount of lipid
for their membranes and other structural and functional role (Evans & Ratledge
1988a; Wynn et al. 1999). Bacteria in general do not produce TG but instead
produce PHB and PHA as storage polymers (Patnayak & Sree 2005; Ratledge
2003). Therefore the accumulations of oil above 20% of their cell mass only
found in small number of microorganisms it includes yeasts, fungi and algae
(Barclay et al. 1994; Ratledge 2004). Biosynthetic pathway of lipids in most
oleaginous microorganisms is same as in non-oleaginous microorganisms. But the
presence of certain key enzymes plays an important role in the production of
PUFAs, where these enzymes are not found in non oleaginous microorganisms
(Ratledge 1992a, b).
Several reviews have been published regarding accumulation of lipid from
oleaginous microorganisms (Certik & Shimizu 1999; Moreton 1988; Ratledge
1988; 2004). The mechanism of lipid overproduction in oleaginous
microorganisms appears those involving both the physiology and genetics
(Ratledge 1988). Fundamental physiological requirement for lipid overproduction
in these organisms is excess carbon and deficiency of nutrient, generally limited
N2 in the growth medium. During these conditions, several physiological and
metabolic changes were observed (Holdsworth & Ratledge 1988).
When organisms grown in N2 limitation medium, beyond 70% oil
accumulation observed in oleaginous fungus whereas non-oleaginous fungus do
PDF created with pdfFactory Pro trial version www.pdffactory.com

78
not accumulate lipid. Instead those non-oleaginous microorganisms either tend to
cease further proliferation or production lipid in their cell. The physiological
condition which leads to lipid accumulation is that the organisms is grown in
medium such that the supply of nitrogen is quickly exhausted but carbon supply
stays in excess. Various reasons have been proposed as to how oleaginous
organisms may achieve this conversion of carbon substrate into lipid, such as
1. Glucose (or other substrate used) is taken up by the potential lipid
accumulator regardless of the lack of supply of other important nutrients
such as nitrogen source, to the cell. Thus an oleaginous organisms may
continue to assimilate glucose even though it can no larger generate new
cells by virtue of their being no nitrogen to synthesise proteins or nucleic
acids. The glucose (substrate) is then converted into lipids whereas in other
microbial cells, the glucose may be converted into polysaccharides or
metabolites like citric acid, etc. by the same supplement then, the
organisms which did not accumulate any such materials would have the
tendency to curtail glucose transport to the cell (Botham & Ratledge 1989).
2. The rate of lipid biosynthesis is much higher in these organisms than in
non-oleaginous ones in which case, recognized key enzymes of fatty acid
biosynthesis (Acetyl-CoA carboxylase and fatty acid synthase complex),
would be much active in oleaginous microorganisms. This does not appear
to be the case of non oleaginous microorganisms (Botham & Ratledge
1989).
Sequence of Metabolic Events Leading To Initiation of Lipogenesis in Oleaginous Microorganisms
§ Nitrogen becomes exhausted from medium.
§ The increased activity of AMP deaminase.
§ Decreases the cellular content of AMP.
§ Isocitrate dehydrogenase in mitochondria slows / stops
PDF created with pdfFactory Pro trial version www.pdffactory.com

79
§ Isocitrate equilibrates with citrate and accumulates citrates
§ Citrates exits from the mitochondrion
§ Citrate enters to cytosol and cleaved by ATP citrate lyase
§ Acetyl CoA generated
§ Acetyl CoA is used for the fatty acid synthesis.
§ Oxaloacetate converted into malate,
§ Malate converted to pyruvate via malic enzyme
§ The malic enzyme generates NADPH
Net reaction: Acetyl CoA + NADPH produced, which are utilized as substrate
for lipid synthesis
(Ratledge 2004; Venkateswaran 1999)
This sequence of events showed in diagrammatically in Fig. 2.11 and 2.12
PDF created with pdfFactory Pro trial version www.pdffactory.com

80
Fig. 2.11 Scheme showing how the proposed citrate/malate cycle and the cytosolic ‘transhydrogenase’ cycle could provide sufficient precursors (acetyl-
CoA and NADPH) for lipogenesis in filamentous fungi. Enzymes: 1, pyruvate decarboxylase; 2, malate dehydrogenase; 3, malic enzyme; 4, pyruvate dehydrogenase; 5, citrate synthase; 6, ATP:citrate lyase; 7, citrate/ malate transport.
(Source: Ratledge 2004)
Fig. 2.12 Schematic representation of Lipid accumulation in oleaginous microorganisms
(Source: Ratledge 2004)
PDF created with pdfFactory Pro trial version www.pdffactory.com
81
Biosynthesis of PUFAs production in fungi
The mechanism of lipids and fatty acids biosynthesis in plants, yeast,
molds, and animals has revised by several authors (Lopez & Gracia 2000; Certik
& Shimizu 1999; Finnerty & Manku 1975; Murphy 1991; Ohlrogge & Jaworsky,
1997; Ratledge & Wynn 2002; Uttaro 2006). Fungal oils have greater diversity of
lipid and fatty acid in the cell. Biosynthesis is well studied in yeast, plants animals
but in lower eukaryotes is still poorly understood although several pathways
involved in the biosynthetic pathway and potential research has been going on this
field (Certik et al. 1997; Ratledge & Wynn 2002). Generally, lipid synthesis
involves three steps in the eukaryotic systems.
ü Denovo synthesis of fatty acid from glucose
ü The incorporation of exogenous fatty acids directly into lipid structures.
ü Following desatuaration and elongation of lipid sources. In addition fatty
acid biohydrogenation (saturation) and partial or total degradation (β-
oxidation) also contribute to this process
Mono and poly unsaturated fatty acid are synthesized in prokaryotes and
eukaryotes commonly by aerobic pathway. However, some marine prokaryotes
and eukaryotes like E.coli, Streptococcus pneumoniae and Thraustochytrids
respectively synthesize PUFAs via specialized polyketide synthase (PKS) (Metz
et al. 2001; Napier 2002; Ratledge 2004).
In eukaryotic microorganisms the biosynthesis of PUFAs takes place by
aerobic reaction. The reaction involves the introduction of double bonds
(desaturation) in the aliphatic chain of fatty acids and extension (elongation) by
two carbon units of the acyl chain. The enzymes currently named as desaturases
and elongases (Leonard et al. 2004, Uttaro 2006). Desaturation of aerobic
pathway involves three proteins (NAD(P)H-cytochrome b5 reductase, Acyl-ACP
desaturase and Acyl lipid desaturases are proteins) and tree types of desturases
(Acyl CoA desaturases, Acyl ACP desaturase and Acyl lipid dessaturases).
PDF created with pdfFactory Pro trial version www.pdffactory.com
82
Synthesis of PUFAs starts with the condensation of acetyl-CoA with
malonyl-ACP by the β-ketoacyl-ACP synthase (KAS) is followed by the
reduction of the β-ketoester by a NADPH dependent β-ketoacyl-ACP reductase,
the removal of water by the β-hydroxyacyl-ACP dehydrase to produce trans-2
enoyl-ACP and another reduction by the enoyl-ACP reductase to form a saturated
acyl-ACP that in turn can initiate another cycle of condensation with malonyl-
ACP, reductions and dehydration. The process continues up to the synthesis of
C16-18 saturated acyl-ACPs. Generally stearic acid is the basic substrate for the
first double bond introduction to oleic acid or oleoyl CoA or oleoyl ACP
respectively. The first double bond in the aerobic pathway dominant in the
eukaryotic cells and some bacteria is introduced into the ∆9 position of saturated
fatty acid. Thus plamitoleic acid (C16:1) and oleic acid (C18:1) are the major
fatty acids in all microorganisms. Subsequent desaturation of oleic acid takes
place in endoplasmic reticulum (ER, the formation of PUFAs is dominant in all
the organisms). Oleic acid is desaturated to yield linoleic acid (LA, C18:2) by the
∆12 desaturase, which may be further converted into ALA (EFAs). Thus LA and
ALA are precursors to ω-9, ω-6 and ω-3 fatty acid pathway [Fig. 2.13].
The next step for PUFAs production are desaturation of appropriate fatty
acid precursors by ∆6 desaturase followed by successive chain elongations and
subsequent desaturation to yield respective C20 and C22 PUFAs. The ω9 family
synthesized from oleic acid and sequential participation of ∆6desaturase, elongase
and ∆5 desaturase to finally produce mead acid (MA). The ω-6 type of fatty acids
is usually formed from LA via desaturation (∆6, ∆5 and ∆4) and elongation steps
from LA through GLA, DGLA and AA. ALA is metabolized via ω-3 pathway to
EPA, DPA and DHA. Once desaturation has occurred, the acyltransferation
reaction then facilitates distribution of newly synthesized PUFAs to the other
cellular lipids. Many microorganisms accumulate large amount of PUFAs as
storage lipid in the form of triglycerides (Certik & Shimizu 1999; Ratledge 2003).
PDF created with pdfFactory Pro trial version www.pdffactory.com

83
Fig. 2.13 Biosynthesis of PUFAs in eukaryotes (Fungi) (Source: Ratledge 2004)
PDF created with pdfFactory Pro trial version www.pdffactory.com

84
Advantages of microbes as SCO source
v An Active lipid synthesizing apparatus makes oleaginous micro organisms
attractive oil source
v High growth rate on wide varieties of substrates including various waste
substrates
v Oil production can be carried through out the year (climatic independent)
v Microbial PUFAs are the higher value of oil types moderately than
commercial oils like soya oil, palm oil and sunflower oil
v Supply of high controlled (quality/purer) PUFAs with pharmaceutical grade
i.e. more concentrated oil when compared to quality of control oil
v Existence of defective mutant i.e. absence of specific enzymes improve tailor
made oils
v Appropriate vehicles for cloning foreign genes (plant or animals) for the
production of specific PUFAs
v Microorganisms provide useful models for studying the lipid biochemistry,
metabolic control and function because of fewer organelles that allows
synthesis faster than complex multicellular systems of other organisms
v Microbial competence allows transformation reactions (oxidation, desaturation
and dehydrogenation), enables the upgrading of PUFAs structures and
simultaneous formation of other compound also
v Simplicity of metabolic regulation in microbes. They can grow under
controlled condition with nutritional regimes that may stimulate or repress the
key enzymes and allow for manipulation of lipid yield and fatty acid profile
v They can be employed both a source of macronutrient and as micronutrient
since microbes are rich in proteins and fibre and micronutrients like vitamins,
antioxidants.
(Certik et al. 1998; Gill & Valivety 1997; Venkateswaran 1999)
PDF created with pdfFactory Pro trial version www.pdffactory.com

85
Disadvantages of fish and plant oils as source of PUFAs
Ø Seasonal and climatic variation in oil composition, which can result in
inconsistencies in oil supply and quality
Ø Complex and expensive downstream processing
Ø Objectionable taste and odors of fish oil
Ø High cholesterol and small amounts of potential toxic impurities those are
difficult to remove
(Dyaneswar 2006; Gill & Valivety 1997; Yongmanitchai & Ward 1989)
INFLUENCE OF PHYSIOLOGICAL ASPECTS ON LIPID AND PUFAs PRODUCTION
The production of PUFAs by microbial fermentation has been shown to be
an ideal alternative to its amiability for the separation, purification and
commercialization (Ahmed et al. 2006; Bajapai et al. 1991a, b; Ratledge 2003;).
The physiology of lipid accumulation in oleaginous microorganisms specially in
molds have been studied by a number of workers (Aggelis 1996; Certik &
Shimizu 2002; Papanikolaou et al. 2007; Ratledge 2002; 2004), for efficient
microbial strain with both high lipid and high PUFAs content. Recent research has
focused mainly maximizing PUFAs yields by screening new strain, as well as
medium optimization (Dyal et al. 2005; Jang et al. 2005; Lindberg & Molin 1993;
Li et al. 2006). These studies have been carried out with different oleaginous mold
both in batch and continuous cultures by varying different physiological
parameters (Ahmed et al. 2006; Hansson & Dostalek 1988; Kavadia et al. 2001;
Weinstein et al. 2000; Xian et al. 2001). This is especially vital when attempting
to optimize growth conditions for a PUFAs production within a strain. The growth
factors include pH, temperature, aging, carbon source, nitrogen source, metal ion
types, and supplementation of the growth medium. The first detailed physiology
of lipid accumulation studied in the yeast by Woodbine (1959). He observed that,
a high C:N ratio is needed in the medium for lipid overproduction in the yeast.
PDF created with pdfFactory Pro trial version www.pdffactory.com

86
Studies have demonstrated there is the potential to produce GLA at concentrations
of 15-20% of total fatty acids by lower fungi from the order Mucorales, especially
the species of Mortierella, Mucor and Thamnidium, Cunninghamella in both
submerged and solid state fermentation (Certik et al. 2006; Li et al. 2006
Mamatha et al. 2008; Papanikolaou et al. 2008; Stradenska & Sajbidor 1993;
Stradenska et al. 1993; Stradenska et al. 2000 a, b; Suzuki et al. 1983; Ward &
Singh 2005).
pH (in the culture medium)
It has been known that in yeast, pH of the cultivation medium does not
influence the biomass production but possibly in some strains pH could bring
about the change in fatty acid profile of the lipid (Venkateswaran 1999).
Generally, it was found that varying pH values, the amounts of saturated and
monounsaturated fatty acids tended to decrease while PUFAs content tended to
increase with increasing pH values. In oleaginous yeast, Ratledge et al. (1988)
working with Candida 107 and Davies (1988) working with Candida curvata
were unable to observe changes in fatty acid composition by changing the pH of
the cultivation medium. Several studies on influence of pH on biomass, lipid and
PUFAs production from oleaginous molds have been reported (Dyal et al. 2005;
Hansoon & Dostalek 1988; Leman & Brackoniek 1996; Li et al. 2008). The study
by Lindberg & Molin (1993) found that M. alpina did not grow at pH 8.5 and
slow growth and lipid accumulation were recorded at pH 7.5. Rapid growth and a
high lipid content were achieved both pH 5.5 and 6.5. AA content in total fatty
acid content increased from 26% at pH 5.5 to about 31% at pH 6.5 or 7.5. The
concentration of GLA was not affected. Where-as Xian et al. (2001) reported that
M. isabelliana showed an inverse relationship between pH 5.0-9.0 and dry
biomass. Dyan et al. (2005) studied pH ranging from 2.0-14.0 in different media.
In M. ramanniana var. ramanniana showed high GLA production at pH 5.0 in
dextrose yeast extract broth medium where dry biomass high at pH 3.0-4.0. This
observations imply that the occurrence of interactions between media and pH
which can affect the growth of M. ramanniana var. ramanniana. Ahmed et al.
PDF created with pdfFactory Pro trial version www.pdffactory.com
87
(2006) studied the effect of pH on GLA production in Mucor sp. RRL001 from
pH 4.0-8.0 and was found that maximum lipid production at pH 6.5. The lipid
content decreased at pH 8.0 and 4.0. However, GLA production was higher at pH
5.0 and decreased in the range of pH 3.0 and 6.0. Similar observation was also
made by Li et al. (2008) that total lipids, GLA and PUFAs were highest at pH 6.0
in M. recurvus. The study also reported, total lipid and PUFAs production
increases as the pH increases from 4.0 to 6.0. However, production of PUFAs
decreased sharply as the pH was raised from 7.0 to 8.0.
Growth temperature
Among physiological parameters temperature is one of the most critical
factors that affect all species of living organisms and controlling the growth rate,
lipid synthesis and alters the composition of fatty acids in cellular level. Earlier
studies showed that temperature has pronounced effect on growth and
biosynthesis of unsaturated fatty acids in certain oleaginous microorganisms
(Choi et al. 1982; Kendrick & Ratledge 1992b; Linderberg & Molin 1993;
Michinaka et al. 2003). Fermentation at high temperature produce more saturated
than unsaturated fatty acid and vice versa when grown at low temperature. This
phenomenon is a part of the adaptive response to the cold environment (Quoc &
Duacq 1997; Robinson 2001; Michinaka et al. 2003).
Hansson & Dostalek (1988) studied the effect of growth temperature on
biomass yield and fatty acid composition of Mortierella ramanniana CBS 112.08,
M. ramanniana CBS 478.63, M. vinacea CBS 212.32, and M. isabellina Oudem at
20, 25, and 30°C. It was observed that at 25°C, there was a maximum biomass
yield and was the optimal growth temperature for growth. The study also noted
some variation in fatty acid composition with respect to temperature, generally,
the degree of unsaturation increased as temperature decreased. This increased
unsaturation was at least partially due to the fact that the GLA content of the
moulds increased with a decrease in temperature. These results suggest that lower
growth temperatures tend to favour the production of unsaturated fatty acids.
PDF created with pdfFactory Pro trial version www.pdffactory.com

88
Effect of temperature on the fatty acid composition of Mortierella fungi which
normally produce AA but not EPA at 28°C was studied (Shimizu et al. 1988). It
was observed that the optimum temperature for AA production in M. alpina was
28°C Although EPA accumulation occurred up to 20°C, there was a significant
decrease in EPA content when the growth temperature was above 12°C.
Generally, AA content decreased with decreasing temperature whereas EPA
content increased with decreasing temperature. This study suggests that ARA and
EPA production are related by a metabolic pathway. Shimizu et al. (1988)
hypothesize that an enzyme catalyzed reaction is activated at low temperatures
which converts AA to EPA. Formation of lipid and unsaturated fatty acids tends
to increase considerably and these results were also observed in certain Mucor
spp. (Lindberg & Molin 1993; Quoc & Duacq 1997).
Nakahara et al. (1992) investigated the temperature effect on the fatty acid
composition of Mortierella fungi in more detail by determining the fatty acid
composition of both polar and neutral lipid fractions within the species of
M. isabellina. This study found that polar lipid fractions generally contained more
unsaturated fatty acids than the corresponding neutral lipid fractions. The fatty
acid compositions of M. ramanniana var. angulispora grown at various
temperatures indicated that the GLA content of the polar lipid fractions tended to
increase with decreasing temperature while the GLA content of the neutral lipid
components remained relatively consistent regardless of temperature. The
saturated and monounsaturated fatty acids present in greater amounts at 35°C than
at 25°C. Conversely, the reported PUFAs had a tendency to be present in lower
amounts at 35°C than at 25°C. Michinaka et al. (2003) who found that M.
circinelloides grown at different temperature shown that ∆6 desaturase activity
increased twice as much as that produced at room temperature thus the culture
grown at low temperature shows high 18:3 fatty acids content in the lipid. Further
growth in low temperature not only influences the PUFAs production but also
alters the cell morphology (Carvalho et al. 1999; Higashiyama et al. 1999).
However, the biomass and lipid yields obtained at lower temperatures need to be
PDF created with pdfFactory Pro trial version www.pdffactory.com
89
taken into account when deciding what temperature is optimum for PUFAs
production. If the biomass and/or lipid yields are too low at lower temperatures,
the conditions may not be ultimately ideal for PUFAs production although (Dyal
& Narine 2005; Quoc & Duacq 1997).
Shaking speed and dissolved oxygen levels
PUFAs are formed in the mycelia, through elongation and desaturation by
utilizing carbon as energy source. The desaturation involves an aerobic reaction
by oxygenation; therefore dissolved oxygen [DO] is an important factor for
PUFAs production (Ratledge 1992). In fungal fermentation the problem of
oxygen limitation generally arises because of high viscosity of the culture broth
due to high biomass density and filamentous growth (Higashiyama et al. 1999; Li
et al. 2006). For the commercial production of PUFAs, the achievement of a
higher biomass density is essential because PUFAs are intracellular products
(Ahmed et al. 2006). The O2 requirement is higher for desaturation than for cell
growth and lipid production (Ratledge 2004). In Apiotrichum curvatum,
Canthamoeba casrellan and Mortierella spp. maximum production of fatty acid
was observed when the agitation speed (RPM) increased but the concentration of
fatty acid was decreased. The observation was also made that if the agitation
lowers alteration in total fatty acid production was found but the individual fatty
acid composition altered (Davies et al. 1990; Heighashima et al. 1999).
Lower shaking speed resulted in slower growth and lower PUFAs yields
because of the lower level of dissolved oxygen (DO). However, lower PUFAs
yield were also obtained in the experiment with too high shaking speed because
the shear stress was increased with the increased speed. GLA and PUFAs
production was high at shaking speed of 160 rpm, with the highest biomass and
total lipid. PUFAs yield was reduced sharply when the shaker speed was over 180
rpm, although DBM production was not changed between 160 and 200 rpm (Li et
al. 2008). There is a report that the change of DO concentration in the medium
affects on morphology of fungi. Morphology of fungus changed from filamentous
PDF created with pdfFactory Pro trial version www.pdffactory.com

90
to pellet when the DO concentration was maintained at 20-50 rpm. Pellet form
was needed when mass transformation and cultivation of fungi in industrial scale
production of PUFAs (Heighashima et al. 1999). The effects of 2-3 ppm DO on
PUFAs production E. excitalis fungus has been reported by Kendrick & Ratledge
(1992b). There have been some attempts to prevent DO limitation by monitoring
and controlling the agitator speed (De Preeze et al. 1997; Emelyanova 1997;
Hansoon et al. 1989; Nakahara et al. 1992; Totani et al. 1992). Hiruta et al. (1997)
reported that the change of impeller design resulted in the as improvement of
PUFAs production. This may be due to the fact that in general, fungi are
physically weak therefore agitation rate has to be controlled within a certain range
(Higashima et al. 1999). It may be due to that many fungal metabolites are extra
cellular products, evaluated the distribution of productivity.
Carbon sources
Carbon sources have received much attention in attempts to find materials
which are suitable and efficiently converted into lipid. The effect of carbon source
on GLA production by Mucor spp. was investigated using different pentose,
hexose sugars, mono, di and polysaccharides as well as glycerol, ethanol, acetic
acid vegetable oils and cereal flours in shake flask cultures (Both et al. 1995;
Certik et al. 1993; du Preeze et al. 1996; Hansoon et al. 1989; Kock & Botha
1993; Papanikolaou et al. 2002b; Tsuchivra & Sakura 1998). In the recent years,
work has been carried out on numerous carbon sources including a wide variety of
wastes from different areas like agricultural and industrial wastes which includes
molasses, whey, organge peel, apple pomacea and other substrates like tomato
waste hydrolysate (Certik et al. 2006; Chen et al. 1999; Fakas et al. 2008; Gema
et al. 2001; Stredanska et al. 2000). Sajbidor et al. (1988) studied the effect of
different carbon sources on growth, lipid content and fatty acid composition in
four strains of mucorales namely M. mucedo, M. plumbeus, M.
ramanniana and R. arrhizus. The results showed that M. mucedo
grew very well on glycerol and produced GLA 0.58 g/100g glycerol. Kock &
Botha (1993) showed that when acetic acid was used as sole carbon source M.
PDF created with pdfFactory Pro trial version www.pdffactory.com

91
cercinalloides produces both GLA and cocoa butter equivalents consisting mainly
of palmitic acid, stearic acid and oleic acid. Acetic acid is a cheap carbon source
and has commercial implications (i.e. biotechnological process, the production of
high value oil from low cost substrate). Tsuchivra & Sakura (1998) also found
improved production of GLA when acetic acid was used as a co-substrate in
glucose containing medium in Mortierella spp. Mucor hiemalis IPD 51 produced
41.1% GLA, when cultivated in media containing maltose or glucose as the sole
carbon source and yeast extract as the nitrogen source (Kennedy et al. 1993).
Funtikova et al (2002) performed experiment, media with various compositions
using M. lusitanicus 306D. The results showed that glucose as the sole energy
source was the most promising carbon source for obtaining lipids with a high
content of GLA when compared to other carbon sources like sunflower oil, maize
extract though efficiently converted to lipid. Hansoon & Dostalek (1988) found
that the lipid produced on soluble starch had much higher GLA content (25.7 %)
than the lipid produced on glucose (14.7%) and xylose (19.5% GLA). The GLA
content in mycelia grown in xylose was somewhat higher than the mycelia grown
on glycerol (Fakas et al. 2009a). R. nigricans shows high GLA
production at 2% soluble starch when compared to other carbon sources
(Bandyopadhyay et al. 2001). Lipid formation and GLA production by 48 species
of Mucorales fungi grown in sunflower oil showed 42.7-65.8% lipids in the
biomass (7.7-1.4 g/L) (Certik et al. 1997). For all the mucorales tested, lactose
was the poorest carbon source for GLA production (Ahmed et al. 2006;
Somashekar et al. 2002). Li et al (2008) showed that the sugar cane molasses is a
good source for GLA (0.99 g/L) production by Mucor recurvus sp. at 15%
(volume ratio). Molasses is also a good source of inorganic nitrogen and vitamins.
Tauk-Tornisielo et al. (2007) studied the soluble carbohydrates and different plant
oils used as carbon source. They found that biomass production was
approximately 8 to 10% greater in media containing carbohydrates as the single
carbon source than plant oils. They reported that no correlation between the
highest yield of biomass, fatty acids and carbon source used. The lipid yield and
GLA production depended on the type of carbon source and also the strains used.
PDF created with pdfFactory Pro trial version www.pdffactory.com

92
There are reports on use of cereals and other waste substrates as carbon sources in
solid state fermentation (Chen et al. 1999; Certik et al. 2006). Gema et al. (2002)
first studied the glucose and orange peel (an agro-industrial byproduct) as a
carbon source for production of lipid in semi defined nitrogen limited media with
various C:N ratios in C. echinulata. Results revealed that the enrichment of
orange peel as carbon substrate with glucose maximum GLA 80 mg/g dry
biomass by fungal cultivation was obtained. Papanikolaou et al. (2007) studied the
correlation of individual carbon uptake and secretion of hydrolytic enzymes for
the M .isabelliana ATHUM 2935 and C. echinulata ATHUM 4411 when grown
on various low cost sugar based substrates as related to the formation of biomass,
and accumulation of storage lipids. Biochemical differences concerning pattern of
substrate uptake, activity of intracellular key enzymes responsible for the lipid
synthesis and storage of lipid breakdown process have been observed in response
lipid accumulation in low cost substrate (Fakas et al. 2008; Papanikolaou et al.
2004a; 2007a, b). These discrepancies could be attributed to the difference in the
assimilation of each carbon source utilized as a substrate.
Nitrogen sources
Apart from carbon sources studied various nitrogen sources have also
received a lot of attention cost-effectively in PUFAs production (Certik et al.
1999; Papanokolaou et al. 2007a). Several studies indicated that use of variety of
a nitrogen sources during fermentation process affect the yield of mycelial
growth, lipid, PUFAs production and also mycelial morphology (Hansoon &
Dostalek 1988; Park et al. 1999). In the experiment of Evans & Ratledge (1984)
with 17 species of yeast in shake flask experiment with different types of nitrogen
sources observed that with glutamate, arginine or urea, the lipid yields were about
50% whereas with ammonium chloride it was only 18%. Moreton (1988) was
however unable to demonstrate such difference in the effects of various nitrogen
sources in stirred fermenters. They concluded that the effect of different nitrogen
sources on lipid yield in shake flasks experiments could have been due to the
buffering capacity helping to maintain the pH at an optimal level for growth and
PDF created with pdfFactory Pro trial version www.pdffactory.com

93
O2 limitation in shake flask cultures. Hansson & Dostalek (1988) observed that
potassium nitrate used as nitrogen source produced more biomass and lipid
content when compared to ammonium chloride or ammonium sulphate in M.
ramanniana CBS 112.08. However, Mortierella spp. produced maximum GLA at
1% yeast extract and also increased yeast extract concentration in the cultivation
medium which promoted the cell growth (Bajpai & Bajpai 1992). Use of urea as
nitrogen source in the cultivation medium enhanced growth and GLA production
of C. echinulata CCRC 31840 (Chen & Chang 1996). The probable reason might
be that urea has higher nitrogen content as compared to the other nitrogen sources
and created an inert atmosphere that has prevented the oxidation of unsaturated
fatty acids. Ammonium nitrate and urea were the better nitrogen source for
growth and potassium nitrate was best for maximum lipid (35%) production in the
case of C. echinulata CCRC 31840 (Chen & Chang 1996). Certik et al. (1999)
experimented the different nitrogen sources on the activities of lipogenic enzymes
in C. echinulata, a oleaginous fungus. He observed that increased lipid content in
biomass was paralleled with an increase of acetyl Co-A carboxylase activity. They
also reported that the rate of fatty acid biosynthesis is faster in C. echinulata when
grown either on ammonium nitrate or corn steep when compared to other nitrogen
sources. M. rouxii and Mucor sp.1b, both the cultures showed maximum lipid
production in medium containing potassium nitrate. M. rouxii showed a maximum
GLA (16.3%) when grown on ammonium sulfate as nitrogen source. Both the
cultures grown on urea showed less biomass and poor GLA production
(Somashekar et al. 2002). Dyal et al. (2005) found that 1% yeast extract as
nitrogen source and 4% glucose as carbon source in the cultivation medium gave
the best production of biomass, lipid and AA production in M. ramanniana var.
ramanniana. Yeast extract as sole nitrogen source stimulated the cell growth, but
not for GLA and total PUFAs production (Dyal & Narine 2005). Yeast extract
enhances the growth of the organisms, since it is a complex nitrogen source but it
is an expensive source for large scale production. Simple nitrogen source for
microbial production of lipids have been received attentions from various workers
in the recent years (Fakas et al. 2008). Ahmed et al (2006) studied the difference
PDF created with pdfFactory Pro trial version www.pdffactory.com
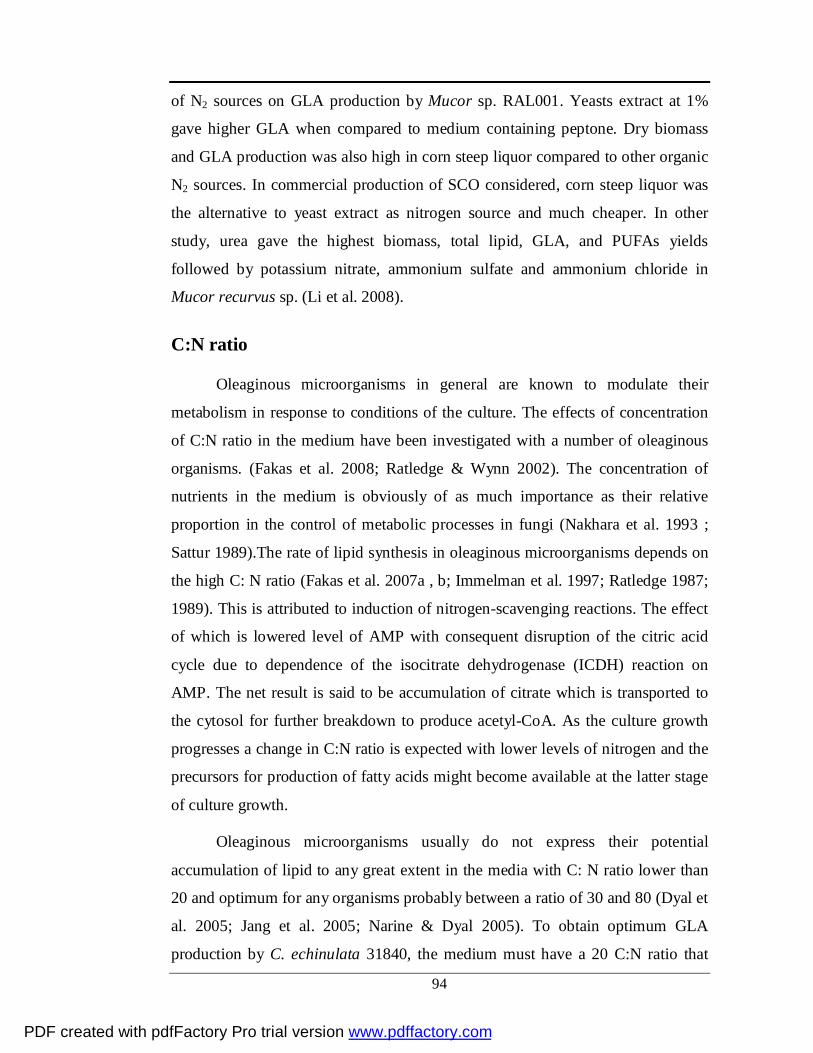
94
of N2 sources on GLA production by Mucor sp. RAL001. Yeasts extract at 1%
gave higher GLA when compared to medium containing peptone. Dry biomass
and GLA production was also high in corn steep liquor compared to other organic
N2 sources. In commercial production of SCO considered, corn steep liquor was
the alternative to yeast extract as nitrogen source and much cheaper. In other
study, urea gave the highest biomass, total lipid, GLA, and PUFAs yields
followed by potassium nitrate, ammonium sulfate and ammonium chloride in
Mucor recurvus sp. (Li et al. 2008).
C:N ratio
Oleaginous microorganisms in general are known to modulate their
metabolism in response to conditions of the culture. The effects of concentration
of C:N ratio in the medium have been investigated with a number of oleaginous
organisms. (Fakas et al. 2008; Ratledge & Wynn 2002). The concentration of
nutrients in the medium is obviously of as much importance as their relative
proportion in the control of metabolic processes in fungi (Nakhara et al. 1993 ;
Sattur 1989).The rate of lipid synthesis in oleaginous microorganisms depends on
the high C: N ratio (Fakas et al. 2007a , b; Immelman et al. 1997; Ratledge 1987;
1989). This is attributed to induction of nitrogen-scavenging reactions. The effect
of which is lowered level of AMP with consequent disruption of the citric acid
cycle due to dependence of the isocitrate dehydrogenase (ICDH) reaction on
AMP. The net result is said to be accumulation of citrate which is transported to
the cytosol for further breakdown to produce acetyl-CoA. As the culture growth
progresses a change in C:N ratio is expected with lower levels of nitrogen and the
precursors for production of fatty acids might become available at the latter stage
of culture growth.
Oleaginous microorganisms usually do not express their potential
accumulation of lipid to any great extent in the media with C: N ratio lower than
20 and optimum for any organisms probably between a ratio of 30 and 80 (Dyal et
al. 2005; Jang et al. 2005; Narine & Dyal 2005). To obtain optimum GLA
production by C. echinulata 31840, the medium must have a 20 C:N ratio that
PDF created with pdfFactory Pro trial version www.pdffactory.com

95
produces lipid accumulation. Maximum GLA content of 853-943 mg/L were
obtained at C:N ratio 30-48.5. Higher GLA content in lipid was produced only in
limited amount of lipid. The results show that there is a likely hood GLA was
produced approximately at constant metabolic rate and extra accumulation of
GLA by the cell (Chen & Chang 1996). Optimal C:N ratio of the medium was
around 15-20 for AA production in culture of M. alpina CBS 754.68 when the
C/N ratio was higher than 20 the mycelial weight and PUFAs production
decreased due to N2 limitation. Mucor recurvus sp. an experiment with the C:N
ratio was varied at a fixed initial concentration of the carbon source. In this case
the mycelial concentration was dependent on the nitrogen source concentration,
when N2 was in excess the proportion of PUFAs increased but that of saturated
fatty acid decreased. However, when consumed C/N ratio was increased at a fixed
initial concentration of the N2 source, the GLA concentration depended on the
initial concentration of carbon source. Although, all fungal strains utilized
efficiently glucose and yeast extract as carbon and nitrogen sources respectively.
This may be because of glucose enters directly into the glycolytic pathway, while
yeast extract contains all the micronutrients (including metal ions) required for
fungal growth, in addition to being a nitrogen source (Dyal & Narine 2005). The
optimum carbon and/or nitrogen source and concentration for one fungal strain
cannot be generalized to other strains within its genus or even its species.
Minerals supplements
In the recent years it is interesting to study the effect of different metal ions
on lipid and PUFAs production in oleaginous microorganisms (Nakhara et al.
1992; Dyal et al. 2005; Muhid et al. 2008). Gill et al. (1977) studied the effect of
N2, P and C and Mg2+ limitation on lipid production by Candida 107 using
continuous cultivation technique. Phosphate limitation alone produced a 50%
reduction in biomass yield than of N2 limitation and the lipid yield was 10>15%
(w/w). Hansson & Dostalek (1988) investigated the effect of metal ions on lipid
and GLA accumulation in M. ramanniana, M. vinacea, and M. isabellina. The
results revealed that addition of Cu2+ and Zn2+ metals had a stimulatory effect on
PDF created with pdfFactory Pro trial version www.pdffactory.com

96
both lipid and GLA production. However, the addition of Mg2+ did not influence
the lipid and GLA production in Mortierella sp. The increased concentration of
Mg2+ in the growth medium was also not showed any marked difference on either
of lipid and GLA production. Lipid with considerably high GLA yield was
possible with the fungus Rhizopus nigricans SSSD-8 when grown in a potato
dextrose-yeast culture medium containing 0.40 % KCl (Bandyopadyay et al.
2003). Dyal et al (2005) studied effect of different metal ions with different
concentration in M. ramanniana var. ramanniana. The study revealed that
addition of Mn2+ at 5 mg/L induced highest yield of GLA content total lipid.
Results obtained by Muhid et al. (2008) reported that the addition of Mg2+ to the
culture medium in increased percentage it might have affected the ATP citrate
lyase and Malic enzyme, thus it affected the Acetyl CoA and NADPH for
lipogenesis in Cunninghamella sp.2A1. Metal ions are known to have important
role as co-factors for enzyme activities like Malic enzyme, ATP citrate lyase and
fatty acid synthase (Evans & Ratledge 1985; Wynn et al. 1999). These three
enzymes play major key role in the lipid production since malic enzyme play a
role in NADPH source for fatty acid synthase when ATP citrate lyase accumulate
acetyl CoA as a precursors to the fatty acid biosynthesis (Wynn et al. 1999; 2001).
Supplements on lipid and PUFAs production: Common fat or their derivatives are of special interest as substrates, since
several oleaginous yeasts and molds are able to accumulate and at the same time
modify the composition of the fat utilized as the carbon source (Aggelis &
Sourdis 1997; Aoki et al. 1999; Papanikolaou et al. 2003a, b). Several papers have
dealt with various growth media containing some supplements to examine their
influence on growth, lipid and fatty acid composition in molds (Aggelis 2003;
Certik et al. 1997; Papanikolaou et al. 2002a; Tornisielo et al. 2007). Kendrick &
Ratledge (1996) studied supplementing triolein, sesame oil, safflower oil, linseed
oil as well as oil extracted from M. isabellina in glucose containing media. Four
fungi were studied such as Conidiobolus nanodes, Entomophthora exitalis,
M.isabellina, and M. cercinelloides. It was interesting to note that M. isabellina did
PDF created with pdfFactory Pro trial version www.pdffactory.com

97
not grow on either the linseed oil or Mortierella oil containing media. The
medium supplemented with safflower oil showed highest cell yield where as
sesame oil showed very less cell yield significantly than the glucose medium
alone. With respect to GLA production, safflower oil supplemented to a glucose
medium, resulted in higher cell and lipid yields than the unsupplemented glucose
medium. However, the percentage of GLA that was obtained from the glucose
medium without supplementation was more than two times that obtained from the
supplemented medium. Lipid formation and GLA production by 48 species of
Mucorales fungi grown in sunflower oil showed 42.7-65.8% lipids in the biomass
(1.4 -7.7g/L) (Certik et al. 1997).
The various fungi were found to utilize the free fatty acids with varying
degrees of efficiency. However, the Mortierella fungus effectively formed GLA,
as well as, ARA and EPA from the mixture. The ability of different fungi, like
Mucor hiemalis H-30 , utilized a fatty acid mixture to accumulate lipid added to
liquid growth medium was studied (Aoki 1999). The presence of LA and ALA in
the oils used for media supplementation seems to be effectively utilized by the
various fungi like M. cercinelloides, M. hiemalis and M. alpine (Aggelis &
Sourdis 1997; Auki et al. 1999; Certik et al. 1997). LA and ALA are precursors to
LC-PUFAs like DGLA, AA and/or EPA. Presumably, this allows the fungi to
reserve its carbon source for functions other than EFAs production instead of
synthesizing them de nova (Dyal & Narine 2005). Complicated biological
process, such as the bioconversion of industrial fats to microbial lipids studied
through mathematical models (Aggelis & Sourdis 1997). It is important to
quantitatively investigate bioconversions and possess a tool for predicting
parameters of biochemical significance, such as the specific rates of lipid
accumulation and degradation (Aggelis & Sourdis 1997; 2003; Papanikolaou et al.
2001a; 2003b).
PDF created with pdfFactory Pro trial version www.pdffactory.com

98
FERMENTATION
In the past several years, research on microbial PUFAs production was
basically aimed at improving economic competitiveness of microbial lipids
compared to plant and animal-derived lipids. Emphasis was placed on screening
for more efficient strains, increasing the product value, using inexpensive
substrates, and reducing the processing steps necessary for lipid recovery from the
cells. Two basic processes have been developed for microbial production of
PUFAs: solid-state fermentation and submerged fermentation (Jang & Yang 2008;
Conti 2001).
Solid-state fermentation for PUFAs production
Improvement of culture by cultivating on agro-industrial wastes and in the
production of high lipid and PUFAs content considered to be an interesting area in
the biodiesel production (Fakas et al. 2008; 2009a, b; Zhu et al. 2003). The
association of fungal oil with solid state fermentation (SSF) provides another
opportunity to fill marketing demands for PUFAs (Certik & Shimizu 1999). SSF
is a process in which micro-organisms grow on a moist solid substrate in the
absence of free water which allows utilization of cheap raw materials and residues
of agro- and food-industries as fermentation substrates and convert them to useful
metabolites (Certik et al. 2006; Pandey 1992; Robinson et al. 2001b). SSF used
successfully in the industrial production of primary and secondary metabolites
from the microbial sources such as amylase, phytase, glucoamylase, protease,
cellulase, ligninase, pectinase and xylanase and various byproducts have been
used successfully in SSF (Holker et al. 2004; 2005; Gunashree 2006;Pandey et al.
1999; 2000). During the past ten years, there has been a vast change in the solid-
state culture with significant developments. Studies on SSF compares with
submerged cultures, SSF claims higher yields, more concentrated metabolite with
potential downstream recovery advantage for commercial production [Table 2.16]
(Manpreet et al. 2005).
PDF created with pdfFactory Pro trial version www.pdffactory.com

99
SSF might provide an alternative for PUFAs production since the
association of fungal oil with solid substrate might be used as inexpensive food
and feed supplement (Certik & Shimizu 1999; Jang et al. 2000; Zhu et al. 2003).
Fungi play a key role in SSF, for their hyphal development allows them to
effectively colonize and penetrate the solid substrate (Pandey et al. 2000; 2003).
SSF cultivation was successfully used for the production of GLA and other
PUFAs like AA and EPA from oleaginous microorganisms like mucor and
mortierella spp. (Emelyanova 1997; Stredanska et al. 1993). Economically
competitive, production of PUFAs using rice bran can be performed at the rural
level. SSF can achieve this purpose by reducing the cost of growing
microorganisms, high product yield and low wastewater output (Jang & Yang
2008; Pandey et al. 1999; 2003; Singhania et al. 2009). However, due to technical
problems such as difficulties in contamination control, scaling-up and lipid
extraction, SSF has received less attention than submerged fermentation (Conti et
al. 2001; Dyal et al. 2005; Gema et al. 2002).
Submerged fermentation for PUFAs production
Submerged fermentation (SmF) is one of the industrially important
techniques where the fungal products of biotechnological interest, such as primary
metabolites, and secondary metabolites, are developed for use in scale up studies
(Certik & Shimadzu 1999; Dyal et al. 2005). SmF cultivation for industrial use
requires a process that consists of several operational units from strain cultivation
to oil refining. There are three processes involved in obtaining lipids or oils the
oleaginous microorganisms fermentation, cell separation and oil extraction and
refining. The economic consideration is an important in PUFAs production and
severely affected by the cost of raw materials and selection of growth media. It
should be noted that media adequate to the production of high concentration of
PUFAs in optimized conditions chosen (Certik & Shimizu 1999). Very efficient
microbial strains, well adapted to SmF by genetic engineering are available for
PUFAs production on an industrial scale. Oleaginous fungi, like Mortierella spp.,
Mucor spp., and other oleaginous microorganisms have been successfully applied
PDF created with pdfFactory Pro trial version www.pdffactory.com
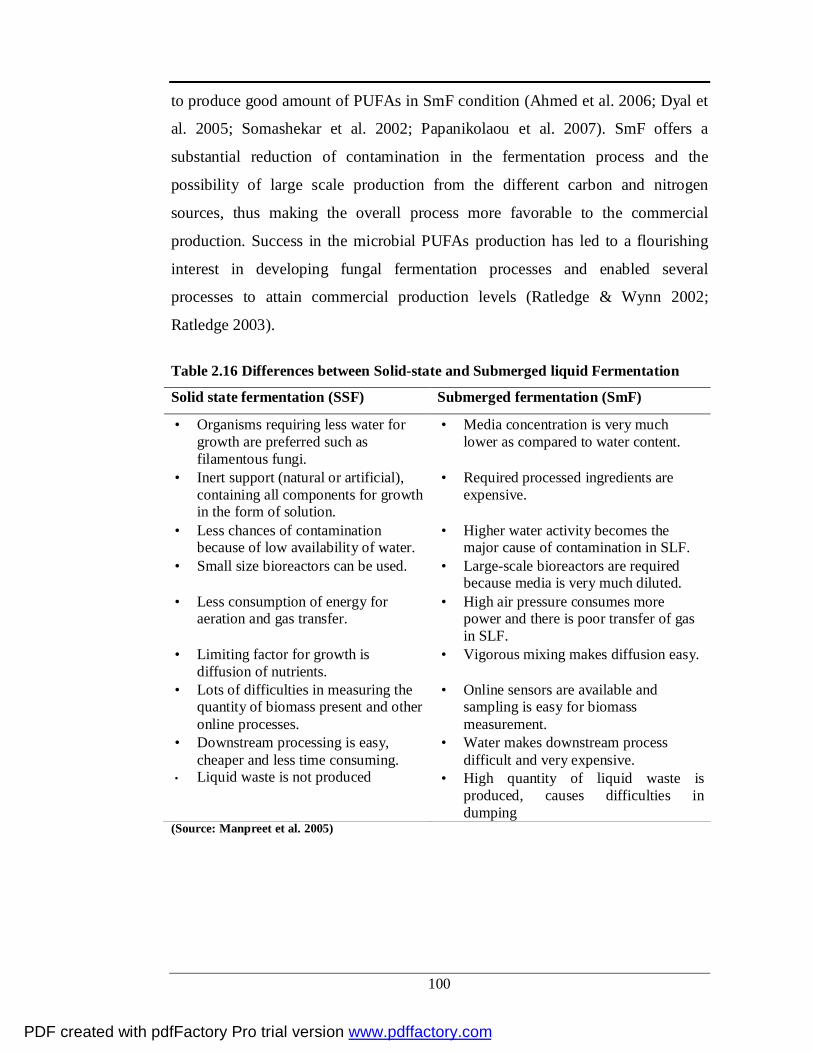
100
to produce good amount of PUFAs in SmF condition (Ahmed et al. 2006; Dyal et
al. 2005; Somashekar et al. 2002; Papanikolaou et al. 2007). SmF offers a
substantial reduction of contamination in the fermentation process and the
possibility of large scale production from the different carbon and nitrogen
sources, thus making the overall process more favorable to the commercial
production. Success in the microbial PUFAs production has led to a flourishing
interest in developing fungal fermentation processes and enabled several
processes to attain commercial production levels (Ratledge & Wynn 2002;
Ratledge 2003).
Table 2.16 Differences between Solid-state and Submerged liquid Fermentation
Solid state fermentation (SSF) Submerged fermentation (SmF)
• Organisms requiring less water for growth are preferred such as filamentous fungi.
• Inert support (natural or artificial), containing all components for growth in the form of solution.
• Less chances of contamination because of low availability of water.
• Small size bioreactors can be used. • Less consumption of energy for
aeration and gas transfer. • Limiting factor for growth is
diffusion of nutrients. • Lots of difficulties in measuring the
quantity of biomass present and other online processes.
• Downstream processing is easy, cheaper and less time consuming.
• Liquid waste is not produced
• Media concentration is very much lower as compared to water content.
• Required processed ingredients are
expensive. • Higher water activity becomes the
major cause of contamination in SLF. • Large-scale bioreactors are required
because media is very much diluted. • High air pressure consumes more
power and there is poor transfer of gas in SLF.
• Vigorous mixing makes diffusion easy. • Online sensors are available and
sampling is easy for biomass measurement.
• Water makes downstream process difficult and very expensive.
• High quantity of liquid waste is produced, causes difficulties in dumping
(Source: Manpreet et al. 2005)
PDF created with pdfFactory Pro trial version www.pdffactory.com

101
METHODS OF LIPID EXTRACTION
The use of gas chromatography (GC) to characterize fatty acid profiles of
lipids in various biological samples has became routine in laboratories of various
scientific institutions and industrial organizations. The analysis of the composition
of fatty acids was very important especially when developing a process for edible
oil production for human consumption (Certik et al. 1996; Buurja et al. 2007).
Traditionally, the procedure for fatty acid estimation consists of extraction of
lipids from the biological material and subsequent preparation of fatty acid methyl
esters (FAMEs) which are then used for GC analysis. The reliability of obtained
results depends on efficiency of extraction procedure and efficiency of FAMEs
preparation method used (Certik et al. 1996; Rodriguez et al. 1998).
Several extraction procedures may be found aiming at the improvement of
lipid recovery from organisms, tissues or cell types. The extraction of lipids from
intact yeast cells is connected complex membrane composition that must be taken
in account; otherwise erratic results can be obtained. The lipid occurs in two
forms dependent upon their ease of extraction, namely as ‘readily-extractable’ or
‘free’ lipid and ‘bound’ lipid, in oleaginous microorganisms (Certik et al. 1996;
Rodriguez et al. 1998; Sajbidor et al. 1994). Common techniques used for lipid
extraction are Folch and Bligh and Dyer, which is a quantitative extraction
technique that uses chloroform and methanol (Bligh & Dyer 1959; Folch et al.
1957). The conventional methods are successful in recovering the free lipid from
microorganism but poor extraction of bound lipid which is primarily associated
with the cell envelope (Certik et al. 1996). The synthesis of lipids take place
inside the mycelium i.e. intracellular and it should be separated for recovery and
analysis. The extraction involves a pre-treatment to breakdown the tough cell wall
followed by the isolation of lipid using different organic solvents (Ratledge 1992
a, b). There are three major unit operations followed during extraction of lipid
from tissue, organs, plant material and in microorganisms.
o Cell disintegration
o Extraction with organic solvents
PDF created with pdfFactory Pro trial version www.pdffactory.com

102
o Recovery from the solvent and refining
The efficiency of different pre-treatment methods is dependent on the
rigidity of the cell wall. In case of fungi, the cell is composed of polymers of
chitin, glucans and mannans (Orlawsky 1991). These polysaccharides, give high
strength and rigidity to the cell wall, thus disruption process is an essential step
before extraction of lipid (Burja et al. 2007; Sajbidor et al. 1994).
Cell disintegration/ disruption techniques
There are three pre-treatment methods are available to soften or break the
cell wall, before the extraction of lipids using organic solvents.
a. Mechanical methods
Cell disruption by grinding action is brought about by a rapid agitation or
the cell suspension with glass beads in a disintegrator (Dynomill, Braun
homogenizer). Cell disruption is caused by collisions between shear force layers
and also by rolling of the grinding elements (Hansoon & Dosatlek 1988). Another
commonly used laboratory techniques is the French press. Liquid shear principle
is applied here, where high pressure was employed to force the cell suspension
through a needle valve. Pressures upto 35 Mpa are applied to samples contained in
steel cylinder by means of a tight fitting piston. After the sample is bled through
the needle valve at constant pressure, the cells are then subjected to sudden
pressure drop results in disruption of cell wall and release of lipid globules (Gill et
al. 1977; Hammond & Glatz 1988). A sonication technique has been widely
employed as one of the laboratory techniques. Ultrasonic disintegrators operate at
frequencies of 15 to 25 KHz, cell disruption occurs due to cavitations effect. This
method can be adapted for continuous operation but does not suit for large scale
processing because of difficulties in providing adequate cooling at high power
input. Freezing and thawing in repeated cycles causes ice crystals to form and
PDF created with pdfFactory Pro trial version www.pdffactory.com

103
melt, with some subsequent disruption of cells. But, it is a slow process with
limited release of cellular materials (Hammond & Glatz 1988).
b. Biological methods
The most promising technique at laboratory scale seems to be enzyme
lysis. Enzymes which have the activity include lysozyme and enzyme extracts
from Leucocytes, Streptomyces spp. Micromonospora spp., Penicillium spp.,
Trichoderma spp., and snails. An advantage of biological method was lysis of cell
wall occurs even at mild conditions. But the use of biological method is relatively
expensive and the presence of enzyme in extracts complicates purification
process. Autolysis is another method, in which the lytic enzymes are produced by
the organism itself (Sattur 1989; Venkateswaran 1999).
c. Chemical methods
The use of chemical treatment was common to hydrolyze the cell wall of
the organisms. Treatments with acid or alkali have been found to be effective in
cell wall hydrolysis. Acid hydrolysis is found to be more effective compared to
alkali treatment (Venkateswaran 1999; Somashekar et al. 2001). A number of
detergents damage the lipoproteins of the microbial cell membrane and lead to
release of intracellular components. The compounds which can be used for this
purpose include quaternary ammonium compounds and sodium lauryl sulphate.
Osmotic shock caused by sudden change in salt concentration is one of the
gentlest methods of disruption. This method is good for fragile cell wall (Sattur
1989).
Extraction with organic solvents
After breaking the cell walls, the lipids are extracted by different solvents
either individual or in mixtures like acetone, chloroform, methanol followed by
folch wash (Bligh & Dyer 1959; Folch et al. 1957; Lamacka et al. 1998), acetone-
methanol, ethyl ether, alcohol, hot methanol, petroleum ether, benzene, ethanol-
PDF created with pdfFactory Pro trial version www.pdffactory.com

104
hexane (Certik et al. 1996; Lamacka et al. 1998; Lopez et al. 2005). Burja et al.
(2007) studied using different solvent system on Thraustochytrium sp. ONC-T18
and observed that a drastic differences in the percentage of total lipid obtained by
various methods. However, the efficiency of extraction methods differs from one
organism to another and sometimes from strains to strain also (Certik et al. 1996;
lewis et al. 2000; Somashekar et al. 2001).
Extraction with supercritical fluid extraction (SCF)
The traditional extraction methods used to obtain these types of products
have several drawbacks; thus, they are time consuming, laborious, have low
selectivity and/or low extraction yields. Moreover, these techniques employ large
amounts of toxic solvents. At present, new extraction methods which are able to
overcome the above mentioned drawbacks are being studied, among them,
Supercritical Fluid Extraction (SFE) and Subcritical Water Extraction (SWE) are
among the more promising processes (Darani & Farahani 2005; Mendes et al.
2003; Sajilata et al. 2008). These extraction techniques provide higher
selectivities, shorter extraction times and avoids use of toxic organic solvents.
The need for rapid, efficient and safe methods for GLA extraction from
natural sources has been emphasized (Darani & Farahani 2005). Therefore,
several studies of supercritical fluid extraction of oils containing GLA and other
PUFAs have been reported from fungi using CO2, N2O, CHF3 and SF6 (Certik &
Horenitaky 1999; Sakaki et al. 1990), from evening primrose and borage sseeds
(Favati et al. 1991; Darani & Farahani 2005) and Spirulina platensis and Spirulina
Maxima (Quihui, 1999; Mendes et al. 2003; 2006) using CO2, Pythium irregulare
(Walker et al. 1999).
The supercritical fluid extraction (SFE) has been applied only recently to
sample preparation on an analytical scale. This technique resembles Soxhlet
extraction except that the solvent used is a supercritical fluid, substance above its
PDF created with pdfFactory Pro trial version www.pdffactory.com

105
critical temperature and pressure. This fluid provides a broad range of useful
properties. One main advantage of using SFE is the elimination of organic
solvents and to avoid the degradation of thermally labile components, thus
reducing the problems of their storage and disposal in the laboratory (Darani &
Farahani 2005; Mendes et al. 2006; Sajilata et al. 2008).
Purification of PUFAs
The major difficulty associated with microorganisms as sources of PUFAs
centres around the relatively extensive purification process to isolate and refine
oils. The PUFAs concentrates can be produced by several methods, including
freezing crystallization, urea complexation, molecule distillation, supercritical
fluid extraction, silver ion complexation and lipase concentration. Some methods
have involved a five-step process using a combination of chloroform, methanol,
and water to separate lipid classes followed by transmethylation, urea
fractionation, and reverse phase chromatography. Urea complexation is an
effective method of PUFAs isolation because urea preferentially complexes with
saturated and monounsaturated fatty acids to form solids which can be removed
from the PUFAs (Bajpai & Bajpai, 1993). Ethanolic KOH used for saponification,
followed by liquid chromatography to isolate the PUFAs fraction. A two-step
purification process involving only urea complexation and liquid chromatography,
achieved a range of 94 to 96% purity for GLA, AA, EPA and DHA (Ahmed et al.
2009).
PDF created with pdfFactory Pro trial version www.pdffactory.com

106
STRAIN IMPROVEMENT IN OLEAGINOUS
MICROORGANISMS
Commercial production of microbial oil has led to a flourishing interest in
the development of fermentation processes and has enabled several processes to
attain success (Gill & Valivety 1997; Hiruta et al 1996). When compared to health
benefits obtained from microbial source (SCO), the cost of production was
secondary (Certik & Shimizu 1999). Although the manipulation of microbial oil
composition is rapidly growing field of lipid biotechnology, the supply of
microbial lipids is still insufficient to meet pharmaceutical and nutraceutical
industrial demand (Papanikolaou et al. 2007; Ratledge 2004). Therefore
alternative strategies such as mutation methods, hybridization and molecular
engineering techniques could be combined with classical fermentation [Fig. 2.14]
(Hiruta et al. 1996; Jareokitmongkol et al. 1993 a, b; Wongsumpanchai et al.
2004).
Fig 2.14 Strategy for the Modification of microbial PUFA (Source: Certik et al. 1998)
Desired PUFAs
Desaturase inhibitors or activators
Screening of microorganisms
Optimization of fermentation process
Desaturase- defective mutants
Molecular- genetic approach
Enzymatic biotransformation
PDF created with pdfFactory Pro trial version www.pdffactory.com

107
MUTATION TECHNIQUES
Strain improvement is an essential part of process development for
microbial fermentation products. It is a means of reducing costs of developing
strains with increased productivity (total yield), ability to use low value added raw
materials, more specific advantageous characteristic such as improved filtration
properties, ability to produce under particular conditions of temperature or
aeration (Certik et al. 1998; Fakas et al. 2009a, b; Jang et al. 2005; Papanikoloau
et al. 2007). Inspite of the development of the newer techniques, such as rational
screening and genetic engineering, the traditional method of strain improvement
by mutagenesis and selection on the basis of random screening-still play central
role as a reliable and cost effective procedures (Certik & Shimizu 1999).
Mutation is a method of strain improvement and is nothing but inheritable
genetic change which is persists in the genome throughout the generations of the
organisms. From industrial point of view mutation is the alteration in genetic level
to achieve higher product yield. The change in genetic level (genotype) is
manifested outside (phenotype) as a change in one or more characters, which are
coded by that particular gene. Treatment with mutagens followed by selection of
putative mutants at lower temperatures resulted in the identification of several
new strains of microbes with higher GLA contents (Hiruta et al. 1996; Nakhara et
al. 1992).
Application of mutation techniques in production of desired PUFAs
Although several wild-type oleaginous microorganisms are able to
synthesize PUFAs-rich oils, these strains have a limited ability to produce new
PUFAs or increase existing PUFAs formation. Mutation techniques resulting in
the suppression or activation of specific desaturases and elongases are beneficial
not only for the production of tailor made fatty acids, but they can also be useful
for studying fatty acid biosynthetic pathway in oleaginous microorganisms (Certik
et al 1998; Certik & Shimizu 2003; Gunstone (1998); Jareokitmongkol et al. 1993
PDF created with pdfFactory Pro trial version www.pdffactory.com

108
a, b; Ratledge & Wynn 2002). Several mutants have been characterized and
employed for PUFAs synthesis using either defective in desaturases enzymes or
enhanced desaturase activities (∆5, ∆6 and ∆12) or their combinations (Certik et al.
1998; Jareonkitmongkol et al. 1993 a b; Laiteng et al. 2003). These mutants not
only exhibit significantly improved production of naturally occurring PUFAs, but
also form other PUFAs commonly not found in the wild type microorganisms
(Certik & shimizu 1999; Laoteng et al. 2003; Wongsumpanchai et al. 2004).
Another feature of mutants is that they can utilize exogenous fatty acids and allow
the production of various PUFAs in high yield. The biotransformation is very
promising from the biotechnological point of view (shinmen et al. 1992). There
are various sources easily available which are natural oil containing individual
fatty acid precursors. Thus, the mutants are excellent tools for regulating
exogenous fatty acids flow to targeted PUFAs. Moreover, the mutants because of
their simplicity of metabolism are considered to be excellent models for
elucidating the reaction mechanisms involved in fatty acid biosynthesis (Certik et
al. 1998; Certik & Shimizu 1999; Ratledge 2004). Among oleaginous microbial
strains, the mutants of M. alpina with their unique fatty acid biotransforming
enzyme system are probably the best studied (Certik et al. 1998; Certik & Shimizu
1999; 2000).
ii. HYBRIDISATION STUDIES
Protoplasts are osmotically fragile cells, which are completely devoid of
cell wall. Protoplasts can be isolated from microbial cells by specific lytic
enzymes to remove cell wall, in the presence of osmotic stabilizer. Such
protoplasts can be induced to fuse in the presence of agents such as the
polyethylene glycol (PEG). Protoplast fusion is a physical phenomenon, during
fusion two or more protoplast come in contact and adheres with one another in the
presence of fusion inducing agents. Cultivation of the protoplasts on a hypertonic
growth medium induces regeneration of new cell wall material and their
subsequent reversion to the normal cell form of the organism (Peberdy 1979). By
PDF created with pdfFactory Pro trial version www.pdffactory.com

109
protoplast fusion it is possible to transfer some useful genes responsible for
qualities such as disease resistance, nitrogen fixation, rapid growth rate, more
product formation rate, quality of protein, resistant to herbicide, drought, heat and
cold from one species to another. Protoplast fusion is an important tool in strain
improvement for bringing genetic recombination and developing hybrids strain in
filamentous fungi (Peberdy 1979). Parasexual hybrid protoplasts were obtained in
two different fusion of protoplast from two genetically different cells. The hybrid
protoplast contained heteroplasmic cytoplasm and two fused parent nuclei.
Protoplast fusion has been used to combine genes from different organisms to
create strains with desired properties. Fusion of protoplast is relatively a new
versatile technique to induce or promote genetic recombination in a variety of
prokaryotic and eukaryotic cells (Verma et al. 2007). This may be used to produce
interspecific, intergeneric, intraspeicific, intrageneric, intrastrain hybrids (Peberdy
et al. 1972, Prabhavathi et al. 2006). Fusion has also been found to be highly
effective for obtaining heterokaryons and enabling the use of filamentous fungi
for genetic studies and industrial strain improvement. Fusion technique has a
great potential for genetic analysis and for strain improvement. It is a powerful
technique for engineering of microbial strains with desirable industrial properties
(Muralidhara & Panda 2000; Verma et al. 1999).
Protoplast isolation
Protoplast isolation is an important technique in which that cell wall of
plant and microorganisms is degraded by using appropriate lytic enzymes. The
isolation of protoplasts from microbial cells involves the total digestion or
localized puncturing of the cell wall by enzymes allowing the cell contents
enclosed by the plasma membrane to escape. To maintain the protoplast as intact
structures, the protoplasts must be released into a hyper tonic or isotonic solution
to provide osmotic stability (Venkateswaran 1999). The success of this method
depends upon three important factors
PDF created with pdfFactory Pro trial version www.pdffactory.com

110
i. Use of appropriate enzymes,
ii. Ionic conditions and
iii. Osmotic stabilizers
Various commercial enzymes have been widely used in the isolation of
protoplasts from fungi. Enzymes of microbial origin are found to be highly
capable of digesting the cell wall. Lytic enzymes are the most favored for the
isolation of protoplast. Trichoderma harzianum has also been proved to be a
useful lytic organism showing activity against cells of a range of species. Lysing
enzymes from T. harzianum contains cellulase, protease and chitinase and other
enzymes which act very effective in cell wall digestion. Fungal wall degraded by
Novozyme-234 includes glucanase and chitinase enzymes (Peberdy 1980;
Venkateswaran 1999). Bacterial cell walls are degraded efficiently by the action
of lysing enzymes especially the lysozymes. In plants pectinase or macerozyme,
cellulose was used efficiently for protoplast isolation.
Protoplast isolation from batch cultures of a microorganism i.e. yeasts or
filamentous fungi are usually heterogeneous in nature with regard to their
physiology and biochemistry (Peberdy 1979; Venkateswaran 1999). The
physiological status and age of the culture is a major factor in determining
protoplast yield. On the other hand, the nature of the culture medium used also has
an effect. This phenomenon was observed by many workers in yeast and
filamentous fungi (Peberdy 1980; Venkateswaran 1999; Prabhavathi et al. 2006).
Early or exponential phase of growth cell culture are more preferable for
protoplasts isolation than the culture age of lag phase (Venkateswaran 1999).
Osmotic stabilizer
Stabilizers are essential to provide osmotic support to the protoplasts
following the removal of the cell wall. Many inorganic salts, sugars, and sugar
alcohols have been used for this purpose. Inorganic salts have proved to be highly
PDF created with pdfFactory Pro trial version www.pdffactory.com

111
effective with filamentous fungi, and sugars are found to be best suited for yeasts.
(Varavallo et al. 2007; Venkateswaran 1999).
Methods of protoplast fusion
After isolation of protoplasts from their parental strains, they are mixed in
equal numbers and treated with a fusogen. The treated material is then plated onto
a suitable medium and the fusion products are recovered, which may later be
subjected to direct or indirect selection. The protoplast fusion can be broadly
classified into two categories. Spontaneous fusion and Induced fusion. During
enzyme treatment the protoplasts adjoining to cells fuse through their
plasmodesmata to form multinucleate protoplast and this phenomenon is called as
spontaneous fusion. Fusion of free protoplast isolated from different sources with
the help of fusogen is known as induced fusion. Normally isolated protoplasts do
not fuse together because the surface of the isolated protoplast carries negative
charges around the plasma membrane out side. Thus there is strong tendency in
the protoplast to repel each other due to same charges. So this type of fusion needs
inducing agents which actually reduce the electro negativity of the isolated
protoplast and allow them to fuse with each other (Muralidar & Panda 2000).
The induced fusion can be brought from three ways, mechanical fusion,
chemical fusion and electro fusion.
Mechanical fusion: The protoplasts are physically brought into contact by
mechanically using micromanipulator or perfusion micropipette which is known
as mechanical fusion.
Chemofusion: Chemical fusogens cause the isolated protoplast to adhere each
other and leads to tight agglutination followed by fusion of protoplast. Several
chemicals have been used to induce protoplasts fusion such as sodium nitrate,
polyethylene glycol (PEG) and calcium ions. In T. harzianum, T. ressei and A.
niger protoplast fusion has been successfully carried out using the chemofusion
i.e. using PEG. Since the development of protoplast fusion in microbial systems,
PDF created with pdfFactory Pro trial version www.pdffactory.com

112
PEG has been established as a universal fusogens (Prabhavathi et al. 2006). A
study carried out by Anne & Peberdy (1976) confirmed the use of PEG to be
highly effective in inducing fusion of protoplasts of several fungal species.
Molecular weights of PEG 1000, 4000 or 6000 are equally effective in inducing
the aggregation of protoplasts during fusion. The different concentration of PEG
has been used to study the effect on protoplast fusion. Optimal concentration for
fusion was found to be 30% PEG and below 20% its stabilizing effect was lost, in
the lysis of cell wall. At higher levels i.e. above 30% the PEG was hyper tonic
causing protoplasts to shrink and produced a lower frequency of fusion. PEG
induced protoplast fusion of fungal protoplasts is influenced by the presence and
concentration of various cations. A requirement of Ca2+ ion is well established. In
the presence of Ca2+ ions, alkaline conditions stimulated the highest fusion
frequency. PEG forms a molecular bridge between adjacent membranes involving
hydrogen bonding in the membrane or indirectly utilizing the Ca2+ added to the
fusion mixture.
Electrofusion: recently, mild electric stimulation is being used to fuse
protoplasts. In this, two capillary microelectrodes are used to contact with the
protoplast. This method is easy to control and having 100% fusion frequency but
the instrument is sophisticated and expensive.
Regeneration of Protoplasts and Formation of Hybrid Cells
The induced fusion of protoplasts is clearly an artificial system, and the
prospects of using this technique to generate new products unobtainable by
conventional methods. In theory, protoplasts from any two organisms might be
expected to fuse following the treatment with PEG. In the filamentous fungi,
interspecies protoplast fusion leads to the formation of new colony forms called as
fusion products or fusants. The fusants are further subjected to various selection
procedures for their use in strain improvement.
PDF created with pdfFactory Pro trial version www.pdffactory.com

113
Studies of the regeneration of the cell wall and its biosynthesis the
protoplasts are very useful. The protoplasts of fungi, bacteria, plants, have the
capacity to synthesis whole cells from which they are derived, including the
ability to make a new cell wall (Peberdy 1980; Venkateswaran 1999; Verma et al.
2007). Fungal protoplast formed by various methods have been utilized in
regeneration studies, particularly all washed protoplasts are capable of
regeneration into new cells, their capacity being apparently determined primarily
by the physical conditions in the medium. Since the regeneration process in most
fungal protoplasts takes place very slowly, it is possible to follow the individual
stages of biosynthesis of the new cell wall. Many workers have demonstrated the
regeneration of protoplast in the fungus and yeasts (Peberdy 1980;
Narayanaswamy 1994; Varavallo et al. 2007). Once protoplasts have been
transferred to a growth medium with the stabilization they revert to typical normal
cells. The life of growth and regeneration found vary with the osmotic strength of
the medium and the cultural conditions under which they develop (Venkateswaran
1999).
The potentiality of the study of fungal protoplast helps to elucidate, many
problems associated with cell structure, growth, nutrition, biosynthesis and others.
The formation of protoplasts opened up new areas in the investigation of the role
of the cell wall in both physiology and genetics.
Use protoplast fusion (hybridization) used in Biochemical and Genetic studies
Protoplasts contain all the intracellular organelles of cells and form a vital
link in transfer of micromolecules in between cyto organelles. Currently most of
the laboratories involved in fungal genetics are using gene manipulation based on
protoplast fusion. Therefore to further improve genetic properties of the strain
using protoplast fusion are attempts to develop methods of preparation and
regeneration of protoplasts. The process involved is protoplast mutagenesis,
transformation and protoplast fusion (Evans 1983; Verma et al. 2007).
PDF created with pdfFactory Pro trial version www.pdffactory.com

114
Protoplast uses are as follows:
Ø For the preparation of cell membrane and the study of cell wall structure.
Ø For obtaining nuclei, vacuoles and tonoplasts.
Ø Preparation of cell organelles such as mitochondria, ribosomes,
endoplasmic reticulum, etc.
Ø Preparation of cell free extracts.
Ø The study of osmotic systems and permeability.
Ø For growth studies.
Ø The study of transport mechanisms of solutes.
Ø For tests of resistance to physical factors.
Ø Investigation of protein and enzyme synthesis effectively.
Ø For studies of localization of enzymes in cells.
Ø For the studies of the mode of action of antibodies and surface active
agents.
Ø For studies of the regeneration of the cell wall and its biosynthesis.
Ø For the studies of conjugation between protoplasts.
Ø For the studies on spore formation
(Spencer & Spencer 1981, Venkateswaran 1999)
Brume et al. (1992) showed that ten fold higher alkaloid production than
the parental strains by protoplast fusion without introducing any selective
auxotrophic markers. Intraspecific protoplast fusion carried out in Streptomyces
griseoflavus, the result indicated that increased production of desferrioxamine B
chelator (that absorbs additional iron from the blood of thalasemia patient)
(Verma 1999). Complete set of cellulase production by the protoplast fusion in T.
reesei and A. niger produced more amounts of endo and exoglucanase and other
produced more β-glucosidase was the best technique used (Ahmed & Berkely
2006). Prabhavathi et al. (2006) reported that the isolated protoplast from T. reesei
strain PTr2 showed high CMCase activity with 80% of fusants and more than two
fold increased in enzyme activities with two fusants SFTr2 and SFTr3 as
compared to the parental strain. Transfer of genes by protoplast fusion has been
PDF created with pdfFactory Pro trial version www.pdffactory.com

115
recently demonstrated as an efficient method of improving industrially important
microorganisms.
BIOTECHNOLOGY OF MICROBIAL LIPID PRODUCTION (Genetic Engineering)
A major challenge in modifying the lipid composition is to change the
degree of fatty acid unsaturation and reduce or increase the chain length of fatty
acids. Molecular engineering provides very powerful methodology and tools for
the investigation of complex metabolic pathways involved in PUFAs formation,
but also for the production of novel microbial varieties synthesising economically
valuable fatty acids (Certik et al. 1998; Certik & Shimizu 1999). In lower
eukaryotes i.e. in fungi, biochemical mechanism, structure and function such as
positional specificity relationship between fungal desaturases, and other fatty acid
modifiers, are still not well understood. The strategies for isolation and expression
of the genes responsible for the desired metabolic steps have to be designed
(Passorn et al. 1999). There are three independent genetic technologies to
engineer fatty acid composition:
• Cloning of genes encoding protein involved in PUFAs biosynthesis,
• Transgenic expression of desaturase genes
• Modification of cloned genes in order to engineer the expressed
protein (Certik et al. 1998).
Desaturases
Fatty acid desaturases play essential roles in fatty acid metabolism and the
maintenance of proper structure and function of biological membranes and living
organisms. There are two main types of fatty acid desaturases: the soluble and
membrane bound desaturases, both of which are dioxin-oxo enzymes (Murphy
1998; Laoteng et al. 2005b). The soluble desaturases that introduce double bonds
into fatty acids esterified to acyl carrier proteins are restricted to higher plants and
they have two conserved histidine rich motifs (Na-Ranong et al. 2006; Zang et al.
2004). Membrane bound desaturases which distribute widely and introduce
PDF created with pdfFactory Pro trial version www.pdffactory.com

116
double bonds into fatty acids esterified to acetyl -Co-A and glycerolipids are
characterized by three histidine rich motifs and four transmembrane domain
(Huang et al. 2001; Na-Ranong et al. 2006; Zang et al. 2004). Microsomal
membrane bound desaturases, microsomal desaturases can be further divided into
two groups: carboxyl directed and methyl directed desaturases such as ∆4-,∆5-and
∆6- desaturases (Laoteng et al. 2005a; Napier et al. 2004; Qiu et al. 2001; Zang et
al. 2004). The desaturase introduce double bonds in between the existing double
bond and carboxyl terminus of the fatty acyl chain. Methyl directed membrane
bound desaturases such as ∆12- desaturase introduce the double bond between the
existing bond and methyl terminus of the fatty acyl chain (Passorn et al. 1999).
Classification of desaturase enzymes are given in Table 2.17. Modification of the
fatty acid biosynthesis pathways by genetic manipulation to produce desired oil in
transgenic microorganisms and oil seed crops, as a possible alternative source,
this leads to the isolation of gene encoding for desaturase enzymes from various
organisms [Table 2.18] (Huang et al. 2004). The awareness of the enzymatic
reactions and corresponding metabolic pathways are well studied by molecular
characterization and these recombinant enzymes offer the prospect of producing a
desired fatty acid in oilseed crops (Napier et al 2001).
PDF created with pdfFactory Pro trial version www.pdffactory.com

117
Table 2.17 Classification of desaturases
Type Substrate Location e7 donor Soluble Saturated acyl-
ACP Plant plastids (∆9) Mycobacterium Streptomyces
Ferredoxin Ferredoxin Ferredoxin
Membrane: I Saturated acyl-
CoA Saturated acyl-lipid
ER of animals and lower eukaryotes (∆9) Cyanobacteria (∆9) Bacillus subtilis (∆5)
Cyt b5 Ferredoxin Ferredoxin
II (methyl-end)
Mono- or di-unsaturated acyl-lipids
Cyanobacteria (ω-6) Plant plastids (ω-6/ω-3) ER of plants, animals and lower eukaryotes (ω-6/ω-3)
Ferredoxin Ferredoxin Cyt b5
III (front-end) PUFA acyl-CoA/acyl-lipids PUFA acyl-lipids
ER of plants, animals and lower eukaryotes (∆6/∆5) Euglena (∆8) Lower eukaryotes (∆4) Cyanobacteria (∆6)
Cyt b5 Cyt b5 Cyt b5 Ferredoxin
1 Organism and subcellular location (and main regioselectivity) for desaturases. ER, endoplasmic reticulum; Cyt b5, cytochrome b5.
(Source: Uttaro 2006)
PDF created with pdfFactory Pro trial version www.pdffactory.com

118
Table 2.18 Biological sources Desaturases
(Source:
Lopez Alonso &
Garcia Maroto
2000)
Gene/enzyme
Biological source
∆9- desaturase Anabaena variabilis Synechocystis sp. Rosa hybrida Arabidopsis thaliana
n-3 desaturase s(microsomal)
Arabidopsis thaliana Glycine max Brassica napus Limnanthes douglasii Nicotiana tabaccum Triticum aestivum Perilla frutescens
n-3 desaturases (plastidial)
A. thaliana (FAD-7) A. thaliana (FAD-8) G. max B. napus N. tabaccum T. aestivum P. frutescens
∆12- desaturase (microsomal)
A. thaliana G. max Borago officinalis
∆12- desaturase (plastidial)
A. thaliana A. thaliana Spinacia oleracea
∆6- -desaturase Borago officinalis Physcomitrella patens Synechocystissp. Helianthus annuus Mortierella alpina
∆5- -desaturase Mortierella alpina
PDF created with pdfFactory Pro trial version www.pdffactory.com

119
OTHER IMPORTANT ω-6 & ω-3PUFAs
Linoleic acid (LA, 18:2, ω-6)
Linoleic acid (LA) is one of the most abundant PUFAs in all plants. It is
one of the ω-6 EFAs, the human desaturase cannot insert the double bond beyond
the ω-6 double bond, hence it must supply through diet. Low levels indicate
dietary insufficiency that leads to a variety of symptoms. Some of these symptoms
result from lack of LA in membranes where it serves a role in structural integrity
(Lenhinger 1993). LA is the starting point for the production of LC-PUFAs,
where it serves as precursors for production of local hormones like prostglandind
and leukotirenes. Dietary sources of LA are corn oil, sun flower oil, safflower oils
and soya, it needs for balanced production of hormones in human health (Lunn &
Theobald 2006).
Dihomo-gamma-linolenic acid (DHGLA 20:3 ω-6)
Eicosatrienoic acid, (20:3) or dihomo-gamma-linolenic acid, is an ω-6
PUFAs which is produced from GLA by specific fatty acid elongase enzyme
inserting the two carbon atoms. It is natural precursors of many C20 compounds
of biological interest, including prostaglandins 1 and 3 and thromboxanes
(Horrobin 1992; James et al. 2000). It is one of the many PUFAs currently
undergoing evaluation by scientist as to its potential future role in medicine and
also diets low in EFAs are almost universally low in DGLA (Kendrik & Ratledge
1998). In sufficiency of this acids leads to number of disorders, a wide range of
cellular functions and tissue responses (Lunn & Theobald 2006). Through the
amities not accumulating large quantity, but the microorganisms produce GLA.
When this GLA is supplied through the diet then DGLA accumulate more by
chain elongation (Huang et al. 2001; Ratledge 2004). Mortierella spp. are
producers in low amounts since it producing high quantity of AA (Dyal & Narine
2005). There are two ways to produce DGLA by fungi (Jareokitmongkol et al.
1993a);
PDF created with pdfFactory Pro trial version www.pdffactory.com

120
i. By adding inhibitors like sesamin (AA inhibitors) in the culture
medium and
ii. By getting AA deficient mutants
Production of DGLA by second method is advantageous since no
requirements of any inhibitors and it yields relatively high amount of DGLA
(Certik & Shimizu 1999). In metabolism the conversion of AA into DGLA is slow
process because desaturation is slow process, it is partly inhibited
(Jareokitmongkol et al. 1993a).
Arachidonic acid (AA, 20:4, ω-6)
The last ω-6 PUFAs is eicosatetraenoic acid (20:4, 5,8,11,14). AA serves
as substrate for the cyclooxygenase and lipooxygenase enzymes, leading to the
production of the 2 series prostanoids and leukotrienes (Huang & Ziboh 2001).
The production of AA was carried out in industrial level from genus Mortierella.
The highest level of AA (13 g / l, 220 mg/g mycelia) was achieved with M. alpina
IS-4 in a 10kl fermentor (Heighashima et al. 998). The fungal process is more
superior to the microalgal production among which Prophyridium cruentum is
probably best producer (Sakuradani 2009).
Several of these products have potent, proinflammatory and thrombogenic
activity. High AA also promotes gall stone formation by stimulating much
production in the gall bladder mucosa. Recently AA, together with the n-3
PUFAs, DHA, has been shown to augment free radical generation in tumour cells
grown in vitro (Innis 1991; Innis et al. 1994). Such research has fuelled the search
for replacements for the main sources of AA from porcine liver, porcine adrenal
gland and sardines. However, AA content in fish oil source is usually low and
alternative to these fungal cultures like Mortierella spp (Yu et al. 2003). were
searched for high unsaturated fatty acid especially AA(Aki et al. 2001; Buranova
et al. 1990).
PDF created with pdfFactory Pro trial version www.pdffactory.com

121
Eicosapentaenoic acid (EPA, 20:5, ω-3)
Eicosapentaenoic acid, 20:5 (5, 8, 11, 14, 17) is an ω-3 PUFAs of great
commercial potential production. Together with the ω-3 PUFAs docosahexaenoic
acid (DHA), it has been shown to prevent blood platelet aggregation and reduce
blood cholesterol hence reducing the rate of reoccurrence of coronary heart
diseases (Das 2006; Demaison & Moreau 2002; Huang et al. 1984). EPA is the
parent of the 3-series prostanoids and leukotrienes, which moderate the pro
inflammatory effects of the 2-series derived from AA (Napier et al. 2003).
Although EPA can be produced from the ALA, dietary intake of this fatty acid is
generally poor. The conversion also requires the action of the ∆6 desaturase
enzyme that may be at a low level by virtue of inadequate Zn, Mg, or vitamins
B3, B6, and C. Such enzyme impairment would be indicated if EPA levels were
low and ALA levels normal or high (Graham et al. 2004; Kendrik & Ratledge
1990). High levels of saturated, monounsaturated, and trans-fatty acids and of
cholesterol also limit the conversion of ALA to EPA (as well as that of GLA to
DGLA) (Graham et al. 2004). Fish oils are rich sources of EPA presently
(Ratledge 2003). When taken in sufficient doses, the ω-3 PUFAs also reduce the
incidence of inflammatory diseases such as asthma and type I diabetes mellitus
(Ruxton et al. 2004).
Docosapentaenoic Acid (DPA, 22:5, ω-3) and Docosahexaenoic Acid
(DHA, 22:6, ω-3)
Docosapentaenoic acid, 22:5 (7, 10, 13, 16, 9) and docosahexaenoic acid,
22:6 (4, 7, 10, 13, 16, 19) are the two terminal members of the ω-3 PUFAs
biosynthetic pathway. The growth and development of the central nervous system
is particularly dependent upon the presence of an adequate amount of the very
long chain, highly unsaturated fatty acids, DPA and DHA (Innis 1991; Kyle et al.
1992). Attention deficit hyperactivity disorder and failures in development of the
visual system in EFAs deficiencies are two examples of this dependency. DHA is
PDF created with pdfFactory Pro trial version www.pdffactory.com

122
an important member of the very LC-PUFAs (C22 to C26) that characteristically
occur in glycosphingolipids, particularly those in brain tissue. Since this fatty acid
is so important in early development, it is worth noting that the levels in breast
milk are correlated with the mothers’ intake of fish oils (Das 2006; Demaison &
Moreau 2002), which are rich sources of DHA and DPA. Fatty acids have
considerable medicinal and nutritional value for example; EPA and DHA; both ω-
3 fatty acid) have physiological effects in three areas i.e. heart and circulatory,
inflammatory and cancer (Kendrik & Ratledge 1988; Demaison & Moreau 2002).
A characteristic of marine micro organisms is the predominance of PUFA in their
cellular lipid. In the fungus Thraustochytrium aureum , Schizochytrium
aggregatum and T. roseum are reported for the production of DPA and DHA
(Kyle et al. 1992; Ratledge 2004).
Fat is more than just a source of energy PUFAs have significant role in
health and disease. Inadequacy of agricultural and animal oils has necessitated the
‘hunt’ for suitable sources for production of biologically important fatty acids like
GLA. New potential species should be screened and the characteristic should be
studied. Development of new microbial technologies using fungi for this
production needs lot of fundamental research on growth conditions of the fungi
and the effect of incorporation of different factors into media for good yield.
Mutation methods and molecular engineering steps also should be investigated.
Work has been done all over the world towards these goals. This review of
literature has covered the previously published literature on such researches.
This research investigation on “Polyunsaturated Fatty Acids (PUFAs) of
Mucor sp. with Special Reference to Gamma Linolenic Acid (GLA)” has been
planned based on this background material.
PDF created with pdfFactory Pro trial version www.pdffactory.com

123
CHAPTER -3
MATERIALS AND METHODS
PDF created with pdfFactory Pro trial version www.pdffactory.com

124
MATERIALS AND METHODS
I. MATERIALS
i. The following chemicals and reagents were procured and used in this study:
Microbiological media like potato dextrose agar, potato dextrose broth,
czapek dox agar, Fine chemicals like yeast extract, malt extract, beef extract,
bacteriological peptone, yeast nitrogen base without ammonium sulphate, succinic
acid, glycine etc used in the study were obtained from Hi- Media Chemicals.
Molecular biology reagents like acrylamide, bisacrylamide, ammonium
persulphate, tris (hydroxymethyl aminomethane), ethylene diamine tetra acetic
acid (EDTA), IPTG, X-gal, amino acids, sodium dodecyl sulphate (SDS), ethyl
methane sulphonate (EMS), N-nitro, N-methyl-N’-nitro-N-nitrosoguanidine
(NTG), N, N, N’, N’- tetramethyl ethylene diamine (TEMED), agarose, β-
mercaptoethanol, tween- 80, coomassie brilliant blue G 250, bromophenol blue,
xylene cyanol, bromocresol green, methyl red, ethidium bromide, fungal cell
lysing enzyme from Trichoderma harzianum, chitinase, chloramphenicol,
polyethylene glycol (PEG) 6000 and Sudan black-B, Fatty acid standards like,
myristic, palmitic, plamitoleic, heptadecanoic, stearic, oleic, linoleic and gamma
linoleic acids were procured from Sigma Chemicals, USA. Novozyme 234, the
enzyme used for cell wall lytic purpose was from NOVO Biolabs, Denmark. PCR
components like, Taq DNA polymerase, buffer, dNTPs, 1Kb, 3Kb, 10 Kb, λ-
markers and restriction enzymes were procured from Genie, Bangalore Pvt. Ltd.,
India.
Salts of ammonium nitrate, magnesium sulphate, ferrous sulphate,
manganese sulphate, potassium dihydrogen phosphate, potassium nitrate,
potassium sulphate, calcium chloride, zinc chloride, copper sulphate, disodium
hydrogen phosphate, ammonium sulphate, sodium hydroxide, citric acid, sorbitol,
PDF created with pdfFactory Pro trial version www.pdffactory.com

125
sodium thiosulphate, sodium carbonate, formaldehyde, phosphoric acid, glacial
acetic acid, hydrochloric acid, solvents like methanol, chloroform, petroleum
ether, hexane, benzene, acetyl chloride, of both analytical grade and HPLC grade
were obtained from Qualigens India Pvt. Ltd., E- Merck Chemicals, Glaxo India
Pvt. Ltd., BDH Chemicals and Sisco Research Laboratory Chemicals. Ethanol
was procured from standard distillery company. Ultra filter and RO water used in
all the experiments were collected from Millipore water purification unit, USA.
Whatman filter paper No.1 and No.42 were procured from Whatman Company.
The different oils used in this study were of pure, refined packed ones obtained
from local market of Mysore city.
All the glassware’s used in this study were obtained from Borosil and
Vensil Glass, India Ltd.
Standard cultures used in this study
Fungal strains viz, Mucor rouxii MTCC 386, and Mucor hiemalis MTCC
2877 were procured from Microbial Type Culture Collection Centre (MTCC),
IMTECH, Chandigarh, India for a comparative purpose. These fungal strains were
maintained as per the instructions given by MTCC.
ii. Culture Media Used:
i. Mucor Screening Medium : g/L Glucose 30 Yeast extract 5 Potassium dihydrogen phosphate 2.4 Potassium nitrate 1.0 Magnesium sulphate 0.5 Calcium chloride 0.1 Ferrous sulphate 0.015 Zinc sulphate 0.0075 Manganese sulphate 0.01 Copper sulphate 0.0005 pH 6.0 ± 0.2
PDF created with pdfFactory Pro trial version www.pdffactory.com

126
ii. Potato Dextrose Agar (PDA): g/L
Potato infusion 200.0 Dextrose 20.0 Agar-agar 20.0 pH 5.5 ± 0.2
iii. Fat Production Medium (FPM) (Enobes Medium): g/L
Glucose 40.0 Yeast extract 1.5 Ammonium nitrate 0.286 Magnesium sulphate 0.4 Calcium chloride 0.4 pH 5.8 ± 0.2
The FPM is described by the Enobes for fat production in R. gracilis with
slight modification was used. The nitrogen limited media contained 0.286 g/l and
for non-limited nitrogen medium higher concentration of 2.86 g/l of Ammonium
nitrate was used (Sattur 1989).
iv. Nutrient solution (NS): g/L
Yeast extract 5.0 Peptone 4.0 Magnesium sulphate 0.75
Potassium dihydrogen phosphate 1.0
v. Luria-bertani (LB) medium: g/L
Bacto peptone 10.0 Bacto-yeast extract 05.0 Sodium chloride 10.0 pH 7.2± 0.2
vi. Potato Dextrose Broth (PDB): g/L
Potato infusion 200.0 Dextrose 20.0 pH 5.5 ± 0.2
PDF created with pdfFactory Pro trial version www.pdffactory.com

127
vii. Czapek Dox Medium (CDM): g/L
Sucrose 30.0 Sodium nitrate 3.0 Dipotassium hydrogen phosphate 1.0 Magnesium sulphate 0.5 Potassium chloride 0.5 Ferrous sulphate 0.01 Agar-agar 20.0 pH 7.3± 0.2
viii. Synthetic Medium (SM): g/L
Glucose 30.0 Yeast extract 5.0 Potassium dihydrogen phosphate 2.5 Potassium nitrate 1.0 Magnesium sulphate 0.5 Calcium chloride 0.1 Ferrous sulphate 0.02 Zinc sulphate 0.01 Manganese sulphate 0.01 Copper sulphate 0.002 pH 5.5 ± 0.2
ix. Glucose Yeast extract Medium (GY): g/L
Glucose 20.0 Yeast extract 10.0 pH 6.0± 0.2
x. Mutant Screening Medium (MYA): g/L
Maltose 4.0 Glucose 12.0 Yeast extract 4.0 Peptone 6.0 Agar-agar 20.0 pH 5.5± 0.2 (Source: Hiruta et al. 1996)
PDF created with pdfFactory Pro trial version www.pdffactory.com
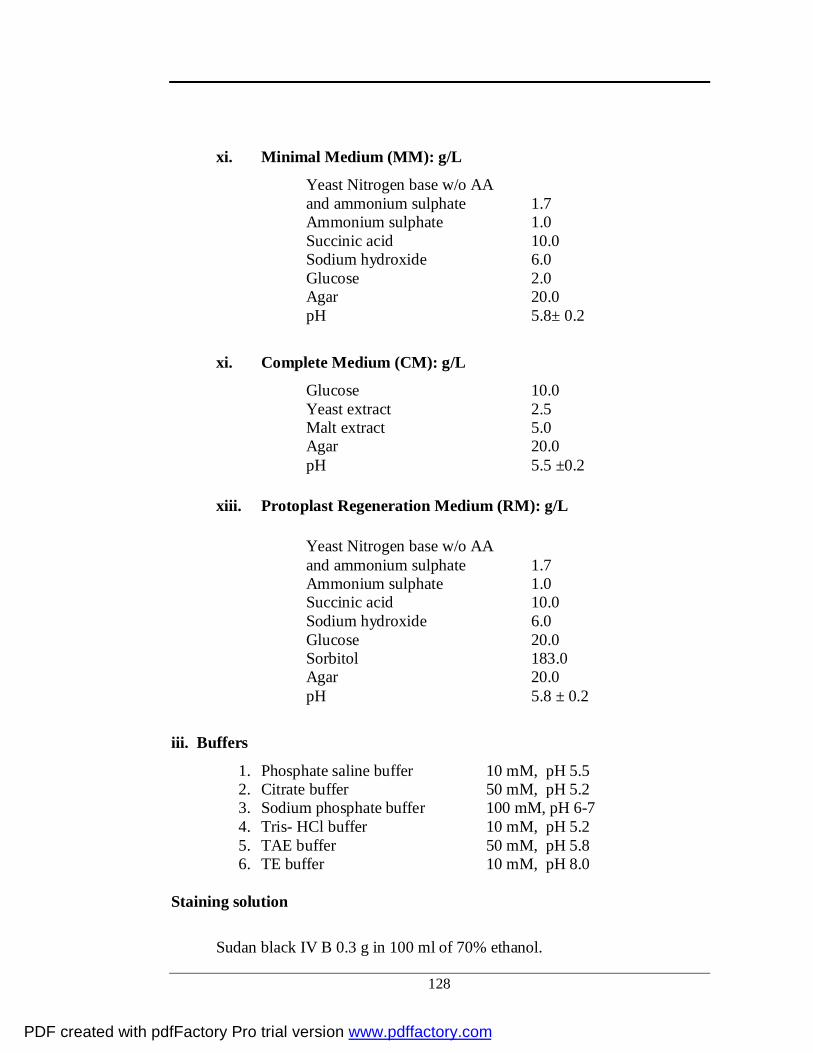
128
xi. Minimal Medium (MM): g/L
Yeast Nitrogen base w/o AA and ammonium sulphate 1.7 Ammonium sulphate 1.0 Succinic acid 10.0 Sodium hydroxide 6.0 Glucose 2.0 Agar 20.0 pH 5.8± 0.2
xi. Complete Medium (CM): g/L
Glucose 10.0 Yeast extract 2.5 Malt extract 5.0 Agar 20.0 pH 5.5 ±0.2
xiii. Protoplast Regeneration Medium (RM): g/L
Yeast Nitrogen base w/o AA and ammonium sulphate 1.7 Ammonium sulphate 1.0 Succinic acid 10.0 Sodium hydroxide 6.0 Glucose 20.0 Sorbitol 183.0 Agar 20.0 pH 5.8 ± 0.2
iii. Buffers
1. Phosphate saline buffer 10 mM, pH 5.5 2. Citrate buffer 50 mM, pH 5.2 3. Sodium phosphate buffer 100 mM, pH 6-7 4. Tris- HCl buffer 10 mM, pH 5.2 5. TAE buffer 50 mM, pH 5.8 6. TE buffer 10 mM, pH 8.0
Staining solution
Sudan black IV B 0.3 g in 100 ml of 70% ethanol.
PDF created with pdfFactory Pro trial version www.pdffactory.com

129
METHODOLOGY
SECTION 1
ISOLATION AND SCREENING OF OLEAGINOUS MUCOR Spp. FOR GLA PRODUCTION 1.1 Collection of Soil Samples
Soil samples were collected from different places like river banks, humus
soil, forest, agricultural land, plane land, Zoo, garden and pond soil for screening
oleaginous Mucor species. All soil samples collected, were properly labeled and
coded for further use.
1.2 Isolation of Mucor spp. from different soil samples
One g of soil sample was dispensed in 10 ml of sterile phosphate saline
buffer (10 mM, pH 5.5), mixed thoroughly and kept undisturbed for the solid
particles to settle down. 0.1 ml of the clarified supernatant was serially diluted and
appropriate dilutions of the sample were plated on Mucor screening medium
supplemented with 0.1 g/L Chloramphenicol to suppress any bacterial growth due
to heterogeneity of the soil nature. The plates were incubated at 28±2ºC for 5 days
to obtain mucor isolates.
1.3 Identification of Mucor spp.
Fungal mycelia morphologically similar to Mucor spp. from different agar
plates were mounted on a glass slide and stained with cotton blue. Mycelial
structure, sporangiophores and sporangiospores were observed under microscope
(Leica Heburgg, AG, Switzerland). The morphology of the fungus was compared
with standard cultures obtained from MTCC and this was further confirmed with
soil fungi manual (Gilman 1999). The confirmed isolates of Mucor spp. were
maintained on a PDA slants and stored at 4ºC. Sub-culturing was carried out in
every fortnight throughout this study.
PDF created with pdfFactory Pro trial version www.pdffactory.com

130
1.4 Screening of Mucor spp. for lipid production
Two methods were followed for screening of oleaginous Mucor spp. for
lipid production, i) qualitative analysis by dye binding method and ii) quantitative
analysis by gravimetric method
1.5 Qualitative Screening of Mucor spp. by staining method
The selected Mucor strains were stained with Sudan black B according to
the method of Burnod (1964) & du Preeze et al. (1997). Qualitative screening
method is given in flow chart. The presence of blue or grayish oil globules were
observed under oil immersion microscope within the mycelium.
Staining Method Fungal cell culture obtained from fermentation
Filtered through Whatmann no.1 paper & washed with distilled water
Resuspended in 5 ml of distilled water
Add 5 ml of 1 M HCI & 0.4 ml of Sudan black B to test tube
Stained cells served as the test material as against the unstained cell as control
Both tubes were then placed in a boiling water bath for 30s with intermittent shaking. Centrifuged & washed with distilled water
The tubes were then cooled & centrifuged at 3000 rpm for 10min
Supernatant was discarded
The cells were then washed with 50% alcohol
3-4 times, to remove excess stain
The cells were then resuspended in distilled water
Made a smear of culture solution from the cells
Observe under phase contrast microscope (oil immersion)
(Source: Baroda 1964; Venkateswaran 1999)
PDF created with pdfFactory Pro trial version www.pdffactory.com
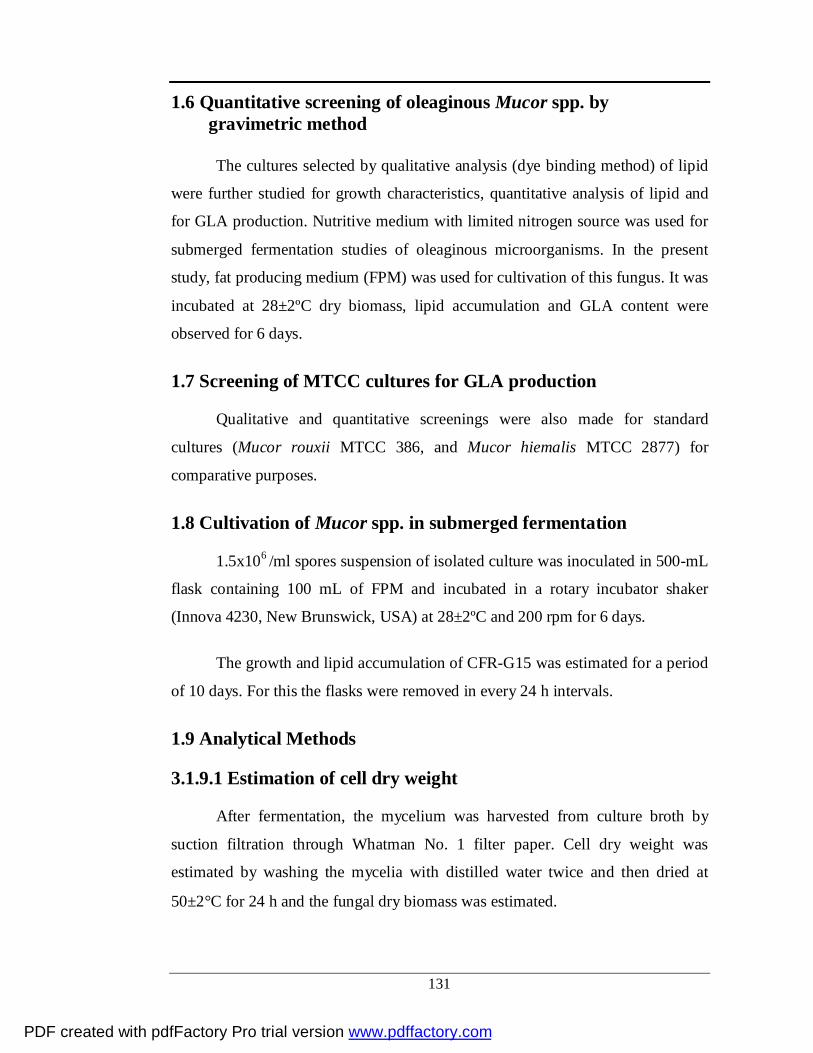
131
1.6 Quantitative screening of oleaginous Mucor spp. by gravimetric method The cultures selected by qualitative analysis (dye binding method) of lipid
were further studied for growth characteristics, quantitative analysis of lipid and
for GLA production. Nutritive medium with limited nitrogen source was used for
submerged fermentation studies of oleaginous microorganisms. In the present
study, fat producing medium (FPM) was used for cultivation of this fungus. It was
incubated at 28±2ºC dry biomass, lipid accumulation and GLA content were
observed for 6 days.
1.7 Screening of MTCC cultures for GLA production
Qualitative and quantitative screenings were also made for standard
cultures (Mucor rouxii MTCC 386, and Mucor hiemalis MTCC 2877) for
comparative purposes.
1.8 Cultivation of Mucor spp. in submerged fermentation
1.5x10⁶ /ml spores suspension of isolated culture was inoculated in 500-mL
flask containing 100 mL of FPM and incubated in a rotary incubator shaker
(Innova 4230, New Brunswick, USA) at 28±2ºC and 200 rpm for 6 days.
The growth and lipid accumulation of CFR-G15 was estimated for a period
of 10 days. For this the flasks were removed in every 24 h intervals.
1.9 Analytical Methods
3.1.9.1 Estimation of cell dry weight
After fermentation, the mycelium was harvested from culture broth by
suction filtration through Whatman No. 1 filter paper. Cell dry weight was
estimated by washing the mycelia with distilled water twice and then dried at
50±2°C for 24 h and the fungal dry biomass was estimated.
PDF created with pdfFactory Pro trial version www.pdffactory.com

132
1.9.2 Estimation of Lipid
Total lipid content of the Mucor spp. was estimated by gravimetric method
of AOAC (1991). The maceration method is given in flow chart. The lipid was
extracted by solvent contact method in soxhlet apparatus using analytical grade
Chloroform and Methanol (2:1 V/V) for 4-6 hours (Somashekar et al. 2003). 2-
3ml of solvent containing lipid fraction transferred to pre-weighed beaker and
refluxed with nitrogen gas and kept in desiccators under cold condition till total
lipid estimated by gravimetric method.
MACERATION PROCEDURE
1 gm of sample + 1 gm of acid washed sand &
ground with the help of pestle and mortar
The powder is transferred to Whatmann filter no.42
& tied with twine thread.
Packet, transferred to 0.5 N HCl in 500 ml beaker
Transferred to water bath, boiled for 1 hr
After boiling sample kept under running water for 30 min
Sample kept for drying in drier overnight
Lipid extraction (Source: Venkateswaran 1999)
1.9.3 Preparation of fatty acid methyl esters (FAMEs)
Fatty acid methyl esters (FAMEs) from the extracted lipid samples were
prepared by Kate’s method (1964) with slight modification. This method is given
in flow chart below. Known amount of lipid obtained from the culture dissolved
in chloroform and methanol (2:1) and saponified with 0.88% KOH. The upper
PDF created with pdfFactory Pro trial version www.pdffactory.com

133
layer-containing lipid was taken and passed through an anhydrous sodium
sulphate to remove the residual moisture content and solvent evaporated through
nitrogen reflexing. The samples were then methylated by adding Methanolic HCl
(methanol: acetyl chloride, 95:5) and kept for reflection in a water bath for 1 hr at
80ºC. After cooling to room temperature, FAMEs were extracted by hexane for
two to three times and the pooled samples reflected with nitrogen gas to remove
any moisture content and stored in -20°C for further use.
Preparation of FAMEs for Fatty Acid Analysis
Known amount of sample dissolved in chloroform: methanol
Transferred into a separating funnel & addition of 1 ml of 0.88% KCl
Collect the lower portion & repeat washing 2-3 times
Flush with nitrogen gas & concentrate to volume
Addition of 1 gm of sodim sulphate anhydrous & leave it for overnight
Extract with chloroform & dry completely
Addition of 5 ml of methanolic HCl (95 ml of cold methanol + 5 ml of cold Acetyl chloride)
Reflux for 90 min on water bath
Remove & allow it cool to room temperature
From 50ml conical flask transferred to separating funnel
Addition of 5 ml of Hexane & extract FAME fractions
Repeat 2-3 times & pooled extracted fractions
Evaporate completely dissolve in 100 to 200 ml distilled chloroform &
store it in small test tube storage vials for analysis
(Source: Kate 1964; Venkateswaran 1999)
PDF created with pdfFactory Pro trial version www.pdffactory.com
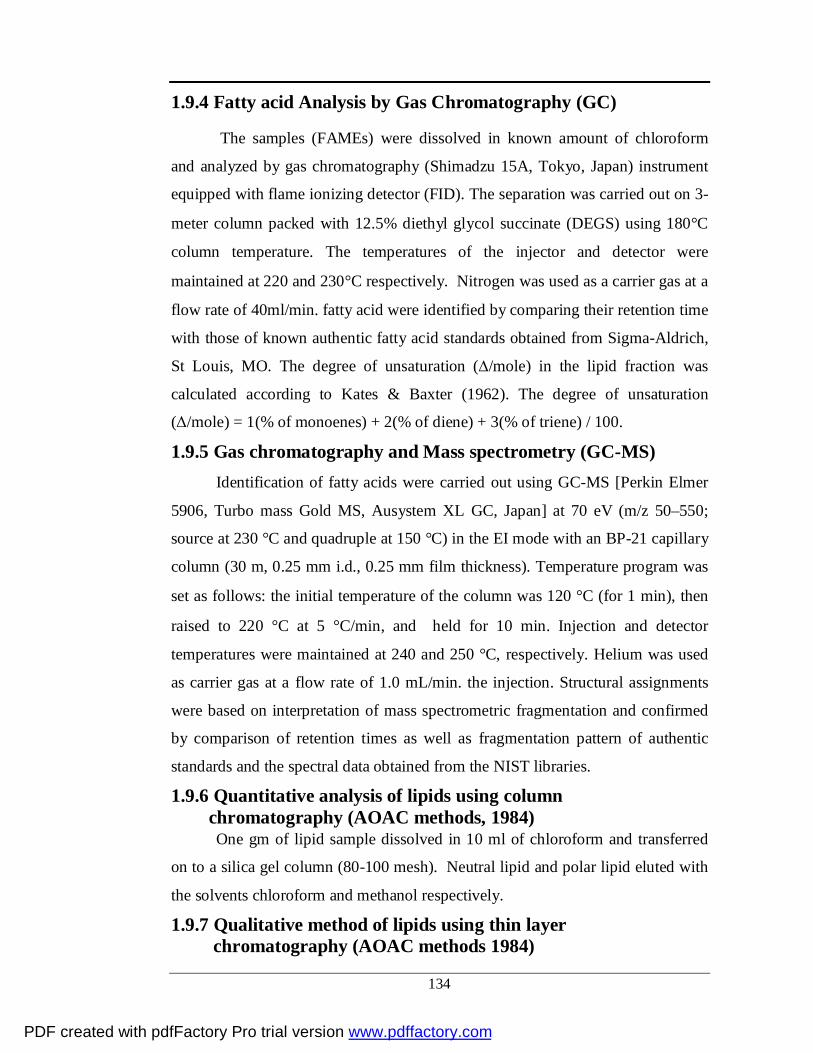
134
1.9.4 Fatty acid Analysis by Gas Chromatography (GC)
The samples (FAMEs) were dissolved in known amount of chloroform
and analyzed by gas chromatography (Shimadzu 15A, Tokyo, Japan) instrument
equipped with flame ionizing detector (FID). The separation was carried out on 3-
meter column packed with 12.5% diethyl glycol succinate (DEGS) using 180°C
column temperature. The temperatures of the injector and detector were
maintained at 220 and 230°C respectively. Nitrogen was used as a carrier gas at a
flow rate of 40ml/min. fatty acid were identified by comparing their retention time
with those of known authentic fatty acid standards obtained from Sigma-Aldrich,
St Louis, MO. The degree of unsaturation (∆/mole) in the lipid fraction was
calculated according to Kates & Baxter (1962). The degree of unsaturation
(Δ/mole) = 1(% of monoenes) + 2(% of diene) + 3(% of triene) / 100.
1.9.5 Gas chromatography and Mass spectrometry (GC-MS) Identification of fatty acids were carried out using GC-MS [Perkin Elmer
5906, Turbo mass Gold MS, Ausystem XL GC, Japan] at 70 eV (m/z 50–550;
source at 230 °C and quadruple at 150 °C) in the EI mode with an BP-21 capillary
column (30 m, 0.25 mm i.d., 0.25 mm film thickness). Temperature program was
set as follows: the initial temperature of the column was 120 °C (for 1 min), then
raised to 220 °C at 5 °C/min, and held for 10 min. Injection and detector
temperatures were maintained at 240 and 250 °C, respectively. Helium was used
as carrier gas at a flow rate of 1.0 mL/min. the injection. Structural assignments
were based on interpretation of mass spectrometric fragmentation and confirmed
by comparison of retention times as well as fragmentation pattern of authentic
standards and the spectral data obtained from the NIST libraries.
1.9.6 Quantitative analysis of lipids using column chromatography (AOAC methods, 1984)
One gm of lipid sample dissolved in 10 ml of chloroform and transferred
on to a silica gel column (80-100 mesh). Neutral lipid and polar lipid eluted with
the solvents chloroform and methanol respectively.
1.9.7 Qualitative method of lipids using thin layer chromatography (AOAC methods 1984)
PDF created with pdfFactory Pro trial version www.pdffactory.com

135
The extracted oil was dissolved in 1.5-2 ml of chloroform and 1.0 ml
spotted on activated silica gel G coated plates. The plates were run in a solvent
system containing petroleum ether: diethyl ether: acetic acid (90:10:1). After air-
drying the plates, the fractions were observed in an iodine chamber. For
identification of triacylglycerol (TG) and free fatty acid (FFA), triolein and oleic
acid standards were used respectively.
1.9.8 Analysis of residual sugar in the medium
Residual sugar estimation was performed using dinitrosalicylic (DNS)
method (Miller 1959). In brief, the broth centrifuged to remove the cells and
different aliquots of the sample were taken and made upto 1 ml with distilled
water. I ml of DNS reagent was added and boiled on a boiling water bath for 10
mins. The tubes were cooled to room temperature and the volume was made upto
10 ml with distilled water. OD was taken at 540 nm and the concentration of sugar
in mg/ml was calculated from the calibration chart prepared with glucose as
standard.
1.10 Solid- State Fermentation (SSF) 1.10.1 Media preparation Solid- state fermentation medium was prepared as follows: 50 g fresh
wheat bran was taken in clean acid- washed Erlenmeyer flask and autoclaved for
40 minutes at 121°C. After cooling, wheat bran was moistened uniformly with
sterile distilled water in an aseptic condition at 60% level. This medium was
inoculated with a known amount of spores (1.5X10⁶ /ml). The flasks were
incubated in an inclined position to facilitate proper aeration at ambient
temperature for an optimum growth period.
PDF created with pdfFactory Pro trial version www.pdffactory.com

136
1.10.2 Inoculum preparation Inoculum preparation and the nature of inoculum play a vital role in
deciding the quality and quantity of the ultimate product in solid- state
fermentation. In the present study, inoculum for solid-state fermentation was
prepared by cultivating the fungi in PDA slants for 7 days at 28±2ºC. To the fully
sporulated fungal slant, 2-3 ml of sterile Tween- 80 was added and the spores
were dislodged from the sporangiophores by gently scraping with a sterile needle.
Before inoculation spore count was taken using a Haemocytometer, Feinoptik,
Bad Blankenburg, Germany. An optimized level of 1.5X10⁶ ml inoculum was
used for all the SSF experiment to obtain maximum fermentation efficiency.
1.10.3 Determination of moisture content in the fermented bran
For all the samples, 1 g of fermented bran was used to measure the
moisture content. 1g of moldy bran was weighed exactly and dried in an oven at
55-60°C for 24 hrs until a constant weight was obtained. Final weight was then
measured and difference between the initial weight and the final weight was found
as the moisture content. This was converted into percentage moisture.
1.10.4 Extraction of Lipid
Fermented wheat bran (mouldy bran) dried at 55°C for 24 h and weighed.
Both substrates and homogenized fermented bran lipid extracted using
chloroform/methanol (volume ratio of 2:1). Total lipid content was determined
gravimetrically.
1.11 Statistical analysis
Data obtained from three independent analyses was expressed as mean ±
Standard deviation. Experimental data was subjected to analysis of variance and
Ducan’s multiple range test (p <0.05) using the Statistical Analysis System
(Duncans 1965).
PDF created with pdfFactory Pro trial version www.pdffactory.com

137
SECTION 2
MOLECULAR CHARACTERIZATION OF MUCOR SP. CFR-
G15 PRODUCING GLA
2.1 Genomic DNA extraction
(a) Reagents Required
(i) 0.8 % Agarose in 100 ml 1x TAE buffer.
(ii) 50x TAE buffer (g/ 100 ml): 24.2 g Tris base (pH 8.0), 5.7 ml of
glacial acetic acid and 10 ml of 0.5M EDTA (pH 8.0) were mixed and
the volume was made up to 100 ml with distilled water.
(iii) Lysis buffer (100 ml): 50mM Tris HCl (pH 7.2), 50mM EDTA, 3%
Sodium dodecyl sulfate (SDS), 2% β-mercaptoethnol (add just before
use)
(iv) Tris EDTA (TE) buffer: 10mM Tris HCl, 0.1mM EDTA.
(v) Chloroform:phenol (1:1)
(vi) SEVAG (chloroform:isoamyl alcohol, 24:1)
(vii) Sodium acetate: 3M (pH 8.0)
(viii) Isopropanol
(ix) Ethanol (70% and 100%, ice cold)
(x) DNA Loading dye: 0.25 g Xylene Cyanol, 0.25 g Bromophenol blue
and 30 ml glycerol in 100 ml distilled water.
(xi) Ethidium bromide (stock): 10 mg ethidium bromide was dissolved
in 1 ml distilled water. 0.07 ml of the stock was diluted with 500 ml
distilled water as working concentration, covered with aluminum foil
and refrigerated.
PDF created with pdfFactory Pro trial version www.pdffactory.com

138
2.1.1 Method 1
The genomic DNA extraction was performed according to method of Moller et
al. (1992) and the procedure is given below.
1. 100 mg lyophilized mycelium was ground with liquid nitrogen
2. Ground lyophilized mycelium (60-100 mg dry) was taken in eppendorf
tube.
3. 750 µl of lysis buffer was added, homogenized by vortexing and the
mixture was incubated at 65°C for 1 hr.
4. 700 µl of chloroform:phenol (1:1 v/v) was added and vortexed briefly.
Centrifuged at 12,000 g for 10 minutes.
5. 600-650 µl which is aqueous phase was transferred to a new tube.
6. 700 µl of SEVAG was added and vortexed briefly. Centrifuged at 12,000 g
for 10 minutes.
7. 550-600 µl of aqueous phase was transferred to a new eppendorf tube. 20
µl of 3M sodium acetate was added and inverted gently for several times.
8. Centrifuge was done at 12,000 g for 30 seconds to pellet the DNA.
Supernatant was poured out and tubes were inverted for 1 minute to drain.
9. 300 µl of TE buffer was added and placed in a water bath at 65°C for 10-
15 minutes.
10. 10 µl of NaOAc was added and top off the eppendorf tube with EtOH. The
tubes were inverted gently for several times.
11. Centrifuged as above for 30 to 120 sec. to pellet the DNA. Supernatant was
poured off and the pellet rinsed with 70% EtOH. Tubes were inverted to
drain off for 1 minute.
12. The tubes were dried in a vacuum oven at 50°C for 15 minutes.
13. DNA pellet was resuspended in 100 µl of TE buffer and stored at -20°C for
further use.
PDF created with pdfFactory Pro trial version www.pdffactory.com

139
2.1.2 Method 2
The genomic DNA extraction was performed according to method of
Tauk-Tornisielo et al. (2007) with slight modification and the procedure given
below.
1. The mycelium was harvested from a 3 days old culture and lyophilized.
2. Mycelium was ground in mortar and pestle with liquid nitrogen and
transferred into 25 ml centrifuge tube.
3. Lysis buffer was added, vortexed and incubated at 65°C for 1 hour,
4. An equal volume of phenol/chloroform/isoamyl alcohol (25:24:1 v/v) was
mixed with the solution and kept in ice for half an hour.
5. The solution was centrifuged at 14,000 rpm for 15 min. The upper phase
was transferred to a new tube
6. 3 M sodium acetate and isopropanol were used to precipitate DNA.
7. The DNA pellet was washed with 70% distilled ethanol.
8. The washed pellet dried and resuspended in TE buffer. DNA was used for
further study.
2.2 Analysis of DNA
Agarose gel preparation and analysis
1. o.8 % agarose was prepared and poured into the sealed boat.
2. The gel was allowed to set. The gel was placed in the electrophoresis tank
to cover the surface of the gel.
3. 10 µl of each sample mixed with 2 µl of loading dye. The samples were
loaded along with the marker.
4. Electrophoresis was carried out at 70 volts till the dye was reached 3/4th of
the gel.
5. The gel was removed from the tank and stained by soaking in a solution of
ehidium bromide for 30 min at room temperature.
PDF created with pdfFactory Pro trial version www.pdffactory.com

140
6. The gel was destained in distilled water for 10 min, examined on a UV
transilluminator (photodyne USA) and photographed.
7. The molecular size of genomic DNA was estimated based on the mobility
of the size marker.
2.3 Polymerase Chain Reaction (PCR)
2.3.1 The PCR Reaction
Table 3.1 PCR Reaction components
Components Volume (µl) Final concentration
Nuclease-free water X
10 X reaction buffer 5.0 1X
dNTP mix (10 mM) 1.0 0.2 mM each
Taq DNA polymerase 0.6 0.02 u/ µl
*25 mM MgCl2 3.0 1.5 mM
Downstream primer (R) 1.0 1.0 µM
Upstream primer (F) 1.0 1.0 µM
(The sequence and source of these primers are mentioned in Table 3.2 (Sigma
Aldrich, India)
Template DNA Y
50µl (Total volume)
Ø The PCR reaction was carried out for 25 µl reaction by taking half of the total volume mentioned in table 3.1
Ø The content of the tubes was mixed properly by a brief spin of micro centrifuge
Ø The tubes were placed in a thermocycler (Perkin Elmer, USA) and the reaction parameters were as follows:
1. Initial Denaturation: 95°C for 5 min 2. Denaturation: 94°C for 40 sec 3. Annealing: 54°C for 40 sec 4. Extension: 72°C for 5 min 5. Final extension: 72°C for 10 min No. of cycler (1-3) 35
PDF created with pdfFactory Pro trial version www.pdffactory.com

141
The method of electrophoresis used was as same as section 2.2. Here, 1.5%
of gel was used instead of 0.8% gel to estimate the PCR product. The 3Kb marker
used to estimate the molecular size of PCR product. The reaction product was
stored at -20°C until further use.
Table .2 PCR primers used in this study
2.3.2 Purification of PCR product
The amplified product (100bp to 10kb), was purified by using Sigma
GenElute PCR Clean up kit (Sigma Aldrich) and the protocol is given below:
Protocol
1. A GenElute Miniprep Binding column was inserted into a collection tube.
2. 1 volume of PCR reaction and 5 volumes of binding solution were added
and mixed.
3. Solution was transferred into the binding column.
4. The column was centrifuged at maximum speed for 1 min.
5. Collected liquid was discarded but, retained the collection tube.
Primers name Sequence (5’-3’) Expected amplicon size
SSF.18S GGTGAACCTGCGAAGG
SSR.18S CCTCCGCTTATTGATATGC
600bp
Des F1 GGATGAAATCCGTACCATGC
Des R1 CAGTCAAGCCACTCTGGAC
1.2kb
SSF CAGGCGGTGAGGCAG
SSR ATGACGAGGCAGTCTAGG
1.2kb
SS1N-F AGCACGATCCCGATATCC 600bp with SSR
PDF created with pdfFactory Pro trial version www.pdffactory.com

142
6. Binding column was replaced into the collection tube. 0.5 ml of diluted
wash solution was added to the column and centrifuged at maximum speed
for 1 min.
7. Collected liquid was discarded but, retained the collection tube.
8. The excess ethanol was removed by centrifuging at maximum speed for 2
min. Residual flow as well as the collection tube was discarded.
9. The column was transferred to a fresh 2 ml collection tube. 50 µl of elution
solution or water was applied to the center of each column.
10. The column was incubated at room temperature for 1 min.
11. DNA was eluted by centrifuging the column at maximum speed for 1 min.
The purified PCR product stored for further use.
2.3.3 A-tailing of PCR product
A-tailing of PCR product is needed to make 3’ OH protruding ends on both
the strands of DNA in order to make the PCR product compatible with T-tail
vector.
Protocol for A-tailing using Taq DNA polymerase
1. 1-2 μl of purified PCR fragment generated by proof reading DNA
polymerase was taken.
2. 1 μl of Taq DNA polymerase reaction buffer (1x) and 1 μl of 25mM MgCl2
were added.
3. Final concentration of 0.2mM of dATP was added.
4. 5 Units (2 μl) of Taq DNA polymerase in the reaction added and reaction
was make up the volume to 10 μl by demonized sterile water.
5. The reaction was incubated at 70 °C for 15 to 30 min.
6. PCR product was purified by using PCR product purification filters to
remove the residual dATP present in the reaction mixture.
7. 1-2 μl of A-tailed PCR product was used in T-tail vector ligation reaction.
PDF created with pdfFactory Pro trial version www.pdffactory.com

143
2.3.4 Ligation/cloning of purified PCR product to pTZ57r/ vector using Ins T/A clone PCR product cloning kit (Bangalore Genei kit, India) Reagents required 10 x Ligation Buffer* : 400mM Tris-HCl, 100mM MgCl2, 100mm DTT, 5.0mM ATP (pH 7.8)
PEG 4000*: 10x (50% w/v) PEG 4000 solution
T4 DNA Ligase, 5U/µl*: Prepared in 20mM Tris-HCl (pH 7.5), 1mm DTT, 50mM KCl, 0.1mM EDTA and 50% glycerol.
* Supplied with the kit
Protocol
1. The following components were added into a 1.5 ml centrifuge tube:
Plasmid vector pTZ57/T DNA 3.0 µl
Purified PCR fragment x µl
PEG 4000 solution 3.0 µl
T4 DNA ligase, 5U/µl 1.0 µl
10X Ligase buffer 3.0µl
Deionized water (to make upto) 30.0 µl
Incubated at 22°C for over night
2. The enzyme was inactivated by incubating the mixture at 65°C for 15 min.
2.4 Competent cell preparation and transformation
Reagents and bacterial strain:
E. coli DH5 α HOST CELLS (genotype: F’/endA1 hsdR17 (rk-mk
+) glnV44thi-
1recA1 gyrA (Nalr) relA1 ∆(laclZYA-argF)U169deoR(¢80dlac∆(lacZ)M15)
Colonies of E. coli DH5 α strain grown on LB agar plate (1.5% agar LB medium without ampicillin).
PDF created with pdfFactory Pro trial version www.pdffactory.com

144
Transformation and storage (TSS) buffer
Ingredients Quantity (100 ml) LB medium 85 (v/v) Polyethylene glycol (PEG) 10 (W/V) Dimethyl sulfoxide (DMSO) 5 (V/V) Magnesium chloride (MgCl2) 50mM final concentration TSS buffer should be sterilized and kept at 4°C after cooling.
SOB ( g/L)
Bacto-tryptone 20.0 Bacto-Yeast extract 5.0 Sodium chloride 0.6 Potassium chloride 0.19 Magnesium sulphate 10.0mM (added from 1.0M stock) Magnesium chloride 10.0mM (added from 1.0M stock)
Autoclave the first four components at 1210C for 15 min and the
magnesium salt separately and then mix to constitute the SOB medium.
SOC (per 100 ml): To 1.0 ml of SOB add 7 µl of filter-sterilized glucose solution
(50%w/v)
0.1M CaCl2 stock solution: Dissolved 1.47 g of CaCl2 in 100 ml of deionised
water. The solution was sterilized by filtration and stored as 20 ml aliquots at -
20°C.
Ampicillin stock solution: 100 mg of ampicillin was dissolved in 1.0 ml of
deionised water, sterilized by filtration. Stored at -40C and working concentration of
100 µg ml-1 of the medium was used.
0.1M IPTG stock solution: IPTG of 0.12 g dissolved in 5.0 ml of deionised water.
Filter-sterilized solution was stored as aliquots at -20°C.
PDF created with pdfFactory Pro trial version www.pdffactory.com

145
X-Gal stock solution: X-gal of 100 mg dissolved in 2.0 ml of N, N'-
dimethylformamide (DMF). The solution in micro centrifuge tube was wrapped in
aluminium foil and stored at -20°C.
2.4.1 Preparation of E. coli DH5 α competent cells by DMSO-PEG
method (Halami 2004)
1. E. coli DH5 α strain was streaked on LB agar plate (1.5% agar without
ampicillin) and incubated at 37° C for overnight.
2. Isolated single colony of DH5α cells from LB agar plate was picked and
inoculated to 2 ml of LB media. The cells incubated for overnight at 37 oC
in an incubator shaker (~200rpm).
3. 0.1ml of the overnight grown culture was inoculated into 50ml sterile LB media in 250ml Erlenmeyer flask. The cells were incubated in shaker incubator (~200rpm) at 37 oC.
4. The cell growth was monitored periodically to determine the OD590 reaches 0.6 to 0.8 (approximately 3-4 hrs) of the culture.
5. When the OD reaches 0.45 to 0.5, the cells transferred into polypropylene tube and culture was cooled by storing the tube on ice for 10mins.
6. Centrifuged at 4000 rpm for 5min at 4°C to recover the cells. 7. The supernatant from the cell pellet was discarded and the tubes were kept
in an inverted position for 1min to allow traces of media to drain away. 8. Resuspended the cells in 1/10th volume of TSS buffer. Incubated the cells
on ice for 15-20 minutes. Aliquots of 200 µl cells on ice (tubes are pre-chilled). Freeze the aliquots immediately by storing at –20oC. (Note: cells can be used immediately for transformation or stored in –200C for 1-2 months durations). [Note: all micro tips, tubes were pre-chilled]
2.4.2 Transformation of E. coli DH5 α
1. Suspension of 200 µl competent cells was transferred into a prechilled sterile
micro-centrifuge tube.
2. DNA (~50 ηg) was added into each tube, the contents of the tube mixed by
swirling gently. The tubes were stored on ice for 30 minutes.
PDF created with pdfFactory Pro trial version www.pdffactory.com

146
3. The following control samples were included: (a) Competent cells that
receive 1 and 2µl of standard super coiled plasmid DNA, (b) competent cells
that receive restricted enzyme digested DNA and (c) only competent cells as
a control.
4. The tubes were transferred into water bath set at 42°C. The tubes were
incubated for 90 seconds.
5. The tubes were rapidly transferred to ice and allowed the cells to chill for 1-
2 minutes.
6. 800 µl of prewarmed LB medium was added to each tube. The cultures
incubated for 45 minutes at 37°C in a shaker incubator set at 150 rpm. (This
step allowed the bacteria to recover and express the antibiotic resistance
marker encoded by plasmid).
2.4.3 Selection of transformants/recombinants
1. 100 µl of transformation mix was plated onto LB agar plates containing 100
µg ml-1 ampicillin, 0.5 mM IPTG and 80 µg ml-1 X-Gal.
2. The plates were incubated at 37°C overnight for the colonies to grow.
2.5 Analysis of transformants/recombinants 1. Plasmid isolation from the transformants.
2. Restriction digestion experiment to check for inserts release from
recombinants.
3. PCR analysis for recombinants
2.5.1 Isolation of recombinants plasmid
Reagents Required
Antibiotic Stock (Ampicillin): 100 mg/ml in distilled water and sterilized by
filtration. Store at -20°C and use at a working concentration of 100 µg/ml.
PDF created with pdfFactory Pro trial version www.pdffactory.com

147
Solution I
50mM glucose
25mM Tris-Cl (pH 8.0)
10mM EDTA (pH 8.0)
Solution II
0.2 N NaOH (freshly prepared from 10 N NaOH)
1.0% SDS
This can be preferably prepared freshly.
Solution III
5.0M Potassium acetate 60.0ml
Glacial acetic acid 11.5 ml
Distilled water 28.5 ml
The resulting solution is 3.0M with respect to potassium and 5.0M with respect to
acetate.
Protocol (Halami 2004)
1. Single colonies of appropriate strain in 2 ml of LB broth containing
antibiotic was incubated.
2. The culture was incubated for overnight in a shaker incubator at 37°C and
180 rpm.
3. 1.5 ml of the overnight culture was transferred into a 1.5 ml micro
centrifuge tube and the cells harvested by centrifugation at 10,000 rpm for
2 min.
4. Supernatant was discarded.
5. 100 µl of solution I was added and vortexed vigorously until no visible
clumps of cells were observed. The samples were kept on ice for 5 min.
6. 200 µl of freshly prepared alkaline solution (solution II) was added and
mixed gently by inverting the tubes several times. The cell suspension
observed for clear. The samples were kept on ice for 5 min.
PDF created with pdfFactory Pro trial version www.pdffactory.com

148
7. 150 µl of ice-cold potassium acetate solution (solution III) was added and
inverted gently (the purpose of this step was to selectively renature the
plasmid DNA).
8. Centrifugation of tubes at 10,000 rpm for 15 min.
9. The supernatant transferred into a fresh tube, an equal volume of phenol-
chloroform was added and vortexed thoroughly. By centrifugation at
10,000 rpm for 10 min two phases formed.
10. The upper aqueous phase was transferred into fresh tube and an equal
volume of chloroform added. To remove the phenol, the tubes were
centrifuged at 10,000 rpm for 10 min.
11. The upper aqueous phase was transferred into a fresh tube and double
volume of absolute ethanol added. The tubes were kept at -20°C for
precipitation.
12. Centrifugation at 10,000 rpm for 10 min. The supernatant was discarded
carefully without dislodging the pellet.
13. 300 µl of 70% ethanol was added and centrifuged to remove salts.
14. The pellet was air dried and dissolved in 20 µl of TE buffer.
15. Each sample was tested by agarose gel (0.8%) electrophoresis as per the
method given in section 2.2.
Restriction digestion of plasmid DNA (Halami 2004) 1. The following reagents was added (reaction mixture was make up to a 20
µl)
Plasmid DNA 5 µl (~1 µg)
10X Restriction enzyme buffer 2 µl
Restriction enzyme 1 µl (10 U, Eco R1)
Sterile distilled water 12 µl
2. The contents were mixed gently with a pipette tip and spinned briefly.
3. The reaction mixture was incubated at 37 °C for 5- 6hrs
PDF created with pdfFactory Pro trial version www.pdffactory.com

149
4. The reaction was ceased by heating at 65°C for 20 min and analyzed by
agarose gel (0.8%) electrophoresis as previously mentioned.
2.6 Nucleotide sequence analysis
The nucleotide sequence was analysed by BLAST (Altschul et al. 1997)
and determined sequences submitted to the GenBank with the accession numbers
EU927296 and EU526025 for 18S rRNA and ∆6 DES genes, respectively.
2.7 Phylogenetic analysis
The partial gene sequences obtained were aligned by Clustal X and
phylogenetic tree constructed was by software MEGA 3.1 version (Kumar et al.
2004). The DES gene sequences obtained from NCBI, were AF296076 (Mucor
rouxii); BOU79010 (Borago officinalis); AY795076 (Rhizopus stolonifer);
AY941161 (Thamnidium elegans); AF465282 (Mortierella isabellina); EF494667
(Phaeodactylum tricornutum). Neighbor joining method with bootstrap of 500
replicates generated the phylogenetic tree.
PDF created with pdfFactory Pro trial version www.pdffactory.com
150
SECTION 3
OPTIMIZATION OF CULTURAL CONDITIONS FOR BIOMASS, LIPID AND GAMMA LINOLEIC ACID (GLA) CONTENT OF MUCOR ROUXII CFR-G15.
3.1 Fungal strain
Mucor rouxii CFR-G15 an oleaginous fungus was isolated from the soil
sample. This fungus has been deposited in CFTRI, Institutional Microbial Type
Culture Collection Centre. The strain has been maintained on the potato dextrose
agar slants with repeated sub culturing.
3.2 Cultural condition
All experiments were performed in 500-ml Erlenmeyer flasks containing
100±2 ml of growth medium sterilized at 121°C for 20 min. The pH was adjusted
by the addition of 0.1N NaOH and HCl solutions accordingly before autoclaving.
Six days incubation period was chosen based on the previous experiment
conducted in section 1. To ensure that the lipid yields do not include any
unutilized supplemented oil, fungi which were grown on media with
supplemented plant oils were first washed extensively with deionized water then
with tween 80 (Kendrick & Ratledge 1996). The lab temperature was maintained
at 28.0 ± 2.0°C and this has been referred in the text as room temperature (RT).
All experiments were replicated in triplicate. The reported values are mean and ±
Standard deviation.
3.3 Media optimization Five different media viz., Fat producing media (FPM), synthetic media
(SM), glucose yeast extract media (GY), potato dextrose broth (PDB) and czepeck
dox broth (CDB) were used to determine the optimal media for growth of this
organism. The composition of each media is given in material section (ii).
PDF created with pdfFactory Pro trial version www.pdffactory.com

151
3.4 Physical Parameters
3.4.1 pH optimization
The initial pH of the growth media were from 3.00±0.02 to 9.00±0.02. This
was adjusted by the addition of 0.1M solutions of NaOH or HCl accordingly, to
determine the optimal pH range for growth of this organism. pH adjustment was
done prior to autoclaving the medium.
3.4.2 Temperature optimization
To determine the optimal temperature of growth, biomass build up and
lipid yield, Culture medium was incubated at different temperatures like 5, 10,
15, 20, 25, 30, 35 and 40 °C (±0.5 °C) for 6 days in the orbital shaker.
3.4.3 Aeration optimization
To study the effect of aeration on cellular lipid accumulation, batch culture
was performed in 500 ml Erlenmeyer flasks containing 50, 75, 100, 125, 150 175
and 200 ml liquid medium respectively.
Ratio (R) = volume of medium/ volume of Erlenmeyer flask (500ml)
3.4.4 Inoculum size optimization
To determine the optimum concentration of inoculum and effect of the
concentration on cellular lipid accumulation and GLA production, different
concentration of inoculum size was experimented.
The inoculum size from 1 to 5% containing 1.5X10⁶ spores/ ml was
inoculated into flasks containing liquid medium and incubated at RT for 6 days.
PDF created with pdfFactory Pro trial version www.pdffactory.com

152
3.5 Chemical Parameters
3.5.1 Optimization of different carbon sources
Glucose, fructose, sucrose, maltose, galactose, lactose, and starch were
used as different carbon sources, to determine their effect on biomass production,
lipid accumulation and GLA content. All sugars were used at 4% level in the
medium. Ammonium nitrate and yeast extract were used as the nitrogen sources.
The experiment was performed at RT, which is close to the temperature where the
best results have been obtained in different temperature experiment and
convenient for an eventual industrial scale production.
After selecting glucose as a source of carbon, a further study was
undertaken to optimize glucose concentration at different level (0-10%)
supplemented in growth media. Medium without carbon source was considered as
control.
3.5.2 Optimization of different nitrogen sources
The nitrogen sources in this study tested were ammonium nitrate, sodium
nitrate, ammonium sulphate, ammonium chloride, potassium nitrate, urea, yeast
extract, casein and peptone. Glucose at the level of 4% was used as carbon source.
The good nitrogen source was studied further at different concentrations of
0.25%, 0.50% and 1.00%. Medium containing 0% nitrogen source was used as
control.
3.5.3 C:N ratio optimization
To study the effect of carbon and nitrogen ratio (C:N Ratio) on biomass,
lipid and GLA production, carbon source (glucose) and nitrogen source (in the
ratio of yeast extract and ammonium nitrate) were used in different ratio in the
medium ranging from 20 to 120.
PDF created with pdfFactory Pro trial version www.pdffactory.com

153
3.5.4 Metal ion supplementation
Magnesium (Mg2+), manganese (Mn2+), zinc (Zn2+), and copper (Cu2+) ions
in the form of sulfates (MgSO4, MnSO4.H2O; ZnSO4 and CuSO4). Iron (Fe2+) and
calcium (Ca2+) ions in the form of iron II chloride tetrahydrate (FeCl2.4H2O,
CaCl2). All metal ions were added in different concentration to the media and
their effect on growth, lipid yield, and GLA content were determined.
3.5.5 Plant Oil supplementation to medium
The effect of supplements such as sunflower, coconut, mustard, palm,
gingelly, ground nut, niger seed oils were investigated. The control medium
contained 4% glucose, whereas the oil supplemented to growth medium (FPM)
was having 2% (w/v).
3.6 Medium optimization by RSM method
3.6.1 Experimental design
Based on prior trails in the laboratory and published literature (Hansson &
Dostalek 1988; Somashekar et al. 2003) glucose, yeast extract and ammonium
nitrate were found to be the most critical variables in the production of GLA by
Mucor species. Hence these variables were selected for optimization to maximize
the level of GLA production. In keeping with this objective, a RSM with CCR
design proposed by Montgomery (1984 & 1997) and Myers & Montgomery (1971
& 2002) were used to maximize the level of GLA production.
Three independent variables, glucose (X1), yeast extract (X2) and
ammonium nitrate concentrations (X3) and the dependent response variable GLA
were considered. Each independent variable was studied at five coded levels (-
1.682, -1, 0, +1, +1.682). The coded and the corresponding values of the three
variables are presented in Table 3.3. A series of 20 experiments including five
replicates of the centre points were performed. The minimum and maximum
PDF created with pdfFactory Pro trial version www.pdffactory.com
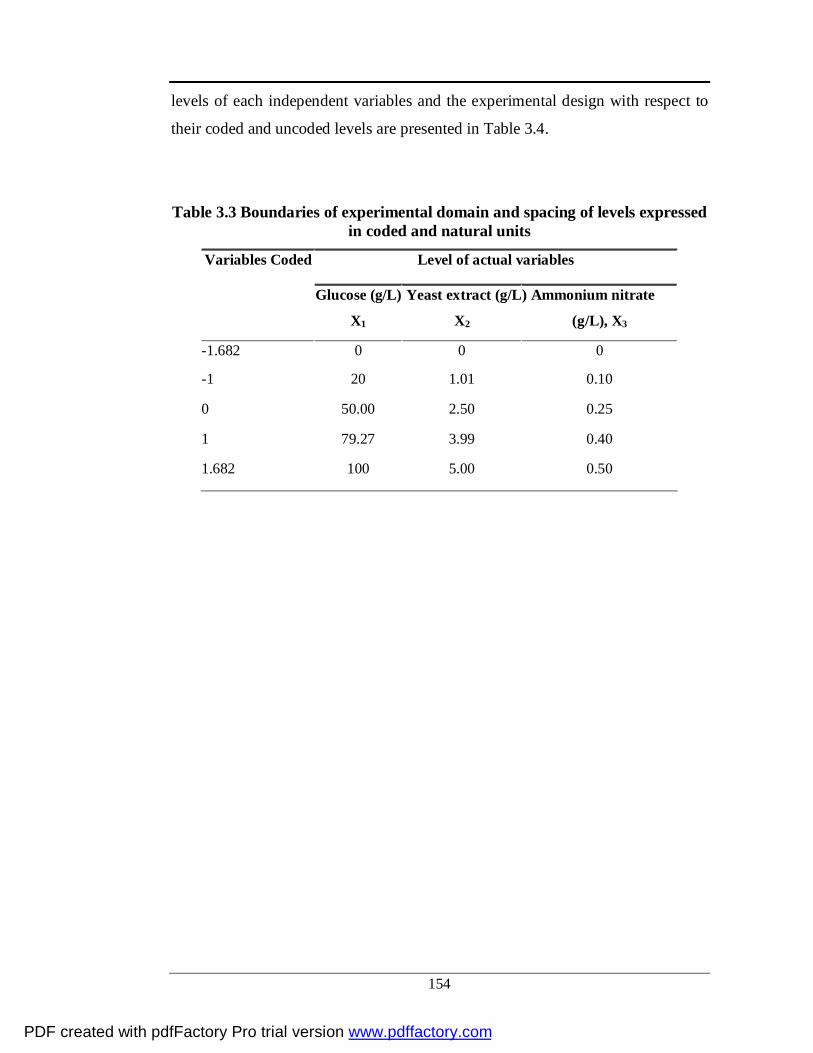
154
levels of each independent variables and the experimental design with respect to
their coded and uncoded levels are presented in Table 3.4.
Table 3.3 Boundaries of experimental domain and spacing of levels expressed in coded and natural units
Level of actual variables Variables Coded
Glucose (g/L)
X1
Yeast extract (g/L)
X2
) Ammonium nitrate
(g/L), X3
-1.682 0 0 0
-1 20 1.01 0.10
0 50.00 2.50 0.25
1 79.27 3.99 0.40
1.682 100 5.00 0.50
PDF created with pdfFactory Pro trial version www.pdffactory.com
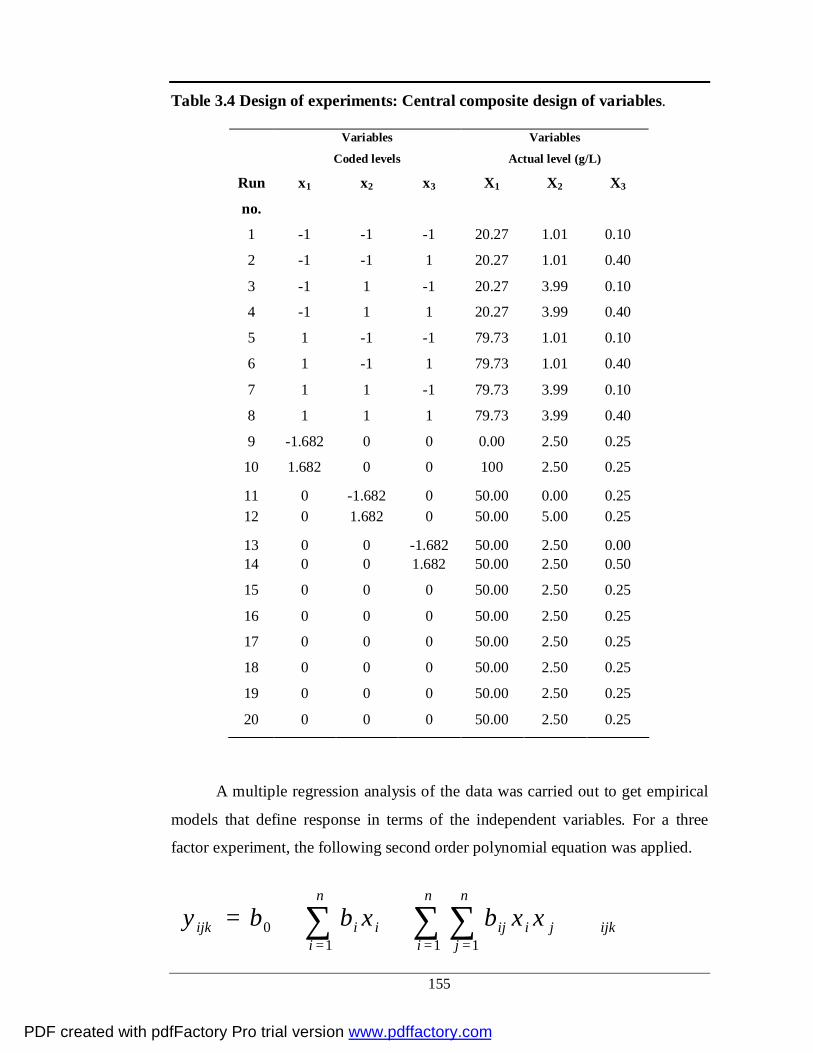
155
Table 3.4 Design of experiments: Central composite design of variables.
Variables
Coded levels
Variables
Actual level (g/L)
Run
no.
x1 x2 x3 X1 X2 X3
1 -1 -1 -1 20.27 1.01 0.10
2 -1 -1 1 20.27 1.01 0.40
3 -1 1 -1 20.27 3.99 0.10
4 -1 1 1 20.27 3.99 0.40
5 1 -1 -1 79.73 1.01 0.10
6 1 -1 1 79.73 1.01 0.40
7 1 1 -1 79.73 3.99 0.10
8 1 1 1 79.73 3.99 0.40
9 -1.682 0 0 0.00 2.50 0.25
10 1.682 0 0 100 2.50 0.25
11 0 -1.682 0 50.00 0.00 0.25 12 0 1.682 0 50.00 5.00 0.25
13 0 0 -1.682 50.00 2.50 0.00 14 0 0 1.682 50.00 2.50 0.50
15 0 0 0 50.00 2.50 0.25
16 0 0 0 50.00 2.50 0.25
17 0 0 0 50.00 2.50 0.25
18 0 0 0 50.00 2.50 0.25
19 0 0 0 50.00 2.50 0.25
20 0 0 0 50.00 2.50 0.25
A multiple regression analysis of the data was carried out to get empirical
models that define response in terms of the independent variables. For a three
factor experiment, the following second order polynomial equation was applied.
∑ ∑ ∑
= = =
∈+++=n
i
n
i
n
jijkjiijiiijk xxbxbby
1 1 10
PDF created with pdfFactory Pro trial version www.pdffactory.com
156
y x x x xn n i ni i i nii i i j i nij i j= + + += = = = +
β β β β0 1
3
1
32
1
2
1
3Σ Σ Σ Σ
ß0, ßi, ßii, and ßij constant co-efficients; Xi coded independent variables by the
equation, X di i i i= −2[( ) / ]φ φ Where Φi : actual values in original units; φ i :
average of low and high levels and di : difference between extreme levels. The
coding facilitated the computations for regression analysis and optimum search
operations.
The response 3D graphs were generated from the regression equation and
keeping the response function on the Z axis with X and Y axes representing the
two independent variables and the third variable constant at its centre (`0’, in
coded level). The ANOVA was performed in coded level of variables to study the
effects of independent variables. The 3D graphs were generated to understand the
effect of selected variables individually and in combination to determine their
optimum level for maximal production of GLA.
3.6.2 RSM optimization Optimization of variables to maximize the response was conducted by
canonical method (Khuri & Cornell 1989). Accordingly, the response function
was expressed in terms of the new variables (Myers & Montgomery 2002) and
roots were calculated to know the nature of the response whether minimum,
maximum or mini-max saddle point. The response function was considered
minimum when the signs of all the roots were positive while if they were
negative, then the response is maximum. If roots are mixed with positive and
negative signs then response will be considered as saddle or mini-max point. The
`statistica' (Stat Soft, Tulsa, OK USA) software was used to perform all the data
analysis, ANOVA, regression and canonical which includes generation of 3D
response surfaces.
3.7 Analytical Methods Estimation of cell dry weight, Lipid, fatty acid analysis and DNS method
has already been given in section 1.9.1, 1.9.2, 1.9.3, 1.9.4, 1.9.5 and 1.9.8.
PDF created with pdfFactory Pro trial version www.pdffactory.com
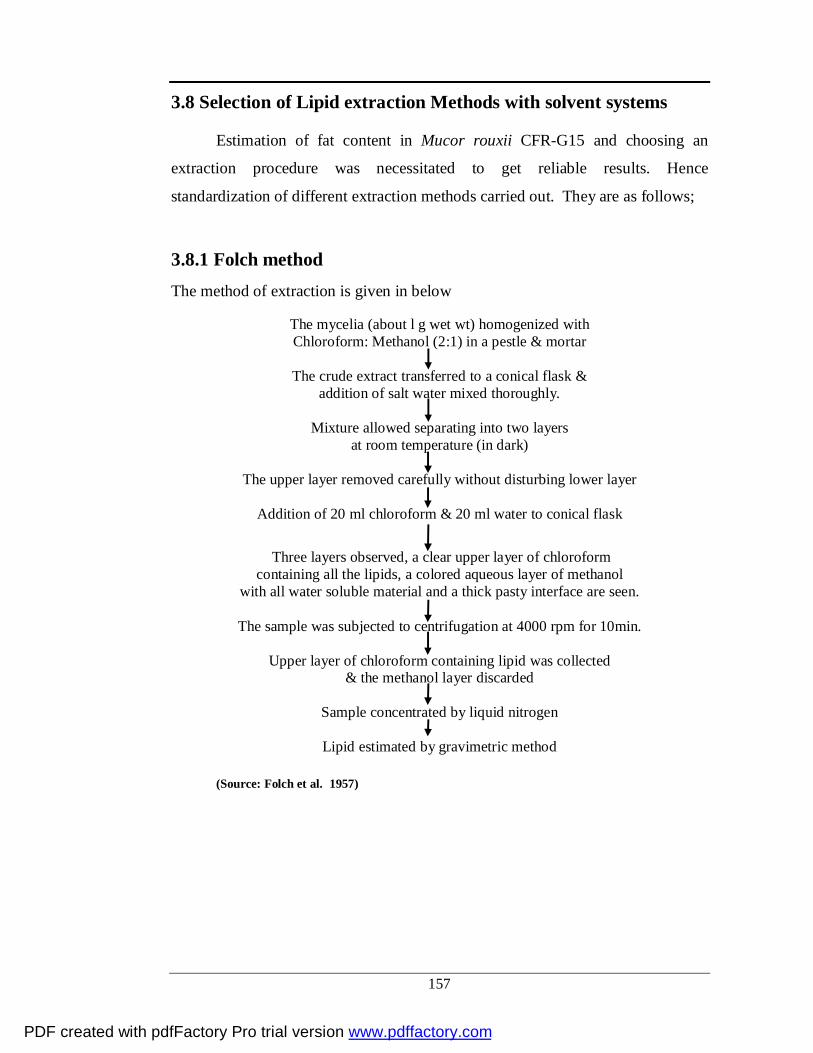
157
3.8 Selection of Lipid extraction Methods with solvent systems
Estimation of fat content in Mucor rouxii CFR-G15 and choosing an
extraction procedure was necessitated to get reliable results. Hence
standardization of different extraction methods carried out. They are as follows;
3.8.1 Folch method The method of extraction is given in below
The mycelia (about l g wet wt) homogenized with Chloroform: Methanol (2:1) in a pestle & mortar
The crude extract transferred to a conical flask &
addition of salt water mixed thoroughly.
Mixture allowed separating into two layers at room temperature (in dark)
The upper layer removed carefully without disturbing lower layer
Addition of 20 ml chloroform & 20 ml water to conical flask
Three layers observed, a clear upper layer of chloroform containing all the lipids, a colored aqueous layer of methanol
with all water soluble material and a thick pasty interface are seen.
The sample was subjected to centrifugation at 4000 rpm for 10min.
Upper layer of chloroform containing lipid was collected & the methanol layer discarded
Sample concentrated by liquid nitrogen
Lipid estimated by gravimetric method
(Source: Folch et al. 1957)
PDF created with pdfFactory Pro trial version www.pdffactory.com

158
3.8.2 Bligh and Dyer method
The method of extraction is given in flow chart
The mycelia (about lg wet wt) first ground
in a pestle & mortar with 10 ml distilled water
Solution transferred to (250ml capacity) a conical flask
containing 30 ml of chloroform: methanol (2:1) and vortexes vigorously
0.5 ml of chloroform added and vortexes
0.5 ml of water and vortexes
Separation of two layers by centrifugation at 3000 rpm
Lower layer was carefully collected and transferred into a new tube & discarded the rmethanol layer
Concentrated by liquid nitrogen
Estimation of lipid by gravimetric method
(Source: Bligh & Dyer 1959)
3.8.3 Soxhlet method The method of extraction is as follows in section (1.9.2)
Solvent systems used in all the three methods were as follows: 1.
Chloroform:Methanol (2:1), 2. Chlorofoem:Methanol(1:1), 2.Hexane:Isopropanol
(3:2), 4. Hexane: Isopropanol (4:1) and 5. Hexane:
Petroleum ether (1:1)
a. Statistical Analysis
The results obtained were subjected to statistical analysis as described in
section 1.11
PDF created with pdfFactory Pro trial version www.pdffactory.com
159
SECTION 4
GENETIC STUDIES ON M. ROUXII CFR-G15 WITH SPECIAL
EMPHASIS ON GLA PRODUCTION
4.1 Strains used
M. rouxii CFR-G15 (parental strain) used for the mutation experiment.
Methionine auxotrophic marker used for protoplast fusion experiment and the
selection of mutants was carried out 15C (low temperature selection).
4.2 Reagents for protoplast fusion experiments
(i) Citrate Phosphate buffer (50 mM, pH 5.2) g/100ml: 9.5 g citric acid
and 4.72 g Na2HPO4 were dissolved and the volume made up to 100 ml
with distilled water.
(ii) Protoplasting buffer (100 ml): 20 ml of 50mM Citrate buffer, 10 ml of
60 % magnesium sulphate and 70 µl β- mercaptoethanol were mixed and
the volume made up to 100 ml with distilled water.
(iii) Fusogen (100 ml): 30 g polyethylene glycol (PEG) 6000, 10mM calcium
chloride (0.144 g), 10 mM, pH 5.2 Tris base (0.12 g) and 0.6M sorbitol
(11.097 g) were dissolved and the volume made up to 100 ml with
distilled water
4.3 MUTATION
4.3.1 Mutagenesis by Ultraviolet radiation (UV)
Young spores of 18 – 20 hrs old culture were harvested using 0.1 %
Tween-80. The spore suspension was filtered through sterile cotton wool to
remove the mycelium. Spores were pelleted by centrifuging at 5000 rpm for 5
PDF created with pdfFactory Pro trial version www.pdffactory.com

160
mins. Spores pellet was washed with 10 mM potassium phosphate buffer saline
pH7.2. The pellet thus obtained was resuspended in the phosphate buffer saline
(1.6X10⁶ cells/ml). 2ml cell suspension was subjected to UV irradiation for
different periods of time (0, 10, 20, 30, 40,50, and 60 min) in an sterile open
petridish using CAMAG UV chamber, Betrachter, Switzerland make (emitting at
254 nm radiation) at a distance of 15.0 cm height. During the course of irradiation
the spores suspension was intermittently agitated. The UV treated spores
suspension transferred to black bag and refrigerated at 4°C overnight prior to
plating. The irradiated spore suspensions were suitably diluted with sterile saline
and appropriate dilutions were plated on mutant screening medium. Killing
percentage was plotted against the UV exposure in order to obtain the kill pattern.
The survival colonies were picked up and incubated at low temperature (15 °C)
for further selection.
4.3.2 Mutagenesis by Ethyl Methane Sulphonate (EMS)
For this experiment, the spores of M. rouxii CFR-G15 obtained from the
previous experiment (section 1) were treated with EMS at different concentrations
(2, 4, 6, 8, 10 mM) in sterile distilled water. The EMS treated spores suspensions
were incubated for 1 hr at 30°C with low agitation. After incubation, the mutagen
was completely removed by centrifugation at 2000 rpm for 10 minutes and this
procedure was repeated twice to ensure the absence of EMS before plating on the
agar medium. Spore pellet was resuspended in 0.01M sterile buffer saline (pH
7.2). Appropriately diluted spore suspension was plated on mutant screening
medium. The plates were incubated at room temperature for 4-5 days and the
killing effect of EMS was plotted against the concentration of EMS. As
mentioned in the previous experiment the survival colonies were picked up and
incubated at low temperature (15°C) for further selection.
4.3.3 Mutagenesis by N-methyl N’-nitro N-nitrosoguanidine (NTG)
PDF created with pdfFactory Pro trial version www.pdffactory.com

161
NTG mutagenesis was also carried out similar to EMS method (7.1.2) with
different concentrations of 5, 10, 15, 20, 25 µg ml-1. The killing effect of NTG
was plotted against its concentration. Here also the survival colonies were picked
up and incubated at 15°C (low temperature growth selection)
4.3.4 Characterization of putative mutants for Biomass, lipid and
GLA production
About 100 putative mutants with morphological, fast growing colonies at
low temperature and colony variations were picked up and screened for biomass,
lipid and GLA production by cultivating them in FPM medium. The biomass,
lipid quantification and GLA production were estimated by the methods described
in section 1.
4.3.5 Screening of auxotrophic mutants
The UV, EMS and NTG mutagenised spores grown on mutant screening
medium were replicated using tooth pick on minimal medium agar plates and
incubated for 24 hours. The colonies which were not grown on agar medium and
grown in complete medium (master plates) were selected and individually tested
for their growth factor requirements by inoculating into medium containing
appropriate concentrations of individual amino acids (Venkateswaran 1999). The
growth of the culture in tubes supplemented with amino acid indicated its amino
acid requirements and they were marked as the respective auxotrophs. Stability of
the auxotrophic mutants was confirmed by repeated experiments and they were
periodically subcultured and maintained in PDA slants for further studies
4.4 Protoplast fusion techniques
PDF created with pdfFactory Pro trial version www.pdffactory.com

162
Protoplast fusion was carried out among the M. rouxii CFR-G15-met strain (intrastrain protoplast fusion) according to the method of Peberdy (1980) and Venkateswaran (1999). Schematic representation of protoplast fusion method is given in the Fig 3.1
M. rouxii CFR-G15 was grown in FPM broth for 16-18 hrs. The fungus
was found to grow as small mycelial pellets of 1-2 mm diameter. Initially,
protoplasts were separated from undigested and fragmented mycelia of parental
strain by being filtered through cotton wool. The protoplasts freed from small
mycelial fragments by centrifugation at 1000 rpm for 10 minutes where only
protoplasts sediments. The sedimental protoplasts were taken out carefully in
osmotic stabilizer solution, filtered through a cotton wool and centrifuged again.
Finally the pelleted protoplasts containing osmotic stabilizer solution were
checked under a phase contrast microscope to ensure absence of any mycelial
fragments. The number of protoplasts of each parental strain was counted with
haemocytometer for fusion experiment.
4.4.1 Harvesting the fungal mycelium for protoplasting
4.4.2 Protoplast formation
The young vfungal mycelium was treated with different concentrations
(100 µg - 1000 µg/ ml) of filter sterilized lytic enzyme (Trichoderma harzianum ),
Novo zyme 234 and Chitinase. The mixture was incubated for 3 hr at room
temperature with mild agitation. The enzyme was removed by centrifugation at
2,000 rpm for 5 minutes. The digest was re-suspended in protoplasting buffer and
the protoplast devoid of cell debris was collected by filtration using specially
designed equipment shown in Fig 3.2 The protoplasts were micro photographed
and the percentage of protoplasting was determined by counting them using
haemocytometer (Feinoptic Bad Blankenburg, Germany). Percentage of
protoplast was calculated by the following formula.
% Protoplasting = Number of protoplasts obtained/ No. of spores used for protoplasting x 100
PDF created with pdfFactory Pro trial version www.pdffactory.com
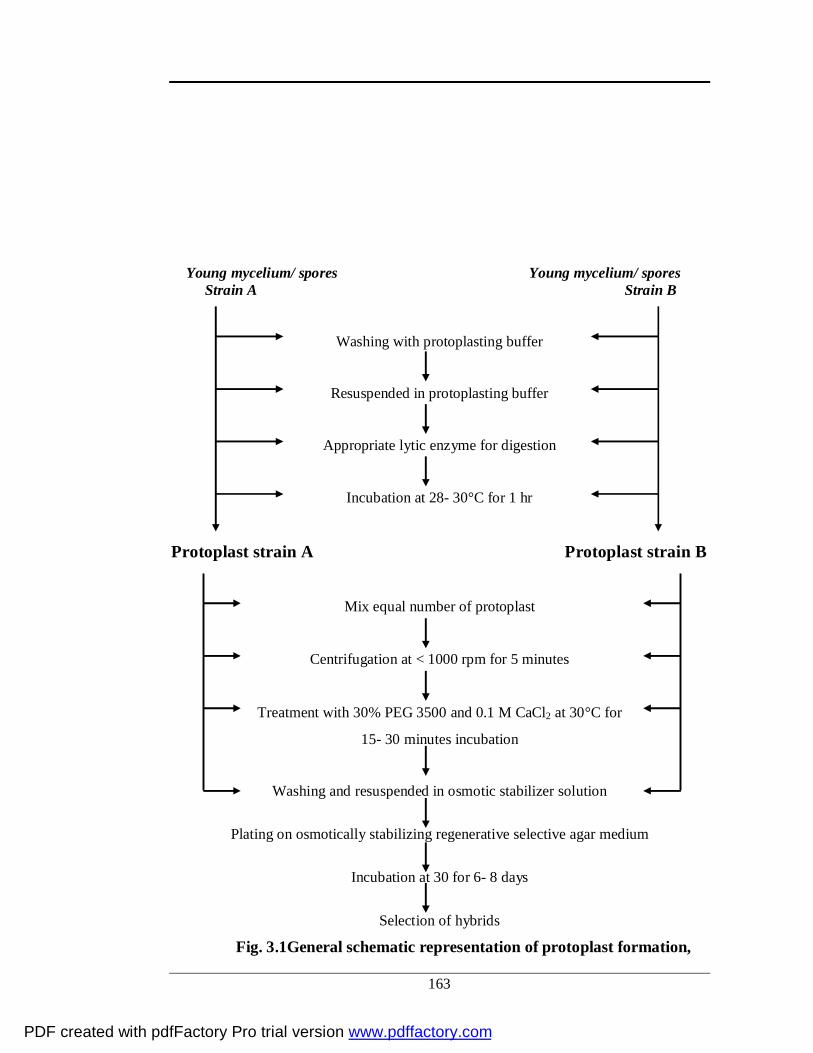
163
Young mycelium/ spores Young mycelium/ spores Strain A Strain B
Washing with protoplasting buffer
Resuspended in protoplasting buffer
Appropriate lytic enzyme for digestion
Incubation at 28- 30°C for 1 hr
Protoplast strain A Protoplast strain B
Mix equal number of protoplast
Centrifugation at < 1000 rpm for 5 minutes
Treatment with 30% PEG 3500 and 0.1 M CaCl2 at 30°C for
15- 30 minutes incubation
Washing and resuspended in osmotic stabilizer solution
Plating on osmotically stabilizing regenerative selective agar medium
Incubation at 30 for 6- 8 days
Selection of hybrids
Fig. 3.1General schematic representation of protoplast formation,
PDF created with pdfFactory Pro trial version www.pdffactory.com

164
fusion and regeneration (Source: Venkateswaran, 1997)
PDF created with pdfFactory Pro trial version www.pdffactory.com

165
Fig. 3.2 Apparatus used for Protoplast harvest
4.4.3 Regeneration of protoplasts
Protoplasts obtained from both the parental strains were tested for their
regeneration by cultivating them on regeneration medium containing 1 M sorbitol
as an osmotic stabilizer. The regeneration frequency was calculated using the
following formula.
Regeneration Frequency = Number of colonies on Regeneration Medium / Number of protoplasts inoculated x 100
4.4.4 Protoplast fusion Equal numbers of protoplasts of M. rouxii CFR-G15-met strains were
mixed with fusogen containing polyethylene glycol 6000, 10 mM Calcium
chloride, 10 mM Tris- HCl and 0.6 M Sorbitol. The tubes were incubated for 30
min. to facilitate fusion between the two strains. Fusogen was removed by
centrifugation at 2,000 rpm for 5 minutes under cooled condition (5°C). Fusion
frequency was calculated using the formula given below after growing the fusion
products on MM and CM plates.
PDF created with pdfFactory Pro trial version www.pdffactory.com

166
Fusion Frequency = Number of colonies on MM/ Number of colonies on CM x 100
4.4.5 Selection of putative hybrids
Hybrids were qualitatively characterized for growth at low temperature by
inoculating the hybrid strains on selection medium containing methionine amino
acids (20 µg/ml, auxotroph requirement). Here also the plates were incubated for
2- 3 days at 15°C (low temperature selection). The putative hybrids thus were
selected based on colony size and morphology and compared with their control M.
rouxii CFR-G15 (parent). Hybrids were selected for further characterization. The
negative hybrids attributed to either delayed growth or no morphological
differences were eliminated.
4.4.6 Characterization of putative hybrids
The selected putative hybrids were cultivated in fat producing medium
broth for 5 days at 30°C in an orbital shaker. After incubation, hybrids were
characterized for biomass, lipid quantification and GLA production by the
methods as described in section 1.9
4.4.7 Protein estimation of hybrids
Protein estimation by Kjeldhal Method
Principle: It is an oxidation of organic compounds by sulphuric acid to
form CO2 and H2O and release of ammonia. Ammonia combines with H2SO4
solution to form ammonium sulphate. Ammonia is released by the reaction of
ammonium sulphate with strong alkali and liberated ammonia is collected in
dilute boric acid solution which in turn back titrated with dilute acid.
PDF created with pdfFactory Pro trial version www.pdffactory.com

167
(a) Reagents
(i) Digestion mixture: Powdered potassium sulphate, copper sulphate and
selenium di- oxide were mixed thoroughly in 5: 2: 1 proportion
respectively.
(ii) 40 % Sodium hydroxide: 40 g Sodium hydroxide pellets were
dissolved in about 50 ml distilled water and the volume was made up to
100 ml in a standard volumetric flask.
(iii) 2% Boric acid: 2 g Boric acid was dissolved in hot distilled water and
the volume was made up to 100 ml in a standard volumetric flask.
(iv) Mixed indicator: 0.1% solution each of bromocresol green and methyl
red indicators were prepared in absolute alcohol and then 5 parts of
bromocresol green solution was mixed with 1 part of methyl red
solution.
(v) Standard N/70 HCl: Approximately 1.3 ml of AR grade concentrated
HCl was mixed with distilled water and the volume was made up to 1 L
in a standard volumetric flask.
(vi) Standard Ammonium sulphate solution: 0.942 g of Ammonium
sulphate is dissolved in distilled water and the volume is 1 L in a
standard volumetric flask (5 ml of this solution is equal to 1 mg of
Nitrogen).
PDF created with pdfFactory Pro trial version www.pdffactory.com

168
Kjeldhal method for protein content determination is given below.
2 g dried fungal biomass + digestion mixture
Digested for 5- 6 hrs
20 ml Con. Sulphuric acid
Digest cooled and volume made up to 250 ml with distilled water
5 ml of the above sample + 20 ml 40 % NaOH + 5 ml 2 % boric acid + 2 drops of
mixed indicator
Titrated against standard HCl Pale pink through pale green
Schematic chart for Kjeldhal method
Percentage protein in the biomass = Titer value - blank x 0.21 x volume of the
digest made up x 6.25 x 100/ aliquot used for distillation x weight of sample taken
for digestion x 1000.
4.4.8 Estimation of Total Carbohydrates of hybrids by
Determination of total carbohydrates by anthrone method (Hedge &
Hofreiter, 1962)
Principle: Carbohydrates are first hyborolsed in simple sugars using dilute
hydrochloric acid. In hot acidic medium glucose is dehydrated to hydroxymethyl
furfural. This compound forms with anthrone a green coloure product with an
absorption maximum at 630 nm.
PDF created with pdfFactory Pro trial version www.pdffactory.com
169
Materials Anthrone Reagents: Dissolve 200 mg anthrone in 100 ml water, working
standard-10ml of stock diluted to 1000ml with distilled water. Store refrigerated
after adding a few drops of toluene.
Standard glucose: stock-dissolve 100mg in 100ml water. Working standard-
10ml of stock diluted to 100ml with distilled water. Store refrigerated after adding
a few drops of toluene.
Procedure: 100 mg of the sample was hydrolysed in boiling tube by keeping it in
a boiling water bath for three hours with 5 ml of 0.25N-HCl and cool to room
temperature. The reaction was neutralised by adding solid sodium carbonate until
effervescence ceases. Volume was made to 100 ml and centrifuged. Supernatant
the sample was collected and made into aliquots of 0.5 ml. The volume made into
1 ml in all taest tubes including the sample tubes by adding distilled water. Then 4
ml of anthrone reagent was added into all tubes and heat for 8 min in water bath.
All tubes were cooled rapidly and dark green colour was measured at 630 nm.
From the standard graph the amount of carbohydrate was calculated in the sample.
4.4.5 Statistical Analysis
The results obtained were subjected to statistical analysis as described in
section 1.11
PDF created with pdfFactory Pro trial version www.pdffactory.com

170
CHAPTER -4
RESULT & DISCUSSION
PDF created with pdfFactory Pro trial version www.pdffactory.com

171
SECTION 1
ISOLATION AND SCREENING OF OLEAGINOUS MUCOR Spp. FOR GLA PRODUCTION
In the past several years, research on microbial PUFAs production was
basically aimed at improving economic competitiveness of microbial lipids
compared to plant and animal-derived lipids. A similar pattern of distribution of
fatty acids and triglycerides structure of microbial oils proved them as a feasible
and cost effective source for the production of pharmaceutically important PUFAs
(Certik & Shimizu 1999; Gill & Valivety 1997). Increasing interest of GLA in
pharmaceutical and nutraceutical applications has lead to searches for new
alternative sources of GLA. Emphasis was placed on screening for more efficient
strains, increasing the product value, using inexpensive substrates, and reducing
the processing steps necessary for lipid recovery from oleaginous microorganisms
(Dyal & Narine 2005; Papanikolaou et al. 2008; Zhu et al. 2003). The aim of this
study was to investigate the GLA contents of Mucor spp. isolated from local soil
samples and to identify and explore a potential strain for GLA production. Mucor
sp. CFR-G15 strain was selected among the isolates and this strain was subjected
to both submerged and solid state fermentation studies for its biomass, total lipid
and fatty acid profile, with special reference to GLA.
Isolation and identification of oleaginous Mucor spp.
In order to obtain native isolates of Mucor spp. for GLA production, 250
soil samples of different habitats were screened. After plating on Mucor screening
medium, the fungal growth of Mucor, Rhizopus, Aspergillus, and Penicillium
species were observed. Among these, higher percentage (40%) of Mucor spp. was
noticed, since the medium contained more nitrogen and low percentage of
minerals. All Mucor spp. were saprophytic and proteolytic in nature, and they
grew faster on the nutrient rich medium compared to other fungi. Cottony hairy
with white or gray coloured growth in morphology similar to Mucor spp. were
tentatively identified as per fungi manual and were taken for further studies [Fig.
PDF created with pdfFactory Pro trial version www.pdffactory.com

172
4.1a & b]. Non-septate coenocytic mycelium without rhizobium, swollen
sporangiophores, and the similar morphological characters of Mucor spp. were
observed in our experiment [Fig.4.2a]. All the morphological characters were
additionally compared with standard culture obtained from MTCC, India and
Gilman manual (1998).
a b
Fig. 4.1 Fungal mycelia on PDA plates a. Mucor rouxii MTTC-386; b. Mucor sp. CFR-G15 isolate
Fig. 4.2 Photomicrograph of Mucor sp . CFR-G15 a. Mycelia with sporangiospores and lipid globules;
b. Mycelia Stained with Sudan Black B (Box indicates lipid globules stained in dark colour)
PDF created with pdfFactory Pro trial version www.pdffactory.com

173
Qualitative analysis of oleaginous Mucor spp.
These isolates were screened for their potentiality for producing lipid
inside their mycelia both qualitatively and quantitatively by using Sudan black B
staining and gravimetric method, respectively. When mycelia stained with Sudan
black-B were observed under oil immersion, dark blue colour lipid globules were
found [Fig.4.2b]. Based on the above observations, 20 species of Mucor were
selected and named as CFR-G1 to CFR-G20 [Fig. 4.3].
Fig 4.3 Isolates of Mucor spp. In PDA slants
Growth characteristics of Mucor isolates, fatty acid content and composition
All the isolates were grown in FPM and their growth characteristics like
biomass, lipid and fatty acid profiles were studied. Results indicated that, biomass
(On dry weight basis) varied from 2.95±0.45 g/L to 8.80±1.22 g/ L for all the
isolates. Lowest biomass was observed in CFR -G1 (2.95±0.45 g/L) and highest
in CFR-G15 (8.80±1.22 g/L) cultures [Table 4.1]. Lipid production varied from
11.58±0.98 to 30.0±1.32 %. Highest total lipid was observed in CFR-G15
(30.0±1.32 %) and lowest in CFR-G4 (11.58±0.98 %) culture.
PDF created with pdfFactory Pro trial version www.pdffactory.com
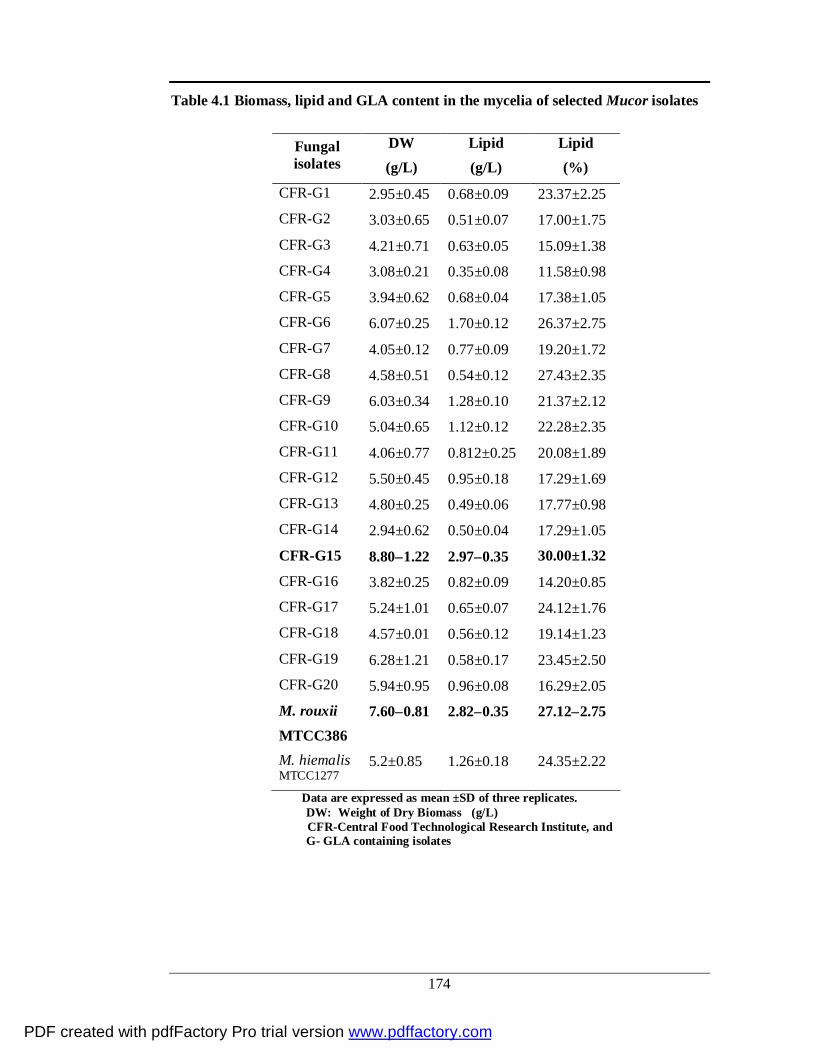
174
Table 4.1 Biomass, lipid and GLA content in the mycelia of selected Mucor isolates
Fungal isolates
DW (g/L)
Lipid (g/L)
Lipid (%)
CFR-G1 2.95±0.45 0.68±0.09 23.37±2.25 CFR-G2 3.03±0.65 0.51±0.07 17.00±1.75
CFR-G3 4.21±0.71 0.63±0.05 15.09±1.38 CFR-G4 3.08±0.21 0.35±0.08 11.58±0.98
CFR-G5 3.94±0.62 0.68±0.04 17.38±1.05 CFR-G6 6.07±0.25 1.70±0.12 26.37±2.75
CFR-G7 4.05±0.12 0.77±0.09 19.20±1.72 CFR-G8 4.58±0.51 0.54±0.12 27.43±2.35 CFR-G9 6.03±0.34 1.28±0.10 21.37±2.12 CFR-G10 5.04±0.65 1.12±0.12 22.28±2.35
CFR-G11 4.06±0.77 0.812±0.25 20.08±1.89 CFR-G12 5.50±0.45 0.95±0.18 17.29±1.69 CFR-G13 4.80±0.25 0.49±0.06 17.77±0.98 CFR-G14 2.94±0.62 0.50±0.04 17.29±1.05
CFR-G15 8.80±1.22 2.97±0.35 30.00±1.32
CFR-G16 3.82±0.25 0.82±0.09 14.20±0.85 CFR-G17 5.24±1.01 0.65±0.07 24.12±1.76 CFR-G18 4.57±0.01 0.56±0.12 19.14±1.23
CFR-G19 6.28±1.21 0.58±0.17 23.45±2.50 CFR-G20 5.94±0.95 0.96±0.08 16.29±2.05
M. rouxii MTCC386
7.60±0.81 2.82±0.35 27.12±2.75
M. hiemalis MTCC1277
5.2±0.85 1.26±0.18 24.35±2.22
Data are expressed as mean ±SD of three replicates. DW: Weight of Dry Biomass (g/L)
CFR-Central Food Technological Research Institute, and G- GLA containing isolates
PDF created with pdfFactory Pro trial version www.pdffactory.com

175
Thus, CFR-G15 was considered a potent culture for the maximum
production of biomass (8.80±1.22 g/L) and lipid (30.0±1.32%) among all the
isolates. It was also observed that the culture CFR-G15 grew well in nitrogen
limiting conditions i.e. fat producing medium (FPM).
Fatty acid composition of all isolates was analyzed by GC and was found
that there were remarkable differences in fatty acid profiles among the isolates
[Table 4.2]. Variations among different cultures were observed in unsaturated
fatty acid index also (DBI). Oleic and palmitic acids were the major fatty acids
present in all the isolates. The GC peak observed at 17.55 min indicated the
presence of GLA in the isolates [Fig. 4.4a & b]. The GLA content in all isolates
varied from 4.74±0.91% (CFR-G6) to 14.42±0.74% (CFR-G15). The percent
GLA was found to be higher in CFR-G15 and M. rouxii MTCC 386. Slightly
lower values were obtained CFR-G4, CFR-G7, and CFR-G12 which were
12.09±0.29, 12.51±0.82, and 11.15±0.92 as % of total fatty acids respectively.
Thus, CFR-G15 isolate was selected for its rapid growth, high production of lipid
and also higher GLA yield.
The presence of GLA in total lipid of CFR-G15 was additionally
confirmed by mass spectrometry (MS). A molecular ion peak at m/e 292 and
intense fragment ion peak at 41, 67, 79 and 93 suggested the component of GLA.
Each peak was in good concurrence with the standard [Fig. 4.5a &b]. The α-
isomer (ALA) was completely absent in all the isolates. Generally, phycomycetes
are recognized for their ability to synthesize GLA, whereas members of
ascomycetes and basidiomycetes, with few exceptions are known to produce ALA
(Stahl & Klug 1996).
PDF created with pdfFactory Pro trial version www.pdffactory.com

176
Table 4.2 Fatty acid composition of isolates of Mucor species.
Fatty Acid Composition (%) Isolates
14:0 16:0 16:1 18:0 18:1 18:2 18:3 DBI
CFR-G1 3.47±1.25 20.30±0.23 3.20±0.54 9.81±0.62 33.45±2.16 9.65±1.13 10.31±0.95 0.84±0.04 CFR-G2 3.05±0.08 16.92±2.15 1.73±0.26 12.27±0.79 44.55±3.21 15.51±1.15 6.94±0.86 0.95±0.07 CFR-G3 3.67±0.09 19.27±1.12 4.65±0.21 9.14±0.62 36.59±2.19 14.03±1.16 10.61±1.11 1.01±0.05 CFR-G4 3.60±0.46 29.86±2.65 4.25±0.15 8.90±0.49 38.94±3.11 8.28±0.89 12.09±0.29 0.78±0.2 CFR-G5 2.22±0.05 28.55±1.21 4.26±0.16 9.48±0.53 32.12±2.75 12.19±0.95 5.4±0.65 0.86±0.6 CFR-G6 3.57±0.14 26.14±1.75 4.09±0.09 14.36±0.94 37.07±2.08 5.54±1.99 4.74±0.91 0.66±0.03 CFR-G7 3.16±0.11 24.26±2.74 5.14±.0.11 10.12±0.53 33.04±1.19 6.24±1.57 12.51±0.82 0.88±0.2 CFR-G8 3.13±0.1 27.10±2.79 2.90±0.06 11.89±0.97 29.19±2.30 10.46±1.26 10.6±1.20 0.85±0.08 CFR-G9 5.08±0.17 25.86±3.14 4.32±0.13 12.32±0.58 33.85±2.34 9.20±0.94 7.17±0.61 0.78±0.05 CFR-G10 2.38±0.08 22.23±2.66 5.79±0.16 11.66±0.66 31.00±1.95 14.47±1.19 8.02±0.97 0.92±0.02 CFR-G11 2.11±0.06 27.21±1.44 3.85±10.09 6.94±0.94 30.65±3.16 14.10±1.12 2.28±1.01 1.00±0.09 CFR-G12 3.03±0.68 32.96±2.41 2.30±0.14 4.60±0.33 32.96±2.36 9.44±2.01 11.15±0.92 0.88±0.06 CFR-G13 3.62±0.13 18.46±1.51 5.08±0.22 9.32±0.94 35.79±1.14 14.16±0.89 8.77±1.06 0.96±0.03 CFR-G14 2.36±0.14 27.76±1.75 2.05±0.08 6.28±0.25 36.00±4.56 9.39±2.16 10.56±0.89 0.90±0.04 CFR-G15 2.21±0.08 25.78±1.58 2.46±0.61 6.42±0.58 37.40±2.26 12.26±0.91 14.42±0.74 1.03±0.09 CFR-G16 2.97±0.16 19.49±1.25 3.27±0.14 7.10±0.66 42.23±2.96 12.16±2.66 10.64±0.68 1.02±0.03 CFR-G17 3.61±0.17 22.47±2.81 4.95±0.19 9.71±1.05 42.41±4.26 11.50±1.16 5.25±0.85 0.86±0.05
CFR-G18 3.26±0.09 22.92±1.16 4.77±0.03 8.51±0.58 35.88±1.96 8.61±1.75 10.45±1.11 0.89±0.09 CFR-G19 3.65±0.15 26.51±1.59 4.94±0.46 9.49±2.01 34.19±2.68 13.20±1.01 8.31±1.62 0.90±0.06 CFR-G20 3.65±0.17 25.51±2.48 4.94±0.80 8.49±1.47 34.19±2.25 13.21±0.09 8.31±0.33 0.90±0.03
M. rouxii MTCC386 2.42±0.16 26.40±1.59 2.20±1.36 9.40±2.49 32.20±1.96 11.40±0.76 13.80±0.85 0.89±0.05
M.hiemalis MTCC1277 3.02±0.14 20.53±1.78 4.75±1.01 7.65±2.10 40.71±1.76 13.69±0.59 7.39±0.46 0.95±0.07
Data are expressed as mean ±SD of three replicates. Fatty acids are expressed as percentage of total fatty acids, DBI- Double bond index.
PDF created with pdfFactory Pro trial version www.pdffactory.com

177
Fig. 4.4 Chromatogram showing
a. GLA standard; b. M. rouxii CFR-15 showing fatty acid profile with GLA
Fig. 4.5 Mass chromatogram of GLA a. Standard; b. M. rouxii CFR-G15
PDF created with pdfFactory Pro trial version www.pdffactory.com

178
Three variables are important for consideration when microorganisms
are screened for fatty acid production. These include the cell concentration, oil
content of the cell and its individual fatty acid contents. Ideally, all these
variables should be very high in the selected species to achieve maximum fatty
acid production. Practically, achieving high biomass, lipid, and PUFAs content
is not possible at one time (Kennedy et al. 1993). While comparing with the
literature, it was found that certain species of Mucor are known to produce
GLA using different carbon sources. M. cercinalloides CBS 203.28 when
grown at 30°C was able to produce 15.6% GLA as a neutral lipid when acetic
acid was used as carbon source (Roux et al. 1994). Mucor species KCTC 8405
isolated in Korea, when cultured on 3% glucose and 0.1% ammonium sulphate
was able to produce 14% GLA (kang & Shin 1988). An oleaginous fungal
strain isolated from the western ghat of Kerala, India when grown in a complex
medium containing glucose as carbon source produced GLA at a level of 8%
(by mass), (Ahmed et al. 2006). When M. hiemalis IPD 51 was screened for
fatty acid production, maximum GLA of 15.4% in the 41.1% of total lipid was
obtained (Kennedy et al. 1993). C. echinulata CCRC 31840 when cultivated
for 5 days at shake flask fermentation, the biomass was 29.79 g dry wt/L with a
total lipid of 26.94% and GLA content of 12.0% (Chen & Chang 1996).
Another study in C. echinulata cultivated on orange pulp, enriched with
glucose was able to accumulate 12.6±2.4 % GLA in 22.3±3.8 % lipid (Gema et
al. 2002). Growth of C. echinulata on glucose and M. isabellina on pectin
produced high GLA of 16.5 % and 6.1 % of total fatty acids respectively, as
compared to starch and lactose (Papanikolaou et al. 2007). C. echinulata was
found to produce 11.7% GLA of 47.6% lipid, upon 168 h of cultivation on
tomato-waste hydrolysate media (Fakas et al. 2008). In the present
investigation the selected Mucor sp. CFR-G15 is a promising producer of
GLA, based on lipid (30±1.32%) and GLA (14.42±0.74% of total fatty acids)
contents.
PDF created with pdfFactory Pro trial version www.pdffactory.com

179
Growth characteristics of Mucor sp. CFR-G15
The culture CFR-G15 was selected for further studies, since it has
shown fast growth and produced substantial amount of lipid and GLA content.
Generally, to ascertain their product output fungal cultivation is carried out
both by submerged fermentation (SmF) and solid state fermentation (SSF).
Keeping this in view, the CFR-G15 was subjected to both SmF and SSF
conditions.
Submerged fermentation
Growth characteristics of Mucor sp. CFR-G15 were studied in
submerged fermentation. The non fermented broth, fermented broth with
biomass and dry biomass (FPM) are shown in Fig. 4.6a, b, & C.
Growth and fatty acid profile of M. rouxii CFR-G15 is shown in Fig.
4.7a and b, respectively. Analysis of biomass, lipid and GLA production as a
function of fermentation, indicated some culture variability in the lag phase,
through log and stationary phases. Consequently, 10 days were chosen for
comparison of data from various culture conditions. Production of biomass was
increased with time and at 144 h, 8.82±0.93 g/L of dry biomass was obtained
with 30±1.32% of total lipid and 14.42±0.74% of GLA content. Results
revealed that Mucor sp. CFR-G15 showed rapid biomass formation and lipid
accumulation in the reproductive phase. During stationary phase, lipid content
of the dry biomass was maintained and decreased gradually. It was observed
that the glucose concentration in the medium decreased rapidly in the first 48 h
and then decreased a lower pace. The rapid consumption of carbon source
initially exhibited faster biomass formation with apparent decrease in its lipid
content. Similar patterns were also observed in lipid content of C. echinulata
and M. isabellina (Papanikolaou et al. 2004b; 2007). When the nutrients get
exhausted in medium other than carbon, it triggers the accumulation of lipid
thus preventing cell proliferation and allows conversion of the substrate into
lipid (Fakas et al. 2007b; Holdsworth et al. 1988b; Papanikolaou et al. 2004b).
PDF created with pdfFactory Pro trial version www.pdffactory.com

180
Fatty acid profile of M. rouxii CFR-G15 revealed that GLA
concentration was higher in the beginning of the fermentation that decreased on
the 48 h and increased after 72 h. Maximum GLA was obtained at 96 h and
was constant till 144 h [Fig. 4.7b]. Result indicated that saturated fatty acids
initially decreased; however, unsaturated fatty acid index was low at 48 h and
increased after 72 h. At the beginning of growth when sporangiospore
development took place, saturated fatty acids like palmitic and stearic acids
were found to be more. Subsequently LA and GLA were increased with the
decreased saturated fatty acids, suggesting higher degree of lipid unsaturation
[Fig. 4.7b]. When culture was grown for 168 h, the GLA content was found to
be decreased, whereas the stearic acid increased. Our results on degree of lipid
unsaturation concurred with the results on Mortierella sp., Cunninghamella sp.,
and Mucor sp. (Ahamed et al. 2006; Chen & Chang 1996; Ho et al. 2007). In
general, cultures that accumulate low GLA are known to produce high
quantities of lipid to perform membrane function (Papanikolaou et al. 2007;
Kennedy et al. 1993).
Degradation of microbial lipid typically initiates after exhaustion of the
carbon source and is referred to as ‘lipid turnover’ and lead to increase in
biomass (Fakas et al. 2007b; Papanikolaou et al. 2004b). Lipid turnover is a
phenomenon routinely observed in oleaginous microorganisms after transition
from excess carbon to carbon starvation conditions that is found in molds
(Fakas et al. 2007b; 2008; Papanikolaou et al. 2004b; 2007), yeasts
(Holdsworth et al. 1988a; Holdsworth & Ratledge 1988b) and bacteria
(Alvarez et al. 2000). In a nitrogen-limiting media when growth takes place,
lipid degradation occurs to produce fatty acids. Generally fatty acid gets
catabolized via β-oxidation, and acetyl CoA is produced through the Krebs
cycle and anaplerotic bypass of glyoxylic acid pathway (Certik & Shimizu
1999; Fakas et al. 2008; Papanikolaou et al. 2004b). Key enzymes NAD+ and
NADP+-CDH and Iso citrate lyase (ICL) play a major role in the process. Lipid
turnover is an important factor in the physiology of oleaginous yeast and mold
(Holdsworth & Ratledge 1988b; Papanikolaou et al. 2004b). This phenomenon
PDF created with pdfFactory Pro trial version www.pdffactory.com

181
indicates lipid metabolism in oleaginous fungus is a well controlled process.
Therefore key enzymes involved in the process of lipid accumulation are of
prime importance when considering the potential of industrial process for
microbial lipid production (Certik & Shimizu 1999; Holdsworth et al. 1988a;
Papanikolaou et al. 2004b).
a b
c
Fig. 4.6 Submerged fermentation
a. Non-fermented broth (FPM); b. Mucor sp. CFR-G15 in submerged fermentation (SmF);
c. Dry biomass of Mucor sp. CFR-G15
PDF created with pdfFactory Pro trial version www.pdffactory.com

182
Fig. 4.7 a. Growth Characteristic of Mucor sp. CFR-G15 during 10 days of cultivation
b. Fatty acid profile of Mucor sp. CFR-G15 during 10 days of cultivation. Data are expressed as mean ±SD of three replicates. DB- dry biomass (g/L), TLC-Total lipid content (%), Reducing sugar (g/L) Fatty acids are expressed as percentage of total fatty acids, DBI- Double bond index.
PDF created with pdfFactory Pro trial version www.pdffactory.com

183
Solid state fermentation
In order to investigate the suitability of use of wheat bran for solid state
fermentation by Mucor sp. CFR-G15, the lipid content and fatty acid profile of
the resultant substrate was studied. Fig 4.8a and b shows the wheat bran
substrate before and after fermentation. Lipid composition of wheat bran
(substrate as control) was analysed before it was used for growing the fungus
Mucor sp. CFR-G15. The wheat bran, as substrate was moistened with 60%
water and in other experiments with nutrient solution (NS) at the levels of 60
and 70% respectively were used for SSF studies. The results of the analyses of
the moldy bran after 7 days of fermentation for its lipid and fatty acid profiles
are given in Table 4.3a and b. Substrate with NS at 60 and 70 % showed good
growth and lipid accumulation (12±1.01 and 14±1.03 %) which were within
the optimal range for SSF process observed by other workers (Hang &
Woodams 1987).
Fig. 4.8 Solid state fermentation a. Non-fermented wheat bran b. Fermented moldy bran of Mucor sp. CFR-G15
PDF created with pdfFactory Pro trial version www.pdffactory.com

184
The major fatty acids found in the SSF culture were, palmitic
23.47±1.23%; stearic 12.09±0.93%; oleic 42.30±1.78%; linolenic 7.2±0.85%.
Biologically important GLA was totally absent in solid substrates i.e wheat
bran. After fermentation, with 60% moisture the GLA content was 8.73±0.85%
of total fatty acids. When 60 and 70% nutrient solution was added to the wheat
bran the GLA content was further increased to 13.64±0.84% and 12.31±0.96%
respectively. Addition of a mixture of yeast extract, potassium phosphate and
magnesium sulphate as a nutrient solution showed a positive effect on the total
lipid (14.21±0.84%) and GLA production (13.64±0.84 %). Increase of nutrient
solution from 60-70% did not show any significant change in the GLA content.
Stredansky et al. (2000b) observed that, high sugar containing apple pomaceae
+MSG mix, showed significant effect on the lipid yield when the substrate was
supplemented with additional carbon source namely glucose, glycerol and pea
nut oil. The highest GLA yield was achieved with the substrate enriched with
peanut oil (not containing GLA), which serves as a direct precursor for the
formation of fungal oil. Shinmen et al. (1989) also observed that Plant oils
supplied to fungal cultivations showed an increased PUFAs yield.
Growth characteristics of Mucor sp.CFR-G15 on wheat bran with
nutrient solution containing nitrogen source and metal ions was carried for 10
days. Lipid and GLA production was checked periodically after every 2 days
and the results are given in Fig. 4.9. During the first 3 days of cultivation on
solid substrate, the mycelial growth appeared on the surface of substrate
particles. Observation under microscope revealed that fungal hyphae penetrated
into the substrate in the subsequent period.
PDF created with pdfFactory Pro trial version www.pdffactory.com

185
Table 4.3a Dry weight, lipid accumulation and GLA content in total fatty acids of lipid produced by Mucor sp. CFR-G15 cultivated on solid state substrate for 7 days.
Data are expressed as mean ±SD of three replicates. NS: Nutrient solution; AF: After fermentation.
Table 4.3b Fatty acid profile of Mucor sp. CFR-G15 on solid substrate
Data are expressed as mean ±SD of three replicates. WB: Wheat bran; NS: Nutrient solution. Fatty acids are expressed as percentage of total fatty acids (%).
Dry weight (g)
Moisture content (%) Substrate
Initial AF Initial Final
Lipid content per dry weight (%)
Wheat bran 10.0 - 0.02 0.02 1.5 ±0.09 WB+ H20 10.0 8.98±0.22 60 45±1.13 10±0.92
WB + NS (60%) 10.0 9.34±0.32 60 39±1.49 12±0.71 WB + NS (70%) 10.0 10.21±0.34 70 40±1.78 14.21±0.84
Fatty acid composition in TFA (% w⁄ w) Substrate
C14:0 C16:0 C16: 1 C18:0 C18: 1 C18: 2 C18: 3 (n6) C18: 3 (n3)
Wheat bran 1.21±0.13 20.74±0.99 2.81±0.31 4.97±0.97 40.86±2.03 18.38±1.07 - 9.30±0.73
WB+ H2O (60%) 2.94±0.27 23.47±1.13 2.36±0.37 12.09±0.93 42.30±1.78 7.20±0.85 8.73±0.85 7.21±0.68
WB + NS (60%) 1.53±0.16 26.61±1.03 2.24±0.25 7.51±0.60 39.74±2.17 10.6±0.93 13.64±0.84 5.34±0.37
WB + NS (70%) 2.96±0.29 25.93±1.08 2.09±0.15 6.35±1.01 30.97±1.96 9.09±0.85 12.31±0.96 5.24±0.39
PDF created with pdfFactory Pro trial version www.pdffactory.com
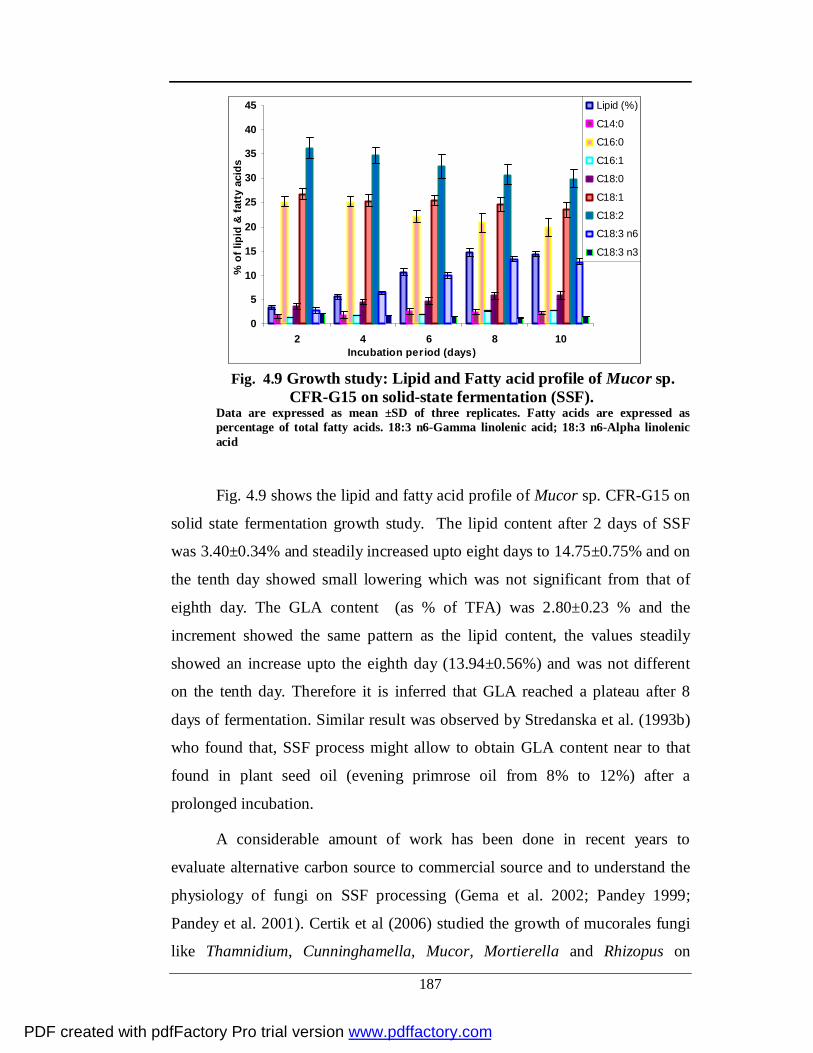
187
0
5
10
15
20
25
30
35
40
45
2 4 6 8 10Incubation period (days)
% o
f lip
id &
fatt
y ac
ids
Lipid (%)
C14:0
C16:0
C16:1
C18:0
C18:1
C18:2
C18:3 n6
C18:3 n3
Fig. 4.9 Growth study: Lipid and Fatty acid profile of Mucor sp.
CFR-G15 on solid-state fermentation (SSF). Data are expressed as mean ±SD of three replicates. Fatty acids are expressed as percentage of total fatty acids. 18:3 n6-Gamma linolenic acid; 18:3 n6-Alpha linolenic acid
Fig. 4.9 shows the lipid and fatty acid profile of Mucor sp. CFR-G15 on
solid state fermentation growth study. The lipid content after 2 days of SSF
was 3.40±0.34% and steadily increased upto eight days to 14.75±0.75% and on
the tenth day showed small lowering which was not significant from that of
eighth day. The GLA content (as % of TFA) was 2.80±0.23 % and the
increment showed the same pattern as the lipid content, the values steadily
showed an increase upto the eighth day (13.94±0.56%) and was not different
on the tenth day. Therefore it is inferred that GLA reached a plateau after 8
days of fermentation. Similar result was observed by Stredanska et al. (1993b)
who found that, SSF process might allow to obtain GLA content near to that
found in plant seed oil (evening primrose oil from 8% to 12%) after a
prolonged incubation.
A considerable amount of work has been done in recent years to
evaluate alternative carbon source to commercial source and to understand the
physiology of fungi on SSF processing (Gema et al. 2002; Pandey 1999;
Pandey et al. 2001). Certik et al (2006) studied the growth of mucorales fungi
like Thamnidium, Cunninghamella, Mucor, Mortierella and Rhizopus on
PDF created with pdfFactory Pro trial version www.pdffactory.com
188
different cereals. Thamnidium, Cunninghamella and Mucor showed higher
capacity to synthesize GLA (4.7–6.8% of fatty acids) than strains of
Mortierella and Rhizopus (1.9–3.3% of fatty acids). Cultivation of two fungi on
oat flakes finally resulted in a maximum 4.8 g GLA/kg of bio-product by
T. elegans and 4.6 g GLA/kg of bio-product by M. mucedo, respectively.
Fungal GLA was accumulated in the by-products and its yield was affected not
only by fungal strain but also by both lipid content in the byproduct and GLA
concentration in fatty acids (Conti et al. 2001; Fakas et al. 2007a). High yield
of GLA was also reported in Mucorales grown on pearled barley supplemented
with additional nutrients (Certik et al. 2006).
PUFAs production in fungi was significantly influenced by the moisture
content of substrate in solid substrate fermentation. Preliminary trials with
wheat bran, and mixture of nutrient solution at 60% and 70% suggested that
60-70 water content was favourable for both lipid and GLA production. Similar
moisture level between 60–75% of water in the substrate was reported as
optimal for growth, substrate utilization and GLA formation in fungi (Conti et
al. 2001; Stredansky 2000a, b). Solid substrate should be having well-balanced
sources of carbon with adequate levels of organic nitrogen and other nutrients
necessary for fungal proliferation (Pandey 2003). Jang et al. (2000) reported
that initial moisture content of solid substrate ranging from 60% to 65% was
good for PUFAs production. However, suitable moisture of the substrate was
also required for satisfied fungal growth during SSF (Pandey 2000; 2002). The
low moisture levels reduced the solubility of nutrients and the swelling of
substrate and increased the water tension (Pandey et al. 2001).
Correspondingly, high moisture content decreased the porosity and the gas
exchange induced the loss of particle structure and the production of stickiness,
reduced the gas volume, and enhanced the aerial mycelium formation (Pandey
et al. 2001; Singhania et al. 2009).
The main drawback of this type of cultivation is in scale-up studies. This
is largely due to several problems encountered in the heat transfer and
PDF created with pdfFactory Pro trial version www.pdffactory.com
189
homogeneity of the cultures. Separation of mycelia mass from the substrate
was difficult in SSF cultivation and recovery of lipid has to be done along with
the substrate. So accuracy of lipid content obtained cannot be comparable with
submerged fermentation in different fungi.
As SmF is more suitable for scale up studies, our further detailed studies using Mucor sp. CFR-G15 was confined to SmF only.
Lipid composition of Mucor sp. CFR-G15 in submerged fermentation
The lipid composition of Mucor sp. CFR-G15 was analyzed by thin
layer chromatography. In the culture cultivated in basal medium (FPM) upto
the stationary phase, the ratio of neutral and polar lipid was about 4:1. Neutral
lipid, when separated by thin layer chromatography, showed that,
triacylglycerols, diacylglycerols, and monoacylglycerols being the predominant
lipid classes. Neutral and polar lipid fractions were analysed by GC and it was
found that GLA present in both the lipid classes with high concentration in
neutral lipid (15.43±1.08%) when compared to polar lipid (10.88±0.97%)
[Table 4.4]. Since the ratio of neutral to polar lipid was high in Mucor sp. CFR-
G15, it has more potential for commercial production of GLA. M.
cercinalloides CBS 203.28 produced GLA content of 15.6% as a neutral lipid
when acetic acid was used as carbon source and grown at 30 °C (Roux et al.
1994). Based on above result Mucor sp. CFR-G15 was selected for further
studies like optimization of cultural conditions in submerged fermentation.
PDF created with pdfFactory Pro trial version www.pdffactory.com

190
Table 4.4 Lipid composition of Mucor sp. CFR-G15 in submerged fermentation
Data are expressed as mean ±SD of three replicates. Fatty acids are expressed as percentage of total fatty acids.
Fatty acid composition (%) Types of
lipid
Lipid
Content
(%) C14:0 C16:0 C16:1 C18:0 C18:1 C18:2 C18:3 DBI
Neutral
lipid 72.00 ±2.49 2.66±0.19 19.8±0.91 3.45±0.24 5.87±0.19 39.64±2.18 12.28±0.67 15.43±1.08b 1.14±0.05b
Polar lipid 28.23 ±1.47 3.93±0.04 29.1±1.63 2.61±0.21 7.72±0.96 34.31±2.09 9.53±0.92 10.88±0.97a 0.89±0.03a
PDF created with pdfFactory Pro trial version www.pdffactory.com

191
SECTION 2
MOLECULAR CHARACTERIZATION OF OLEAGINOUS MUCOR SP. CFR-G15 WITH SPECIAL REFERENCE TO GLA
Since Mucor sp. CFR-G15, was proliferating fast and accumulated high
lipid (28±3.32%) in its mycelium, it was selected for further studies. In order to
taxonomically identify the culture through molecular method i.e. 18S rRNA
gene sequencing and to study the diversity of this fungal culture, ∆6 DES gene
sequencing was carried out and used for characterization.
Multiple sequence alignment of 18S rRNA and ∆6 DES genes
To amplify target DNA by PCR, multiple sequence alignment was
carried out to design primers. Major Mucor species, strains: Mucor rouxii
ATCC (AF296076), Amylomyces rouxii strain CBS416.77 (EF203695.1),
Mucor sp. KJ-2007a strain KJ1119 18S (EF203698.1), Mucoraceae sp.
CGMCC-0817 (AF545631.1), Mucor circinelloides (AJ878535.1), Mucor
plumbeus strain A220 (EF203696.1), Mucor plumbeus strain A162
(EF203697.1) were used for designing primers. The more conserved region
present in the sequences was used to construct forward and reverse primers
[Fig 4.10a]. The primers were named as SS-18S F and SS-18S R according to
convenient. The PCR of 18S rRNA was expected to 600 bp in Mucor sp CFR-
G15.
For the cloning of ∆6 DES gene by PCR, two sets of primers were
designed. Selected molds which produce GLA, Mucor rouxii (AF296076,
AF296073) and Mucor circinelloides (AB090360, AB052086) were used for
multiple sequence alignment. All the sequences were multaligned using the
Multalin version 5.4.1. The more conserved region present in the alignment
sequences were identified and selected to design both forward and reverse
primers [Fig 4.10b]. The primers were named SS-F, SS-R, DES-F and DES-R
conveniently. The expected PCR size of ∆6 DES gene was approximate 1.2 kb.
PDF created with pdfFactory Pro trial version www.pdffactory.com

192
18S Forward primer DQ118998.1| TCCGTAGGTGAACCTGCGGAAGGATCATTAAATAATCAATAA DQ119007.1| TCCGTAGGTGAACCTGCGGAAGGATCATTAAATAATCAATAA AM745433.1| TCCGTAGGTGAACCTGCGGAAGGATCATTAAATAATCAATAA AF412288.1| TTAAATAATCAATAA AY625074.1| AAAAGTCGTAACAAGGTTTCCGTAGGTGAACCTGCGGAAGGA CONSENSUS ..................TCCGTAGGTGAACCTGCGGAAGGA *************** 18S Reverse primer DQ118998.1| CAGGCGGGATTACCCGCTGAACTTAAGCATATCAATAAGCGGAGGA DQ119007.1| CAGGCGGGATTACCCGCTGAACTTAAGCATATCAATAAGCGGAGGA AM745433.1| CAGGCGGGATTACCCGCTGAACTTAAGCATATCAATAAGCGGAGGA AF412288.1| CAGGCGGGATTACCCGCTGAACTT AY625074.1| CAGGCGGGATTACCCGCTGAACTTAA CONSENSUS CAGGCGGGATTACCCGCTGAACTTAAGCATATCAATAAGCGGAGGA ********************************** (A) DES Forward primer AF296076.1M. AGATGTCACGGATGAAATCCGTACCATGCATCCACCACAGGTATATGA AF290983.1M. AGATGTCACGGATGAAATCCGTACCATGCATCCACCACAGGTATATGA AB090360.1M. AGATGTCACGGATGAAATCCGTACCATGCATCCACCACAGGTATATGA AB052086.1M. AGACGCTACAGATGTCTTTCATGAAATGCATCCTccctctgcttacga DES Reverse primer AF296076.1M. ATGTTGCGTACTACAATGGATGTTGATTGTCCAGAGTGGCTTGACTGG AF290983.1M. ATGTTGCGTACTACAATGGATGTTGATTGTCCAGAGTGGCTTGACTGG AB090360.1M. ATGTTGCGTACTACAATGGATGTTGATTGTCCAGAGTGGCTTGACTGG AB052086.1M. -----------------------------TTGATTGTTCATTGACTGG (B) Fig. 4.10 Multiple sequence alignment sequence
a. 18S rRNA b. 6 ∆6 DES gene
(DQ118998.1 Amylomyces rouxii strain CBS 416.77; DQ119007.1 Rhizomucor variabilis var. regularior strain CBS 384.95; AM745433.1 Mucor circinelloides; AF412288.1 Mucor circinelloides strain CBS203.28 AY625074.1 Mucor racemosus strain NRRL 1428 AF296076.1M. Mucor rouxii delta-6 desaturase mRNA, complete cds; AF290983.1M.Mucor rouxii delta-6 desaturase gene, complete cds; AB090360.1M.Mucor circinelloides mcD6-2 mRNA for delta-6 fatty acid desaturase, complete cds; AB052086.1M. Mucor circinelloides)
PDF created with pdfFactory Pro trial version www.pdffactory.com

193
Optimization of extraction procedure for genomic DNA
In order to obtain good quality of DNA from M. rouxii CFR-G15, two
methods were followed as mentioned in the materials and methods. The
extracted genomic DNA by these methods all dissolved in 20 µL TE buffer and
5 µL of each sample loaded to the agarose gel. Intensity of fungal DNA
recovered with the two extraction methods is shown in Fig. 4.11a and 4.11b. a
band of less intensity was observed in agarose gel in first method, it indicates
low yield of DNA, may be due to the poor lysis of cell wall of culture. In the
method 1, the little shearing was observed in agarose gel. Results indicated that
good quality of DNA was obtained by second method. The quantity and quality
of DNA obtained by this method was analyzed by gel and used for further
studies.
Fig.4.11 a. Gel analysis of genomic DNA from Mucor rouxii CFR-G15 b. Restriction digestion (M ; 10 Kb marker)
Since fungi have cell walls that hinder cell lysis and influence the
recovery of DNA using conventional extraction methods (Fredricks et al. 2005;
Maaroufi et al. 2004). Several methods are available for the extraction of
genomic DNA from various filamentous molds (Schwarz 2006; Iwen et al.
2005; 2007). The simple lysis procedures, such as use of sequential freeze-thaw
cycles or incubation with hot detergent and proteases, have not produced high
yields of DNA from many fungal species. Alternative approaches for the lysis
of fungal cells include the agitation of tissue samples with microspheres or
a
M A B C
b
PDF created with pdfFactory Pro trial version www.pdffactory.com

194
particulates within a sealed tube for physical disruption and the enzymatic
digestion of cell wall polysaccharides to form spheroplasts followed by
membrane lysis procedures (Goodwin & Lee 1993; Haugland et al. 1999).
Other DNA extraction methods for fungi, such as grinding cells frozen with
liquid nitrogen using a mortar and pestle and disrupting cell walls with a probe
sonicator were also reported (Graham et al. 1994; Muller et al. 1998; Van
Burik et al. 1998). Some factors during the recovery of DNA must be
considered when selecting a DNA extraction method. These include processing
time, sample volume, additional reagents, and equipment for each DNA
extraction method (Fredricks et al. 2005). In DNA extraction methods different
lysis strategies that are suitable for use on different samples are followed. The
extraction of genomic DNA from fungal cultures is a critical step in the process
of cloning and sequencing (Van Burik et al. 1998). Results presented here
revealed that different DNA extraction methods may produce considerably
different yields of fungal DNA.
PCR cloning
i. Amplification of 18S rRNA gene
The optimized annealing temperature of 54°C for 18S rRNA, clear band
was observed. The amplification of 18S rRNA gene by PCR was analyzed after
electrophoresis of agarose gel and approximate product of 600 bp was obtained
and non specific bands were completely absent [Fig. 4.12a]. This suggests
primers used in this study were shown strong specificity for fungal rDNA
sequences. The PCR product was purified and used directly for nucleotide
analysis using SS-18S F and SS-18S R primers. In literature the identification
of Mucorales which are medically important fungi, the rDNA was amplified at
52°C for 1 min (Michinaka et al. 2003). Amplification of rRNA of M.
cercinelloides was done at 50°C for 30 s (Iwen et al. 2007). Oleaginous fungus
Mortierella alpina which is isolated from soil identified through ITS regions
amplification using 57 °C for 1 min as annealing temperature (Yuen et al.
PDF created with pdfFactory Pro trial version www.pdffactory.com

195
2007). M. hiemalis strains were evaluated and probable genetic differences
between these strains were determined using 55 ºC for 1 min as annealing
temperature (Tauk-Tornisielo et al. 2007). PCR amplification of 18S rRNA and
ITS region is known to be used for rapid and specific identification of species
both industrially and medically important fungi.
ii. Amplification of ∆6 Desaturase gene
The amplification of ∆6 DES gene by PCR using genomic DNA as a
template was carried out. The annealing temperature for ∆6 DES gene was
optimized in this study to get the specific band. When the primers set 1 were
used, the non specific bands were present in PCR products in all the annealing
temperature tried. But when DES-F & R used non specific bands were
completely absent and only the specific band was obtained. PCR at 54 °C was
shown to be optimum for ∆6 DES genes, the expected approximate size of 1.2
Kb was obtained [Fig. 4.12b] and this was compared with the marker. The
second set DES-F & R primers showed strong specificity for Mucor rouxii
CFR-G15 ∆6 DES sequences. The nested primers showed the approximate size
of 600 bp for ∆6-DES at 54 °C. Further the specific band eluted using the
commercial kit and purified PCR product was used for further cloning
experiment. PCR amplification of ∆6- DES gene was carried out in most of the
Mucor spp. Mortierella spp. Rhizopus spp. and Thamindium elegans by using
mRNA as template and construction of cDNA library to obtain the full length
sequence were also reported (Michinaka et al. 2003; Sakuradanai et al. 1999;
Wang et al. 2007; Zhang et al. 2004).
PDF created with pdfFactory Pro trial version www.pdffactory.com

196
Fig. 4.12 PCR amplification of 18S rRNA and ∆6 DES gene of M. rouxii CFR-G15.
a. PCR product of 18S rRNA gene and
b. PCR product of ∆6 DES gene (a), M is a 3 Kb Marker (b), A and B PCR products in duplicates, Arrow indicates expected size of amplicon.
Cloning of ∆6 DES gene in E coli DH5α and recombinant analysis
E-coli DH5α competent cells were prepared by PEG-DMSO method,
since this method showed more competitiveness in transformation. The PCR
product of ∆6 DES was ligated into T-tail cloning vector and transformed into
PEG-DMSO treated E-coli DH5α cells. The controls were vector self ligated
positive and negative control used. Among transformants putative clones were
selected based on the blue/white colonies. When plates were observed, the
numbers of white colonies observed were higher than the blue colonies,
indicating more efficiency of cloning. About 18 recombinants were obtained in
blue/white screening method among 22 colonies analysed.
Recombinants were further confirmed by plasmid isolation, restriction
digestion and as well as by PCR. Plasmids were isolated from all 18
recombinants and analysed by gel. The size of the plasmid DNA was compared
to that of the parent vector. Plasmid DNA appeared larger due to presence of
PDF created with pdfFactory Pro trial version www.pdffactory.com

197
insert [Fig. 4.13a]. Additionally, recombinants were subjected to restriction
digestion showed the release of inserts in the plasmid. Comparisons were made
on the sizes of the restriction digests product with those that are expected based
on the desired clone [Fig. 4.13b]. The recombinants further analyzed by PCR,
using DES-F and R primers. The agarose gel analyses after electrophoresis
showed an expected approximate size of 1.2 Kb correspond with the marker
[Fig. 4.13c].
To study the function of a particulars DNA, sequencing and
manipulation of those sequences is a basic part in molecular biology. There two
ways followed to get this, i). the PCR and ii) use of restriction enzymes and
modifying enzymes to “cut and paste” the desired DNA fragments from
genome into cloning vectors, then which were replicated using live cells. PCR
products were ligated into a suitable vector, which later transformed into
suitable host like E. coli. Several methods were used to screen transformants
colonies such as Blue/white selection, restriction digestion and PCR.
Blue/white selection was the easiest screening method, utilized with large class
of cloning vectors (Sambrook & Russel 2001).
In this study, the pTZ57R/T vector system was used. This vector system
provides the following information for cloning of PCR product. It is an
efficient system for cloning of PCR products with addition of 3’A by Taq DNA
polymerase. The vector pTZ57R/T is prepared by cutting vector pUC57 with
EcoRV and adding a 3’– terminal thymidine (T) to both ends. DNA
polymerases that lack 3’→5’ exonuclease activity (i.e. proof reading activity)
possess deoxynucleotidyl terminal transferase activity in addition to primer
extension activity (Sambrook & Russel 2001). This results in the addition of
extra adenine at 3’ ends of amplified products. This terminal transferase
activity of some DNA polymerases is independent of the template.
PDF created with pdfFactory Pro trial version www.pdffactory.com

198
Fig. 4.13 Analysis of Recombinants
a. Plasmid isolation (A Marker B= Control plasmid, C, D, F, H = Recombinant clones and E & G Non recombinants clones)
b. Restriction digestion of plasmid (A= Negative control, B= Positive Control, C, D, F= Recombinants
c. PCR amplification of ∆6 DES gene in recombinants (A=10Kb Marker, B= Control plasmid, C, D, F, H Clones)
A B C D E F G
PDF created with pdfFactory Pro trial version www.pdffactory.com

199
Nucleotide sequencing and Phylogenetic analysis
i. Analysis of 18S rRNA gene
For sequencing of the PCR product of rRNA gene was SS-18S F and
SS-18S R primers were used. The resultant sequence of rDNA gene obtained
was around 600 bp. This rDNA sequence analyzed using BLAST analysis
(NCBI), it contains, ITS1, 5.8S rRNA, ITS2 and 28S rRNA regions. The M.
rouxii CFR-G15 was identified to be 98% homology with M. rouxii ATCC
24905 (AF117923.1), 96% A. rouxii (DQ118998.1), 95 and 92% similarity
with the Mucor sp. KJ-2007a strain KJ1119 18S (EF203698.1) M.
cercinelloides (AJ878535.1) respectively.
Molecular phylogenetic analysis of M. rouxii CFR-G15 was confirmed
as a new strain of M. rouxii. The phylogenetic relationship of these fungal
strains is presented in a distance-based NJ tree [Fig. 4.14]. Stains of the same
species that had identical sequences are merged into one cluster, but strains of
different species that shared the same sequence were kept as separate clusters
on the NJ tree. Literature suggested that molecular characterization was a
useful tool to phylogenetically related fungi besides their characteristic
morphological features as well as physiological and functional aspects
(Fliegerova et al. 2004; Sharma et al. 2008).
Molecular identification has been evaluated for several groups of
microorganisms which are industrially and medically important (Abe et al.
2006; Sharma et al. 2008; Woll et al. 2003; Wu et al. 2003). Different
molecular targets have been used, including conserved ribosomal DNA genes
and the more variable internal transcribed spacer (ITS) regions between those
genes which allow identification to the species level (Schwarz et al. 2006).
In recent past, molecular tools are routinely used for taxonomic
identification. Molecular techniques using genomic targets within the rRNA
complex have been shown to be reliable for the species identification of the
zygomycetes, including Mucor species (Abe et al. 2006; Iwen et al. 2007;
PDF created with pdfFactory Pro trial version www.pdffactory.com

200
Komaitis et al. 2001; Schwarz et al. 2006). The results of these studies
indicated that ITS sequences shared a high level of identity between isolates
within a species used, contrasting with a low level of identity between species.
This indicates that ITS sequencing is a reliable molecular tool for precise
identification of zygomycetes to the genus and species level and could used for
“DNA bar coding” of this group of fungi (Iwen et al. 2007; Schwarz et al.
2006). Similar to this study, three alleles namely, 18S rDNA, ITS region and
D1 ⁄ D2 hyper variable region were considered for phylogenetic studies.
Combination of two alleles, i.e. either 18S rRNA and ITS or ITS and 26S
rRNA have also been used to determine medically important yeast and
zygomycetes, respectively (Abe et al. 2006; Chen et al. 2001; Morakotkarn et
al. 2007; Voigt et al. 1999). The ITS1/2 rDNA region proved to provide
appropriate markers for genetic studies in the orders Mortierellales and
Mucorales. It also showed that the ITS1/2 rDNA region may be used for
phylogenetic studies of Mucorales at the population and species levels (Ho &
Chen 2008; Kilo et al. 2009; Kwasna et al. 2006). Comparative studies of the
internal transcribed spacer (ITS) regions of the ribosomal RNA genes (rDNA)
have become a useful tool in fungal taxonomy as these regions evolve
sufficiently rapidly to distinguish different species within a genus (Iwen et al.
2002; kilo et al. 2009).
The molecular characterization can also be a useful tool to study
phylogenetically relate the fungi on the basis of their characteristic
morphological features (Fliegerova et al. 2004) as well as physiological and
biochemical aspects. Similarly, two zygomycete fungi M. indicus and R.
pusillus, that expectedly formed as out groups and classified as mucorales.
These have been considered to have an early phylogenetic origin as compared
with ascomycetes and were found to be good sources of phytases (Chadha et al.
2004).
PDF created with pdfFactory Pro trial version www.pdffactory.com

201
Figure 4.14 Phylogenetic analysis of 18S rRNA taxonomy (Native isolate is highlighted in bold letters)
ii. Analysis of ∆6-DES gene
The recombinant clone was sequenced in both direction using MB3
primers and the sequence obtained was around 1200 bp. Sequencing results
showed that it contain regions that encode the ∆6-desaturase enzyme involved
in the GLA biosynthesis pathway. Using BLAST (NCBI), the percentages of
identical matches of with other sequences in the GenBank database (NCBI)
were determined; it showed 98% similarity with Mucor rouxii ATCC
(AF296076).
In this study, phylogenetic tree of ∆6 DES generated by MEGA 3
version showed M. rouxii CFR-G15 was clustered with the Mucor spp. and this
indicates that, they are more related [Fig. 4.15]. Translated ∆6 desaturase of M.
rouxii CFR-G15 predicted protein showed all the characteristic of membrane
bound front-end fatty acid desaturases. It contained an usual histidine rich
PDF created with pdfFactory Pro trial version www.pdffactory.com
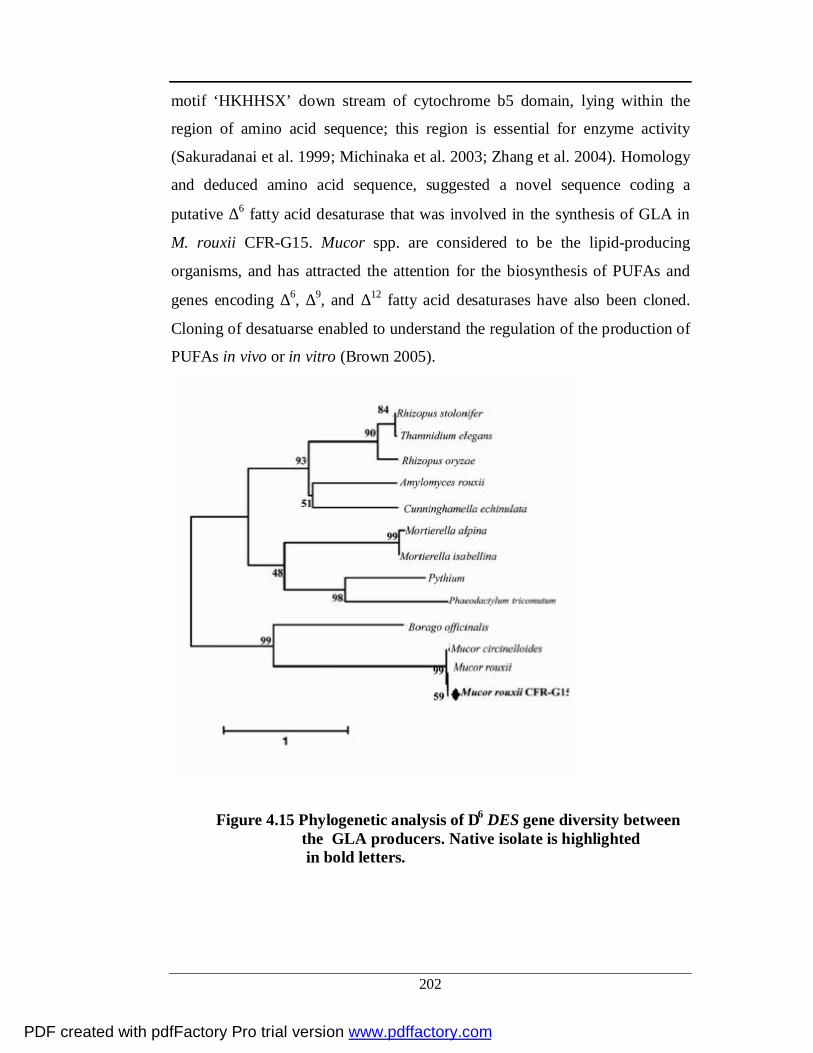
202
motif ‘HKHHSX’ down stream of cytochrome b5 domain, lying within the
region of amino acid sequence; this region is essential for enzyme activity
(Sakuradanai et al. 1999; Michinaka et al. 2003; Zhang et al. 2004). Homology
and deduced amino acid sequence, suggested a novel sequence coding a
putative ∆6 fatty acid desaturase that was involved in the synthesis of GLA in
M. rouxii CFR-G15. Mucor spp. are considered to be the lipid-producing
organisms, and has attracted the attention for the biosynthesis of PUFAs and
genes encoding ∆6, ∆9, and ∆12 fatty acid desaturases have also been cloned.
Cloning of desatuarse enabled to understand the regulation of the production of
PUFAs in vivo or in vitro (Brown 2005).
Figure 4.15 Phylogenetic analysis of ∆6 DES gene diversity between the GLA producers. Native isolate is highlighted
in bold letters.
PDF created with pdfFactory Pro trial version www.pdffactory.com

203
∆6-desaturase enzyme is a membrane bound front-end desaturases with molecular weight 600kDa. It catalyzes, conversion of linoleic acid (C18:2 n6) and Alpha linoleic acid (C18:3 n3) into GLA (C18:3 n6) and stearcodonic acid (C18:4, n3) respectively (Michinaka et al. 2003). GLA is an omega-6 (ω-6) polyunsaturated fatty acid and has wide number of application in medicinal and nutritional area (Horrobino 1992; Gill & Valivety 1997). To study the diversity of ∆6 desaturase enzyme in GLA producers, several studies on cloning and expression has been under taken (Gill & Valivety 1997; Sakuradanai et al. 1999; Wang et al 2007). The ∆6 desatuarse enzyme has been diversified from various organisms like plants (Sayanova et al.1997; 2003), animals (Aki et al.1999; Das et al. 2001), insects (Napier et al. 1998), algae (Domergue et al. 2002; Hirano et al. 1990) and fungi (Michinaka et al. 2003; Sakuradani et al. 1999; Wang et al. 2007). ∆6-desaturases in higher plants; Borage, Echium, Primula and Anemone appear to be distantly related to the fungal and lower-plant ∆6-desaturases. This diverged from those in lower plants at an early stage of evolution. The fungal Mucor rouxii ∆6-desaturase is more related to plant species Borage than the animals, algae and fungi like Mortirella spp. (Michinaka et al. 003; Zhang et al. 2004).
Gene sequencing of 18S rRNA is suggesting taxonomic identity of the
native isolate M. rouxii CFR-G15. In fungal taxonomy, comparative studies of
the 18S rRNA and ITS regions of the ribosomal RNA genes has become a
useful tool for rapid and accurate identification. The genes and genes products
involved in the biosynthesis of PUFAs is being identified and characterized for
higher production of PUFAs. Additionally, gene encoding ∆6-desaturase
enzyme involved in GLA biosynthesis in M. rouxii CFR-G15 was also
identified. This study provides useful information for further work on PUFA
metabolic pathways and gene engineering about GLA production from
microbial sources. A potential strain was reported that could be used for the
development of an economical process in industrial GLA production.
PDF created with pdfFactory Pro trial version www.pdffactory.com

204
SECTION 3
OPTIMIZATION OF CULTURAL CONDITIONS FOR BIOMASS, LIPID AND GLA CONTENT OF MUCOR ROUXII
CFR-G15.
Several growth conditions are known to influence lipid production in
oleaginous fungi. The physiology of lipid production in different oleaginous
microorganisms has been studied by a number of workers through various
growth conditions (Ahmed et al. 2006; Dyal et al. 2005; Fakas et al. 2007a, b;
Kavadia et al. 2001; Leman 1997; Li et al. 2008; Nakahara et al. 1992;
Papanikolaou et al. 2004a; Somashekar et al. 2002; Stredanska et al. 1993).
Some microorganisms grown under particular environmental conditions were
able to accumulate significant quantities of storage material, lipid or
polysaccharides (Aggelis et al. 1996; Fakas et al. 2008; Ratledge 1987; 1993).
A high C:N ratio in the medium was initially found essential for lipid
overproduction in oleaginous microrganisms (Holdsworth & Ratledge 1988a;
Ratledge 2004). However, lipid over production can also result from limitation
of certain other essential nutrients and environmental parameters. Microbial
production of lipids that contains speciality lipids (PUFAs) with potential
commercial value has been aimed at organism’s selection and optimization
(Ahmed et al. 2006; Fakas et al. 2007b; Kendick & Ratledge 1992). In
commercial production of GLA by fermentation, usually optimization of media
was carried out for biomass and product maximization. Optimization is directly
proportional to the effect of nutrients of cost effective substrate and also factors
like pH, temperature, aeration or agitation on the yield of products (Hansson &
Dostalek 1988; Kendrick & Ratledge 1996; Mamatha et al. 2008; Xian et al.
2006).
In this study, the influence of different physiological parameters was
carried out for M. rouxii CFR–G15, a locally isolated strain in a lab scale level
using 500 ml shake flask cultivation with 100 ml working volume. Thus, this
study was aimed to optimize the pH, temperature, aeration, carbon source,
PDF created with pdfFactory Pro trial version www.pdffactory.com
205
nitrogen source, C:N ratio, supplementation of metal ions and oils in order to
produce high biomass, lipid yield, and GLA content. As this experiment was
focused for the development of a scale-up and mass production of GLA from
M. rouxii CFR-G15 in submerged fermentation, these parameters were
optimized.
Effect of Different Media Composition on Lipid Accumulation
In this experiment, different media compositions were tried for their
suitability for biomass buildup, total lipid productions and GLA content. The
media used were fat producing medium (FPM), synthetic medium (SM),
glucose yeast extract medium (GY), potato dextrose broth medium (PDB) and
Czepack Dox medium (CDB) based on the nutrient conditions and results of
pilot experimental studies. The results of the experiment using M. rouxii CFR-
G15 strain, is presented in Fig. 4.16 The results indicated that biomass yield
was more in SM medium (8.80±1.21 g/L) followed by FPM and GY. Biomass
production in PDB media was lower than SM. The biomass build up
(4.21±0.61 g/L) was found to be least in CDB. The lipid percentage calculated
on the basis of dry biomass is given in Fig 4.3.1. The lipid percent varied from
16.91±1.12% to 30.27±1.12%. The media CDB and PDB showed the least lipid
percent in the dry mycelia. The media FPM and GY were similar in the
production of lipid content (%) by the culture M. rouxii CFR-G15. The culture
grown on SM contained a lipid % intermediate between these two sets
(23.34±1.98%). The lipid content of dry biomass was calculated for all the
experiments. Though the percentage lipid content varied between media used,
because of the variation in the quantity of biomass produced (consequently dry
biomass content) the absolute quantity of lipid produced varied. The total lipid
yield thus calculated was expected to give basis the about choice of the media
for future studies using M. rouxii CFR-G15. The production of total lipid in
CDB media was the least 0.72±0.15 g/L which was not different from PDB
media namely 1.28±0.27 g/L. The other media studied namely SM GY and
FPM produced 2.06±0.41, 2.33±0.45 and 2.50±0.54 g/L respectively. The
PDF created with pdfFactory Pro trial version www.pdffactory.com

206
production of lipid (g/L) in these groups was not different. In FPM media
almost all sugar was utilized for growth and lipid accumulation.
The final content of reducing sugar per litre was used as an indicator of
sugar utilization by M. rouxii CFR-G15, in the media studied [Fig. 4.16]. This
residual sugar content was lowest in FPM, 2.87±0.64 g/L and in SM 3.21±0.51
g/L which were not different. The residual sugar was highest in CDB viz.,
5.56±0.45 g/L. A value of 5.30±0.43 g/L found in GY was not different from
that. In media PDB, the value was intermediate between these two groups
(4.14±0.24 g/L). Result showed that among the media studied FPM and SM
were utilized more by M. rouxii CFR-G15.
0
5
10
15
20
25
30
35
FPM SM GY PDB CDBDifferent media
DB
(g/L
) & %
of l
ipid
con
tent
0
1
2
3
4
5
6
7
Lipi
d yi
eld
(g/L
) & R
es. s
ugar
(g/L
)
DB (g/L)
TLC (%)
Lipid yield (g/L)
Res.sugar (g/L)
Fig. 4.16 Effect of Different Media on biomass, lipid production
and residual sugar in M. rouxii CFR-G15 Data are expressed as mean ±SD of three replicates. DB- dry biomass (g/L),
TLC-Total lipid content (%), Residual sugar (g/L).
Effect of different media on GLA production and other fatty acids is
shown in Table 4.5. The highest GLA content of 14.98±1.00% was noticed
when FPM was used. Lowest value was found when CDB media used
(7.15±0.58%). Use of SM resulted in a GLA content of 13.55±0.97% which is
not different from FPM media. Media PDB and GY produced 11.15±1.02%
PDF created with pdfFactory Pro trial version www.pdffactory.com

207
and 13.12±1.05% GLA respectively which were intermediate in their
efficiency in GLA production in M. rouxii CFR-G15. For all further
experiments FPM was selected to optimize the cultural conditions, since it
showed highest lipid and GLA content when compared to other media
Oleaginous microorganisms accumulate high lipid content when the
nitrogen source exhausted from the medium and excess carbon diverted into
lipid synthesis (Fakas et al. 2008; Holdsworth & Ratledge 1988b; Papanikolaou
et al. 2004b). FPM was commonly used since the oleaginous microorganisms
grow well in N2 limiting media and produce high lipid content. It provides
favorable conditions necessary for the accumulation of lipid inside the
mycelium of fungi. The result concurred with these found in oleaginous
microorganisms like zygomycetes fungus which shows good growth and more
lipid accumulation in N2 limited medium (Buranova et al. 1990; Chen & Chang
1996; Kendrik & Ratledge 1992a; Komaitis et al. 2001). Mortierella spp.
produces more biomass, lipid and PUFAs in GY medium, since it is nutrient
rich medium (Buranova et al. 1990; Dyal et al. 2005; Hansson & Dostalek
1988; Kavadia et al. 2001; Leman 1997). PDB has components such as metal
ions and/or other micronutrients which provide meticulous conditions to
enhance growth of the organisms but at the same time it was found that it was
not suitable for lipid and PUFAs production (Dyal et al. 2005; Somashekar et
al. 2002). Similar observation was also made in our study. CDB medium was
nutritionally intermediate, having poor growth and less lipid accumulation. It
may be due to the occurrence of variation in pH (dropped to acidic) during
growth phase. pH of the medium was maintained in the FPM, SM and GY
throughout the growth period.
PDF created with pdfFactory Pro trial version www.pdffactory.com

208
Table 4.5 Effect of different media composition on fatty acid profile of M. rouxii CFR-G15
All
parameters are expressed as Mean ± SD values in the same column with different letters are significant different at p< 0.05 according to Duncan’s multiple range tests. DBI- Double bond index.
Fatty acid composition (as % of total fatty acids) Different
Media 14:0 16:0 16:1 18:0 18:1 18:2 18:3 DBI
FPM 2.98±0.31 23.92±1.08 3.27±0.50 6.49±0.58 32.37±1.23 13.83±0.83 14.98±1.00d 1.08±0.04d
SM 1.42±0.27 27.97±1.15 2.28±0.42 7.90±0.45 35.69±1.42 11.02±0.98 13.55±0.97cd 1.01±0.04cd
GY 3.26±0.35 20.12±1.08 4.58±0.51 8.02±0.53 36.63±1.61 12.42±1.06 13.12±1.05c 1.05±0.06cd
PDB 3.03±0.22 29.96±1.27 2.34±0.46 8.34±0.63 34.84±1.12 9.44±0.90 11.15±1.02b 0.90±0.04b
CDB 5.05±0.36 25.86±1.05 4.32±0.55 12.32±0.76 33.45±1.21 9.20±0.70 7.15±0.58a 0.79±0.01a
PDF created with pdfFactory Pro trial version www.pdffactory.com
209
Influence of Culture Conditions on Lipid and GLA Production Physical parameters
Growth and lipid accumulation in oleaginous microorganisms are highly
influenced by a number of environmental or physical parameters like pH,
temperature, light and aeration. Among these, temperature and aeration are the
most critical factors that affect the overall metabolism in the microbes. These
physical parameters also controlling the growth rate, morphology, lipid
synthesis and their composition in cellular level (Morenson 1988; Ratlegde &
Wynn 2002).
pH optimization
In cultivation medium, pH is one of the most important environmental
factors affecting cell growth and product formation (which can be controlled)
in microbial fermentations (Hong et al. 2006). To know the optimal pH for the
maximum production of biomass, lipid and GLA in M. rouxii CFR-G15 this
study was carried out. Cultivation medium was prepared (FPM) and pH was
adjusted from pH-3.0 to pH-9.0 (pH of the medium was adjusted before
autoclaving using 0.1N HCl and/or NaOH accordingly). The results revealed
that original pH of the medium yielded maximum biomass. At pH 5.5 it was
8.10±0.45 g/L. The dry biomass content was maximum at pH values of 4.5 to
5.5. Below a pH of 4.5 down to 3 the values were same and biomass was
dipping down to a low of 6.60±0.53 g/L. Above the pH of 7 there was a steep
fall in the biomass to a low value of 3.27±0.34 g/L at pH 9. This confirms that
a pH of 5.5 is the most suitable for maximum biomass production.
The lipid percentage of the dry biomass at different pH levels gave a
clear picture for the choice of optimum pH in the range of 5.5 to 6. The lipid
contents were 32.58±1.35% and 30.50±1.24% at the above said levels
respectively. Very low lipid percent were found at pH values at neutral range
and above as well as at 3.0 and 3.5 pH values. There was a trend of increase in
the lipid content from pH 4.0 onwards which reached a peak at 5.5. At 6.5 the
lipid content became considerably lower and was 25.9±1.51% only. The total
PDF created with pdfFactory Pro trial version www.pdffactory.com
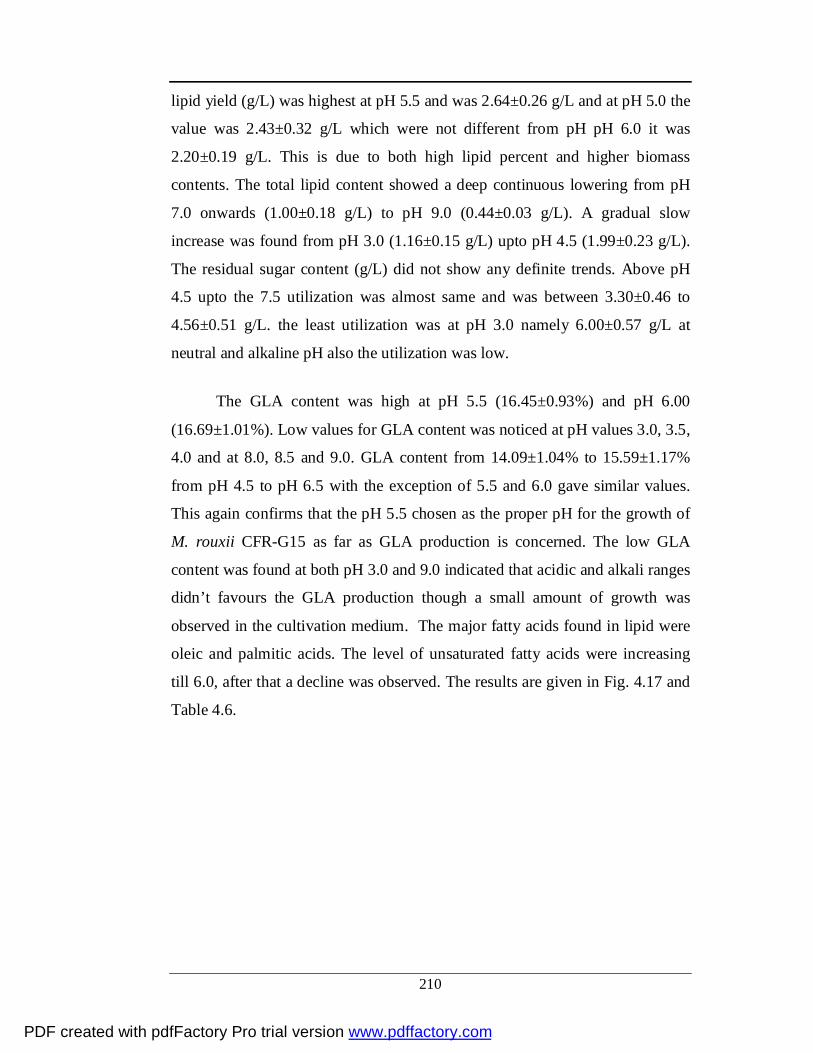
210
lipid yield (g/L) was highest at pH 5.5 and was 2.64±0.26 g/L and at pH 5.0 the
value was 2.43±0.32 g/L which were not different from pH pH 6.0 it was
2.20±0.19 g/L. This is due to both high lipid percent and higher biomass
contents. The total lipid content showed a deep continuous lowering from pH
7.0 onwards (1.00±0.18 g/L) to pH 9.0 (0.44±0.03 g/L). A gradual slow
increase was found from pH 3.0 (1.16±0.15 g/L) upto pH 4.5 (1.99±0.23 g/L).
The residual sugar content (g/L) did not show any definite trends. Above pH
4.5 upto the 7.5 utilization was almost same and was between 3.30±0.46 to
4.56±0.51 g/L. the least utilization was at pH 3.0 namely 6.00±0.57 g/L at
neutral and alkaline pH also the utilization was low.
The GLA content was high at pH 5.5 (16.45±0.93%) and pH 6.00
(16.69±1.01%). Low values for GLA content was noticed at pH values 3.0, 3.5,
4.0 and at 8.0, 8.5 and 9.0. GLA content from 14.09±1.04% to 15.59±1.17%
from pH 4.5 to pH 6.5 with the exception of 5.5 and 6.0 gave similar values.
This again confirms that the pH 5.5 chosen as the proper pH for the growth of
M. rouxii CFR-G15 as far as GLA production is concerned. The low GLA
content was found at both pH 3.0 and 9.0 indicated that acidic and alkali ranges
didn’t favours the GLA production though a small amount of growth was
observed in the cultivation medium. The major fatty acids found in lipid were
oleic and palmitic acids. The level of unsaturated fatty acids were increasing
till 6.0, after that a decline was observed. The results are given in Fig. 4.17 and
Table 4.6.
PDF created with pdfFactory Pro trial version www.pdffactory.com

211
0
5
10
15
20
25
30
35
40
3 3.5 4 4.5 5 5.5 6 6.5 7 7.5 8 8.5 9
Different pH
DB
(g/L
& T
LC %
)
0
1
2
3
4
5
6
7
Lipi
d yi
eld
(g/L
) & R
es. s
ugar
(g/L
)
DB (g/L)TLC (%)Lipid yield (g/L)
Res. sugar
Fig. 4.17 Effect of initial pH on biomass, lipid production
and residual sugar in M. rouxii CFR-G15. Data are expressed as mean ±SD of three replicates. DB- dry biomass (g/L), TLC-Total lipid content (%), residual sugar (g/L).
The GLA content was high at pH 5.5 (16.45±0.93%) and pH 6.00
(16.69±1.01%). Low values for GLA content was noticed at pH values 3.0, 3.5,
4.0 and at 8.0, 8.5 and 9.0. GLA content from 14.09±1.04% to 15.59±1.17%
from pH 4.5 to pH 6.5 with the exception of 5.5 and 6.0 gave similar values.
This again confirms that the pH 5.5 chosen as the proper pH for the growth of
M. rouxii CFR-G15 as far as GLA concerned. The low GLA content was found
at both pH 3.0 and 9.0 indicated that acidic and alkali ranges didn’t favours the
GLA production though a small quantity growth was observed in the
cultivation medium. The major fatty acids found in lipid were oleic and
palmitic acids. The level of unsaturated fatty acids were increasing till 6.0, after
that a decline was observed. The results are given in Fig. 4.17 and Table 4.6.
This trend was very much similar to those found with the Mortierella sp.
and Mucor sp. RRL001 where lipid production was high when the mould was
cultivated at the pH 6.5 (Ahamed et al. 2006; Dyal et al. 2005; Leman &
PDF created with pdfFactory Pro trial version www.pdffactory.com
212
Brackoniek 1996; Lindberg & Molin 1993). Result obtained in this study also
agreed with the results of studies with fungus Rhizopus nigricans SSSD-8,
where maximum GLA yield from total lipid content was observed at pH 5.5
(Bandyopadhyay et al. 2001). The results of the study was different from
studies on Mucor cercinelloides I.M.I. 307741 and Rhizopus arrhizus where
maximum GLA and lipid content were obtained at pH 4.0 and 7.0 respectively
(Kristofikova et al. 1991). It is inferred that the pH of the cultivation medium
does not influence the biomass production. In general, it was found that with
respect to varying pH values, the amount of saturated fatty acid and
monounsaturated fatty acid decreased with increasing pH values, while the
PUFAs content tend to increase with increasing pH values (Dyal et al. 2005).
Thus our result revealed that GLA production in M. rouxii CFR-G15 was
maximum at pH 5.5 and 6.0 whereas the biomass and lipid content obtained
were maximum at pH 5.5. Hence in all our future experiments pH 5.5 was
fixed as optimal pH.
PDF created with pdfFactory Pro trial version www.pdffactory.com

213
Table 4.6 Influence of pH on fatty acid profile of M. rouxii CFR-G15
Fatty acid composition (as % of total fatty acids) Different pH 14:0 16:0 16:1 18:0 18:1 18:2 18:3 DBI 3.0 2.98±0.34 25.04±1.32 3.24±0.23 7.24±0.65 37.68±2.02 10.95±0.85 10.90±0.78a 1.04±0.07a
3.5 2.57±0.45 26.14±1.45 3.09±0.36 7.39±0.78 37.07±1.91 10.54±0.94 10.75±0.79a 1.27±0.08 4.0 2.80±0.58 27.86±1.52 3.50±0.48 6.84±0.92 36.61±1.86 10.61±0.95 10.77±0.85a 1.31±0.06 4.5 2.59±0.44 24.19±1.17 2.98±0.44 5.93±0.87 35.24±2.09 12.51±0.93 14.09±1.04cd 1.06±0.08 5.0 2.50±0.37 24.96±1.12 3.21±0.41 6.12±0.30 34.36±1.83 12.78±0.97 15.43±1.12def 1.09±0.11 5.5 2.22±0.56 23.55±1.10 4.26±0.39 5.48±0.52 33.12±1.67 13.19±0.79 16.45±0.93ef 1.13±0.21 6.0 2.66±0.52 20.86±1.57 4.25±0.26 6.19±0.39 34.94±1.89 13.28±0.65 16.69±1.01e 1.16±0.18 6.5 2.68±0.60 23.41±1.34 3.12±0.31 8.56±0.37 34.62±2.09 10.75±0.95 15.59±1.17def 1.06±0.14 7.0 4.53±0.33 21.44±1.52 3.13±0.38 7.12±0.55 35.72±2.15 11.25±0.98 15.04±1.08def 1.06±0.21 7.5 3.46±0.43 23.53±1.33 3.49±0.29 8.47±0.41 35.57±2.12 9.47±0.84 14.79±1.11def 1.02±0.09 8.0 1.86±0.38 25.61±1.08 2.13±0.57 9.15±0.72 36.67±2.05 11.51±0.88 12.11±0.95ab 0.98±0.08 8.5 2.23±0.36 27.70±1.17 2.06±0.41 7.78±0.54 36.71±2.15 10.71±0.81 12.69±0.93bc 0.98±0.07 9.0 3.23±0.41 27.72±1.25 2.16±0.56 9.78±0.69 35.71±1.94 10.25±0.93 10.69±0.87a 1.09±0.08a
All parameters are expressed as Mean ± SD values in the same column with different letters are significant different at p< 0.05 according to Duncan’s multiple range tests. DBI- Double bond index
PDF created with pdfFactory Pro trial version www.pdffactory.com

214
Optimization of Temperature PUFAs are the primary metabolites produced in M. rouxii CFR- G.
Their yield was associated with the growth of the fungus, lipid accumulation
and growth temperature under cultivation. Our focus in this study was to
optimize the cultivation temperature for M. rouxii CFR-G15 an oleaginous
fungi at different levels ranging from low temperature (5-15°C) to the high
temperature (40 to 45°C) for enhanced production of biomass, lipid
accumulation and their fatty acid profiles with special reference to GLA. Thus
the culture was grown in association of two varied temperatures and supply of
additional glucose in the culture medium.
Results indicated that this strain did not show any significant (p>0.05)
growth (dry biomass) (4.3±0.3 g/L and 2.42±0.22 g/L) and lipid yield
(22±1.2% and 14.2±1.2 %) both in low temperature (5ºC) and high temperature
(40ºC) when compared to room temperature (7.8±0.80 g/L and 30.20±1.23 %).
Optimal growth with reference to biomass (7.8±0.80 g/L), and total lipid
content (30.20±1.23 %) was observed at 30°C under normal culture conditions
[Fig. 4.18]. Further, to optimize the temperature for biomass build up, lipid
accumulation and pattern of lipid profile, temperatures of 14ºC, 21ºC, 28ºC and
35ºC were selected. Optimal growth with reference to biomass (8.20±1.8 g/L)
and total lipid yield (30.12±1.20%) was observed at 28ºC when compared to low
temperature on the 6th day. Maximum GLA production, was obtained when the
fungus was grown at 14ºC for 6 days. This resulted 21.97±1.09% of the total
fatty acids [Table 4.7]. This clearly indicated that low temperature favors
PUFAs formation particularly GLA in the cell of M. rpuxii CFR-G15.
PDF created with pdfFactory Pro trial version www.pdffactory.com

215
0
5
10
15
20
25
30
35
40
45
5 10 15 20 25 30 35 40Incubation temperature (0C)
DB
(g/L
) & T
LC (%
)
DB (g/L)
TLC (%)
Fig. 4.18 Effect of incubation temperature on biomass and lipid
content in M. rouxii CFR-G15. All parameters are expressed as Mean ± SD values of triplicate. DB-Dry Biomass (g/L) TLC-Total lipid content (%)
It was observed that, this culture when grown in low temperature, the
biomass and lipid production showed variations. While altering the temperature
to low level from the optimal, the highest yield of GLA and other PUFAs were
recorded. Another interesting observation was that during the exponential
growth condition, the lipid profiles were showing more of the saturated form
than unsaturated whereas in stationary phase, the culture was more of an
unsaturated form. Hence it was concluded that the degree of unsaturation in the
fatty acid composition was influenced by low temperature. This observation
was very much in accordance with the studies of Jang et al. (2005). Further,
growth in low temperature not only influenced the PUFAs production but also
altered the cell morphology (Higashiyama et al. 1999). In this study, culture
medium, during the first 24 hours of the growth at 35ºC large fluffy pellets (3-
5mm dia) were formed and gradually these pellets transformed into mycelial
form whereas in low temperature (14°C) smaller pellets were formed and they
were stable.
PDF created with pdfFactory Pro trial version www.pdffactory.com

216
Table 4.7 Effect of incubation temperature on Biomass, Lipid and GLA production of M. rouxii CFR-G15 on 6th day of cultivation. Temp ° C Biomass (g/L) Lipid (%, DB w/w) GLA/ Total Fatty acids
(% w/w)
14 5.6±0.6 a 15.75 ±0.61a 21.97±1.09 c
21 7.218±1.1b 19.1±0.85b 15.27±0.10 b
28 8.20±1.8c 30.12±1.20 c 14.42±0.52b
35 5.9±0.23a 27.8±0.24 b 11.17±0.56 a All parameters are expressed as Mean ± SD values in the same column with different letters are significant different at p< 0.05 according to Duncan’s multiple range tests. DB; Dry biomass Lipid; Total lipid in the dry biomass
Effect of temperature on fatty acid profiles of total lipid of M. rouxii
CFR- G15 on 6th day of cultivation is given in Fig 4.19. Oleic acid (C18:1) was
found to be a major fatty acid in all the temperatures tested, followed by
palmitic acid (C16:0), GLA (C18:3, n-6), linoleic acid (C18:2) and stearic acid
(C18:0). The remaining fatty acids were only fractional. An important
observation was made that the increase in GLA and linoleic acid contents
inversely proportional to the availability of palmitic acid and oleic acid
contents at low temperature level (14°C).
0
5
10
15
20
25
30
35
40
45
50
15 23 28 35Incubation temperature (0C)
Fatt
y ac
ids
(%)
C16:0C18:0C:18:1C:18:2C:18:3DBI
Fig. 4.19 Effect of incubation temperature on Fatty Acid Profiles of
M. rouxii CFR-G15 (on 6th day of incubation period). All parameters are expressed as Mean ± values of triplicate. The fatty acid contents were expressed in relative percentage of total fatty acids.
PDF created with pdfFactory Pro trial version www.pdffactory.com

217
The increased level of GLA at low temperature could be due to presence
of desaturase genes that received signals from a specific sector in the
cytoplasmic membrane. Influence of carbon in the cystol led to accumulation
of acetyl CoA which further led to unsaturation of long chain fatty acids from
fatty acid synthase (Jiang & Gao 2004). This study also revealed that low
temperature brought about higher contents of GLA per unit mass. The degree
of unsaturation of membrane lipid increased with the lowering of growth
temperature.
The degree of unsaturation was also found to be increaseing steadily
with lowering of temperature in M. rouxii CFR-G15 tested here. This
modification could be due to the membrane fluid stability of the organisms as
an adaptive mechanism to cold environment. This observation correlates very
much with results observed by Robinson (2001) and Sumner et al. (1969b).
Multiple interlocking controls and regulatory mechanisms operate within the
cell system necessitate or adjust the cell lipid to alter the lipid profile. Certain
key enzymes responsible for fatty acid formation become inactivated due to
sudden temperature shock. It was observed that temperature shock also alters
the structural and functional moiety of the lipid in the cell level (Devem &
Manocha 1976; Higashiyama et al. 1999; Shimizu et al. 1988). At lower
temperature the synthesis of unsaturated fatty acids was less retarded than their
degradation, so that under these conditions, more linoleic acid (C18:2)
accumulates in the lipids, with consequent increase in the degree of lipid
unsaturation. Varying the temperature for growth of the organism modified its
biosynthetic metabolites resulting in an increased or decreased level of
unsaturation (∆/mole) (Quoc & Duacq 1997; Suutari & Laakso 1994). Our
results indicated that, the degree of unsaturation was primarily dependant on
the concentration of GLA and oleic acid content i.e. higher the concentration of
GLA the higher the degree of unsaturation (∆/mole) was observed in the M.
rouxii CFR- G15 [Fig. 4.19].
PDF created with pdfFactory Pro trial version www.pdffactory.com

218
The conversion of saturated into unsaturated fatty acid is a well known
phenomenon regulated by desaturase enzymes which require oxygen as a
cofactor along with acetyl coenzyme A (acetyl Co-A), acyl carrier protein,
reduced nicotinamide adenine nucleotide (NADH2) and reduced nicotinamide
adenine dinucleotide phosphate (NADPH2). Therefore, when the oxygen
concentration of the medium falls to a low level, it becomes rate limiting for
the desaturation reaction (Choi et al. 1982; Devem & Manocha 1976; Robinson
2001a).
The results of the present study indicated that, M. rouxii CFR-G15
produced 30.20±1.20% lipid in their dry cell weight, in which 14.2±0.52%
accounted for GLA in an ambient cultivation condition. When the culture was
grown at low temperature, the lipid content was 15.75±0.61% the GLA content
increased significantly (p<0.05) i.e. 21.97±1.09% of the total fatty acid content.
Therefore further optimization of temperature as fermentation parameter was
needed to produce high percentage of lipid and higher GLA production. Kates
& Baxter (1962) have reported that the rate of synthesis and degradation of
unsaturated fatty acids were temperature dependent and these rates had
different coefficients.
Lower temperatures in the medium brought about higher contents of
GLA and PUFAs per unit mass, but fungal growth rate, and lipid yield are
decreased. Therefore, the highest overall production of PUFAs and GLA could
not be achieved at low temperature. In order to combine the beneficial effect of
rapid biomass production at its optimal temperature and then shifting it to a
lower temperature generated higher yield of lipid, GLA and other PUFAs in M.
rouxii CFR-G15. It could be concluded through our results that, maximum
biomass and lipid production were obtained at 28ºC and maximum GLA
production at 14ºC. Our results also revealed that when culture was transferred
from room temperature to low temperature, the lipid content of the mycelium
decreased. This indicated that the culture utilized the accumulated lipid in the
mycelium as a carbon source when the glucose becomes exhausted in the
PDF created with pdfFactory Pro trial version www.pdffactory.com
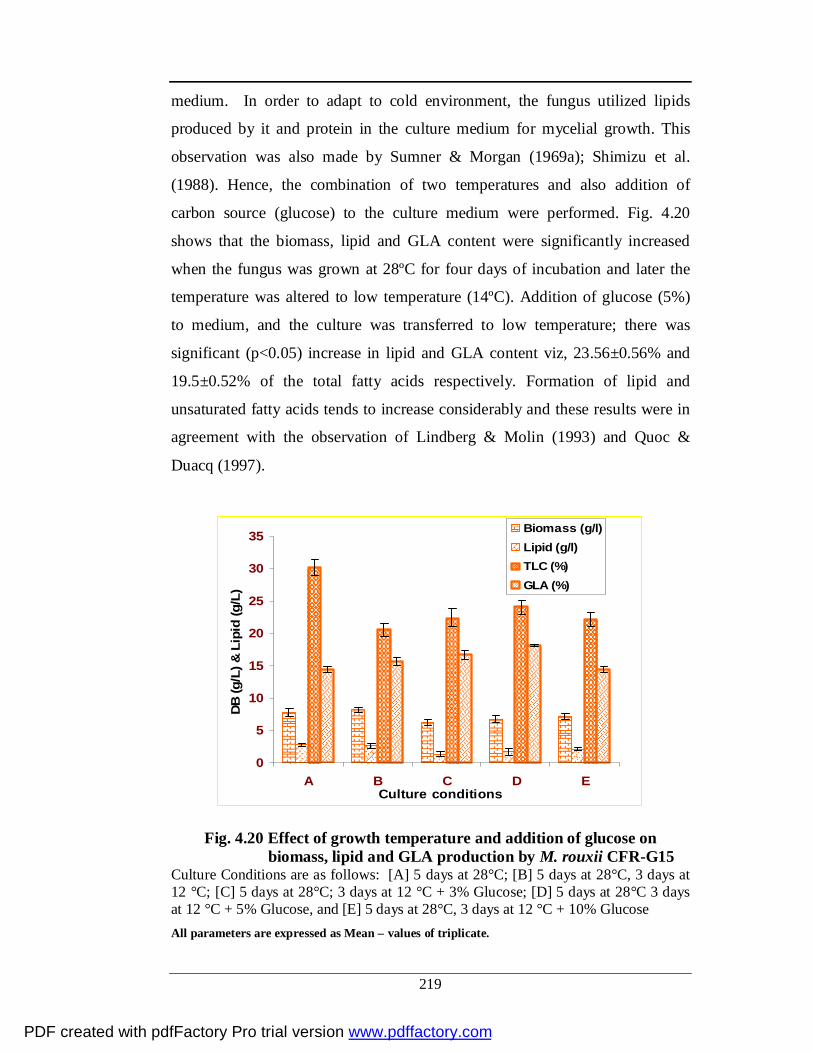
219
medium. In order to adapt to cold environment, the fungus utilized lipids
produced by it and protein in the culture medium for mycelial growth. This
observation was also made by Sumner & Morgan (1969a); Shimizu et al.
(1988). Hence, the combination of two temperatures and also addition of
carbon source (glucose) to the culture medium were performed. Fig. 4.20
shows that the biomass, lipid and GLA content were significantly increased
when the fungus was grown at 28ºC for four days of incubation and later the
temperature was altered to low temperature (14ºC). Addition of glucose (5%)
to medium, and the culture was transferred to low temperature; there was
significant (p<0.05) increase in lipid and GLA content viz, 23.56±0.56% and
19.5±0.52% of the total fatty acids respectively. Formation of lipid and
unsaturated fatty acids tends to increase considerably and these results were in
agreement with the observation of Lindberg & Molin (1993) and Quoc &
Duacq (1997).
0
5
10
15
20
25
30
35
A B C D ECulture conditions
DB (g
/L) &
Lip
id (g
/L)
Biomass (g/l)Lipid (g/l)TLC (%)GLA (%)
Fig. 4.20 Effect of growth temperature and addition of glucose on biomass, lipid and GLA production by M. rouxii CFR-G15
Culture Conditions are as follows: [A] 5 days at 28°C; [B] 5 days at 28°C, 3 days at 12 °C; [C] 5 days at 28°C; 3 days at 12 °C + 3% Glucose; [D] 5 days at 28°C 3 days at 12 °C + 5% Glucose, and [E] 5 days at 28°C, 3 days at 12 °C + 10% Glucose All parameters are expressed as Mean ± values of triplicate.
PDF created with pdfFactory Pro trial version www.pdffactory.com

220
Thus our studies concluded that temperature is the principal regulatory
factor in the degree of unsaturation in the lipid profile of the organisms. In
general, organisms growing under low temperature possess relatively a high
degree of unsaturation in their lipid profile and it is a part of the adaptive
response to the cold environment. Temperature is also regulating most of the
other factors, like pH, water activity, aeration and nutrients inside the cell in
relation to other cellular functions and environments. Therefore microbes have
to adapt to their cellular composition in accord with the demand. The changes
in fatty acid composition of a cell by change in the ambient temperature have
also altered the growth rate and dissolved oxygen in the growth medium. In this
study, it was possible to enhance the lipid and GLA production of M. rouxii
CFR-G15 from the baseline significantly (p<0.05) 15.75±0.10% to
23.56±0.56% and 14.2±0.52% to 19.5±0.52% respectively. The results
presented in this study showed the significant influence of growth temperature
and supply of glucose enhanced the production of biomass, lipid and GLA.
These finding suggest that M. rouxii CFR-G15 may have a potential for
commercial exploitation for the production of GLA by fermentation. Upon
optimization, for all further studies, room temperature (28±2ºC) was used for
culturing this fungus.
Optimization of aeration
To study the effect of aeration on cellular lipid accumulation in M.
rouxii CFR-G15, batch culture was performed by changing the ratio (R) of
volume of the medium to the total volume of the flask (500 ml). The ratio used
to optimize the aeration was 0.1, 0.15, 0.2, 0.25, 0.3, 0.35, and 0.4. In this study
it was found that, there was an increase of biomass when the ratio of media to
volume of flask ratio 0.1 (6.40±0.67 g/L) to 0.2 (7.80±0.67 g/L). Other ratios
(0.15, 0.25, 0.3, 0.35 and 0.4) didn’t promote biomass production in M. rouxii
CFR-G15. In this experiment a ratio of 0.2 promoted maximum percentage of
lipid on the basis of dry biomass in the cultivation media (33.01±1.14%). The
PDF created with pdfFactory Pro trial version www.pdffactory.com

221
least lipid percentage (23.35±0.76) was observed at the ratio was 0.4. Other
ratios did not greatly vary in their lipid percentage. Lipid g/L, the values were
1.60±0.21 for a ratio of 0.4 and 2.52±0.38 for a ratio of 0.2. None of the values
were different. Therefore it was inferred that the ratio of volume of media to
volume of flask didn’t make a difference in this criteria between 0.2 and 0.4
[Fig.4.21]. It was also noticed that at 0.4, biomass, lipid production and sugar
utilization (4.14±0.31 g/L) were considerably reduced. Rests of them were not
different. These results suggested that oleaginous microorganisms require
considerable aeration for energy, biosynthesis and metabolism. Similar
observation was made by Hong et al. (2006).
0
5
10
15
20
25
30
35
40
0.10 0.15 0.20 0.25 0.30 0.35 0.40
Different aeration ratio
Biom
ass
(g/L
) & T
otal
Lip
id (%
)
011223344
55
TLC
(g/L
) & R
es. s
ugar
(g/L
)
DB (g/L)TLC (%)Lipid yield (g/L)Res sugar
Fig. 4.21 Effect of aeration on biomass, lipid production and residual sugar in M. rouxii CFR-G15.
Data are expressed as mean ±SD of three replicates. DB- dry biomass (g/L), TLC-Total lipid content (%), Residual sugar (g/L).
The effect of aeration on fatty acid profile of M. rouxii CFR-G15
presented in Table 4.8. An analysis of the data showed that, the GLA content
expressed as percentage of fatty acids were 12.20±0.64% and 14.74±0.92% at
0.40 and 0.20 ratios respectively. A ratio of 0.2 gave the highest GLA content
PDF created with pdfFactory Pro trial version www.pdffactory.com

222
(14.74±0.92%). A ratio of 0.25 also produced a high GLA content of
13.50±0.78% and was not different from 0.2 ratio, the GLA ratio value at rest
of the aeration ratios were similar. The result also revealed that there was a
tendency of increase in the unsaturation index with the increase in aeration but
the mean values were not significantly different. At 0.2 ratio unsaturation
index was 1.02±0.04 (∆/mol). These results indicated that aeration was needed
for the conversion of monounsaturation status into polyunsaturation. PUFAs
are formed through desaturation and elongation from a carbon source in any of
the organisms in presence of oxygen i.e. aerobic reaction (Ratledge 1992a).
The conversion of saturated into unsaturated fatty acid is known to be regulated
by desaturase enzymes which require oxygen as a cofactor along with acetyl
coenzyme A (acetyl Co-A), acyl carrier protein, reduced NADH2 and reduced
NADPH2. These are greatly necessary for the citrate formation from acetyl
CoA in the presence of citrate lyase. If the oxygen concentration of the
medium falls to a low level, it becomes rate limiting for the desaturation
reaction (Choi et al. 1982; Devem & Manocha 1976; Robinson 2001a).
PDF created with pdfFactory Pro trial version www.pdffactory.com

223
Table 4.8 Effect of aeration on fatty acid profile in M. rouxii CFR-G15
Fatty acid composition (as % of total fatty acids) Aeration
ratio 14:0 16:0 16:1 18:0 18:1 18:2 18:3 DBI
0.10 3.50±0.19 22.24±1.14 3.07±0.32 9.52±0.84 35.47±1.91 10.28±1.02 12.68±0.93a 0.96±0.02
0.15 2.28±0.39 23.64±1.42 4.20±0.24 6.09±0.82 36.64±2.04 11.88±0.96 13.17±0.78a 1.02±0.0.2
0.20 3.17±0.32 24.05±1.27 3.73±0.35 6.70±0.79 34.05±1.78 12.05±0.74 14.74±0.92b 1.02±0.04
0.25 3.28±0.35 23.64±1.35 4.20±0.49 6.09±0.72 34.64±2.15 12.22±0.96 13.50±0.78b 1.02±0.06
0.30 2.84±0.23 23.83±1.42 2.82±0.51 6.23±0.65 36.99±2.26 12.60±0.81 12.73±0.86a 1.00±0.06
0.35 4.04±0.25 22.23±1.35 3.82±0.38 7.23±0.52 35.99±2.17 12.60±0.95 12.64±0.78a 0.99±0.08
0.40 3.07±0.46 24.55±1.21 2.73±0.34 9.70±0.83 35.05±2.05 12.05±0.91 12.20±0.64a 0.97±0.09
All parameters are expressed as Mean ± SD values in the same column with different letters are significant different at p< 0.05 according to Duncan’s multiple range tests. DBI- Double bond index.
PDF created with pdfFactory Pro trial version www.pdffactory.com

224
Optimization of Inoculum Size
Size of the inoculum in the culture medium plays an important role on
fungal metabolites like antibiotics (Penicillium), enzymes (Aspergillus) and
lipid (Cunninghamella, M. rouxii) (Chen & Liu 1997; Jangbua 2009; Pandey
2003). Inoculum size/density (number of spores per unit volume of
fermentation broth) has been attributed as one of the major factors influencing
mycelial morphology. This in turn affects mycelial growth and product
formation by determining the rheology of the culture and causing diffusion
limitation of nutrients within mycelial floes (Chen & Liu 1997; Metz 1977). In
this experiment, to study the effect of inoculum concentration on the
production of biomass buildup, lipid accumulation and GLA content, lower
concentration to higher concentration of inoculum size (0.5 ml, 1 ml, 2ml, 3ml,
4ml and 5ml containing 1.5x10⁶ per ml) were used. Normal inoculum size
through out the experiment had been fixed as 1.5x10⁶ spores/ ml. The result
obtained in this study is presented in Fig 4.22. Results indicated that 0.5 ml
containing 1.5x10⁶ spores /ml produced biomass of 6.40±0.41 g/L and 1 ml
produced 7.36±0.55 g/L biomass. Inoculum size 5ml containing 1.5x10⁶ spores
/ml had maximum content of biomass (9.12±0.45 g/L). Inoculum size of 4 ml
also gave similar results of biomass 8.34±0.65 g/L. Other quantity of inoculum
also produced similar results. At 5.0 ml of inoculum size the lipid content (%)
was 24.02±1.78, though the biomass production was high the lipid percent was
lower. At 0.5 ml 26.20±1.92 % was found. Lipid percentage was highest at 3
ml (32.34± 2.11 %) this value was not different from value obtained from 4.ml
(31.34± 2.12 %) or 2.0 ml also it was 29.60±2.48 they were not different. The
level of lipid percentage was decreased after inoculum size 3, may be due to
lack of aeration (dissolved oxygen) in the culture. An inoculum size of 0.5 ml
resulted in a total lipid grams per litre 1.68±0.02.g/L. An inoculum size of 1 ml
did not result in great increases in the total lipid content (2.08±0.16 g/L). There
was an increase in the total lipid content when the inoculum size was increased
to 2, 3, 4, or 5 ml, which were not different. Highest total lipid content
PDF created with pdfFactory Pro trial version www.pdffactory.com

225
observed with 4 ml of inoculum i.e. 2.61±0.34 g/L. Residual sugar content is
given in Fig 4.22. At an inoculum size of 0.5 ml the residual sugar was
5.12±0.46 g/L, this was higher than all the other groups which showed residual
sugar content from 2.98±0.90 g/L (1 ml) to 3.56±0.34 g/L (3 ml). Residual
sugar content of inoculum sizes 1.0 ml to 5.0 ml was not different.
0
5
10
15
20
25
30
35
DBM (g/L), Lipid %,
TLC (g/L) % Res sugar
(g/L)
0.5 1 2 3 4 5
Different Inoculum size (ml)
DB (g/L)TLC (%)
lipid g/L
Res. sugar
Fig. 4.22 Effect of different inoculum size on biomass, lipid production and residual sugar in M. rouxii CFR-G15.
Data are expressed as mean ±SD of three replicates. DB- dry biomass (g/L), TLC-Total lipid content (%), Residual sugar (g/L).
Different size of inoculum altered fatty acid profiles in M. rouxii CFR-
G15 is shown in Table 4.9. Inoculum size 2 ml, 3ml, 4ml produced the same
quantities of GLA viz., 15.29±0.95, 14.33±1.04 and 14.23±0.97% respectively.
Five ml of inoculum produced a biomass with 11.80±0.81% GLA for the total
fatty acid content. Inoculum size of 0.5 ml and 1.0 ml resulted in similar lower
values 12.24±0.90% and 13.24±1.10% respectively. The influence of inoculum
size on the production of unsaturated fatty acids was studied through double
bond index. Though the values varied from 0.96±0.04 (for 5 ml inoculum size)
to 1.08±0.08 (for 2 ml of inoculum size) the results were not significantly
different. It is evident from the result that 2 or 3 ml of inoculum could be
chosen for further studies based on percentage of GLA content. The result
PDF created with pdfFactory Pro trial version www.pdffactory.com

226
obtained in this study is differing to Chen & Liu (1997) in C. echinulutu CCRC
31840, where an increase in mycelial weight apparently resulted in an
increased yield of biomass, lipid, and GLA. Generally in fungal fermentation,
when the inoculum size increases, the growth of the organisms tends to be
more, but the problem of O2 limitation arises because of the high viscosity of
the culture broth due to high biomass and filamentous growth (Shimizu et al.
1988; Sumner & Morgan 1969a). At high inoculum size, stearic acid was
present in greater concentration, oleic acid and other unsaturated fatty acid in
less concentration. The reason might be that, conversion of stearic acid to oleic
acid by desaturase enzyme, when oxygen depletes, possibly the activity of the
enzyme also declines since it is an aerobic reaction (Uttaro 2006).
PDF created with pdfFactory Pro trial version www.pdffactory.com
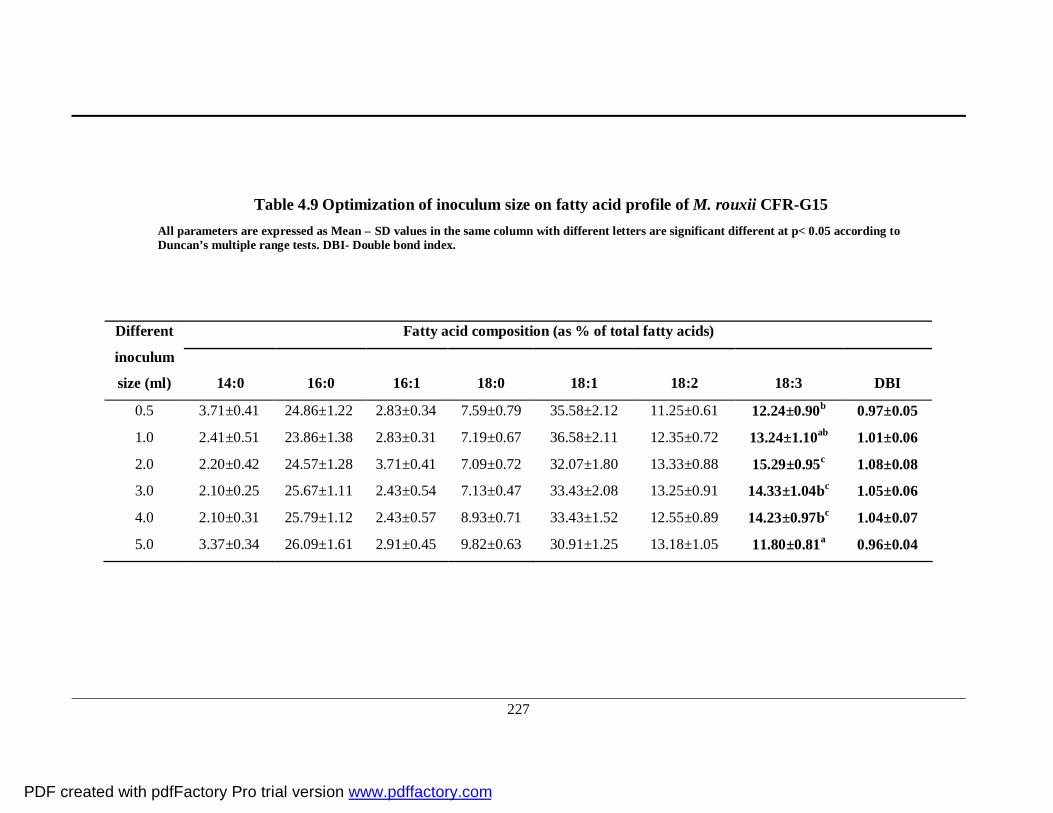
227
Table 4.9 Optimization of inoculum size on fatty acid profile of M. rouxii CFR-G15 All parameters are expressed as Mean ± SD values in the same column with different letters are significant different at p< 0.05 according to Duncan’s multiple range tests. DBI- Double bond index.
Fatty acid composition (as % of total fatty acids) Different
inoculum
size (ml) 14:0 16:0 16:1 18:0 18:1 18:2 18:3 DBI
0.5 3.71±0.41 24.86±1.22 2.83±0.34 7.59±0.79 35.58±2.12 11.25±0.61 12.24±0.90b 0.97±0.05
1.0 2.41±0.51 23.86±1.38 2.83±0.31 7.19±0.67 36.58±2.11 12.35±0.72 13.24±1.10ab 1.01±0.06
2.0 2.20±0.42 24.57±1.28 3.71±0.41 7.09±0.72 32.07±1.80 13.33±0.88 15.29±0.95c 1.08±0.08
3.0 2.10±0.25 25.67±1.11 2.43±0.54 7.13±0.47 33.43±2.08 13.25±0.91 14.33±1.04bc 1.05±0.06
4.0 2.10±0.31 25.79±1.12 2.43±0.57 8.93±0.71 33.43±1.52 12.55±0.89 14.23±0.97bc 1.04±0.07
5.0 3.37±0.34 26.09±1.61 2.91±0.45 9.82±0.63 30.91±1.25 13.18±1.05 11.80±0.81a 0.96±0.04
PDF created with pdfFactory Pro trial version www.pdffactory.com

228
Optimization of chemical parameters
Effect of Different carbon sources
During microbial fermentation, the carbon source acts as a major
nutrient for building cellular material and also as energy source (Aggelis et al.
1997; Dyal & Narine 2005; Papanikolaou et al. 2007). Biomass buildup, lipid
accumulation, fatty acid profile and its constitution have been influenced by
different type of sugars during fermentation (Dyal & Narine 2005; Hansoon &
Dostalek 1988; Jang et al. 2005; Papanokolaou et al. 2007; Sajbidor 1988;
Somashekar et al. 2002). The carbon sources tested were glucose, fructose,
galactose, maltose, lactose, sucrose and starch in M. rouxii CFR-G15. The
biomass produced during the growth of M. rouxii CFR-G15 in media
containing different carbon sources is given in Fig.4.23. The disaccharides
lactose gave the lowest biomass viz., 2.50±0.54 g/L. The highest biomass
production was exhibited in media with starch, glucose and fructose as the
source of carbon viz., 8.44±0.34, 8.12±0.61 and 7.51±0.72 g/L respectively.
Where as sucrose, galactose and maltose as source of carbon produced biomass
between these values 4.20±0.35, 6.40±0.45 and 7.39±0.31 g/L respectively.
These results were used as the basis for selection of glucose as carbon source
for further studies. Similar results also found in M. rouxii and Mucor sp. 1b,
where the biomass production was in high in both starch and glucose were used
as carbon source individually in the media (Somashekar et al. 2002). Findings
in this study is in agreement with the results reported by Hansoon & Dostalek
(1998) in which biomass production in M. ramanniana grown in media
containing fructose as the carbon source was only slightly higher than the
dextrose. Weete (1980) also observed that both glucose and fructose produce
much higher biomass than the sucrose in the media. Result obtained in this
study also corresponds to other Mucor spp. where the lactose was the poorest
carbon source for biomass production (Ahmed et al. 2006; Somashekar et al.
2002).
PDF created with pdfFactory Pro trial version www.pdffactory.com

229
0
5
10
15
20
25
30
35
Glucose
Fructo
se
Maltos
e
Galactos
e
Lactose
Sucrose
Starch
Different carbon sources
DB (g
/L),
TLC
(%) &
Lip
id (g
/L)
DB (g/L)TLC (%)Lipid (g/L)
Fig. 4.23 Effect of different carbon sources on biomass and lipid production in M. rouxii CFR-G15.
Data are expressed as mean ±SD of three replicates. DB- dry biomass (g/L), TLC-Total lipid content (%).
The lipid production (%) in M. rouxii CFR-G15 by different carbon
sources is given in Fig.4.23. Least percentage of lipid produced by lactose
15.56±1.60 and highest production was by glucose and fructose namely
30.34±1.91% and 29.67±1.73% respectively. These two values were not
different. The other sugars galactose, lactose, maltose and starch gave values
intermediate between these two levels. It is proved from these studies and
similar studies in literature that glucose and fructose are best suited as carbon
sources for the media as judged by this criterion. The production of total lipids
by M. rouxii CFR-G15 showed a different picture when glucose, starch,
fructose, maltose and galactose were used as carbon source. They were similar
in their total lipid production capacities (g/L) (1.51±0.41 to 2.46±0.23 g/L).
When lactose and sucrose were the carbon sources, the total lipid production
was as low as 0.39±0.34 g/L and 0.94±0.31 g/L respectively. The variations in
the total lipid were neutralised by the difference in the biomass contents when
the yield as g/L was calculated.
The GLA content as % of total fatty acids produced from different
sources showed the following picture. Glucose produced the highest GLA
PDF created with pdfFactory Pro trial version www.pdffactory.com
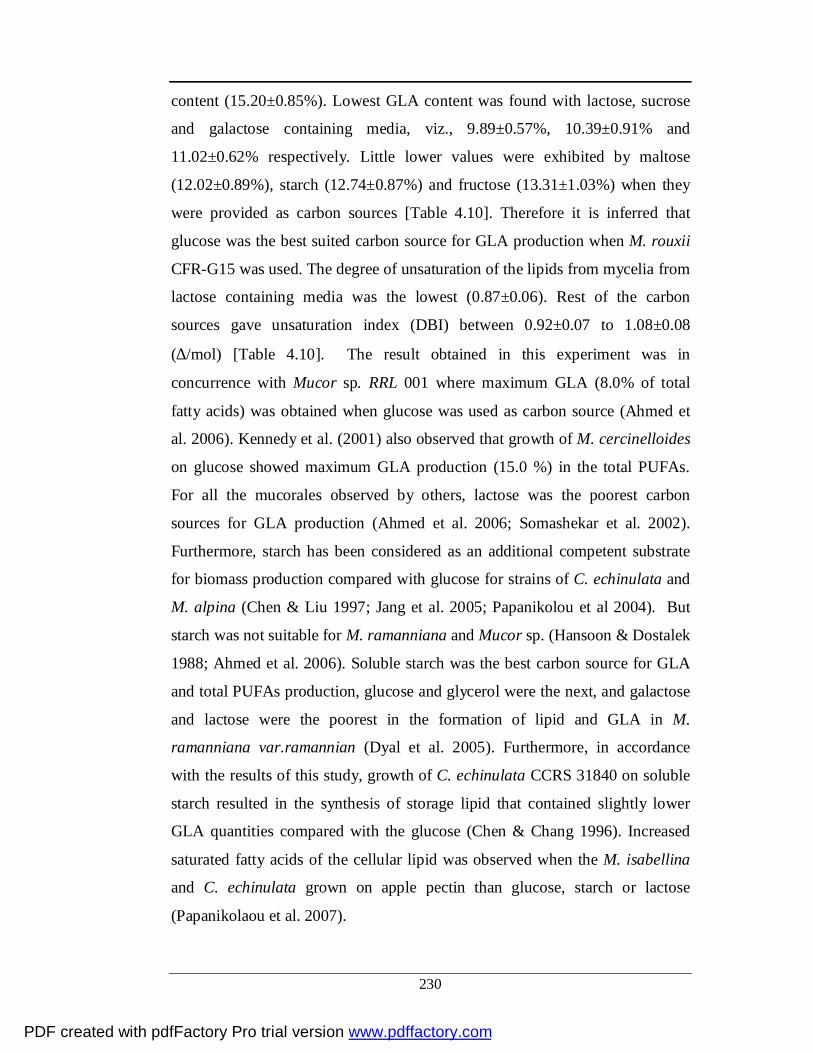
230
content (15.20±0.85%). Lowest GLA content was found with lactose, sucrose
and galactose containing media, viz., 9.89±0.57%, 10.39±0.91% and
11.02±0.62% respectively. Little lower values were exhibited by maltose
(12.02±0.89%), starch (12.74±0.87%) and fructose (13.31±1.03%) when they
were provided as carbon sources [Table 4.10]. Therefore it is inferred that
glucose was the best suited carbon source for GLA production when M. rouxii
CFR-G15 was used. The degree of unsaturation of the lipids from mycelia from
lactose containing media was the lowest (0.87±0.06). Rest of the carbon
sources gave unsaturation index (DBI) between 0.92±0.07 to 1.08±0.08
(∆/mol) [Table 4.10]. The result obtained in this experiment was in
concurrence with Mucor sp. RRL 001 where maximum GLA (8.0% of total
fatty acids) was obtained when glucose was used as carbon source (Ahmed et
al. 2006). Kennedy et al. (2001) also observed that growth of M. cercinelloides
on glucose showed maximum GLA production (15.0 %) in the total PUFAs.
For all the mucorales observed by others, lactose was the poorest carbon
sources for GLA production (Ahmed et al. 2006; Somashekar et al. 2002).
Furthermore, starch has been considered as an additional competent substrate
for biomass production compared with glucose for strains of C. echinulata and
M. alpina (Chen & Liu 1997; Jang et al. 2005; Papanikolou et al 2004). But
starch was not suitable for M. ramanniana and Mucor sp. (Hansoon & Dostalek
1988; Ahmed et al. 2006). Soluble starch was the best carbon source for GLA
and total PUFAs production, glucose and glycerol were the next, and galactose
and lactose were the poorest in the formation of lipid and GLA in M.
ramanniana var.ramannian (Dyal et al. 2005). Furthermore, in accordance
with the results of this study, growth of C. echinulata CCRS 31840 on soluble
starch resulted in the synthesis of storage lipid that contained slightly lower
GLA quantities compared with the glucose (Chen & Chang 1996). Increased
saturated fatty acids of the cellular lipid was observed when the M. isabellina
and C. echinulata grown on apple pectin than glucose, starch or lactose
(Papanikolaou et al. 2007).
PDF created with pdfFactory Pro trial version www.pdffactory.com

231
Table 4.10 Effect of different carbon source on fatty acid profile in M. rouxii CFR-G15
Fatty acid composition (as % of composition) Different
carbon
sources 14:0 16:0 16:1 18:0 18:1 18:2 18:3 DBI
Glucose 2.17±0.37 24.05±1.21 3.73±0.47 5.70±0.65 35.05±2.03 12.05±0.94 15.20±0.85d 1.08±0.08c
Fructose 1.42±0.31 25.63±1.36 2.21±0.28 6.37±0.54 38.20±1.83 11.24±1.03 13.31±1.03c 1.03±0.05bc
Maltose 3.16±0.27 24.14±1.28 2.12±0.38 9.28±0.41 33.76±1.14 13.72±0.69 12.02±0.89bc 1.00±0.04bc
Galactose 3.14±0.53 25.14±1.33 3.12±0.65 8.28±0.81 35.70±1.61 11.72±0.73 11.02±0.62ab 0.92±0.07ab
Lactose 3.19±0.45 28.80±1.29 1.20±0.58 11.20±1.01 33.37±1.89 10.32±0.84 9.89±0.57a 0.87±0.06a
Sucrose 3.51±0.51 23.97±1.39 1.72±0.39 8.94±0.90 39.76±1.78 11.11±0.96 10.39±0.91a 1.01±0.07bc
Starch 1.41±0.49 22.80±1.15 2.89±0.55 8.52±0.83 38.80±1.45 11.27±1.03 12.74±0.87c 1.07±0.08c All parameters are expressed as Mean ± SD values in the same column with different letters are significant different at p< 0.05 according to Duncan’s multiple range tests. DBI- Double bond index.
PDF created with pdfFactory Pro trial version www.pdffactory.com

232
In microbial fermentations, the simple carbohydrates, especially the
glucose assimilated most efficiently and rapidly for the formation of biomass
and lipid. In the recent past, for economical production of single cell oil (SCO)
a variety of low cost substrates like dairy, distilleries and agricultural wastes
have found to be utilized as a major carbon source (Chen et al. 1999; Certik et
al. 2006; Conti et al. 2001; Fakas et al. 2008; Gema et al. 2002; Li et al. 2008;
Papanikolaou et al. 2007; Waltermann et al. 2000). Several oleaginous
microorganism like Cunninghamella spp. and Rhizopus spp. use starch as a
carbon source but they need more incubation period to degrade the substrates
and convert into lipid (Chen & Chang 1996). In this study, mucorales which
are saprophytic, grew very rapidly and proliferate extensively on simple sugars
compared to complex substrates. Similar observation have been reported earlier
by Ahmed et al. (2006); Jang et al. (2005); Kennedy et al. (2001); Somashekar
et al. (2002). Based on the above observation, all the further experiments have
been carried out in FPM medium containing glucose as carbon source.
Optimization of glucose concentration in fermentation medium
Optimization of glucose concentration for maximum biomass, lipid and
GLA production was carried out by keeping the concentration of nitrogen
source as constant in FPM medium. When glucose levels of 2-10% were tested
as the carbon source in the FPM medium, the biomass content was 6.72±0.37
g/L at 2.0% level which was the lowest quantity. There was an increased level
(mean values) in the biomass content with increase in the glucose level. At 4, 6,
8 and 10 the values were 7.70±0.58 g/L, 8.53±0.68, 8.27±0.90 and 7.83±0.63
g/L, but the values were not different. The result obtained in this study is
presented in Fig 4.24. At a glucose level of 2% the lipid (% of biomass) was
25.60±0.97 %. The lipid level increased from 4 % onward (37.80±1.21%) and
was similar at 6, 8, and 10% also. At 8% it was 39.50±1.24% and was the
maximum lipid produced. Total lipid (g/L) was 1.72±0.16 at glucose level of
2%. It showed steep rise at 4% level to 2.92±0.31 g/L. The total lipid content 6,
8, 10 % was not different and was 3.19±0.40 g/L, 3.28±0.46 g/L and 3.09±0.30
PDF created with pdfFactory Pro trial version www.pdffactory.com

233
g/L respectively. The glucose utilized by M. rouxii CFR-G15 at 2, 4, 6,8 and
10% was as follows 19.2±0.36, 36.94±0.45, 53.5±0.58, 69.77±0.52 and
83.51±0.70 g/L. With every increment in the glucose levels supplied an
increment in the utilization was noticed.
Fig. 4.24 Effect of different concentration of glucose on biomass, lipid production and sugar utilized in M. rouxii CFR-G15.
Data are expressed as mean ±SD of three replicates. DB- dry biomass (g/L), TLC-Total lipid content (%), Residual sugar (g/L).
Effet of different glucose concentration on fatty acid profile in M. rouxii
CFR-G15 is shown in Table 11 GLA content at 2 % it was 12.91±0.74%, at
10% level 11.96±0.65% and at 8 % 13.51±0.86 %. Highest GLA content was
found at 6% 15.67±0.97 %, at 4% also the GLA content was similar
(14.79±0.84%). There is no difference at double bond index in all the levels
tested. It ranged from 1.02±0.13 (10%) to 1.12±0.09 (∆/mol) (6%).
The results obtained in this study agreed with the results of Chen &
Chang (1996). When Cunninghmella was cultivated for GLA production at
higher percentage of carbon source (glucose), didn’t yield good amount of
biomass and lipid. This effect was also observed in various fungi including
Mortierella spp. Mucor spp. and Cunninghamella spp. (Mamatha et al. 2008;
Nakhara et al. 1993; Papanikalaou et al. 2004a). It was also reported that fatty
acids content increased with the concentration of glucose from 2.0 to 12.0% in
M. alpina CBS 754.68, while AA content was reversed (Bajpai et al. 1991c;
Koike et al. 2001).
PDF created with pdfFactory Pro trial version www.pdffactory.com

234
Table 4.11 Effect of initial glucose concentration on fatty acid profile in M. rouxii CFR-G15
All parameters are expressed as Mean ± SD values in the same column with different letters are significant different at p< 0.05 according to Duncan’s multiple range tests. DBI- Double bond index.
Fatty acid composition (as % of total fatty acids) Different conc.
of glucose 14:0 16:0 16:1 18:0 18:1 18:2 18:3 DBI
2 2.35±0.53 21.41±1.23 3.35±0.53 7.44±0.64 38.22±1.56 12.65±0.96 12.91±0.74a 1.06±0.08
4 2.42±0.34 23.53±1.87 3.49±0.64 8.47±0.79 33.41±1.21 13.14±0.98 14.79±0.84bc 1.08±0.07
6 2.56±0.45 21.78±1.11 3.34±0.45 6.75±0.34 32.59±1.35 14.55±1.02 15.67±0.97c 1.12±0.09
8 3.41±0.54 21.70±1.15 3.59±0.54 7.91±0.62 34.95±1.85 13.5±1.01 13.51±0.86ab 1.06±0.10
10 3.40±0.58 21.67±1.26 4.02±0.76 7.65±0.73 37.93±1.87 11.94±1.19 11.96±0.65a 1.02±0.13
PDF created with pdfFactory Pro trial version www.pdffactory.com
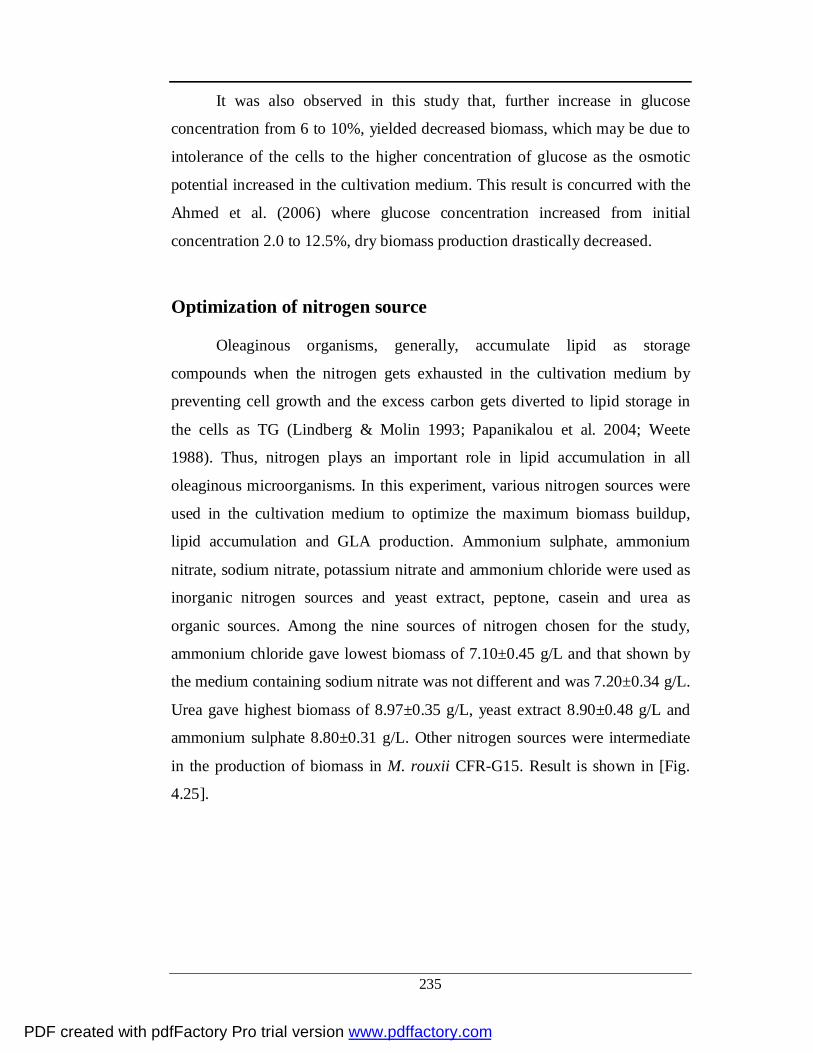
235
It was also observed in this study that, further increase in glucose
concentration from 6 to 10%, yielded decreased biomass, which may be due to
intolerance of the cells to the higher concentration of glucose as the osmotic
potential increased in the cultivation medium. This result is concurred with the
Ahmed et al. (2006) where glucose concentration increased from initial
concentration 2.0 to 12.5%, dry biomass production drastically decreased.
Optimization of nitrogen source
Oleaginous organisms, generally, accumulate lipid as storage
compounds when the nitrogen gets exhausted in the cultivation medium by
preventing cell growth and the excess carbon gets diverted to lipid storage in
the cells as TG (Lindberg & Molin 1993; Papanikalou et al. 2004; Weete
1988). Thus, nitrogen plays an important role in lipid accumulation in all
oleaginous microorganisms. In this experiment, various nitrogen sources were
used in the cultivation medium to optimize the maximum biomass buildup,
lipid accumulation and GLA production. Ammonium sulphate, ammonium
nitrate, sodium nitrate, potassium nitrate and ammonium chloride were used as
inorganic nitrogen sources and yeast extract, peptone, casein and urea as
organic sources. Among the nine sources of nitrogen chosen for the study,
ammonium chloride gave lowest biomass of 7.10±0.45 g/L and that shown by
the medium containing sodium nitrate was not different and was 7.20±0.34 g/L.
Urea gave highest biomass of 8.97±0.35 g/L, yeast extract 8.90±0.48 g/L and
ammonium sulphate 8.80±0.31 g/L. Other nitrogen sources were intermediate
in the production of biomass in M. rouxii CFR-G15. Result is shown in [Fig.
4.25].
PDF created with pdfFactory Pro trial version www.pdffactory.com

236
0
5
10
15
20
25
30
35
40
KNO3
(NH4)2
NO3
(NH4)2
SO4
(NH4)2
Cl2
Na2NO3
Urea YE
Pepto
ne
Casein
Different Nitrogen Sources
DB
(g/L
), TL
C (%
) & R
es. s
ugar
(g/L
)
DB (g/L)TLC (%)Res.sugarLipid (g/L)
Fig. 4.25 Effect of different nitrogen sources on biomass, lipid Production and residual sugar in M. rouxii CFR-G15.
Data are expressed as mean ±SD of three replicates. DB- dry biomass (g/L), TLC-Total lipid content (%), Residual sugar (g/L). YE-Yeast extract
The values of lipid percentage of dry biomass of M. rouxii CFR-G15
showed that all the nitrogen sources promoted similar lipid accumulation
ranging from 25.49±1.23% (ammonium sulphate) to 28.00±1.31% (peptone).
Ammonium nitrate (29.86±1.30%) and yeast extract (32.0±1.37%) showed
higher percentage of lipid accumulation. When the total lipid content as g/L,
M. rouxii CFR-G15 showed that all the nitrogen sources yielded 1.94±0.20 g/L
(sodium nitrate) to 2.29±0.17 g/L (urea). Yeast extract (2.85±0.24 g/L) showed
high lipid yield in M. rouxii CFR-G15. Ammonium nitrate showed little higher
value 2.45±0.27 g/L than the other sources but was less than yeast extract [Fig.
25]. The residual sugar content in yeast extract was the lowest i.e. 2.12± 0.42
g/L, this was expected as yeast extract showed very good biomass production
and lipid accumulation. The medium containing sodium nitrate as nitrogen
source showed the highest amount of residual sugar namely 5.12±0.34 g/L, the
biomass content also the lowest in the group. Rest of them values were in
between for e.g., potassium nitarate (3.12±0.38 g/L) to urea (4.70±0.21 g/L).
Ammonium sulphate and urea though gave more biomass, the lipid content was
PDF created with pdfFactory Pro trial version www.pdffactory.com

237
found to be very less. Many studies have shown the effect of nitrogen source
on the biomass and lipid yield in yeast and fungal species (Evans & Ratledge
1984; Fakas et al 2007a; Park et al. 1999; Somashekar et al. 2002; Totani et al.
2000). Hansson & Dostalek (1988) observed that when potassium nitrate used
as nitrogen source gave more biomass, lipid content when compared to
ammonium chloride or ammonium sulphate in M. ramanniana CBS 112.08.
Dyal et al. (2005) showed that 1% yeast extract and 4% glucose as nitrogen
source in the cultivation medium gave the best production of biomass, lipid and
AA production in M. ramanniana var ramanniana. Our result is also very
much in agreement with this observation.
The effect of different nitrogen supplement on GLA and other fatty
acids production is illustrated in Table 4.12. The GLA content as percent of
total fatty acids was lowest in yeast extract medium with the value of
11.02±0.87%. Casein containing medium also resulted a low GLA containing
11.11±0.71%. Though the biomass and lipid content were high, with these two
nitrogen sources (casein and yeast extract) the total lipid content was high in
yeast extract and a slight variation observed in casein. But these two nitrogen
sources when graded on GLA content were as lowest performers in.
Ammonium nitrate, peptone, ammonium chloride and potassium nitrate as
nitrogen sources produced lipid with GLA contents of 16.64±1.13, 15.77±1.08,
14.94±1.04 and 14.92±0.85% respectively. The unsaturated fatty acid content
as measured with the double bond index gave the following results. Media
containing casein as source of nitrogen had the lowest double bond index
namely 0.82±0.09. The highest values were obtained with media with
ammonium nitrate (1.11±0.09) and peptone (1.08±0.07). The other had values
in between these two nitrogen sources.
The result obtained in our study is not concomitant with the results
obtained by Lindberg & Molin (1993), in Mortierella alpine CBS 343.66
where ammonium nitrate was replaced with KNO3 enhanced the cell growth,
total PUFAs and AA production. Yeast extract as sole nitrogen source
PDF created with pdfFactory Pro trial version www.pdffactory.com

238
stimulated the cell growth, but not for GLA and total PUFAs production (Dyal
et al. 2005; Dyal & Narine 2005). Ammonium nitrate was the best nitrogen
source for GLA and total PUFAs production. However, Mortierella spp.
produce maximum GLA at 1% yeast extract and also increase of yeast extract
concentration in the cultivation medium promoted the cell growth (Bajpai &
Bajpai 1992). Chen & Chang (1996) in their study reported that use of urea as
nitrogen source in the cultivation medium enhanced growth and GLA
production of C. echinulata CCRC 31840. The probable reason that urea has
higher nitrogen content as compared to the other nitrogen sources and created
an inert atmosphere that has prevented the oxidation of unsaturated fatty acids.
Several studies indicated that use of variety of nitrogen sources during
fermentation process affect the yield of mycelial growth in different ways (Park
et al. 1999).
PDF created with pdfFactory Pro trial version www.pdffactory.com
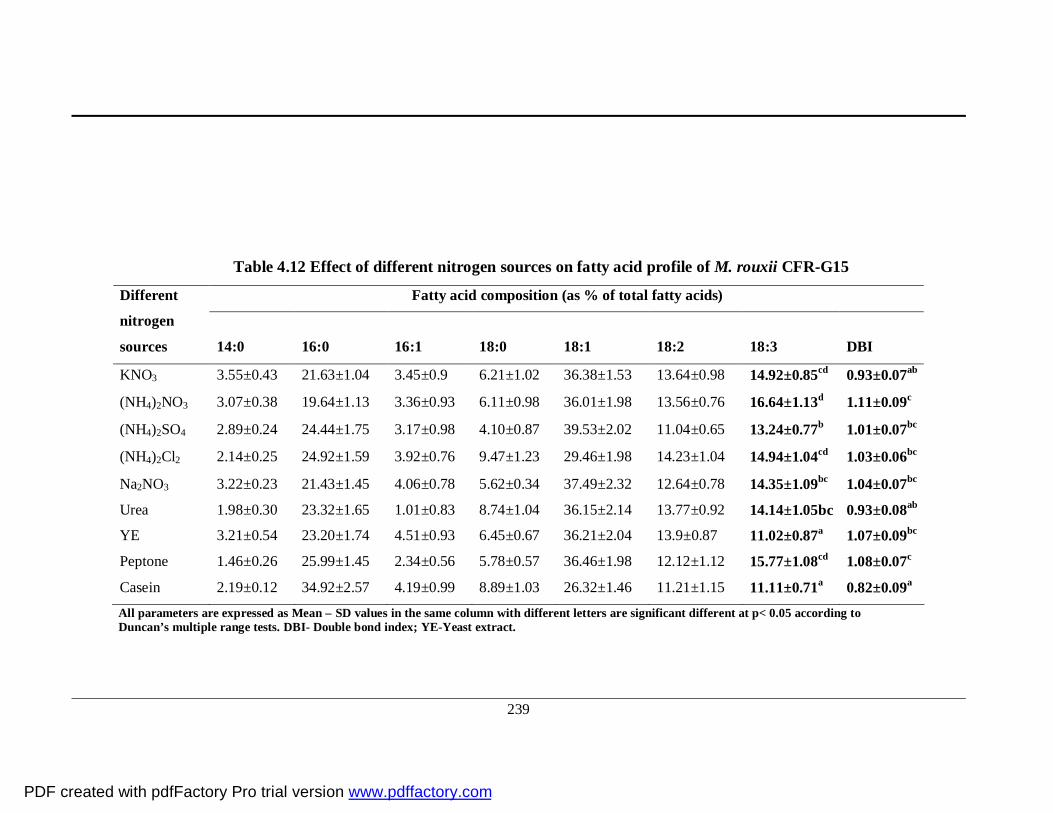
239
Table 4.12 Effect of different nitrogen sources on fatty acid profile of M. rouxii CFR-G15
Fatty acid composition (as % of total fatty acids) Different
nitrogen
sources 14:0 16:0 16:1 18:0 18:1 18:2 18:3 DBI
KNO3 3.55±0.43 21.63±1.04 3.45±0.9 6.21±1.02 36.38±1.53 13.64±0.98 14.92±0.85cd 0.93±0.07ab
(NH4)2NO3 3.07±0.38 19.64±1.13 3.36±0.93 6.11±0.98 36.01±1.98 13.56±0.76 16.64±1.13d 1.11±0.09c
(NH4)2SO4 2.89±0.24 24.44±1.75 3.17±0.98 4.10±0.87 39.53±2.02 11.04±0.65 13.24±0.77b 1.01±0.07bc
(NH4)2Cl2 2.14±0.25 24.92±1.59 3.92±0.76 9.47±1.23 29.46±1.98 14.23±1.04 14.94±1.04cd 1.03±0.06bc
Na2NO3 3.22±0.23 21.43±1.45 4.06±0.78 5.62±0.34 37.49±2.32 12.64±0.78 14.35±1.09bc 1.04±0.07bc
Urea 1.98±0.30 23.32±1.65 1.01±0.83 8.74±1.04 36.15±2.14 13.77±0.92 14.14±1.05bc 0.93±0.08ab
YE 3.21±0.54 23.20±1.74 4.51±0.93 6.45±0.67 36.21±2.04 13.9±0.87 11.02±0.87a 1.07±0.09bc
Peptone 1.46±0.26 25.99±1.45 2.34±0.56 5.78±0.57 36.46±1.98 12.12±1.12 15.77±1.08cd 1.08±0.07c
Casein 2.19±0.12 34.92±2.57 4.19±0.99 8.89±1.03 26.32±1.46 11.21±1.15 11.11±0.71a 0.82±0.09a All parameters are expressed as Mean ± SD values in the same column with different letters are significant different at p< 0.05 according to Duncan’s multiple range tests. DBI- Double bond index; YE-Yeast extract.
PDF created with pdfFactory Pro trial version www.pdffactory.com

240
Effect of C:N ratio
The carbon to nitrogen (C:N) ratio in the growth medium plays a major
factor for achieving the high lipid accumulation in oleaginous microorganisms
(Fakas et al. 2008; Moreton 1988). The media used for lipid production have to
be high C:N ratio so that sufficient carbon left in medium will be utilized for
lipid accumulation during culture growth (Ratledge & Wynn 2002). The effect
of C/N ratio on lipid production was well studied by most of the researcher
(Chen & Chang 1996; Immelman et al. 1997; Koike et al. 2001; Nakhara et al.
1992; Papnikolaou et al. 2008). In this experiment, optimization of C:N ratio
for biomass, lipid and GLA production of M. rouxii CFR-G15 was carried out.
The result obtained in this study is shown in Fig. 4.26. The C:N ratio produced
a biomass of 8.60±0.53 g/L, C:N ratio of 20 and 140 resulted in biomass
content of 9.28±0.74 g/L and 9.80±0.87 g/L respectively. The highest biomass
content was observed when C:N ratio 80 which was 11.73±0.9 g/L. The other
C: N ratios values were in between. Percentage of lipid production was lowest
in C: N ratio 160 namely 15.34±0.93 %, again the lipid % was highest with the
C:N ratio of 80 i.e. 39.45±1.54. No other trends could be influenced from the
data. At C:N ratio 160 had a lowest total lipid yield (1.32±0.14 g/L), the
highest lipid yield was obtained at C:N ratio of 80 i.e. 4.64±0.61 g/L. A C:N
ratio 20 also showed a trend similar to 160 C:N ratio. The residual sugar
content increased from C:N 20 to 140. There is a slight lowering in the residual
sugar in 160 C:N ratio. Residual sugar in 20 C:N ratio was 1.15±0.23 g/L and
at 140 it was 13.78±0.57 g/L, at 160 it was 12.17±0.53 g/L.
PDF created with pdfFactory Pro trial version www.pdffactory.com

241
Fig. 4.26 Effect of different C:N ratio on biomass, lipid production and residual sugar in M. rouxii CFR-G15.
Data are expressed as mean ±SD of three replicates. DB- dry biomass (g/L), TLC-Total lipid content (%), Residual sugar (g/L).
The GLA content as a percent of lipid content was lowest at a C:N ratio
160 and 140 and were 8.44±0.66 and 9.33±0.59% respectively. The GLA
content was highest at 60 and 40 C:N ratio and were 15.17±1.15 and
13.78±1.04% respectively. The double bond indices of C:N ratio of 20 to 160
was the same[Table 4.13]. Optimum C:N ratio for maximum biomass, lipid and
GLA production in this organism was found between C:N ratio 40 and 80 .
In general, when the C:N ratio was tested, the lipid accumulation
accelerated after depletion of nitrogen source in the medium and high lipid
accumulation observed at high C:N ratio. When high C:N ratio was used in
cultivation medium, the rate of glucose uptake could be higher that lead to
increased ATP production. Consecutively the ATP production increases cell
energy charge that would inhibit isocitrate dehydrogenase (ICDH) activity
(Ratledge & Wynn 2002). However in oleaginous fungi the inhibition of
ICDH, triggers the lipid accumulation in the mycelium (Papanikolou et al.
2004; Wynn et al. 2001). Our study also revealed that during lipogenic phase,
GLA content was found to be decreased. Furthermore, the result obtained in the
experiment is supported with the report of Kennedy et al. (1993). They used
PDF created with pdfFactory Pro trial version www.pdffactory.com

242
two strains to study lipid and GLA production potentially and observed that
lipid accumulation increased at high C:N ratio but GLA content was very low.
Kavadia et al. (2001) indicated in his study, the change of GLA content in the
lipogenic phase was observed in oleaginous zygomycetes fungi. It could be the
commencement of growth i.e. spores development, GLA synthesized in more
amount and utilized for proper functioning of membrane while in lipogenic
phase GLA synthesis decreases. Similar observation was made on M.
ramannian var. angulispora, when organisms enter the lipogenic (stationary)
phase, the conversion of LA to GLA decreases (kamashika et al. 1990). All the
above findings lipid accumulation and GLA synthesis and our results are
similar with the.
Fakas et al. (2008) & Koike et al. (2001) studied the control of C:N
exerts on lipogenesis in media comprising agro-industrial waste that contain
organic nitrogen was investigated. The studies showed that rate of carbon
uptake and nitrogen availability were major factors affecting lipid
accumulation process in oleaginous microorganisms. When the carbon uptake
was more, the lipid accumulation occurred even in the presence of high amount
of nitrogen in the growth medium. Therefore, when the waste residues were
evaluating, the medium C:N ratio should not be considered as an adequate
criterion during their fermentation time. When the C:N ratio was higher than
20, the mycelial weight and AA decreased due to N2 limitation. The GLA
production and total PUFAs in Mucor recurvus sp increased significantly to the
maximal level. C:N ratio of 35 was found to be optimal for maximum GLA
production (Li et al. 2008). GLA content decreased sharply when the C:N ratio
was lower than 30 or higher than 40 in Mucor sp. RRL 001(Ahamed et al.
2006). Jang et al. (2005) studied the effect of C:N ratio on PUFAs production
in M. alpina. Results obtained indicated that there was significant differences
among C:N ratio, final pH, cell dry weight and PUFAs production. Thus, it
could be concluded through our studies that, the relative proportion of C:N
ratio play major role in biomass production, lipid and GLA accumulation in M.
rouxii CFR-G15.
PDF created with pdfFactory Pro trial version www.pdffactory.com

243
Table 4.13 Optimization of C:N ratio on fatty acid profile of M. rouxii CFR-G15
All parameters are expressed as Mean ± SD values in the same column with different letters are significant different at p< 0.05 according to Duncan’s multiple range tests. DBI- Double bond index.
Fatty acid composition (as % of total fatty acids) Different
C:N ratio 14:00 16:00 16:01 18:00 18:01 18:02 18:03 DBI
20 2.98±0.56 23.39±1.34 4.45±0.26 10.91±1.23 35.57±2.13 10.61±1.01 11.56±0.90b 0.90±0.07
40 2.57±0.47 22.26±1.23 4.10±0.34 10.04±1.34 32.70±2.04 12.72±1.36 13.78±1.04cd 1.04±0.09
60 2.80±0.78 22.81±1.52 4.22±0.63 9.10±1.56 32.00±1.98 12.70±1.81 15.17±1.15d 1.07±0.12
80 1.59±0.82 22.12±1.31 4.33±0.56 10.30±1.03 33.88±2.32 12.12±1.45 12.34±0.85bc 0.99±0.05
100 1.51±0.45 23.92±1.45 3.67±0.34 12.06±1.56 34.11±2.56 11.27±1.31 12.17±0.87bc 0.97±0.10
120 2.22±0.39 22.24±1.63 3.91±0.78 12.50±1.34 35.51±2.69 10.23±1.09 11.48±0.85b 0.94±0.09
140 2.66±0.43 25.26±1.37 3.84±0.78 13.50±1.78 34.30±2.64 9.61±1.12 9.33±0.59a 0.85±0.06
160 2.68±0.71 27.13±1.56 2.10±0.56 13.50±1.65 36.30±2.87 8.06±0.98 8.44±0.66a 0.80±0.04
PDF created with pdfFactory Pro trial version www.pdffactory.com

244
Supplementation of Minerals to enhance the GLA production
Several studies indicated that addition of minerals like Mg2+, Mn2+, Fe2+,
Ca2+, Cu2+ and Zn2+ ions with different concentration influence the growth,
lipid and PUFAs production, in M.ramanniana var ramanniana, M.
ramanniana, M. isabeeliana, Rhizopus nigricans SSS 0088 and
Cunninghamella sp.2A1 (Bandyopadhyay et al. 2003; Dyal et al. 2005;
Higashiyama et al. 1999; Muhid et al. 2008). A study was carried out for
optimization of Mg2+, Ca2+, K+ and Na2+, (at levels of 0.25, 0.5, 1.0 and 2.0
g/L), Zn2+, Fe2+ (at levels of 0.1, 1, 2, 5 mg/L) and Cu2+ and Mn2+ (0.1, 0.25,
0.5 1 mg) supplemented to basal medium (FPM) to know their influence on
lipid and GLA content in M. rouxii CFR-G15. The results indicated that when
this organism cultivated in basal medium without any addition of minerals, the
production of biomass (8.24±0.43 g/L), lipid (30±1.32%) and GLA (14.2±0.53
%) was observed. Supplementation of Mg2+ in the culture medium and biomass
build up at 0.25 & 2 g/L resulted in the lowest biomass content were 7.36±0.97
g/L and 8.35±1.01 respectively. At 0.5 g/L gave highest biomass of 11.56±0.25
g/L which was higher than in control. Addition of Mg2+ at a level of 0.5 g/L
resulted in a significant increase in the biomass production by the fungus M.
rouxii CFR G15. Further increment of Mg2+ level at 1 g/L and 2 g/L resulted in
a biomass level lesser than 0.5 g/L. Ca2+ supplementation to media at 0.25 g/L
resulted in the lowest biomass 6.82±0.36 g/L, which was lower than the
control. Raising the Ca2+ level in media to 0.5 g/L resulted in the biomass
production in the group 11.20±0.34 g/L, which was higher than that found in
basal medium. There was a lowering biomass when Ca2+ level raise to 1 and 2
g/L. Addition of K+ at 0.25 and 0.5 g/L did not result in the increment in the
biomass content. Supplementation of K+ at 1 g/L resulted in the considerable
increment in the biomass content to 11.43±0.50 g/L. Addition of Na2+ at 2
g/L to 9.45±0.51 g/L resulted in a small increases in the biomass content when
compared to control. Since the source of Na2+ was sodium sulphate salt, it was
noticed that apart from contributing to the medium, it resulted in a change in
PDF created with pdfFactory Pro trial version www.pdffactory.com

245
pH of the medium, which might have impact on biomass production. Addition
of Fe2+ at the level chosen namely at 0.1, 1, 2 and 5 mg/L did not result any
improvement in the production of biomass content. Addition of Zn2+ to
medium resulted in an increase in the biomass 11.25±0.47 g/L at 2 mg/L.
Addition of Cu2+ at the levels used in this study did not show any increase in
the biomass content (rather it brought down the biomass level considerably).
Addition of Mn2+ to the medium resulted in increased biomass at 1 mg/L.
Further increments in Mn2+ addition brought down the biomass production in
the levels studied. The results are given in Fig. 4.27a, b, & c.
0
2
4
6
8
10
12
DB (g/L)
Mg2+ Ca2+ K+ Na2+
Dfferent concentration of minerals (g/L)
Control0.250.501.002.00
0
2
4
6
8
10
12
DB (g/L)
Fe2+ Zn2+
Different conc. of minerals (mg/L)
Control0.1125
a b
0
1
2
3
4
5
6
7
8
9
10
DB (g/L)
Control 0.10 0.25 0.50 1.00
Different conc. of minerals (mg/L)
Cu2+
Mn2+
c
Fig. 4.27a,b,c Effect of different Minerals on biomass production in M. rouxii CFR-G15. Data pressed as mean ±SD of three replicates. DB- dry biomass (g/L).
PDF created with pdfFactory Pro trial version www.pdffactory.com

246
Addition of different mineral at different concentration to the medium
on percentage of lipid content shown in Fig. 4.28a, b, & c. Addition of Mg2+ to
medium at 0.5 g/L resulted in an increase in the lipid content (36.19±0.86%).
Supplementation of Ca2+ at 0.5 g/L resulted in an increase of lipid 35.38±0.92
%. K+ supplementation at 0.5 g/L increased lipid level to 34.67±1.25. Levels
used in the Na2+ supplement experiment didn’t result any increase the lipid
percent. 0.1 mg/L of Fe2+ resultant lipid 33.46±1.25 %. Further increase in
levels lowered the lipid percent level. Addition of 1 mg/L of Zn2+ slight
increase in the lipid percentage 35.33±1.11, further addition resulted in
decrease in the lipid percent. Addition of Cu2+ at the levels of used in this
experiment didn’t show any raise in the lipid content. Addition of Mn2+ in the
level used in the experiment didn’t result in any increase in the lipid percent
level. Total lipid yield (g/L) of M. rouxii CFR-G15 in basal medium was 2.48±
0.18 g/L. Addition of Mg2+ in the medium resulted in a value of 4.19±0.16 g/L,
which is above the control value. Addition of 0.5 g/L Ca2+ to the medium
resulted in 3.96±0.22 g/L. Supplementation of 1 g/L K+ resulted in total lipid
values of 3.63±0.0.15 g/L. Na2+ level didn’t increase total lipid yield at any
level of the supplement studied. Addition of iron at the levels studied didn’t
improve the total lipid yield in the M. rouxii CFR-G15, rather the total lipid
yield was considerably lower at all the four level studied. Addition of the Zn2+
didn’t result in an increase in yield of total lipid. Supplementation of Cu2+ to
the medium at the levels studied didn’t result an increment the total lipid yield.
Supplementation of Mn2+ at the levels studied didn’t result in increase of lipid
yield.
Minerals influenced significantly the production of GLA in M. rouxii
CFR-G15 [Fig. 4.29a, b & c]. GLA content of the group supplemented with
Mg2+ at 0.5 g/L resulted in a GLA content of 24.56±0.72 % as total fatty acids.
When compare to the unsupplemented basal medium which was 14.25±0.53 %.
Ca2+ content at 0.5 g/L resulted in an increase in the GLA content to
23.52±0.96%. K+ supplementation at 0.5 g/L resulted in an increment in GLA
content over the basal medium (20.83±1.23 %). 1 g/L resulted in a value of
PDF created with pdfFactory Pro trial version www.pdffactory.com

247
22.91±1.27 % which was not significantly different. Na2+ at 1.0 g/L
supplementation resulted in a higher GLA content of 21.05±1.21% which
similar values of 20.68±1.25 and 21.54±0.82 at 0.5 g/L and 2.0 g/L
respectively.
0
5
10
15
20
25
30
35
40
Control 0.25 0.50 1.00 2.00
Conc. of minerals (g/L)
Lipi
d (%
)
Mg2+Ca2+K+Na2+
0
5
10
15
20
25
30
35
40
45
Control 0.10 1.00 2.00 5.00Conc. of minerlas (mg/L)
Lipi
d (%
)
Fe2+Zn2+
a b
0
5
10
15
20
25
30
35
Control 0.10 0.25 0.50 1.00Conc. of minerals (mg/L)
Lipi
d (%
)
Cu2+Mn2+
c
Fig. 4.28 Effect of different Minerals on total lipid content in M. rouxii CFR-G15.
Data are expressed as mean ±SD of three replicates. TLC-Total lipid content (%),
PDF created with pdfFactory Pro trial version www.pdffactory.com

248
Supplementation of Fe2+ resulted in a GLA of 19.47±0.84% at 0.1 mg/L
and was higher than the content of the basal media in M. rouxii CFR-G15.
Supplementation of Zn2+ at 0.1 mg/L resulted in a slight increase in GLA
content to 16.79± 0.73%. Cu2+ didn’t result any increment in the GLA content
of the lipid. Supplementation of 1 mg/L Mn2+ resulted in a value similar to that
of basal medium and was 15.06±0.84%. The GLA production of the fungus
for the individual minerals was the best (among the several concentrations of
the minerals) at the mineral concentration of Mg2+ and Ca2+ at 0.5 g/L. Thus
comparing the results obtained by the addition of minerals at their various
concentrations it was observed that Mg2+ and Ca2+ as an additive to the basal
medium was most effective for enhancing GLA yield. The degree of GLA
production was almost 1.5 fold in comparison to the basal medium alone and
this enhancement can be considered to be significant.
0
5
10
15
20
25
30
Mg2+ Ca2+ K+ Na2+Conc. Of minerals (g/L)
DB
(g/L
)
Control0.250.501.002.00
0
5
10
15
20
25
Fe2+ Zn2+Conc. Of minerals (mg/L)
GLA
(%)
Control0.101.002.005.00
a b
0
5
10
15
20
25
Cu2+ Mn2+Conc. Of minerals (mg/L)
GLA
(%)
Control0.100.250.501.00
c
Fig. 4.29 Effect of different Minerals on GLA content in M. rouxii CFR-G15.
Data are expressed as mean ±SD of three replicates. GLA expressed as relative % of total fatty acids
PDF created with pdfFactory Pro trial version www.pdffactory.com

249
Furthermore, results obtained in this study concurred with the M.
ramanniana var. ramanniana, that media supplemented with Mg2+, Cu2+ and
Mn2+ yielded more lipid when compare to medium without any mineral
supplements (Dyal et al 2005). Maximum lipid production was attained in M.
ramanninana when addition of Cu2+ (0.005 g/L) and Zn2+ (0.0075 g/L) to the
growth media (Nakhara et al. 1992). This study also revealed that lower
concentration of Fe2+ and Zn2+ ions increased lipid production from 30 to 36%
in M. rouxii CFR-G15. The probable reason may be due to low activity of
enzyme concentration caused implicating in lipogenesis. Metal ions are known
to have important role as co-factors for enzyme activities like Malic enzyme,
ATP citrate lyase and fatty acid synthase. These three enzymes play major key
role in the lipid production since malic enzyme plays a role in NADPH source
for fatty acid synthase when ATP citrate lyase accumulate acetyl CoA as a
precursors to the fatty acid biosynthesis (Evans & Ratledge 1985). Similar
observation was made by Muhid et al. (2008) when Mg was added to the
culture medium it showed an increased percentage of lipid in Cunninghamella
sp.2A1, it had influence the ATP citrate lyase and Malic enzyme, thus inturn
influence the Acetyl CoA and NADPH formation lipogenesis (Muhid et al.
2008; Wynn et al. 1999; 2001) and also in Mortierella alpine CBS (Hansoon
& Dostalek 1988). Shasi et al. (1989) also observed that, ATP citrate lyase
dependent on Mg2+ for lipogenesis activity in oleaginous yeast like
Rhodotorula gracili. Metal ions like Mg2+, Mn2+ and other bivalent ion have
also found to be an important co factor for malic enzyme activity (Totani et al.
2000). Higashiyana et al (1998) reported that influence of addition of minerals,
such as Na2+, K2+, Ca2+, and Mg2+ on AA production by Mortierella alpine IS-
4. He observed that 1.5% soy flour medium with the addition of 0.3% KH2PO4,
0.1% Na2SO4, 0.05% CaCl2 and 0.05% MgCl2 enhanced the AA yield 1.7 fold
over that of unsupplementation (without any minerals) medium. He also
observed that variations in the morphology of the oraganism, when minerals
were added to media. The morphology of the fungus was filamentous when
KH2PO4 supplemented to the media. Where as the morphology of fungus was
PDF created with pdfFactory Pro trial version www.pdffactory.com
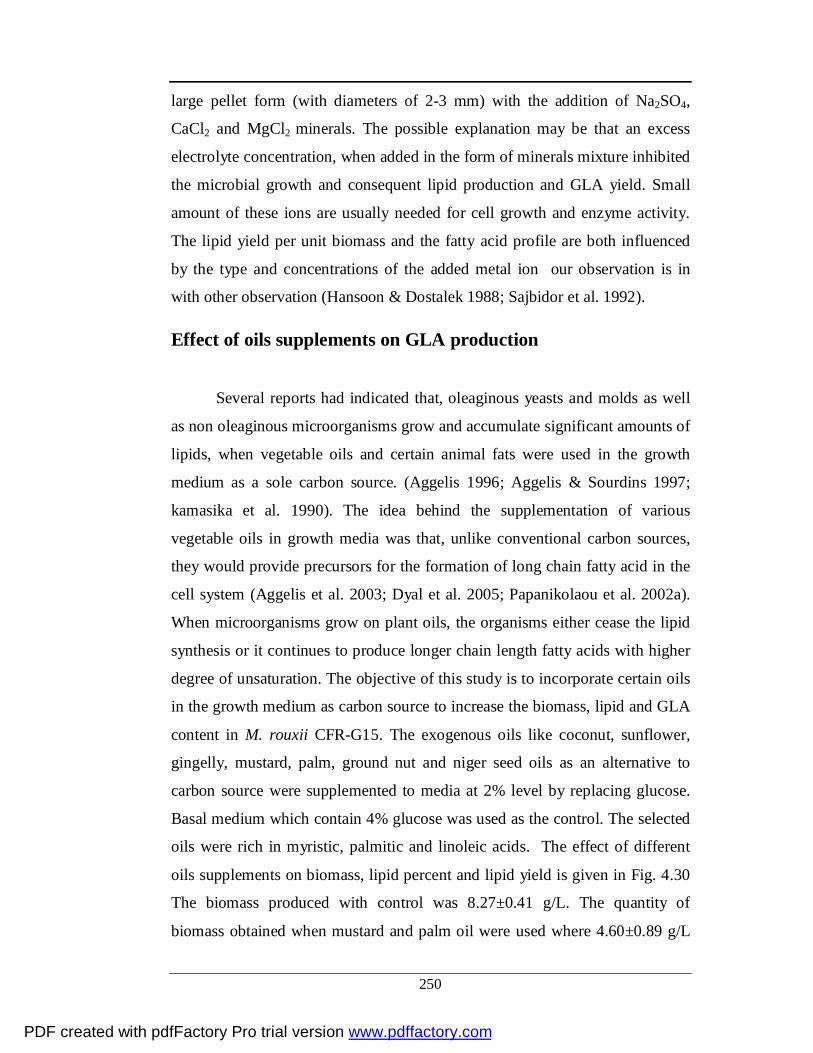
250
large pellet form (with diameters of 2-3 mm) with the addition of Na2SO4,
CaCl2 and MgCl2 minerals. The possible explanation may be that an excess
electrolyte concentration, when added in the form of minerals mixture inhibited
the microbial growth and consequent lipid production and GLA yield. Small
amount of these ions are usually needed for cell growth and enzyme activity.
The lipid yield per unit biomass and the fatty acid profile are both influenced
by the type and concentrations of the added metal ion our observation is in
with other observation (Hansoon & Dostalek 1988; Sajbidor et al. 1992).
Effect of oils supplements on GLA production
Several reports had indicated that, oleaginous yeasts and molds as well
as non oleaginous microorganisms grow and accumulate significant amounts of
lipids, when vegetable oils and certain animal fats were used in the growth
medium as a sole carbon source. (Aggelis 1996; Aggelis & Sourdins 1997;
kamasika et al. 1990). The idea behind the supplementation of various
vegetable oils in growth media was that, unlike conventional carbon sources,
they would provide precursors for the formation of long chain fatty acid in the
cell system (Aggelis et al. 2003; Dyal et al. 2005; Papanikolaou et al. 2002a).
When microorganisms grow on plant oils, the organisms either cease the lipid
synthesis or it continues to produce longer chain length fatty acids with higher
degree of unsaturation. The objective of this study is to incorporate certain oils
in the growth medium as carbon source to increase the biomass, lipid and GLA
content in M. rouxii CFR-G15. The exogenous oils like coconut, sunflower,
gingelly, mustard, palm, ground nut and niger seed oils as an alternative to
carbon source were supplemented to media at 2% level by replacing glucose.
Basal medium which contain 4% glucose was used as the control. The selected
oils were rich in myristic, palmitic and linoleic acids. The effect of different
oils supplements on biomass, lipid percent and lipid yield is given in Fig. 4.30
The biomass produced with control was 8.27±0.41 g/L. The quantity of
biomass obtained when mustard and palm oil were used where 4.60±0.89 g/L
PDF created with pdfFactory Pro trial version www.pdffactory.com

251
and 6.27±0.71 g/L respectively. All the other oils produced higher biomass
than the control. The production of biomass when different oils were
supplemented as follows: gingelly 10.44±0.72 g/L, Sunflower 12.13±0.63 g/L,
niger seed 12.49±0.69 g/L, coconut 14.20±0.87 and ground nut 16.01±0.74
g/L. All these oils were capable of generating higher biomass production by the
organism M. rouxii CFR-G15 when compared to control.
The lipid percent produced by the M. rouxii CFR-G15 in basal medium
was 30.67±1.53%. The lipid production was higher in mustard and sunflower
oil and were 41.53±1.15% and 43.79±1.57% respectively. These two values
were not different. Lower lipid production was shown when other oils were
supplemented studied they were coconut (14.47±1.53%), palm oil
15.91±1.31% gingelly oil 21.74± 1.22%, groundnut oil 22. 53±1.00 and niger
seed oil 27.73±1.31. Total lipid yield (g/L) accumulated was 2.54±0.23 in the
control. M. rouxii CFR-G15 grown in niger seed oil, ground nut oil and
sunflower oil had yielded higher lipid values, they were 3.41 ±0.26, 3.60±0.19
and 5.32±0.65 g/L respectively. Palm oil and mustard oil containing media
could generate only 0.99±0.09 g/L and 1.90±0.31 g/L respectively.
05
101520253035404550
1 2 3 4 5 6 7 8Different oils
DB
(g/L
) & L
ipid
con
ten
(%)
0
1
2
3
4
5
6
7Li
pid
yiel
d (g
/L)
DB (g/L)TLC (%)Lipid (g/L)
Fig. 4.30 Effect of Different plant oils on biomass, and lipid production in M. rouxii CFR-G15.
Data are expressed as mean ±SD of three replicates.
DB: Dry Biomass (g/L); TLC: Total lipid content (%).
1. Glucose 2. Coconut oil 3. Palm oil 4. Sunflower oil 5. Niger seed oil
6. Groundnut oil 7. Mustard oil 8. Gingelly oil
PDF created with pdfFactory Pro trial version www.pdffactory.com

252
The lipid percent produced by the M. rouxii CFR-G15 in basal medium
was 30.67±1.53%. The lipid production was higher in mustard and sunflower
oil and was 41.53±1.15% and 43.79±1.57% respectively. These two values
were not different. Lower lipid production shown by the other oils studied they
were coconut (14.47±1.53%), palm oil 15.91±1.31% gingelly oil 21.74±
1.22%, groundnut oil 22. 53±1.00 and niger seed oil 27.73±1.31. Total lipid
yield (g/L) accumulated was 2.54±0.23 in the control. M. rouxii CFR-G15
grown in niger seed oil, ground nut oil and sunflower oil had yielded higher
lipid values, they were 3.41 ±0.26, 3.60±0.19 and 5.32±0.65 g/L respectively.
Palm oil and mustard oil containing media could generate only 0.99±0.09 g/L
and 1.90±0.31 g/L respectively.
Fatty acid profile of the M. rouxii CFR-G15 grown in media with
supplementation of different plant oil is shown in Table 4.14. GLA content of
14.42±1.16% was observed in control medium. Medium with niger seed oil
resulted in lipid accumulation with higher GLA content of 16.30±1.19%.
Ground nut oil and mustard oil promoted lipid accumulation of 14.90±1.03 %
and 13.30±1.12 % which were similar to that observed in the control. Palm oil,
coconut oil, gingelly oil and sunflower oil promoted lipid accumulation with a
GLA content of 5.94±0.58, 6.46±0.79, 9.97±0.58 and 12.40±1.04%
respectively. LA content was found to be more in most of the plant oils and it
made a precursor for formation of fatty acids (GLA). In our results, we could
also find that the GLA was very less when medium was supplemented with
palm oil and coconut oil as there was little LA content in these oils, this may be
due to poor incorporation of saturated fatty acids into mycelium to be
converted to LA and GLA (PUFAs). It is confirmed through our experiment
that LA is the precursor for the formation of PUFAs in oleaginous
microorganisms.
PDF created with pdfFactory Pro trial version www.pdffactory.com

253
Table 4.14 Effect of different Plant oils on fatty acid profile of M. rouxii CFR-G15
All parameters are expressed as Mean ± SD values in the same column with different letters are significant different at p< 0.05 according to Duncan’s multiple range tests. DBI- Double bond index.
Fatty acid composition (as % of total fatty acids ) Different
Plant Oils 14:0 16:0 16:1 18:0 18:1 18:2 18:3 DBI
Glucose 1.5±0.14 20.6±2.15 3.4±0.01 8.4±0.98 37.4±1.85 13.5.±1.10 14.42±1.16cd 1.11±0.9c
Coconut 8.09±0.13 32.4±2.67 1.6±0.0.34 8.16±0.96 28.54±1.56 13±1.07 5.94±0.58a 0.76±0.09a
Palm 5.14±0.15 39.6±2.56 2.2±0.03 12.2±1.04 26.8±1.98 6±1.36 6.46±0.79a 0.80±0.08a
Sunflower 1.55±0.143 18.5±1.43 2.6±0.68 7.67±1.23 35.67±2.13 18.00±1.31 12.30±1.12c 1.04±0.11b
Niger 2.5±0.13 12.2±1.01 2.6±0.42 4.95±1.02 29.30±1.90 31±2.18 16.30±1.19d 1.12±0.19cd
Ground nut 4.35±0.19 20.6±2.16 1.2±0.23 12.9±1.67 28.77±1.78 16.3±0.98 14.90±1.03cd 1.03±0.09bc
Mustard 1.37±0.0.12 18.6±1.04 4.9±0.85 5.96±0.98 24.47±1.45 32.05±2.29 13.30±1.12c 0.9±0.09b
Gingelly 3.26.37±0.14 19.94±1.23 2.8±0.71 8.26±1.03 23.47±1.25 27±1.78 9.97±0.58b 1.19±0.12d
PDF created with pdfFactory Pro trial version www.pdffactory.com
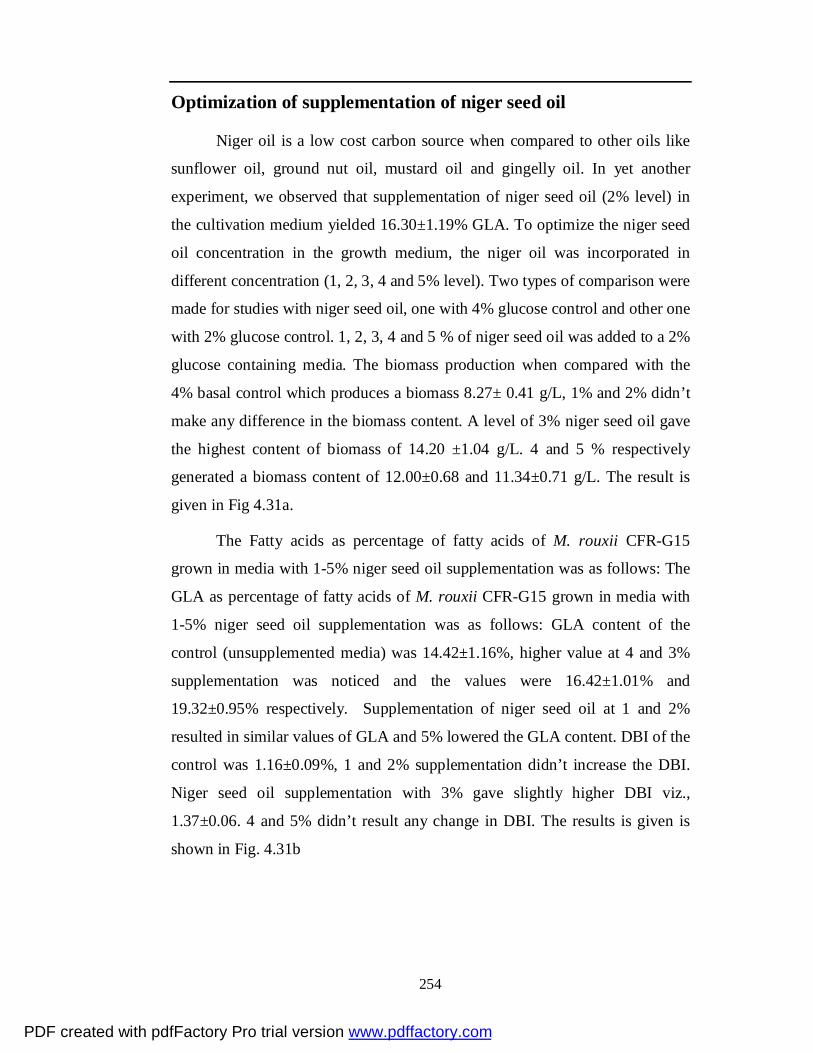
254
Optimization of supplementation of niger seed oil
Niger oil is a low cost carbon source when compared to other oils like
sunflower oil, ground nut oil, mustard oil and gingelly oil. In yet another
experiment, we observed that supplementation of niger seed oil (2% level) in
the cultivation medium yielded 16.30±1.19% GLA. To optimize the niger seed
oil concentration in the growth medium, the niger oil was incorporated in
different concentration (1, 2, 3, 4 and 5% level). Two types of comparison were
made for studies with niger seed oil, one with 4% glucose control and other one
with 2% glucose control. 1, 2, 3, 4 and 5 % of niger seed oil was added to a 2%
glucose containing media. The biomass production when compared with the
4% basal control which produces a biomass 8.27± 0.41 g/L, 1% and 2% didn’t
make any difference in the biomass content. A level of 3% niger seed oil gave
the highest content of biomass of 14.20 ±1.04 g/L. 4 and 5 % respectively
generated a biomass content of 12.00±0.68 and 11.34±0.71 g/L. The result is
given in Fig 4.31a.
The Fatty acids as percentage of fatty acids of M. rouxii CFR-G15
grown in media with 1-5% niger seed oil supplementation was as follows: The
GLA as percentage of fatty acids of M. rouxii CFR-G15 grown in media with
1-5% niger seed oil supplementation was as follows: GLA content of the
control (unsupplemented media) was 14.42±1.16%, higher value at 4 and 3%
supplementation was noticed and the values were 16.42±1.01% and
19.32±0.95% respectively. Supplementation of niger seed oil at 1 and 2%
resulted in similar values of GLA and 5% lowered the GLA content. DBI of the
control was 1.16±0.09%, 1 and 2% supplementation didn’t increase the DBI.
Niger seed oil supplementation with 3% gave slightly higher DBI viz.,
1.37±0.06. 4 and 5% didn’t result any change in DBI. The results is given is
shown in Fig. 4.31b
PDF created with pdfFactory Pro trial version www.pdffactory.com

255
0
5
10
15
20
25
30
35
40
45
1 2 3 4 5
Different conc. of niger seed oil (%)
DB (g
/L) &
Lip
id c
onte
nt (%
)
DB (g/L)TLC (%)Lipid (g/L)
Fig. 4.31a Effect of different concentration of niger seed oil on biomass and lipid production in M. rouxii CFR-G15
Data are expressed as mean ±SD of three replicates. DB: Dry Biomass (g/L);TLC: Total lipid content (%).
0
5
10
15
20
25
30
35
40
1 2 3 4 5Different Conc. of Niger seed oil
Fatty
aci
d pr
ofile
(%)
C14:0
C16:0
C16:1
C18:0
C18:1
C18:2
C18:3
DBI
Fig. 4.31b Effect of different concentration of niger seed oil on fatty acid composition of M. rouxii CFR-G15.
Data are expressed as mean ±SD of three replicates. Fatty acids are expressed as relative percentage of total fatty acids, DBI- Double bond index.
Comparison of the same experimental results with 2% basal medium
(Control) showed the following result. Addition of niger seed oil at all the
levels used, resulted in the increase of biomass. The control showed the dry
biomass of 6.72± 0.37 g/L. there is no difference in the 1 and 2% level of
addition. There is an increase to 14.20±1.04 g/L at 3% addition. At 4 and 5%
addition the values were 12.00±0.68 and 11.34±0.71 g/L respectively. The
biomass content doubled at 3% level supplementation M. rouxii CFR-15. The
lipid content at 2% control was 24.93±0.58%. At 3 % level the lipid content
PDF created with pdfFactory Pro trial version www.pdffactory.com

256
was 38.80±1.10 %, at 5% level there was a lowering in the lipid content. At
level 2 % niger seed oil supplementation it was 22.34±1.15 %. The lipid yield
at 2% control was 1.67±0.10 g/L. Addition of niger seed oil at 1, 2, and 5%
were not different but slightly higher values than the control. At 3 % level a
lipid yield of 5.51 ±0.51 g/L was noticed. At 4% it was 3.42±0.31 g/L. The
GLA content of the 2% control was 11.24±0.63%. There is an increase in GLA
content with 1, 2, 3, and 4% but the higher mean values at 5% level it was
similar to control. At 3%, supplementation gave GLA content of 19.32±0.96%.
The DBI of 2% control was 1.01±0.04. At 3% supplementation level an
increase in DBI to 1.37±0.06 was noticed.
Similar results observed in M. hiemalis HA-30, when free fatty acids
like different PUFAs were supplemented in the medium showed more
absorption of unsaturated fatty acid in TG compared to the saturated fatty acids
(Aoki et al. 1999). The results obtained in this study are also similar to the
experiments by Aggelis et al. (1995) in M. cercinelloides CBS 172-27. Certain
fatty acids in plant oils could be selectively absorbed in the cellular lipid where
as other fatty acids were used for beta oxidation degradation to provide energy
and intermediate cell metabolism (Aggilis 1997; Auki et al. 1999; Dyal and
Narine 2005). The incorporated fatty acids will either assimilated for growth
or become a substrate for endo-cellular biotransformation (Papanikolaou et al.
2001; 2002a). The phenomenon of controlling the fatty acid composition was
specific process of substrate and the endo-cellular changes of fatty acid by the
enzymatic capabilities of the microorganisms (Papanikolaou et al. 2001). In
bacteria like Vibrio sp., E. coli, Bacillus fatty acids were mainly accumulated in
the phospholipids (Ando et al. 1992; Patnayak & Sree 2005) but in fungi such
as M. remanniana var. angulispora, M. alpina IS-4 and M.cercinalloides
exogenous fatty acid accumulated in triacylglycerol (Aggelis & Sourdins 1997;
Kamishaka et al. 1990; Shinmen et al. 1992). Mutants or by genetic
manipulation could be the between choice for carrying out biotransformation of
PUFAs from plant sources into higher value oils (Certik et al. 1998; Wang et
al. 2009).
PDF created with pdfFactory Pro trial version www.pdffactory.com

257
OPTIMIZATION OF MEDIUM COMPONENTS THROUGH RESPONSE SURFACE METHODOLOGY (RSM)
Microbial production of lipids that contains unusual fatty acids with
potential commercial application has been aimed at organisms selection and
optimization. In commercial production of GLA by fermentation, optimization
of media components are carried out for biomass and product maximization.
Optimization is directly proportional to the effect of nutrients of cost effective
substrate and also factors like pH, temperature, aeration or agitation on the
yield of products (Ahmed et al. 2006; Hansoon & Dostalek 1988; Kendrick &
Ratledge 1996). The conventional method of optimization involves varying one
parameter at a time and keeping the others constant, but this method does not
give the interaction of various parameters as compared to factorial design. To
overcome these problems, Response Surface Methodology (RSM) technique
was employed to study the effect of several factors influencing the responses
by altering the multiple variables simultaneously and carrying out a limited
number of experiments (Ravi & Susheelamma 2005). RSM is a group of
empirical techniques devoted to the evaluation of relations existing between a
cluster of controlled experimental factors and the measured responses. This
technique was used in the various areas to optimize the conditions such as
enhanced of lipid production and enzyme optimization (Linder et al. 2005),
cultural medium optimization (Chang et al. 2006), biosurfactants in probiotics
(Rodrigues et al. 2006) and other fields. The optimization of the medium in any
fermentation process plays a fundamental role in preventing metabolic
deviation that directly affects the yield. RSM is the common approach to the
optimization of growth medium. In this study we aimed to design an optimal
medium for an efficient GLA production using RSM. Variables consisting of
glucose as the main carbon and the energy source, yeast extract and ammonium
nitrate as nitrogen sources were selected for optimizing proportion for
maximum GLA accumulation. This experiment was conducted based on the
optimization of carbon and nitrogen sources previously explained.
PDF created with pdfFactory Pro trial version www.pdffactory.com

258
Result indicated that glucose, yeast extract and ammonium nitrate were
the major sources of nutrients for the enhancement of GLA. The optimizations
of above parameters were already carried out in one at factor method. The data
obtained were subjected to regression analysis by applying the RSM. The
coefficients of the regression equation were calculated using the Statistica
software and the results are given in Table 4.15. The GLA production is
expressed in terms of the following regression equation.
Regression equation
“GLA = 5.134+0.367x1 - 0.003*x12 + 0.036*x2 + 0.046*x2
2 - 14.236*x3 + 41.056*x32 +
0.008*x1*x2 - 0.011*x1*x3 - 1.421*x2*x3 ”
Where X1, X2 and X3 were the glucose, yeast extract and ammonium
nitrate respectively. The results of the second order response surface model
fitting in the form of analysis of variance (ANOVA) are given in Table. 4. A
good fit of the regression model was checked by the coefficient of
determination (R2), correlation coefficient (R) values and total regression F
test. The R2 value was 0.852 indicates 85% of the variance could be explained
by this model successfully. The ANOVA results [Table 4.16] indicated that the
independent variable glucose is influencing the GLA production significantly
(P<0.05).
Response surface plots The 3D response surface curves were then generated to explain the
interaction of variables and the optimum levels of each variable required for the
maximum production of GLA. Response surface plots as a function of two
factors varied at a time by maintaining all other factors at fixed level (zero
level, for instance), which was helpful in understanding both the main and
interaction effects of these two factors. These plots were easily obtained by
calculating from the model values taken by one factor where the second varies
with constraint of a given Y value. The yield values for different concentrations
of the variables were also predicted from the respective response surface plots
PDF created with pdfFactory Pro trial version www.pdffactory.com

259
[Fig 4.32a, b, c]. The maximum predicted yield was indicated by the surface
confined in the response surface diagram.
Table 4.15 Model coefficients estimated by multiples linear regression
Factor Regression
Co -efficient Std. Error t(10) p Mean/Interc. 5.134 4.127 1.244 0.2418
Glucose (X1) 0.367 0.079 4.626 0.0009 Glucose (X1
* X1) -0.003 0.001 -5.418 0.0002 Yeast extract (X2) 0.036 1.586 0.023 0.9823 Yeast extract (X2
* X2) 0.046 0.225 0.206 0.8413 Ammonium nitrate (X3) -14.262 15.817 -0.902 0.3884
Ammonium nitrate (X3* X3) 41.056 22.466 1.827 0.0975
X1*X2 0.008 0.015 0.523 0.6122 X1*X3 -0.011 0.150 -0.071 0.9447 X2*X3 -1.421 2.993 -0.475 0.6452
Table 4.16 ANOVA of the variables
SS df MS F p Glucose (x1) 75.31 1.00 75.31 20.94 0.00 Glucose (x1*x1) 104.78 1.00 104.78 29.14 0.00 Yeast extract (x2) 2.86 1.00 2.86 0.80 0.39 Yeast extract (x2*x2) 0.15 1.00 0.15 0.04 0.84 Ammonium nitrate (x3) 1.46 1.00 1.46 0.41 0.54 Ammonium nitrate (x3*x3) 11.79 1.00 11.79 3.28 0.10 x1*x2 0.98 1.00 0.98 0.27 0.61 x1*x3 0.02 1.00 0.02 0.01 0.94 x2*x3 0.81 1.00 0.81 0.22 0.65 Error 35.96 10.00 3.60 Total SS 243.21 19.00
R2=0.8521; Adj: 0.7190
Fig. 4.32a, shows the response surface plot obtained as a function of
glucose concentration vs. yeast extract concentration, while third variable
ammonium nitrate was maintained at zero level (coded). An increase in GLA
PDF created with pdfFactory Pro trial version www.pdffactory.com

260
yield with increase concentration of glucose versus yeast extract was observed.
Among the two independent variables glucose plays a major role in the
production of GLA. Its level is very critical as evidenced from the 3D surface
graph. The optimum value was near the centre point of glucose level and the
interaction of glucose and yeast extract did not result in any further beneficial
effect on the system.
Fig. 4.32b, shows the response surface plot obtained as a function of
concentration of glucose vs. ammonium nitrate, while the third variable yeast
extract was kept at its mid level. An increased GLA with increase
concentration of glucose vs. ammonium nitrate were also observed. As
indicated in Fig. 4.32a, the same trend was observed here also. The role of
glucose was very critical and significant when compared with ammonium
nitrate. The interaction effect of both independent variables resulted in decrease
in the production of GLA after the mid level.
Fig. 4.32c, shows the effect of concentration of yeast extract vs.
ammonium nitrate, while the third variable glucose was maintained at zero
level. Increase in GLA yield with increased concentration of yeast extract was
observed. From the response surface it is clear that the increase in
concentration of ammonium nitrate decreases the GLA content and yeast
extract increases the GLA production. But the extent of decrease of ammonium
nitrate or increase of yeast extract is only marginal for GLA increase in the
total lipid of the mycelium.
PDF created with pdfFactory Pro trial version www.pdffactory.com

261
Fig. 4.32 a. Effect of glucose and yeast extract concentration on the production
of GLA by M.rouxii CFR-G15. Other variable was held at zero level (coded)
b. Effect of glucose and ammonium nitrate concentration on the production of GLA by M. rouxii CFR-G15. Other variable was held at zero level (coded);
c. Effect of yeast extract and ammonium nitrate concentration on the production of GLA by M. rouxii CFR-G15. Other variable was held at zero level coded)
PDF created with pdfFactory Pro trial version www.pdffactory.com
262
Canonical analysis
The signs of the roots, the independent variables (Eigen values)
indicated the nature of the response surface. The calculated roots of the
variables had mixed signs, meaning that the response function is a saddle point
or mini-max response. Verification experiment was accomplished by using the
optimized conditions and obtained 18.55 % GLA of total fatty acids [Table 4.
17]. This result therefore corroborated the predicted values and the
effectiveness of the model. A 4.77 % increase in production of GLA was
achieved when compared to that of basal medium. The results of the conditions
for maximizing the GLA production within the experimental region were
predicted and given as Table 4. 18. The maximum production of GLA (18.55
%) could be obtained when the levels of independent variables glucose, yeast
extract and ammonium nitrate were at 65.0 (g/L), 3.5 (g/L) and 0.5 (g/L),
respectively. The results were validated by doing the experiments with the
predicted levels by the model. The results indicated that the predicted and
observed values for GLA did not differ significantly (P<0.05). This indicated
that the optimized medium components favoured the production of GLA in the
mycelium.
Table 4.17 Optimized values - Estimated
Optimized Values
Independent Variables Dependent Variables
Predicted Value
Actual value
Glucose (g/L) 65.00
Biomass (g/L) 12.620 10.67±0.22
Yeast extract (g/L) 3.50 Lipid (g/g) 0.399 0.35±0.81
Ammonium nitrate
(g/L)
0.50 GLA (% of total
fatty acids)
18.90
18.55±0.46
PDF created with pdfFactory Pro trial version www.pdffactory.com

263
Optimization experiments are designed to provide in depth information
on a few variables identified during fatty acid enhancement. In this study, the
nutritional medium components for maximum GLA production from an
oleaginous fungus M.rouxii CFR-G15 were optimized by the method of CCRD
and RSM. It was observed that, biomass and GLA production were
predominantly influenced by carbon and nitrogen concentrations. They also
played key nutrient materials, which controlled the biosynthesis of the lipid
production in the mycelium (Hansson & Dostalek 1988). Similar observations
were also made by Chang et al. (2006), Lin et al 2007 on the production of
biomass and triterpenoid and alkaline B-mannanase respectively. In this
experiment, low concentration of nutrients had caused low production of GLA.
At higher concentrations, both nutrients caused inhibition of lipid and PUFAs
formation especially GLA synthesis. Similar observations were also made by
Certik & Shimizu (1999) and Kendrick & Ratledge (1992). The optimal
calculated values of tested variables for maximum production of GLA were
glucose (65.0 g/L), yeast extract (3.5 g/L) and ammonium nitrate (0.5 g/L) with
a predicted percentage of GLA 19.97%. These predicted optimal parameters
were tested and final GLA obtained was 18.55% of total fatty acids [Table
4.17]. The 3-D response surface curves were plotted to understand the
interaction of medium components and their effect on mycelium growth. In
Fig. 4.32a, the high concentration of yeast extract repressed the growth and
GLA production in M. rouxii CFR-G15 at all levels (+1.685, 0, -1.685).
Variations in concentration of ammonium nitrate didn’t significantly affect the
growth and GLA production [Fig 4.32c]. These results therefore corroborate
the predicted values, and the effectiveness of the model. Yeast extract was used
in all the fermentation studies as supplement, because this contains complex
nutrients such as vitamin, nucleic acid, lipid and other substances which could
be necessary for growth of microbes, but the optimum concentration of yeast
extract was necessary for growth and secondary metabolites production. In our
earlier experiments, we observed that combination of yeast extract and
ammonium nitrate were the significant nitrogen sources for biomass, lipid and
PDF created with pdfFactory Pro trial version www.pdffactory.com

264
GLA production. These observations were also made by Hansson et al. (1989)
and Kendrick & Ratledge (1992). It was also observed in this study that the
main effects of carbon and nitrogen levels as well as the interactions were
highly significant for growth and GLA accumulation. However, controlled fed
batch cultivation and chemostat cultures have so far been used successfully for
improving metabolites production in a number of microorganisms (Hansson et
al. 1989).
The use of a multifactorial statistically approach for determining the
conditions that lead to the optimum yield of secondary metabolites production
(especially the PUFAs production) was the major noteworthy observation in
this study. This observation is very much concurrence with the result of Chang
et al 2006. CCRD maximizes the amount of information that can be obtained,
while considering the interaction of independent variables and limiting the
number of individual experiments required. The response surface methodology,
a smaller and less time consuming experimental design, could generally satisfy
the optimization of many microbial processes (Chang et al. 2006; Linder et al.
2005). The optimum culture medium obtained in this experiment has given a
basis for further study with batch or fed batch cultivation in bioreactor for large
scale production of secondary metabolites i.e. GLA from M. rouxii CFR-G15.
Thus, we conclude this experiment that CCR design with RSM was
found to be useful in determining the conditions leading to the maximum yield
of GLA. The use of an experimental design allowed the rapid screening of a
large experimental domain in search of the best condition and levels for the
GLA production. The R2 value showed a good fit of the model with an
experimental data. With the best of our knowledge, there were no much reports
available on the GLA production by media engineering. Thus our experiment
mainly focused on an attempt to demonstrate the application of statistical
design and RSM to maximize GLA production.
PDF created with pdfFactory Pro trial version www.pdffactory.com

265
SELECTION OF EXTRACTION METHODS WITH SOLVENT SYSTEMS
This research work was aimed on microbial production of lipids that
contain unusual fatty acids. Lipid extraction from biomass is an important step
in the quantification of lipid from microorganisms. Rapid and efficient method
for extraction of lipid forms the basis for the optimization of culture conditions
for lipid production in oleaginous microorganisms. The extract ants may also
have a function in preventing enzymatic hydrolysis (oxidation of fatty acids).
At the same time, attention was given to the potential toxicity of the solvents.
Finally, the extractability of cells or tissues was found to be variable and
depended on both the nature of the cells and of the lipids. This study was
carried out to compare the efficacy of three extraction methods along with
different solvent system for lipid yield and fatty acid composition of M. rouxii
CFR-G15.
In most of the oleaginous microorganisms, lipids are present in cell
membranes and in the cytosol also. Since the lipid contains heterogeneous
compounds with different structures and properties, quantity of lipid produced
in the cells depends on the extraction method having different concentration of
solvents in oleaginous microorganisms. Hence, different methods were chosen
for lipid extraction such as Folch method, Bligh and Dyer method and soxhelt
method. The data obtained in this study i.e. lipid content extracted using
various solvent system is shown in Fig. 33a, b, and C.
Results indicated that among the three methods used viz., Folch, Bligh
& Dyer and soxhlet apparatus methods with five different solvent system they
were: chloroform: methanol (2:1), chloroform: methanol (1:1), hexane:
isopropanol (3:2), hexane: isopropanol (4:1) and hexane: petroleum ether (2:1).
The highest extraction gave a lipid content of 39.00±1.34 % in folch method
when chloroform: methanol used in 2:1 ratio. Hexane and sopranos (3:2) gave
similar to that (38±1.18 %) and chloroform and methanol (1:1) gave slightly
lower extraction of total lipid content 35±1.21%. The GLA content of the lipid
PDF created with pdfFactory Pro trial version www.pdffactory.com

266
was also in the same order viz., 13.80±1.11%, 13.03±0.61% and 11.34±0.64 %
respectively.
Maintaining the folch method as control chloroform:methanol (2:1) as a
comparison the extractability by bligh and dyer method was assessed in M.
rouxii CFR-G15. The lipid content extracted by any of the solvent used in the
bligh and dyer method was lower than that of folch control. Chloroform and
methanol in the ratio of 2:1 and 1:1 gave lipid content extraction of 35.02± 1.21
and 34.21±1.01% respectively. These values were not different and were
higher than the other systems used in this method. The GLA obtained by this
extraction method using chloroform: methanol in the ratio of 2:1 and 1:1 were
12.87±0.92 % and 11.82±0.72%. The GLA content in the lipid extracted using
chloroform: methanol (2:1) by this system was similar to that of folch control.
Soxhlet apparatus method extracted was slightly lower than the folch
control. The highest extraction obtained when chloroform: methanol (2:1) was
used viz., 36.73±1.09%. GLA content of the lipid extracted by soxhlet method
was highest with chloroform: methanol (2:1) in the solvent system i.e.
14.47±0.66%. It was similar to that of control. Chloroform: methanol in the
ratio 1:1 also gave values comparable to control viz., 12.70±1.12% in M. rouxii
CFR-G15.
The results obtained in this study also supported by Certik et al (1996)
and Somashekar et al (2001). Since solvent system contained polar and non -
polar solvents. Chloroform: methanol (2:1) showed efficacy of extraction of
lipid yield very high from this. The ideal solvent system for extracting lipids
from cells should be sufficiently polar to extract bound lipids from cell
membranes. At the same time, the solvent should not be so polar since the non
polar lipids do not dissolve but should not react chemically with these lipids.
Generally, non-polar solvents are usually needed for lipid extraction their
combinations with polar solvents are advantageous, mainly because of
dehydration, protein denaturation and degradation of hydrogen bonds between
PDF created with pdfFactory Pro trial version www.pdffactory.com

267
the complex lipid and proteins. The combination of polar and non polar
solvents is thus advantageous for the extraction of lipid from microorganisms.
When compare to all the methods used in this study, soxhlet method was
advantageous over the other two methods since the separation of the cell debris
and lipid didn’t arise. Unlike other two methods in which the cells were ground
with the sand along with solvent system, which causes the cells to lyse and
release oil, while in soxhlet extraction the cell to solvent contact was very less.
The oil extraction from soxhlet method can be used for various applications in
industries as the solvent is considered to be safe (Somashekar et al. 2001).
Various literatures have reported that the members of zygomycetes produce 10-
20% of GLA under different cultural conditions and observed maximum GLA
production when chloroform: methanol was used as solvent system
(Emelyanova 1997, Weete et al 1998, Certik and Shimizu 1999).
This study suggest that the chloroform: methanol was found to be the best
solvent system in soxhlet method for the extraction of lipid both bound fatty
acids and free fatty acids. As the fungal cell wall is tough, there was a need of
maceration or disruption of cell wall by acid or alkali hydrolysis before
extraction of lipid from biomass in soxhlet method. Thus there is a lot of scope
to improve the rapid and reliable extraction methods and better recovery of
intracellular lipid (purification) from biomass for further development of
microbial lipid biotechnology.
PDF created with pdfFactory Pro trial version www.pdffactory.com

268
a b
c
(A)
(B)
(C)
Fig. 33. Selection of extraction methods with solvent systems A. Folch method; B. Bligh and dyer Method; C. Soxhlet method
PDF created with pdfFactory Pro trial version www.pdffactory.com

269
SECTION 4
GENETIC STUDIES ON M.ROUXII CFR-G15 WITH SPECIAL EMPHASIS ON GLA PRODUCTION
MUTATION
Strain improvement is considered as one of the major factors involved in
the achievement of higher titres of industrial metabolites (Certik et al. 1998;
Peberdy 1980). On the other hand, strain improvement has been achieved
through mutation, selection, or genetic recombination. In many cases,
mutations are harmful, but occasionally may lead to a better adapted organism
to its environment with improved biocatalytic performance. Mutagenesis in
microorganisms is an important property conferred by DNA, since it creates
new variations in the gene pool. The challenge is to isolate those strains which
are true mutants that carry beneficial characters (Parekh et al. 2000; Wang et al.
2009). Random mutagenesis and fermentation have been reported as an
effective way to improve the productivity of industrial microbial cultures
(Parekh et al. 2000; Wang et al. 2009). The most commonly used mutagens are
ethylmethane sulfonate (EMS), N-methyl-N’-nitro-N-nitrosoguanidine (NTG),
methyl methane sulphonate (MMS) and ultraviolet (UV) irradiation (S).
The objective of this study has been to introduce auxotrophic marker in
M. rouxii CFR-G15, which could be used for marker for hybrids selection
derived from protoplast fusion. UV radiation (physical), chemical mutagens
like EMS and NTG were used to mutagenise the culture. The variants obtained
were also examined for modification in fat content and fatty acid profile from
the biomass and screening of high GLA producing hybrids of M. rouxii CFR-
G15 was also performed in this study.
PDF created with pdfFactory Pro trial version www.pdffactory.com

270
i. UV-radiation
UV radiation is a common mutagen used to induce mutations for strain
improvement. UV at 254 nm wavelength is absorbed by DNA and cause
damage in cell level and is therefore mutagenic. The pyrimidines (thymine and
cytosine) are especially sensitive to modifications by UV rays absorption. This
may result in the production of thymine dimers that alter the DNA helix and
block future replications; this causes permanent mutation (Lenhinger 1993).
This method is commonly applied in the field of microbiology for improving
biotechnologically important microbial strains in large scale product
development.
In the present work, mutants of M. rouxii CFR-G15 were developed by
exposing the young spores to UV irradiation at different time intervals. The
killing pattern of this culture under UV is shown in Fig. 4.34. Dose dependent
inactivation of the culture was also observed in this study. The results indicated
that with 10 mins exposure, the killing rate was 9.56 %, 50 min 80.27% and
with 1 h 97.5% were observed. It was noticed that the killing rate increased
with the increase in the exposure time and an inhibitory effect on growth was
observed in mutant screening medium.
0
20
40
60
80
100
120
0 10 20 30 40 50 60Exposure time (min)
Kill
ing
(%)
killing %
Fig. 4.34 Effect of UV on M. rouxii CFR-G15
PDF created with pdfFactory Pro trial version www.pdffactory.com

271
ii. Treatment with EMS
In this experiment, the culture was treated with different concentrations
of EMS ranging from 2-10mM for 1 h. Killing pattern with different
concentration of EMS on this culture is shown in Fig 4. 35. The results
indicated that, 10mM concentration of EMS was found to be optimum in
giving 65% killing rate. A lower killing rate of 32% was noticed when treated
with 2 mM concentration. The survival rate decreased with the increase in
concentration of EMS. Unlike UV, results obtained by EMS treatment of M.
rouxii CFR-G15, the killing rate was found to be less than 65%.
EMS, an alkylating agent and highly mutagenic in lower organisms but
only moderately carcinogenic in mice and rats. The main effect of EMS on
DNA in vitro and in vivo without activation by cellular components is
alkylation. However, the main product, 7- alkylguanine is not necessarily the
major cause of mutagenesis and the major mutagenic effects of EMS must be
examined by biological means. The use of EMS as mutagen produces almost
all kinds of genetic effects in all the organisms tested (Gunashree 2006). EMS
is not hazards to human and till now no reports on epidemiological studies are
known.
Killing %
0
10
20
30
40
50
60
70
80
90
0 5 10 15 20 25
Conc. of NTG (mg/ml)
Killi
ng r
ate
Killing %
Fig. 4.35 Effect of EMS on M. rouxii CFR-G15
PDF created with pdfFactory Pro trial version www.pdffactory.com

272
Treatment with NTG
In NTG treatment, a maximum killing rate of 80% was observed when
the spores were subjected to 25µg/ml which was higher than the reported value.
A killing rate of 100% was observed when the concentration of NTG increased
more than 25µg/ml. The data obtained in this study revealed that minimal
killing rate could be observed when spores were treated with 5µgml-1 of NTG.
Unlike in EMS, results obtained through NTG treatment, the killing rate was
found to be more. The results are indicated in Fig. 4.36.
0
10
20
30
40
50
60
70
80
0 2 4 6 8 10
Conc. of EMS (l/ml)
Kill
ing
rate
Killing %
Fig. 4. 36 Effect of NTG on M. rouxii CFR-G15
NTG reacts with the sulfhydryl groups for conversion of very reactive
carbonium ions or alkyl diazonium ions. This is a widely used laboratory
mutagen and carcinogen known by a number of abbreviations that includes
most commonly MNNG. It has been applied to a wide array of organisms
starting from prokaryotes through mammals and has been clearly demonstrated
to produce a spectrum of genetic alterations in nearly all test systems (Moore
1969).
PDF created with pdfFactory Pro trial version www.pdffactory.com
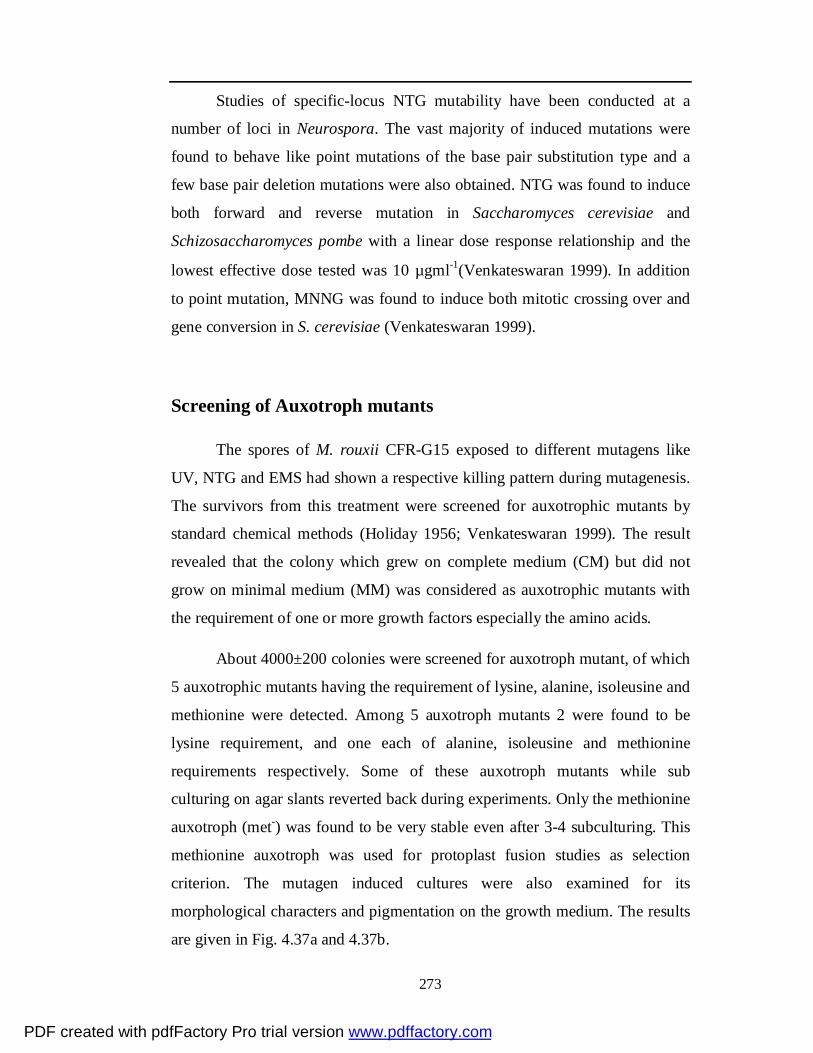
273
Studies of specific-locus NTG mutability have been conducted at a
number of loci in Neurospora. The vast majority of induced mutations were
found to behave like point mutations of the base pair substitution type and a
few base pair deletion mutations were also obtained. NTG was found to induce
both forward and reverse mutation in Saccharomyces cerevisiae and
Schizosaccharomyces pombe with a linear dose response relationship and the
lowest effective dose tested was 10 µgml-1(Venkateswaran 1999). In addition
to point mutation, MNNG was found to induce both mitotic crossing over and
gene conversion in S. cerevisiae (Venkateswaran 1999).
Screening of Auxotroph mutants
The spores of M. rouxii CFR-G15 exposed to different mutagens like
UV, NTG and EMS had shown a respective killing pattern during mutagenesis.
The survivors from this treatment were screened for auxotrophic mutants by
standard chemical methods (Holiday 1956; Venkateswaran 1999). The result
revealed that the colony which grew on complete medium (CM) but did not
grow on minimal medium (MM) was considered as auxotrophic mutants with
the requirement of one or more growth factors especially the amino acids.
About 4000±200 colonies were screened for auxotroph mutant, of which
5 auxotrophic mutants having the requirement of lysine, alanine, isoleusine and
methionine were detected. Among 5 auxotroph mutants 2 were found to be
lysine requirement, and one each of alanine, isoleusine and methionine
requirements respectively. Some of these auxotroph mutants while sub
culturing on agar slants reverted back during experiments. Only the methionine
auxotroph (met-) was found to be very stable even after 3-4 subculturing. This
methionine auxotroph was used for protoplast fusion studies as selection
criterion. The mutagen induced cultures were also examined for its
morphological characters and pigmentation on the growth medium. The results
are given in Fig. 4.37a and 4.37b.
PDF created with pdfFactory Pro trial version www.pdffactory.com

274
(A)
(B) (C) Fig 4.37a Microphotographs showing various colony morphology after
mutagenesis and low temperature selection
A. UV treatment; B. EMS treatment; C. NTG treatment
Fig 4.37b Auxotrophic mutants of M. rouxii CFR-G15 showing colony variation on selective media
PDF created with pdfFactory Pro trial version www.pdffactory.com

275
Screening and selection of low temperature resistant mutants
When M. rouxii CFR-G15 cultivated at low temperature, the GLA
content of the mycelia increased, but the cell growth (biomass formation) and
total lipid production were found to be very low. It is presumed that the
cultures which grow faster at low temperature would also contain more GLA in
their cellular lipid or vise versa. The ability to grow well at low temperature
was considered as an index for cell improvement (Hansoon & Dostalek 1988;
Hiruta et al. 1996).
About 250 mutagenised colonies from complete medium were picked
up, plated out separately and these colonies were grown under low temperature
(at 15 °C) for selection. The results indicated that nearly 30 mutants were
selected on the basis of their fast growth and larger in colony size when
compared to parent culture. The selected mutants were cultivated in
Erlenmeyer flasks containing nitrogen limiting medium (FPM) for 5 days at 28
°C to evaluate the biomass and GLA production. Fatty acid methyl esters of
mutants were prepared by direct transesterification by the method of Rodriguez
et al. (1998) and Lepage & Roy (1984)
Biomass production in parent was 7.98±0.56 g/L. The lowest biomass
content was 4.6±0.32 g/L (M23) and highest biomass production was in 10.6
±0.85 g/L (M27). Among the thirty mutants selected five showed lower
biomass production and five showed higher biomass when compared with the
parent. Rests of the mutants were similar to the parent. The results are
presented in Table 4.18.
GLA content of the parent was 14.42±1.02 %. Mutant no. 26 didn’t
show any GLA content in its lipid. Mutant no. 6 had the lowest GLA value
0.52±0.05% and highest GLA content observed in mutant 21 (18.37±0.83 %).
Among the mutants selected twenty three mutants produced GLA content
lower than the parent and seven were higher [Table 4.18]. The mutants which
had more GLA content did not show any variations in repeated experiments.
PDF created with pdfFactory Pro trial version www.pdffactory.com

276
Thus, this experiment represented that the mutants that could able to
accumulate lipid with high GLA content were successfully obtained by using
low temperature growth as a selection index.
Table 4.18 Biomass and GLA Content of Mutants (selected at lower
temperature, 15°C) of M. rouxii CFR-G15 isolated after mutagen treatment
Mutants Biomass (g/L)
GLA (%)
Parent 7.98±0.45 14.42±1.02 M1 7.35±0.45 15.84±0.45 M2 8.2±0.53 9.28±0.53 M3 7.8±0.42 7.36±0.42 M4 6.2±0.39 10.28±0.39 M5 9.0±0.46 10.24±0.46 M6 8.00±0.51 0.52±0.05 M7 7.6±0.62 5.08±0.27 M8 8.0±0.60 6.87±0.35 M9 6.8±0.38 1.55±0.07
M10 8.6±0.42 15.84±0.42 M11 9.2±0.53 15.65±0.53 M12 10.2±0.72 10.95±0.72 M13 8.4±0.47 16.70±0.78 M14 8.6±0.53 16.70±0.47 M15 9.04±0.76 6.87±0.60 M16 8.86±0.80 3.43±0.21 M17 8.0±0.74 1.7±0.09 M18 7.20±0.68 10.01±0.68 M19 7.60±0.50 11.85±0.96 M20 8.4±0.49 11.20±0.83 M21 8.8±0.53 18.37±0.83 M22 9.21±0.63 7.30±0.32 M23 4.60±0.32 6.68±0.64 M24 9.20±0.64 17.26±0.84 M25 8.40±0.84 1.46±0.08 M26 7.20±0.42 0.00±0.00 M27 10.6±0.85 1.27±0.06 M28 7.7±0.63 0.68±0.03 M29 6.8±0.45 11.46±0.36 M30 5.4±0.36 7.30±0.32
Data are expressed as mean ±SD of three replicates. GLA expressed as relative percentage of total fatty acids,
PDF created with pdfFactory Pro trial version www.pdffactory.com

277
PROTOPLAST FUSION
Protoplasts fusion has always been considered as one of the acceptable
tools in microbial genetics. This technique is considered for the development of
microbial strain by way of nuclear exchanges between two parental strains.
Gene transfers during protoplast fusion and chromosomal aberrations have also
been reported (Venkateswaran 1999). The aim of the study is to isolate the
hybrid with high amount of GLA production in total lipid content in M. rouxii
CFR-G15.
Protoplast formation/isolation
In this experiment, strains of M. rouxii CFR-G15 mycelia with
auxotrophic marker (met-) was subjected to lytic activity with different fungal
lysing enzymes such as Lyticase, Novozyme 234 and Chitinase for 2 to 3h
period with intermittent agitation. The enzymes effectively acted on mycelial
mass and produced spheroplasts and protoplasts. The enzyme reacted with the
cell wall of the mycelial mass became swelled up and round hyaline globules
were formed by the action of these lysing enzymes. The action of these lytic
enzymes on the mycelial mass depended upon the type of lytic activity of the
enzyme, concentration of the enzymes, the incubation period and age of
mycelial mass.
The result of the formation of spheroplasts and protoplasts from the
parental strain is given in Fig. 4.38a&b. Our experiment concluded that
complete digestion of mycelia and the formation/release of protoplast have
occurred in 1 h of the incubation with Novozyme 234 lytic enzyme. Hence, an
optimal enzyme concentration and the incubation period were selected to get
sufficient protoplast/spheroplast from the strain for the fusion purpose.
Three lytic enzymes with various concentration used in this experiment
had different lytic nature during the incubation period (1 h). Among the lytic
enzymes tested 800 µg/ml Novozym 234in an osmotic stabilizer was found to
be optimal for lysis of cell wall and release of protoplast [Table 4.19].
PDF created with pdfFactory Pro trial version www.pdffactory.com

278
Peer and Chete (1990) obtained highest protoplast yield from T.
harzianum using Novozym 234 at 10 mg/ml with 0.6 M KCl, where as Tschen
& Li (1994) used 15 mg/ml of Novozyme 234 with 0.6 M sucrose to obtain
maximum number of protoplast from T. harzianum and T. koningii. The results
obtained by Prabhavathi et al. (2006) maximum protoplasts from T. reesei
obtained when 8 mg/ml lysing enzyme at 0.6 M KCl as osmotic stabilizers.
Hence, the study suggests that, lytic enzyme with various concentration play
vital role in digesting the cell wall of fungal mycelium and also depends upon
the nature of cell wall composition of the particular fungal strain.
Venkateswaran (1999) reported that preparation of protoplasts from various
yeast cells, Novozym 234 enzyme (100 µg/ml) was found to be the most
effective lytic enzyme among the various lytic enzymes tested.
Table 4.19 Influence of different lytic enzymes on the production of
protoplast of M. rouxii CFR-G15
Protoplasts counts / ml Conc. of enzymes µg/ml Novozyme 234 Lysing
Chitinase
100 ND ND ND 200 0.81x10⁵ 1.81x10³ ND 300 1.25x10⁵ 3.25x10³ 1.25x10² 400 2.43x10⁵ 4.43x10³ 2.43x10² 500 3.25x10⁶ 5.25x10³ 3.25x10³ 600 6.45x10⁶ 3.45x10⁴ 4.45x10³ 700 1.94x10⁷ 1.14x10⁵ 1.14x10⁴ 800 2.25x10⁷ 2.25x10⁵ 2.25x10⁴ 900 4.46x10⁶ 3.46x10⁵ 2.46x10⁴
1000 6.25x10⁶ 4.25x10⁵ 3.25x10⁴
The stages of protoplast formation were observed by using different
types of lytic enzymes with different concentration. Swelling and agglutination
of cells were observed initially and subsequently the M. rouxii CFR-G15
mycelium started lysing. Almost complete digestion of mycelia and release of
protoplast occurred prominently after 1h of incubation when 800 µg/ml
Novozyme 234 was used. The protoplasts released soon after the lytic activity
from the mycelial structure were found to be smaller in size and later slowly
PDF created with pdfFactory Pro trial version www.pdffactory.com

279
enlarged to a hyaline spherical structure. It was also observed that the
protoplast yield significantly affected by the concentration of lysing enzymes.
The lysis of fungal mycelium was confirmed when the tip portion of the
mycelia released protoplast at low concentration of enzyme [Fig. 4.38]. On the
other hand, at appropriate concentrations of enzymes, the mycelium become
lysed very effectively yielded large numbers of protoplasts. The high
concentration enzymes totally digested the mycelial structure and did not yield
any protoplast. It is probably due to the imbalance between the concentration
of enzyme, the crowd of the protoplast and the hypotonic solution used. Thus
optimization of enzyme concentration for the production of viable protoplast
became highly important during this experiment.
Thus this experiment concludes that the amount of protoplast formation
depended on the effectiveness of the lytic enzyme that made release of
protoplast from mycelia for the formation of osmotically fragile bodies called
protoplasts. The frequency of protoplast was calculated by using the standard
formula. Our experiment thus revealed that the total protoplast frequency of M.
rouxii CFR G-15 having methionine auxotrophic marker was found to be 35 %.
PDF created with pdfFactory Pro trial version www.pdffactory.com

280
(A)
(B)
(A)
(B)
(C)
PDF created with pdfFactory Pro trial version www.pdffactory.com
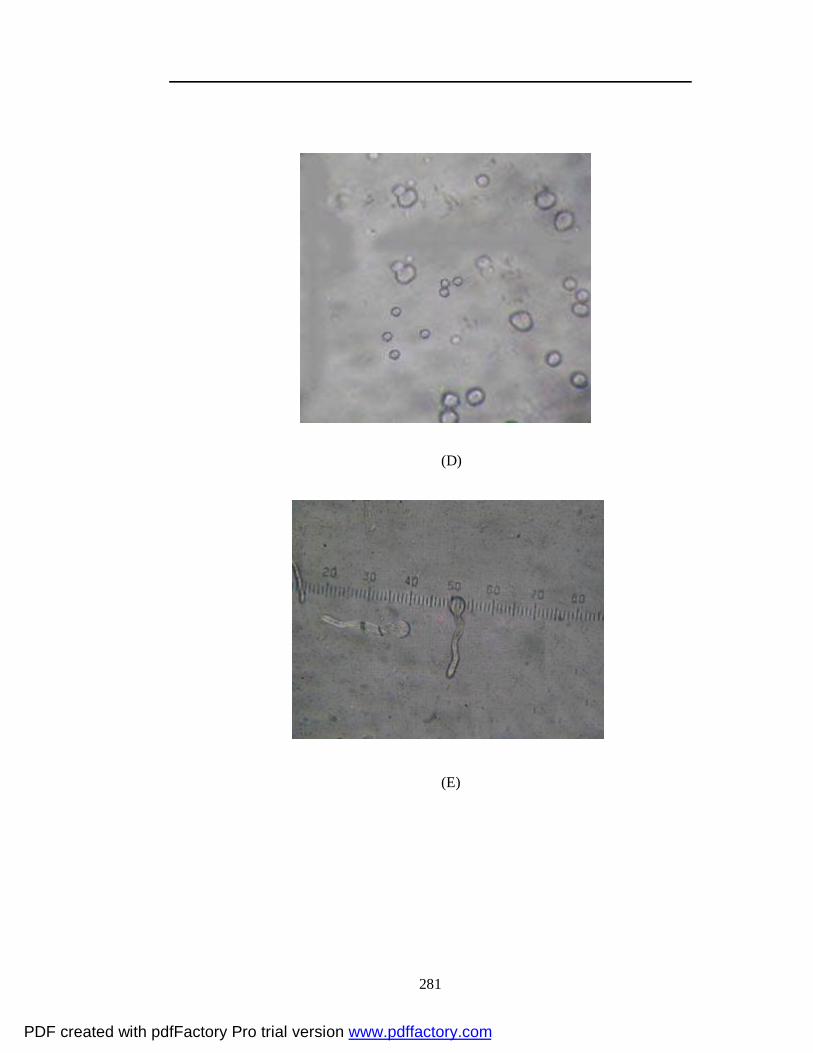
281
(D)
(E)
PDF created with pdfFactory Pro trial version www.pdffactory.com

282
A) Microphotograph of M. rouxii CFR- G15 (met-) before
enzyme treatment showing mycelial structure
B) Microphotograph showing ell degradation and protoplast
release in M. rouxii CFR-G15 (met-)
C) Microphotograph showing protoplast formation in
M. rouxii CFR-G15 (met-)
D) Microphotograph showing protoplast formation in
M. rouxii CFR-G15 (met-)
E) Microphotograph showing protoplast germination after
fusion in selective media containing osmotic stabilizer
(Sorbitol)
PDF created with pdfFactory Pro trial version www.pdffactory.com

283
Regeneration Protoplast
Protoplast regeneration is an important event in protoplast fusion
experiment and a study on the effect of different osmotic stabilizers used in the
regeneration medium showed that 1M sorbitol was the best for this experiment
[Fig. 4.39]. Kirimura et al. (1988) also reported similar levels of regeneration
of protoplast grown on a medium stabilized with 0.7 M KCl. The poor
regeneration of protoplast was observed in our experiment, when MgSO4 at
0.5M concentration used in the regeneration media. Venkateswaran (1999)
reported that among the osmotic stabilizer used 1M sorbitol facilitated
maximum of protoplast in regeneration selective medium. The results obtained
in this study also in concominent with the above results. In our experiment 1M
sorbitol was used in regeneration medium for regeneration of protoplast
obtained from M. rouxii CFR-G15 auxotroph culture. Our results indicated that
the regeneration frequency was found to be 0.46%.
0
0.1
0.2
0.3
0.4
0.5
MgSO4 Mannitol Sorbitol KClDifferent stabilizers
Freq
uenc
y of
pro
topl
ast (
%) P. freq
Fig. 4.39 Effect of different stabilizers on frequency of protoplast fusion
PDF created with pdfFactory Pro trial version www.pdffactory.com

284
Protoplast Fusion The intrastrain protoplasts obtained from M. rouxii CFR-G15 having
auxotrophic marker were fused in presence of 30% PEG 6000 and after 1 h
incubation at 30 °C the fused protoplasts were plated on protoplast regeneration
medium for its appearance. Our results indicated that the fusion frequency was
found to be 0.92 % which was considered to be very optimal. Fusion frequency
between the protoplasts from M. rouxii CFR-G15 was calculated based on the
ratio between the numbers of colonies on MM to the number of colonies on
CM. Several reports indicated that the fusion frequency ranged between 0.2%
and 0.9% (Gunashree 2006; Venkateswaran 1999). Our experiment also
revealed that during fusion of protoplast clumping of protoplasts were formed
[Fig. 4.38]. Similar concentration of PEG used was reported as optimum for
inter-specific and intra strain fusion of protoplast between T. harzianum, T.
reesei and A. niger by EL Bondkly 2006; El Bondkly & Talkhan 2007;
Prabhavathi et al. 2006.
The colonies which showed very fast growth on transfer to selective
complete medium [Fig. 4.40] and grown at 15 °C (low temperature selection)
were picked up and transferred to a complete medium. Based on the mycelial
growth and morphology, 15 fast growing colonies of intra strain fusants of M.
rouxii CFR-G15 were selected and designated as CFR-HyG1 to CFR-HyG15
[Fig.4.41]. Later these selected putative hybrids were cultivated in a normal
room temperature. The characteristics of putative hybrids were performed on
basis of their biomass buildup, fat production and GLA content and these
putative hybrids were compared with the parental cultures. Difference in
growth of parental and hybrid culture grown at both room temperature and low
temperature (15°C) is shown in Fig. 4.42.
PDF created with pdfFactory Pro trial version www.pdffactory.com

285
Fig 4.40 Fusant colonies of M. rouxii CFR-G15 on selective regeneration plates
Fig 4.41 Selected Hybrid cultures
PDF created with pdfFactory Pro trial version www.pdffactory.com
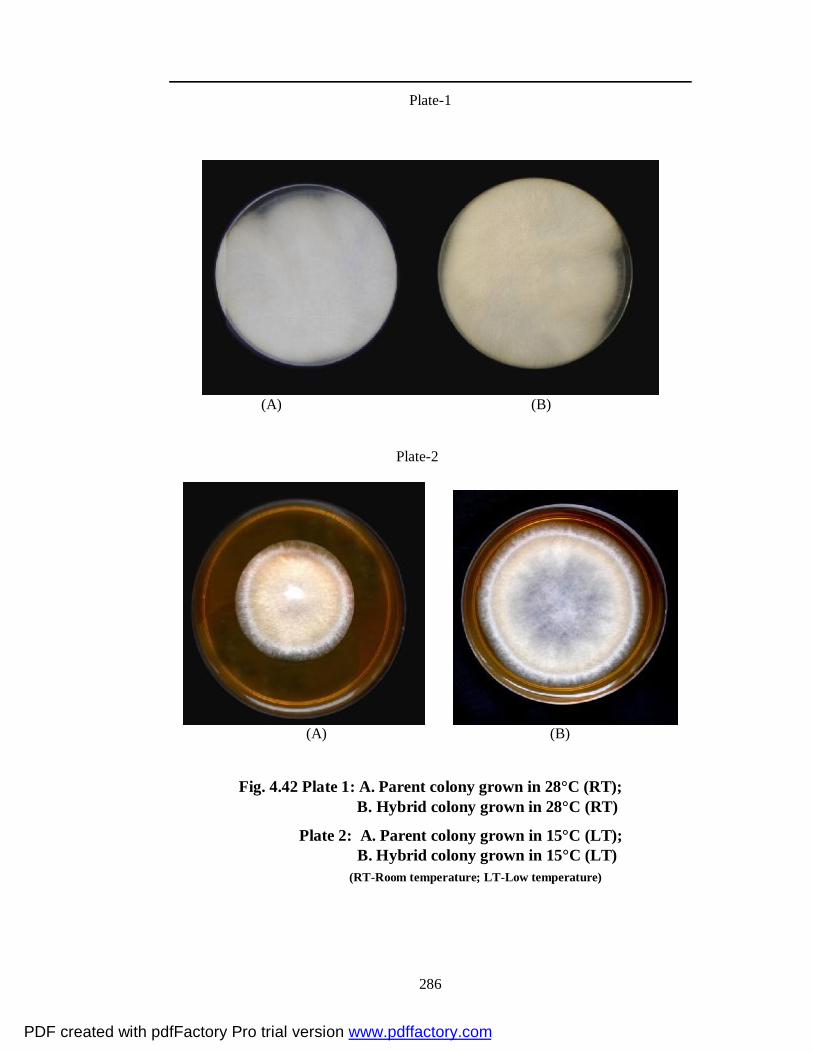
286
Plate-1
(A) (B)
Plate-2
(A) (B)
Fig. 4.42 Plate 1: A. Parent colony grown in 28°C (RT);
B. Hybrid colony grown in 28°C (RT)
Plate 2: A. Parent colony grown in 15°C (LT); B. Hybrid colony grown in 15°C (LT)
(RT-Room temperature; LT-Low temperature)
PDF created with pdfFactory Pro trial version www.pdffactory.com
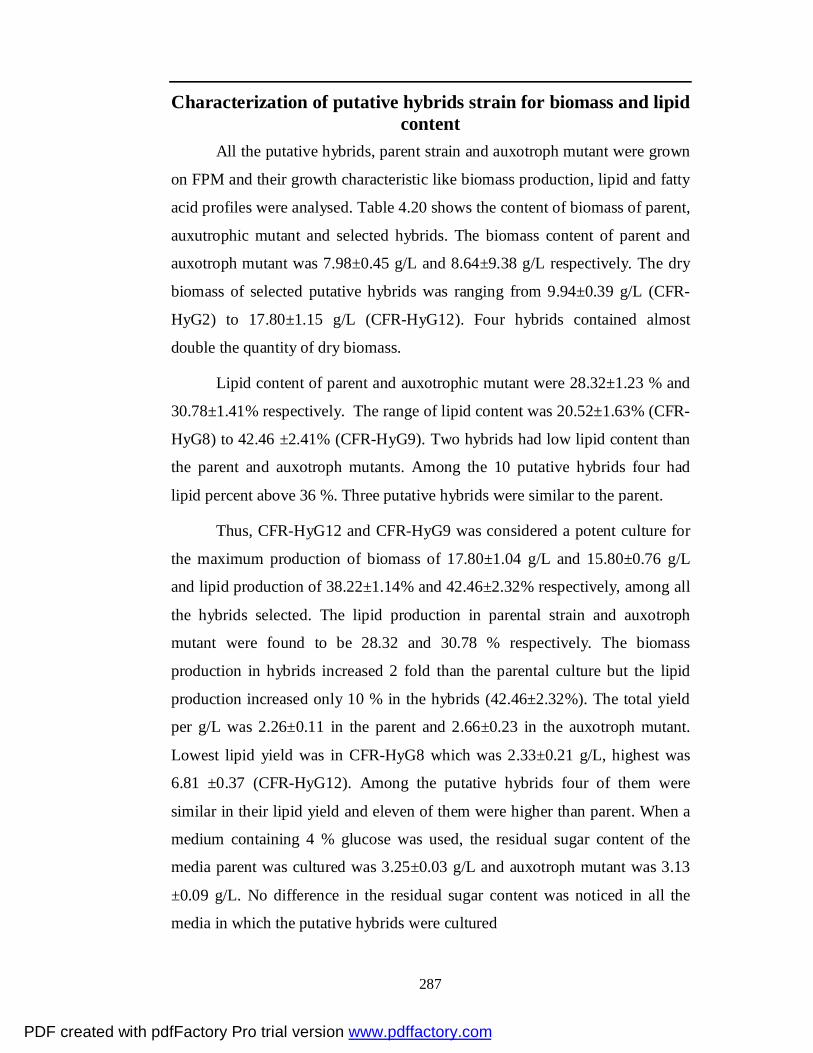
287
Characterization of putative hybrids strain for biomass and lipid content
All the putative hybrids, parent strain and auxotroph mutant were grown
on FPM and their growth characteristic like biomass production, lipid and fatty
acid profiles were analysed. Table 4.20 shows the content of biomass of parent,
auxutrophic mutant and selected hybrids. The biomass content of parent and
auxotroph mutant was 7.98±0.45 g/L and 8.64±9.38 g/L respectively. The dry
biomass of selected putative hybrids was ranging from 9.94±0.39 g/L (CFR-
HyG2) to 17.80±1.15 g/L (CFR-HyG12). Four hybrids contained almost
double the quantity of dry biomass.
Lipid content of parent and auxotrophic mutant were 28.32±1.23 % and
30.78±1.41% respectively. The range of lipid content was 20.52±1.63% (CFR-
HyG8) to 42.46 ±2.41% (CFR-HyG9). Two hybrids had low lipid content than
the parent and auxotroph mutants. Among the 10 putative hybrids four had
lipid percent above 36 %. Three putative hybrids were similar to the parent.
Thus, CFR-HyG12 and CFR-HyG9 was considered a potent culture for
the maximum production of biomass of 17.80±1.04 g/L and 15.80±0.76 g/L
and lipid production of 38.22±1.14% and 42.46±2.32% respectively, among all
the hybrids selected. The lipid production in parental strain and auxotroph
mutant were found to be 28.32 and 30.78 % respectively. The biomass
production in hybrids increased 2 fold than the parental culture but the lipid
production increased only 10 % in the hybrids (42.46±2.32%). The total yield
per g/L was 2.26±0.11 in the parent and 2.66±0.23 in the auxotroph mutant.
Lowest lipid yield was in CFR-HyG8 which was 2.33±0.21 g/L, highest was
6.81 ±0.37 (CFR-HyG12). Among the putative hybrids four of them were
similar in their lipid yield and eleven of them were higher than parent. When a
medium containing 4 % glucose was used, the residual sugar content of the
media parent was cultured was 3.25±0.03 g/L and auxotroph mutant was 3.13
±0.09 g/L. No difference in the residual sugar content was noticed in all the
media in which the putative hybrids were cultured
PDF created with pdfFactory Pro trial version www.pdffactory.com

288
Table 4.20 Biomass, and lipid characteristics of hybrids obtained by intraspecific protoplast fusion of M. rouxii CFR-G15 (Fat Producing Medium, Room temperature, pH-6.0, 180rpm)
Parent/ Aux. mutants/ Hybrids
Dry Biomass (g/L)
Total Lipid content (%)
Lipid yield (g/L)
Residual content
(g/L) Parent
7.98±0.45 28.32±1.23 2.26±0.11 3.25±0.03 Aux.mut
(met-) 8.64±0.38 30.78±1.41 2.66±0.12 3.13±0.09
CFR-HyG1 12.40±1.02 34.76±1.76 4.30±0.46 3.60±0.26
CFR-HyG2 9.94±0.39 35.25±1.78 3.51±0.36 2.88±0.06 CFR-HyG3
10.38±0.58 32.78±1.86 3.41±0.32 3.47±0.08 CFR-HyG4
11.84±0.81 20.97±1.15 2.49±0.35 3.87±0.05 CFR-HyG5
13.76±1.20 30.79±1.59 4.24±0.28 3.87±0.03 CFR-HyG6
11.20±1.07 26.59±1.26 2.97±0.31 3.47±0.06 CFR-HyG7
15.80±1.06 40.63±2.13 6.43±0.48 3.53±0.07 CFR-HyG8
11.40±1.04 20.52±1.63 2.33±0.21 4.27±0.07 CFR-HyG9
15.80±0.76 42.46±2.41 6.72±0.32 3.53±0.07 CFR-HyG10
10.40±0.83 28.85±2.12 3.01±0.24 4.27±0.04 CFR-HyG11
14.00±1.02 32.31±2.10 4.53±0.46 4.00±0.17 CFR-HyG12
17.80±1.15 40.22±1.14 6.81±.037 4.20±0.07 CFR-HyG13
15.20±1.01 34.32±2.43 5.23±0.46 4.13±0.06 CFR-HyG14
13.21±0.87 31.75±2.18 4.18±0.54 4.13±0.05 CFR-HyG15
13.62±0.76 40.36±2.48 5.50±0.38 3.40±0.08 Data are expressed as mean ±SD of three replicates.
CFR-Central Food Technological Research Institute, Hy-Hybrid strains and G1-GLA containing isolates
Characterization of putative Hybrids for its Fatty Acid Profiles Fatty acid composition of all hybrids, parental strains and auxotroph
mutant were analyzed by GC. The results revealed that there were significant
differences in fatty acid profiles among the hybrids [Table 4.21]. Parental
strains and auxtrophic mutants did not have significant amount of GLA when
compared to CFR-HyG9 and CFR-HyG12 hybrids. The GC chromatogram of
PDF created with pdfFactory Pro trial version www.pdffactory.com
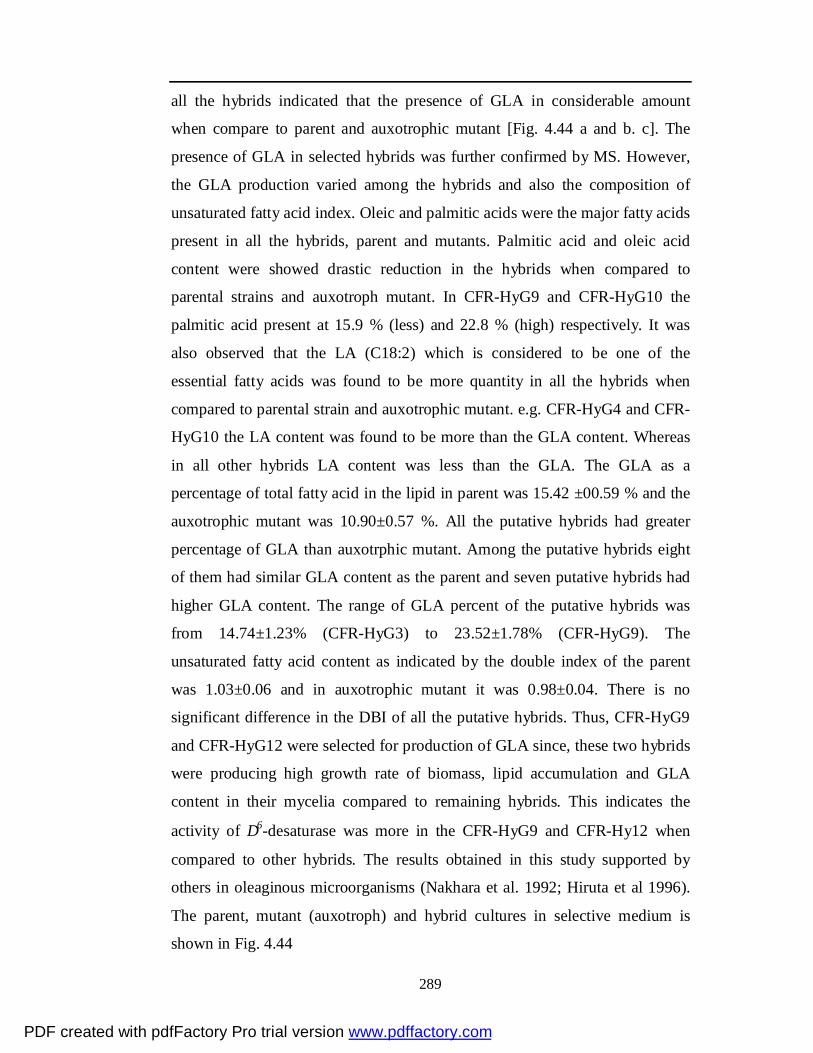
289
all the hybrids indicated that the presence of GLA in considerable amount
when compare to parent and auxotrophic mutant [Fig. 4.44 a and b. c]. The
presence of GLA in selected hybrids was further confirmed by MS. However,
the GLA production varied among the hybrids and also the composition of
unsaturated fatty acid index. Oleic and palmitic acids were the major fatty acids
present in all the hybrids, parent and mutants. Palmitic acid and oleic acid
content were showed drastic reduction in the hybrids when compared to
parental strains and auxotroph mutant. In CFR-HyG9 and CFR-HyG10 the
palmitic acid present at 15.9 % (less) and 22.8 % (high) respectively. It was
also observed that the LA (C18:2) which is considered to be one of the
essential fatty acids was found to be more quantity in all the hybrids when
compared to parental strain and auxotrophic mutant. e.g. CFR-HyG4 and CFR-
HyG10 the LA content was found to be more than the GLA content. Whereas
in all other hybrids LA content was less than the GLA. The GLA as a
percentage of total fatty acid in the lipid in parent was 15.42 ±00.59 % and the
auxotrophic mutant was 10.90±0.57 %. All the putative hybrids had greater
percentage of GLA than auxotrphic mutant. Among the putative hybrids eight
of them had similar GLA content as the parent and seven putative hybrids had
higher GLA content. The range of GLA percent of the putative hybrids was
from 14.74±1.23% (CFR-HyG3) to 23.52±1.78% (CFR-HyG9). The
unsaturated fatty acid content as indicated by the double index of the parent
was 1.03±0.06 and in auxotrophic mutant it was 0.98±0.04. There is no
significant difference in the DBI of all the putative hybrids. Thus, CFR-HyG9
and CFR-HyG12 were selected for production of GLA since, these two hybrids
were producing high growth rate of biomass, lipid accumulation and GLA
content in their mycelia compared to remaining hybrids. This indicates the
activity of ∆6-desaturase was more in the CFR-HyG9 and CFR-Hy12 when
compared to other hybrids. The results obtained in this study supported by
others in oleaginous microorganisms (Nakhara et al. 1992; Hiruta et al 1996).
The parent, mutant (auxotroph) and hybrid cultures in selective medium is
shown in Fig. 4.44
PDF created with pdfFactory Pro trial version www.pdffactory.com

290
Fig 4.43 Gas chromatogram showing the increased GLA a. Parent; b. Auxotroph mutant; c. Hybrid culture
C18
:3
PDF created with pdfFactory Pro trial version www.pdffactory.com
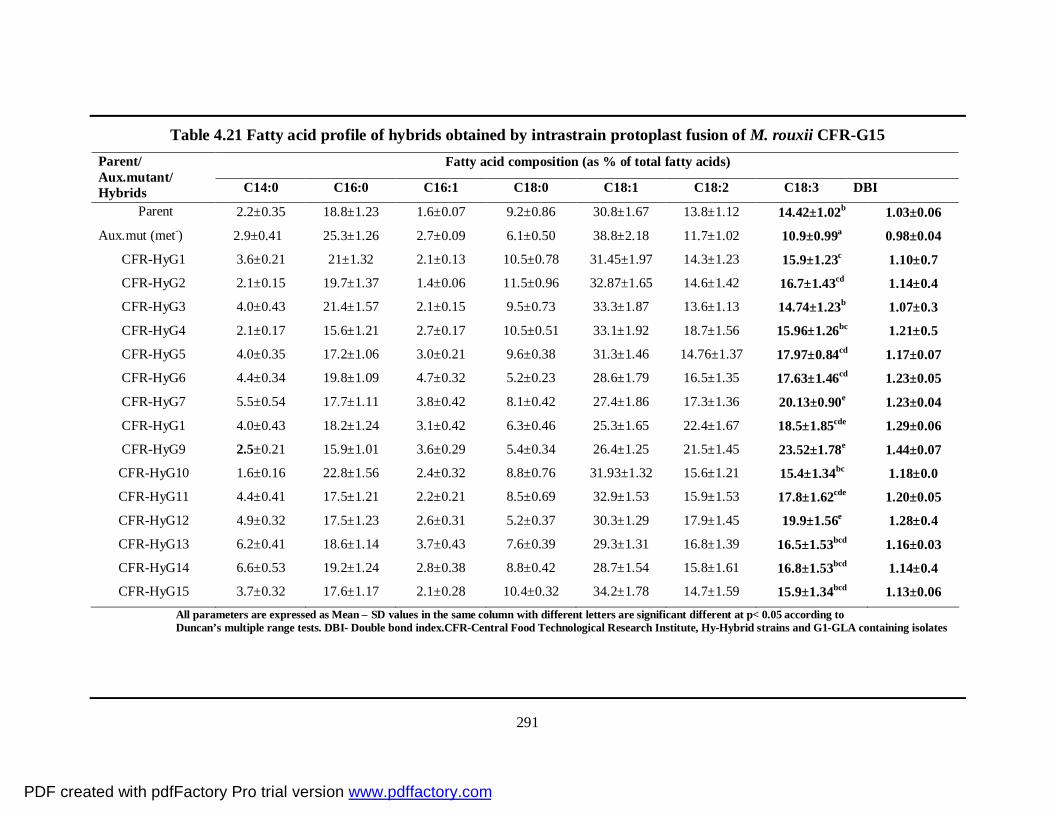
291
Table 4.21 Fatty acid profile of hybrids obtained by intrastrain protoplast fusion of M. rouxii CFR-G15
Fatty acid composition (as % of total fatty acids) Parent/ Aux.mutant/ Hybrids C14:0 C16:0 C16:1 C18:0 C18:1 C18:2 C18:3 DBI
Parent 2.2±0.35 18.8±1.23 1.6±0.07 9.2±0.86 30.8±1.67 13.8±1.12 14.42±1.02b 1.03±0.06
Aux.mut (met-) 2.9±0.41 25.3±1.26 2.7±0.09 6.1±0.50 38.8±2.18 11.7±1.02 10.9±0.99a 0.98±0.04
CFR-HyG1 3.6±0.21 21±1.32 2.1±0.13 10.5±0.78 31.45±1.97 14.3±1.23 15.9±1.23c 1.10±0.7
CFR-HyG2 2.1±0.15 19.7±1.37 1.4±0.06 11.5±0.96 32.87±1.65 14.6±1.42 16.7±1.43cd 1.14±0.4
CFR-HyG3 4.0±0.43 21.4±1.57 2.1±0.15 9.5±0.73 33.3±1.87 13.6±1.13 14.74±1.23b 1.07±0.3
CFR-HyG4 2.1±0.17 15.6±1.21 2.7±0.17 10.5±0.51 33.1±1.92 18.7±1.56 15.96±1.26bc 1.21±0.5
CFR-HyG5 4.0±0.35 17.2±1.06 3.0±0.21 9.6±0.38 31.3±1.46 14.76±1.37 17.97±0.84cd 1.17±0.07
CFR-HyG6 4.4±0.34 19.8±1.09 4.7±0.32 5.2±0.23 28.6±1.79 16.5±1.35 17.63±1.46cd 1.23±0.05
CFR-HyG7 5.5±0.54 17.7±1.11 3.8±0.42 8.1±0.42 27.4±1.86 17.3±1.36 20.13±0.90e 1.23±0.04
CFR-HyG1 4.0±0.43 18.2±1.24 3.1±0.42 6.3±0.46 25.3±1.65 22.4±1.67 18.5±1.85cde 1.29±0.06
CFR-HyG9 2.5±0.21 15.9±1.01 3.6±0.29 5.4±0.34 26.4±1.25 21.5±1.45 23.52±1.78e 1.44±0.07
CFR-HyG10 1.6±0.16 22.8±1.56 2.4±0.32 8.8±0.76 31.93±1.32 15.6±1.21 15.4±1.34bc 1.18±0.0
CFR-HyG11 4.4±0.41 17.5±1.21 2.2±0.21 8.5±0.69 32.9±1.53 15.9±1.53 17.8±1.62cde 1.20±0.05
CFR-HyG12 4.9±0.32 17.5±1.23 2.6±0.31 5.2±0.37 30.3±1.29 17.9±1.45 19.9±1.56e 1.28±0.4
CFR-HyG13 6.2±0.41 18.6±1.14 3.7±0.43 7.6±0.39 29.3±1.31 16.8±1.39 16.5±1.53bcd 1.16±0.03
CFR-HyG14 6.6±0.53 19.2±1.24 2.8±0.38 8.8±0.42 28.7±1.54 15.8±1.61 16.8±1.53bcd 1.14±0.4
CFR-HyG15 3.7±0.32 17.6±1.17 2.1±0.28 10.4±0.32 34.2±1.78 14.7±1.59 15.9±1.34bcd 1.13±0.06 All parameters are expressed as Mean ± SD values in the same column with different letters are significant different at p< 0.05 according to Duncan’s multiple range tests. DBI- Double bond index.CFR-Central Food Technological Research Institute, Hy-Hybrid strains and G1-GLA containing isolates
PDF created with pdfFactory Pro trial version www.pdffactory.com
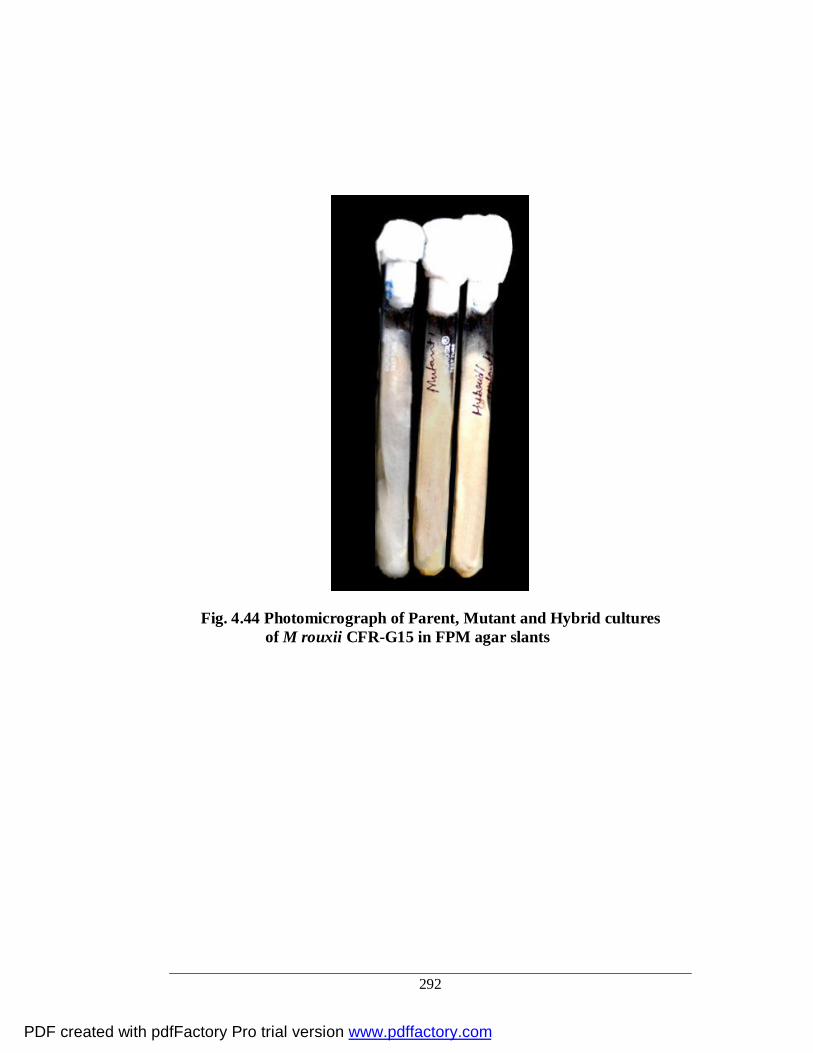
292
Fig. 4.44 Photomicrograph of Parent, Mutant and Hybrid cultures of M rouxii CFR-G15 in FPM agar slants
PDF created with pdfFactory Pro trial version www.pdffactory.com

293
Characterization of putative Hybrids for the protein, total soluble sugar, lipid and ash content
The selected hybrids were also subjected to proximate analysis of total
protein, sugars and ash content on the dry biomass basis. The results are given
in Table 4.22. The crude protein was estimated by Kjeldhal method and the
results revealed that, protein content of the parent was 38.81±1.76% and that of
auxotrophic mutant 40.1±2.01%. The range of protein in the putative hybrids
was from 31.30±1.78% (CFR-HyG9) to 50.80±2.23% (CFR-HyG4). Six
putative hybrids were higher than parent and two were lower. Rests of them
were similar in protein percentage in their dry biomass. The total carbohydrates
content in hybrids and parental strains of the biomass were estimated by
phenol-sulphuric acid method. The results showed that the total crude
carbohydrate in parent was 32.86±1.45% and the auxotroph mutant
30.10±1.52%. The values for carbohydrate content of the dry biomass of the
putative hybrids varied from 20.12±1.05% (CFR-HyG3) to 32.55±1.96%
(CFR-HyG10). The ash content of the parent was 0.16±0.03% and of that of
auxotroph mutant was 0.18±0.05%. The ash content ranged from 0.14±0.03 to
0.35±0.09 and was not greatly different.
Thus, the various experiments carried out in this study, ultimately aimed
to increase the biomass, total lipid content and maximizing the GLA production
through study of various techniques. Based on the above results, hybrids
culture namely CFR-HyG9 and CFR-HyG12 were selected for maximum
biomass, lipid and GLA production. Future study may be undertaken for scale
up studies using fermenters/reactors for the production of biomass and lipid
extraction under optimized controlled conditions for food and pharmaceutical
applications.
PDF created with pdfFactory Pro trial version www.pdffactory.com

294
Table 4.22 The lipid, protein, carbohydrate and ash content of the parent/aux. mutant/ putative hybrids.
Parent/ Aux.
mutant/Hybrid Lipid (%)
Protein (%)
Carbohydrate (%)
Ash (%)
Parent 28.32±1.23 38.81±1.76 32.86±1.23 0.16±0.03
Aux.mut (met-) 30.78±1.41 40.10±2.01 28.94±1.52 0.18±0.05 CFR-HyG1 34.76±1.76 36.91±1.89 28.07±1.61 0.27±0.07 CFR-HyG2 35.25±1.78 46.65±2.12 17.83±1.78 0.35±0.09 CFR-HyG3 32.78±1.86 45.22±2.17 20.12±1.05 0.24±0.08 CFR-HyG4 20.97±1.15 50.80±2.23 26.33±1.73 0.14±0.03 CFR-HyG5 30.79±1.59 36.31±1.78 31.09±1.69 0.23±0.05 CFR-HyG6 26.59±1.26 40.63±1.34 31.49±2.07 0.32±0.09 CFR-HyG7 40.63±2.13 30.45±1.51 28.74±1.67 0.18±0.02 CFR-HyG8 20.52±1.63 46.90±1.96 32.43±1.52 0.15±0.02 CFR-HyG9 42.46±2.41 31.30±1.78 25.97±1.37 0.27±0.04 CFR-GyG10 28.85±2.12 38.31±1.63 32.55±1.96 0.29±0.07 CFR-HyG11 32.31±2.10 42.60±1.87 24.83±1.31 0.26±0.08 CFR-HyG12 40.22±1.14 38.40±1.93 21.25±1.98 0.18±0.05 CFR-HyG13 34.32±2.53 40.24±1.97 25.23±1.73 0.21±0.06 CFR-HyG14 31.75±2.08 45.91±1.98 22.13±1.26 0.22±0.08 CFR-HyG15 40.36±2.78 35.36±1.37 24.01±1.43 0.27±0.06
Data are expressed as mean ±SD of three replicates. CFR-Central Food Technological Research Institute; Hy-Hybrid strains; G1-GLA containing isolates
PDF created with pdfFactory Pro trial version www.pdffactory.com

295
SUMMARY &
CONCLUSION
PDF created with pdfFactory Pro trial version www.pdffactory.com

296
SUMMARY AND CONCLUSION
Single cell oil (SCO) in the recent past, has become an accepted
biotechnologically important product, fulfilling major roles in human health.
They are also become very essential for nutrition of infants as well as geriatrics
for overall maintenance. SCO are the edible oils extracted from
microorganisms. As the single celled entities they are all at the bottom of the
food chain (Zui and Ratledge 2005). Yeasts, fungi and several algae are able to
produce high levels of nutritionally and pharmaceutically important SCO, rich
in PUFAs (Cohen & Ratledge 2005; Waltermann et al. 2009).
In this study, M. rouxii CFR-G15, a zygomycetous fungi producing high
amount of gamma linolenic acid was isolated from soil and has been subjected
various experimental conditions to produce maximum lipid and GLA in its
biomass.
In this section an overall conclusions from each study have been
described:
In order to obtain native isolate for GLA production, 250 soil samples
from various habitats (river banks, humus soil, forest agricultural land, Zoo
zone, garden and pond) were collected and screened for oleaginous fungi with
special reference to Mucor spp. Normally, Mucor, Rhizopus, Aspergiluus and
penicillium species were observed from the above soil samples. Higher
percentage (40%) of Mucor species were noticed among the fungal population.
All Mucor spp. were saprophytic and proteolytic in nature and they grew faster
on the nutrient rich medium when compared to other fungi.
Cottony hairy with white or grey coloured growth was the
morphological character of Mucor sp. Later these Mucor spp. were identified
with standard culture obtained from MTCC Bank, confirmation was also
performed using Gilman manual of soil fungi and further confirmed by
molecular methods (Fig. 4.1.1) using rRNA analysis and ∆6-desaturase gene
cloning and sequencing analyses.
PDF created with pdfFactory Pro trial version www.pdffactory.com

297
All Mucor species isolated through screening methods were observed
for their oleagenecity by qualitative method using Sudan B black stain and
quantitatively by gravimetric method, respectively.
Mycelia with highly stained fat globules inside were selected for further
study. About 20 Mucor isolates along with the standard cultures were
cultivated in fat production medium by submerged fermentation to find out the
growth characteristics, total lipid production and GLA content. Among all the
20 isolates, CFR-G15 showed higher biomass production (8.82±0.93 g/L) on
dry basis, lipid percentage (30±1.32%) and GLA (14.42±0.74as % of fatty
acids) content.
Optimization of cultural conditions for maximum biomass, lipid and
GLA content of Mucor rouxii CFR-G15 (screened and selected as potent
culture for GLA production) was carried out. The cultivation conditions for
GLA production were optimized by appropriate selection of pH, temperature,
aeration, effect of inoculum size/concentration, media composition, various
carbon and nitrogen sources in the cultivation media, C:N ratio, incorporation
of certain vegetable oils in the growth media and certain minerals with different
concentrations. From the above experiments on optimization parameters a pH
of 5.5-6.0, temperature at 28 ±2°C for good biomass buildup and 15°C for
GLA formation in mycelial structure were found to be optimum.
Effect of aeration on the culture with different volumes of medium in
the cultivation flask was tested. Our result concluded that 100 ml working
volume in 500 ml capacity culture flasks gave maximum biomass, lipid and
GLA production in M. rouxii CFR-G15.
Evaluation of various carbon sources for maximizing the GLA
production was carried out. Carbon sources like glucose, fructose, sucrose,
starch, galactose, maltose, and lactose were tested for the above purpose. The
result indicated that, when glucose and soluble starch were used as carbon
source individually, a good biomass build up (8.44±0.34 and 8.12±0.81 g/L)
was found. Sucrose and lactose didn’t give any significant growth of M. rouxii
PDF created with pdfFactory Pro trial version www.pdffactory.com

298
CFR-G15. Slight variation was observed among the other carbon sources in
growth of M. rouxii CFR-G15.
The effect of nitrogen on the production of GLA in M. rouxii CFR-G15
was studied by using different nitrogen compounds. They are yeast extract,
peptone, ammonium sulphate, ammonium nitrate, potassium nitrate and urea.
Our results concluded that the medium containing yeast extract and ammonium
nitrate gave the highest cell biomass and total lipid yield and GLA content.
Urea in the cultivation medium gave more biomass but very low lipid content.
Studies on C:N ratio by varying the carbon and nitrogen sources were
carried out for optimal production of GLA in the fungus. Through this study, it
was concluded that C:N ratio 40-80 gave maximum lipid and GLA production
with M. rouxii CFR-G15.
Several studies indicated that addition of certain minerals such as Ca2+,
Mg2+, Na2+, K+, Zn2+, Fe2+, Cu2+ and Mn2+ ions at different concentrations had
an effect on growth, lipid and GLA production. Our results indicated that
Mg2+, and Ca2+ when added at 0.5 g/L in growth medium increased the
concentration of GLA more than 10% in M. rouxii CFR-G15. Other minerals
like Na2+, K+, Zn2+, Fe2+, Cu2+ and Mn2+ didn’t show any significant increases
on these parameters.
Similarly inclusion of certain plant oils also had an effect on biomass,
lipid and GLA production. Coconut, palm, sunflower, ground nut, niger,
gingelly and mustard oils were added to cultivation medium. The results
concluded that niger seed oil showed increase in biomass, lipid content and
GLA content in the M. rouxii CFR-G15. When growth medium was
supplemented with coconut oil and palm oil, the GLA content was found to be
very low when compared to basal medium, because these oils very low linoleic
acid content in their lipid. Hence we conclude that oil sources containing
saturated fatty acids didn’t favour the production of GLA. It is confirmed again
from our experiment that linoleic acid is the precursors for the formation of
GLA and other PUFAs. Niger seed oil contains good amount of linoleic acid
PDF created with pdfFactory Pro trial version www.pdffactory.com

299
thus incorporation of this oil in the growth medium favoured the GLA
production in M. rouxii CFR-G15.
Response surface methodology (RSM) was used with the aim of
optimizing the levels of carbon and nitrogen source to maximize the GLA
production in M. rouxii CFR-G15. Various trial experiments revealed that
glucose, yeast extract and ammonium nitrate played a major role in GLA
production in this fungus. The optimization study was carried out with CCR
design (CCRD) with these variables. 20 experiments were carried out and
central point was experimented 6 times. The results indicated that the
maximum yield of biomass (12. 2 g/L), lipid (39.9 %) and GLA (18.89%)
observed with glucose 65 g/L, yeast extract 3.5 g/L and ammonium nitrate 0.5
g/L were used.
Strain improvement is an important criterion for microorganisms to
improve the product performance. This fungus, M. rouxii CFR-G15, was
subjected to mutation (UV, EMS and NTG) and the mutants were selected
based on the auxotrophic growth requirements. Lysine (lys-), alanine (ala-),
isoleusine (isoleu-) and methionine (met-) auxotrophs were selected as markers
for protoplast fusion studies. Though we could produce a few auxotrophic
markers, many of them have reverted back to original genetic status due to
DNA autorepair mechanism. A double mutation on this fungus, have resulted
in getting met- auxotroph permanently. This marker was used as selection
criterion for hybrid selection.
Intrastrain/intraspecific protoplast fusion (hybridization) experiment was
carried out to obtain hybrids with high lipid and GLA content. PEG 6000 at
30% level was used as fusogenic agent. By using standard protocol a few
hybrids were selected. Quantitative analysis revealed that, out of 15 hybrids,
CFR-HyG9 and CFR-HyG12 had more GLA content when compared to parent
and met- auxotroph mutant cultures of M. rouxii CFR-G15.
PDF created with pdfFactory Pro trial version www.pdffactory.com
300
This study on GLA production using Musor sp. (Mucor rouxii CFR-
G15) indicates a promising alternative/ additional source for industrial scale
production from conventional sources like evening primrose, borage seed oil
and other potential microbial sources. Screening studies are useful identifying
organisms for PUFAs production. Further study can be carried out to identify
potential PUFAs carried out to identify potential PUFAs producers especially
GLA. Exploring the native isolate for the production of the speciality lipid
GLA using biotechnological approaches is an important step. The present work
enabled the identification of new fungal strains for their potential GLA
production through manipulation of growth conditions, mutation and
hybridization.
The genes and genes products involved in the biosynthesis of PUFAs is
being identified and characterized all over the world for higher production of
PUFAs from microbial sources. Additionally, gene encoding ∆6-desaturase
enzyme involved in GLA biosynthesis in M. rouxii CFR-G15 was also
identified. The present research work provides useful information for further
work on PUFA metabolic pathways and gene engineering about GLA
production from microbial sources. A potential strain was reported that could
be used for the development of an economical process in industrial GLA
production.
PDF created with pdfFactory Pro trial version www.pdffactory.com

301
OUTCOME OF THIS RESEARCH WORK
PAPERS
Mamatha, S.S., Ravi, R.and Venkateswaran, G. “Medium optimization of Gamma Linolenic Acid production in Mucor rouxii CFR-G15 by RSM”. Food and bioprocess technology An International journal (Published)
Mamatha, S. S. and Venkateswaran, G. “Differential temperature effect on Gamma linolenic acid prodcuton in Mucor rouxii CFR-G15. Indian journal of Microbiology (Accepted)
Mamatha S S, Prakash M Halami and Venkateswaran G. “Identification and characterization of omega 6 fatty acids producing Mucor rouxii native isolate CFR-G15” .European Journal of lipid science and technology (Accepted)
Mamatha S S, Muthukumar S P and Venkateswaran G. “Safety evaluation of Mucor rouxii CFR-G15 biomass containing ω -6 fatty acids in rats”. Regulatory toxicology and pharmacology (communicated)
Papers presented in National/International Conferences/Symposia
Mamatha S.S., Gayathri N and G. Venkateswaran (2004). Intraspecific protoplast fusion for altered lipid profile in Mucor rouxii. 45th Annual Conference of AMI held between 23rd and 25th Nov 2004 at National Dairy Research Institute, Karnal, Haryana. Mamatha S. S and G.Venkateswaran (2005) Differential temperature effect on growth, lipid and lipid profiles of Mucor rouxii: a study. 46th Annual Conference of AMI held between 8th and 10th Dec 2005 at Osmania University, Hyderabad. Mamatha S. S. and G.Venkateswaran (2005) Studies on Gamma Linolenic Acid (GLA) of Mucor sps: Isolation and screening from soil sources. 17th Indian Convention of Food Scientists and Technologists organized by AFSTI (I), CFTRI and DFRL held between 9th and 10th
December 2005 at NIMHANS, Bangalore. Best poster Award in the area of Microbiology and Biotechnology
Mamatha, S. S. and Venkateswaran, G. “Effect of extraction methods on lipid yield with special reference to γ-linolenic acid from Mucor rouxii CFR-G15” at the 17th ICFOST jointly organized by CFTRI, and
PDF created with pdfFactory Pro trial version www.pdffactory.com

302
AFST (I) held between 16th and 17th of Nov-2006 at Agricultural university, Hyderabad Also awarded Best poster award in the area of Biotechnology and Microbiology
Mamatha, S. S. and Venkateswaran, G. “Influence of C:N ratio on the production of lipid and γ-linolenic acid by Mucor rouxii CFR-G15” 47th Annual Conference of AMI held at Biotechnology and bioinformatics department, Barkatulla University, in the month of Dec-2006
Mamatha, S.S., Ravi, R.and Venkateswaran, G.. “Response Surface Optimization Of Media Components For Gamma Linolenic Acid Production By Mucor Rouxii CFR- G15” at the 75th Annual Conference of SBC(I) held at life sciences department, Jawaharlal Nehru University, in the month of Dec-2006
Mamatha S. S and G.Venkateswaran (2007) “Enhancing γ-linolenic acid production by Mucor rouxii CFR-G15 using oils”. “New horizons in biotechnology (NHBT)” organized by NIIST, Trivandrum held between 26th and 29th November 2007 Mamatha S. S and G.Venkateswaran (2007) “Influence of Mineral components for the enhanced production of γ-linolenic acid by Mucor rouxii CFR-G15” 1st International Conference of Applied Bioengineering held at Sathyabhama University, Chennai.
Mamatha S S, Prakash M Halami and Venkateswaran G (2008) “Molecular characterization of omega 6 fatty acids producing Mucor rouxii native isolate CFR-G15” IFCON-2008 organized by AFST(I) held at CFTRI, Mysore
Mamatha S S, MuthuKumar S P† and Venkateswaran G (2008) “Safety evaluation of omega 6 fatty acids containing Mucor rouxii CFR-G15 biomass in albino rats for food formulation” IFCON-2008 organized by AFST(I) held at CFTRI, Mysore
PDF created with pdfFactory Pro trial version www.pdffactory.com

303
BIBLIOGRAPHY
PDF created with pdfFactory Pro trial version www.pdffactory.com

304
Abe A, Oda Y, Asano K & Sone T (2006) The molecular phylogeny of the Genus Rhizopus based on rDNA sequences. Biosci Biotechnol Biochem. 70, 2387-2393.
Aggelis G (1996) Two alternative pathways for substrate assimilation by Mucor circinelloides. Folia Microbiol, 41, 254–256.
Aggelis G & Sourdis J (1997) Prediction of lipid accumulation-degradation in oleaginous micro-organisms growing on vegetable oils. Antonie Leeuwenhoek, 72, 159–165.
Aggelis G (2003) Selective uptake of fatty acids by the yeast Yarrowia lipolytica. Eur J Lipid Sci Technol, 105, 651–655.
Ahmed S U, Singh S K, Pandey A, Kanjilal S & Prasad R B N (2006) Effects of Various Process Parameters on the Production of γ-Linolenic Acid in Submerged Fermentation. Food Technol Biotechnol, 44, 283–287.
Ahmed S U, Reddy K K, Swathy L S, Singh S K, Kanjilal S, Prasad R B N & Pandey A (2009) Enrichment of γ-Linolenic Acidin the extracted from Mucor zychae MTCC 5420. Food Res Internat, 42, 449-453.
Aki T, Shimida Y, Inagaki K, Higashimoto H, Kawamoto S, Shigete S, Ono K & Suzuki O (1999) Molecular cloning and functional characterization of rat delta-6 fatty acid desaturase. Biochem Biophys Res Commun, 255, 575-579.
Altschul S F, Maddan T L, Schaffer A A, Zhang J, Zhang Z, Miller W & Lipman D J (1997) Gapped BLAST and PSI-BLAST: a new generation of protein database search programs. Nucleic acids Res, 25, 3389-3402.
Alvarez H, Kalscheuer R & Steinbul A (2000) Accumulation and mobilization of storage lipids by Rhodococcus opacus PD630 and Rhodococcus ruber NCIMB 40126. Appl Microbiol Biotechnol, 54, 218–223.
Ando S, Nakajima K & Hatano M (1992) Incorporation of n-3Polyunsaturated fatty acids into phospholipids of a marine bacterium Vibrio sp. cultivated with the sardine oil. J Ferment Bioeng, 73, 169-171.
Anne J & Peberdy J F (1976) induced fusion of fungal protoplasts following treatment with polyethylene glycol. J Gen Microbiol, 92, 413-417.
AOAC (1991) Official methods of Analysis, 15th edn, Vol 1and 2. Assoc. Offici. Anal. Chem. Arlington.
AOAC Official methods of Analysis (1984a), 13 Edition, Association of official Analytical Chemists, Washington 529
AOAC Official methods of Analysis (1984b), 13 Edition, Association of official Analytical Chemists, Washington 447
Aoki H, Nishioka K, Mankura M, Endo Y & Fujimoto K (1999)The incorporation of Accumulation of Supplemented Fatty acids in Mcor hiemalis HA-30. Biosci Biotechnol biochem, 63, 1032-1036.
Bajpai P, Bajpai P K & Ward O P (1991b) Eicosapentaenoic acid (EPA) formation: Comparative studies with Mortierella strains and production by Mortierella elongata. Mycological Res, 95, 1294–1298.
PDF created with pdfFactory Pro trial version www.pdffactory.com
305
Bajpai P K, Bajpai P & Ward O P (1991d) Optimization of production of docosahexaenoic acid (DHA) by Thraustochytrium aureum ATCC 34304. J Am Oil Chem Soc, 68, 509–514.
Bajpai P K & Bajpai P (1992) Review: arachidonic acid production by microorganisms. Biotechnol. App. Biochem, 15, 1–10.
Bajpai P & Bajpai P K (1993) Eicosapentaenoic acid (EPA) production from microorganisms: a review. J Biotechnol, 30, 161–183.
Bandyopadhyay S, Ghosh S, Chaudari S & Bhattacharyya D K (2001) production of γ-linolenic acid bt Rhizopus nigricans SSD-8. J Oleo Sci. 50, 641-647.
Bandyopadyay K, Bandyopadhyay S, Bhattacharyya A K & Ghosh G (2003) Mineral addition on production of γ-Linolenic acid by Rhizopus nigricans. J Oleo Sci, 52, 215-219.
Barclay W R, Meager K M & Abril J R (1994) Heterotrophic production of long chain omega-3 fatty acids utilizing algae and algae like microorganisms. J Appl Phycol, 6, 123–129.
Barham, J.B, Edens M B, Fonteh A N, Johnson M M, Easter L & Chilton F H (2000) Addition of eicosapentaenoic acid to gamma-linolenic acid-supplemented diets prevents serum arachidonic acid accumulation in humans. J Nutr, 130, 1925-1931.
Belch J J F & Hill A (2000). “Evening primrose oil and Borage oil in rheumatologic conditions”, Ame J Clin Nutr. 71, 352S-356S.
Berry E M (1997) Dietary fatty acids in the management of diabetes mellitus. Am J Clin Nutr, 66 (Suppl), 991S–7S.
Berry E M (2001) Are diets high in omega-6 polyunsaturated fatty acids unhealthy? Europ Heart J Suppl, 3, D37–D41.
Bligh E C & Dyer W J (1959) A rapid method of total lipid extraction and purification. Can J Biochem Physiol, 37, 911–917.
Botha A, Kock J L F, Roux C, Coetzee D J & Botes P J (1995) An isolation medium for γ-linolenic acid producing mucoralean fungi. Syst Appl Microbiol, 18, 448-453.
Both A, Kock J L F Coetzee D J & Botes P J (1997) Physiological properties and fatty acid composition in Mucor cercinelloides f circinelloides. Antonie van leeuvenhoek 71, 201-207.
Botham P A & Ratledge C (1979) A biochemical explanation for lipid accumulation in Candida 107 and other oleaginous micro-organisms. J Gen Microbiol, 114, 361-375.
Brown J E (2005) A critical review of methods used to estimate γ-linoleic acid-delta-6 desaturase, exo vivo and in vivo. Eur J Lipid Sci Technol, 107, 119-134.
Brume M D, Parker V G, Alacemi M & Socici H (1992) Strain improvement of Claviceps purpurea by protoplast fusion without introducing auxotrophic markers. Appl Microbiol Biotechnol , 38-42.
Burdon K L (1964) Fatty material I bacteria and fungi revealed by staining dried, fixed slide preparation. J Bacteriol, 52, 665-578.
Burja A M, Aementa R E, Radianingtyas H Barrow C J (2007) Evaluation of fatty acid extraction methods for Thraustochytrium sp. ONC-T18. J Agric Food Chem, 55, 4795-4801.
PDF created with pdfFactory Pro trial version www.pdffactory.com

306
Calder P C (2001) Polyunsaturated fatty acids, inflammation, and immunity. Lipids, 36, 1007–1024.
Carter J P (1988) ϒ-Linolenic acid as a nutrient. Food Technol, 6, 72–82.
Carvalho P O, Oliveira J G & Pastore G M (1999) Enhancement of Gamma-Linolenic Acid production by the fungus Mucor sp LB-54 by growth temperature. Rev Microbiol, 30, 170-175.
Certik M, Sereke Berhan S & Sajbidor J (1993) Lipid production and fatty acid composition of selected strains belonging to Mucorales. Acta Biotechnol, 13, 193–196.
Certík M, Andrasi P & Sajbidor J (1996) Effect of extraction methods on lipid yield and fatty acid composition of lipid classes containing gamma-linolenic acid extracted from fungi. J Ame Oil Chem Soc, 73, 357-365.
Certik M, Balteszova L & Sajbidor J (1997) Lipid formation and gamma-linolenic acid production by Mucorales fungi grown on sunflower oil. Lett Appl Microbiol, 25, 101–105.
Certik M, Sakuradani E & Shimizu S (1998) Desaturase-defective fungal mutants:useful tools for the regulation and overproduction of polyunsaturated fatty acids. Trends Biotechnol, 16, 500–505.
Certik M & Shimizu S (1999) Biosynthesis and regulation of microbial polyunsaturated fatty acid production. J Biosci Bioeng, 87, 1–14.
Certik M, Megova J & Horenitzky R (1999) Effect of nitrogen sources on the activities of lipogenic enzymes in oleaginous fungus Cunninghamella echinulata. J Gen Appl Microbiol, 45, 289–293.
Certik M & Shimizu S (2000) Kinetic analysis of oil biosynthesis by an arachidonic acid-producing fungus, Mortierella alpina 1S-4. Appl Microbiol Biotechnol, 54, 224–230.
Certik M, Slavikova L, Masrnova S & Sajbidor J (2006) Enhancement of Nutritional Value of Cereals with γ-Linolenic Acid by Fungal Solid-State Fermentations. Food Technol Biotechnol, 44, 75–82.
Chadha B S, Gulati H K, Minhas M, Saini H S & Singh N (2004) Phytase production by thermophilic fungus Rhizomucor pusillus. World J Microbiol Biotechnol, 20, 105–109.
Chang C Y, Lue M Y & Pan T M (2006) Statistical optimization of medium components for the production of Antrodia cinnamomea AC0623. Appl Microbiol Biotech, 72, 654-661.
Chen H C & Chang C C (1996) Production of γ-linolenic acid by the fungus Cunninghamella echinulata CCRC31840. Biotechnol Prog, 12, 338-341.
Chen H C, Chang C C, & Chen C X (1997) Optimization of arachidonic acid production by Mortierella alpine Wuji-H14 isolate. J Am Oil Chem Soc, 74, 569-578.
Chen H C & Liu T M (1997) Inoculum effects on the production of γ-linolenic acid by the shake culture of Cunninghamella echinulata CCRC 31840. Enzyme Microb Technol, 21, 137–142.
PDF created with pdfFactory Pro trial version www.pdffactory.com

307
Chen Y, Eisner T D, Kattar M M, Barrett S L R, Lafe K, Bui U, Limaye A P & Cookson B T (2001) Polymorphic internal transcribed spacer region 1 DNA sequences identify medically important yeasts. J Clin Microbiol, 39, 4042–4051.
Cheng H M, Walker T H, Hulbert J G & Raman R D (1999) Fungal production of eicosapentaenoic and arachidonic acids from industrial waste streams and crude soybean oil. Biores Technol, 67, 101-110.
Choi S Y, Ryu D D W & Rhee J S (1982) Production of microbial lipid: Effects of growth rate and oxygen on lipid synthesis and fatty acid composition of Rhodotorula gracik. Biotechnol Boeing, 24, 1165-1172.
Cohen Z & Ratledge C in: Single Cell Oils, American Oil Chemists’ Society, Champaign, IL, USA, 2005
Conti E, Stredansky M, Stredansky S & Zanetti F (2001) Gamma-linolenic acid production by solid-state culture of Mucorales strains on cereals. Biores Technol, 76, 283–286.
Das T, Huang Y S & Mukerji P. δ6-desaturase and γ-linoleic acid biosynthesis: A biotechnology perspective In: gamma linolenic acid: recent advances in biotechnology and clinical application Eds. Y.S. Huang, V. A. Ziboh. AOCS press, 2001c, 6-23.
Das U N (2004) From bench to the clinic: [gamma]-linolenic acid therapy of human gliomas. Prostaglandins Leukot Essent Fatty Acids, 70, 539–552.
Das U N (2006) Essential fatty acids: biochemistry, physiology and pathology. Biotechnol J, 1, 420–439.
Das UN (2007) A defect in the activity of D6 and D5 desaturases may be a factor in the initiation and progression of atherosclerosis. Prostaglandins Leukot Essent Fatty Acids, 76, 251-268.
Da Silva T L, Pinheiro H M & Roseiro J C (2003) Stress-induced morphological and physiological changes in γ-linolenic acid production by Mucor fragilis in batch and continuous cultures. Enzyme Microb Technol, 32, 880–888.
Davies R J, Scale up of yeast technology; In Industrial Application of Single Cell Oils, kyle D J & Ratledge C. Eds. American oil Chemists Society, Champaign, IL, 1992 pp. 196-218.
Davies R J, Holdswoth J E & Reader S L (1990) The effect of low oxygen uptake rate on the fatty acid profile of the oleaginous yeast Apiotrichum curvatum. Appl Microbiol Biotechnol, 33, 569–573.
Demaison L & Moreau D (2002) Dietary ω-3 polyunsaturated fatty acids and coronary heart disease-related mortality: a possible mechanism of action. Cell Mol Life Sci, 59, 463–477.
Devem J M &. Manocha M S (1976) Effect of various cultural conditions on the fatty acid and lipid composition of Choanephora cucurbitarum. Can J Microbiol, 22, 443-449.
Domergue F, Abbadi A, Zahringer U, Moreau H, Heinz E (2005) In vivo-characterisation of the first acyl-CoAvDelta6-desaturase from the plant kingdom, the microalga Ostreococcus tauri. Biochem J, 389, 483–490.
PDF created with pdfFactory Pro trial version www.pdffactory.com

308
Dyal S D, Bouzidi L & Narine S (2005) Maximizing the production of γ-linolenic acid in Mortierella ramanniana var. ramanniana as a function of pH, temperature and carbon source, nitrogen source, metal ions and oil supplementation. Food Res Inter, 38, 815-829.
Dyal S D & Narine S (2005) Implications for the use of Mortierella fungi in the industrial production of essential fatty acids. Food Res Inter, 38, 445–467.
Dyaneshwar W, Kalpana J & Abhay H (2006) Polyunsaturated fatty acids: Biotechnology. Crit Rev Biotech, 26, 83-93.
Duncan DB (1955) Multiple range and multiple F- tests. Biometrics 11, 1-42.
du Preez J C, Immelman M & Kilian S G (1996) The utilization of short-chain monocarboxylic acids as carbon sources for the production of gamma-linolenic acid by Mucor strains in fed-batch culture. World J Microbiol Biotechol, 12, 68.
du Preez J C, Immelman M, Kock J L K & Kilian S G (1997) The effect of acetic acid concentration on the growth and production of gamma-linolenic acid by Mucor circinelloides CBS 203.28 in fed-batch culture. World J Microbiol Biotechol, 13, 81-86.
EI-Bondkly A M (2006) Gene transfer between different Trichoderma species and Aspergillus niger through intergeneric protoplast fusion to convert ground rice straw to citric acid and cellulases. Appl Biochem Biotechol, 135, 117-132.
El Bondkly A M & Talkhan F N (2007) Intra-strain crossing in Trichoderma harzianum via protoplast fusion to enhance chitinase productivity and bio control activity. Arab J Biotech, 10, 233-240.
Emelyanova E V (1996) γ-Linolenic acid production by Cunninghamella japonica in solid state fermentation. Process Biochem, 31, 431-434.
Emelyanova E V (1997) Lipid and γ-linolenic acid production by Mucor inaquisporus. Process Biochem, 32, 173- 177
Evans D A (1983) Agricultural application of protoplast fusion. Nature Biotechnol, 1, 253-261.
Evans C T, Scragg A H & Ratledge C (1983a). A comparative study of citrate efflux from mitochondria of oleaginous and non oleaginous yeasts. Eur J Biochem, 130, 195-204.
Evans C T & Ratledge C (1983b) Biochemical activities during lipid accumulation in Candida curvata. Lipids, 18, 630-635.
Evans & Ratledge (1984) Effect of nitrogen source on lipid accumulation in oleaginous yeasts. J Gen Microbiol, 47, 39-43.
Evans C T & Ratledge C (1985) Possible regulatory roles of ATP: citrate lyase, malic enzyme, and AMP deaminase in lipid accumulation by Rhodosporidium toruloides CBS 14. Can J Microbiol, 31, 1000-1005.
Fakas S, Papanikolaou S, Galiotou-Panayotou M, Komaitis M & Aggelis G (2006) Lipids of Cunninghamella echinulata with emphasis to γ-linolenic acid distribution among lipid classes. Appl Microbiol Biotech, 73, 676–683.
PDF created with pdfFactory Pro trial version www.pdffactory.com

309
Fakas S C, Certik M, Papanikolaou S, Aggelis G, Komaitis M & Galiotou-Panayotou M (2007a) γ-linolenic acid production by Cunninghamella echinulata growing on complex organic nitrogen sources. Bioresour Technol, 99, 5986–5990.
Fakas S, Galiotou-Panayotou M, Papanikolaou S, Komaitis M & Aggelis G (2007b) Compositional shifts in lipid fractions during lipid turnover in Cunninghamella echinulata. Enzyme Microb Technol, 40, 1321–1327.
Fakas S, Papanikolaou S, Galiotou-Panayotou M, Komaitis M & Aggelis G (2008) Organic nitrogen of tomato waste hydrolysate enhances glucose uptake and lipid accumulation in Cunninghamella echinulata. J Appl Microbiol, 105, 1062–1070.
Fakas S, Papanikolaoua S, Batsosa A, Panayotoua M G, Mallouchosa A, Aggelis G (2009a) Evaluating renewable carbon sources as substrates for single cell oil production by Cunninghamella echinulata and Mortierella isabellina. Biomass & Bioenergy, 33, 573-580.
Fakas S, Makri A, Mavromati M, Tselepi M & Aggelis G (2009b) Fatty acid composition in lipid fractions length wise the mycelium of Mortierella isabellina and lipid production by solid state fermentation. Bioresource Technol, 100, 6118-6120.
Fan Y Y & Chapkin R S (1998) Importance of dietary g-linolenic acid in human health and nutrition. J Nutr, 128, 1411–1414.
Favati F, King J W & Mazzanti M (1991) Supercritical carbon dioxide extraction of Primrose oil. J Am Oil Chem Soc, 68, 422–427.
Finnerty W R & Makula P A (1975) Microbial lipid metabolism. Crit Rev Microbiol, 4, 1–40.
Fliegerova K, Hodrova B & Voigt K (2004) Classical and molecular approaches as a powerful tool for characterization of rumen polycentric fungi. Folia Microbiol, 49, 157–164.
Flider F J (2005) GLA: Uses and new sources. Inform, 16, 279-282.
Folch J, Lees M & Sloane-Stanley G (1957) A simple method for the isolation and purification of total lipids from animal tissues. J Biol Chem, 199, 833–841.
Fredricks D N, Smith C & Meier A (2005) Comparison of Six DNA Extraction Methods for Recovery of Fungal DNA as Assessed by Quantitative PCR. J Clin Microbiol, 43, 5122–5128.
Funtikova N S & Mysyakina I S (1997) Synthesis of γ-linonenic acid by mucaraceous fungi utilizing exogenous fatty acids. Microbiol, 66, 76–79.
Funtikova N S, Mysyakina I S & Konova I V (2002) Synthesis of biologically Active Lipids by the Fungus Mucor lusitanicus 306D Grown on Media with Various Composition. Appl Biochem Microbiol, 38, 553–557.
Gamma Linolenic acid-GLA-Mongraph. Alternative Med Rev, March 2004. Health Care Industry.
Gema H, Kavadia A, Dimou D, Tsagou V, Komaitis M & Aggelis G (2002) Production of γ-linolenic acid by Cunninghamella echinulata cultivated on glucose and orange peel. Appl Microbiol Biotechnol, 58, 303–307.
PDF created with pdfFactory Pro trial version www.pdffactory.com
310
Gil A (2002) Polyunsaturated fatty acids and inflammatory diseases. Biomed Pharmacother, 56, 388–396.
Gill C O, Hall M J & ratledge C (1977) Lipid accumulation in an oleaginous yeast (Candida 107), growing on glucose in single cell -stage continuous culture. Appl Environ Microbiol, 32, 231-239.
Gill I & Valivety R (1997) Polyunsaturated fatty acids, part 1: Occurrence, biological activities and applications. Trends Biotechnol, 15, 401-409.
Gilman C J: Manual Soil Fungi. Biotech Books, Delhi (India). 1998
Goodwin D C & Lee S B (1993) Rapid, microwave mini-prep of total genomic DNA from fungi, plants, protists and animals for PCR. Biotechniques, 15, 438–444.
Gosselin Y, Lognay G, & Thonart P (1989) Improvement of fed-batch mass culture for gamma-linolenic biosynthesis by Tefrahyenu rostrufa (protozoa). Biotechnol Lett, 11, 423-426.
Graham G C, Mayers P & Henry R J (1994) A simplified method for the preparation of fungal genomic DNA for PCR and RAPD analysis. Biotechniques, 16, 48–50.
Graham I A, Cirpus P, Rein D & Napier J A (2004) The use of very long chain polyunsaturated fatty acids to ameliorate metabolic syndrome: transgenic plants as an alternative sustainable source to fish oils. Nutr Bulletin, 29, 228–233.
Guil-Guerrero J L, Go´mez-Mercado F, Garcı´a-Maroto F & Campra-Madrid P (2000) Occurrence and characterization of oils rich in γ-linolenic acid (I): Echium seeds from Macaronesia. Phytochem, 53, 451-456.
Guil-Guerrero J L, Go´mez-Mercado F, Rodrı´guez-Garcı´a I, Campra-Madrid P & Garcı´a-Maroto F (2001a) Occurrence and characterization of oils rich in γ-linolenic acid (III): the taxonomical value of the fatty acids in Echium (Boraginaceae). Phytochem, 58, 117-120.
Guil-Guerrero J L, Garcı´a-Maroto F F & Gime´nez-Gime´nez A (2001b) Fatty acids profiles in organs from forty-nine plant species that are potential new sources of γ-linolenic acid. J Am Oil Chem Soc, 78, 677-/684.
Gunashree B S (2006) Ph.D Thesis, University of Mysore, Mysore, India.
Gunstone F D (1992) Gamma linolenic acid. Occurrence and physical and chemical properties. Prog Lipid Res, 31, 145-/161.
Gunstone F D (1998) Movements towards tailor-made fats. Prog Lipid Res, 37, 277–305.
Hammond & Glatz (1988) Extraction and analysis of single cell oils. In Single Cell Oil ed. Moreton R S. pp. 147–165. Harlow: Longmans Scientific & Technical. New York
Hang Y D & Woodams E E (1987) Effect of substrate moisture content on fungal production of citric acid in a solid state fermentation system. Biotechnol Lett, 9, 183-186.
Hansson L & Dostalek M (1988) Effect of culture conditions on mycelial growth and production of γ- linolenic acid by the fungus Mortierella ramanniana. Appl Microbiol Biotechnol, 28, 240–246.
PDF created with pdfFactory Pro trial version www.pdffactory.com

311
Hansson L, Dostalek M & Sorenby B (1989) Production of γ-linolenic acid by the fungus Mucor rouxii in fed-batch and continuous culture. Appl Microbiol Biotechnol, 31, 223–227
Harbige L S (2003) Fatty acid, the immune response, and autoimmunity: a question of n-6 essentiality and the balance between n-6 and n-3. Lipids, 38, 323–341
Hastings N, Agaba M, Tocher D R, Leaver M J, Dick J R, Sargent J R, Teale A J (2001) A vertebrate fatty acid desaturase with ∆5 and ∆6 activities. Proc Nat Acad Sci, 98, 14304–14309.
Haugland R A, Heckman J L & Wymer L J (1999) Evaluation of different methods for the extraction of DNA from fungal conidia by quantitative competitive PCR analysis. J Microbiol Methods, 37, 165–176.
Hedge J E & Hofreiter B T (1962) In: Carbohydrate Chemistry 17 Ed: Whiltler R L & Be Miller J N, Academic Press New York.
Higashiyama K, Yaguchi T, Akimoto K, Fujikawa S & Shimizu S (1998) Effects of mineral addition on the growth morphology and arachidonic acid production by Mortierella alpina 1S-4. J Am Oil Chem Soc, 75, 1815-1819
Higashiyama K, Murakami K, Tsujimura H, Matsumoto N & Fujikawa S (1999) Effect of dissolved oxygen on the morphology of an arachidonic acid production by Mortirella alpina 1S-4. Biotechnol bioeng, 63, 442-448.
Hirano M, Mori H, Miura Y, Matsunaga N, Nakamura N & Matsunaga T (1990) Gamma-linolenic acid production by microalgae. Appl Biochem Biotechnol, 24-25, l83- 191
Hiruta O, Futamura T, Takebe H, Satoh A, Kamisaka Y, Yokochi T, Nakahara T & Suzuki O (1996) Optimization and scale-up of γ-linolenic acid production by Mortierella ramanniana MM15-1, a high γ-linolenic acid producing mutant. J Ferment Bioeng, 82, 366–370.
Hiruta O, Yamamura K, Takebe H, Futamura T, Linum K & Tanka H (1997) Application of Macbled fermentor for microbial processes. J Ferment Bioeng, 83, 79-86.
Ho S Y, Jiang Y & Chen S (2007) PUFAs Contents of the fungus M. alpina isolated from soil. J Agric Food Chem, 55, 3960-3966.
Ho S Y & Chen F (2008) Genetic characterization of Mortierella alpina by sequencing the 18S-28S ribosomal gene internal transcribed spacer region. Lett Appl Microbiol, 47, 250-255.
Holdsworth J E, Veenhuis M & Ratledge C (1988a) Enzyme activities in oleaginous yeasts accumulating and utilizing exogenous or endogenous lipids. J Gen Microbiol, 134, 2907–2915.
Holdsworth J E & Ratledge C (1988b) Lipid turnover in oleaginous yeasts. J Gen Microbiol, 134, 339–346.
Holiday, R (1956) Nature , 178, 987.
Holker U, Hofer M & Lenz J (2004) Biotechnological advantages of laboratory-scale solid-state fermentation with fungi. Appl Microbiol Biotechnol, 64, 175-186.
PDF created with pdfFactory Pro trial version www.pdffactory.com

312
Holker U & Lenz J (2005) Solid-state fermentation-are there any biotechnological. Curr Opin Microbiol, 8, 301-306.
Hong H, Datla N, Reed D W, Covello P S, Mackenzie S L & Qiu X (2002) High-level production of gamma-linolenic acid in Brassica juncea using a Delta-6 desaturase from Pythium irregulare. Plant Physiol, 129, 354-362.
Hong L Y, Bo L, Bao Z Z & Wu B F (2006) Optimization of Culture Conditions for Lipid Production by Rhodosporidium toruloides. Chinese J Biotechnol, 4, 650–656.
Horrobin D F (1992) Nutritional and medical importance of g-linolenic acid. Prog Lipid Res, 31, 163-194.
Horrobin D F (1993) Fatty acid metabolism in health and disease: the role of ∆-6 desaturase. Am J Clin Nutr, 57, 732S-737S.
Horrobin D F (2000) Essential fatty acids metabolism and its modification in atopic eczema. Am J Clin Nutr, 71, 367S-372S
Hudson B J F (1984) Evening primrose (Oenothera spp.) oil and seed. J Am Oil Chem Soc, 61, 540–543.
Huang Y S, Manku M S & Horrobin D F (1984) The effect of dietary cholesterol on blood and liver polyunsaturated and on plasma cholesterol in rats fed various types of fatty acid diets. Lipids. 19, 664-672.
Huang Y S & Milles D E (1996) Gamma-Linolenic Acid:Metabolism and Its Roles in Nutrition and Medicine. Champaign IL: AOCS.
Huang Y S, Chaudhary J M & Thumond J M, Bobik E G, Jr. Yuan L, Chan G M & Kircher (1999) Cloning of ∆12 and ∆6 desaturases from Mortierella alpine and recombinant production of gamma linolenic acid in Saccharomyces cerevisiae. Lipids, 34, 649-659.
Huang Y S & Ziboh A (2001) Gamma-Linolenic Acid:Recent Advances in Biotechnology and Clinical Applications. Champaign IL: AOCS.
Huang S, Pereira S L & Leonard L E (2004) Enzymes for transgenic biosynthesis of long-chain polyunsaturated fatty acids. Biochimie, 86, 793–798.
Innis S M (1991) Essential fatty acids in growth and development. Prog Lipid Res, 30, 39–103.
Innis S M, Nelson C M, Rioux M F & King D J (1994) Development of visual acuity in relation to plasma and erythrocyte w-6 and w-3 fatty acids in healthy term gestation infants. Am J Clin Nutr, 60, 347–352.
Immelman M, Du Preez J C & Kilian S G (1997) Effect of C:N ratio on gamma-linolenic acid production by Mucor circinelloides grown on acetic acid. System Appl Microbiol, 20, 158–164.
Iwen P C, Hinrichs S H & Rupp M E (2002) Utilization of the internal transcribed spacer regions as molecular targets to detect and identify human fungal pathogens. Med Mycol, 40, 87–109.
PDF created with pdfFactory Pro trial version www.pdffactory.com

313
Iwen P C, Freifeld A G, Sigler L & Tarantolo S R (2005) Molecular Identification of Rhizomucor pusillus as a Cause of Sinus-Orbital Zygomycosis in a Patient with Acute Myelogenous Leukemia. J Clin Microbiol, 43, 5819–5821.
Iwen P C, Sigler L, Noel R K & Freifeld A G (2007) Mucor circinelloides Was Identified by Molecular Methods as a Cause of Primary Cutaneous Zygomycosis. J Clin Microbiol, 45, 636–640.
James M J, Gibson R A & Cleland L G (2000) Dietary polyunsaturated fatty acids and inflammatory mediator production, Ame J Clin Nutr, 71, 343S–348S.
Jang H D, Lin Y Y, Yang S S (2000) Polyunsaturated fatty acid production with Mortierella alpina by solid substrate fermentation. Bot Bull Acad Sinica, 41, 41-48.
Jang H D, Lin Y Y & Yang S S (2005) Effect of culture media and conditions on polyunsaturated fatty acids production by Mortirella alpina. Bioresour Technol, 96, 1633-1644.
Jang H D & Yang S S (2008) Polyunsaturated fatty acids production with a solid-state column reactor. Biores Technol, 6181-6189
Jangbua P, Laoteng K, Kitsubun P, Nopharatana M & Tongta A (2009) Gamma-linolenic acid production of Mucor rouxii by solid-state fermentation using agricultural by-products. Lett Appl Microbiol, 49, 91-97.
Jareokitmongkol S, Sakuradani E & Yamada H (1993a) A novel desaturase mutants of Mortierella alpina IS-4 and its dihomo- -linolenic acid productivity. Appl Environ Microbiol, 59, 4300-4303.
Jareokitmongkol S, Shimizu S & Yamada H (1993b) Production of an eicosapentaenoic acid-containing oil by a ∆12 desaturase defective mutant of Mortierella alpina 1S-4. J Am Oil Chem Soc, 70, 119–123.
Jeennor S, Laoteng K, Jeennor S, Laoteng K, Tanticharoen M & Cheevadhanarak S (2008) Evaluation of inoculum performance for enhancing gamma-linolenic acid production from Mucor rouxii. Lett Appl Microbiol, 46, 421–427.
Jiang H & Gao K (2004) Effect of lowering temperature during culture on the production of polyunsaturated fatty acids in the marine diatom Phaeodactylum trieornutum (Bacillariophyceae). J Phycol, 40, 651-654.
Johnson M M, Swan D D, Surette M E, Stegner J, Chilton T, Fonteh A N & Chilton F H (1997) Dietary supplementation with gamma-linolenic acid alters fatty acid content and eicosanoid production in healthy humans. J. Nutr, 127, 1435-1444.
Kamisaka Y, Yokochi T, Nakahara T & Suzuki O (1990) Incorporation of linoleic acid and its conversion to γ-linolenic acid in fungi. Lipids, 25, 54–60.
Kang H S & Shin H D (1989) Influence of medium composition on the production of γ-linolenic acid by Mucor sp KCTC 8405P. Kor J Appl Microbiol Bioeng, 17, 568-573.
Kates M & Baxter M (1962) Lipid composition of mesophilic and psychrophilic yeasts (candid species) as influenced by environmental temperatures. Can J Biochem Physiol, 40, 1213-1227.
PDF created with pdfFactory Pro trial version www.pdffactory.com
314
Kates M (1964) Bacterial lipids. Advan Lipid Res, 2, 17-90.
Kavadia A, Komaitis M, Chevalot I, Blanchard F, Marc I & Aggelis G (2001) Lipid and γ-linolenic acid accumulation in strains of Zygomycetes growing on glucose. J Ame Oil Chem Soc, 78, 341–346.
Kendrick A & Ratledge C (1992a) Lipids of selected moulds grown for production of n-3 and n-6 polyunsaturated acids. Lipids, 27, 15–20.
Kendrick A & Ratledge C (1992b) Lipid formation in the oleaginous mould Entomophthora exitalis grown in continuous culture: effects of growth rate, temperature, and dissolved oxygen tension on polyunsaturated fatty acids. Appl Microbiol Biotechnol, 37, 18-22.
Kendrick A & Ratledge C (1992c) Desaturation of polyunsaturated fatty acids in Mucor cercinelloides and the involvement of a novel membrane bound malic enzyme. Eur J Biochem, 209, 667-673.
Kendrick A & Ratledge C (1996) Cessation of polyunsaturated fatty acid formation in four selected filamentous fungi when grown on plant oils. J Am Oil Chem Soc, 473, 431–435.
Kenny F, Pinder S, Ellis I, Gee J, Nicholson R, Bryce R & Robertson J. (2000) Gamma linolenic acid with tamoxifen as primary therapy in breast cancer. Int J Cancer, 85, 643–648.
Kennedy M J, Reader S L & Davies R J (1993) Production, characterization of fungi with particular emphasis on gamma linolenic acid production. Biotech Bioeng, 42, 625-634.
Kilo H, Abe A, Sujaya I N, Oda Y, Asano K & Sone T (2009) Molecular characterization of the relationships among Amylomyces rouxii, Rhizopus oryzae, and Rhizopus delemar. Biosci Biotechnol Biochem, 73, 861-864
Kirimura K, Nakajima J, Lee S P, Kawabe S, Usami S (1988) Citric acid production by the diploid strains of Aspergillus niger obtained by protoplast fusion. Appl Microbiol Biotechnol, 27, 504-506.
Khoomrung S, Laoteng K, Jitsue S & Cheevadhanarak S (2008) Significance of fatty acid supplementation on profiles of cell growth, fatty acid and gene expression of three desaturases in Mucor rouxii. Appl Microbiol Biotechnol, 80, 499–506.
Khunyoshyeng S, Cheevadhanarak S, Rachdawong S & Tanticharoen M (2002) Differential expression of desaturases and changes in fatty acid composition during sporangiospore germination and development in Mucor rouxii. Fungal Genet Biol, 37, 13–21.
Khuri A I & Cornell J A (1989) Response surfaces: Designs and analysis. Marcel Dekker, NY.
Kock J L F & Botha A (1993) Acetic acid – a novel source for the production of gamma-linolenic acid and cocoa butter equivalents. South Afr J Sci, 89, 465-471.
Koike Y, Jie Cai H, Higashiyama K, Fujikawa S & Park E Y (2001) Effect of consumed carbon to nitrogen ratio of mycelial morphology and arachidonic acid production in cultures of Mortierella alpina. J Biosci Bioeng, 91, 382–389.
Komaitis A, Chevalot M, Blanchard I, Marc F & Aggelis G (2001) Lipid and gamma-linolenic acid accumulation in strains of Zygomycetes growing on glucose. J Am Oil Chem Soc, 78, 341–346.
PDF created with pdfFactory Pro trial version www.pdffactory.com

315
Kristofikova L, Rosenberg M, Vlnova A, Sajbidor J & Certik M (1991) Selection of Rhizopus strains for L(+)-lactic acid and gamma linolenic acid production. Folia Microbiol, 36, 451–455.
Kumar S, Tamur K & Nei M (2004) MEGA3: Integrated software for molecular evolutionary genetic analysis and sequence alignment. Brief Bioinform, 5, 150-163.
Kwasna H, Ward E & Bateman G L (2006) Phylogenetic relationships among Zygomycetes from soil based on ITS1/2 rDNA sequences. Mycological Res, 110, 501–510.
Kyle D J, Sicotte V J, Singer J J & Reeb S E (1992) Bioproduction of docosahexaenoic acid (DHA) by microalgae. In: Industrial Applications of Single Cell Oils. Kyle D J & Ratledge C (Eds.), AOCS Press, IL, pp. 287–300.
Lamacka M, Sajbidor J & Bohov P (1998) Lipid isolation and fatty acid analysis in Saccharomyces cerevisiae. Comparison of different methods. Biotechnol Techniq, 12, 621–625.
Laoteng K, Anjard C, Rachadawong S, Tanticharoen M, Maresca B & Cheevadhanarak S (1999) Mucor rouxii D9-desaturase gene is transcriptionally regulated during cell growth and by low temperature. Mol Cell Biol Res Commun, 1, 36–43.
Laoteng K, Mannontarat R, Tanticharoen M & Cheevadhanarak S (2000) ∆6 -desaturase gene of Mucor rouxii with high similarity to plant ∆6-desaturase and its heterologous expression in Saccharomyces cerevisiae. Biochem Biophys Res Commun, 279, 17-22.
Laoteng K, Pongchuachidthai R, Rueksomtawin K, Dandusitapunth Y, Tanticharoen M & Cheevadhanarak S (2003) A Mucor rouxii mutant with high accumulation of an unusual trans-linoleic acid (9c,12t-C18:2). FEMS Microbiol Let,t 223, 159–165.
Laoteng K, Ruenwai R, Tanticharoen M & Cheevadhanarak S (2005a) Genetic modification of essential fatty acids biosythesis in Hansenula polymorpha. FEMS Microbiol Lett, 245, 169-178.
Laoteng, K, Cheevadhanarak S, Tanticharoen M & Maresca B (2005b) Promoter analysis of Mucor rouxii ? ∆9 -desaturase: Its implication for transcriptional regulation in Saccharomyces cerevisiae. Biochem Biophys Res Commun, 335, 400-405
Lehninger Priniciple of Biochemistry, Ed Nelson D L & Cox M M Fouth edition (1993).
Leman J & Brakoniecka-Sikorska A (1996) Effect of growth conditions on biosynthesis of oil by Mortierella ramanniana. Polish J Food Nutr Sci, 5, 111–120.
Leman J (1997) Oleaginous Microorganisms: An assessment of the potential, Adv Appl Microbiol, 43, 195-244.
Leng G C, Lee A J, Fowkes F G, Jepson R G, Lowe G D, Skinner E R, Mowat B F (1998) Randomized controlled trial of gamma-linolenic acid and eicosapentaenoic acid in peripheral arterial disease. Clin Nutr, 17, 265-71.
Leonard A E, Pereira S L, Sprecher H & Huang Y S (2004) Elongation of long-chain fatty acids. Prog Lipid Res, 43, 36–54.
PDF created with pdfFactory Pro trial version www.pdffactory.com

316
Lepage G & Roy C C (1984) Improved recovery of fatty acid through direct transesterification without prior extraction or purification. J Lipid Res, 25, 1391–1396.
Leventhal L J, Boyce E G & Zurier R B (1994) Treatment of rheumatoid arthritis with blackcurrant seed oil. Br J Rheumatol. 33, 847–852.
Lewis T, Nichols P D & Mc Meekin T A (2000) Evaluation of extraction methods for recovery of fatty acids from lipid-producing microheterotrophs. J Microbiol Meth, 43, 107–116.
Li N, Deng Z N, Qin Y L, Chen C L & Liang Z Q (2008) Production of Polyunsaturated fatty acids by Mucor recurvus sp. with Sugarcane Molasses as the carbon source. Food Technol Biotechnol, 46, 73-79.
Li Y H, Liu B, Zhao Z B & Bai F W (2006) Optimized culture medium and fermentation conditions for lipid production by Rhodosporidium toruloides. Chinese J Biotechnol, 22, 650–656.
Lin S S, Dou W F, Xu H Y, Li H Z, Xu Z H & Ma Y H (2007) Optimization of medium composition for the production of alkaline β-mannanase by alkaliphilic Bacillus sp. N16-5 using response surface methodology. Appl Microbiol Biotechnol, 75, 1015-1022.
Lindberg A M & Hansson L (1991) Production of gamma linolenic acid by the fungus Mucor rouxii on cheap nitrogen and carbon sources. Appl Microbiol Biotechnol, 36, 26–28.
Lindberg A M & Molin G (1993) Effect of temperature and glucose supply on the production of polyunsaturated fatty acids by the fungus Mortierella alpina CBS343.66 in fermentor culture. Appl Microbiol Biotechnol, 39, 450-455.
Linder M, Kochanowski N, Fanni J & Parmentier M (2005) Response surface optimization of lipase catalyzed esterification of glycerol and n-3 polyunsaturated fatty acids from salmon oil. Process Biochem, 40, 273-279.
Liu J W, De Michelle S J, Palombo J, Chuang LT, Hastilow C, Bobik E J & Huang YS (2004) Effect of long-term dietary supplementation of high- g -linolenic canola oil versus borage oil on growth, hematology, serum biochemistry, and n-6 fatty acid metabolism in rats. J Agric Food Chem. 52, 3960–3966.
Lopez A D & Garcia M G (2000) Plants as ‘chemical factories’ for the production of polyunsaturated fatty acids. Biotechnol Adv, 18, 481–497.
Lopez-Martínez J C, Campra-Madrid P, Rincon-Cervera M A & Guil-Guerrero J L (2005) Ecological and simultaneous seed oil extraction/saponification/γ-linolenic acid concentration. Eur J Lipid Sci Technol, 107, 180–186.
Lunn J & Theobald H E (2006) The health effects of dietary unsaturated fatty acids. Nutr Bulletin, 31, 178–224
Maaroufi Y, Ahariz M, Husson M & Crokaert F (2004) Comparison of different methods of isolation of DNA of commonly encountered Candida species and its quantitation by using a real-time PCR-based assay. J Clin Microbiol, 42, 3159–3163.
Mamatha S S, Ravi R & Venkateswaran G (2008) Medium Optimization of Gamma Linolenic Acid Production in Mucor rouxii CFR -G15 using RSM. Food Bioprocess Techno,l 1, 405–409.
PDF created with pdfFactory Pro trial version www.pdffactory.com

317
Manpreet S, Sawraj S, Sachin D, Pankaj S & Banerjee U C (2005) Influence of Process Parameters on the Production of Metabolites in Solid-State Fermentation. Mal J Microbiol, 1, 1-9.
Mendes R L, Nobre B P, Cardoso M T, Pereira A P & Palavra A F (2003) Supercritical carbon dioxide extraction of compounds with pharmaceutical importance from microalgae. Inorganica Chimica Acta, 356, 328-334
Mendes R L, Reis A D & Palavra A N F (2006) Supercritical CO2 extraction of γ-linolenic acid and other lipids from Arthrospira (Spirulina) maxima: Comparison with organic solvent extraction. Food Chem, 99, 57–63.
Metz B & Kossen N W F (1977) The growth of molds in the form of pellets. Biotechol Bioeng, 19, 781-799.
Metz J G, Roessler P, Facciotti D, Levering C, Dittrich F, Lassner M, Valentine R, Lardizabal K, Domergue F, Yamada A, Yazawa K, Knauf V, & Browse J (2001) Production of polyunsaturated fatty acids by polyketide synthases in both prokaryotes and eukaryotes. Science, 293, 290–293.
Michinika Y, Aki T, Shimachi-Nakajima T, Kawamoto S, Shigeta S O, Suzuki & Ono K (2003) Differential response to low temperature of two ∆6 desaturase from M. cercinelloides. Appl Microbiol Biotechnol, 62, 362-368.
Miller G L (1959) Use of dinitro salicylic acid reagent for determination of reducing sugar. Anal Chem, 31, 426-428.
Moller, Bahnweg, Sandermann & Geiger (1992) DNA extraction method in fungi. Nucleic Acids Res, 20, 6115-16.
Montgomery D C (1984) Response surface methodology. In: Design and analysis of experiments (2nd edn), John Wiley, NY.
Montgomery D C (1997) Response surface methods and other approaches to process optimization. In: Design and analysis of experiments, John Wiley, NY, 427-510.
Morakotkarn D, Kawasaki H & Seki T (2007) Molecular diversity of bamboo-associated fungi isolated from Japan. FEMS Microbiol Lett, 266, 10–19.
Moore D (1969) The mutagenic action of N-methyl-N’-nitro-Nnitrosoguanidine on Coprinus lagopus. J Gen Microbiol, 55, 121-125.
Moreton R S (1988) Physiology of lipid accumulation. In Single Cell Oil ed. Moreton R S. pp. 11–27. Harlow: Longmans Scientific & Technical. New York.
Muhid F, Navi W N W N, Kader A J A, Yosyff W M W & Haamid A A (2008) Effects of metal ion concentration on lipid and gamma linolenic acid production by cunninghamella sp. 2A1. OnLine J Biological Sci, 8, 2008.
Mukherjee K D (1999) Production and use of microbial oils. Inform, 10, 308–313.
Muller F M, Werner K E, Kasai M, Francesconi A, Chanock S J & Walsh T J (1998) Rapid extraction of genomic DNA from medically important yeasts and filamentous fungi by high-speed cell disruption. J Clin Microbiol, 36, 1625–1629.
PDF created with pdfFactory Pro trial version www.pdffactory.com

318
Murlidhar R V & Panda T (2000) Fungal protoplast fusion : A revisit. Bioprocess Biosyst Engg, 22, 429-431.
Murphy D (1991) Storage lipid bodies in plants and other organisms. Prog Lipid Res, 29, 299–324.
Myers R H (1971) Response Surface Methodology. Allyn and Bacon, Boston M A.
Myers R H & Montgomery D C (2002) Response surface methodology: process and product optimization using designed experiments. John Wiley, NY.
Mysyakina I S & Funtikova N S (2003) Changes in the lipid composition of Mucor hiemalis sporangiospores related to the age of the spore-forming culture. Microbiol, 72, 461–465.
Nakahara T, Yokochi T, Kamisaka Y, & Suzuki O. Gamma-linolenic acid from genus Mortierella. In: Industrial applications of single cell oils. Champaign, IL, American Oil Chemists Society Press, 2002, 61–97.
Nakahara T, Yokochi T, Kamisaka Y & Suzuki O (1993) Physiological effects of gamma-linolenic acid and its production by fungal cultivation. J Jp Oil Chem Soc, 42, 242-253.
Napier J A, Sayanova O , Stobart A K & Shewry P R (1997) A new class of cytochrome b5 fusion proteins. Biochem J, 328, 717–718.
Napier J A, Hey S J, Lacey D J & Shewry S R (1998) Identification of Caenorhabditis elegans D6-fatty-acid desaturase by heterologous expression in Saccharomyces cerevisiae. Biochem J, 330, 611–614.
Napier J A, Michaelson L V & Stobart A K (1999) Plant desaturases: harvesting the fat of the land. Curr Opin Plant Biol, 2, 123–7.
Napier J A (2002) Plumbing the depths of PUFA biosynthesis: A novel polyketide synthase-like pathway from marine organisms. Trends Plant Sci, 7, 51-54.
Napier J A, Michaelson L V & Sayanova O (2003) The role of cytochrome b5 fusion desaturases in the synthesis of polyunsaturated fatty acids. Prostaglandins Leukot Essent Fatty Acids, 68, 135–143.
Napier J A, Beaudoin F, Michaelson L V & Sayanova O (2004) The production of long chain polyunsaturated fatty acids in transgenic plants by reverse-engineering. Biochimie, 86, 785–792.
Napier J A, Beaudoin F & Sayanova O (2005) Reverse engineering of long-chain polyunsaturated fatty acid biosynthesis into transgenic plants. Eur J Lipid Sci Technol, 107, 249–255.
Na-Ranong S, Laoteng K, Kittakoop P, Tanticharoen M & Cheevadhanarak S (2005) Substrate specificity and preference of ? 6 -desaturase of Mucor rouxii. FEBS Lett, 579, 2744-2748.
Na-Ranong S, Laoteng K, Kittakoop P, Tanticharoen M & Cheevadhanarak S (2006) Targeted mutagenesis of a fatty acid delta-6 desaturase from Mucor rouxii: Role of amino acid residues adjacent to histidine-rich motif II. Biochem Biophys Res Commun, 339, 1029—1034.
PDF created with pdfFactory Pro trial version www.pdffactory.com

319
Narayanswamy S (1994) Plant cells and tissue cultures. Plant Protoplast:Isolation,Culture and Fusion. 391-469. TATA MCGraw Hill Publishing Company ,New Delhi,India.
Nigam P (1999) Fermentation (industrial); Production of Oils and Fatty Acids. Academic Press.
Ohlrogge J B & Jaworski J G (1997) Regulation of fatty acid biosynthesis. Annu Rev Plant Physiol Plant Mol Biol, 48, 109–36.
Orlowski M (1991) Mucor Dimorphism. Microbiol Rev, 5, 234–258.
Pandey A (1992) Recent process developments in solid state fermentations. Proc Biochem, 27, 109-117.
Pandey A, Selvakumar P, Nigam P & Soccol C R (1999) Solid-state fermentation for the production of industrial enzymes. Curr Sci, 77, 149–162.
Pandey A, Soccol C R & Mitchell D A (2000) New developments in solid-state fermentation I—bioprocesses and products. Proc Biochem, 35, 1153- 1169.
Pandey A, Soccol C R, Rodriguez-Leon J A & Nigam P (2001). Solid-state Fermentation in Biotechnology. Asiatech Publishers Inc., New Delhi, p. 221.
Pandey A (2003) Solid-state fermentation. Biochem eng, 13, 81-84.
Papanikolaou S, Chevalot I, Komaitis M, Aggelis G & Marc I (2001) Kinetic profile of the cellular lipid composition in an oleaginous Yarrowia lipolytica capable of producing a cocoa-butter substitute from industrial fats. Antonie Van Leeuwenhoek, 80, 215–224.
Papanikolaou S, Chevalot I, Komaitis M, Marc I & Aggelis G (2002a) Single cell oil production (SCO) production by Yarrowia lipolytica growing on an industrial derivative of animal fat in batch cultures. Appl Microbiol Biotechnol, 58, 308–312.
Papanikolaou S & Aggelis G (2002b) Lipid production by Yarrowia lipolytica growing on industrial glycerol in a single-stage continuous culture. Bioresour Technol, 82, 43–49.
Papanikolaou S & Aggelis G (2003a) Modeling lipid accumulation and degradation in Yarrowia lipolytica cultivated on industrial fats. Curr Microbiol, 46, 398–402.
Papanikolaou S & Aggelis G (2003b) Selective uptake of fatty acids by the yeast Yarrowia lipolytica. Eur J Lipid Sci Technol, 105, 651–655.
Papanikolaou S, Komaitis N & Aggelis G (2004a) Single cell oil (SCO) production by Mortierella isabellina grown on high sugar content media. Bioresour Technol, 95, 287–291.
Papanikolaou S, Sarantou S, Komaitis M & Aggelis G (2004b) Repression of reserve lipid turnover in Cunninghamella echinulata and Mortierella isabellina cultivated in multiple limited media. J Appl Microbiol, 97, 867–874.
Papanikolaou S, Galiotou-Panayotou M, Fakas S, Komaitis M & Aggelis G (2007) Lipid production by oleaginous Mucorales cultivated on renewable carbon sources. Eur J Lipid Sci Technol, 109, 1060–1070.
Papanikolaou S, Fakas S, Fick M, Chevalot I, Galiotou-Panayotou M, Komaitis M, Marc I & Aggelis G (2008) Biotechnological valorisation of raw glycerol discharged after
PDF created with pdfFactory Pro trial version www.pdffactory.com

320
bio-diesel (fatty acid methyl-esters) manufacturing process: production of 1,3-propanediol, citric acid and single cell oil. Biomass & Bioenerg, 32, 60–71.
Parekh S, Vinci V A & Strobel R J (2000) Improvement of microbial strains and fermentation processes. Appl Microbiol Biotechnol, 54, 287–301.
Park E Y, Koike Y, Higashiyama K, Fujikawa S & Okabe M (1999) Effect of nitrogen source on mycelial morphology and arachidonic acid production in cultures of Mortierella alpina. J Biosci Bioeng, 88, 61–67.
Passorn S, Laoteng K, Rachadawong S, Tanticharoen M & Cheevadhanarak S (1999) Heterologous expression of Mucor rouxii ∆12-desaturase gene in Saccharomyces cerevisiae. Biochem Biophys Res Commun, 263, 47-51.
Patnayak S & Sree A (2005) Screening of bacterial associates of marine sponges for single cell oil and PUFA. Let Appl Microbiol, 40, 358–363.
Peberdy J F (1979) Fungal protoplasts: Isolation, reversion and fusion. Ann Rev Microbiol, 33, 21-39.
Peberdy J F (1980) Protoplast fusion- a tool for genetic manipulation and breeding in industrial microorganisms. Enz Microbial Technol, 2, 23-29.
Pereira S L, Leonard A E & Mukerji P (2003) Recent advances in the study of fatty acid desaturases from animals and lower eukaryotes. Prostaglandins Leuk Essent Fatty Acids, 68, 97-106.
Prabavarthy V R,mathiavanan N, Sagadevan E, Murugesan K, Lalithakumari D (2006) Intrastrain protoplast fusion enhances carboxymethylcellulase activity in Trichodermma reesei. Enzyme Microbial Technol, 38, 719-723.
Prakash M Halami (2004) Ph.D Thesis, University of Mysore, Mysore, India.
Pohl C H, Botha A, Kock J L F, Coetzee D J & Botes P J (1997) The production of γ-linolenic acid by selected members of the Dikaryomycota grown on different carbon sources. Antonie van Leeuwenhoek, 72, 191-199.
Pullman-Mooar S, Laposata M, Leto D, Holman R, Leventhal LJ, DeMarco D & Zurier R B (1990) Alteration of the Cellular Fatty Acid Profile and the Production of Eicosanoids in Human Monocytes by Gamma-linolenic Acid'. Arthritis Rheum. 33, 1526-1531.
Puri B K (2007) The safety of evening primrose oil in epilepsy. Prostaglandins Leukot Essent Fatty Acids, 77, 101-103.
Qiu X, Hong H P, MacKenzie S L (2001) Identification of a ∆4 fatty acid desaturase from Thraustochytrium sp. Involved in biosynthesis of docosahexaenoic acid by heterologous expression in Saccharomyces cerevisiae and Brassica juncea. J Biol Chem, 276, 31561–31566.
Quihui H (1999) Supercritical carbon dioxide extraction of Spirulina platensis component and removing the stench. J Agri Food Chem, 47, 2705–2706.
Quoc P K & Duacq P J (1997) Effect of growth temperature on the biosynthesis of eukaryotic lipid molecular species by the cyanobacterium Spirulina platensis. Biochemica et Biophysica Acta, 1346, 237-246.
PDF created with pdfFactory Pro trial version www.pdffactory.com

321
Ratledge C (1987) Lipid biotechnology, a wonderland for the microbial physiologist. J Am Oil Chem Soc, 64,1647–1656.
Ratledge C (1988) Biochemistry, stoichiometry, substrates and economics. In Single Cell Oil ed. Moreton R S pp 33–70 Harlow: Longmans.
Ratledge C (1989) Microbial routes to lipids. Biochem Soc Trans. 17, 1139–41.
Ratledge C (1991) Microorganisms for lipids. Acta Biotechnol 11, 429–438.
Ratledge C (1992a) Microbial lipids: Commercial realities or academic curiosities. pp.1-15. In: Industrial Applications of Single Cell Oils, D J Kyle, & Ratledge C (eds.), AOCS Press, IL, USA.
Ratledge C (1992b) Tailor made oils and fats––possibilities for microbial oils. Rev Franaise des Corps Gras, 39, 325–332.
Ratledge C (2002) Regulation of lipid accumulation in oleaginous micro-organisms. Biochem Soc Trans, 30, 1047–1050.
Ratledge C & Wynn J P (2002) The biochemistry and molecular biology of lipid accumulation in oleaginous microorganisms. Adv Appl Microbiol, 51, 1–51.
Ratledge C (1993) Single cell oils-have they a biotechnological future?. Trends Biotechnol, 11, 278-284.
Ratledge C (2004) Fatty acid biosynthesis in microorganisms being used for single cell oil production. Biochimie, 86, 807-815.
Ravi R & Susheelamma N S (2005) Simultaneous optimization of a multi-response system by desirability function analysis of ‘Boondi’ making - a case study. J Food Sci, 70, S539-547.
Robinson H C (2001a) Cold adaptation in Arctic and Antarctic fungi. New Phytologist, 151, 341-353.
Robinson T, Singh D & Nigam P (2001b) Solid-state fermentation: a promising microbial technology for secondary metabolite production. Appl Microbiol Biotechnol, 55, 284-289.
Rodriguez R J, Belarbi E H, Sanchez J L G & Alonso D L (1998) Rapid simultaneous lipid extraction and transesterification for fatty acid analyses. Biotechnol Tech, 12, 689–691.
Rodrigues L, Teixeira J, Oliveira R & Van der Mai H C (2006) Response surface optimization of the medium components for the production of biosurfactants by probiotic bacteria. Proc Biochem, 41, 1-10.
Roux M P, Kock J L F, Botha A, Du Preez J C, Wells G V & Botes P J (1994) Mucor a source of cocoa butter and gamma-linolenic acid. World J Microbiol Biotechol, 10, 417-422.
Ruxton C H S, Reed S C, Sumpson M J A & Millington K J (2004) The health benefits of omega-3 Polyunsaturated fatty acids: a review of the evidence. J Hum Nutr Dietet, 17, 449-459.
Sajbidor J, Certik M & Dobronova S (1988) Influence of different carbon sources on growth, lipid content, and fatty acid composition in four strains belonging to Mucorales. Biotechnol Let, 10, 347–350.
PDF created with pdfFactory Pro trial version www.pdffactory.com

322
Sajbidor J, Dobronova S & Certik M (1990) Arachidonic acid production by Mortierella SP. S-17: influence of C/N ratio. Biotechnol Lett, 12, 455-456.
Sajbidor J, Kozelouiiova D & Certik M (1992) Influence of some metal ions on the lipid content and arachidonic acid production by Mortierella sp. Folia Microbiol, 37, 404–406.
Sajbidor J, Certik M & Grego J (1994) Lipid Analysis of Baker's Yeasts. J Chromatogr, 665, 191-195.
Sajilata M G, Singhal R S & Kamat M Y (2008) Supercritical CO2 extraction of γ-linolenic acid (GLA) from Spirulina platensis ARM 740 using response surface methodology. J Food Engineer, 84, 321–326.
Sakaki K, Yokochi T, Suzuki O & Hakuta T (1990). Supercritical fluid extraction of fungal oil using CO2, N2O, CHF3 and SF6. J Ame Oil Chem Soc, 67, 553–557.
Sakuradani E, Kobayashi M & Shimizu S (1999) δ6-Fatty acid desaturase from an arachidonic acid-producing Mortierella fungus. Gene cloning and its heterologous expression in a fungus, Aspergillus. Gene, 238, 445–453.
Sakuradani E & Shimizu S (2009) Single cell oil production by Mortierella alpine. J Biotechnol, 44, 31-36
Sambrook J & Russell D W (2001) Molecular cloning. A Laboratory Manual, 3rd Edition, Cold Spring Harbor Laboratory, Cold Spring Harbor, New York.
Sattur A (1989) Ph.D Thesis, University of Mysore, Mysore, India.
Sayanova O, Mark A S, Peter L, Stobart A K, Dobson G, William W C, Peter R S & Johnathan A N (1997) Expression of a Borage Desaturase cDNA Containing an N-Terminal Cytochrome b5 Domain Results in the Accumulation of High Levels of Δ6-Desaturated Fatty Acids in Transgenic Tobacco. Proc Natl Acad Sci, USA, 94, 4211–4216.
Sayanova O V, Beaudoin F, Michaelson L V, Shewry P R, Napier J A (2003) Identification of Primula fatty acid delta 6-desaturases with n-3 substrate preferences. FEBS Lett, 542, 100–104.
Schwarz P, Bretagne S, Gantier J C, Garcia-Hermoso D, Lortholary O, Dromer F & Dannaoui E (2006) Molecular identification of zygomycetes from culture and experimentally infected tissues. J Clin Microbiol, 44, 340–349.
Serrano I, Lopes da S T & Carlos R J (2001) Ethanol-induced dimorphism and lipid composition changes in Mucor fragilus CCMI 142. Lett Appl Microbiol, 33, 89–93.
Sharma A K, H Raj, A Pandita, V R Tandon & A Mahajan (2006) Gamma Linolenic Acid in Dry Eye. J K science, 8, 24-27.
Sharma M, Chadha B S, Kaur M, Ghatora S K & Saini H S (2008) Molecular characterization of multiple xylanase producing thermophilic /thermotolerant fungi isolated from composting materials. Lett Appl Microbiol, 46, 526–535.
Shasi K Menan (1989) Ph.D Thesis, University of Mysore, Mysore, India.
Shaw R (1965) The occurrence of gamma linolenic acid in fungi. Biochim Biophys Acta, 98, 230-237.
PDF created with pdfFactory Pro trial version www.pdffactory.com

323
Shaw R (1966a) The polyunsaturated fatty acids of microorganisms. Adv Lipid Res, 4, 107-174.
Shaw R (1966b) The fatty acids of phycomycete fungi, and the significance of the γ−linolenic acid component. Comp Biochem Physiol, 18, 325–331.
Shimizu S, Shinmen Y, Kawashima H, Akimoto K & Yamada H (1988) Fungal mycelia as a novel source of eicosapentaenoic acid: activation of enzyme(s) involved in eicosapentaenoic acid production at low temperature. Biochem Biophys Res Commun, 150, 335-341.
Shimizu S, Akimoto K, Shinmen Y, Kawashima H, Sugano M & Yamada H (1991) Sesamin is a potent and specific inhibitor of ∆5-desaturase in polyunsaturated fatty acid biosynthesis. Lipids, 26, 512–516.
Simpoulos A P (2002) The importance of the ratio of omega-6 ⁄ omega-3 essential fatty acids. Biomed Pharmacother, 56, 365–379.
Simonopoulos A P (1991) Omega-3 fatty acids in health and disease and in growth and development. Am J Clin Nutr , 54, 438–63.
Shinmen Y, Shimizu S, Akimoto K, Kawashima H & Yamada H (1989) Production of arachidonic acid by Mortierella fungi. Appl Microbiol Biotechnol, 31, 11–16.
Shinmen Y, Kawashima H , Shimizu S & Yamada H (1992) Concentration of eicosapentaenoic acid in arachidonic acid producing fungus. Mortierella alpine IS-4, grown with fish oil. Appl Microbiol Biotechnol, 38, 301-304.
Somashekar D, Venkateswaran G, Sambaiah K, Lokesh B R (2002) Effect of culture conditions on lipid and gamma linolenic acid production in mucoraceous fungi. Process Biochem , 38, 1719-1724.
Somashekar D, Venkateswaran G, Srividya C, Krishnanand, Sambaiah K & Lokesh B R (2003) Efficacy of lipid extraction methods for lipid and fatty acid composition from fungal cultures. World J Microbiol Biotechnol, 17, 317-320.
Spencer J F T & Spencer D M (1982) Hybridization studies in Yeast. Current Genetics, 8, 49-53.
Stahl P D & Klug M J (1996) Characterization and differentiation of filamentous fungi based on fatty acid composition. Appl Environ Microbiol, 62, 4136-4146.
Stredanska S & Sajbidor J (1993a) Influence of carbon and nitrogen sources on the lipid accumulation and arachidonic acid production by Mortierella alpina. Acta Biotechnologica, 13, 185–191.
Stredanska S, Slugen D, Stredansky M & Grego J (1993b) Arachidonic acid production by Mortierella alpina grown on solid substrates. World J Microbiol Biotechnol, 9, 511–513.
Stredansky M, Conti E & Salaris A (2000a) Production of polyunsaturated fatty acids by Pythium ultimum in solid-state cultivation. Enz Microbial Technol, 26, 304-307.
Stredansky M, Conti E, Stredanska S & Zanetti F (2000b) γ-linolenic acid production with Thamnidium elegans by solid-state fermentation on apple pomace. Biores Technol, 73, 41-45.
PDF created with pdfFactory Pro trial version www.pdffactory.com

324
Sumner J L & Morgan E D (1969a) The fatty acid composition of sporangiospores and vegetative mycelium of temperature-adapted fungi in the order Mucorales. J Gen Microbiol, 5, 215-221.
Sumner J L, Morgan E D & Evans H C (1969b) The effect of growth temperature on the fatty acid composition of fungi in the order mucorales. Can J Microbiol, 15, 515-520.
Suutari M & Laakso S (1994) Microbial fatty-acids and thermal adaptation. Crit Rev Microbiol, 20, 285-328.
Suzuki O, Yokochi T & Yamashina T (1981) Studies on production of lipids in fungi (II). Lipid compositions of six species of Mucorales in Zygomycetes. J Jpn Oil Chem Soc, 30, 863-868.
Tadaka R, Saito M & Mori T (1994) Dietary γ-linolenic acid enriched oil reduces body fat content and induces liver enzymes activities relating to fatty acid β-oxidation in rats. J Nutr. 124, 469-474.
Tapiero H, Ba G N, Couvreur P & Tew K D (2002) Polyunsaturated fatty acids (PUFA) and eicosanoids in human health and pathologies. Alternative Med Rev, 56, 215-222.
Tauk-Torniselo S M, Viera J M, Ceilia M, Carneiro V S, Govone J S (2007) Fatty acid production by four strains of M. hiemalis grown in plant oil and soluble carbohydrate. Afric J Biotechnol, 6, 1840-1847.
Tocher D R, Leaver M J & Hodgson P A (1998) Recent advances in the biochemistry and molecular biology of fatty acyl desaturases. Prog Lipid Res, 37, 73–117.
Torlanova B O, Konova I V, Funtikova N S, Babanova N K, Katomina A A, Mysyakina I S (1992) Influence of the conditions of culturing of a Mucor fungus, treatment of biomass, and extraction ability on the production of lipids containing gamma-linolenic acid. Appl Biochem Microbiol, 28, 461–468.
Totani N, Someya K & Oba K (1992) Industrial production of arachidonic acid by Mortierella: In Industrial applications of single cell oils. pp. 52–60. Champaign, IL: Ame Oil Chem Soc.
Totani N, Hyodo K & Ueda T (2000) A study on new nitrogen source for cultivation of genus Mortierella. J Jpn Oil Chem Soc, 49, 479–485.
Traitler H, Wille H J & Struder A (1988) Fractionation of blackcurrant seed oil. J Am Oil Chem Soc, 65, 755–760.
Uttaro A D (2006) Biosynthesis of Polyunsaturated fatty acids in Lower Eukaryotes. IUBMB Life, 58, 563 – 571.
Van Burik J A, Schreckhise R W, White T C, Bowden R C & Myerson D (1998) Comparison of six extraction techniques for isolation of DNA from filamentous fungi. Med Mycol, 36, 299–303.
Van der Westhuizen J P J, Kock J L F, Botha A & Bores P J (1994) The distribution of the omega 3 and 6-series of cellular long-chain fatty acids in fungi. Sys Appl Microbiol, 17, 327-345.
PDF created with pdfFactory Pro trial version www.pdffactory.com

325
van Gool W J, Thijs C, Henquet CJM, van Houwelingen AC, Dagnelie PC, Schrander J, Menheere P P & van den Brandt P A (2003) γ-Linolenic acid supplementation for prophylaxis of atopic dermatitis—a randomized controlled trial in infants at high familial risk1–3. Am J Clin Nutr, 77, 943–51.
Vanheeswijck R (1984) The formation of protoplasts from Mucor species. Carlsberg Res Commun, 49, 597-609.
Varavallo A M, Queiroz M V, Lana T G, de Brito A T R, Gonacalves D B & de Araujo E F (2007) Isoaltion of recombinant strains with enhanced pectinase production by protoplast fusion between Penicillium expansum and Penicillium griseoroseum. Brazillian J Microbiol, 38, 52-57.
Vega E Z, Glatz B A & Hammond E G (1988) Optimization of bana juiece fermentation for the production of microbial oil. Appl Env Microbiol, 54, 748-752.
Venkateswaran G (1997) Ph. D Thesis, University of Mysore, Mysore, India.
Verma N, Bansal M C & Kumar V (2007) Protoplast Fusion Technology and Its Biotechnological Applications .
Voigt K, Cigelnik E, & O’donnell K (1999) Phylogeny and PCR Identification of Clinically Important Zygomycetes Based on Nuclear Ribosomal-DNA Sequence Data. J Clin Microbio, 37, 3957–3964.
Wallis J G, Watts J L & Browse J (2002) Polyunsaturated fatty acid synthesis: What will they think of next? Trends Biochem Sci, 27, 467–470.
Walker T H, Cochran H D & Hulbert G J (1999) Supercritical Carbon Dioxide Extraction of Lipids from Pythium irregulare. J Ame Oil Chem Soc, 76, 597-602.
Waltermann M, Luftmann H, Baumeister D, Kalscheuer R, Steinbüchel A (2000) Rhodococcus opacus strain PD630 as a new source of high-value single-cell oil? Isolation and characterization of triacylglycerols and other storage lipids. Microbiol, 146, 1143–1149.
Wang D, Le M, Wei D, Cai Y, Zhang Y & Xing L (2007) Identification and Functional Characterization of the Delta-6 Fatty Acid Desaturase Gene from Thamnidium elegans. J Eukaryot Microbiol, 54, 110-117.
Wang J, Li R, Lu D, Ma S, Yan Y & Li A (2009) quick isolation method for mutants with high lipid yield in oleaginous yeast. World J Microbiol Biotechnol, 25, 921–925.
Ward O P (1995) Microbial production of long-chain PUFAs. INFORM, 6, 683-688.
Ward O P & Singh A (2005) Omega-3/6 fatty acids: Alternative sources of production. Proc Biochem, 40, 3627–3652.
Weete J D (1980) Lipid biochemistry of fungi and other organisms. New York, NY: Plenum Press, 97–111.
Weete J D, Shewmaker F & Gandhi S R (1998) g-Linolenic acid in zygomycetous fungi Synzygites megalocarpus. J Am Oil Chem Soc, 75, 1367–1372.
Westhuizen J P, Kock J L F, Botha A, Botes P J (1994) The distribution of the ω3 and ω6 of cellular long chain fatty acids in fungi. Syst Appl Microbiol, 17, 327–345.
PDF created with pdfFactory Pro trial version www.pdffactory.com

326
Weinstein R N, Montierl P O & Johnstone K (2000) Influence of growth temperature on lipid and soluble carbohydrate synthesis by fungi isolated from fell field soil in the maritime Antarctic. Mycologia, 92, 222–229.
Willis W M, Lencki R W & Marangoni A G (1998) Lipid Modification Strategies in the Production of Nutritionally Functional Fats and Oils. Crit Rev Food Sci Nutr, 38, 639–674.
Wongsumpanchai W, Anamnart S, Laoteng K & Petsom A (2004) Elongation of C16:0 to C18:0 fatty acids in methylotrophic yeast Hansenula polymorpha CBS1976 and fatty acid auxotrophic mutants. FEMS Microbiol Lett, 237, 213-218.
Woll A M, Appel K F, Petersen J B, Poulsen U & Arnau J (2002) Identification and analysis of genes involved in the control of dimorphism in Mucor circinelloides (syn. racemosus). FEMS Yeast Res, 2, 203-213.
Woodbine M (1959) Microbial fat: Microorganisms as potential fat producers. Prog Ind Microbiol, 1, 179-245.
Wu Z, Tsumura Y, Blomquist G & Wang X R (2003) 18S rRNA gene variation among common airborne fungi, and development of specific oligonucleotide probes for the detection of fungal isolates. Appl Environ Microbiol, 69, 5389–5397.
Wynn J P, Hamid A A & Ratledge C (1999) The role of malic enzyme in the regulation of lipid accumulation in filamentous fungi. Microbiol, 145, 1911-1917.
Wynn J P, Hamid A A, Li Y & Ratledge C (2001) Biochemical events leading to the diversion of carbon into storage lipids in the oleaginous fungi Mucor circinelloides and Mortierella alpina. Microbiol, 147, 2857–2864
Xian M, Yan J, Kang Y, Liu J, Bi Y & Zhen K (2001) Production of γ-linolenic acid by Mortierella isabellina grown on hexadecanol. Lett Appl Microbiol, 33, 367–370.
Yamada H, Shimizu S, Cmen Y, Akimoto K, Kawashima H & Jareonkitmongkol S (1992) Production of dihomo-gammalinolenic acid, arachidonic acid, and eicosapentaenoic acid by filamentous fungi. Industrial applications of single cell oils. Champaign, IL: Ame Oil Chem Soc, pp.118–138.
Yongmanitchai W & Ward O P (1989) Omega-3 fatty acids: alternative sources of production. Proc Biochem, 24, 117-125.
Yu L J, Qin W M, Lan W Z, Zhou P P & Zhu M (2003) Improved arachidonic acids production from the fungus Mortierella alpina by glutamate supplementation. Bioresource Technol, 88, 265–268.
Zhang Q, Li M, Ma H, Sun Y & Xing L (2004) Identification and characterization of a novel δ6-fatty acid desaturases gene from Rhizopus arrizus. FEBS Letters, 556, 81-85.
Zhu M, Yu L J & Wu Y X (2003) An inexpensive medium for production of arachidonic acid by Mortierella alpina. J Ind Microbiol Biotechnol, 30, 75–79.
Zhu L Y, Zong M H & Wu H (2003) Efficient lipid production with Trichosporon fermentans and its use for biodiesel preparation. Bioresource Technol, 99, 75–79.
PDF created with pdfFactory Pro trial version www.pdffactory.com

327
Ziboh, V A & Fletcher M P (1992) Dose-response effects of dietary gamma-linolenic acid-enriched oils on human polymorphonuclear-neutrophil biosynthesis of leukotriene B4. Am J Clin Nutr, 55, 39-45.
Zurier R B, Rossetti R G, Jacobson E W, DeMarco D M, Liu N Y, Temming J E, White B M, Lapsota M (1996) Gamma-linolenic acid treatment of Rheumatoid Arthritis. A randomized, placebo-controlled trial. Arthritis Rheum, 39, 1808-17.
PDF created with pdfFactory Pro trial version www.pdffactory.com


![SOLE TRUSTEE LOKA SHIKSHANA TURST V. COMMISSIONER OF INCOME TAX, MYSORE … · 2009. 6. 3. · sole trustee loka shikshana turst v. commissioner of income tax, mysore [1975] insc](https://static.fdocuments.us/doc/165x107/5fe513b6244cc53d1c505a82/sole-trustee-loka-shikshana-turst-v-commissioner-of-income-tax-mysore-2009-6.jpg)