POLYPROPYLENE/TITANIUM DIOXIDE NANOCOMPOSITES€¦ · PP/TiO2 composites were prepared using 0-5wt%...
36
Polypropylene/titanium dioxide nanocomposites 151 POLYPROPYLENE/TITANIUM DIOXIDE NANOCOMPOSITES 6.1 Introduction 6.2 Results and Discussion 6.3 Conclusion PP/TiO 2 composites were prepared using 0-5wt% of NTO through melt mixing. It was then made in to films by compression moulding process. PP composites with CTO was also prepared under the same conditions. Mechanical, dynamic mechanical, morphology and thermal properties of the composites and neat PP were studied. Transparency of the films were decreased by the addition of TiO 2 . However, NTO filled PP composites showed better transparency compared to PP/CTO composites. Melt flow index (MFI) of PP was increased at low concentration of NTO while for CTO filled composites showed a decrease in MFI compared to neat PP. DSC studies showed an increase in crystallinity by the addition of TiO 2 . XRD indicated monoclinic crystal form of PP in neat PP and composites. TGA revealed increased thermal stability of PP by the addition of TiO 2 . LOI was increased by the addition of nanoparticles. SEM images of the fractured surface of nano composites showed uniform dispersion of the TiO 2 in the nanocomposites. Mechanical, morphological and IR studies were carried out after thermal and UV ageing. NTO filled PP showed better properties compared to that of CTO filled PP composites. Contents
Transcript of POLYPROPYLENE/TITANIUM DIOXIDE NANOCOMPOSITES€¦ · PP/TiO2 composites were prepared using 0-5wt%...

Polypropylene/titanium dioxide nanocomposites
151
POLYPROPYLENE/TITANIUM DIOXIDE NANOCOMPOSITES
6.1 Introduction
6.2 Results and Discussion
6.3 Conclusion
PP/TiO2 composites were prepared using 0-5wt% of NTO through melt mixing. It
was then made in to films by compression moulding process. PP composites with
CTO was also prepared under the same conditions. Mechanical, dynamic
mechanical, morphology and thermal properties of the composites and neat PP
were studied. Transparency of the films were decreased by the addition of TiO2.
However, NTO filled PP composites showed better transparency compared to
PP/CTO composites. Melt flow index (MFI) of PP was increased at low
concentration of NTO while for CTO filled composites showed a decrease in MFI
compared to neat PP. DSC studies showed an increase in crystallinity by the
addition of TiO2. XRD indicated monoclinic crystal form of PP in neat PP and
composites. TGA revealed increased thermal stability of PP by the addition of
TiO2. LOI was increased by the addition of nanoparticles. SEM images of the
fractured surface of nano composites showed uniform dispersion of the TiO2 in the
nanocomposites. Mechanical, morphological and IR studies were carried out after
thermal and UV ageing. NTO filled PP showed better properties compared to that
of CTO filled PP composites.
Con
tent
s

Chapter -6
152
6.1 Introduction
In recent years, materials with sizes 1-50 nm have attracted a great
attention because of their versatile applications in polymer/inorganic
nanocomposites, optoelectronic devices, biomedical materials etc [1–6].
Polymer nanocomposites prepared by melt mixing have been reported to show
enhanced properties compared to neat polymers [7]. Polymer nanocomposites
have attracted great attention because of their significant enhancement in
mechanical strength and thermal properties at low filler contents [8-15]. This
improvement is due to the unique characteristics of the nanofillers [16]. There
is a growing trend in using nanoparticles of conventional inorganic fillers in
plastic composites. Two major findings in the field of polymer nanocomposites
began the investigations of these materials. First, Toyoto researchers observed
nylon nanocomposites, for which moderate inorganic loadings resulted in
significant improvements of the thermal and mechanical properties. Second,
Grannelis reported the possibility of melt mixing polymers and clays without
organic solvents. Since then, the high promise of industrial applications of
nanocomposites have motivated vigorous research, which has showed
remarkable enhancements of properties of the nanocomposites. There are
some investigations has been done to improve the properties of polymers by
the addition of inorganic nanofillers such as SiO2 [17], ZnO [18] and CaCO3
[19]. Recently, nanocomposites based on PP constitute a major challenge for
industry since they enhance the mechanical and physical properties of PP
[20-22]. PP is one of the most widely used thermoplastic due to its good
physical and mechanical properties as well as the ease of processing at a
relatively low cost. The commercial PP has a wide range of applications in
automobiles, textiles, furniture, electrical equipment and packaging industry
[23]. Extensive investigations have been conducted to broaden the
application of PP by improving properties like strength, impact resistance

Polypropylene/titanium dioxide nanocomposites
153
and thermal stability [24–54]. PP melts are more viscoelastic than other
thermoplastic melts like polyamide and polyester. There is a number of studies
on the PP nanocomposites filled with different types of fillers such as carbon
nanotubes [55-57], nanoclay [58-60], talc, mica and fibrous fillers like glass,
jute, aramid, carbon fibers etc. Reinforcement at nanoscale to enhance
properties of polymer including changes in the polymer crystallization
behaviour is being investigated [61]. The improved properties may be due to
the synergistic effects of nanoscale structure and interaction of fillers with
polymers. The size and nanostructure of the dispersed phase markedly influence
the properties of polymer nanocomposites [62-65]. To obtain nanocomposites
with enhanced performance, nanoparticles are to obtain a fine dispersion of the
nano powders in the polymer to promote a strong interface adhesion between
matrix and nanofillers. There are some reports on the use of nanoparticles of
various geometric shapes, including nano–TiO2, tubes and silica platelets [66-68].
TiO2 has been used as white colour pigment due to its high refraction index,
chemical stability and nontoxicity. One of the most interesting properties of TiO2
based cosmetics is UV-ray absorption and UV-ray scattering. Since the extent of
light scattering depends on the relationship between the particle size and the wave
length of light, decrease in TiO2 particle diameter achieves high transparency in
visible light, while UV-ray absorptivity increases with the extension of the
geometric area occupied by TiO2 [ 69].
We reported various properties of PP/TiO2 nanocomposites prepared by
melt mixing method in this chapter. PP/TiO2 composites with 0-5 wt% of TiO2
(both CTO and NTO) were prepared. Mechanical properties, dynamic
mechanical properties, thermal properties, melt flow index, transparency,
limiting oxygen index, crystallization, morphology and x-ray diffraction
studies of the composites were investigated. Mechanical, morphological and

Chapter -6
154
IR studies were carried out after UV and thermal ageing. Experimental details
are same as in chapter 3, section 3.2.
6.2 Results and Discussion 6.2.1 Mechanical properties of PP/ TiO2 composites
Tensile strength of the PP/NTO composites and PP/CTO composites are
shown in figure 6.1. Tensile strength of the composites increases with increase
the concentration of TiO2, reaches a maximum at a concentration of 1wt% of
TiO2. NTO filled PP shows higher tensile strength compared to CTO filled
composites. Tensile strength of PP is increased by 26% by the addition of
1wt% NTO and 22.6% by the addition of CTO.
0 1 2 3 4 530
32
34
36
38
40
42
Tens
ile s
tren
gth(
N/m
m2 )
Concentration of TiO2(%)
PP+NTO PP+CTO
Figure 6.1: Effect of TiO2 on tensile strength of PP/ TiO2 composites
The interface between nanoparticles and a polymer matrix can transfer
stress, which is beneficial for the enhancement of the tensile strength of
composite films. However, on increasing the concentration of nanoparticles,
aggregation occurs, which leads to a decrease in the interaction between

Polypropylene/titanium dioxide nanocomposites
155
particles and polymer resulting in defects in the composites. Therefore, the
effective interfacial interaction is decreased and tensile strength of the films
also reduced [70].
Tensile modulus of the neat PP and its composites with TiO2 is shown in
figure 6.2. Modulus of PP increases with increasing concentration of TiO2,
reaches a maximum at 1wt% of TiO2. NTO filled composites show higher
modulus compared to CTO filled composites. An increase of 23% in modulus
is observed by the addition of 1 wt% NTO and 19.8% by 1wt% CTO. The
improvement in modulus of PP/TiO2 composites is related to increased
stiffness, quality of the dispersion of TiO2 and also to the adhesion between the
matrix and TiO2.
0 1 2 3 4 5
1000
1100
1200
1300
1400
Mod
ulus
(N/m
m2 )
Concentration of TiO2(%)
PP+NTO PP+CTO
Figure 6.2: Effect of TiO2 on modulus of PP/ TiO2 composites
Elongation at break of the composites and neat PP are shown in figure
6.3. Elongation at break decreases with increasing concentration of TiO2. After
1 wt %, elongation at break of PP is increased. Decrease in elongation at break
may be due to the increase in stiffness of the composites.

Chapter -6
156
0 1 2 3 4 5
10
11
12
13
14El
onga
tion
at b
reak
(%)
Concentration of TiO2
PP+CTO PP+NTO
Figure 6.3: Effect of TiO2 on elongation at break of PP/ TiO2 composites
6.2.2 Dynamic mechanical analysis
The storage modulus of neat PP and PP/TiO2 composites as a function of
temperature at 1Hz are shown in figure 6.4.
20 40 60 80 100 120 140 160
200
400
600
800
1000
1200
1400
1600
1800
Stor
age
mod
ulus
(MPa
)
Temperature(0C)
1)Neat PP2) PP+1.5% NTO3) PP+ 3% NTO4)PP+ 1.5% CTO5) PP+3% CTO
1
2
3
4
5
1
Figure 6.4: Effect of TiO2 on storage modulus of PP/ TiO2 composites

Polypropylene/titanium dioxide nanocomposites
157
Storage modulus of the PP is increased with the addition of TiO2.This increase
is significant at low temperature. The storage modulus of PP increased with
increase in TiO2 concentration due to the stiffening effects of TiO2, indicating
efficient stress transfer between the polymer matrix and TiO2.
The loss modulus of PP and composites are given in figure 6.5. Loss
modulus also increases substantially with TiO2 concentration. The reinforcing
effect of TiO2 may be due to their specific interactions and the formation of a
rigid percolating TiO2 network within the polymer matrix. Maximum
improvement is shown by PP with 1.5 wt% NTO. Composites of PP with NTO
show significant improvement compared to PP with CTO.
20 40 60 80 100 120 140 16010
20
30
40
50
60
70
80
90
100
Loss
mod
ulus
(MPa
)
Temperature(0C)
1) Neat PP2) PP+1.5% NTO3) PP+ 1.5% CTO4) PP+ 3% NTO5) PP+ 3% CTO
1
2
3
4
5
Figure 6.5: Effect of TiO2 on loss modulus of PP/ TiO2 composites
The tanδ curves of PP and composites are shown in figure 6.6. It is evident
from the figure that there is an increase in tanδ value on addition of TiO2. This
indicates an increase in damping property. It is obtained in many cases that the

Chapter -6
158
improvement of stiffness significantly decreases the ductility. But PP/TiO2
composites showed increased stiffness without reducing ductility.
40 60 80 100 120 140 160
0.06
0.07
0.08
0.09
0.10
0.11
Tanδ
Temperature(0C)
PP+ 3 % CTO PP+1.5% CTO PP+ 3% NTO Neat PP PP+1.5% NTO
Figure 6.6: Effect of TiO2 on tanδ of PP/ TiO2 composites
6.2.3 Torque studies
Figure 6.7 represents the variation of torque with mixing time for the
neat PP and PP/NTO composites and PP/CTO composites. Torque is
increased rapidly during initial mixing and then dropped to stabilized on
increasing the mixing time. This indicates good level of filler dispersion at
the specified conditions. Also the torque value of the PP/NTO composites
was higher than that of neat PP and PP/CTO composites. This also points
towards interfacial interaction between the nanoparticles and polymer [70].

Polypropylene/titanium dioxide nanocomposites
159
0 2 4 6 8
0
10
20
30
40
50
Torq
ue(N
m)
Time(Min)
Neat PP PP+1.5% NTO PP+ 1.5% CTO
Figure 6.7: Variation of torque with time during mixing
6.2.4 Morphology of the fractured surface
Mechanical properties of a composite depends on the dispersion of filler
in the composites [71]. Figures 6.8a, 6.8b, 6.8c, 6.8d, 6.8e, 6.8f and 6.8g show
SEM images of tensile fractured surfaces of neat PP, PP/CTO and PP/NTO
composites. From SEM images it is clear that the TiO2 particles are well
dispersed in the PP matrix. F.G. Ramos Filho et al. reported the similar
fractured surface of PP/modified bentonite nanocomposites. They also
observed good dispersion of modified bentonite in PP [72]. NTO particles are
more dispersed when compared to CTO particles. At higher concentration of
TiO2, large particles are observed due to the agglomeration of TiO2.

Chapter -6
160
(a) (b)
(c) (d)
(e) (f)
(g)
Figure 6.8: SEM images of fractured surface of a) neat PP b) PP+1.5wt% NTO c) PP+1.5wt% CTO d) PP+2wt% NTO e) PP+2wt% CTO f) PP+5wt% NTO g) PP+5wt% CTO filled composites

Polypropylene/titanium dioxide nanocomposites
161
6.2.5 Energy dispersive atomic X-ray spectrum (EDAX)
EDAX is used for understanding the chemical composition of a material.
EDAX shows the presence of TiO2 in the PP matrix. The EDAX of neat PP
and PP/TiO2 composites are shown in the figures 6.9a, 6.9b and 6.9c
respectively.
(a) (b)
(c)
Figure 6.9: EDAX of a) neat PP b) PP+5wt%NTO c) PP+5wt%CTO composites

Chapter -6
162
6.2.6 X-ray diffraction analysis of Composites
XRD is the most commonly used technique to evaluate the degree of
dispersions of nanoparticles in a polymer. XRD studies also provide
opportunity to evaluate the crystalline structure, the extent of crystallization
and also crystalline orientation. Figure 6.10 shows the XRD of the composites
and neat PP. Sharp peaks indicate the crystalline nature of PP. X-ray
diffraction pattern of nanocomposites show sharp and highly intense peaks
compared to that of neat PP. This is due to the development of crystallinity in
the polymer. The peaks obtained are corresponding to the planes (110), (040),
(130) represents α− form of monoclinic isotactic PP.
0 5 10 15 20 25 30 35 40 45 50 55 60
Inte
nsity
( ar
b un
its)
2θ
Neat PP
PP+1.5% NTO
PP+1.5%CTO
Figure 6.10: X-ray diffraction pattern of neat PP and TiO2 filled composites
6.2.7 Thermogravimetric analysis
Degradation behaviour of the composites and neat PP was studied using
TGA is shown graphically in the figure 6.11 and the data is tabulated in Table
6.1. As shown in figure 6.11 and table 6.1, TiO2 filled composites show
enhanced thermal stability. Thermal stability of PP is increased more
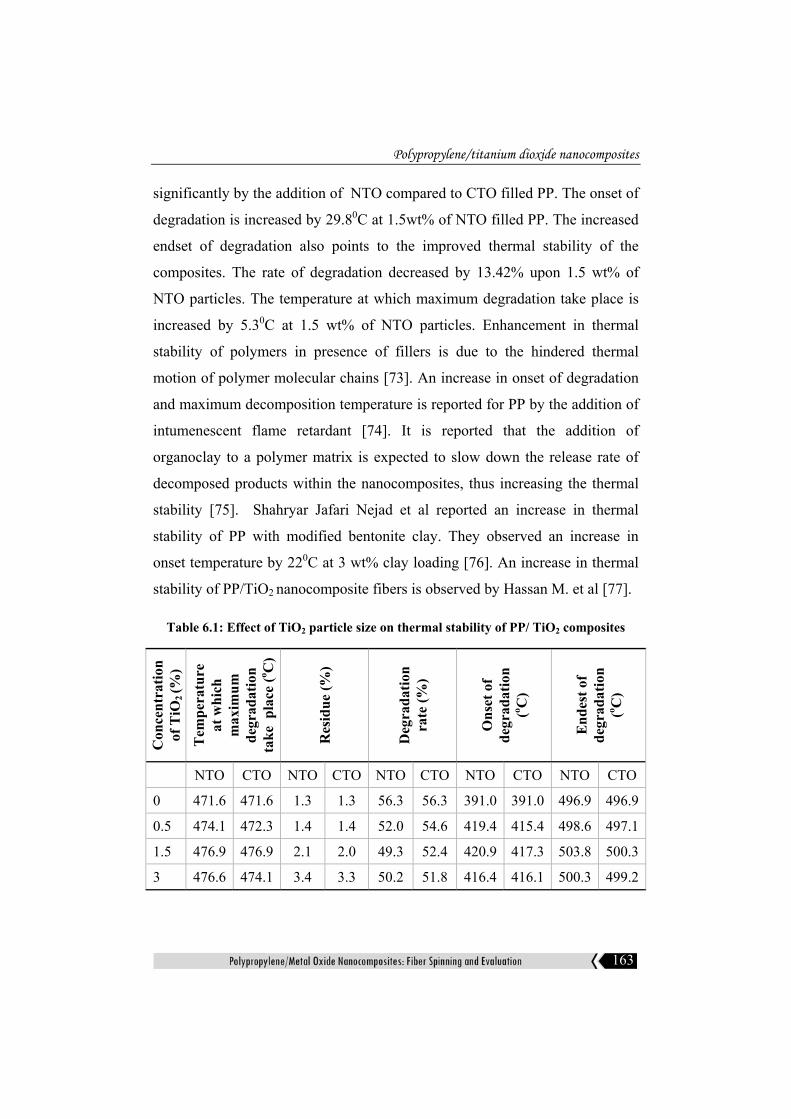
Polypropylene/titanium dioxide nanocomposites
163
significantly by the addition of NTO compared to CTO filled PP. The onset of
degradation is increased by 29.80C at 1.5wt% of NTO filled PP. The increased
endset of degradation also points to the improved thermal stability of the
composites. The rate of degradation decreased by 13.42% upon 1.5 wt% of
NTO particles. The temperature at which maximum degradation take place is
increased by 5.30C at 1.5 wt% of NTO particles. Enhancement in thermal
stability of polymers in presence of fillers is due to the hindered thermal
motion of polymer molecular chains [73]. An increase in onset of degradation
and maximum decomposition temperature is reported for PP by the addition of
intumenescent flame retardant [74]. It is reported that the addition of
organoclay to a polymer matrix is expected to slow down the release rate of
decomposed products within the nanocomposites, thus increasing the thermal
stability [75]. Shahryar Jafari Nejad et al reported an increase in thermal
stability of PP with modified bentonite clay. They observed an increase in
onset temperature by 220C at 3 wt% clay loading [76]. An increase in thermal
stability of PP/TiO2 nanocomposite fibers is observed by Hassan M. et al [77].
Table 6.1: Effect of TiO2 particle size on thermal stability of PP/ TiO2 composites
Con
cent
ratio
n of
TiO
2 (%
)
Tem
pera
ture
at
whi
ch
max
imum
de
grad
atio
n ta
ke p
lace
(o C)
Res
idue
(%)
Deg
rada
tion
rate
(%)
Ons
et o
f de
grad
atio
n (o C
)
End
est o
f de
grad
atio
n (o C
)
NTO CTO NTO CTO NTO CTO NTO CTO NTO CTO
0 471.6 471.6 1.3 1.3 56.3 56.3 391.0 391.0 496.9 496.9
0.5 474.1 472.3 1.4 1.4 52.0 54.6 419.4 415.4 498.6 497.1
1.5 476.9 476.9 2.1 2.0 49.3 52.4 420.9 417.3 503.8 500.3
3 476.6 474.1 3.4 3.3 50.2 51.8 416.4 416.1 500.3 499.2

Chapter -6
164
350 400 450 500 550
0
20
40
60
80
100
Wei
ght (
%)
Temperature (0C)
1)Neat PP2)PP+ 1.5% CTO3)PP+ 1.5% NTO
12 3
Figure 6.11: Thermogram of PP and PP/ TiO2 composites
6.2.8 Kinetic analysis of thermal decomposition
Kinetics of degradation behaviour of PP and PP/TiO2 composites were
studied using Coats–Redfern method [78]. Thermal degradation functions used
for the Coats–Redfern method were listed in Table 3.3 and detailed description
is given in section 3.3.8.
Table 6.2: Apparent activation energy (E) and correlation coefficients(R) for neat PP and PP/ TiO2 composites by Coats–Redfern method.
Sample name R E (kJ/mol) Neat PP 0.999 126.52 PP+0.5% NTO 0.999 140.69 PP+1.5% NTO 0.999 158.64 PP+3% NTO 0.999 137.25
From the table 6.2 it is clear that the activation energy of PP fiber is increased
by the addition of NTO. Activation energy (E) obtained for neat PP is 126.5
kJ/mol, 1.5% NTO added PP is 158.6 kJ/mol. Significant increase in
activation energy indicates high thermal stability. Representative plot of

Polypropylene/titanium dioxide nanocomposites
165
Coats–Redfern equation for neat PP, PP/0.5wt% NTO, PP/1.5wt% NTO
nanocomposite and PP/3wt% NTO nanocomposite are shown in figures 6.12a,
6.12.b, 6.12.c and 6.12d respectively.
0.001389 0.001392 0.001395 0.001398-14.58
-14.55
-14.52
-14.49
-14.46
-14.43
ln[g
(α)/T
2 )
1/T(K-1)
Figure 6.12a: Representative plot of Coats–Redfern equation for neat PP
0.001389 0.001392 0.001395 0.001398-14.58
-14.55
-14.52
-14.49
-14.46
-14.43
ln[g
(α)/T
2 )
1/T(K-1)
Figure 6.12b: Representative plot of Coats–Redfern equation for PP+0.5% NTO

Chapter -6
166
0.001377 0.001380 0.001383 0.001386
-14.28
-14.25
-14.22
-14.19
-14.16
-14.13
-14.10ln
[g(α
)/T2 )
1/T(K-1) Figure 6.12.c: Representative plot of Coats–Redfern equation for PP+1.5% NTO
0.001383 0.001386 0.001389 0.001392 0.001395
-14.55
-14.52
-14.49
-14.46
-14.43
-14.40
ln[g
(α)/T
2 )
1/T(K-1) Figure 6.12.d: Representative plot of Coats–Redfern equation for PP+3% NTO

Polypropylene/titanium dioxide nanocomposites
167
6.2.9 Differential Scanning Calorimetry
Properties of a semicrystalline polymer are related to degree of
crystallization and crystallite size [79]. Nucleating agents that have been
reported in the literature include metal oxides and hydrides, residual catalysts
and diamide segments [80-82]. Several researchers reported the use of
nanoparticles, such as organically modified nanoclays and nanotubes as
crystallization promoters for different polymers [83-86].
DSC crystallization exotherms of neat PP and composites are shown in
figure 6.13. From DSC crystallization exotherms, Tc (the temperature at the
crossing point of the tangents of the baseline and the high-temperature side of
the exotherm), Tcp (the peak temperature of the exotherm) and ∆Hc (enthalpy
of crystallization) can be obtained is shown in table 6.3. Percentage
crystallinity (Xc) was calculated using the Equation 3.1. It shows an increase
in crystallinity by the addition of TiO2. The Tc – Tcp values of the composites
were smaller than that of neat PP, indicating that addition of TiO2 increased the
crystal growth rate (CGR) of PP.
60 90 120 150 180 210
PP+ 3 wt% TiO2
PP+ 1.5 wt% TiO2
Exot
herm
ic h
eat f
low
(W/g
)
Temperature(0C)
Neat PP
PP+ 0.5 wt% TiO2
Figure 6.13: Cooling behaviour of neat PP and PP/ TiO2 composites

Chapter -6
168
Table 6.3: Effect of TiO2 on the crystallization behaviour of PP
Sample name Tc(0C) Tcp(0C) ∆Hc(J/g) Xc(%) Tc-Tcp
Neat PP 120.60 113.64 81.65 39.4 6.96
PP+0.5%NTO 118.5 113.84 98.3 47.5 4.66
PP+1.5%NTO 118.93 113.95 91.28 44.6 4.98
PP+3%NTO 119.25 113.46 92.0 45.5 5.79
Melting behaviour obtained from DSC is shown in figure 6.14 and
values are tabulated in table 6.4. From the figure, Tm (designed here as the
temperature at the crossing point of the tangents of the baseline of the melting
peak), Tmp (the peak temperature of the curve), and ∆Hm (heat of fusion) can
be obtained. The maximum rate of melting (Tmp) occurred at 163.80C for pure
PP and its Tm is 154.30C. The Tm value of PP with 3 wt% NTO is increased
by about 1.70C compared with neat PP.
30 60 90 120 150 180 210
PP+3 wt%TiO2
PP+1.5wt%TiO2
Endo
ther
mic
hea
t flo
w(W
/g)
Temperature(0C)
Neat PP
PP+0.5 wt%TiO2
Figure 6.14: Melting behaviour of neat PP and PP/ TiO2 composites

Polypropylene/titanium dioxide nanocomposites
169
Table 6.4: Effect of TiO2 on the melting behaviour of PP
Sample name Tm(0C) Tmp(0C) ∆Hm(J/g) Neat PP 154.37 164.77 48.61 PP+0.5% NTO 156.5 161.95 64.32 PP+1.5% NTO 154.81 164.07 55.46 PP+3% NTO 152.65 164.92 64.89
6.2.10 Melt flow index
Figures 6.15a and 6.15b show the effect of TiO2 on the MFI of PP at 5kg
and 2.16kg respectively. MFI of PP is decreased by the addition of CTO
indicate a decrease in flow of the polymers. In nanocomposites, MFI is
increased by the addition of low concentration of NTO indicate an increase in
the flow of the polymers. A low content of nanoparticles may provide flow
favouring orientation due to the small size of NTO as depicted in figure 6.16.
An increase in MFI is reported on addition of multi walled carbon nanotube
to PP [87]. After adding 1wt% NTO to the PP the MFI value decreases
gradually, indicates the structure of nanoparticles was interconnected to hinder
the molecular motion of polymer chains [88].
0.0 0.5 1.0 1.5 2.0 2.5 3.045
50
55
60
65
70
PP+NTO PP+CTO
Mel
t flo
w in
dex
valu
es
Concentration of TiO2(%)
0.0 0.5 1.0 1.5 2.0 2.5 3.012
14
16
18
20
Mel
t flo
w in
dex
valu
es
Concentration of TiO2(%)
NTO CTO
(a) (b)
Figure 6.15: Effect of TiO2 particle size on the melt flow index of PP using (a) 2.16kg and (b) 5 kg weight

Chapter -6
170
(a) (b)
Figure 6.16: Schematic representation of flow behaviour of (a) PP+NTO (b) PP+CTO composites
6.2.11 Transparency of the films
The percentage transmittance of neat PP and the composites is given in
figure 6.17. Transmittance of the film is decreased by the addition of TiO2.
NTO filled PP films show higher transparency when compared to CTO
filled PP films. The photographs showing the transparency of the films are
given in figure 6.18. From photographs it is evident that the composites
based on NTO are much clearer than those containing CTO. This may be
due to decrease in spherulite size of PP and also due to smaller TiO2
particles in the composites.

Polypropylene/titanium dioxide nanocomposites
171
600 800 1000 1200 1400 1600
10
20
30
40
50
60
70
% T
rans
mitt
ance
Wave length(nm)
(1)Neat PP(2)PP+ 1% NTO(3)PP+1% CTO
1
2
3
Figure 6.17: Visible-IR transmittance of neat PP and PP/ TiO2 composites
(a) (b)
(c)
Figure 6.18: Photographs of a) neat PP b) PP+1wt%NTO c) PP+1wt%CTO films

Chapter -6
172
6.2.12 Limiting oxygen index
Use of nanoparticles in polymers for fire retardant applications help to
avoid toxicity of the degradation products compared with the more traditional
additives like halogenated compounds and allows the production of light
weight products. Figure 6.19 represents the LOI of the neat PP and its
composites with NTO. Neat PP shows 18% and the composites show 19%
LOI. The improvement in the flame retardancy may be due to the good filler
dispersion in the PP matrix because of the addition of TiO2 [89].
0.0 0.5 1.0 1.5 2.0 2.5 3.0 3.517.0
17.5
18.0
18.5
19.0
19.5
20.0
Lim
iting
oxy
gen
inde
x (%
)
Concentration of titanium dioxide (%)
Figure 6.19: Effect of TiO2 on the limiting oxygen index of PP/ TiO2 composites
6.2.13 Thermal and Photo Ageing
Degradation of polymeric materials is a commonly encountered
problem that causes changes in their chemical, physical and mechanical
properties. There are many factors causing polymer degradation: solar light,
other high energy radiations, heating, chemicals attack, stress loading, water
loading, biological sources etc. Among these factors, ultraviolet radiation and
light is the common factors that cause degradation of polymers under outdoor

Polypropylene/titanium dioxide nanocomposites
173
environments. The degradation mechanism of PP under light and temperature
is given in figure 3.19. In this section, mechanical, morphology and IR
studies of the neat PP and composites after thermal and UV ageing were
discussed.
6.2.13.1 Thermal ageing 6.2.13.1.1 Mechanical properties of PP/TiO2 nanocomposites
The mechanical properties of the nanocomposites, such as tensile
strength and modulus after 24 hrs of thermal ageing have been evaluated
and the results are shown in figures 6.20 and 6.21. Mechanical properties of
the composites showed higher value compared to neat PP even after thermal
ageing. More degradation was observed in the case of composite prepared
with CTO and neat PP. This evidences that reduction in particle size of
TiO2 increases the ageing resistance of the composites. Thermal ageing
when conducted in an air oven, the degradation takeplace in presence of
oxygen, which is the main factor responsible for degradation of PP in the
thermal environment [90]. In polymer, there will be a depth profile of
degradation, with higher rate of oxidation near the surface, due to the lack
of oxygen in the sample interior. Thus, diffusion of oxygen plays a major
role in determining the extent of chemical degradation [91, 92]. In
nanocomposites, oxygen molecules are concentrated more on the fillers,
decreasing the diffusion path through the PP. It helps to resist the
degradation of polymer molecules.

Chapter -6
174
0.0 0.5 1.0 1.5 2.0 2.5 3.0
30
32
34
36
38
40
1) PP+NTO before thermal ageing2) PP+NTO after thermal ageing3) PP+CTO before thermal ageing4) PP+CTO after thermal ageing
Tens
ile s
tren
gth(
N/m
m2 )
Concentration of titanium dioxide(wt%)
1 32
4
Figure 6.20: Effect of thermal ageing on tensile strength of PP/TiO2 composites
0.0 0.5 1.0 1.5 2.0 2.5 3.0
1000
1100
1200
1300
Mod
ulus
(N/m
m2 )
Concentration of titanium dioxide(wt%)
1
3
2
4
Figure 6.21: Effect of thermal ageing on tensile modulus of PP/TiO2 composites
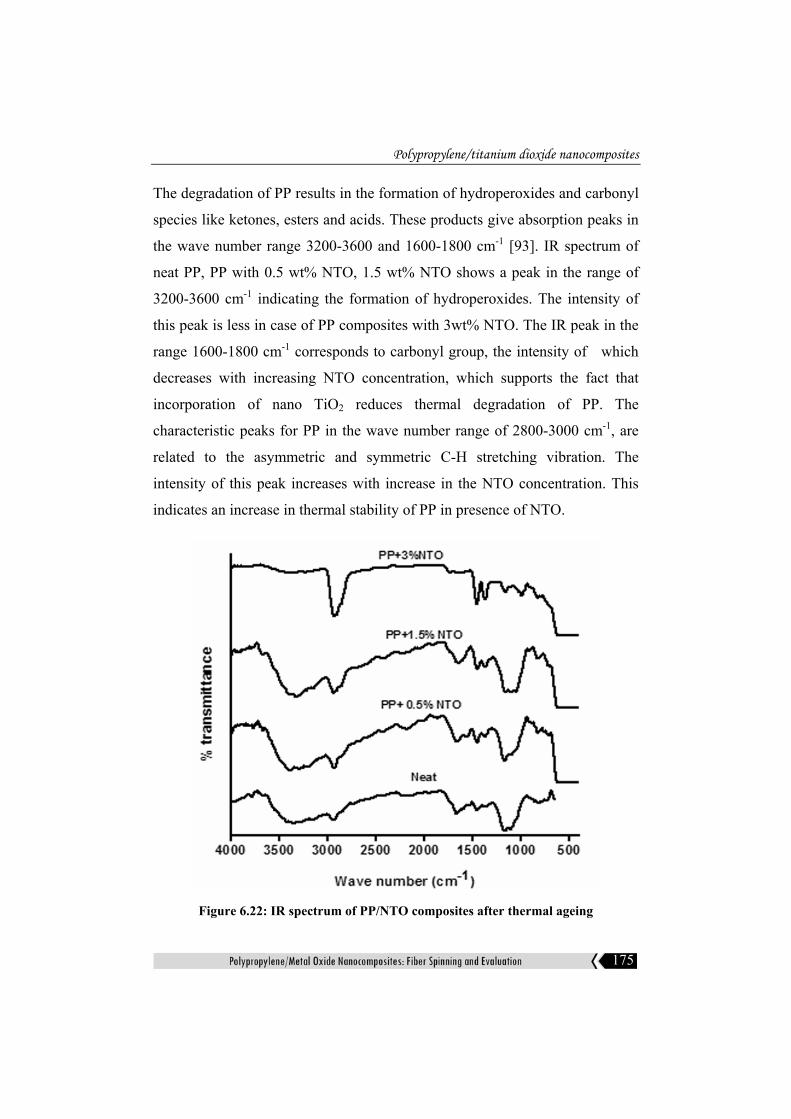
6.2.13.1.2. IR studies
Degradation products of neat PP and its composites with NTO after
thermal ageing are studied by IR spectroscopy. IR spectrum of neat PP, PP
with 0.5 wt% NTO, 1.5 wt% NTO and 3 wt% NTO are shown in figure 6.22.
Polypropylene/titanium dioxide nanocomposites
175
The degradation of PP results in the formation of hydroperoxides and carbonyl
species like ketones, esters and acids. These products give absorption peaks in
the wave number range 3200-3600 and 1600-1800 cm-1 [93]. IR spectrum of
neat PP, PP with 0.5 wt% NTO, 1.5 wt% NTO shows a peak in the range of
3200-3600 cm-1 indicating the formation of hydroperoxides. The intensity of
this peak is less in case of PP composites with 3wt% NTO. The IR peak in the
range 1600-1800 cm-1 corresponds to carbonyl group, the intensity of which
decreases with increasing NTO concentration, which supports the fact that
incorporation of nano TiO2 reduces thermal degradation of PP. The
characteristic peaks for PP in the wave number range of 2800-3000 cm-1, are
related to the asymmetric and symmetric C-H stretching vibration. The
intensity of this peak increases with increase in the NTO concentration. This
indicates an increase in thermal stability of PP in presence of NTO.
Figure 6.22: IR spectrum of PP/NTO composites after thermal ageing

Chapter -6
176
6.2.13.1.3 Morphology of the tensile fractured surface
The SEM images of the fractured surface of the neat PP, 1.5 wt% of
NTO and 1.5 wt% of CTO filled PP after thermal ageing is shown in the
figures 6.23a, 6.23b and 6.23c. A well dispersed filler matrix system is
observed after ageing.
(a) (b)
(c)
Figure 6.23: Scanning electron micrographs of (a) neat PP (b) PP+1.5wt%NTO and (c) PP+1.5wt% CTO filled composites after thermal ageing.

Polypropylene/titanium dioxide nanocomposites
177
6.2.13.2 UV ageing 6.2.13.2.1 Mechanical properties
The mechanical properties of the neat PP and composites, such as tensile
strength and modulus before and after 48 hours of UV irradiation are
represented in figure 6.24 and 6.25. After UV irradiation, tensile strength and
modulus of neat PP and composites decreased. Properties of NTO filled PP
after UV irradiation are higher than that of CTO filled PP composites and neat
PP. Based on the tensile results, it can be summarized that the presence of
TiO2 particles can act as effective UV screen to resist photodegradation for
PP. Hongxia Zhao et al has been observed the stability of PP/ZnO composites
after UV irradiation under UV light [93].
0.0 0.5 1.0 1.5 2.0 2.5 3.0
28
30
32
34
36
38
40
1)PP+NTO before UV ageing2)PP+NTO after thUV ageing3)PP+CTO before UV ageing4)PP+CTO after UV ageing
Tens
ile s
tren
gth(
N/m
m2 )
Concentration of titanium dioxide(%)
1
23
4
Figure 6.24: Effect of photo ageing on tensile strength of PP/TiO2 composites.

Chapter -6
178
0.0 0.5 1.0 1.5 2.0 2.5 3.0
700
800
900
1000
1100
1200
1300M
odul
us(N
/mm
2 )
Concentration of titanium dioxide(%)
1 2 3 4
Figure 6.25: Effect of photo ageing on tensile modulus of PP/TiO2 composites
6.2.13.2.2 Fourier transform infrared studies
Figure 6.26 represents the FTIR spectrum of neat PP, 1.5% NTO filled PP
and 1.5% CTO filled PP after UV irradiation respectively. Intensity of the peak
due to the formation hydroperoxide in the range of 3200-3600 cm-1 decreases
significantly by the addition of TiO2 and this decrease is significant in the case
of NTO filled PP composites than CTO filled composites. Intensity of
characteristic peak of PP in the range 2800cm-1 increased by the addition of
TiO2. PP/NTO filled composite shows intense peak compared to that of
PP/CTO composites. TiO2 nanoparticles may be stabilizing the PP molecules
thereby delaying the photodegradation.

Polypropylene/titanium dioxide nanocomposites
179
4000 3500 3000 2500 2000 1500 1000 500
0
100
200
300%
tran
smitt
ance
Wave numbers(cm-1)
PP+1.5Wt% NTO
PP+1.5wt% CTO
Neat PP
Figure 6.26: IR spectrum of PP/TiO2 composites after photo ageing
The dominant screening mechanism is that the TiO2 nanoparticles absorbed
the UV radiation and hence reduced the UV intensity that can promote oxidation
of the PP. Outstanding photo-stabilization effect of zinc oxide nano particles on
PP [93] and LLDPE is reported [94].
6.2.13.2.3. Morphologies of tensile fractured surfaces
Figure 6.27 shows the overviews of the surface morphologies of
tensile fractured specimens of PP, PP/NTO and PP/CTO composites after
UV irradiation respectively.SEM photographs of neat PP shows holes after
UV irradiation. These holes are caused by photo-degradation on the
specimen surfaces. When examining the fractured surface of composites
such holes are not observed.

Chapter -6
180
(a) (b)
(c)
Figure 6.27: Scanning electron micrographs of (a) neat PP (b) PP+1.5wt%CTO and (c) PP+1.5wt% NTO filled composites after photo ageing
6.3 Conclusion
Mechanical and dynamic mechanical properties of PP are improved by
the addition of TiO2. PP shows better thermal stability in presence of TiO2.
Differential scanning calorimetric studies show increase in crystallinity of PP
by the addition of TiO2. X-ray diffraction studies of neat PP and composites
indicate the presence of α phase of monoclinic PP. Melt flow index increases
by adding low concentration of NTO, whereas CTO added PP shows a
decrease in MFI. Transparency of the PP films is decreased by the addition of
TiO2. PP with NTO filled films show higher transparency when compared to
CTO filled PP films. Limiting oxygen index of PP is increased by the addition

Polypropylene/titanium dioxide nanocomposites
181
of TiO2. Mechanical, morphology and IR studies show improved performance
of composites even after thermal and UV ageing when compared to neat PP.
NTO filled PP shows better properties than CTO filled composites.
References
[1] Pavlidoua S, Papaspyrides C D , Prog Polym Sci,2008, 33,1119.
[2] Kubacka A, Serrano C, Ferrer M, Lunsdorf H, Bielecki P, Cerrada ML, Fernandez-Garcia M,Nano Lett, 2007,7,2529.
[3] Kagan C R, Mitzi D B, Dimitrakopoulos C D, Science, 1999, 286,945.
[4] Eckle M, Decher G , Nano Lett, 2001,1,45.
[5] Choy J H, Kwak S Y, Jeong Y J, Park J S, Angew Chem Int Ed, 2000, 39,4041.
[6] Cristofaro A D, Violante A , Appl Clay Sci, 2001, 19,59.
[7] Hsu Y G, Lin K H , J Polym Res,2001,8,69.
[8] Fereidoon A, Ahangari M G, Saedodin S, Journal of macromolecular Science, Part B: Physics 2008, 48,196.
[9] Mehta S, Mirabella M, Rufener K, Bafna A, J of Appl Polym Sci, 2004,92,928.
[10] G Mani, Q Fan, Samuel C U, Yang Y, J of Appl Polym Sci, 2005,97,218.
[11] Garcia M, van Vilet G, Jain S, Schrauwen B A, Sarkissov A, van Zyl W E, Boukamp B, Rev.Adv.Mater.Sci, 2004,6,169.
[12] Marosfoi B B, Szabo A, Marosi Gy, Tabuani D, Camino G, Pgliari S, J of Thremal Analysis and Calorimetry, 2006,86,669.
[13] Jiann-Wen Huang, J Appl Polym Sci, 2008,107, 3163.
[14] Pralay Maiti, Pham Hoai Nam, Masami Okamoto, Macromolecules 2002, 35,6.
[15] Maurizio Avella, Simona Cosco, Maria Laura Di Lorenzo, Emilia Di Pace, Maria Emanuela Errico, Gennaro Gentile, Macromol Symp, 2006, 234, 156.

Chapter -6
182
[16] Yang J, Lin Y, Wang J, Mingfang Lai, Jing Li, Liu J, Xin Tong, Cheng H, J.Appl Polym Sci, 2005,98,1087.
[17] Garcia M, van Vilet G, Jain S, Schrauwen B A, Sarkissov A, van Zyl W E, Boukamp B, Rev.Adv.Mater.Sci, 2004,6,169.
[18] Dong Wook Chae, Byoung Chul Kim, Polym. Adv. Technol, 2005, 16, 846.
[19] Shu-Cai Li, Ya-Na Li, J of Appl Polym Sci, 2010, 116, 2965.
[20] Maurizio Avella, Maria Emanuela Errico, Gennaro Gentile, Macromol. Symp, 2007, 247, 140.
[21] Garcıa Lopez D, Merino J C, Pastor J M, J. Appl. Polym. Sci, 2003, 88, 947.
[22] Ellis T S, D Angelo J S, J. Appl. Polym. Sci , 2003, 90, 1639.
[23] Hasegawa N, Okamoto H, Kato M, Usuki A, J.Appl. Polym. Sci, 2000, 78, 1918.
[24] Rumiana Kotsilkova, Evgeni Ivanov, Ekaterina Krusteva, Clara Silvestre, Sossio Cimmino, Donatella Duraccio, J Appl Polym Sci, 2010,115, 3576.
[25] Reyes de Vaaben S, Aguilar A, Avalos F, Ramos de Valle L F, J of Thermal Analysis and Calorimetry, 2008,93,947.
[26] Henry Kuo Feng Cheng, Nanda Gopal Sahoo, Xuehong Lu, Lin Li, J Therm Anal Calorim, DOI 10.1007/s10973-011-1498-5
[27] Liu Z, Gilbert M J, J Appl Polym Sci 1996;59(7):1087–98
[28] Wang Y, Wang J, Polym Eng Sci, 1999,39,190.
[29] Lei SG, Hoa SV, Ton-That MT, Compos Sci Technol, 2006,66,1274.
[30] Chen M, Tian G, Zhang Y, Wan C, Zhang Y, J Appl Polym Sci, 2006,100,1889.
[31] Jeong S H, Yeo S Y, Yi S C, J Mater Sci, 2005, 40, 5407.
[32] Bhattacharyya A R, Sreekumar T V, Liu T, Kumar S, Ericson L M, Hauge R H, Smalley R. E, Polymer 2003, 44, 2373.
[33] Chatterjee A, Deopura B L, Compos A 2006, 37, 813.

Polypropylene/titanium dioxide nanocomposites
183
[34] Kumar S, Doshi H, Srinivasarao M, Park J O, Schiraldi D A, Polymer, 2002, 43, 1701.
[35] Rottstegge J, Qiao Y K, Zhang X, Zhou Y, Xu D, Han C C, Wang D, J Appl Polym Sci, 2007, 103, 218.
[36] Gordeyev S A, Ferreira J A, Bernardo C A, Ward I M, Mater Lett 2001, 51, 32.
[37] Rong M Z, Zhang M Q, Zheng Y X, Zeng H M , Friedrich K, Polymer 2001, 42, 3301.
[38] Bikiaris D N, Papageorgiou G Z, Pavlidou E, Vouroutzis N, Palatzoglou P, Karayannidis G P, J Appl Polym Sci,2006, 100, 2684.
[39] Huang L, Zhan R, Lu Y, J Reinforc Plast Compos, 2006, 25,1001.
[40] Rubaca M, Zieba J, Fibers Text Eastern Eur 2006, 14, 49.
[41] Yu B, Qi L, Ye J, Sun H, J Polym Res 2007, 14, 107.
[42] Ghasemi A, Hossienpour A, Morisako A, Saatchi A, Salehi M, J of Magnetism and Magnetic Materials, 2006, 302, 429.
[43] Yang H, Zhu S, Pan N, J Appl Polym Sci, 2004, 92, 3201.
[44] Burniston N, Bygott C, Stratton J, Surf Coat Int Part A, 2004, 87, 179.
[45] Tjong S C, Bao S P, Liang G D, J. Polym. Sci. B. Polym. Phys. 2005, 43,3112.
[46] Jose M V, Dean D, Tyner J, Price G, Nyairo E, J. Appl. Polym. Sci., 2007, 103,3844.
[47] Xu W, Ge M, He P, J. Polym. Sci. B. Polym. Phys., 2002, 40, 408.
[48] Amash A, Zugenmaier P, J. Appl. Polym. Sci., 1997, 63, 1143.
[49] Zhou Z, Wang S, Zhang Y, J. Appl. Polym. Sci., 2006, 102, 4823.
[50] Takashi K, Eric G, Jenny H, Richard H, Walid A, Jack D, Macromol Rapid Commun 2002, 13, 761.

Chapter -6
184
[51] Valentini L, Biagiotti J, Kenny J M, Santucci S, J Appl Polym Sci, 2003, 87, 708.
[52] Kearns J C, Shambaugh R L, J Appl Polym Sci, 2002, 86, 2079.
[53] Bhattacharyya A R, Sreekumar T V, Liu T, Kumar S, Ericson L M, Hauge R H, Smalley R E, Polymer 2003, 44, 2373.
[54] Valentini L, Biagiotti J, Kenny J. M, Manchado M A L, J Appl Polym Sci, 2003, 89, 2657.
[55] Thomas S Ellis, Joseph S D Angelo, J Appl Polym Sci, 2003,90,1639.
[56] Masaya Kawasumi, Naoki Hasegawa, Makoto Kato, Arimitsu Usuki, Akane Okada, Macromolecules 1997, 30, 6333.
[57] Quang T, Nguyen, Donald G Baird, Advances in Polymer Technology 2006, 25, 270.
[58] Bhattacharya A R, Sreekumar TV, Tao Liu, Satish Kumar, Ericson M, Robert H. Hauge, Richard E Smalley, Polymer 2003, 44, 2373.
[59] Avella M, Errico M E, Rimedio R, J. Mater. Sci, 2004, 39, 6133.
[60] Avella M, Errico M E, Martuscelli E, Nanoletters, 2001, 1, 213.
[61] Lu S, Melo M, Zhao J, Pearce E M, Kwei T K, Macromolecules, 1995, 28, 4908.
[62] Ahmadi S J, Huang Y D,Li J W, J. Mater. Science, 2004, 39, 1919
[63] Lee D C, Jang LW, J. Appl. Polym. Sci, 1998, 68, 1997.
[64] Fornes T D, Yoon PJ, Keskkula H, Paul D R, Polymer, 2001, 42,9929.
[65] Liu L, Qi Z, Zhu X, J. Appl. Polym. Sci, 1999, 71,1133.
[66] Jakob M, Levanon H, Kamat PV , Nano Lett, 2003, 3,353.
[67] Shi SL, Zhang LZ, Li JS ,J Polym Res, 2009, 16,395.
[68] Chiu F C, Chu P H, J Polym Res, 2006, 13,73.

Polypropylene/titanium dioxide nanocomposites
185
[69] Yoichi Ishibai, Takashi Nishikawa , Shigeyoshi Miyagishi, Journal of dispersion science and Technology, 2006, 27, 1093.
[70] Shu-Cai Li, Ya-Na Li, Journal of Applied Polymer Science 2010, 116, 2965.
[71] Lin Hongjiao, Yan Hong, Liu Bo, Wei Liqiao, Bingshe Xu, Polym Degrad Stab 2011,96,1382.
[72] Florencio GF, Tomas JAM, Marcelo SR, Suedina MLS, Polym Degrad Stab, 2005,89,383.
[73] Gilman JW, Appl Clay Sci, 1999,15,31.
[74] Dogan Mehmet, Yılmaz Aysen, Bayramli Erdal, Polym Degrad Stab, 2010, 95, 2584.
[75] Danyadi L, Janecska T, Szabo Z, Nagy G, Moczo J, Pukanszky B, Composites Sci Technol, 2007,67,2838.
[76] Jafari Nejad Shahryar, Ahmadi Seyed javad, Abolghasemi Hossein, Mohadde Spour Ahmad, J Appl Polym Sci, 2007, 7, 2480.
[77] Hassan M, El-Dessouky, Carl AL, J Nanopart Res, 2011,13,1115.
[78] Coats AW, Redfern JP. Nature 1964,68,201.
[79] Jiang-Ping He, Hua-Ming Li, Xia-Yu Wang, Yong Gao, European Polymer Journal, 2006,42,1128.
[80] Van Bennekom ACM, Gaymans R J ,Polymer, 1997,38,657.
[81] Bouma K, de Wit G, Lohmeijer JHGM,Gaymans RJ,Polymer, 2000,41,3965.
[82] Agarwal US,G de Wit, Lemstra PJ, Polymer, 2002,43,5709.
[83] Ou CF, J Appl Polym Sci, 2003,89,3315.
[84] Ou CF, J Polym Sci Part B:Polym Phys, 2003,41,2902.
[85] Anoop Anand K,Agarwal US, Rani Joseph, Polymer, 2006,47,3976.
[86] Wu T Ke Y,Thin solid films, 2007,515,13,5220

Chapter -6
186
[87] Chin-Chun Teng, Chen-Chi M Ma,Yen-Wei Huang, Siu-Ming Yuen, Cheng-Chih Weng,Cheng-Ho Chen,Shun-Fua Su, Composites: Part A,39,2008,1869.
[88] Lee S H, Kim M W,Kim S H,Youn J R., Eur Polym J, 2008,44,1620.
[89] Kancheng mai, Zhengjun Li,yuxin qiu, Hanmin zeng, Journal of Applied Polymer Science,2001, 81, 2679 .
[90] Rapoport N Y, Berulava S I, Kovarskii A L, Musayelyan I N, Yershov YuA,Miller V B, Polym Sci USSR (EnglmTrnasl)1975,A17,2901.
[91] Rabello M S, White J R, Polym Degrad Stab 1997,56,55.
[92] Zanetti M, Bracco P, Costa L, Polym Degrad Stab, 2004,85,657.
[93] Hongxia Zhao, Robert K Y Li, Polymer 2006,47,3207.
[94] Yang R, Li Y, Yu J, Polym Degrad Stab 2005,88,168.
….. ……