polynomials - University of Kentuckymshaw/ma110/polynomials.pdf · • is an x-intercept of the...
21
8 Polynomials Concepts: • Quadratic Functions – The Definition of a Quadratic Function – Graphs of Quadratic Functions - Parabolas – Vertex – Absolute Maximum or Absolute Minimum – Trasforming the Graph of f (x)= x 2 to Obtain the Graph of Any Quadratic Function. • Polynomial Functions – The Definition of a Polynomial – Identifying Polynomials – Leading Coefficient, Leading Term, and the Degree of a Polynomial – Constant Term of a Polynomial – Polynomial Division - The Division Algorithm – Roots and Zeros of a Polynomial – The Remainder Theorem – The Factor Theorem – The Rational Root Theorem – The Number of Roots of a Polynomial – Finding Rational Roots of a Polynomial – Finding Real Roots of a Polynomial – Graphs of Polynomials ∗ Leading Term vs. Shape of the Graph ∗ Continuous Graphs ∗ Smooth Graphs ∗ End Behavior of the Graph ∗ Multiplicity of a Root and Behavior of the Graph at x-intercepts. ∗ How Many Local Extrema Can a Polynomial Graph Have? (Sections 4.1-4.4) 1
Transcript of polynomials - University of Kentuckymshaw/ma110/polynomials.pdf · • is an x-intercept of the...

8 Polynomials
Concepts:
• Quadratic Functions
– The Definition of a Quadratic Function
– Graphs of Quadratic Functions - Parabolas
– Vertex
– Absolute Maximum or Absolute Minimum
– Trasforming the Graph of f(x) = x2 to Obtain the Graph of Any QuadraticFunction.
• Polynomial Functions
– The Definition of a Polynomial
– Identifying Polynomials
– Leading Coefficient, Leading Term, and the Degree of a Polynomial
– Constant Term of a Polynomial
– Polynomial Division - The Division Algorithm
– Roots and Zeros of a Polynomial
– The Remainder Theorem
– The Factor Theorem
– The Rational Root Theorem
– The Number of Roots of a Polynomial
– Finding Rational Roots of a Polynomial
– Finding Real Roots of a Polynomial
– Graphs of Polynomials
∗ Leading Term vs. Shape of the Graph
∗ Continuous Graphs
∗ Smooth Graphs
∗ End Behavior of the Graph
∗ Multiplicity of a Root and Behavior of the Graph at x-intercepts.
∗ How Many Local Extrema Can a Polynomial Graph Have?
(Sections 4.1-4.4)
1

We have already studied linear functions and power functions. Linear and power functionsare special types of functions known as polynomial functions. Polynomial functions haveseveral very nice properties. The domain of a polynomial function is (−∞,∞). The graphof a polynomial function is continuous and smooth. Intuitively, this means that you cansketch the graph without picking up your pencil and that there are no sharp corners onthe graph. (The graph of the greatest integer function is not continuous because there arebreaks in the graph. The graph of the absolute value function is not smooth because thereis a sharp corner at the tip of the vee.)
We will study several classes of functions in this course including polynomial, rational, expo-nential, logarithmic, and trigonometric functions. Functions in the same class have similarformulas or common origins. Polynomial functions have similar formulas. Trigonometricfunctions were all derived from ratios of right triangles. The graphs of functions in eachclass are distinctive. By the end of the semester, you should be able to look at a graph andidentify its class.
We begin with polynomial functions because they can be simply built from the power func-tions we have already studied. Linear functions are the simplest of all polynomial functions.Quadratic functions are next in the line of polynomial functions. Although quadratic func-tions are a bit more complicated than linear functions, we gain a lot by moving up a levelas you will see when we discuss optimization.
8.1 Quadratic Functions
Definition 8.1A quadratic function is a function that is equivalent to a function of the form
q(x) = ax2 + bx+ c
where a, b, and c are constants and a 6= 0.
Definition 8.2The graph of a quadratic function is called a parabola.
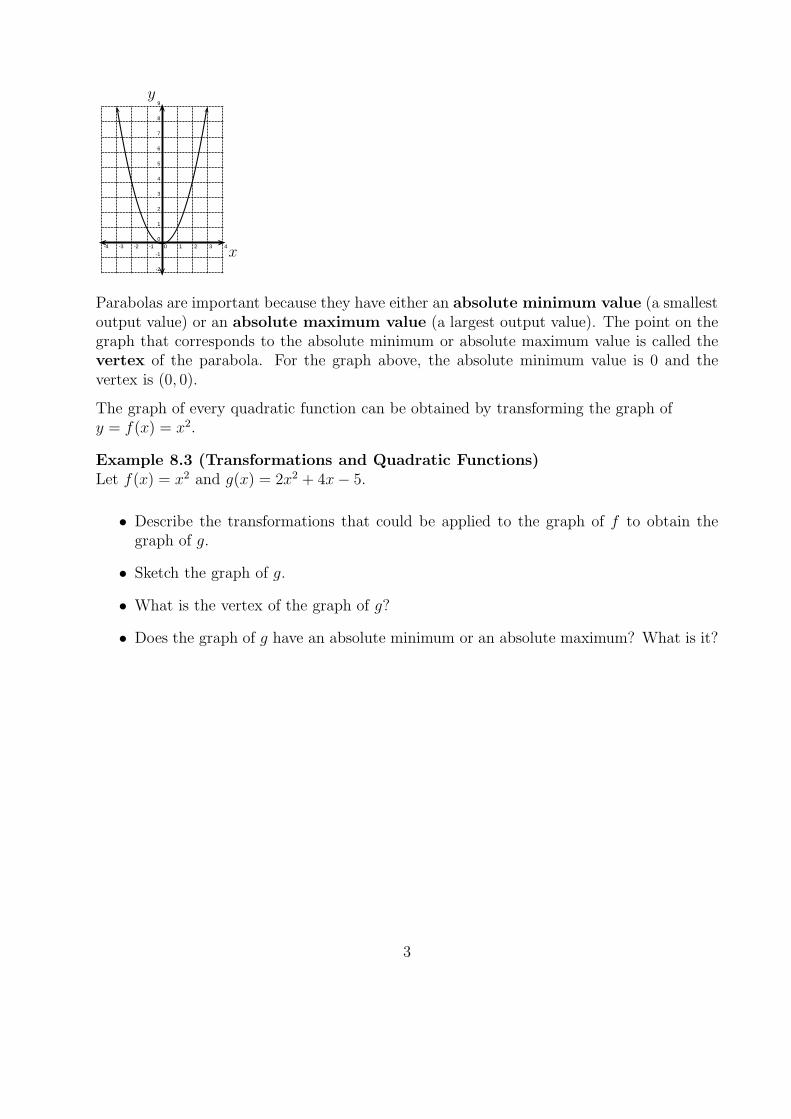
The most basic quadratic function is f(x) = x2. The graph of f is shown below.
2
-4 -3 -2 -1 0 1 2 3 4
-2
-1
0
1
2
3
4
5
6
7
8
9
x
y
Parabolas are important because they have either an absolute minimum value (a smallestoutput value) or an absolute maximum value (a largest output value). The point on thegraph that corresponds to the absolute minimum or absolute maximum value is called thevertex of the parabola. For the graph above, the absolute minimum value is 0 and thevertex is (0, 0).
The graph of every quadratic function can be obtained by transforming the graph ofy = f(x) = x2.
Example 8.3 (Transformations and Quadratic Functions)Let f(x) = x2 and g(x) = 2x2 + 4x− 5.
• Describe the transformations that could be applied to the graph of f to obtain thegraph of g.
• Sketch the graph of g.
• What is the vertex of the graph of g?
• Does the graph of g have an absolute minimum or an absolute maximum? What is it?
3

-10 -9 -8 -7 -6 -5 -4 -3 -2 -1 0 1 2 3 4 5 6 7 8 9 10
-10
-9
-8
-7
-6
-5
-4
-3
-2
-1
0
1
2
3
4
5
6
7
8
9
10
x
y
4

Example 8.4 (Transformations and Quadratic Functions)Let f(x) = x2 and g(x) = −3x2 + 2x− 4.
• Describe the transformations that could be applied to the graph of f to obtain thegraph of g.
• Sketch the graph of g.
• What is the vertex of the graph of g?
• Does the graph of g have an absolute minimum or an absolute maximum value? Whatis it?
-10 -9 -8 -7 -6 -5 -4 -3 -2 -1 0 1 2 3 4 5 6 7 8 9 10
-10
-9
-8
-7
-6
-5
-4
-3
-2
-1
0
1
2
3
4
5
6
7
8
9
10
x
y
5

Example 8.5 (Optimization)A farmer has 200 feet of fencing to construct five rectangular pens. as shown in the diagrambelow.
What is the maximum possible area of all five pens?
6

Example 8.6 (Min or Max?)
• When does a quadratic function have an absolute maximum?
• When does a quadratic function have an absolute minimum?
8.2 Polynomials
Definition 8.7A polynomial in x is an algebraic expression that is equivalent to an expression of the form
anxn + an−1x
n−1 + · · ·+ a1x+ a0
where n is a non-negative integer, x is a variable, and the ai’s are all constants.
In a polynomial, ai is called the coefficient of xi and a0 is called the constant term ofthe polynomial. If the polynomial contains only a constant term, it is called a constantpolynomial. If the polynomial equals 0, then it is called the zero polynomial.
To find the degree of a polynomial, find all xis with nonzero coefficients. List their expo-nents. (The exponent corresponding to a nonzero constant term is zero since a0 = a0x
0.)The degree is the largest exponent in the list. The degree of the zero polynomial is undefinedsince your list will be empty. The degree of a constant polynomial that is not the zero poly-nomial is zero. If k is the degree of the polynomial, then the coefficient of xk is the leadingcoefficient of the polynomial and akx
k is the leading term of the polynomial.
Example 8.8 (Polynomials)Which of the following are polynomials? If the expression is a polynomial, find its degreeand leading term.
• x3 + 3x4 + 2
• x3 + 0x4 + 2
• x−3 + 3x4 + 2
•√2x+ 1
7

•√2x+ 1
• 1
5x7 + 2x3 +
2
9x+ x8 + 3x4 + 5x8
• 1
5x7+ 2x3 +
2
9x+ x8 + 3x4 + 5x8
• x1
3 + 3x4 + 2
• 7
2
• 0
Example 8.9 (Review of Long Division)Use long division to find the quotient and the remainder.
7843
3
Example 8.10 (Polynomial Division)Find the quotient and the remainder.
3x3 − 2x2 + 4x− 3
x+ 4
8
Example 8.11 (Polynomial Division)Find the quotient and the remainder.
x5 + 3x2 + 1
x2 + 3
9

Theorem 8.12 (The Division Algorithm)Let P (x) and D(x) be polynomials. Then there are unique polynomials Q(x) and R(x) suchthat
P (x) = D(x)Q(x) +R(x)
and either R(x) is the zero polynomial or the degree of R(x) is less than the degree of D(x).
Definition 8.13In the Division Algorithm:
• P (x) is the dividend.
• D(x) is the divisor.
• Q(x) is the quotient.
• R(x) is the remainder.
Example 8.14 (A Preview of the Factor and Remainder Theorems)Let P (x) = x2 + 5x+ 6. Find the quotient and remainder of
P (x)
x+ 3.
• What does the remainder tell you about the factors of P ?
• What does the remainder tell you about P (3)?
• What does the remainder tell you about the graph of P ?
10

Definition 8.15 (Roots and Zeros)Let P (x) be a polynomial. The number c is called a root or a zero of P if and only ifP (c) = 0.
Example 8.16 (A Preview of the Factor and Remainder Theorems)Let P (x) = 2x4 + 1. Find the quotient and remainder of
P (x)
x+ 2.
• What does the remainder tell you about the factors of P ?
• What does the remainder tell you about P (−2)?
• What does the remainder tell you about the graph of P ?
Theorem 8.17Let P (x) and D(x) be polynomials. Then D(x) is a factor of P (x) if and only if the remainder
of the division problemP (x)
D(x)is the zero polynomial.
Theorem 8.18 (The Remainder Theorem)Let P (x) be a polynomial. Then
P (c) = the remainder of the division problemP (x)
x− c.
11

The next theorem includes the phrase, “The following are equivalent. . .” This means thatall the statements are true or all of them are false. It is never the case that some are trueand some are false.
Theorem 8.19The following are equivalent for the polynomial P (x):
• (x− c) is a factor of P (x).
• is a root of P (x).
• P (c) = .
• is an x-intercept of the graph of P .
Theorem 8.20 (Number of Roots)A polynomial of degree n has at most n distinct roots.
8.2.1 Finding Roots of Polynomials
The roots or zeros of a polynomial are often important in applications. When a polynomialhas integer coefficients, the Rational Roots Theorem allows us to narrow the search for rootswhich are rational numbers.
Theorem 8.21 (The Rational Roots Theorem)Let
P (x) = anxn + an−1x
n−1 + · · ·+ a1x+ a0 (an 6= 0)
be a polynomial with integer coefficients. If r
sis a rational number in lowest terms and
r
sis a root of P then
• r is a factor of a0 AND
• s is a factor of an.
Example 8.22 (The Rational Roots Theorem)Let P (x) = 3x3− 8x2−x+10. List all of the possible rational roots of P (x) as given by theRational Roots Theorem. (Do not check to see which are actually zeros.)
12

Example 8.23 (Finding all Rational Roots of a Polynomial)Let P (x) = 2x4 + 3x3 − 16x2 + 3x+ 2. Find all the rational roots of P (x). What does thistell you about the factors of P (x)?
Example 8.24Completely factor 6160.
Suppose you know that (x− c) is a factor of P (x). What does this mean? How can you usethis information to completely factor P (x)?
13

Example 8.25 (Finding all Real Roots of a Polynomial)Let P (x) = 2x4 + 3x3 − 16x2 + 3x+ 2. Find all the real roots of P (x).
Example 8.26 (Finding all Real Roots of a Polynomial)Let P (x) = 3x4 + 10x3 + 9x2 − 16x− 6. Find all the real roots of P (x).
14
Example 8.27 (Finding all Real Roots of a Polynomial)
Let P (x) =1
2x4 +
3
4x3 − 4x2 +
3
4x+
1
2. Find all the real roots of P (x).
8.2.2 Graphs of Polynomials
Basic Shapes
Example 8.28Sketch the graphs of y = f(x) = 3x2, y = g(x) = x10, and y = h(x) = −5x4 in the sameviewing window.
15
Example 8.29Sketch the graphs of y = f(x) = 5x3, y = g(x) = 3x9, and y = h(x) = −2x11 in the sameviewing window.
Let f(x) = axn.
• What is the basic shape of the graph of f if a is positive and n is even?
• What is the basic shape of the graph of f if a is positive and n is odd?
• What is the basic shape of the graph of f if a is negative and n is even?
• What is the basic shape of the graph of f if a is negative and n is odd?
16

Special Properties of Polynomials Graphs
(P-1) Polynomial Graphs are continuous.
When you study Calculus, you will study the precise definition of a continuous func-tion. At this point in your studies, you can begin to understand the idea that lead tothe precise definition. The graph of a functions is continuous if there are no breaksin the graph. In other words, you arrive at the point that you are headed towards.The graph of a function is continuous on an interval if there are no breaks in thegraph for all input values in the interval.
(P-2) Polynomial graphs are smooth.
The graph of a polynomial does not have any sharp corners.
(P-3) The shape of a polynomial graph is dominated by the leading term when|x| is large.
For example, let’s consider the graphs of y = 2x3 and y = 2x3 + 5x2 − 4x− 3.
Viewing Window [−5, 5]× [−10, 10] Viewing Window [−5, 5]× [−100, 100]
Viewing Window [−100, 100]× [−1000000, 1000000]
We can see that for small values of x (x ∈ [−5, 5]) there are some noticeable differencesin the graphs if we zoom in close enough, but for larger values of x (x ∈ [−100, 100]),the graphs are almost indistinguishable. Think about what would happen if welooked at even larger values of x. The fluctuations that take place at smaller x valuesare caused by the x2, the x, and the constant terms. Eventually, these pieces of the
17

polynomial have little influence because the 2x3 term begins to dominate the shape ofthe graph. More formally, we say that the graphs of y = 2x3 and y = 2x3+5x2−4x−3have the same end behavior.
Eventually, the leading term of any polynomial will dominate the shape of its graph,so the end behavior of a polynomial graph can be determined by examining the graphof the leading term.
END BEHAVIOR:We have some notation to help us describe the end behavior of graphs.
• If the y values become very large as x becomes very large, we denote this by
y → ∞ as x → ∞.
• If the y values become very large and negative as x becomes very large, we denotethis by
y → −∞ as x → ∞.
• If the y values become very large as x becomes very large and negative, we denotethis by
y → ∞ as x → −∞.
• If the y values become very large and negative as x becomes very large and negative,we denote this by
y → −∞ as x → −∞.
Example 8.30 (End Behavior)Describe the end behavior of the graph of y = 7− x+ 3x8.
Example 8.31 (End Behavior)Describe the end behavior of the graph of y = axn.
18

Example 8.32Describe the end behavior of the graph of y = (5− x)3(2x+ 15)71.
(P-4) The graph of a polynomial of degree n can have at most n x-intercepts.
Example 8.33 (To Cross or To Touch and Turn Around?)Look at the following graphs, and describe the behavior of the graph at x = 3 andx = −5.
(a) y = (x− 3)(x+ 5)
(b) y = (x− 3)2(x+ 5)
(c) y = (x− 3)3(x+ 5)
(d) y = (x− 3)4(x+ 5)
(e) y = (x− 3)(x+ 5)2
(f) y = (x− 3)2(x+ 5)3
(g) y = (x− 3)3(x+ 5)4
Definition 8.34If (x− c)k is a factor of a polynomial P (x) an no higher power of (x− c) is a factorof the polynomial, then c is called a root of multiplicity k of the polynomial P .
Example 8.35 (Multiplicity of a root)Let P (x) = (x−1)2(x−2)(x+4)7(x+7)9. List the roots of P and their multiplicities.Describe the behavior of the graph of P at each x-intercept.
19
Theorem 8.36Let P (x) be a polynomial and let c be a root of multiplicity k of P .
• If k is odd, then the graph of P crosses the x-axis at (c, 0).
• If k is even, then the graph of P touches the x-axis at (c, 0) but does not cross the
x-axis at (c, 0).
(P-5) The graph of a polynomial of degree n has at most n− 1 local extrema.
Definition 8.37A local extremum is a local minimum or a local maximum. The plural of “local extremum”is “local extrema”
On a graph, a local minimum appears as the point at the bottom of of a valley and alocal maximum appears as the point at the top of a mountain. This does not meanthat it is the lowest valley or the highest mountain. You are looking for all valleysand all mountains.
Example 8.38 (Local Extrema)
• Could the graph of a 7th degree polynomial have 8 local extrema?
• Could the graph of a 7th degree polynomial have 7 local extrema?
• Could the graph of a 7th degree polynomial have 6 local extrema?
• Could the graph of a 7th degree polynomial have 5 local extrema?
• Could the graph of a 7th degree polynomial have 4 local extrema?
Example 8.39 (Local Extrema)
• How many local extrema could the graph of a polynomial of degree 10 have?
• How many local extrema could the graph of a polynomial of degree 11 have?
20

Example 8.40 (The Characteristics of a Polynomial Graph)The graph shown below is NOT the graph of y = f(x) = (x − 4)(x− 6)2(x+ 1). Which ofthe following are clues that this is NOT the graph of f?
(a) The graph crosses the x-axis at (6, 0), but it should not cross the x-axis at this point.
(b) The graph has too many local extreme points to be the graph of a polynomial of degree4.
(c) The graph crosses the x-axis at (−1, 0), but it should not cross the x-axis at this point.
(d) The graph displays the wrong end behavior.
(e) The graph does not cross the x-axis at (4, 0), but it should cross the x-axis at this point.
(f) The graph has the wrong x-intercepts.
21