Polymorph stabilization in processed acetaminophen powders
11
Polymorph stabilization in processed acetaminophen powders Anna Łuczak a , Laila J. Jallo b , Rajesh N. Dave b , Zafar Iqbal a, ⁎ a Department of Chemistry and Environmental Science, New Jersey Institute of Technology, 138 Warren Street, Newark, NJ 07102‐1982, USA b Department of Chemical, Biological and Pharmaceutical Engineering, and New Jersey Center for Engineered Particulates, New Jersey Institute of Technology, 138 Warren Street, Newark, NJ 07102‐1982, USA abstract article info Available online 29 May 2012 Keywords: Polymorphs Raman spectroscopy Dry coating Stabilization Dissolution A novel approach has been developed to stabilize the metastable form II of acetaminophen (APAP) prepared from the melt of micronized and nano-silica coated APAP I. It is suggested that stabilization of form II APAP occurs by pinning via van der Waals-type interactions on low energy defects created by micronization and impinging particles during dry coating in form I APAP, heating to the melt phase, and cooling. The defects are likely to persist into the near-molten isotropic phase due to a permanent memory effect similar to that previously observed in silica-liquid crystal composites and re-crystallize together with form II APAP. Raman spectroscopy, scanning electron microscopy (SEM), powder X-ray diffraction (PXRD), and conven- tional as well as intrinsic dissolution have been used to characterize the stabilized APAP II obtained. Raman measurements up to 18 months and PXRD data for micronized form II APAP show no indication of APAP I formation. Aged samples of dry-coated APAP II however display Raman features indicative of APAP I within 5 months. PXRD and SEM techniques also detected small fractions of APAP I in dry-coated APAP II. Both micronized APAP II and dry-coated APAP II give rise to a time-dependent background scattering superimposed on the Raman spectra which increases in integrated intensity with time, saturates at 180 and 90 days, respectively, and then decreases in intensity with further aging. The time-dependent scattering background occurs in the stabilized form II APAP samples only after cooling from the melt and is more intense in micronized APAP II compared to dry-coated APAP II. It is assigned to disorder associated with slowly diffusing defects created by micronization and dry coating with impinging nano-silica particles in form I APAP. Intrinsic dissolution profiles for the stabilized APAP II samples showed measureable increases, partic- ularly for micronized APAP II. © 2012 Elsevier B.V. All rights reserved. 1. Introduction Acetaminophen (APAP) is a widely used analgesic drug which provides an excellent example of an organic polymorphic system since it is known to exist in three forms with different crystalline struc- tures in addition to its structurally disordered amorphous phase. Form I APAP is monoclinic, form II is orthorhombic, and form III is too unstable for its structure to be determined by X-ray methods. The commercial form I is the most stable at room temperature, but it has poor binding and densification properties [1]. Both form I and II can be grown out of the molten state of APAP crystals; however the unstable form III can only be grown from the molten state at specific conditions, for example, between two flat surfaces [2] or by use of a nanoporous host [3]. From the commercial point of view, it is desirable to stabilize the metastable form II because of its enhanced compression behavior and higher intrinsic dissolution rate [4,5] compared to form I. The compres- sion properties of the form I and II polymorphs relate to different molecular packing in the two forms. The molecules form puckered layers in the form I polymorph and flat sheets or layers in form II, as evident from Fig. 1(a) and (b), respectively. Van der Waals inter- molecular bonding occurs between the sheets and stronger inter- molecular hydrogen bonding exists among the molecules in the sheets. As shown in Fig. 2(b), two types of hydrogen bonding, NH···O and OH···O, which differ significantly in their corresponding bond lengths — 2.91 Å and 2.65 Å in form I and 2.97 Å and 2.72 Å in form II, are observed in APAP crystals [6]. The shorter (stronger) intra-layer hydrogen bonding in form I results in its higher melting point and great- er thermodynamic stability relative to the form II [7,8]. Another inter- esting feature is the higher plastic deformability of form II relative to the form I, which is consistent with its flat layered architecture in contrast to the puckered architecture of the molecules in the form I. The relative orientation of layers of acetaminophen molecules in each structural type relates to compaction properties and behavior of each phase under pressure. The more planar orientation of the sheets in form II is responsible for its well-developed slip planes and higher plastic deformability [9]. Form I does not deform plastically since the relative orientation of the molecular sheets are in a puckered arrange- ment. As a result, form I crystallites break by brittle fracture and require Powder Technology 236 (2013) 52–62 ⁎ Corresponding author. Tel.: + 1 973 596 8571. E-mail address: [email protected] (Z. Iqbal). 0032-5910/$ – see front matter © 2012 Elsevier B.V. All rights reserved. doi:10.1016/j.powtec.2012.05.046 Contents lists available at SciVerse ScienceDirect Powder Technology journal homepage: www.elsevier.com/locate/powtec
Transcript of Polymorph stabilization in processed acetaminophen powders
Powder Technology 236 (2013) 52–62
Contents lists available at SciVerse ScienceDirect
Powder Technology
j ourna l homepage: www.e lsev ie r .com/ locate /powtec
Polymorph stabilization in processed acetaminophen powders
Anna Łuczak a, Laila J. Jallo b, Rajesh N. Dave b, Zafar Iqbal a,⁎a Department of Chemistry and Environmental Science, New Jersey Institute of Technology, 138 Warren Street, Newark, NJ 07102‐1982, USAb Department of Chemical, Biological and Pharmaceutical Engineering, and New Jersey Center for Engineered Particulates, New Jersey Institute of Technology, 138 Warren Street, Newark,NJ 07102‐1982, USA
⁎ Corresponding author. Tel.: +1 973 596 8571.E-mail address: [email protected] (Z. Iqbal).
0032-5910/$ – see front matter © 2012 Elsevier B.V. Alldoi:10.1016/j.powtec.2012.05.046
a b s t r a c t
a r t i c l e i n f oAvailable online 29 May 2012
Keywords:PolymorphsRaman spectroscopyDry coatingStabilizationDissolution
A novel approach has been developed to stabilize the metastable form II of acetaminophen (APAP) preparedfrom the melt of micronized and nano-silica coated APAP I. It is suggested that stabilization of form II APAPoccurs by pinning via van der Waals-type interactions on low energy defects created by micronization andimpinging particles during dry coating in form I APAP, heating to the melt phase, and cooling. The defectsare likely to persist into the near-molten isotropic phase due to a permanent memory effect similar to thatpreviously observed in silica-liquid crystal composites and re-crystallize together with form II APAP.Raman spectroscopy, scanning electron microscopy (SEM), powder X-ray diffraction (PXRD), and conven-tional as well as intrinsic dissolution have been used to characterize the stabilized APAP II obtained. Ramanmeasurements up to 18 months and PXRD data for micronized form II APAP show no indication of APAP Iformation. Aged samples of dry-coated APAP II however display Raman features indicative of APAP I within5 months. PXRD and SEM techniques also detected small fractions of APAP I in dry-coated APAP II. Bothmicronized APAP II and dry-coated APAP II give rise to a time-dependent background scatteringsuperimposed on the Raman spectra which increases in integrated intensity with time, saturates at 180and 90 days, respectively, and then decreases in intensity with further aging. The time-dependent scatteringbackground occurs in the stabilized form II APAP samples only after cooling from the melt and is more intensein micronized APAP II compared to dry-coated APAP II. It is assigned to disorder associated with slowlydiffusing defects created by micronization and dry coating with impinging nano-silica particles in form IAPAP. Intrinsic dissolution profiles for the stabilized APAP II samples showed measureable increases, partic-ularly for micronized APAP II.
© 2012 Elsevier B.V. All rights reserved.
1. Introduction
Acetaminophen (APAP) is a widely used analgesic drug whichprovides an excellent example of an organic polymorphic systemsince it is known to exist in three forms with different crystalline struc-tures in addition to its structurally disordered amorphous phase. Form IAPAP is monoclinic, form II is orthorhombic, and form III is too unstablefor its structure to be determined by X-ray methods. The commercialform I is the most stable at room temperature, but it has poor bindingand densification properties [1]. Both form I and II can be grown outof the molten state of APAP crystals; however the unstable form IIIcan only be grown from the molten state at specific conditions, forexample, between two flat surfaces [2] or by use of a nanoporous host[3]. From the commercial point of view, it is desirable to stabilize themetastable form II because of its enhanced compression behavior andhigher intrinsic dissolution rate [4,5] compared to form I. The compres-sion properties of the form I and II polymorphs relate to different
rights reserved.
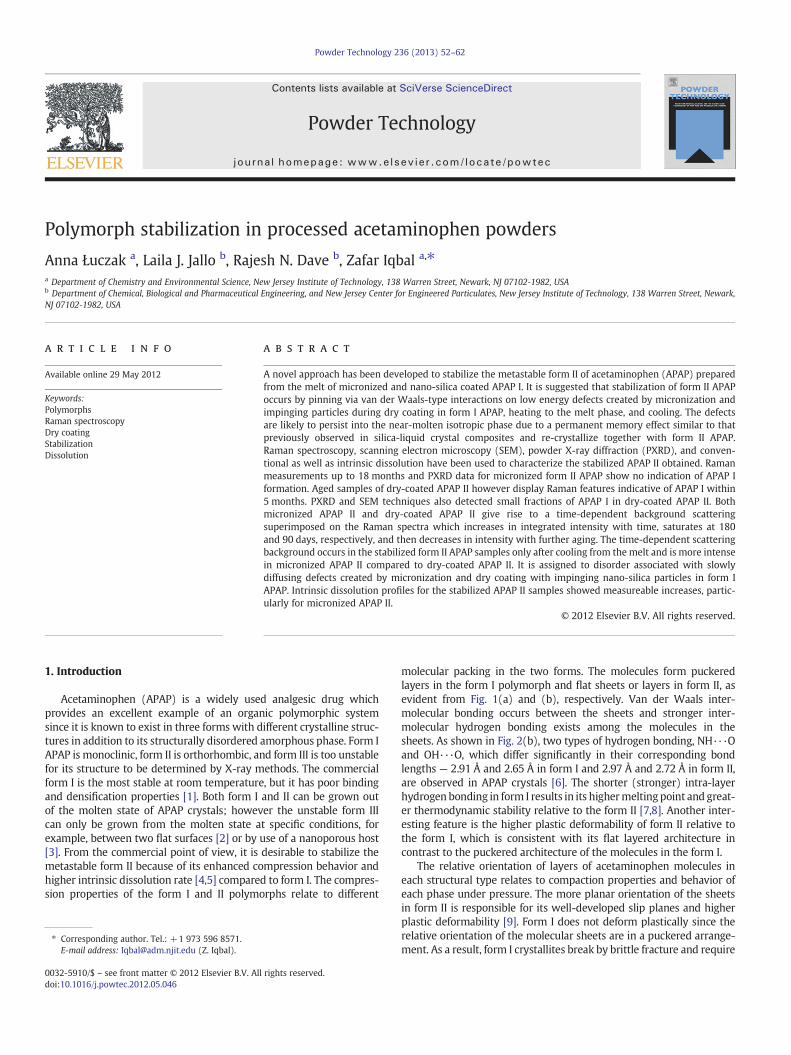
molecular packing in the two forms. The molecules form puckeredlayers in the form I polymorph and flat sheets or layers in form II, asevident from Fig. 1(a) and (b), respectively. Van der Waals inter-molecular bonding occurs between the sheets and stronger inter-molecular hydrogen bonding exists among the molecules in thesheets. As shown in Fig. 2(b), two types of hydrogen bonding, NH···Oand OH···O, which differ significantly in their corresponding bondlengths — 2.91 Å and 2.65 Å in form I and 2.97 Å and 2.72 Å in form II,are observed in APAP crystals [6]. The shorter (stronger) intra-layerhydrogen bonding in form I results in its highermeltingpoint and great-er thermodynamic stability relative to the form II [7,8]. Another inter-esting feature is the higher plastic deformability of form II relative tothe form I, which is consistent with its flat layered architecture incontrast to the puckered architecture of the molecules in the form I.
The relative orientation of layers of acetaminophen molecules ineach structural type relates to compaction properties and behavior ofeach phase under pressure. The more planar orientation of the sheetsin form II is responsible for its well-developed slip planes and higherplastic deformability [9]. Form I does not deform plastically since therelative orientation of the molecular sheets are in a puckered arrange-ment. As a result, form I crystallites break by brittle fracture and require
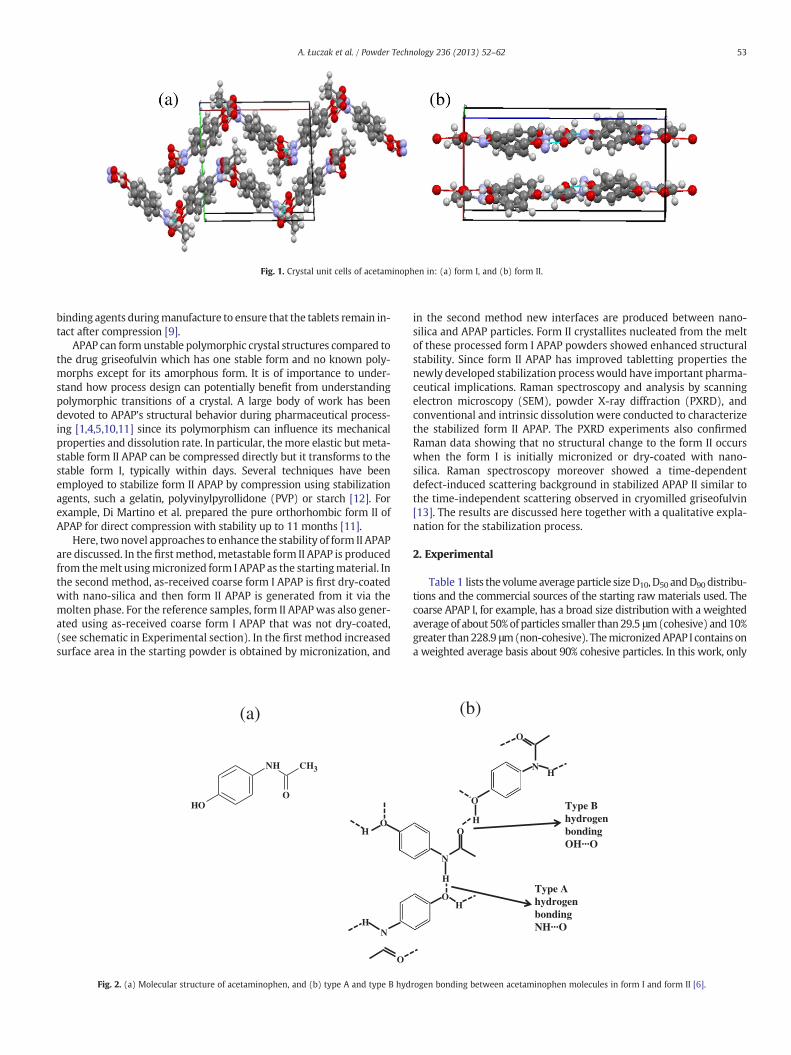
Fig. 1. Crystal unit cells of acetaminophen in: (a) form I, and (b) form II.
53A. Łuczak et al. / Powder Technology 236 (2013) 52–62
binding agents duringmanufacture to ensure that the tablets remain in-tact after compression [9].
APAP can form unstable polymorphic crystal structures compared tothe drug griseofulvin which has one stable form and no known poly-morphs except for its amorphous form. It is of importance to under-stand how process design can potentially benefit from understandingpolymorphic transitions of a crystal. A large body of work has beendevoted to APAP's structural behavior during pharmaceutical process-ing [1,4,5,10,11] since its polymorphism can influence its mechanicalproperties and dissolution rate. In particular, themore elastic butmeta-stable form II APAP can be compressed directly but it transforms to thestable form I, typically within days. Several techniques have beenemployed to stabilize form II APAP by compression using stabilizationagents, such a gelatin, polyvinylpyrollidone (PVP) or starch [12]. Forexample, Di Martino et al. prepared the pure orthorhombic form II ofAPAP for direct compression with stability up to 11 months [11].
Here, two novel approaches to enhance the stability of form II APAPare discussed. In the firstmethod,metastable form II APAP is producedfrom themelt usingmicronized form I APAP as the startingmaterial. Inthe second method, as-received coarse form I APAP is first dry-coatedwith nano-silica and then form II APAP is generated from it via themolten phase. For the reference samples, form II APAPwas also gener-ated using as-received coarse form I APAP that was not dry-coated,(see schematic in Experimental section). In the first method increasedsurface area in the starting powder is obtained by micronization, and
(a)
NH
OOH
CH3
OH
NH
O
Fig. 2. (a) Molecular structure of acetaminophen, and (b) type A and type B hyd
in the second method new interfaces are produced between nano-silica and APAP particles. Form II crystallites nucleated from the meltof these processed form I APAP powders showed enhanced structuralstability. Since form II APAP has improved tabletting properties thenewly developed stabilization processwould have important pharma-ceutical implications. Raman spectroscopy and analysis by scanningelectron microscopy (SEM), powder X-ray diffraction (PXRD), andconventional and intrinsic dissolution were conducted to characterizethe stabilized form II APAP. The PXRD experiments also confirmedRaman data showing that no structural change to the form II occurswhen the form I is initially micronized or dry-coated with nano-silica. Raman spectroscopy moreover showed a time-dependentdefect-induced scattering background in stabilized APAP II similar tothe time-independent scattering observed in cryomilled griseofulvin[13]. The results are discussed here together with a qualitative expla-nation for the stabilization process.
2. Experimental
Table 1 lists the volumeaverageparticle sizeD10, D50 andD90 distribu-tions and the commercial sources of the starting rawmaterials used. Thecoarse APAP I, for example, has a broad size distribution with a weightedaverage of about 50%of particles smaller than29.5 μm(cohesive) and10%greater than228.9 μm(non-cohesive). ThemicronizedAPAP I contains ona weighted average basis about 90% cohesive particles. In this work, only
(b)
Type B hydrogen bonding OH···O
Type A hydrogen bondingNH···O
NH
O
O
HO
N
H
OH
rogen bonding between acetaminophen molecules in form I and form II [6].

- 0.2
0
0.2
0.4
0.6
0.8
1 10 100 1000
Den
sity
Dis
trib
utio
n
Particle Size (µm)
Uncoated CAPAP
Dry Coated CAPAP
Fig. 3. Bimodal size distribution of the uncoated and dry-coated as-received coarseacetaminophen (CAPAP I).
54 A. Łuczak et al. / Powder Technology 236 (2013) 52–62
the coarse APAP I was dry-coated with 1 wt.% nano-silica. The amount ofsilica depositedwas sufficient to cover a large proportion of the surface toprevent particle–particle contact between the API particles as evidentfrom Fig. 6. Raman spectroscopy and PXRD measurements performedafter dry coating showed no resulting chemical and structural changes,respectively.
2.1. Dry coating method
Detailed description of the dry coating method can be found else-where [14,15], and is briefly discussed here. The method employs thetechnique of Magnetically Assisted Impaction Coating (MAIC). A mea-sured amount of magnetic, host and guest particles at a determinedratio is placed in a glass jar, which is placed in a collar coil. Voltageis applied, creating an oscillating magnetic field, which acceleratesand spins the magnets along with the host and guest particles inthe jar. This promotes the collisions among the particles and withthe wall of the vessel. During this process, guest particles get coatedonto the surface of the host particles mainly due to impaction of flu-idized magnetic particles. This device may be used with only a smallamount of material, typically 5 g. However, the device can be rec-onfigured to provide continuous, scaled up operation, which hasbeen done by Aveka, Inc., who manufactures this continuous deviceand has coated various powders at industrial scale.
2.2. Preparation of form II APAP
Form II APAPwas generated fromas-received coarseAPAP I (CAPAP I),as-received micronized APAP I (MAPAP I), and nano-silica dry-coatedcoarse APAP I as presented schematically below. The resulting form IIAPAP samples are labeled as: CAPAP II, MAPAP II, and dry-coated APAPII, respectively.
1. Preparation of reference form II APAP:As-received Coarse APAP I (CAPAP I) →Melt CAPAP II
Table 1Particle size and sources of the raw materials used.
Material Sources Particle size
D10 D50 D90
Coarse acetaminophen(CAPAP Form I)
AnMar InternationalLtd, USA
3.7 μm 29.5 μm 228.9 μm
Micronized acetaminophen(MAPAP Form I)
Mallinckrodt Inc.,U.S.A
2.6 μm 10.7 μm 37.3 μm
Nano-silica (hydrophilic) Cabot Inc., U.S.A – 16 nm –
2. Preparation of stabilized form II APAP:As-received micronized APAP I (MAPAP I) →Melt MAPAP IIAs-received Coarse APAP I (CAPAP I) →Dry−coating Dry-coatedCAPAP I →Melt Dry-coated APAP II
The procedure involves placing a few milligrams of a sample on aglass slide and melting at 190 °C. The hot melt was rapidly cooled in afreezer resulting in a thin film of form II APAP on the glass slide. Theformation of the orthorhombic form II was confirmed by Raman spec-troscopy in the thin films or crushed powders (for dissolution stud-ies). All form II APAP samples prepared as described above werestored under ambient temperature and humidity conditions duringthe stability studies.
2.3. Conventional dissolution rate (CDR)
Dissolution analysis was performed using a basket dissolution tes-ter Distek 2100A USP apparatus 1 (North Brunswick, New Jersey).Samples were tested according to the USP29-NF24 monograph foracetaminophen capsules. The dissolution profile was obtained as perspecified conditions in monograph using a dissolution tank with sixdissolution vessels, 900 ml each, equipped with rotating basketswith samples instead of paddles. Approximately 50 mg of samplewas enclosed in a gelatin capsule and placed in each of the dissolutionbaskets, immersed into the vessel with deionized (DI) water at 37 °C,and rotated at a constant speed of 50 rpm. The water bath tempera-ture was constant during the experiment.
Aliquots of 5 ml were removed at time intervals, t=0, 5, 10, 15, 20,25 and 30min and analyzed using a Varian Cary 50 Bio UV–visiblespectrophotometer (Palo Alto, California). A calibration curve was gen-erated by a set of freshly prepared standard solutions of 0.005 mg/ml,0.010 mg/ml, 0.025 mg/ml, 0.050 mg/ml, and 0.060 mg/ml concentra-tions of as-received, coarse form I APAP (CAPAP I) in water. All sampleswere run in triplicate to create a dissolution profile and a reliable dataset. Dissolution analyses were performed for the following forms ofacetaminophen indicated in schematic above: CAPAP I, CAPAP II,MAPAP II, and dry-coated APAP II.
2.4. Intrinsic dissolution rate (IDR)
A Vankel, VK 7000 dissolution apparatus equipped with compactedand rotating diskwas employed to perform intrinsic dissolution on fourbatches of acetaminophen: CAPAP I, CAPAP II, MAPAP II, and dry-coatedAPAP II. Sampling and experimental conditions were the same asdescribed above for the conventional dissolution rate study. A typicalIDR apparatus consists of a steel plunger and die, and a stainless steelsample holder for direct compaction. Approximately 40 mg powdersample of CAPAP I was directly compressed using a hydraulic CarverPress Model C, applying a pressure of 3 kN for 30 s to form a 0.6 mmdiameter disc inside the sample holder. The same procedure wasrepeated for the remaining batches, where each batch analysis was per-formed in triplicate. The sample holder was attached to the rotatingshaft and immersed into the dissolution bath. Prior to analysis, the airpockets formed at the bottom of the sample holder during immersionwere carefully removed. Using a Cary 50 UV–visible spectrometer, anda set of standards of the same concentrations as above, the mass ofdissolved acetaminophenwas calculated after correcting for the changein volume and including the disk area. For both types of dissolution test-ing, thin films were gently crushed to generate powders which werethen confirmed to be form II APAP by Raman spectroscopy.
2.5. Raman spectroscopy
Two Raman instruments were used to record Raman spectra: (a) Aconfocal Horiba–Jobin Yvon LabRammicro-Raman spectrometer witha 20 mW He-Ne laser source emitting at a wavelength of 632.8 nm
55A. Łuczak et al. / Powder Technology 236 (2013) 52–62
focused to a spot size of 10 μmwith a 10× lens; and (b) aMesophotonicsSE 1000 Raman spectrometer calibrated to 2 cm−1 with a 250 mWnear-infrared laser operating at 785 nm with a 130 μm diameter spot size.Typical acquisition time for all spectra recorded was 10 s per scannedspectrum. Each spectrum acquired using the Horiba–Jobin Yvon LabRammicro-Raman spectrometer was averaged over 2 scans. Data acquiredwith theMesophotonics SE 1000 Raman spectrometer represent an aver-age of 5 scans, for a total of 50 s. All Ramandata shown are as-recorded bythe instruments used.
2.6. Powder X-ray diffraction
X-ray diffraction patterns for the powders were obtained using awide-angle Philips X'pert PW3040 X-Ray Diffractometer with CuKαradiation (λ=1.5406 Å) operating at 40 kV and 30 mA, with 2θ rang-ing from 5° to 50°.
2.7. Scanning electron microscopy (SEM)
SEM images were obtained with a VP-1530 Carl Zeiss LEO (Peabody,MA) field emission scanning electron microscope. The samples, which
0
6000
12000
1210 1230
(a)
(c)(b)
0
5000
10000
15000
20000
50 550 1050 155
Arb
itra
ry I
nten
sity
(co
unts
/s)
Raman
Scattering backgro
0
3000
6000
9000
50 100 150 200 250 300
Arb
itra
ry I
nten
sity
(co
unts
/s)
Arb
itra
ry I
nten
sity
(co
unts
/s)
Raman Shift (cm-1) Rama
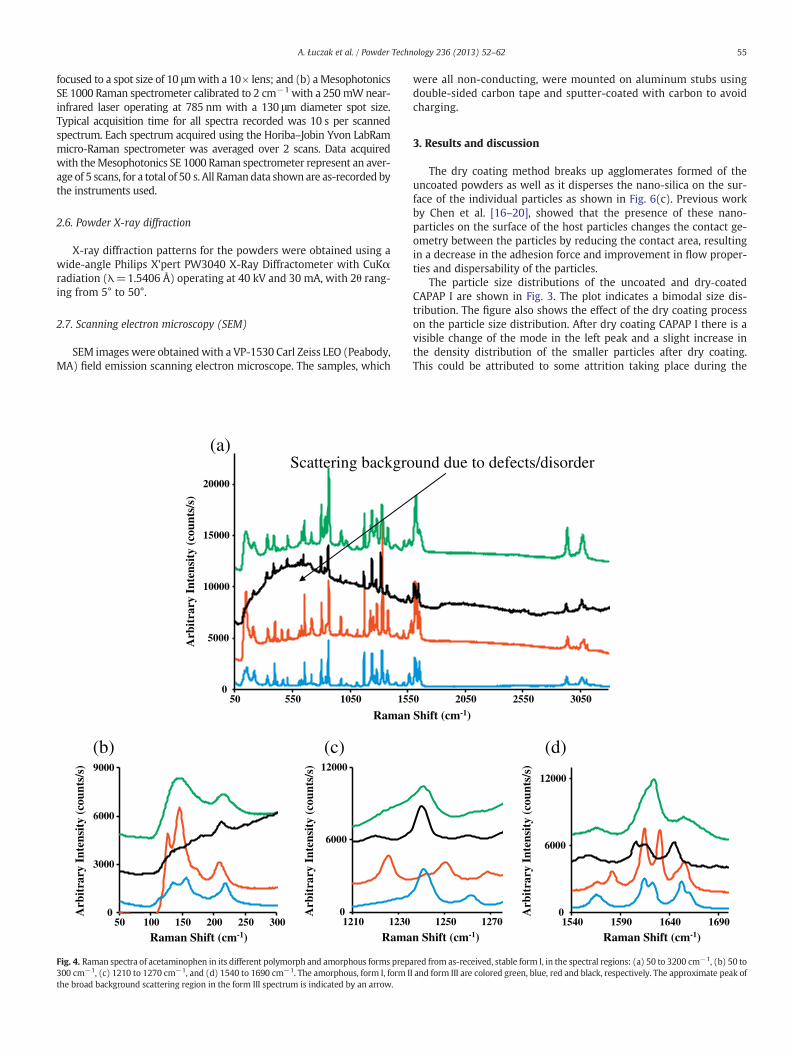
Fig. 4. Raman spectra of acetaminophen in its different polymorph and amorphous forms prepa300 cm−1, (c) 1210 to 1270 cm−1, and (d) 1540 to 1690 cm−1. The amorphous, form I, form Ithe broad background scattering region in the form III spectrum is indicated by an arrow.
were all non-conducting, were mounted on aluminum stubs usingdouble-sided carbon tape and sputter-coated with carbon to avoidcharging.
3. Results and discussion
The dry coating method breaks up agglomerates formed of theuncoated powders as well as it disperses the nano-silica on the sur-face of the individual particles as shown in Fig. 6(c). Previous workby Chen et al. [16–20], showed that the presence of these nano-particles on the surface of the host particles changes the contact ge-ometry between the particles by reducing the contact area, resultingin a decrease in the adhesion force and improvement in flow proper-ties and dispersability of the particles.
The particle size distributions of the uncoated and dry‐coatedCAPAP I are shown in Fig. 3. The plot indicates a bimodal size dis-tribution. The figure also shows the effect of the dry coating processon the particle size distribution. After dry coating CAPAP I there is avisible change of the mode in the left peak and a slight increase inthe density distribution of the smaller particles after dry coating.This could be attributed to some attrition taking place during the
1250 12700
6000
12000
1540 1590 1640 1690
0 2050 2550 3050
Shift (cm-1)
und due to defects/disorder
Arb
itra
ry I
nten
sity
(co
unts
/s)
n Shift (cm-1) Raman Shift (cm-1)
(d)
red from as-received, stable form I, in the spectral regions: (a) 50 to 3200 cm−1, (b) 50 toI and form III are colored green, blue, red and black, respectively. The approximate peak of

56 A. Łuczak et al. / Powder Technology 236 (2013) 52–62
dry coating process. However, the distribution profile of the uncoatedand dry coated are similar. It must also be noted that although the de-vice used here can only coat small quantities of material, it can be rec-onfigured to provide continuous, industrially-relevant operation.
3.1. Raman spectra of acetaminophen polymorphs
Raman scattering is one of the most widely used techniquesemployed to study polymorphism in solids because of its high sensi-tivity to crystalline structure. It is therefore used here as the primarytool to monitor changes in form II APAP prepared from micronizedAPAP I and dry coated CAPAP I as a function of elapsed time. Ramanspectra shown in Fig. 4, together with the frequencies and their pos-sible assignments in Table 2, for all four polymorphic types includingthe amorphous form of APAP have been measured down to 100 cm−1
50000Scattering Background
0200 400
45000
01200 1250
600 800 1000
Raman Sh
Raman Sh
Arb
itra
ry I
nten
sity
(co
unts
/s)
Arb
itra
ry I
nten
sity
(co
unts
/s)
(a)
(b)
Fig. 5. Raman spectra of stabilized form II acetaminophen as a function of time for sample prepaand (b) 1200 to 1350 cm−1; and dry-coated CAPAP I in the spectral region from (c) 200 to 2intensity of the background scattering as a function of time in days. The full line curve in Fig. 5
and are in essential agreement with the data previously reported bySzelagiewicz et al. [21] and Kauffman et al. [22]. Raman lines below200 cm−1, studied for the first time to the best of our knowledge,are assigned to inter-molecular or lattice modes which are particular-ly sensitive to the lattice structure and clearly show differences be-tween the four APAP forms. In form I, the lowest frequency lines at136 cm−1 and 155 cm−1 are assigned to largely translational mo-tions of the acetaminophen molecule, similar to observations in gris-eofulvin [13]. Both of these lines shift to lower frequencies (127 cm−1
and 145 cm−1, respectively) in form II APAP. In the amorphous form,long-range crystalline order is lost and the molecules are randomlyoriented. The low frequency Raman lines however persist in theamorphous phase due to remnant short-range order but are substan-tially broadened due to the effects of long-range disorder. In form III,the translational mode features are not evident in the spectrum and
1300 1350
ift (cm-1)
ift (cm-1)
1200 1400 1600 1800 2000
0 month
10
35000
90 180Time (Days)
Inte
nsit
y (c
ount
s/s)
300 550
6 months
18 months
0 month
6 months
18 months
APAP I
red bymelting frommicronizedMAPAP I in the spectral region from (a) 200 to 2000 cm−1
000 cm−1 and (d) 1200 to 1350 cm−1. Insets in Figs. 5(a) and 5(c) show the integrated(a) is an approximate guide to the eye of the background scattering.

20000
0200 400 600 800 1000
Raman Shift (cm-1)
Raman Shift (cm-1)
1200 1400 1600 1800
12000
20000
1250 1300 1350
2000
0 month
1 90Time (Days)
Inte
nsit
y (c
ount
s/s)
150
10000
0
3 months
5 months
0 month
3 months
5 months
APAP I
Arb
itra
ry I
nten
sity
(co
unts
/s)
Arb
itra
ry I
nten
sity
(co
unts
/s)
(c)
(d)
Fig. 5 (continued).
57A. Łuczak et al. / Powder Technology 236 (2013) 52–62
appear to be embedded in a broad scattering background similar tothat seen in cryomilled griseofulvin [13].
Raman lines attributed to intra-molecular vibrational modes are ob-served at frequencies above 200 cm−1 for the different polymorphs andthe amorphous form as shown in Fig. 4(a and b). Changes in these linesoccur in the different phases due to changes in local potentials and aremore subtle than those for the Raman features assigned to inter-molecular or lattice vibrations discussed above. More detailed viewsof the Raman features in the spectral regions between 1200 cm−1 to1280 cm−1 and between 1500 cm−1 to 1650 cm−1 are indicated inFig. 4(c) and (d), respectively. The Raman lines in the 1200 cm−1 to1260 cm−1 frequency region correspond to C\N, C\H, and phenylring vibrations [23]. The characteristic C\N stretching Raman line at1237 cm−1 for form I APAP develops into two well resolved peaks at1221 cm−1 and 1245 cm−1 in form II APAP due to change in local sym-metry. Furthermore, there is substantial disorder-induced broadeningof the 1237 cm−1 line in the amorphous phasewith almost no frequen-cy shift relative to that of the line in the form I. In the form III this line
also broadens but increases in frequency by 6 cm−1 to 1243 cm−1 indi-cating an increase in force constant associated with the C\N bond.
Additionally, other changes in the intra-molecular vibrational linesare observed in theRaman spectra as a function of crystalline polymorphor amorphous form in the 1500 cm−1 to 1650 cm−1 frequency regionas evident from Fig. 4(d). Here changes occur in the relative intensitiesand peak positions of Raman lines that are attributed to –N\Hdeforma-tion and C_O stretching modes. The strongest lines for form I APAP areseen at 1611 cm−1 and 1649 cm−1 and are assigned to –N\Hdeforma-tion and C_O stretching modes, respectively. In the amorphous formboth of these lines shift up in frequency by 9 cm−1 together with signif-icant broadening as well as an increase and decrease in relative peak in-tensity, respectively. These changes are most likely due to disorder inthe amorphous form and type A and B hydrogen bonding explainedin the Introduction. The upshift in the peak positions indicatethat the force constants for N\H deformation and C_O stretchingincrease probably because inter-molecular interactions aredisrupted in the amorphous form. In form III APAP intermolecular

Table 2Raman frequencies and qualitative mode assignments for acetaminophen in its threepolymorph and amorphous forms.
Form I Form II Form III Amorphous Qualitative assignments
(cm−1) (cm−1) (cm−1) (cm−1)
135 127 – –
155 145 146 143 Translational lattice modes– 172 183 –
205 208 210 –
218 – – 215326 330 330 330 Out-of-plane ring deformation388 388 388 388462 452 457 458 Out-of-plane ring deformation501 5050 505 508 Out-of-plane ring deformation649 649 646 650 In-plane ring deformation796 796 799 800 Phenyl ring stretch [22]839 – – 831 C\H out-of-plane bend856 856 862 864 Phenyl ring C\H stretching1169 1169 1172 1174 C\H in-plane bend– 1221 – – C\C stretch carbon phenyl ring1237 – – 1238 C\N stretch– 1245 1242 –
1278 1278 1278 1280 O\H and C\O combination,(ar) C\N stretch
1324 1326 1321 1328 C\H bend1371 1376 1374 1378 –CH3 umbrella mode1559 – 1562 1562 –H\N\C_O stretch [22]– 1578 – –
1611 1609 1614 1620 –N\H deformation [22]– 1623 – –
1649 1649 1647 1658 C_O stretch [22]2937 2940 2928 2938 –CH3 symmetric stretch3016 3018 3009 3018 –CH3 symmetric stretch– – 3045 – –CH3 symmetric stretch3058 3069 – – –CH3 symmetric stretch– – 3067 – –CH3 asymmetric stretch3072 – – 3072 –CH3 asymmetric stretch3083 3083 3095 – –CH asymmetric stretch,
phenyl ring– – 3095 –
3110 3111 – 3107 –CH asymmetric stretch,phenyl ring
3163 3166 3159 3155 O\H stretch3326 3328 3329 – N\H stretch
58 A. Łuczak et al. / Powder Technology 236 (2013) 52–62
interactions persist, and the line at 1611 cm−1 upshifts by 3 cm−1
whereas the line at 1649 cm−1 downshifts by 2 cm−1 due to changesin the local inter-molecular potentials. In form II, the form I APAP line
(a) (b)
10µm 10µm
Fig. 6. SEM images of (a) As-received CAPAP I, (b) As-received micronized APAP I, and (c) Nan
at 1611 cm−1 splits into two peaks at 1578 cm−1 and 1623 cm−1 indi-cating substantial changes in the hydrogen bonding interactions.
3.2. Monitoring the stability of APAP II by Raman spectroscopy
The Raman spectra in the 200 to 2000 cm−1 range over a period ofseveral months for form II APAP prepared from micronized and dry-coated form I APAP displayed in Fig. 5(a and c), respectively, showthe Raman spectral features of form II APAP discussed above and atime-dependent background scattering superimposed on the Ramanspectra. The expanded view of the Raman spectra as a function oftime in the 1200 to 1350 cm−1 range for APAP II from micronizedAPAP I together with the spectrum from APAP I (in blue) shown inFig. 5(b) indicate that the lines of APAP I in this spectral range near1230 and 1260 cm−1 are not observed even after 18 months, al-though small frequency downshifts are observed at 18 months. Thisconfirms the long-term stability of APAP II prepared via micro-nization. However, the corresponding spectra for APAP II fromnano-silica coated APAP I in Fig. 5(d) show larger downshifts in fre-quencies at shorter times after synthesis as well as the appearanceof weak spectral features due to the formation of APAP I consistentwith PXRD and SEM results discussed below.
The broad time-dependent scattering background superimposed onthe Raman spectra appears in the Raman spectra of stabilized MAPAP IIand dry-coated APAP II samples. The scattering is similar to that seenpreviously in cryomilled griseofulvin and related materials [13,24].The plots of the integrated intensities of this scattering as a function oftime for MAPAP II and dry-coated APAP II are shown as insets inFig. 5(a) and (d), respectively. The integrated intensities are muchhigher in MAPAP II compared to dry-coated APAP II. In both MAPAP IIand dry-coated APAP II the intensities increase with time and then de-crease after saturation at 180 days and 90 days, respectively. By analogywith Raman observations in cryomilled griseofulvin [13], the back-ground scattering observed can be assigned to defect-induced disorderinduced by the two processes used to prepare the form II APAP. The firstprocess involves micronization of APAP I followed by melting and crys-tallization on cooling and the second process involves dry coating byimpinging nano-silica particles on APAP I followed bymelting and crys-tallization. The defect density is expected to be higher inMAPAP II com-pared to dry-coated APAP II in agreement with the higher backgroundscattering intensity for MAPAP II (Fig. 5). The scattering intensity forMAPAP II and dry-coated APAP II increases with time followed by satu-ration and decrease in intensity after 180 and 90 days, respectively, the
(c)
o-silica dry-coated CAPAP I showing uniform and substantial surface coverage of a crystal.

Fig. 7. SEM images of APAP II thin film from as-received CAPAP I with increasing magnification from left to right. Pores discussed in the text are indicated by arrows.
59A. Łuczak et al. / Powder Technology 236 (2013) 52–62
time-dependence of the scattering is probably due to slow diffusion ofthe defects under ambient conditions during aging.
Although a quantitative model needs to be developed, it can beconjectured that long-term stabilization of MAPAP II and shorter-termstabilization of dry-coated APAP II occurs by pinning via van derWaals-type interactions on these low energy defect structures. Higherstabilization is achieved in MAPAP II compared to dry-coated APAP IIbecause of higher defect densities in the former. This is also in agree-ment with the Raman spectra which show very little indication ofform I in aged MAPAP II but weak features of form I appear in dry-coated APAP II aged for 5 months. Also, since the precursor defects arecreated in form I, they have to persist into the near-molten isotropicphase during preparation of form II APAP from the melt. Persistence ofthe defects initially created in form I APAP into the melt phase is likelyto occur due to a permanent memory effect similar to that observed insilica-liquid crystal composites [24] to provide sites for “pinning” theAPAP II structure crystallizing out of themelt. The observed backgroundscattering however only appears in MAPAP II and dry‐coated APAP IIafter crystallization from the melt. The reason for this is not entirelyclear and needs further investigation.
Fig. 8. SEM images at different magnifications for APAP
3.3. Characterization of stabilized APAP II polymorph by SEM imaging,and PXRD and dissolution measurements
3.3.1. Scanning electron microscopy (SEM)SEM studies were carried out to image the physical features of the
samples since various sample types with different morphologies wereused, such as as-received powders, thin films, and powders from crushedfilms. The orthorhombic and monoclinic form II and form I polymorphs,respectively, can be easily recognized due to differences in their crystalhabits, especially at higher magnifications. Fig. 6(a), (b), and (c) showrepresentative images of as-received coarse CAPAP I, as-receivedMAPAP I, and dry-coated CAPAP I, respectively. Figs. 7, 8, and 9 showSEM images of thin films of APAP II prepared from as-received CAPAP I,MAPAP II, and dry-coated APAP, respectively. Interestingly, APAP II fromas-received CAPAP I in Fig. 7 showed a large number of pores formed dur-ing film preparation. Higher surface area around the poreswould acceler-ate the transition back to APAP I. Pores, however, were not observed inMAPAP II and from dry-coated APAP II. Well-established crystal habitsof both form I APAP (monoclinic) and form II APAP (orthorhombic)were observed on the surface of dry-coated APAP II films shown in
II from micronized APAP I fabricated as a thin film.

Type I
Type II
Fig. 9. SEM images of dry-coated CAPAP II fabricated as a thin film. Presence of monoclinic (form I) and orthorhombic (form II) crystals are evident in the sample as indicated by arrows.
0
8000
10 15 20 25 30 35 40
Inte
nsit
y [a
rb u
nits
]
0
8000
10 15 20 25 30 35 40
Inte
nsit
y [a
rb u
nits
]
Diffraction Angle 2 -[°]
MAPAP II
MAPAP I
Dry Coated APAP II
Dry Coated APAP I
(a)
(b)
Diffraction Angle 2 -[°]
Fig. 10. Wide-angle powder X-ray diffraction patterns of acetaminophen samplesobtained using CuKα radiation, λ=1.5406 Å, (panel a) micronized APAP I (MAPAP I)and MAPAP II from micronized APAP I, and (panel b) dry-coated coarse CAPAP I andAPAP II from dry-coated CAPAP I.
60 A. Łuczak et al. / Powder Technology 236 (2013) 52–62
Fig. 9 (indicated by arrows), consistentwith the Raman spectra and XRPDresults below.
3.3.2. Powder X-ray diffraction (PXRD)Wide-angle PXRD diffraction data obtained using CuKα radiation
are shown in Fig. 10(a) for MAPAP I and MAPAP II, and in Fig. 10(b)for dry-coated APAP I and APAP II, respectively. PXRD data for MAPAPI and II, and dry-coated APAP I agree with that of Welton et al. [23].However the PXRD pattern of dry-coated APAP II shows the presenceof small quantities of form I consistent with the Raman results.
3.3.3. Dissolution profilesBy definition, “dissolution is defined as the process by which solid
substances enters a solvent to yield a solution” [25]. Conventional dis-solution rate (CDR) analysis was carried out to test the behavior ofthe stabilized form II APAP samples.
Equal amounts of all samples used for CDR were enclosed in gelatincapsules. However, since CAPAP I was used as powder and CAPAP II,MAPAP II, and dry-coated APAP II samples were obtained by crushingthe thin films, the gelatin capsules consisted of particles with varyingsurface areas. Although the polymorph form is one of the solid statecharacteristics affecting dissolution, in this case the CDR profile wasstrongly related to the disintegration of the solid particle of varioussizes and shapeswithin the capsules rather than the physical propertiesof the drug, such as its polymorph form. Fig. 11(a) compares the disso-lution profiles of CAPAP I and CAPAP II with those of MAPAP II and dry-coated APAP II. It can be seen that almost complete mass release is seenin CAPAP I within the first 10 min of analysis; this was followed byCAPAP II. The two modified acetaminophen form II samples showedno improvement in dissolution rate, in fact it took almost three timesas long, compared to APAP form I, for these samples to dissolvecompletely.
Sincemodified APAP form II samples are generated frommicronizedand dry-coated CAPAP I, it is important to understand the influence ofthese solid state characteristics of the formulation on dissolution. Theintrinsic dissolutionmethodwas used to deduce the relative solubilitiesof themetastable forms of APAP. During intrinsic dissolution, a constantsurface area is exposed to the dissolution medium. IDR is described bythe Eq. (1) referred to as the Noyes–Whitney equation [26]:
J ¼ dmdt
·1A¼ k Cs−Cð Þ ð1Þ
where dm/dt is the rate of increase of the mass of solute released perunit time t, k is the mass transfer coefficient, A is the surface area of
the sample, Cs is the intrinsic solubility at the sample surface, and C isthe concentration of solute dissolved in time t. Eq. (1) can be further re-duced to Eq. (2), since for sink conditions Cs>>C,
J ¼ dmdt
·1A¼ kCS ð2Þ

0
4000
8000
12000
0 10 20 30
Tot
al M
ass
Rel
ease
d (µ
g)
Time (min)
0
20000
40000
0 10 20 30
Tot
al M
ass
Rel
ease
d (µ
m)
Time (min)
CAPAP I
CAPAP II
MAPAP II
Dry-coatedAPAP II
(a)
(b)
Fig. 11. (a) Conventional dissolution rate profiles for as-received CAPAP I, APAP II fromCAPAP I, MAPAP II from micronized MAPAP I and dry-coated APAP II from CAPAP I, and(b) intrinsic dissolution rate profiles for the same samples as in (a).
61A. Łuczak et al. / Powder Technology 236 (2013) 52–62
Eq. (2) indicates that the rate of dissolution J, is a function of thesolid surface area. There are many known surface modification tech-niques, such as particle size (micronization), crystalline form of a solid(polymorphs), or coating that can act as a barrier to the dissolutionrate. Since both micronization and surface coating were employedhere to generate form II APAP samples, intrinsic dissolution with acompressed disk of known area was employed to eliminate surfacearea and surface electrical charges as dissolution variables. The dissolu-tion rate so determined can bemore closely correlatedwith the physicalproperties of the sample [26].
By holding the extrinsic factors such as agitation, pH, temperature,and surface area of the sample constant, the IDR of the pure solid wasmeasured. From Fig. 11(b) it is evident that both MAPAP II and dry-coated APAP II show measureable increases in dissolution relative toCAPAP I. Dry-coated form II APAP also showed improvement inmass release, but the improvement relative to CAPAP I is small. Differ-ent dissolution profiles indicate that the form I and II polymorphs dis-solved at different rates. The calculated intrinsic dissolution rates forMAPAP II, dry-coated APAP II, and CAPAP II samples were 1.50, 1.33,and 1.31 mg/min/cm2 respectively with %RSD value below 6% for alldissolution time points. Lower rate was obtained for CAPAP I sampleequal to 1.14 mg/min/cm2, with %RSD below 6%. As expected, allAPAP form II samples resulted in higher intrinsic dissolution ratesthan the form I APAP sample.
4. Conclusions
MAPAP II prepared from micronized APAP I and dry-coated APAP IIprepared from coarse APAP I show long- and shorter-term stabilizationof the form II APAP polymorph. Ramanmeasurements up to 18 months
and PXRD data for MAPAP II show no indication of APAP I formation.Aged samples of dry-coated APAP II however displayRaman features in-dicative of APAP I within 5 months. PXRD and SEM techniques alsodetected small fractions of APAP I in dry-coated APAP II. Both MAPAPII and dry-coated APAP II give rise to a time-dependent backgroundscattering superimposed on the Raman spectra which increases in inte-grated intensity with time, saturates at 180 and 90 days, respectively,and then decreases in intensity with further aging. The time-dependentscattering background which only appears in form II APAP samples afterpreparation from the melt is more intense in MAPAP II compared todry-coatedAPAP II. It is assigned to disorder associatedwith slowly diffus-ing defects created by micronization and impinging particles during drycoating in form I APAP. Stabilization of MAPAP II and dry-coated APAP IIoccurs by pinning via van derWaals-type interactions on these low ener-gy defects. Longer term stabilization is achieved inMAPAP II compared todry-coated APAP II because of higher defect densities in the former. It issuggested that the defects formed in form I APAP persist into the near-molten isotropic phase on heating due to a permanent memory effectsimilar to that previously observed in silica-liquid crystal composites[24] and then re-crystallize together with form II APAP on cooling.Measureable increaseswere also observed in the intrinsic dissolution pro-files for the stabilized APAP II samples and particularly for MAPAP II.
Acknowledgments
This work was funded by the National Science Foundation Engi-neering Research Center for Structured Organic Particulate Systems(Grant no. EEC-0540855). Special thanks to Aveka, Inc., Woodbury,MN, for providing the use of the MAIC, Dr. Costas Gogos of the NewJersey Institute of Technology for providing the use of the convention-al dissolution tester, and Dr. Shirlynn Chen of Boehringer-Ingelheim,Ridgefield, CT, for the use of the instrumentation for intrinsic dissolu-tion testing.
References
[1] M. Sacchetti, Thermodynamic analysis of DSC data for acetaminophen poly-morphs, Journal of Thermal Analysis and Calorimetry 63 (2001) 345–350.
[2] P.D. Martino, P. Conflant, M. Drache, J.-P. Huvenne, A.-M. Guyot-Hermann, Preparationand physical characterization of forms II and III of paracetamol, Journal of ThermalAnalysis 48 (1997) 447–458.
[3] M. Beiner, G.T. Rengarajan, S. Pankaj, D. Enke, M. Steinhart, Manipulating thecrystalline state of pharmaceuticals by nanoconfinement, Nano Letters 7 (2007)1381–1385.
[4] G.L. Perlovich, T.V. Volkova, A. Bauer-Brandl, Polymorphism of paracetamol: rela-tive stability of the monoclinic and orhtorhombic phase revisited by sublimationand solution calotimetry, Journal of Thermal Analysis and Calorimetry 89 (2007)767–774.
[5] T. Beyer, G.M. Day, S.L. Price, The prediction, morphology, andmechanical propertiesof the polymorphs of paracetamol, Journal of the American Chemical Society 123(21) (2001) 5086–5094.
[6] S.L. Wang, S.Y. Lin, Y.S. Wei, Transformation of metastable forms of acetamino-phen studied by thermal Fourier Transform infrared (FT-IR) microspectroscopy,Chemical and Pharmaceutical Bulletin 50 (2002) 153–156.
[7] M. Haisa, S. Kashin, H. Maeda, The orthorhombic form of p-hydroxyacetanilide,Acta Crystallographica Section B 30 (1974) 2510–2512.
[8] M. Haisa, S. Kashino, T. Yuasa, K. Akigawa, Topochemical studies. IX. The crystaland molecular structure of p-aminoacetophenone, Acta Crystallographica SectionB 32 (1976) 1326–1328.
[9] G. Nichols, C.S. Frampton, Physicochemical characterization of the orthorhombicpolymorph of paracetamol crystallized from solution, Journal of PharmaceuticalSciences 87 (6) (1998) 684–693.
[10] J.S. Capes, R.E. Cameron, Effect of polymer addition on the contact line crystallisationof paracetamol, Crystal Engineering Communications 9 (2007) 84–90.
[11] P.D. Martino, A.M. Guyot-Hermann, P. Conflant, M. Drache, J.C. Guyot, A new pureparacetamol for direct compression: the orthorhombic form, International Jour-nal of Pharmaceutics 128 (1996) 1–8.
[12] J.-M. Fachaux, A.-M. Guyot-Hermann, J.-C. Guyot, P. Conflant, M. Drache, S. Veesler,et al., Pure paracetamol for direct compression Part I. Development of sintered-likecrystals of paracetamol, Powder Technology 82 (2) (1995) 123–128.
[13] A. Żarów, B. Zhou, X. Wang, R. Pinal, Z. Iqbal, Spectroscopic and X-ray diffractionstudy of structural disorder in cryomilled and amorphous Griseofulvin, AppliedSpectroscopy 65 (2011) 135–143.
[14] M. Ramlakhan, C.Y. Wu, S. Watano, R.N. Dave, R. Pfeffer, Dry particle coating usingmagnetically assisted impaction coating: modification of surface properties and

62 A. Łuczak et al. / Powder Technology 236 (2013) 52–62
optimization of system and operating parameter, Powder Technology 112 (2000)137–148.
[15] J. Yang, A. Sliva, A. Banerjee, R. Dave, R. Pfeffer, Dry particle coating for improvingthe flowability of cohesive powders, Powder Technology 158 (2005) 21–33.
[16] Y. Chen, L. Jallo, M.A.S. Quintanilla, R. Dave, Characterization of particle and bulklevel cohesion reduction of surface modified fine aluminium powders, Colloidsand Surfaces A: Physicochemical and Engineering Aspect 361 (2010) 66–80.
[17] Y. Chen, J. Yang, R.N. Dave, R. Pfeffer, Fluidization of coated group C powders,American Institute of Chemical Engineers Journal 54 (2008) 104–121.
[18] L. Jallo, Y. Chen, J. Bowen, F. Etzler, R.N. Dave, Prediction of inter-particle adhesionforce from surface energy and surface roughness, Journal of Adhesion Science andTechnology 18 (2011) 367–384.
[19] L. Jallo, C. Ghoroi, L. Gurumurthy, U. Patel, R.N. Davé, Improvement of flow andbulk density of pharmaceutical powders using surface modification, InternationalJournal of Pharmaceutics 423 (2011) 213–225.
[20] L. Jallo, M. Schoenitz, E.L. Dreizin, R.N. Dave, C.E. Johnson, The effect of surfacemodification of aluminum powder on its flowability, combustion and reactivity,Powder Technology 204 (2010) 63–70.
[21] M. Szelagiewicz, C. Marcolli, S. Cianferani, A.P. Hard, A. Vit, A. Burkhard, et al., Insitu characterization of polymorphic forms: the potential of Raman spectroscopy,Journal of Thermal Analysis and Calorimetry 57 (1999) 23–43.
[22] J.F. Kauffman, L.M. Batykefer, D.D. Tuschel, Raman detected differential scanningcalorimetry of polymorphic transformations in acetaminophen, Journal of Phar-maceutical and Biomedical Analysis 48 (2008) 1310–1315.
[23] G. Socrates, Infrared and Raman Characteristic Group Frequencies, 3rd ed. JohnWiley & Sons, Ltd., England, 2000.
[24] S. Relaix, R.L. Leheny, L. Reven, M. Sutton, Memory effect in composites of liquidcrystal and silica aerosil, Physical Review E 84 (2011) 061705.
[25] V. Kumar, D. Tewari, Dissolution, in: D.B. Troy (Ed.), Remington: The Science andPractice of Pharmacy, 21 ed., Lippincott Williams & Wilkins, Philadelphia, 2005,p. 672.
[26] H.-K. Chan, D.J. Grant, Influence of compaction on the intrinsic dissolution rate ofmodified acetaminophen and adipic acid crystals, International Journal of Phar-maceutics 57 (1989) 117–124.