POLYMERS - gtu.edu.trabl.gtu.edu.tr/hebe/AblDrive/68431132/w/Storage/... · •Originally natural...
41
POLYMERS STRUCTURE AND MECHANICAL BEHAVIOUR
Transcript of POLYMERS - gtu.edu.trabl.gtu.edu.tr/hebe/AblDrive/68431132/w/Storage/... · •Originally natural...
POLYMERS
STRUCTURE AND MECHANICAL BEHAVIOUR

2
What is a polymer?
Poly mermany repeat unit
Adapted from Fig. 14.2, Callister 7e.
C C C C C C
HHHHHH
HHHHHH
Polyethylene (PE)
ClCl Cl
C C C C C C
HHH
HHHHHH
Polyvinyl chloride (PVC)
HH
HHH H
Polypropylene (PP)
C C C C C C
CH3
HH
CH3CH3H
repeat
unit
repeat
unit
repeat
unit
3
Ancient Polymer History
• Originally natural polymers were used
– Wood – Rubber
– Cotton – Wool
– Leather – Silk
• Oldest known uses
– Rubber balls used by Incas
– Noah used pitch (a natural polymer) for the ark

4
Polymer Composition
Most polymers are hydrocarbons– i.e. made up of H and C
• Saturated hydrocarbons– Each carbon bonded to four other atoms
CnH2n+2
C C
H
H HH
HH

5
Unsaturated Hydrocarbons
• Double & triple bonds relatively reactive – can form new bonds– Double bond – ethylene or ethene - CnH2n
• 4-bonds, but only 3 atoms bound to C’s
– Triple bond – acetylene or ethyne - CnH2n-2
C C
H
H
H
H
C C HH

6
Chemistry of PolymersAdapted from Fig.
14.1, Callister 7e.
Note: polyethylene is just a long HC
- paraffin is short polyethylene

7
Bulk or Commodity Polymers


10
MOLECULAR WEIGHT
iiw
iin
MwM
MxM
Mw is more sensitive to higher
molecular weights
Lower M higher M
Adapted from Fig. 14.4, Callister 7e.
xi: number fraction of chains
wi:weight fraction of chains
Mi:Mean molecular weight of size range i.

The melting or softening temperature increases
with increasing molecular weight (for up to about
100,000 g/mol)
At room temperature, polymers with very short
chains (having molecular weights on the order of
100 g/mol) exist as liquids
or gases.
Other properties that depend on molecular weight
include elastic modulus and strength

Example: A polymer has three species of molecular
weights: 3 × 10⁶, 4 × 10⁶, and 5 × 10⁶. Compute its
number-averaged molecular weight Mn and weight-
averaged molecular weight Mw .
iin MxM
iiw MwM
Solution:
)10x5(3
1)10x4(
3
1)10x3(
3
1 666
610x4
)10x5(12
5)10x4(
12
4)10x3(
12
3 666
610x17.4

13
• Covalent chain configurations and strength:
Direction of increasing strength
Adapted from Fig. 14.7, Callister 7e.
Molecular Structures
B ranched Cross-Linked NetworkLinear
secondarybonding

14
Polymer CrystallinityEx: polyethylene unit cell
• Crystals must contain the polymer chains in some way
– Chain folded structure
10 nm
Adapted from Fig.
14.10, Callister 7e.
Adapted from Fig.
14.12, Callister 7e.

15
Polymer CrystallinityPolymers rarely 100% crystalline
• Too difficult to get all those chains aligned
• % Crystallinity: % of material
that is crystalline.-- TS and E often increase
with % crystallinity.
-- Annealing causes
crystalline regions
to grow. % crystallinity
increases.
Adapted from Fig. 14.11, Callister 6e.
(Fig. 14.11 is from H.W. Hayden, W.G. Moffatt,
and J. Wulff, The Structure and Properties of
Materials, Vol. III, Mechanical Behavior, John Wiley
and Sons, Inc., 1965.)
crystalline region
amorphousregion

Effect of CrystallinityCyrstallinity
elongation, toughness
stiffness, strength, thermal stability, chemical resistance
Density, crystallinity and tensile strength in polyethylene
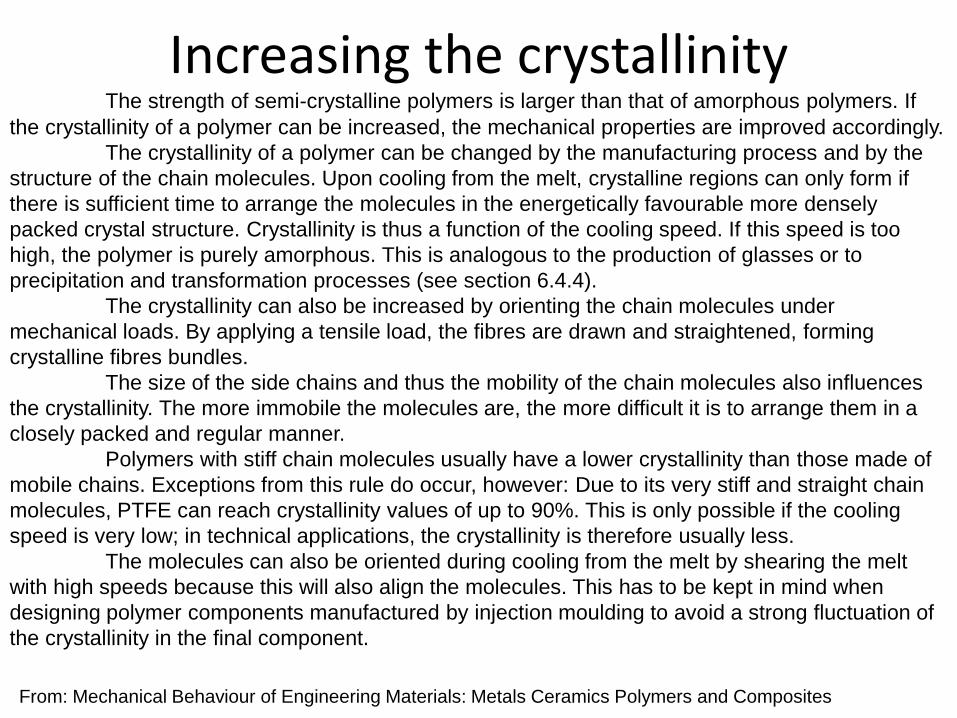
Increasing the crystallinityThe strength of semi-crystalline polymers is larger than that of amorphous polymers. If
the crystallinity of a polymer can be increased, the mechanical properties are improved accordingly.
The crystallinity of a polymer can be changed by the manufacturing process and by the
structure of the chain molecules. Upon cooling from the melt, crystalline regions can only form if
there is sufficient time to arrange the molecules in the energetically favourable more densely
packed crystal structure. Crystallinity is thus a function of the cooling speed. If this speed is too
high, the polymer is purely amorphous. This is analogous to the production of glasses or to
precipitation and transformation processes (see section 6.4.4).
The crystallinity can also be increased by orienting the chain molecules under
mechanical loads. By applying a tensile load, the fibres are drawn and straightened, forming
crystalline fibres bundles.
The size of the side chains and thus the mobility of the chain molecules also influences
the crystallinity. The more immobile the molecules are, the more difficult it is to arrange them in a
closely packed and regular manner.
Polymers with stiff chain molecules usually have a lower crystallinity than those made of
mobile chains. Exceptions from this rule do occur, however: Due to its very stiff and straight chain
molecules, PTFE can reach crystallinity values of up to 90%. This is only possible if the cooling
speed is very low; in technical applications, the crystallinity is therefore usually less.
The molecules can also be oriented during cooling from the melt by shearing the melt
with high speeds because this will also align the molecules. This has to be kept in mind when
designing polymer components manufactured by injection moulding to avoid a strong fluctuation of
the crystallinity in the final component.
From: Mechanical Behaviour of Engineering Materials: Metals Ceramics Polymers and Composites

18
Melting vs. Glass Transition Temp.What factors affect Tm and Tg?
• Both Tm and Tg increase with increasing chain stiffness
• Chain stiffness increased by
1. Bulky sidegroups
2. Polar groups or sidegroups
3. Double bonds or aromatic chain groups
• Regularity – effects Tm only
Adapted from Fig. 15.18,
Callister 7e.
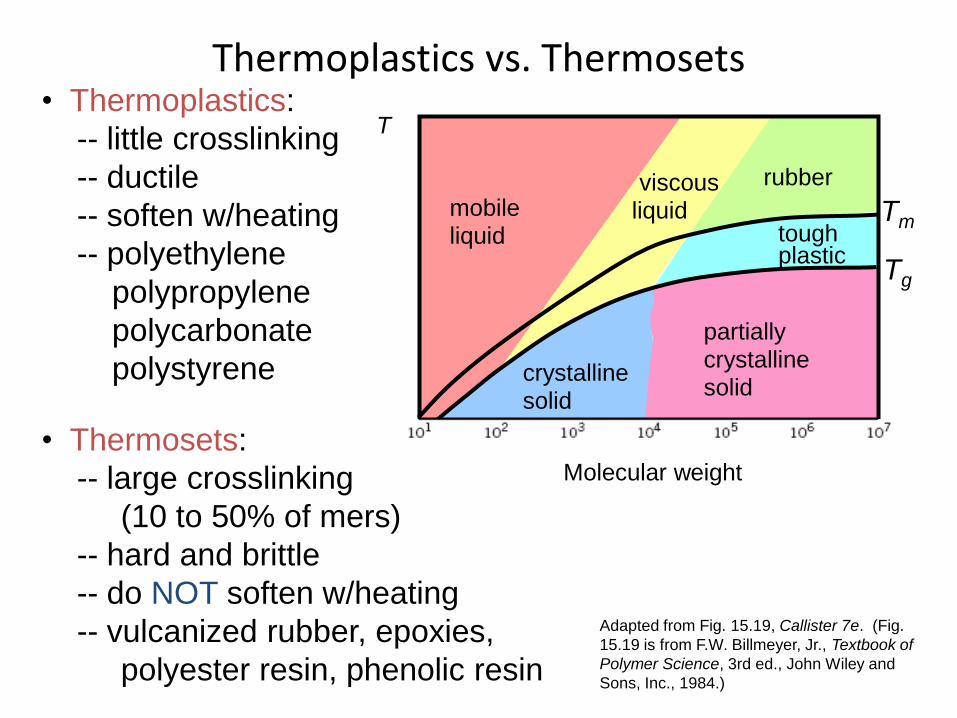
• Thermoplastics:
-- little crosslinking
-- ductile
-- soften w/heating
-- polyethylene
polypropylene
polycarbonate
polystyrene
• Thermosets:
-- large crosslinking
(10 to 50% of mers)
-- hard and brittle
-- do NOT soften w/heating
-- vulcanized rubber, epoxies,
polyester resin, phenolic resin
Adapted from Fig. 15.19, Callister 7e. (Fig.
15.19 is from F.W. Billmeyer, Jr., Textbook of
Polymer Science, 3rd ed., John Wiley and
Sons, Inc., 1984.)
Thermoplastics vs. Thermosets
Callister, Fig. 16.9
T
Molecular weight
Tg
Tmmobile liquid
viscousliquid
rubber
tough plastic
partially crystalline solid
crystalline solid

20
Mechanical Properties• i.e. stress-strain behavior of polymers
brittle polymer
plastic
elastomer
U of polymer ca. 10% that of metals
Strains – deformations > 1000% possible
(for metals, maximum strain 100% or less)
elastic modulus
– less than metal
Adapted from Fig. 15.1,
Callister 7e.


23
Tensile Response: Brittle & Plastic
brittle failure
plastic failure
(MPa)
e
x
x
crystalline
regions
slide
fibrillar
structure
near
failure
crystalline
regions align
onset of
necking
Initial
Near Failure
semi-
crystalline
case
aligned,
cross-
linked
case
networked
case
amorphous
regions
elongate
unload/reload
Stress-strain curves adapted from Fig. 15.1, Callister 7e. Inset figures along plastic response curve adapted from
Figs. 15.12 & 15.13, Callister 7e. (Figs. 15.12 & 15.13 are from J.M. Schultz, Polymer Materials Science, Prentice-
Hall, Inc., 1974, pp. 500-501.)
24
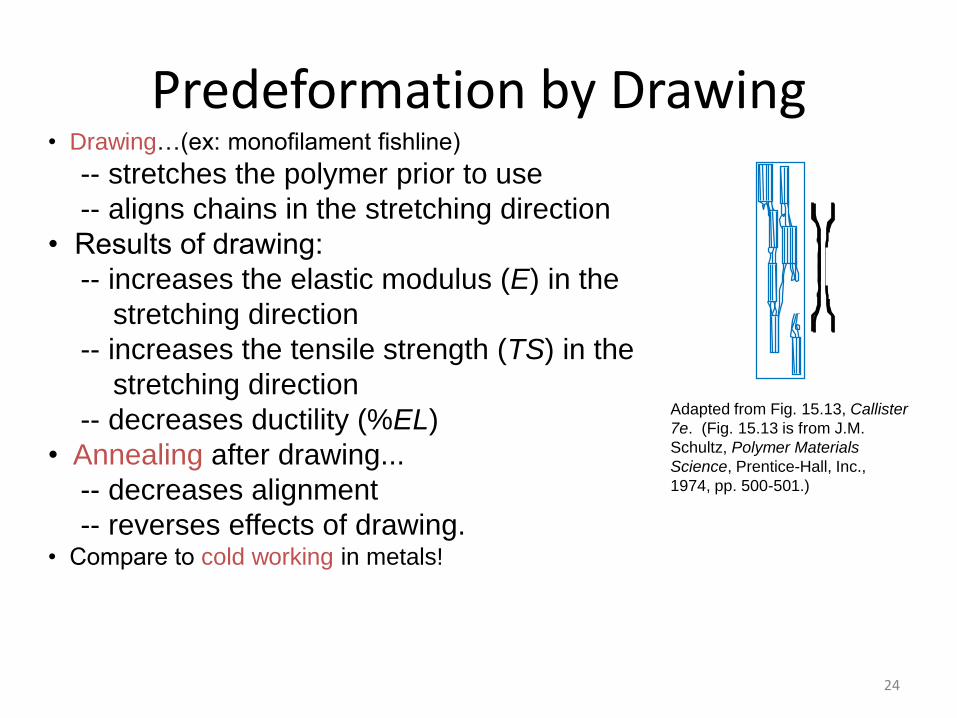
Predeformation by Drawing• Drawing…(ex: monofilament fishline)
-- stretches the polymer prior to use
-- aligns chains in the stretching direction
• Results of drawing:
-- increases the elastic modulus (E) in the
stretching direction
-- increases the tensile strength (TS) in the
stretching direction
-- decreases ductility (%EL)
• Annealing after drawing...
-- decreases alignment
-- reverses effects of drawing.• Compare to cold working in metals!
Adapted from Fig. 15.13, Callister
7e. (Fig. 15.13 is from J.M.
Schultz, Polymer Materials
Science, Prentice-Hall, Inc.,
1974, pp. 500-501.)

25
• Compare to responses of other polymers:
-- brittle response (aligned, crosslinked & networked polymer)
-- plastic response (semi-crystalline polymers)
Stress-strain curves
adapted from Fig. 15.1,
Callister 7e. Inset
figures along elastomer
curve (green) adapted
from Fig. 15.15, Callister
7e. (Fig. 15.15 is from
Z.D. Jastrzebski, The
Nature and Properties of
Engineering Materials,
3rd ed., John Wiley and
Sons, 1987.)
Tensile Response: Elastomer Case(MPa)
e
initial: amorphous chains are kinked, cross-linked.
x
final: chainsare straight,
stillcross-linked
elastomer
Deformation is reversible!
brittle failure
plastic failurex
x

26
• Decreasing T...
-- increases E
-- increases TS
-- decreases %EL
• Increasing
strain rate...
-- same effects
as decreasing T.
Adapted from Fig. 15.3, Callister 7e. (Fig. 15.3 is from T.S. Carswell and
J.K. Nason, 'Effect of Environmental Conditions on the Mechanical
Properties of Organic Plastics", Symposium on Plastics, American Society
for Testing and Materials, Philadelphia, PA, 1944.)
T and Strain Rate: Thermoplastics
20
4 0
6 0
8 0
00 0.1 0.2 0.3
4°C
20°C
40°C
60°Cto 1.3
(MPa)
e
Data for the
semicrystalline
polymer: PMMA
(Plexiglas)

Schematic of the different
types of stress–strain curves
in a polymer.
Effect of strain rate and
temperature on stress–strain
curves.


a) Even though they have similar structures, glass fibers
are much stronger than the window glass. Why?
b) Polymer fibers are also much stronger than bulk
polymers. Why?
2014 Final:

Answers:

Answers:
On the other hand, random polymer chains with partial crystallinity
decreases the strength of bulk polymers.

VISCOELASTIC DEFORMATIONLoad versus time, where load is
applied instantaneously at time taand released at tr .
the strain-versus time response
for totally elastic material
the strain-versus time response
for viscoelastic material
str
ess
strain
str
ess
strain

• Stress relaxation test:
-- strain to eo and hold.
-- observe decrease in
stress with time.
o
r
ttE
e
)()(
• Relaxation modulus: • Sample Tg(C) values:
PE (low density)
PE (high density)
PVC
PS
PC
- 110
- 90
+ 87
+100
+150
Selected values from
Table 15.2, Callister
7e.
Time Dependent Deformation
time
strain
tensile test
eo
(t)
• Data: Large drop in Erfor T > Tg.
(amorphous
polystyrene)
Adapted from Fig.
15.7, Callister 7e.
(Fig. 15.7 is from
A.V. Tobolsky,
Properties and
Structures of
Polymers, John
Wiley and Sons, Inc.,
1960.)
103
101
10-1
10-3
105
60 100 140 180
rigid solid (small relax)
transition region
T(°C)Tg
Er (10s)
in MPa
viscous liquid (large relax)

Mechanical Models
Elastic
(spring)
Pure viscous
(dashpot or damping)
str
ain
time
str
ain
time

Mechanical Models (Viscoelastic flow
(Maxwell) (Voigt)
str
ain
time
str
ain
time

Mechanical Models
Four element viscoelastic model

A specimen made of a certain material is subjected to a tensile stress
at time 0 and the stress is removed at time t0. The strain behavior of the
specimen is given below as a function of time. What type of material
would that be? Explain the graph.
2011 Final:

Answer:

40
Polymer Fracture
fibrillar
bridges
microvoids crack
alligned chains
Adapted from Fig. 15.9,
Callister 7e.
Crazing Griffith cracks in metals
– spherulites plastically deform to fibrillar structure
– microvoids and fibrillar bridges form

Strengthening Mechanismsa) Composites
b) Alignment of polymer chains
c) Increase crystallinity