UOP Continued Development of Gas Separation Membranes Tech Paper
POLYMER BLEND BASED MIXED MATRIX GAS SEPARATION
MEMBRANES
A THESIS SUBMITTED TO
THE GRADUATE SCHOOL OF NATURAL AND APPLIED SCIENCES
OF
MIDDLE EAST TECHNICAL UNIVERSITY
BY
MELĠS KARĞILI
IN PARTIAL FULFILLMENT OF THE REQUIREMENTS
FOR
THE DEGREE OF MASTER OF SCIENCE
IN
POLYMER SCIENCE AND TECHNOLOGY
SEPTEMBER 2015


Approval of the thesis:
POLYMER BLEND BASED MIXED MATRIX GAS SEPARATION
MEMBRANES
submitted by MELİS KARĞILI in partial fulfillment of the requirements for the
degree of Master of Science in Polymer Science and Technology Department,
Middle East Technical University by,
Prof. Dr. Gülbin Dural Ünver
Dean, Graduate School of Natural and Applied Sciences
Prof. Dr. Necati Özkan
Head of Department, Polymer Science and Technology
Prof. Dr. Levent Yılmaz
Supervisor, Chemical Engineering Dept., METU
Prof. Dr. Halil Kalıpçılar
Co-supervisor, Chemical Engineering Dept., METU
Examining Committee Members:
Prof. Dr. Nihal Aydoğan
Chemical Engineering Dept., Hacettepe University
Prof. Dr. Levent Yılmaz
Chemical Engineering Dept., METU
Prof. Dr. Halil Kalıpçılar
Chemical Engineering Dept., METU
Assist. Prof. Dr. Pınar Zeynep Çulfaz Emecen
Chemical Engineering Dept., METU
Assist. Prof. Dr. Erhan Bat
Chemical Engineering Dept., METU
Date: 02.09.2015

iv
I hereby declare that all information in this document has been obtained and
presented in accordance with academic rules and ethical conduct. I also declare
that, as required by these rules and conduct, I have fully cited and referenced
all material and results that are not original to this work.
Name, Last name : Melis KARĞILI
Signature :

v
ABSTRACT
POLYMER BLEND BASED MIXED MATRIX GAS SEPARATION
MEMBRANES
Karğılı, Melis
M.S., Polymer Science and Technology
Supervisor : Prof. Dr. Levent Yılmaz
Co-Supervisor: Prof. Dr. Halil Kalıpçılar
September 2015, 97 pages
Polymer blending and mixed matrix membranes are two methods suggested to
improve performance of gas separation membranes. Dense and asymmetric
membranes of PES/PI blends with different compositions were prepared and the
effect of blend composition on gas separation performances was investigated. In
addition, PES/PI/ZIF-8 blend based mixed matrix membranes were prepared in order
to investigate the effect of nano-porous filler addition to polymer blends.
ZIF-8 particles with size of 83 nm were synthesized. Particles were characterized
through scanning electron microscopy (SEM), X-Ray diffractometer (XRD), and
thermogravimetric analysis (TGA).
Dense PES/PI blend membranes were prepared in DMF with PI composition in range
of 5 to 95%. Membranes were characterized through SEM, TGA, and differential
scanning calorimetry (DSC). Glass transition temperatures of the blend membranes

vi
were in between the values of pristine membranes. Gas permeation test were
conducted for H2, CO2, and CH4 at 3 bar feed pressure. It was determined that no
phase separation occurred based on SEM or DSC characterization. The permeability
of all gases increased as the amount of the PI in the blend increased. H2/CO2,
CO2/CH4, and H2/CH4 selectivity values increased with increasing PI composition.
PES/PI 20/80 membranes performed best for all gas pairs among the blend
membranes.
Polymer blend based dense, mixed matrix membranes were prepared by addition of
10 wt% ZIF-8 particles into the PES/PI 20/80 matrix. Membranes were characterized
through TGA, SEM, and DSC. The decomposition temperature of PES/PI/ZIF-8
membrane was found below PES/PI 20/80 membranes. ZIF-8 particles were
dispersed in the polymer matrix homogeneously and formed sieve-in-cage structure.
ZIF-8 addition improved the permeability of the membranes due to high porosity of
the particles, while selectivity values remained almost same for all gas pairs,
compared to PES/PI 20/80 blend membranes. Furthermore, CO2/CH4 separation
performance of PES/PI/ZIF-8 membrane was found better than PI/ZIF-8 membranes.
PES/PI 20/80 asymmetric blend membranes were prepared by immersing polymer
blend/DMF solution casted on a glass plate into DMF/IPA mixture. Thermal
characters of the asymmetric membranes were improved very little in terms of the
decomposition temperature and weight losses. According to the SEM micrographs,
membranes have thin, nanoporous skin layer on sponge-like microporous support
layer. The permeances of the asymmetric membranes were significantly higher than
the dense membranes, due to the high porous structure. Besides, H2/CO2 and H2/CH4
selectivity values were improved by preparation of asymmetric membranes, relative
to dense membranes.
Keywords: Gas separation, Polymer Blends, Polyethersulfone, Polyimide, Zeolitic
Imıdazolate Framework-8 (ZIF-8), Mixed Matrix Membranes
vii
ÖZ
POLĠMER HARMANINA DAYALI KARIġIK MATRĠSLĠ GAZ AYIRMA
MEMBRANLARI
Karğılı, Melis
Yüksek Lisans, Polimer Bilimi ve Teknolojisi Bölümü
Tez Yöneticisi : Prof. Dr. Levent Yılmaz
Ortak Tez Yöneticisi: Prof. Dr. Halil Kalıpçılar
Eylül 2015, 97 sayfa
Polimer harmanlama ve karıĢık matrisli membranlar gaz ayırma membranlarının
performanslarını arttırmak için önerilmiĢ iki yöntemdir. Ġnce film ve asimetrik
PES/PI membranlar iki polimerin farklı oranlarda harmanlanmasıyla üretilmiĢ ve
harman komposizyonunun gaz ayırım performansına etkileri incelenmiĢtir. Ayrıca,
PES/PI/ZIF-8 harman temelli karıĢık matrisli membranlar üretilerek nano-gözenekli
dolgu malzemesinin harman membranların gaz ayırım performansına etkileri
incelenmiĢtir.
Sentezlenen ZIF-8 dolgu malzemesinin ortalama parçacık boyutu 83nm’dir.
Partiküller taramalı elektron mikroskobu (SEM) , X-Ray kırınımı (XRD) ve
termogravimetrik (TGA) yöntemlerle analiz edilmiĢtir.
PI oranı %5 ile %95 arasında değiĢen PES/PI harman membranlar, polimerlerin
DMF içerisinde çözünmesiyle çözücü uçurma yöntemine göre hazırlanmıĢtır.
Membranlar SEM, TGA ve diferansiyel taramalı kalorimetri yöntemiyle analiz
edilmiĢtir. Harman membranların camsı geçiĢ sıcaklıkları saf polimerlerin camsı
geçiĢ sıcaklıkları arasındadır. H2, CO2 ve CH4 gaz geçirgenlik testleri 3 bar besleme

viii
basıncında yapılmıĢtır. SEM ve DSC analizlerinde iki polimer arasında bir faz
ayırımı gözlenmemiĢtir. Membranların gaz geçirgenlikleri ve seçicilikleri harman
içerisindeki PI oranı arttıkça artmaktadır. PES/PI 20/80 oranına sahip membran,
harman membranlar içerisindeki en iyi gaz ayırım performansını göstermiĢtir.
Polimer harmanına dayalı karıĢık matrisli membranlar PES/PI 20/80 membrana
kütlece %10 ZIf-8 eklenmesiyle hazırlanmıĢtır. PES/PI/ZIF-8 membranların termal
ve yapısal karakteri TGA, SEM ve DSC ile incelenmiĢtir. ZIF-8 ekli membranların
dekomposizyon sıcaklığı ince film PES/PI 20/80 membranlardan daha aĢağıda tespit
edilmiĢtir. ZIF-8 partikülleri PES/PI matrisi içerisinde homojen olarak dağılmıĢ ve
kafes içinde elek adı verilen yapıyı oluĢturmuĢlardır. PES/PI/ZIF-8 membranların
gaz geçirgenlikleri, ince film PES/PI 20/80 membranlara kıyasla ZIF-8
parçacıklarının yüksek gözenekli yapısı sayesinde artarken, seçiciliklerinde önemli
denilebilecek bir değiĢme görülmemiĢtir. Dahası, PES/PI/ZIF-8 membranların
CO2/CH4 seçicilikleri PI/ZIF-8 membranların seçiciliklerinden bile daha yüksek
bulunmuĢtur.
Asimetrik PES/PI 20/80 membranlar cam üzerine yayılan Polimer/DMF çözeltisinin
IPA/DMF çökeltme banyosuna batırılmasıyla elde edilmiĢtir. Dekomposizyon
sıcaklığı ve kayıp kütle miktarları incelendiğinde, asimetrik membranların termal
karakterinin ince film PES/PI 20/80 membranlar göre daha iyi olduğu görülmüĢtür.
SEM analizleri incelendiğinde, membranların mikro-gözenekli süngerimsi bir destek
tabaka üzerindeki nano-gözenekli ince kabuk tabakadan oluĢtuğu gözlenmiĢtir.
Asimetrik membranların akıları, membranların gözenekli yapılarından dolayı, ince
film membranlara kıyasla oldukça yüksektir. Ayrıca, asimetrik membranların
H2/CO2 ve H2/CH4 seçiciliklerinde de ince film membranlar oranla artıĢ gözlenmiĢtir.
Anahtar Kelimeler: Gaz ayırım, Polimer Harman, Polietersülfon, Poliimid, Zeolitik
Ġmidazolat Çatı-8 (ZIF-8), KarıĢık Matrisli Membranlar

ix
To My Dearest Family,
x
ACKNOWLEDGMENTS
First, I am deeply grateful to my supervisor Prof. Dr. Levent Yılmaz for his
significant contributions, patience, and guidance throughout this study. I would like
to show my appreciation to my co-supervisor Prof. Dr. Halil Kalıpçılar for his
precious suggestions and support. It was a pleasing honor for me to work with them.
Moreover, I would like to thank to TÜBĠTAK (The Scientific and Technological
Research Council of Turkey) for financial supports through grant number 213M546.
I am also grateful to Middle East Technical University Chemical Engineering
Department technicians for their helps and advices.
I would like to present my sincere thanks to my dear lab colleagues Elif Ġrem
ġenyurt, Fırat Ozanırk, Gülçin Kaltalı, Ġlhan Ayas, Burcu Tüzün, Fatma ġahin
Çakanyıldırım and Yiğit Gencal for their kind friendship, help and useful
cooperation.
I would also like to thank to my dear friends Burçin Kavcı and Alyaan Khan for their
endless friendships and supports. Also, I sincerely thank to all my comrades of
higher education Umut Çaçan, Emir DemirtaĢ, Türkan Güler, Burcu Sarı, BaĢak
Kanya, Elif Topçuoğlu, Özge Çimen, Berrak Erkmen, Merve Özkutlu, Dilara Gülçin
Çağlayan, who were beside me during my graduate study.
Finally yet importantly, my very special thanks go to my family for their great
support, encouragement, and unlimited patience and love.
xi
TABLE OF CONTENTS
ABSTRACT ................................................................................................................. v
ÖZ .......................................................................................................................... vii
ACKNOWLEDGMENTS ........................................................................................... x
TABLE OF CONTENTS ............................................................................................ xi
LIST OF TABLES .................................................................................................... xiii
LIST OF FIGURES .................................................................................................. xiv
CHAPTERS
1. INTRODUCTION ................................................................................................... 1
2. LITERATURE RESEARCH ................................................................................... 7
2.1. Polymeric gas separation membranes ............................................................ 7
2.2. Advancements in polymeric membranes ....................................................... 8
2.2.1. Mixed matrix membranes ..................................................................... 8
2.2.2. Polymer blends gas separation membranes .......................................... 9
2.2.2.1. Dense Polymer Blend Membranes ......................................... 10
2.2.2.2. Asymmetric Polymer Blend Membranes................................ 12
2.2.3. Polymer blend based mixed matrix membranes ................................. 16
2.2.3.1. Dense Polymer Blend Based Mixed Matrix Membranes ....... 16
2.2.3.2. Asymmetric Polymer Blend Based Mixed Matrix Membranes .
............................................................................................... 17
3. EXPERIMENTAL METHODOLOGY ................................................................. 21
3.1. Preparation of PES/PI and PES/PI/ZIF-8 Membranes................................. 21
3.1.1. Materials of PES/PI and PES/PI/ZIF-8 Membranes .......................... 21
3.1.2. Materials and Preparation Method of ZIF-8 ....................................... 22
3.1.3. Membrane Preparation Methodology ................................................. 23
3.1.2.1. Dense Membrane Preparation................................................. 23
3.1.2.2. Asymmetric Membrane Preparation ....................................... 25

xii
3.2. Characterization of Blend and Mixed Matrix Membranes and ZIF-8 Crystals
..................................................................................................................... 25
3.2.1. TGA ................................................................................................ 25
3.2.2. DSC ................................................................................................ 26
3.2.3. SEM ................................................................................................ 26
3.2.4. XRD ................................................................................................ 26
3.3. Gas permeation Measurements of Membranes ............................................ 27
4. RESULTS AND DISCUSSION ............................................................................ 29
4.1. Characterization of ZIF-8 Crystals .............................................................. 29
4.1.1. XRD ................................................................................................ 29
4.1.2. SEM ................................................................................................ 31
4.2. Characterization of PES/PI and PES/PI/ZIF-8 Membranes ......................... 32
4.2.1. TGA ................................................................................................ 32
4.2.2. DSC ................................................................................................ 36
4.2.3. SEM ................................................................................................ 41
4.3. Gas Permeation Results of Dense and Asymmetric Membranes ................. 48
4.3.1. Gas Permeation Results of Dense Membranes ................................... 48
4.3.2. Gas Permeation Results of PES/PI/ZIF-8 Membranes ....................... 62
4.3.3. Gas Permeation Results of PES/PI 20/80 Asymmetric Membranes .. 65
5. CONCLUSION ...................................................................................................... 69
REFERENCES ........................................................................................................... 71
A: CALCULATION OF SINGLE GAS PERMEABILITIES ................................... 77
B: SAMPLE CALCULATION OF ZIF-8 YIELD AND AVERAGE PARTICLE
SIZE .................................................................................................................... 79
C: TGA THERMOGRAMS OF DENSE AND ASYMMETRIC PES/PI 20/80 AND
PES/PI/ZIF-8 20/80/10 MEMBRANES ............................................................. 83
D: DSC SCANS OF PES/PI BLEND MEMBRANES .............................................. 87
E: REPRODUCIBILITY OF GAS PERMEABILITY EXPERIMENTS .................. 95

xiii
LIST OF TABLES
TABLES
Table 2.1 Gas Separation Performance of Blend and Blend Based Mixed Matrix
Membranes ............................................................................................................ 19
Table 3.1 The recipe of the polymer blend membranes ............................................. 24
Table 3.2 The recipe of the polymer blend based mixed matrix membranes ............ 24
Table 4.1 Peak Areas and % Crystallizations ............................................................ 30
Table 4.2 TGA Results of PES, PI, PES/PI 20/80, PES/ZIF-8, and PES/PI/ZIF-8
20/80/10 Membranes ............................................................................................. 32
Table 4.3 DSC Results of Dense Blend Membranes ................................................. 38
Table 4.4 Measured Glass Transition Temperatures of PES/PI Blends..................... 40
Table 4.5 Permeability and Selectivity Values of the PES/PI Dense Blend
Membranes ................................................................................................................. 48
Table 4.6 Theoretical Permeability Results According to Eq. 4.3 ............................. 49
Table 4.7 The Amount of Mol of PI in Blends .......................................................... 50
Table 4.8 Comparison of Permeability and Selectivity Values of the PES/ZIF-8
(10%), PES/PI/ZIF-8 20/80/10 and PI/ZIF-8 (10%) Dense Blend Membranes .... 62
Table 4.9 Permeance and Selectivity Values of PES/PI 20/80 Asymmetric
Membranes ................................................................................................................. 65
Table 4.10 Permeance and Selectivity Values of PES/PI 20/80 Asymmetric
Membranes ............................................................................................................ 66
Table B.1 Average Particle Size of ZIF-8 Crystals from SEM micrographs............. 81
Table E.1 Reproducibility data for PES/PI dense blend membranes ......................... 95
Table E.2 Reproducibility data for PES/PI/ZIF-8 20/80/10....................................... 97

xiv
LIST OF FIGURES
FIGURES
Figure 1.1 Robeson upper bound trade off [9] ............................................................. 5
Figure 3.1. Open Formula of Polyimide [33] ............................................................. 22
Figure 3.2 Open Formula of PES [33] ....................................................................... 22
Figure 3.3 The Diagram of the Gas Permeation Test Set-Up [6] ............................... 28
Figure 4.1 X-Ray Pattern of Synthesized ZIF-8 crystals ........................................... 29
Figure 4.2 SEM micrographs of ZIF-8 particles ........................................................ 31
Figure 4.3 TGA Results of Pure PI, Pure PES, and PES/PI 20/80 Membranes ......... 33
Figure 4.4 Td of Pure PES, PES/PI 20/80 Dense and Pure PI Membranes ................ 33
Figure 4.5 TGA Results of PES/PI 20/80 and PES/PI/ZIF-8 20/80/10 Membranes.. 34
Figure 4.6 Td of PES/PI 20/80 and PES/PI/ZIF-8 20/80/10 Membranes ................... 34
Figure 4.7 TGA Results of PES/PI 20/80 Dense and Asymmetric Membranes ........ 35
Figure 4.8 Td of Dense and Asymmetric PES/PI 20/80 Membranes ......................... 35
Figure 4.9 DSC result of PES/PC 1:1 Membrane ...................................................... 36
Figure 4.10 DSC result of PES/PC 1:2 Membrane .................................................... 37
Figure 4.11 DSC scan of PES/PI 25/75 Run 2 ........................................................... 39
Figure 4.12 Experimental vs. Taylor-Gordon Eqn. Tg Results .................................. 41
Figure 4.13 SEM Micrograph of Pure PI Dense Membrane (a) low magnification;
(b) high magnification ........................................................................................... 42
Figure 4.14 SEM micrographs of cross-sections of (a) Pure PI; (b) PES/PI 10/90;
(c) PES/PI 20/80; (d) PES/PI 75/25; (e) PES/PI 50/50; (f) PES/PI 75/25;
(g) PES/PI 90/10 membranes at high magnification .................................................. 43
Figure 4.15 SEM micrographs of cross-sections of PES/PI/ZIF-8 20/80/10
membranes at (a) low; (b) high magnification ...................................................... 44

xv
Figure 4.16 High magnification SEM micrographs of PES/PI/ZIF-8 20/80/10
membranes where Polymer Matrix-ZIF-8 attachments marked ............................ 46
Figure 4.17 SEM micrographs of Asymmetric PES/PI 20/80 Membrane ................. 47
Figure 4.18 PI wt% vs. H2 Permeability .................................................................... 51
Figure 4.19 PI mol% vs. H2 Permeability .................................................................. 52
Figure 4.20 PI wt% vs. CO2 Permeability ................................................................. 52
Figure 4.21 PI mol% vs. CO2 Permeability ............................................................... 53
Figure 4.22 PI wt% vs. CH4 Permeability ................................................................. 54
Figure 4.23 PI mol% vs. CH4 Permeability ............................................................... 54
Figure 4.24 PI wt% vs. H2/CO2 Selectivity ............................................................... 55
Figure 4.25 PI mol% vs. H2/CO2 Selectivity ............................................................. 56
Figure 4.26 Single gas permeabilities of blend membranes with reference line for
H2/CO2 pair ............................................................................................................ 57
Figure 4.27 PI wt% vs. CO2/CH4 Selectivity ............................................................. 58
Figure 4.28 PI mol% vs. CO2/CH4 Selectivity ........................................................... 58
Figure 4.29 Single gas permeabilities of blend membranes with reference line for
CO2/CH4 pair ......................................................................................................... 59
Figure 4.30 PI wt% vs. H2/CH4 Selectivity ............................................................... 60
Figure 4.31 PI mol% vs. H2/CH4 Selectivity ............................................................. 60
Figure 4.32 Single gas permeabilities of blend membranes with reference line for
H2/CH4 pair ............................................................................................................ 61
Figure 4.33 H2/CO2 vs. H2 Permeation of PES/ZIF-8, PI/ZIF-8, PES/PI/ZIF-8
20/80/10, Pure PES, Pure PI and PES/PI 20/80 membranes ................................. 63
Figure 4.34 CO2/CH4 vs. CO2 Permeation of PES/ZIF-8, PI/ZIF-8, PES/PI/ZIF-8
20/80/10, Pure PES, Pure PI and PES/PI 20/80 membranes ................................. 64
Figure 4.35 H2/CH4 vs. H2 Permeation of PES/ZIF-8, PI/ZIF-8, PES/PI/ZIF-8
20/80/10, Pure PES, Pure PI and PES/PI 20/80 membranes ................................. 65
Figure 4.36 H2, CO2, and CH4 Permeances of PES/PI 20/80 Dense and Asymmetric
Membranes ............................................................................................................ 67

xvi
Figure 4.37 H2/CO2, CO2/CH4, and H2/CH4 Selectivities of PES/PI 20/80 Dense and
Asymmetric Membranes........................................................................................ 67
Figure A.1 The time (s) vs. pressure change (atm) graph for H2 permeation test of
PES/PI 20/80 ......................................................................................................... 77
Figure C.1 The TGA thermogram of Dense PES/PI 20/80 Membrane 1 .................. 83
Figure C.2 The TGA thermogram of Dense PES/PI 20/80 Membrane 2 .................. 84
Figure C.3 The TGA thermogram of Dense PES/PI/ZIF-8 20/80/10 Membrane 1 ... 84
Figure C.4 The TGA thermogram of Dense PES/PI/ZIF-8 20/80/10 Membrane 2 ... 85
Figure C.5 The TGA thermogram of Asymmetric PES/PI 20/80 Membrane 1 ......... 85
Figure C.6 The TGA thermogram of Asymmetric PES/PI 20/80 Membrane 2 ......... 86
Figure D.1 DSC thermogram of PES/PI 90/10 .......................................................... 87
Figure D.2 DSC thermogram of PES/PI 90/10 Run2 ................................................. 88
Figure D.3 DSC thermogram of PES/PI 75/25 .......................................................... 88
Figure D.4 DSC thermogram of PES/PI 75/25 Run2 ................................................. 89
Figure D.5 DSC thermogram of PES/PI 60/40 .......................................................... 89
Figure D.6 DSC thermogram of PES/PI 50/50 .......................................................... 90
Figure D.7 DSC thermogram of PES/PI 50/50 Run2 ................................................. 90
Figure D.8 DSC thermogram of PES/PI 25/75 .......................................................... 91
Figure D.9 DSC thermogram of PES/PI 25/75 Run2 ................................................. 91
Figure D.10 DSC thermogram of PES/PI 20/80 ........................................................ 92
Figure D.11 DSC thermogram of PES/PI 20/80 Run2 ............................................... 92
Figure D.12 DSC thermogram of PES/PI 10/90 ........................................................ 93
Figure D.13 DSC thermogram of PES/PI 5/95 .......................................................... 93
Figure D.14 DSC thermogram of PES/PI 5/95 .......................................................... 94
Figure D.15 DSC thermogram of Pure PI .................................................................. 94
1
CHAPTER 1
INTRODUCTION
Fossil fuels can be counted as the world’s most preferred energy sources. However,
increase in the need of energy around the world and the harmful effects of the fossil
fuels on the nature direct the research on renewable and more efficient energy
sources. Natural gas is counted as a replacement of fossil fuel and coal. Purification
of the natural gas from the impurity gases, mostly CO2, is enhances the quality of the
natural gas and decrease the corrosion of the pipelines during transportation [1].
There are several methods to separate carbon dioxide from methane; such as
cryogenic distillation, absorption, amine adsorption, and membrane separation. Even
though amine adsorption is the most developed commercial method, this method has
several disadvantages, such as high energy consumption during regeneration of the
solvent, corrosion of the equipment and flow problems [1]. Separation of gas
mixtures by membranes has numerous advantages over the other methods, for
example low operation and capital cost, ease of operation and low energy
consumption [1,2].
Hydrogen is one of the most vastly used chemicals in various industries, such
ammonia production, oil refining, or food. Also, it has been gained importance as
one of the clean energy sources alternative to fossil fuels [3]. Therefore, production,
storage, and separation of hydrogen have been gaining importance. Water-gas shift
reaction is the major hydrogen production method and products of this reaction are
CO2 and H2. The presence of carbon dioxide decreases the yield of the process and
quality of the product [4]. The conventional H2/CO2 separation methods can be listed

2
as pressure swing adsorption, temperature swing adsorption, and cryogenic
distillation. However, these methods are not energy or cost effective, compared with
membrane separation methods [5]. Moreover, H2 is used extensively in steam
refining process, therefore it is required to be separated from CH4 and regained [6].
Gas separation membranes can be classified to four groups, based on materials they
are produced, facilitated-transport membranes, inorganic membranes, polymeric
membranes, and mixed matrix membranes. The theory of facilitated-transport
membranes is to establish strong bonds between interested gas molecules and
membrane to facilitate the diffusion of interested gas [7]. They possess some
disadvantages such as mechanical instability, low diffusivity, and defect formation.
Inorganic membranes may have good separation performance, chemical and thermal
stability [2]. However, since they are quite expensive, hard to handle and process,
they are not preferred to be used in industrial applications. Polymeric membranes are
cost effective, easy to produce and operate. However, since they are chemically and
thermally vulnerable, their usage is limited by low-temperature and non-reactive
gases. Mixed matrix membranes are developed by combining inorganic and
polymeric membranes to overcome these problems. They have mechanical and
thermal stability, cost-effectiveness, and easy operation condition as well as excellent
gas separation properties [2]. Polymer blending is another method to obtain an
enhanced polymeric membrane by combining different polymers with different
properties. It is time and cost effective method to derive a polymeric membrane with
certain performance rather than synthesizing a new polymer [8]. Polymeric
membranes may suffer from CO2 plasticization at relatively higher temperatures and
pressures, which may be required for natural gas purification. Blending of two or
more polymers are suggested to overcome or increase the resistance against
plasticization [9] and also to increase the mechanical and thermal properties [8].
Polymer based membranes can also be classified depending on their morphology as
symmetric, asymmetric and composite. Symmetric membranes can be porous or non-
porous (dense).The permeability of a symmetric membrane depends on its thickness,

3
which means thinner the membrane higher the permeation rate. Asymmetric
membranes have thin skin layer on porous sublayer. The thickness of an asymmetric
membranes can be decreased to 0.1 to 0.5 microns which decreases the resistance of
the membrane against permeate and increases the permeability of the membrane, yet
not much changes the selectivity [10].
Separation mechanism of non-porous, also called dense, polymeric membranes is
sorption of the gas molecules at one side of the membrane, diffusion, and passing
through the membrane, and desorption at the other side under the driving force of
pressure gradient. Solubility of the gas molecules in the polymer matrix are playing
an important role while separating similar sized gases [9].
The permeability, and the ideal selectivity are the key features while determining the
gas separation performance of a dense membrane, which are calculated by following
formulas [6].
where P is the permeability of the membrane for certain gases, Barrer,
α is the selectivity of A gas to B gas,
J is the flux of gas through membrane, cm3/cm2 s,
l is the membrane thickness, cm,
Δp is the difference of the partial pressures of feed and permeate, atm.
During calculating gas separation performance of an asymmetric membrane,
permeance is calculated instead of permeation. Permeance can be simply defined as
4
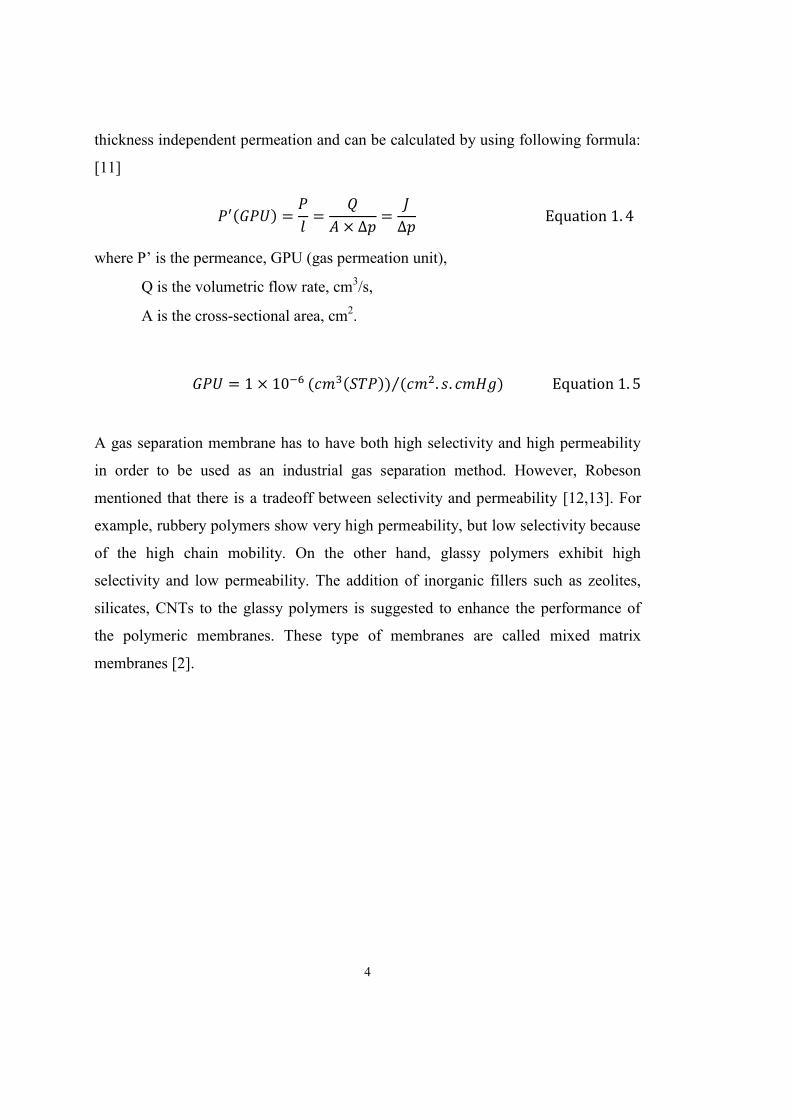
thickness independent permeation and can be calculated by using following formula:
[11]
where P’ is the permeance, GPU (gas permeation unit),
Q is the volumetric flow rate, cm3/s,
A is the cross-sectional area, cm2.
⁄
A gas separation membrane has to have both high selectivity and high permeability
in order to be used as an industrial gas separation method. However, Robeson
mentioned that there is a tradeoff between selectivity and permeability [12,13]. For
example, rubbery polymers show very high permeability, but low selectivity because
of the high chain mobility. On the other hand, glassy polymers exhibit high
selectivity and low permeability. The addition of inorganic fillers such as zeolites,
silicates, CNTs to the glassy polymers is suggested to enhance the performance of
the polymeric membranes. These type of membranes are called mixed matrix
membranes [2].

5
Figure 1.1 Robeson upper bound trade off [9]
At this study, glassy polymers with different properties are blended in order to see
the effect of blending on gas separation performance. At the beginning of this study,
Polycarbonate/Polyethersulfone (PES), Poly (vinyl alcohol)/Polyethersulfone, and
Poly (vinyl acetate)/Polyethersulfone blends were prepared However, because of the
incompatibility of these polymers with PES, we were unable to prepare
homogeneous and usable membranes. Therefore, we continued with literature survey
and came up with Matrimid ® 5218 (a type of polyimide, abbreviated as PI), a
superior polymeric material for gas separation membranes.
Since only PES/PI pair produces homogeneous, workable membranes, rest of the
study focused on membranes based on PES/PI blends. Based on this polymer pair,
the effect of blending composition, structure of the blend membrane (dense vs.
asymmetric), and ZIF-8 addition to a dense polymer blend on the gas separation
performance of PES/PI and PES/PI/ZIF-8 membranes were investigated.

6
7
CHAPTER 2
LITERATURE RESEARCH
2.1. Polymeric gas separation membranes
First gas separation membranes were used by Monsanto for H2 recovery system in
1977. First CO2 separation membrane was cellulose acetate based. However,
plasticization of cellulose acetate membranes under harsh flue gas conditions urged
the researchers to investigate new membranes with better permeability, selectivity,
and mechanical and thermal durability. There has been using numerous polymeric
membranes with reasonable gas separation performances, such as polyamides,
polycarbonate, polysulfones, and polyimides. [7]
One of the major problems of polymeric membranes is the trade-off between
permeability and selectivity. It was reported by Robeson that rubbery polymers have
very high permeability values because of the loose chain packing; therefore, they are
suffering from lack of selectivity. On the other hand, glassy polymers have
considerably high selectivity values and low permeability values, but in order to be
feasible for industrial applications, membrane area should be very large [9].
However, superior gas separation performance is not the only important aspect for
polymeric membrane to be industrially attractive. Mechanical and thermal stabilities
are also important aspect in industrial gas separation [7]. According to the patent
application study conducted by Ekiner revealed that percent elongation of ternary

8
blend of PES, aromatic polyimide and alkyl substituted aromatic polyimide is higher
than pristine polymers’ [14].
Another major problem of polymeric membranes is the CO2 plasticization at high
temperature pressure processes. CO2 molecules cause to increase the free volume
within the polymer matrix and make the membrane looser as they diffuse through the
membrane. This bring about increase in permeation and decrease in selectivity,
especially in CO2/CH4 separation processes [1,15,16]. In order to overcome or at
least enhance the resistance against plasticization three possible solutions has been
suggested, which are polymer blending, crosslinking and thermal treatment
[8,16,17].
2.2. Advancements in polymeric membranes
Polymeric membrane technology for gas separation processes has been being studied
extensively because of the advantages as easy processability, low cost of preparation
and operation, aside from the disadvantages as low chemical and thermal stability,
unsatisfying gas separation performance for industrial applications, and plasticization
at certain operation conditions [1,2]. In order to improve the gas separation
performance and overcome the problems several methods have been proposed such
as polymer blending, copolymerization and grafting of backbone, sulfonation,
hollow-fiber spinning, crosslinking and thermal treatment, and combination with
inorganic fillers, i.e. mixed matrix membranes [1].
2.2.1. Mixed matrix membranes
Mixed matrix membranes were designed by dispersing filler materials in the polymer
matrix in order to overcome the problems of both inorganic and polymeric
9
membranes and to create the synergistic effect of increasing of both permeability and
selectivity [2]. Zeolites, carbon molecular sieves, and metal organic frameworks are
the most used fillers in the mixed matrix membranes [18,19]. However, due to the
limitations as poor polymer-filler bonding, filler segregation, or pore blocking,
zeolites, carbon molecular sieves or silicas were not much preferred to use in the
industrial membranes as MMM fillers. Zeolites are one of the most preferred filler
material among them, even though severe interfacial non-selective void formation
and aggregation. Several methods have been suggested to overcome these problems
of zeolite based MMMs, such as priming, silanation, chemical treatment, low
molecular weight additives, thermal treatment, copolymerization and crosslinking
[16,20,21]. Recently discovered metal organic frameworks are the most attention
gathering fillers thanks to their high surface and pore volume, tunable pore size and
structure, and compatibility with organic materials [22,23]. MOFs are crystalline
materials where metal ions are connected to each other with organic linkers. The gas
permeation mechanism of the MOFs is based on the adsorption of the gas molecules
on the MOF surface requiring physical or chemical interaction, and sieving
according to the molecular size. It is possible to tailor the MOF materials by
changing the organic linker types to reach the desired cage opening or affinity to
certain gases. Zeolitic imidazolate frameworks are one of the subclasses of MOFs.
They have sodalite like structures with certain affinity to small sized gases. ZIF-8 has
a pore size of 3.4 Å, which makes ZIF-8 a very good sieving material for H2/CH4 and
CO2/CH4 separation [24]. ZIF-8 is synthesized in methanol medium where Zn(NO3)2
used as a metal donor and HMIM as organic linker [25].
2.2.2. Polymer blends gas separation membranes
Robeson described several upper bounds for different gas pairs by considering
permeability and selectivity performances of numerous polymeric membranes used
in gas separation industry. For example, it can be clearly seen from the Figure 1.1 that

10
the CO2/CH4 separation performances of the most of the polymeric membranes are
below the upper bound [12]. Therefore, most of the recent research is aimed to
develop composite materials that reach or go further than the upper bound.
According to the upper bound described by Robeson, while membranes of glassy
polymers show better selectivity performances, membranes of rubbery polymers
show better permeation performances [2]. In the light of these results, research are
focused on producing a highly perm-selective membranes by combining glassy and
rubbery polymers [26]. The reason of blending is to come up with membranes that
have the high permeability characteristic of rubbery polymers and high selectivity of
glassy polymers. However, not all polymers are compatible with each other [27].
Polymer blends are categorized by miscible, i.e. completely dissolved in each other
in molecular level, and phase-separated, i.e. partially or not dissolved, blends by
Robeson [8]. There are several methods have been used to blend the polymers, e.g.
melt mixing [28] and solution mixing [8,29].
2.2.2.1. Dense Polymer Blend Membranes
Kapantaidakis and his research group have been studying the gas permeation of
dense PSF/PI membranes. Dense PSF/PI membranes were prepared by solvent
evaporation method using methylene chloride as a solvent in three different
proportions as 1:4, 1:1, and 4:1. Single gas permeation experiments were done in
variable volume setup with upstream pressure of 1-45 atm and downstream pressure
of atmospheric conditions. Gas separation experiments were carried out for He, H2,
O2, CO2 and N2. Membranes performed monotonous increase in permeability of
gases except H2 and CO2 as the ratio of the PI in the blend decreased. The pure PI
membranes had the highest H2 permeability values. The permeability of CO2 of all
blend membranes were below that of the pure polymers and showing an inflection
point, because of the CO2 plasticization under that experimental conditions. The CO2
11
permeation experiments were conducted at different pressures to determine the
plasticization pressure of each membrane at 40°C. The results showed that PSF
membranes have the highest resistance and PI membranes have the lowest resistance
to CO2 plasticization. The plasticization pressures of the blend membranes were in
between the pure polymers and adding PSF into the PI matrix significantly increased
the resistance. The CO2/N2 selectivity of the blend membranes fell below the
predicted values because of the decrease in the CO2 permeability. The selectivity of
O2 over N2 did not affected by the blending and H2/CO2 selectivity increased
compared to the pure polymers. In case of O2/N2 selectivity, the effect of blending
was insignificant. There was the inflection points observed at 50/50 wt% blend ratios
for selectivity for the all gas pairs investigated [30].
Hosseini, Teoh and Chung blended Matrimid ® 5218 and PBI with compositions of
(w/w) 25/75, 50/50 and 75/25. In order to prove the miscibility of these polymer
blends, DSC analysis were conducted. Single glass transition temperatures in the
results confirmed these two polymer are miscible with each other. Gas permeation
test were conducted at 35°C, and 3.5 atm for H2 and 10 atm for other gases based on
variable pressure-constant volume method. According to the gas permeation test, the
permeabilities of all gases were decreasing with increasing PBI concentration. As
expected, the selectivities were increasing with increase in PBI concentration.
Surprisingly, H2/N2 and H2/CO2 selectivities of Matrimid/PBI 25/75 membranes
were higher than the pure polymer membranes [31].
Another study on PES/PI blend membranes was done by Ekiner for a patent
application [14]. He investigated the mechanical properties and O2/N2 separation
performances of both binary and ternary blend membranes. First, PES: aromatic
polyimide binary blend dense membranes were prepared. In the resulting scans of
DSC of these membranes, only one phase transition temperature in between the
pristine polymers Tg’s occurred on the first scan proving that these polymers are
compatible. However, on the second scan two different temperatures observed
showing a phase separation between polymers when membranes are annealed above
12
Tg. The gas separation tests were conducted with a mixture of O2 and N2 (21/79) at
30°C. O2 permeability was found as 1.12 Barrers and O2/N2 selectivity as 6.4.
Researcher further investigated the ternary blends of PES: aromatic polyimide: alkyl
substituted aromatic polyimide membranes. According to the results, pure alkyl
substituted aromatic polyimide has the highest O2 permeability, while aromatic
polyimide has the highest selectivity. Pure PES membranes have the lowest
permeability, while ternary blend with 80:10:10 composition has the lowest
selectivity values. The permeability and selectivity values of the blend membranes
were increased as the amount of PES in the blend decreased [14].
2.2.2.2. Asymmetric Polymer Blend Membranes
The theory of the asymmetric membrane preparation is based on exchange of the
solvent with non-solvent. During exchange process, as the solvent diffused out of the
polymer matrix, non-solvent penetrated into the matrix, causing polymer to
precipitate with formation of an asymmetric structure with porous substructure. Skin
layer formation depends on the interactions between polymer-solvent and polymer-
non-solvent. The reason of addition solvent into the coagulation bath is to delay the
demixing and obtain an asymmetric membranes with thicker skin layer [32].
Han et.al. were studied the compatibility and thermal stability of PES and
Matrimid® 5218 and their blends [33]. Membranes are produced by dry/wet phase
inversion with w/w blending ratios of PES/MI 90/10, 80/20, 70/30, 60/40, 50/50,
40/60, 30/70 20/80 and 10/90 as weight percent. NMP and DMF has been used as
solvents, and ultra-purified water has been used as a non-solvent. According to the
SEM micrographs of the cross-sections, the blend membranes with 90/10, 80/20,
70/30 and 10/90 PES/MI ratios have finger-like macro pores, while other blend
membranes have sponge-like pore structures. Formation of sponge-like pore implies
that the interpenetration of the non-solvent into the polymer matrix is slow, because

13
of strong polymer-polymer interactions. The skin layers of the finger-like polymer
membranes are changing between 5 to 10 microns, while sponge-like membranes
have approximately 0.7 micron skin layer thickness. There is no evidence of
incompatibility between these two polymers has been observed in the SEM
micrographs. Since the finger-like macro pores cause to increase in the gas
permeability and decrease in the selectivity, the gas permeation tests of the
membranes with finger-like pores are not conducted. Gas permeation experiments of
H2, N2 and O2 gases were conducted at different feed pressures. The results showed
that as the feed pressure increased permeances of all gases were increased, while the
selectivities of O2/N2 and H2/N2 decreased [33].
Another interesting study on polymer blend gas separation membranes were done
with Matrimid® and Polybenzimidazole (PBI). The membranes was dual-layer
hollow fibers where the inner support was made of PSf. Research group was studied
the effects of air gap, dope liquid composition, rate of elongational drawing, and
chemical modification on gas separation performances of the membranes. The
drawing the fibers in elongational direction after coagulation bath affected the gas
separation performance positively. The permeability of the drawn membranes for H2
and CO2 gases increased, while he CH4 permeability decreased. Owing to this
method, it is possible to produce membranes with considerably high CO2/CH4
selectivities. According to the SEM micrographs, PSf support layer had finger-like
large pores, while the outer M/PBI blend layer had sponge-like porous structure.
There was no evidence of debonding or incompatibility in between inner and outer
layers [34].
In another study on polymer blend gas separation membranes were done by using
Matrimid® 9725 (M) and polysulfone (PSf) [15]. The membranes were prepared by
dry/wet phase inversion method with the w/w ratios of M/PSf 1/3, 1/1, and 3/1.
Binary gas mixture separation performance of the membranes was measured at 35°C
and 10 bar for different CO2/CH4 compositions. The pure Matrimid membranes
showed the highest and pure PSf membranes showed the lowest selectivity and

14
permeance performances among the membranes studied within this work. As the
CO2 concentration increased in the feed mixture, the selectivities off all membranes
decreased. The gas separation performance of the pure Matrimid membranes were
affected the most by the increase of CO2 concentration in the feed mixture, so that
values decreased to the half. On the other hand, blend membranes were affected least
by the concentration change of CO2 in feed stream indicating that blending Matrimid
with PSf increases the membrane stability at the high CO2 concentration processes.
Basu et al., also investigated the effect of feed temperature on the binary gas
separation process for two different feed compositions, which are 10/90 vol% and
75/25 vol% at 10 bar. Permeation characteristics of pure Matrimid membrane was
affected the most from the temperature change among the studied membranes. The
results, where the feed contained 75/25 vol% CO2, showed that selectivity of the
membranes decreased with the increase in temperature from 35°C to 95°C due to the
increase in the permeation of the membranes, as expected. The CO2 permeance
increased up to 65°C due to the increasing kinetic energy of the gas molecules and
chain mobility. However, when temperature were increased even more, the CO2
permeance decreased sharply which may be due to the chain relaxation causing to
decrease of free volume. The results of the experiments that the feed composition
was set to 10/90 vol% CO2 showed that as the temperature increased, the permeance
of CO2 and CH4 increased, especially in case of pure Matrimid membranes. On the
other hand, blend membranes showed steady and smaller change as a function of
increasing temperature. The effect of feed pressure on the membranes were also
studied at 4, 8, 10, 12, 13, and 14 bar with feed composition of 75/25 vol% CO2/CH4.
The selectivity of CO2 over CH4 increased with increasing feed pressure. However,
in case of pure Matrimid, the selectivity suddenly decreased after 12 bar, because of
the CO2 plasticization of Matrimid membranes. Having the stable gas permeance and
selectivity values at high pressures, blending of Matrimid can be offered to overcome
the CO2 plasticization [15].
Another research conducted by Kapantaidakis and his group was on the gas
separation performance of PES/PI blend hollow fiber membranes with three different

15
w/w blending ratios (20/80, 50/50 and 80/20). The hollow fiber membranes were
prepared by dry/wet phase inversion method with NMP as solvent and water as non-
solvent. In addition, the effect of PDMS coating on gas separation performance was
investigated. Single gas permeations of N2 and CO2 were measured in a lab-scale
system by employing constant volume variable pressure method. Glass transition
temperatures of the blend membranes were in between the pure polymers and
matching with the Taylor-Gordon equation when the k is 1 [29]. CO2 and N2 gas
permeance of the uncoated PES/PI 80/20 membranes increased as the air gap
distance increased from 1 to 10 cm, since the increasing air gap distance may cause
prolonging of the coagulation time and production of a membrane structure with
higher free volume. The CO2 and N2 permeance of uncoated PES/PI 20/80 were
much higher than other membranes, especially in case of N2, revealing that high PI
containing blends have more porous skin layer and looser structure. The CO2/N2
selectivity of the uncoated membranes decreased from 2.2 to 1.3 as the air gap
distance increased from 6 to 31 cm. On the other hand, the CO2/N2 selectivity of the
coated membranes remained similar to PES/PI 80/20 and 50/50 membranes. The
hollow fiber membrane with high PI concentration in the blend showed higher gas
permeance as expected, because PI is more permeable polymer than PES. As a result,
the gas separation performances of the PES/PI blend membranes were better than the
commercial CO2 separation membranes and a good candidate to study and improve
further [35].
A study carried out by Rafiq et al. (2011) on blending of PSf and Matrimid 5218
[36]. PSf and PI were blended in five w/w compositions (100/0, 95/5, 90/10, 85/5
and 80/20) in different NMP/DMF mixtures. They prepared PSf/PI membranes by
dry wet phase inversion method using ethanol as non-solvent. They analyzed the
thermal character of the membranes and reported that both glass transition and
decomposition temperatures were increased as the PI content in the blend increases.
The group were investigated the effect of feed pressure and solvent mixture on gas
separation performance of PSf/PI blend membranes. As the feed pressure increased,
not only CO2, but also CH4 permeance was decreased. Permeance values of the
16
membranes increased as amount of PI in the blend increased, which is expected
because of higher free volume of the PI. The ideal selectivity of CO2 over CH4 was
also increased as the PI content increased. However, as the feed pressure increased,
the ideal selectivities were decreased and membranes prepared in NMP/DMF 80/20
mixture appeared as the least affected from the feed pressure [36].
Ekiner also investigated the gas separation performance of asymmetric hollow fiber
PES: aromatic polyimide and PES: aromatic polyimide: alkyl substituted aromatic
polyimide blend membranes. The gas permeation tests were conducted under
100psig bore feed pressure and 21°C for 21/79 O2/N2 mixture. According to the
results, highest O2 permeance values were obtained from 50:50 wt% and 50:25:25
wt% membranes. On the other hand, highest O2/N2 selective membrane was 10:10:80
wt. % membrane, which is expected [14].
2.2.3. Polymer blend based mixed matrix membranes
The addition of nanoparticles into the polymer blend matrix is one of the newest
research areas of membrane technology. Nonselective void formation because of
poor adhesion of the nanoparticles in the polymer matrix is one of the major
problems of mixed matrix membranes. Usage of polymer blends instead of single
polymer is suggested to improve adhesion [37].
2.2.3.1. Dense Polymer Blend Based Mixed Matrix Membranes
The polymer blend mixed matrix membranes based on polysulfone and polyimide as
base polymers and ZSM-5 as filler was studied [37]. Membranes were prepared by
solution casting method with DCM (dichloromethane) as solvent. Polymer blend
compositions of 0/100, 30/70, 50/50, 70/30, and 100/0 membranes were prepared

17
without and with ZSM-5 to be able the see the effect of ZSM-5 addition on the gas
separation performance. The gas permeation of the membranes were tested in a
constant volume system with feed pressure changing between 2 to 5 bar and 35°C for
O2, N2, CO2, and CH4. According to the results of the gas permeation tests, the gas
permeability of the membranes decreased and the selectivities increased as the
concentration of the PI in the blend increased. PES/PI 50/50 membranes had the
highest O2/N2 and CO2/CH4 selectivities among the blend membranes. The addition
of the ZSM-5 particles to the polymer matrix caused to increase the gas
permeabilities significantly, and thus decreased the selectivities. The reason of this
increment is the nonselective void formed between the particles and polymers [37].
Another study on polymer blend based mixed matrix membranes was conducted by
Ismail et.al [38]. They added Zeolite 4A into the blend of 50/50 PES and Matrimid ®
5218 and investigated the gas separation performances. Membranes were produced
according to the solvent evaporation method where the solvent was NMP. Gas
separation performances of the membranes were investigated in terms of O2 and N2
separation. O2 and N2 gas permeations were increased as the zeolite loading
increased. However, O2/N2 selectivity of membranes were very low [38].
2.2.3.2. Asymmetric Polymer Blend Based Mixed Matrix
Membranes
Basu et al. also studied the effect of PSf addition with the ratio of PI/PSF 3/1 to
PI/[Cu(BTC)2] asymmetric, mixed matrix membranes. [Cu(BTC)2] is a metal organic
framework with high gas absorptivity. Membranes were containing 20 wt.% polymer
and 10, 20, and 30 wt% MOF. There was no evidence of phase separation between
PI and PSf occurred in the SEM micrographs. The selectivity of CO2/CH4 and
CO2/N2 of the PI/PSF 3/1 membranes were lower than the pure PI and PI/MOF
membranes and decreased as the CO2 content in the feed increased. The addition of
18
filler didn’t affect much on the selectivities of the PI/PSf blend membranes also
[39].
Another study on this topic was conducted with addition of silica nanoparticles to
PSF/PI matrix [40]. PI content in PSF matrix was fixed to 20wt% and silica content
was set as 5.2, 10.1, 15.2, and 20.1wt%. According to the SEM images, a sponge-like
layer was supporting a relatively denser skin layer. Silica particles were
homogeneously distributed through the membrane, except 20.1 wt%. At that much of
loading, particles had been started to agglomerate and cause interfacial voids. Glass
transition and decomposition temperatures of the membranes increased as the silica
content increased. Both CO2 and CH4 permeances increased gradually as the amount
of silica in the membrane increased. The permeances of the membranes tend to
decrease upon increase of feed pressure, due to plasticization of the membranes.
Therefore, membranes were heat treated at 120°C for 1h. After heat treatment, the
permeances of the membranes decreased because of reduction of interfacial voids
between silica particle and polymer matrix. In addition, heat treatment enhanced the
selectivity of the membranes [40].
As a brief summary of the literature so far, most of the studies were focused on
O2/N2 separation. The major outcome from these studies was indicating that the
addition of zeolites to polymer blends might increase the O2 permeability of the
membranes, but decrease the O2/N2 selectivity. Another possible inference is that
asymmetric membranes allow more gas to permeate through because of their porous
structure, as expected.
19
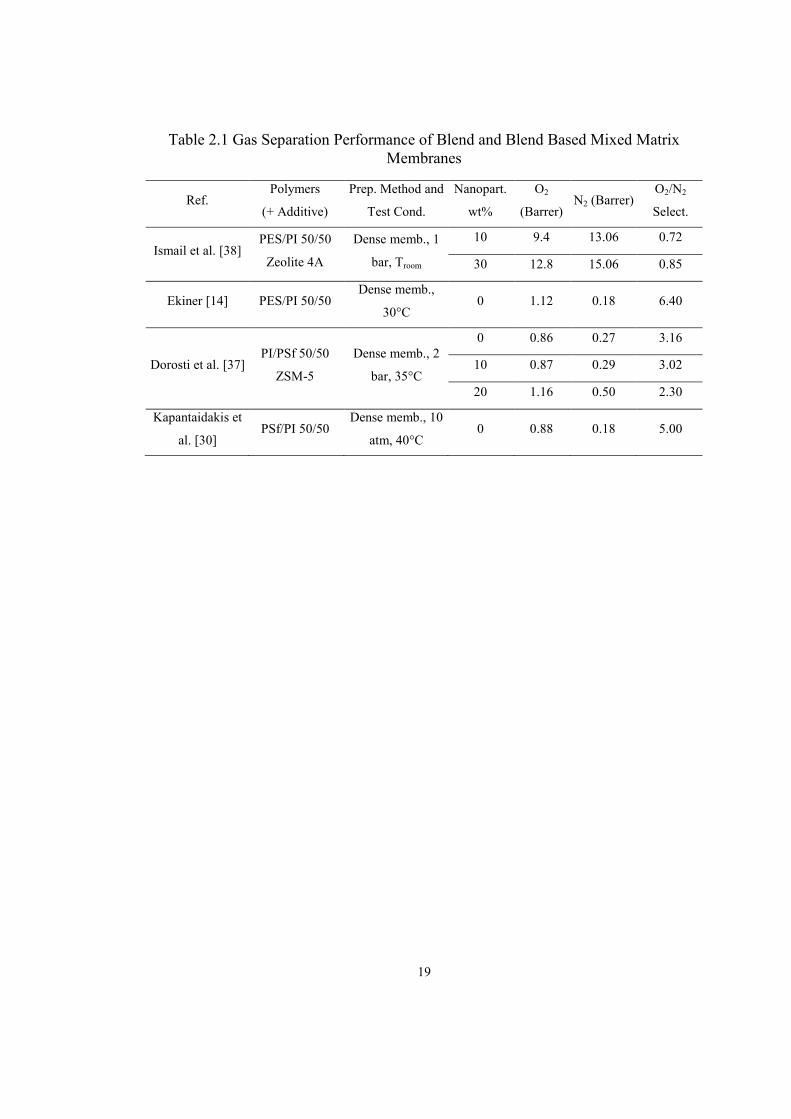
Table 2.1 Gas Separation Performance of Blend and Blend Based Mixed Matrix Membranes
Ref. Polymers
(+ Additive)
Prep. Method and
Test Cond.
Nanopart.
wt%
O2
(Barrer) N2 (Barrer)
O2/N2
Select.
Ismail et al. [38] PES/PI 50/50
Zeolite 4A
Dense memb., 1
bar, Troom
10 9.4 13.06 0.72
30 12.8 15.06 0.85
Ekiner [14] PES/PI 50/50 Dense memb.,
30°C 0 1.12 0.18 6.40
Dorosti et al. [37] PI/PSf 50/50
ZSM-5
Dense memb., 2
bar, 35°C
0 0.86 0.27 3.16
10 0.87 0.29 3.02
20 1.16 0.50 2.30
Kapantaidakis et
al. [30] PSf/PI 50/50
Dense memb., 10
atm, 40°C 0 0.88 0.18 5.00

20

21
CHAPTER 3
EXPERIMENTAL METHODOLOGY
3.1. Preparation of PES/PI and PES/PI/ZIF-8 Membranes
3.1.1. Materials of PES/PI and PES/PI/ZIF-8 Membranes
Radel A-100 grade Polyethersulfone was provided by Solvay. The glass transition
temperature, density, and molecular weight are 220°C, 1.37 g/m3 and 53,000 g/mol,
respectively. Matrimid ® 5218 polyimide resin, of which Tg, density and molecular
weight are 300°C, 1.2 g/cm3, and 80,000 g/mol, was purchased from Alfa Aesar.
Polymers were dried in the oven at 80°C at least for 1 night prior to use for removal
of any absorbed vapor. N,N-Dimethylformamide (DMF), purchased from Sigma-
Aldrich, was chosen as the solvent and used as received. IPA is purchased from
Sigma-Aldrich and used as received as non-solvent.

22
Figure 3.1. Open Formula of Polyimide [33]
Figure 3.2 Open Formula of PES [33]
3.1.2. Materials and Preparation Method of ZIF-8
Zinc nitrate hexahydrate (Zn (NO3)2.6H2O) is purchased from Across, 2-methyl
imidazole and methanol were bought from Sigma-Aldrich to synthesize ZIF-8.
ZIF-8 crystals were synthesized as explained in Keser Demir et. al. [25]. In one
beaker, 4.8 g zinc nitrate hexahydrate were dissolved in 180.8 g methanol. In another
beaker, 10.6 g 2-methyl imidazole were dissolved in 180.8 g methanol. After a short
while of stirring, both solutions became clear and zinc nitrate hexahydrate-methanol
solution was poured in the 2-methyl imidazole solution. The mixture of these
solutions started to whiten immediately indicating that reaction between zinc nitrate
hexahydrate and 2-methyl imidazole had started. The reaction mixture was stirred for
1 hr at 300 rpm in order to complete the ZIF-8 crystal formation. After one hour,

23
ZIF-8 crystals were precipitated in centrifuge. The crystals were washed with
methanol twice to remove any remaining zinc nitrate hexahydrate or 2-methyl
imidazole may clogged the pores of the ZIF-8 particles. ZIF-8 particles were
activated at 180°C in an oven overnight before adding to the membrane preparation
solution.
3.1.3. Membrane Preparation Methodology
3.1.2.1. Dense Membrane Preparation
All compositions of the PES/PI and PES/PI/ZIF-8 membranes were prepared
according to the previously described thin film dense membrane preparation method
[6,41]. Polymer blend membranes were prepared by dissolution of the polymers one
by one in the DMF by priming. For example, during the preparation of the PES/PI
60/40 membranes, first, 1.2 g PES was dissolved in 10 mL DMF by priming, and
stirred overnight. Next day, 0.8 g PI was added into the PES-DMF solution, again by
priming, and stirred overnight. Polymer solution was ultrasonicated between each
polymer addition in order to enhance the interaction between polymer-solvent and
polymer-polymer, therefore the homogeneity. Membrane solution was casted into a
thin film on the third day and placed into an oven at 80°C, 0.2 bar N2 atmosphere for
8 hours in order to remove the solvent. After removal of the solvent, film was
removed from the glass, placed on metal holders and put in the oven at 180°C with
0.8 bar N2 atmosphere for 1 week in order to remove any remaining solvent and
anneal the membrane. Membrane thicknesses were measured with micrometer.
Preparation of polymer blend based mixed matrix membranes is similar, but ZIF-8
crystals were added to DMF a day before addition of polymers and stirred at room
temperature overnight. ZIF-8 addition was done by priming with 30 min
ultrasonication between each addition in order to prevent from agglomeration of the

24
crystals. Polymer addition to the ZIF-8-DMF mixture was done as explained above.
The thickness of the polymer blend based mixed matrix membranes were measured
with micrometer.
The recipe of the blend membranes and polymer blend based mixed matrix
membranes was given in the Table 3.1 and Table 3.2, respectively.
Table 3.1 The recipe of the polymer blend membranes
PES
wt%
PES
(g)
PI
wt% PI (g)
Total
Amount of
Solid (g)
Amount of
DMF (mL)
Membrane
Code
0 0.00 100 2.00 2.00 10 Pure PI 5 0.10 95 1.90 2.00 10 PES/PI 5/95 10 0.20 90 1.80 2.00 10 PES/PI 10/90 20 0.40 80 1.60 2.00 10 PES/PI 20/80 25 0.50 75 1.50 2.00 10 PES/PI 25/75 40 0.80 60 1.20 2.00 10 PES/PI 40/60 50 1.00 50 1.00 2.00 10 PES/PI 50/50 60 1.20 40 0.80 2.00 10 PES/PI 60/40 75 1.50 25 0.50 2.00 10 PES/PI 75/25 90 1.80 10 0.20 2.00 10 PES/PI 90/10 95 1.90 5 0.10 2.00 10 PES/PI 95/5 100 2.00 0 0.00 2.00 10 Pure PES
Table 3.2 The recipe of the polymer blend based mixed matrix membranes
PES
wt%
PES
(g)
PI
wt%
PI
(g)
ZIF-8
wt%
ZIF-8
(g)
Total
Amount of
Solid (g)
Amount of
DMF (mL)
Membrane
Code
20 0.40 80 1.60 10 0.20 2.20 10 PES/PI/ZIF-8 20/80/10

25
3.1.2.2. Asymmetric Membrane Preparation
Asymmetric membranes were prepared only for PES/PI 20/80 blend composition.
The preparation steps of the asymmetric membranes were same with dense
membrane preparation method up to solvent removal part. During preparation of
asymmetric membranes, glass plate with polymer casted on it, was placed into the
coagulation bath, which is composed of 375 mL (75 vol %) IPA and 125mL (25 vol
%) DMF. The coagulation of the polymer film on the glass plate completed in
approximately 15 min. A completely precipitated film was removed from the
coagulation bath and soaked into a distilled water bath for overnight in order to
remove of the IPA and DMF from the pores of the membrane. After water bath,
membrane was removed and gently wiped with paper towel before be placed into the
vacuum oven for drying. Asymmetric membrane was placed on the metal holders
and remaining water entrapped in the porous layer of the membrane was removed at
120°C, under vacuum for 24 hr. Next day, the temperature of the oven was increased
to 180°C and membrane was heat treated for 48 hr.
3.2. Characterization of Blend and Mixed Matrix Membranes and ZIF-8
Crystals
3.2.1. TGA
Thermal character and the amount of solvent entrapped in the membranes were
determined by Shimadzu DTG-60H TGA analysis device. A piece of membrane was
heated from room temperature to 650°C with heating rate of 10°C/min. under N2
atmosphere.

26
3.2.2. DSC
Differential scanning calorimeter analysis were conducted with Shimadzu DSC-60 to
determine the glass transition temperature of the blend and mixed matrix membranes.
Approximately 4 mg of membrane piece was placed in the chamber and heated up to
350°C with the heating rate of 20°C/min under N2 atmosphere and analyses were
conducted as double run.
3.2.3. SEM
The morphology of both polymer blend and mixed matrix membranes were
visualized by scanning electron microscopy in METU Central Laboratory with
QUANTA 400F Field Emission series scanning device. A small piece of membrane
were dipped in liquid nitrogen and fractured by using tweezers. The aim of dipping
membranes in liquid nitrogen is to immobilize the atoms and keep the structure still.
3.2.4. XRD
The patterns of the X-ray diffractometer analysis of the ZIF-8 particles were
compared with the pattern given in the literature. The area under the characteristic
peaks of the ZIF-8, of which belongs the planes of (011), (002), (112), (022), (013),
(222), (114), and (134), is used to determine the percent crystallinity of the particles
[42]. XRD analyses were conducted at the Philips PW 1729 X-Ray Diffractometer,
with Cu-Kα tube at 30 kV voltage and 24 mA current, and 0.05 % scan rate for
Bragg angles between 5-40°.

27
3.3. Gas permeation Measurements of Membranes
Gas permeation experiments were carried on a system designed based on constant
volume-variable pressure method and used previously [6]. The diagram of the test
set-up is given in the Figure 3.3., made-up of a gas tank, a pressure gauge, a
membrane cell, a pressure transducer, a computer, a heating tape and temperature
controller, and vacuum pump. Feed gas tank was made up of seamless stainless steel
to be enduring for high pressures. The pressure of the feed gas tank was measured
with an electronic pressure gauge. All the piping and fittings were ¼” stainless steel,
bought from Swagelok and Hoke. The stainless steel membrane cell was purchased
from Millipore (part no. XX45047 00) with effective membrane area of 9.6 cm2.
Two Viton O-Rings were placed on the cell to prevent any gas leakage during
experiments. One of the O-rings were worn out, therefore it replaced with an original
spare. The pressure change on the permeate side were measured with MKS Baratron
pressure transducer (0-1000 Torr, ± 0.1 Torr) and recorded on the computer. The
two-stage Edwards vacuum pump was used to evacuate the set-up. The temperature
of the set-up was regulated with a heating tape and controlled with J-type
thermocouple and PID controller.
Gas permeation tests were carried under 3 bar absolute pressure and 35°C. Primarily,
a piece of membrane with 9.6 cm2 area was cut and placed into the membrane cell
and the set-up was evacuated for 1.5 hr in order to remove the atmospheric gas or
remaining gas from the previous test. Then, feed tank was filled with penetrant gas
up to absolute 3 bar and immediately allowed to fill the feed and permeate sides of
the membrane cell. This pressure difference acts as driving force of this process. The
increment on the permeate site was measured through pressure transducer and
recorded to the computer. A sample calculation of the membrane’s permeability was
given in APPENDIX A. In order to show the reproducibility of the membranes, each
formulation was casted at least three times and two pieces from each cast were tested

28
twice. Gas permeation experiments were conducted for H2 (Linde, 99.99%), CO2
(Linde, 99.9%) and CH4 (Linde, 99.95%).
Figure 3.3 The Diagram of the Gas Permeation Test Set-Up [6]

29
CHAPTER 4
RESULTS AND DISCUSSION
4.1. Characterization of ZIF-8 Crystals
4.1.1. XRD
Synthesized ZIF-8 crystals were analyzed through X-Ray Diffractometer. After
synthesis, crystals were dried in oven at 80°C overnight in order to remove the
methanol. After drying crystals were crushed in the mortar and activated in the oven
at 180°C overnight. In Figure 4.1, the peaks of two different synthesis of ZIF-8 are
matching one by one with the reference peaks [25], showing that ZIF-8 crystals are
successfully produced.
Figure 4.1 X-Ray Pattern of Synthesized ZIF-8 crystals
30
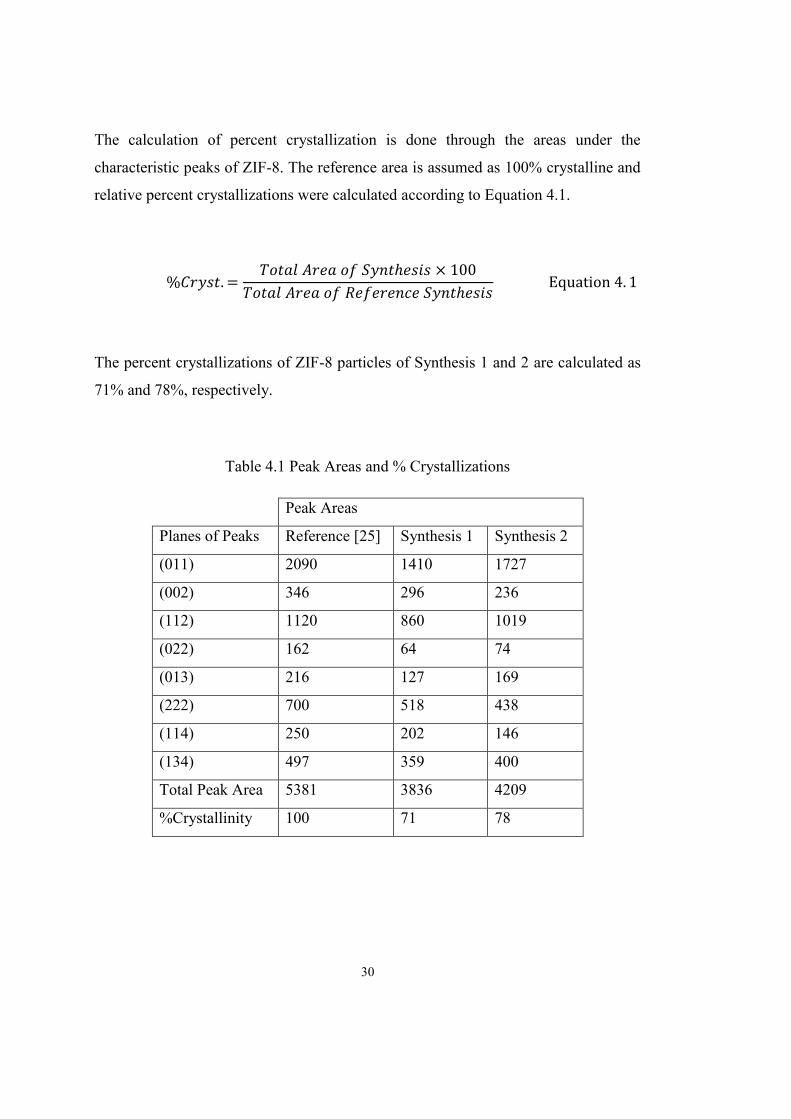
The calculation of percent crystallization is done through the areas under the
characteristic peaks of ZIF-8. The reference area is assumed as 100% crystalline and
relative percent crystallizations were calculated according to Equation 4.1.
The percent crystallizations of ZIF-8 particles of Synthesis 1 and 2 are calculated as
71% and 78%, respectively.
Table 4.1 Peak Areas and % Crystallizations
Peak Areas
Planes of Peaks Reference [25] Synthesis 1 Synthesis 2
(011) 2090 1410 1727
(002) 346 296 236
(112) 1120 860 1019
(022) 162 64 74
(013) 216 127 169
(222) 700 518 438
(114) 250 202 146
(134) 497 359 400
Total Peak Area 5381 3836 4209
%Crystallinity 100 71 78
31
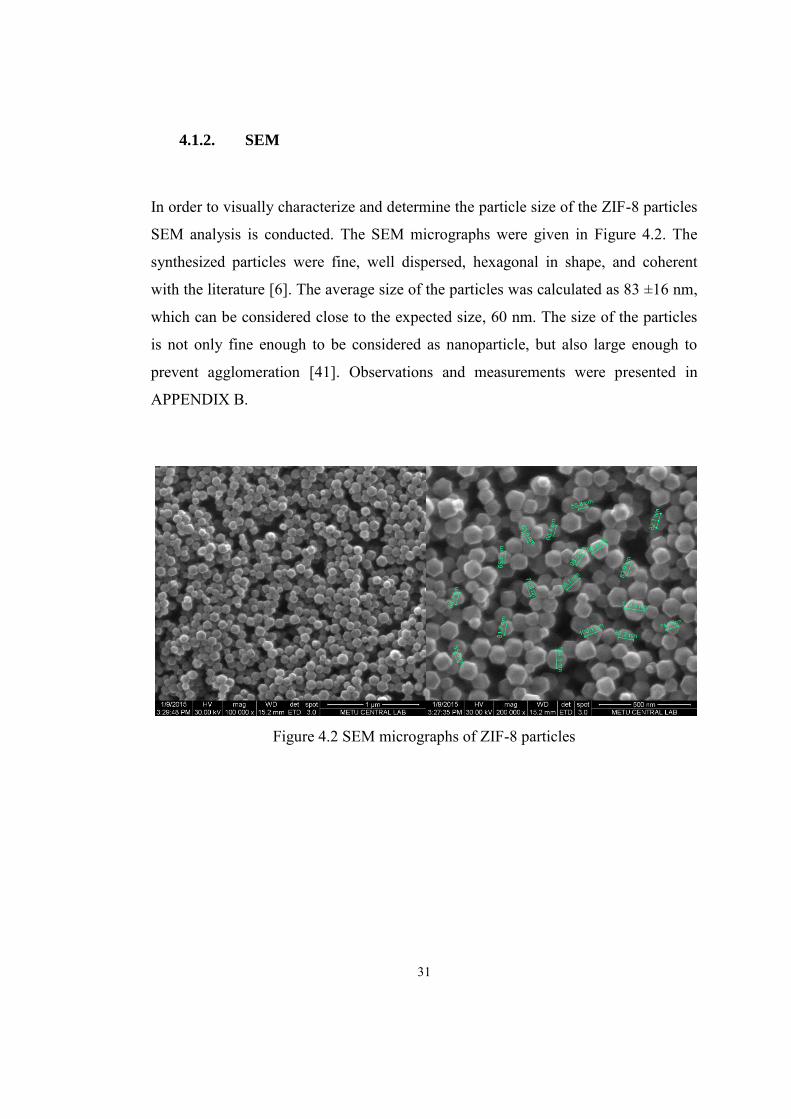
4.1.2. SEM
In order to visually characterize and determine the particle size of the ZIF-8 particles
SEM analysis is conducted. The SEM micrographs were given in Figure 4.2. The
synthesized particles were fine, well dispersed, hexagonal in shape, and coherent
with the literature [6]. The average size of the particles was calculated as 83 ±16 nm,
which can be considered close to the expected size, 60 nm. The size of the particles
is not only fine enough to be considered as nanoparticle, but also large enough to
prevent agglomeration [41]. Observations and measurements were presented in
APPENDIX B.
Figure 4.2 SEM micrographs of ZIF-8 particles
32
4.2. Characterization of PES/PI and PES/PI/ZIF-8 Membranes
4.2.1. TGA
Thermal gravimetric analyses were done to calculate the amount of remaining
solvent entrapped in the membranes and decomposition temperature of the
membranes in order to have an idea about thermal stability of the membranes.
Thermogravimetric analysis is based on the rate of change in weight of the polymer
at a constant rate of heating [43]. The detailed TGA results of Pure PES, Pure PI,
PES/ZIF-8, PES/PI 20/80, and PES/PI/ZIF-8 20/80/10 membranes were presented in
Table 4.2. All thermograms of conducted analyses were given in APPENDIX C.
Table 4.2 TGA Results of PES, PI, PES/PI 20/80, PES/ZIF-8, and PES/PI/ZIF-8 20/80/10 Membranes
Weight % Membrane
Type Wt % ZIF-8 Td (°C)
Weight Loss
(%) PES PI
0 100 Dense 0 514 40.89
20 80 Dense 0 513 40.1
10 493 43.6
100 0 Dense 0 577 58.27
Dense 10 511 [6] 60.86 [6]
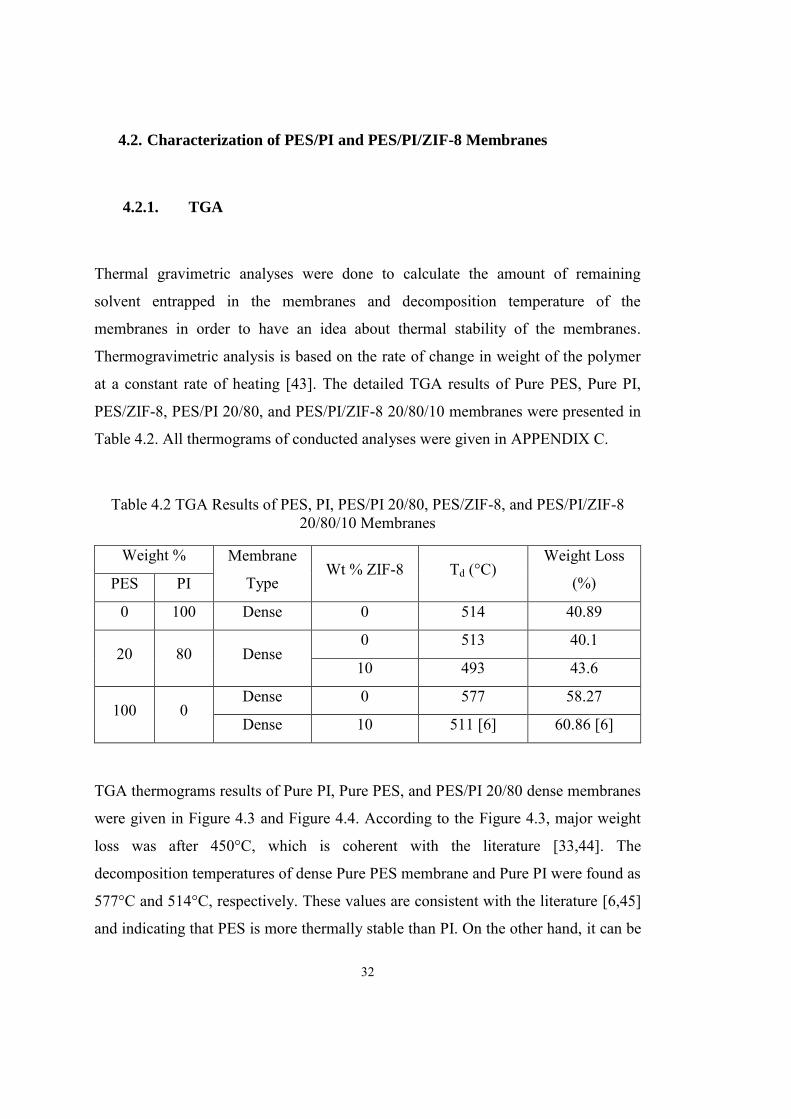
TGA thermograms results of Pure PI, Pure PES, and PES/PI 20/80 dense membranes
were given in Figure 4.3 and Figure 4.4. According to the Figure 4.3, major weight
loss was after 450°C, which is coherent with the literature [33,44]. The
decomposition temperatures of dense Pure PES membrane and Pure PI were found as
577°C and 514°C, respectively. These values are consistent with the literature [6,45]
and indicating that PES is more thermally stable than PI. On the other hand, it can be
33
stated that PI is more thermally durable than PES based on the amounts of the weight
losses given in Table 4.2 and Figure 4.3, because the weight loss of Pure PI
membrane is significantly lower than Pure PES membrane.
The average decomposition temperatures of dense PES/PI 20/80 blend membranes
were found as 513°C ass shown in Figure 4.4, which is close to the Td of PI. The
amount of lost weight of PES/PI 20/80 dense membranes is also very similar to Pure
PI membrane, which is an indication of blend of PES and PI is as durable as Pure PI.
Figure 4.3 TGA Results of Pure PI, Pure PES, and PES/PI 20/80 Membranes
Figure 4.4 Td of Pure PES, PES/PI 20/80 Dense and Pure PI Membranes
40
50
60
70
80
90
100
0 100 200 300 400 500 600
Wei
ght %
TEMPERATURE (°C)
PURE PES PES/PI 20/80 PURE PI
440
460
480
500
520
540
560
580
600
T d (°
C)
Pure PES PES/PI 20/80 Pure PI

34
In Figure 4.5 and Figure 4.6, the TGA thermograms and decomposition temperatures
of PES/PI 20/80 and PES/PI/ZIF-8 20/80/10 membranes were given. The addition of
ZIF-8 to PES/PI matrix caused a significant decrease on Td of the membranes. This
fact is observed before also for PES/ZIF-8 membranes [6]. Lower decomposition
temperature indicates less stable material upon high temperature processes.
Moreover, the amount of weight lost to the polymer matrix increased with ZIF-8
addition, causing to decrease the durability of the membranes at high temperatures.
Figure 4.5 TGA Results of PES/PI 20/80 and PES/PI/ZIF-8 20/80/10 Membranes
Figure 4.6 Td of PES/PI 20/80 and PES/PI/ZIF-8 20/80/10 Membranes
50556065707580859095
100
0 100 200 300 400 500 600
Wei
ght %
TEMPERATURE (°C)
PES/PI 20/80 PES/PI/ZIF-8 20/80/10
480
485
490
495
500
505
510
515
T d (°
C)
PES/PI 20/80 PES/PI/ZIF-8 20/80/10

35
Membrane preparation method does not cause a significant difference on
decomposition temperatures, as presented in Figure 4.7 and Figure 4.8. The
decomposition temperatures of the dense and asymmetric PES/PI 20/80 membranes
were found similar, for dense 512.5 ±0.5°C and for asymmetric 517.4°C.
Asymmetric membrane lost 37.3 g and dense blend membranes lost 40.1 ±1.3 g. The
fact that, asymmetric blend membrane lost lesser amount of their weights compared
to dense blend membranes means that asymmetric blend membranes are more
durable than dense blend membranes.
Figure 4.7 TGA Results of PES/PI 20/80 Dense and Asymmetric Membranes
Figure 4.8 Td of Dense and Asymmetric PES/PI 20/80 Membranes
55
60
65
70
75
80
85
90
95
100
0 50 100 150 200 250 300 350 400 450 500 550 600 650
Wei
ght %
TEMPERATURE (°C)
PES/PI 20/80 Asymmetric PES/PI 20/80 Dense
500
505
510
515
520
Td (°
C)
PES/PI 20/80 Dense PES/PI 20/80 Asym.

36
4.2.2. DSC
Differential scanning calorimeter (DSC) is a well-known method to determine the
miscibility of polymers. Observation of one phase transition indicates the miscibility
and compatibility of two polymers, while more than one phase transitions indicate
formation of different phases within the inner structure and immiscibility of the
polymers.
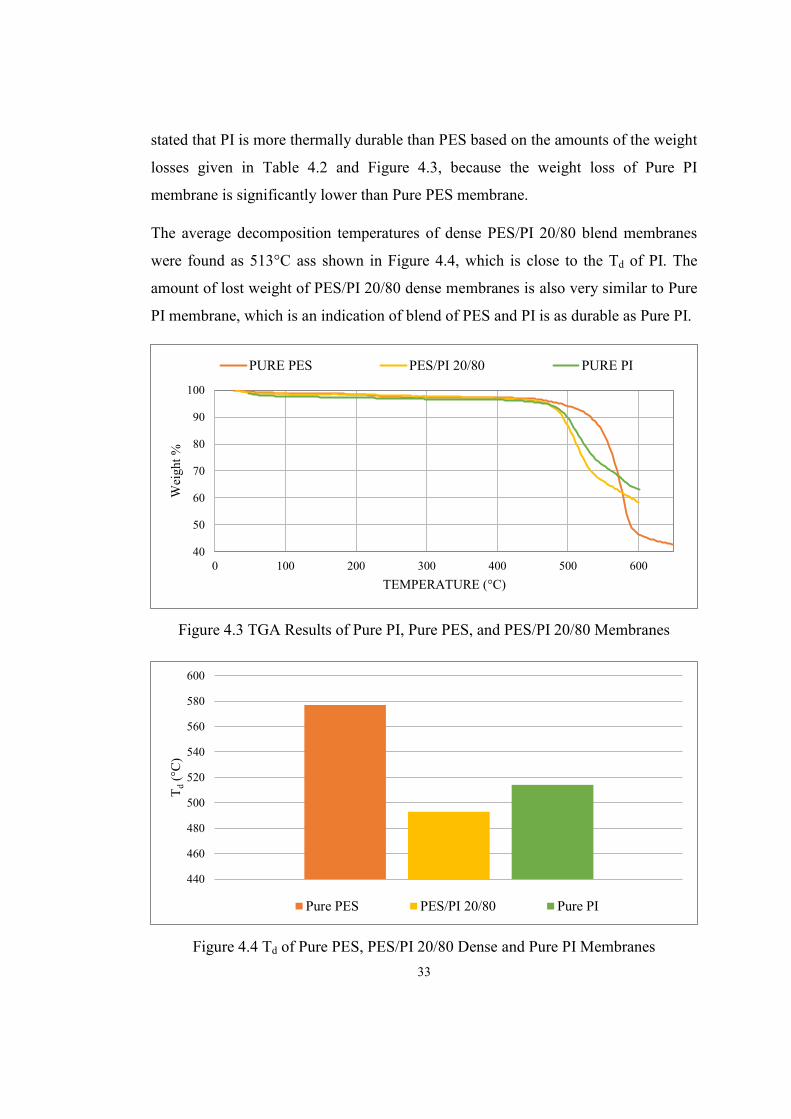
Firstly, PES/PC wt/wt 1:1 and 1:2 blends were prepared according to method
explained in 3.1.2.1. Phase separation between PES and PC was observed visually on
both casting solutions and casted membranes. Resulting films were heterogeneous,
which cannot be used as membranes. DSC scan analyses of these membranes were
given in Figure 4.9 and Figure 4.10. DSC analysis results showed that these two
polymers are not compatible. In Figure 4.9 and Figure 4.10, two different glass
transition temperatures were observed at 148°C which belongs to Tg of pure PC, and
217°C which belongs to Tg of pure PES [27], proving these two polymers are
incompatible.
Figure 4.9 DSC result of PES/PC 1:1 Membrane
37
Figure 4.10 DSC result of PES/PC 1:2 Membrane
After shoving that PES and PC are not compatible and resulting films are not usable
as a membrane, a PES compatible polymer was searched through literature. One of
the PES-compatible polymers mentioned in the literature was PI [29]. Therefore,
further studies were conducted on blending of PES and PI.
In order to prove the miscibility and compatibility of PES and PI, we also conducted
DSC analysis. In order to remove the thermal history of the membranes, DSC scans
were conducted twice [6]. However, two different glass transitions were observed in
the second runs of the analyses at the temperatures of each polymers in DSC scans of
some PES/PI blends, and in other analyses single value is observed very close to Tg
of the pure polymers, as presented in Table 4.3. This fact is mentioned in the
literature by Liang et al. as an indication of a phase separation [29, 43]. They stated
that when the PES/PI polymer blend is heated up to 350°C for 30 min, which is
above the glass transition temperature of PI, caused to phase separation of the
polymers. Resulting films became cloudy, as a visual proof of phase separation.
Further rheological measurements conducted by them, suggesting that the reason of
phase separation may because of the change in viscoelastic properties at higher

38
temperatures [29]. In addition, the reason of increase in opacity of the polymer blend
films may be an indication of increase in crystallinity. Heating the polymer films
above Tg increases the chain mobility [47]. Therefore, polymer chains rearrange
themselves and chains of each polymer may contract individually, thereby may cause
phase separation. Therefore, further DSC analyses of ZIF-8 containing and
asymmetric blend membranes were conducted as single run through this study. A
sample scan of PES/PI 25/75 dense blend membranes was given in the Figure 4.11.
All DSC thermograms of blend membranes were given in APPENDIX D.
Table 4.3 DSC Results of Dense Blend Membranes
Weight % PI Tg 1st Run
Tg 2nd Run PI dominated
phase PES dominated
phase 100 317 N/A
95 310 313
90 303
80 290 313
75 252 307 227
50 260 227
25 240 226
10 232 224
0 220 [48] N/A
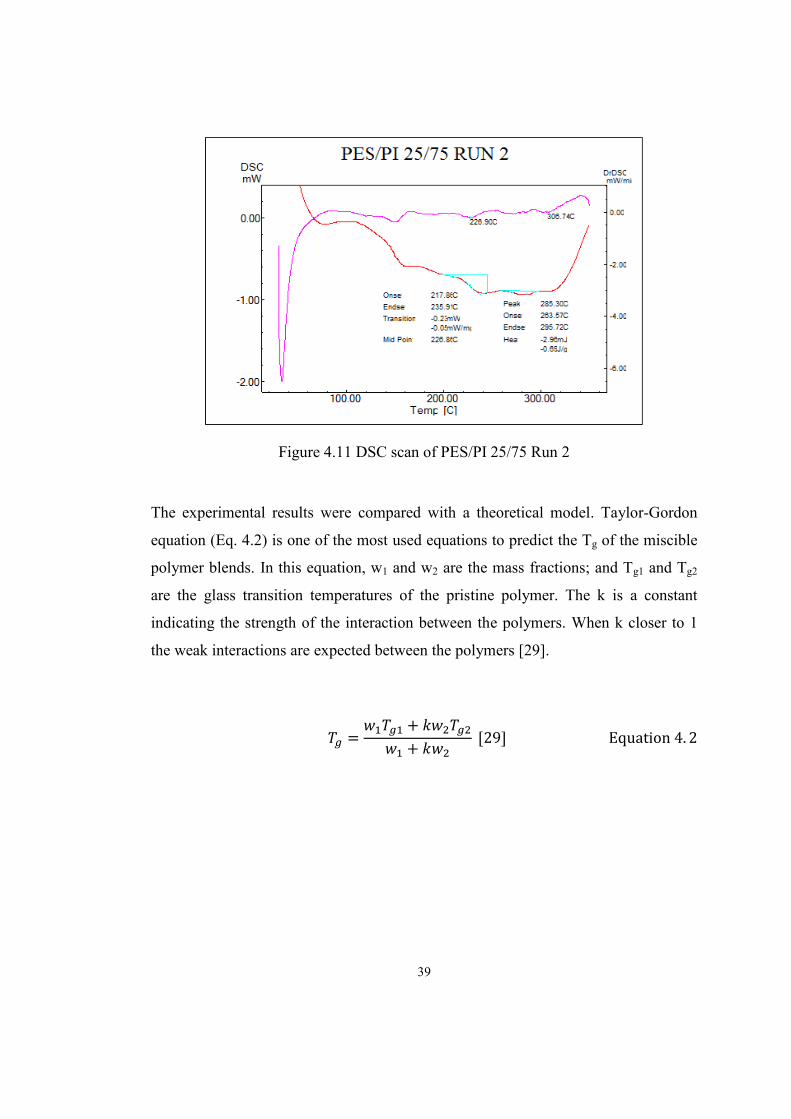
39
Figure 4.11 DSC scan of PES/PI 25/75 Run 2
The experimental results were compared with a theoretical model. Taylor-Gordon
equation (Eq. 4.2) is one of the most used equations to predict the Tg of the miscible
polymer blends. In this equation, w1 and w2 are the mass fractions; and Tg1 and Tg2
are the glass transition temperatures of the pristine polymer. The k is a constant
indicating the strength of the interaction between the polymers. When k closer to 1
the weak interactions are expected between the polymers [29].
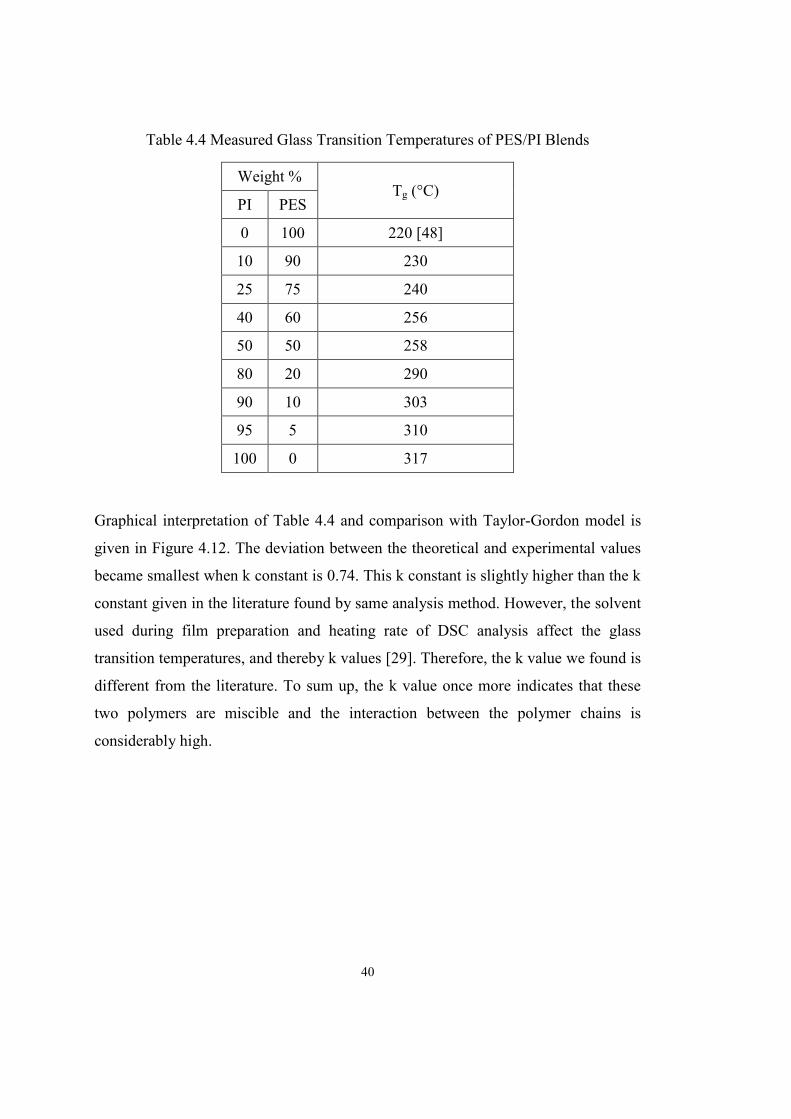
40
Table 4.4 Measured Glass Transition Temperatures of PES/PI Blends
Weight % Tg (°C)
PI PES
0 100 220 [48]
10 90 230
25 75 240
40 60 256
50 50 258
80 20 290
90 10 303
95 5 310
100 0 317
Graphical interpretation of Table 4.4 and comparison with Taylor-Gordon model is
given in Figure 4.12. The deviation between the theoretical and experimental values
became smallest when k constant is 0.74. This k constant is slightly higher than the k
constant given in the literature found by same analysis method. However, the solvent
used during film preparation and heating rate of DSC analysis affect the glass
transition temperatures, and thereby k values [29]. Therefore, the k value we found is
different from the literature. To sum up, the k value once more indicates that these
two polymers are miscible and the interaction between the polymer chains is
considerably high.

41
Figure 4.12 Experimental vs. Taylor-Gordon Eqn. Tg Results
4.2.3. SEM
PES/PI (dense and asymmetric) and PES/PI/ZIF-8 membranes are characterized
through SEM analysis in order to determine the morphology of the membranes. SEM
micrographs of some of the dense polymeric membranes are given in the Figure 4.13
and Figure 4.14.
In Figure 4.13, membrane is appeared as homogeneous and the thickness is measured
as 51.5 µm, which is close to the micrometer measurements, 55 µm. The droplet-
like, rough structure is observed at the cross sectional view of the membrane. This
feature is also observed in the literature before [49–51].
R² = 0,9963
200
220
240
260
280
300
320
340
0 20 40 60 80 100
Tg (
C)
Wt% PI
Experimental Taylor-Gordon

42
Figure 4.13 SEM Micrograph of Pure PI Dense Membrane (a) low magnification; (b) high magnification
In Figure 4.14, the cross-sectional morphology of Pure PI, PES/PI 10/90, PES/PI
20/80, PES/PI 75/25, PES/PI 50/50, PES/PI 75/25, and PES/PI 90/10 membranes are
given for comparison. The cross-sectional roughness is observed in all PES/PI blend
membranes and also indicated in the literature [37,44]. There are no phase
separations or defects observed in the SEM micrographs, indicating that PES/PI
couple is miscible and compatible.
(a) (b)

43
Figure 4.14 SEM micrographs of cross-sections of (a) Pure PI; (b) PES/PI 10/90; (c) PES/PI 20/80; (d) PES/PI 75/25; (e) PES/PI 50/50; (f) PES/PI 75/25;
(g) PES/PI 90/10 membranes at high magnification
(a) (b)
(c) (d)
(e) (f)
(g)
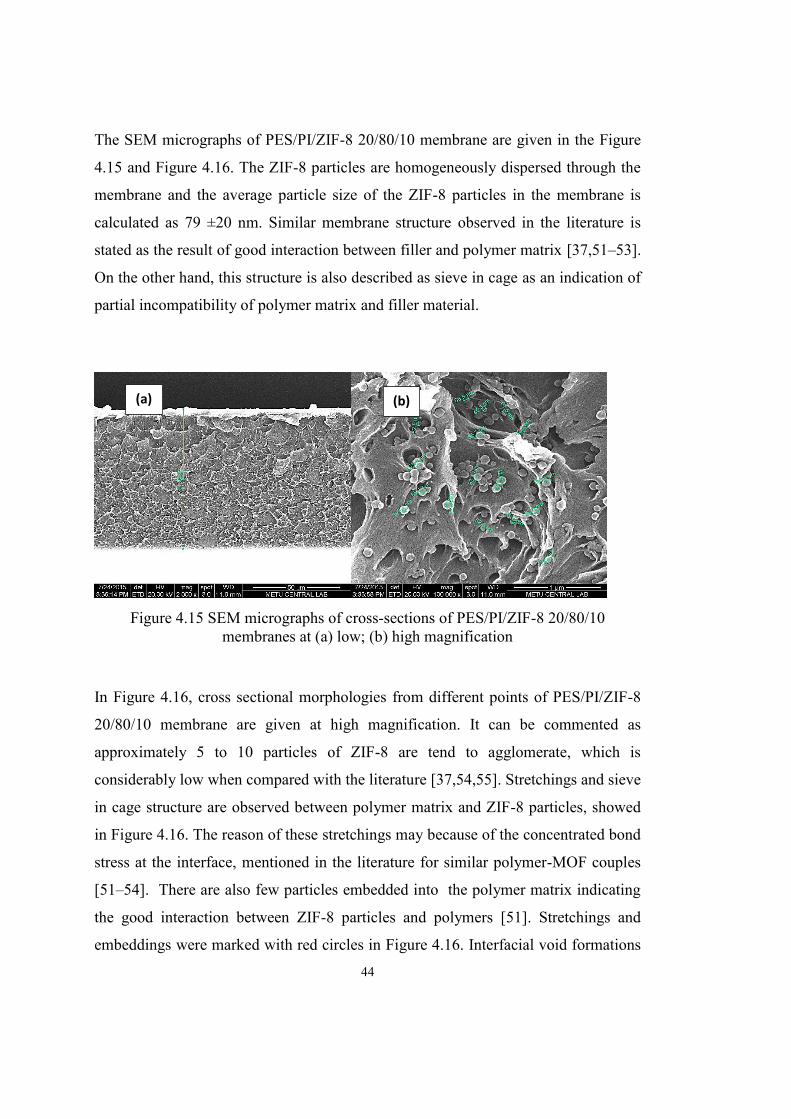
44
The SEM micrographs of PES/PI/ZIF-8 20/80/10 membrane are given in the Figure
4.15 and Figure 4.16. The ZIF-8 particles are homogeneously dispersed through the
membrane and the average particle size of the ZIF-8 particles in the membrane is
calculated as 79 ±20 nm. Similar membrane structure observed in the literature is
stated as the result of good interaction between filler and polymer matrix [37,51–53].
On the other hand, this structure is also described as sieve in cage as an indication of
partial incompatibility of polymer matrix and filler material.
Figure 4.15 SEM micrographs of cross-sections of PES/PI/ZIF-8 20/80/10 membranes at (a) low; (b) high magnification
In Figure 4.16, cross sectional morphologies from different points of PES/PI/ZIF-8
20/80/10 membrane are given at high magnification. It can be commented as
approximately 5 to 10 particles of ZIF-8 are tend to agglomerate, which is
considerably low when compared with the literature [37,54,55]. Stretchings and sieve
in cage structure are observed between polymer matrix and ZIF-8 particles, showed
in Figure 4.16. The reason of these stretchings may because of the concentrated bond
stress at the interface, mentioned in the literature for similar polymer-MOF couples
[51–54]. There are also few particles embedded into the polymer matrix indicating
the good interaction between ZIF-8 particles and polymers [51]. Stretchings and
embeddings were marked with red circles in Figure 4.16. Interfacial void formations
(a) (b)
45
are also clearly observed at all SEM micrographs, as an indication that PES/PI
polymer matrix is not completely compatible with ZIF-8 particles [37,56]. Another
possible reason of occurring of interfacial voids is stated in the literature as freeze
fracturing in liquid nitrogen [15,39,51–53].

46
Figure 4.16 High magnification SEM micrographs of PES/PI/ZIF-8 20/80/10 membranes where Polymer Matrix-ZIF-8 attachments marked

47
In Figure 4.17, the SEM micrographs of asymmetric PES/PI 20/80 membranes are
given with different magnifications. A sponge-like nano-porous skin layer on top of
sponge-like micro-porous support layer is observed. Similar asymmetric structures
were mentioned in the literature before for similar polymer couples [11,33,36].
The thicknesses of skin layer and overall membrane are measured as 14 and 174 µm,
respectively. In addition, pore size of the support layer is approximately 1 micron
and pores size of the skin layer is below micron size.
Figure 4.17 SEM micrographs of Asymmetric PES/PI 20/80 Membrane
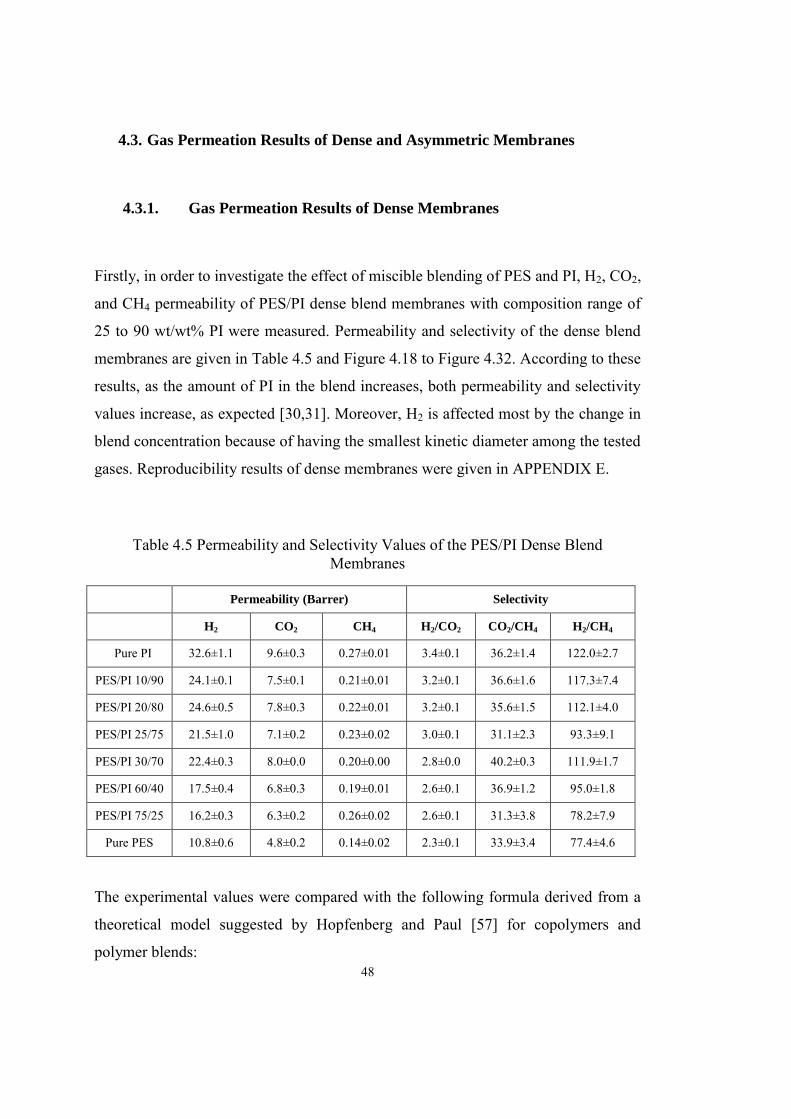
48
4.3. Gas Permeation Results of Dense and Asymmetric Membranes
4.3.1. Gas Permeation Results of Dense Membranes
Firstly, in order to investigate the effect of miscible blending of PES and PI, H2, CO2,
and CH4 permeability of PES/PI dense blend membranes with composition range of
25 to 90 wt/wt% PI were measured. Permeability and selectivity of the dense blend
membranes are given in Table 4.5 and Figure 4.18 to Figure 4.32. According to these
results, as the amount of PI in the blend increases, both permeability and selectivity
values increase, as expected [30,31]. Moreover, H2 is affected most by the change in
blend concentration because of having the smallest kinetic diameter among the tested
gases. Reproducibility results of dense membranes were given in APPENDIX E.
Table 4.5 Permeability and Selectivity Values of the PES/PI Dense Blend Membranes
Permeability (Barrer) Selectivity
H2 CO2 CH4 H2/CO2 CO2/CH4 H2/CH4
Pure PI 32.6±1.1 9.6±0.3 0.27±0.01 3.4±0.1 36.2±1.4 122.0±2.7
PES/PI 10/90 24.1±0.1 7.5±0.1 0.21±0.01 3.2±0.1 36.6±1.6 117.3±7.4
PES/PI 20/80 24.6±0.5 7.8±0.3 0.22±0.01 3.2±0.1 35.6±1.5 112.1±4.0
PES/PI 25/75 21.5±1.0 7.1±0.2 0.23±0.02 3.0±0.1 31.1±2.3 93.3±9.1
PES/PI 30/70 22.4±0.3 8.0±0.0 0.20±0.00 2.8±0.0 40.2±0.3 111.9±1.7
PES/PI 60/40 17.5±0.4 6.8±0.3 0.19±0.01 2.6±0.1 36.9±1.2 95.0±1.8
PES/PI 75/25 16.2±0.3 6.3±0.2 0.26±0.02 2.6±0.1 31.3±3.8 78.2±7.9
Pure PES 10.8±0.6 4.8±0.2 0.14±0.02 2.3±0.1 33.9±3.4 77.4±4.6
The experimental values were compared with the following formula derived from a
theoretical model suggested by Hopfenberg and Paul [57] for copolymers and
polymer blends:
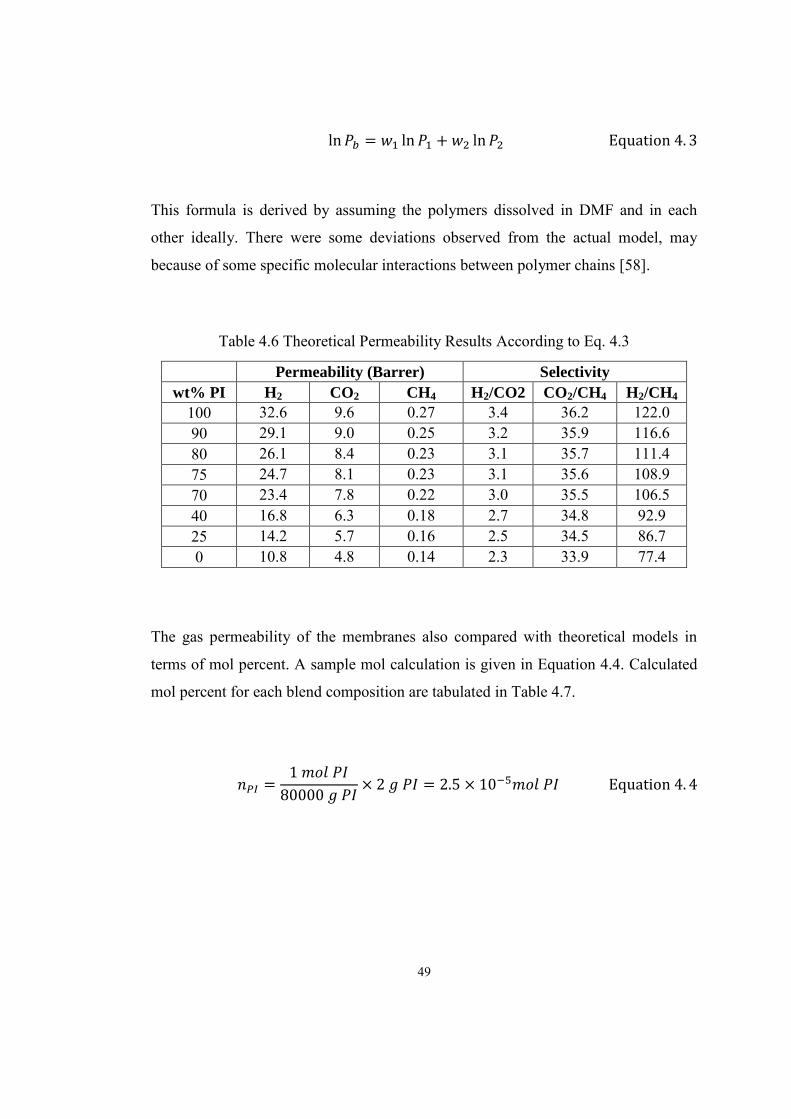
49
This formula is derived by assuming the polymers dissolved in DMF and in each
other ideally. There were some deviations observed from the actual model, may
because of some specific molecular interactions between polymer chains [58].
Table 4.6 Theoretical Permeability Results According to Eq. 4.3
Permeability (Barrer) Selectivity wt% PI H2 CO2 CH4 H2/CO2 CO2/CH4 H2/CH4
100 32.6 9.6 0.27 3.4 36.2 122.0 90 29.1 9.0 0.25 3.2 35.9 116.6 80 26.1 8.4 0.23 3.1 35.7 111.4 75 24.7 8.1 0.23 3.1 35.6 108.9 70 23.4 7.8 0.22 3.0 35.5 106.5 40 16.8 6.3 0.18 2.7 34.8 92.9 25 14.2 5.7 0.16 2.5 34.5 86.7 0 10.8 4.8 0.14 2.3 33.9 77.4
The gas permeability of the membranes also compared with theoretical models in
terms of mol percent. A sample mol calculation is given in Equation 4.4. Calculated
mol percent for each blend composition are tabulated in Table 4.7.
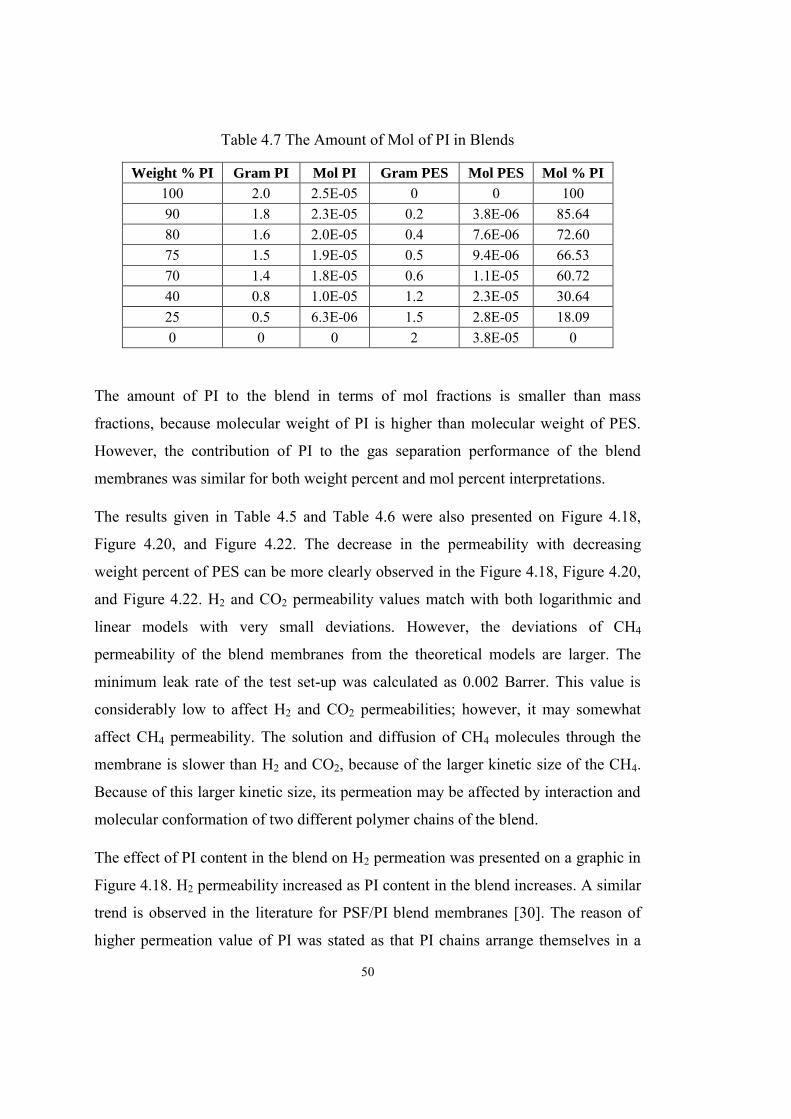
50
Table 4.7 The Amount of Mol of PI in Blends
Weight % PI Gram PI Mol PI Gram PES Mol PES Mol % PI
100 2.0 2.5E-05 0 0 100 90 1.8 2.3E-05 0.2 3.8E-06 85.64 80 1.6 2.0E-05 0.4 7.6E-06 72.60 75 1.5 1.9E-05 0.5 9.4E-06 66.53 70 1.4 1.8E-05 0.6 1.1E-05 60.72 40 0.8 1.0E-05 1.2 2.3E-05 30.64 25 0.5 6.3E-06 1.5 2.8E-05 18.09 0 0 0 2 3.8E-05 0
The amount of PI to the blend in terms of mol fractions is smaller than mass
fractions, because molecular weight of PI is higher than molecular weight of PES.
However, the contribution of PI to the gas separation performance of the blend
membranes was similar for both weight percent and mol percent interpretations.
The results given in Table 4.5 and Table 4.6 were also presented on Figure 4.18,
Figure 4.20, and Figure 4.22. The decrease in the permeability with decreasing
weight percent of PES can be more clearly observed in the Figure 4.18, Figure 4.20,
and Figure 4.22. H2 and CO2 permeability values match with both logarithmic and
linear models with very small deviations. However, the deviations of CH4
permeability of the blend membranes from the theoretical models are larger. The
minimum leak rate of the test set-up was calculated as 0.002 Barrer. This value is
considerably low to affect H2 and CO2 permeabilities; however, it may somewhat
affect CH4 permeability. The solution and diffusion of CH4 molecules through the
membrane is slower than H2 and CO2, because of the larger kinetic size of the CH4.
Because of this larger kinetic size, its permeation may be affected by interaction and
molecular conformation of two different polymer chains of the blend.
The effect of PI content in the blend on H2 permeation was presented on a graphic in
Figure 4.18. H2 permeability increased as PI content in the blend increases. A similar
trend is observed in the literature for PSF/PI blend membranes [30]. The reason of
higher permeation value of PI was stated as that PI chains arrange themselves in a

51
less compacted manner than PES chains, due to the bulkier repeating unit of PI [31].
It can be seen in the Figure 4.18 that experimental permeability values are matching
with the logarithmic model [30,31] better than linear model. There are some small
deviations were observed from the theoretical models. PES/PI 10/90 membranes had
the highest deviation from the theoretical models for H2 permeation.
Figure 4.18 PI wt% vs. H2 Permeability
Hydrogen permeability of blend membranes were also compared with theoretical
models based on mol percentages of the polymers in the blend and graphically
interpreted in Figure 4.19. Membrane code names are kept same as weight
percentages for simplicity. Similar to weight percent case, the permeability of the
membranes increased as the PI content increased. In addition, the deviations from the
theoretical models were found smaller in case of mol percent interpretation.
5.00
10.00
15.00
20.00
25.00
30.00
35.00
0 10 20 30 40 50 60 70 80 90 100
H2 P
ERM
EAB
ILIT
Y (B
arre
r)
PI wt%
Pure PESPES/PI 75/25PES/PI 60/40PES/PI 30/70PES/PI 25/75PES/PI 20/80PES/PI 10/90Pure PILogarithmicLinear

52
Figure 4.19 PI mol% vs. H2 Permeability
The permeability results of CO2 are similar with H2, seen in Figure 4.20.
Permeability values increase as the PI composition increases, coherent with the
literature [17,31,37,59]. The CO2 permeability of PES/PI 10/90 differs from the
theoretical values as similar in case of H2 permeability. The deviation of PES/PI
10/90 from the logarithmic model is calculated as 17%.
Figure 4.20 PI wt% vs. CO2 Permeability
5.00
10.00
15.00
20.00
25.00
30.00
35.00
0 10 20 30 40 50 60 70 80 90 100
H2 P
ERM
EAB
ILIT
Y (B
arre
r)
PI mol%
Pure PESPES/PI 75/25PES/PI 60/40PES/PI 30/70PES/PI 25/75PES/PI 20/80PES/PI 10/90Pure PILogarithmicLinear
4.00
5.00
6.00
7.00
8.00
9.00
10.00
0 10 20 30 40 50 60 70 80 90 100
CO
2 PER
MEA
BIL
ITY
(Bar
rer)
PI wt%
Pure PESPES/PI 75/25PES/PI 60/40PES/PI 30/70PES/PI 25/75PES/PI 20/80PES/PI 10/90Pure PILogarithmicLinear

53
CO2 permeability of blend membranes versus amount of PI in the blend as mol
percent is presented in Figure 4.21. The difference between theoretical models and
experimental results were smaller than weight percent interpretation of the results.
For example, the deviation from the logarithmic model of PES/PI 10/90 was
calculated as 14%. Again, the permeability increased as the amount of PI in the blend
increased.
Figure 4.21 PI mol% vs. CO2 Permeability
In Figure 4.22, PI content in the blend versus the CH4 permeability values of the
dense blend membranes can be seen. It can be stated that CH4 permeability values of
the blend membranes increased as the amount of PI in the blend increased, agreeing
with the literature [31,37], except PES/PI 75/25 membrane. The CH4 permeability of
PES/PI 75/25 membrane deviates from the theoretical models clearly, e.g. 39%
deviation from the logarithmic model. Nevertheless, all CH4 permeability values of
the blend membranes were in between the CH4 permeability values of Pure PI and
Pure PES.
4.00
5.00
6.00
7.00
8.00
9.00
10.00
0 10 20 30 40 50 60 70 80 90 100
CO
2 PER
MEA
BIL
ITY
(Bar
rer)
PI mol%
Pure PESPES/PI 75/25PES/PI 60/40PES/PI 30/70PES/PI 25/75PES/PI 20/80PES/PI 10/90Pure PILogartihmicLinear

54
Figure 4.22 PI wt% vs. CH4 Permeability
The effect of increase in PI amount in terms of mol percent on CH4 permeability of
the blend membranes can be observed in Figure 4.23. There is no significant
difference is observed between weight or mol percent interpretations.
Figure 4.23 PI mol% vs. CH4 Permeability
0.12
0.16
0.20
0.24
0.28
0 10 20 30 40 50 60 70 80 90 100
CH
4 PER
MEA
BIL
ITY
(Bar
rer)
PI wt%
Pure PESPES/PI 75/25PES/PI 60/40PES/PI 30/70PES/PI 25/75PES/PI 20/80PES/PI 10/90Pure PILogartihmicLinear
0.12
0.16
0.20
0.24
0.28
0 10 20 30 40 50 60 70 80 90 100
CH
4 PER
MEA
BIL
ITY
(Bar
rer)
PI mol%
Pure PESPES/PI 75/25PES/PI 60/40PES/PI 30/70PES/PI 25/75PES/PI 20/80PES/PI 10/90Pure PILogarithmicLinear

55
The effect of change in PI composition on H2/CO2 selectivity was presented in
Figure 4.24. According to graphic, H2/CO2 selectivity values are increasing as the
amount of PI in the blend increased. In a similar study, blend of PBI and Matrimid
performed a synergetic effect of H2/CO2 selectivity. The H2/CO2 selectivity of
Matrimid/PBI 25/75 membrane is higher than the Pure PBI and Pure Matrimid
membranes [31]. The possible reason of this difference between our experiments and
literature values could be different interactions between polymers and difference in
interactions between CO2 and polymeric components of blend membrane. All
H2/CO2 selectivity values of the blend membranes matched with the both logarithmic
and linear models.
Figure 4.24 PI wt% vs. H2/CO2 Selectivity
The selectivity of H2/CO2 depending on the mol percent of PI is given in Figure 4.25.
The experimental selectivity values and theoretical values were similar to each other.
The deviations from the theoretical models in case of mol percent PI were found
similar to weight percent PI interpretation.
2.00
2.25
2.50
2.75
3.00
3.25
3.50
0 10 20 30 40 50 60 70 80 90 100
H2/C
O2 S
ELEC
TIV
ITY
wt% PI
Pure PESPES/PI 75/25PES/PI 60/40PES/PI 30/70PES/PI 25/75PES/PI 20/80PES/PI 10/90Pure PILogarithmicLinear

56
Figure 4.25 PI mol% vs. H2/CO2 Selectivity
In Figure 4.26, H2 permeability versus H2/CO2 selectivity values of PES/PI blend
membranes were given with respect to theoretical upper bound [12]. It can be
obviously seen that H2/CO2 separation performance of PI is closer to the theoretical
upper bound drawn by Robeson and both H2 permeability and H2/CO2 selectivity
values of blend membranes are increasing as the PI content increased, because PI
chains are less compacted than PES chains thanks to bulkier repeating unit [36].
2.00
2.25
2.50
2.75
3.00
3.25
3.50
0 10 20 30 40 50 60 70 80 90 100
H2/C
O2 S
ELEC
TIV
ITY
PI mol%
Pure PES
PES/PI 75/25
PES/PI 60/40
PES/PI 30/70
PES/PI 25/75
PES/PI 20/80
PES/PI 10/90
Pure PI
Logarithmic
Linear

57
Figure 4.26 Single gas permeabilities of blend membranes with reference line for H2/CO2 pair
CO2/CH4 selectivity as a function of blend composition (PI wt%) is given in Figure
4.27. It can be clearly seen that linear and theoretical models are exactly coinciding.
Some of the experimental values are deviating from the theoretical models. PES/PI
20/80 membrane’s CO2/CH4 selectivity is overlapping with the theoretical models.
The CO2/CH4 selectivity of PES/PI 60/40 and PES/PI 30/70 membranes are above;
PES/PI 75/25 and PES/PI 25/75 membranes are below the theoretical models. As it is
stated above, CH4 permeation may be affected by the leak rate of the experimental
set-up. Since the molecular diameter of the CH4 is comparatively larger than H2 and
CO2, CH4 molecules move slower through the solution and diffusion. Therefore, test
set-up is subject to leaks for longer duration. In addition, CO2 molecules may interact
with polymer chains and affect the conformation of the chains. CO2 diffusion may be
affected by differing chain conformations at different blend compositions. Since the
diffusion of H2 through the membrane is considerably fast, because of very small
kinetic diameter, the effect of change in conformation may not affect H2 diffusion.
1.00
10.00
5.00 50.00
H2/C
O2 S
ELEC
TIV
ITY
H2 PERMEABILITY (Barrer)
Pure PESPES/PI 75/25PES/PI 60/40PES/PI 30/70PES/PI 25/75PES/PI 20/80PES/PI 10/90Pure PIRobesonLogarithmicLinear

58
Figure 4.27 PI wt% vs. CO2/CH4 Selectivity
The CO2/CH4 selectivity of the blend membranes in terms of mol percent of PI is
given in Figure 4.28. The contribution of mol of PI to the CO2/CH4 selectivity
performance of the blend membranes was found almost same with the contribution
of weight of PI. Therefore, the interactions of CO2 and CH4 molecules with polymer
chains are dominant than the interaction of polymer chains with each other.
Figure 4.28 PI mol% vs. CO2/CH4 Selectivity
30.00
32.00
34.00
36.00
38.00
40.00
42.00
0 10 20 30 40 50 60 70 80 90 100
CO
2/CH
4 SELE
CTI
VIT
Y
PI wt%
Pure PESPES/PI 75/25PES/PI 60/40PES/PI 30/70PES/PI 25/75PES/PI 20/80PES/PI 10/90Pure PILogarithmicLinear
30.00
32.00
34.00
36.00
38.00
40.00
42.00
0 10 20 30 40 50 60 70 80 90 100
CO
2/CH
4 SEL
ECTI
VIT
Y
PI mol%
Pure PESPES/PI 75/25PES/PI 60/40PES/PI 30/70PES/PI 25/75PES/PI 20/80PES/PI 10/90Pure PILogarithmicLinear
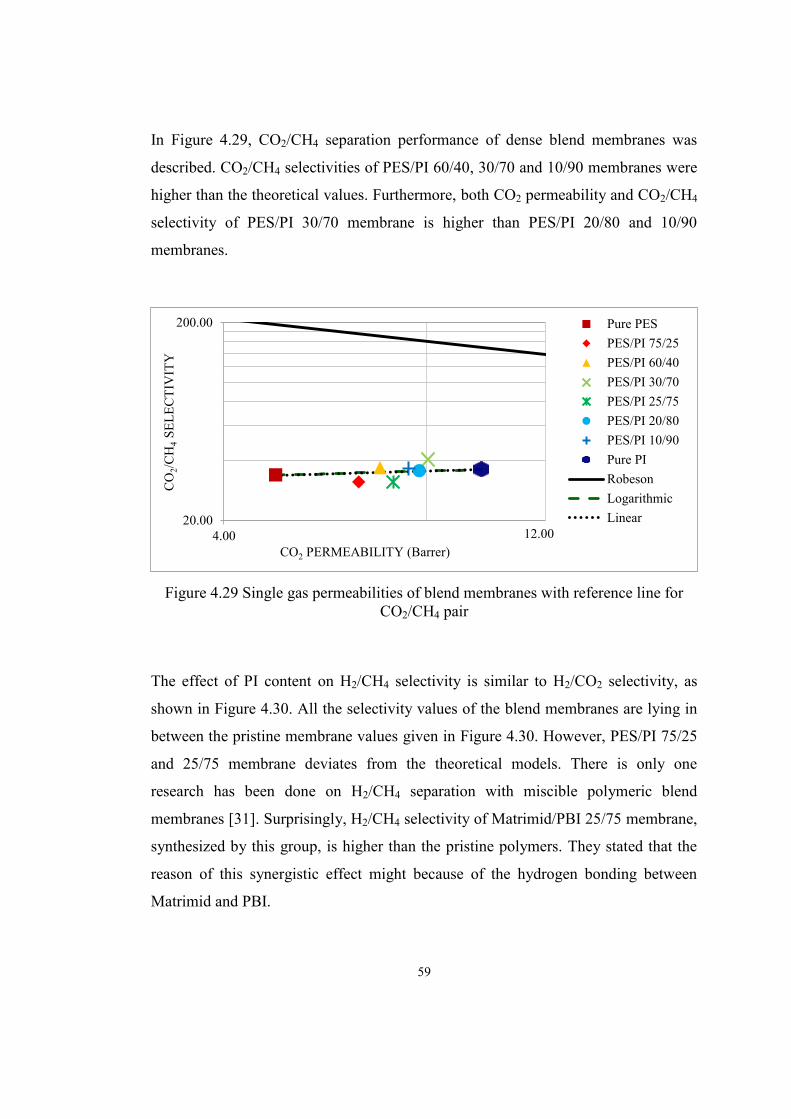
59
In Figure 4.29, CO2/CH4 separation performance of dense blend membranes was
described. CO2/CH4 selectivities of PES/PI 60/40, 30/70 and 10/90 membranes were
higher than the theoretical values. Furthermore, both CO2 permeability and CO2/CH4
selectivity of PES/PI 30/70 membrane is higher than PES/PI 20/80 and 10/90
membranes.
Figure 4.29 Single gas permeabilities of blend membranes with reference line for CO2/CH4 pair
The effect of PI content on H2/CH4 selectivity is similar to H2/CO2 selectivity, as
shown in Figure 4.30. All the selectivity values of the blend membranes are lying in
between the pristine membrane values given in Figure 4.30. However, PES/PI 75/25
and 25/75 membrane deviates from the theoretical models. There is only one
research has been done on H2/CH4 separation with miscible polymeric blend
membranes [31]. Surprisingly, H2/CH4 selectivity of Matrimid/PBI 25/75 membrane,
synthesized by this group, is higher than the pristine polymers. They stated that the
reason of this synergistic effect might because of the hydrogen bonding between
Matrimid and PBI.
20.00
200.00
4.00
CO
2/CH
4 SEL
ECTI
VIT
Y
CO2 PERMEABILITY (Barrer)
Pure PESPES/PI 75/25PES/PI 60/40PES/PI 30/70PES/PI 25/75PES/PI 20/80PES/PI 10/90Pure PIRobesonLogarithmicLinear
12.00

60
Figure 4.30 PI wt% vs. H2/CH4 Selectivity
The selectivity of H2 over CH4 with respect to mol percent of PI is given in Figure
4.31. The results presented in Figure 4.31 were found very similar to results
presented in Figure 4.30. Therefore, it can be suggested that blending two polymers
based on mass or mol fractions is not resulted significantly different from each other.
Figure 4.31 PI mol% vs. H2/CH4 Selectivity
70.00
80.00
90.00
100.00
110.00
120.00
130.00
0 10 20 30 40 50 60 70 80 90 100
H2/C
H4 S
ELEC
TIV
ITY
PI wt%
Pure PESPES/PI 75/25PES/PI 60/40PES/PI 30/70PES/PI 25/75PES/PI 20/80PES/PI 10/90Pure PILogarithmicLinear
60.00
70.00
80.00
90.00
100.00
110.00
120.00
130.00
0 10 20 30 40 50 60 70 80 90 100
H2/C
H4 S
ELEC
TIV
ITY
PI mol%
Pure PESPES/PI 75/25PES/PI 60/40PES/PI 30/70PES/PI 25/75PES/PI 20/80PES/PI 10/90Pure PILogarithmicLinear

61
In Figure 4.32, H2/CH4 separation performance of the blend membranes on Robeson
plot is given. Both permeability and selectivity values increased as the PI content in
the blend increased, because of higher free volume of PI compared to PES [31].
Figure 4.32 Single gas permeabilities of blend membranes with reference line for H2/CH4 pair
As a brief summary, PES/PI blend membranes with different compositions were
prepared and gas permeations tests were conducted for H2, CO2, and CH4. PES/PI
20/80 membranes performed best among the tested membranes. In addition,
separation performance of only PES/PI 20/80 membrane for all gas pairs was
coinciding with the theoretical models. Therefore, further mixed matrix membrane
and asymmetric membrane studies were conducted through this polymer
composition.
30.00
300.00
5.00 50.00
H2/C
H4 S
ELEC
TIV
ITY
H2 PERMEABILITY (Barrer)
Pure PESPES/PI 75/25PES/PI 60/40PES/PI 30/70PES/PI 25/75PES/PI 20/80PES/PI 10/90Pure PIRobesonLogarithmicLinear

62
4.3.2. Gas Permeation Results of PES/PI/ZIF-8 Membranes
After completing gas permeation tests of PES/PI dense blend membranes,
PES/PI/ZIF-8 membranes were synthesized. The gas separation results of
PES/PI/ZIF-8 20/80/10 membranes were given in Table 4.8 and Figure 4.33 to
Figure 4.35 in comparison with PES/PI 20/80 dense membranes. All H2, CO2 and
CH4 permeability values of the PES/PI/ZIF-8 20/80/10 membranes increased
significantly, while the decrease in selectivity is not significant, as expected [6].
Even a very small increase in CO2/CH4 selectivity is observed with ZIF-8 addition to
the polymer matrix. Therefore, PES/PI/ZIF-8 blend based mixed matrix membranes
can be considered advantageous in terms of enhancing the CO2/CH4 separation.
Table 4.8 Comparison of Permeability and Selectivity Values of the PES/ZIF-8 (10%), PES/PI/ZIF-8 20/80/10 and PI/ZIF-8 (10%) Dense Blend Membranes
Permeability (Barrer) Selectivity
H2 CO2 CH4 H2/CO2 CO2/CH4 H2/CH4
PES/ZIF-8 (10%) [6]
15.4 7.2 0.24 2.1 34.5 72.9
PES/PI/ZIF-8 20/80/10
39.6 ±1.7 13.5 ±0.5 0.37 ±0.02 2.9 ±0.1 36.8 ±0.7 106.4 ±2.5
PI/ZIF-8 (10%) [56]
52.6 13.7 0.26 3.8 30.6 117.7
In Figure 4.33, H2 permeability vs. H2/CO2 selectivity values of Pure PES, Pure PI,
PES/PI 20/80, PES/ZIF-8, PI/ZIF-8, and PES/PI/ZIF-8 20/80/10 are presented on
Robeson plot [12]. It can be clearly seen from the figure that, ZIF-8 addition
enhances the permeability of the membranes, while it has little or no effect on
selectivity [6]. Separation performance of PES/PI/ZIF-8 20/80/10 membrane is found
even better than Pure PI membranes. The H2 and CO2 permeability values of PES/PI
20/80 membranes were increased upon ZIF-8 addition by 61% and 73%,

63
respectively. The nano-porous structure of ZIF-8 and sieve-in-cage mixed matrix
structure are responsible these increases. However, voids formed between the ZIF-8
particles and polymer matrix cause to decrease the selectivity. Gas molecules prefer
to go through these non-resistant voids instead of polymer matrix or filler pores [6].
In spite of the fact these drastic increases in permeability values; the H2/CO2
selectivity decreased only 7% upon 10 wt% ZIF-8 addition to PES/PI 20/80 matrix.
Figure 4.33 H2/CO2 vs. H2 Permeation of PES/ZIF-8, PI/ZIF-8, PES/PI/ZIF-8 20/80/10, Pure PES, Pure PI and PES/PI 20/80 membranes
CO2 permeability vs. CO2/CH4 selectivity values of PES/PI, PES/PI/ZIF-8, PES/ZIF-
8, and PI/ZIF-8 on corresponding Robeson plot are given in Figure 4.34. The CO2
and CH4 permeability of PES/PI 20/80 membranes were increased by 73% and 68%,
respectively. Unlikely H2/CO2 and H2/CH4 selectivity values, CO2/CH4 selectivity
increased by 3% with ZIF-8 addition to the matrix. Moreover, CO2/CH4 selectivity of
PES/PI/ZIF-8 membrane is found 20% higher than the PI/ZIF-8. Therefore, ZIF-8
addition into the PES/PI blend can be a promising method to produce industrial
membranes for CO2/CH4 separation processes.
1.00
10.00
5.00 50.00
H2/C
O2 SE
LEC
TIV
ITY
H2 PERMEABILITY (Barrer)
Pure PES
PES/PI 20/80
Pure PI
PES/ZIF-8(10%) [6]PES/PI/ZIF-820/80/10PI/ZIF-8 (10%)[56]Robeson
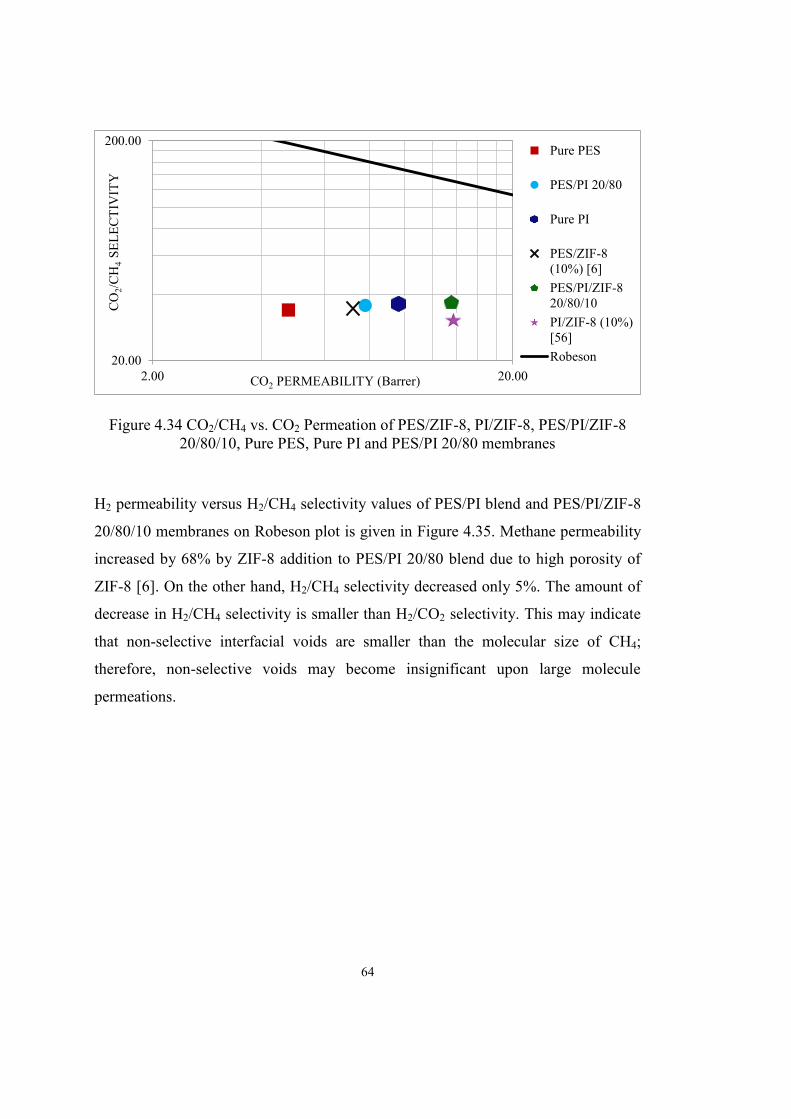
64
Figure 4.34 CO2/CH4 vs. CO2 Permeation of PES/ZIF-8, PI/ZIF-8, PES/PI/ZIF-8 20/80/10, Pure PES, Pure PI and PES/PI 20/80 membranes
H2 permeability versus H2/CH4 selectivity values of PES/PI blend and PES/PI/ZIF-8
20/80/10 membranes on Robeson plot is given in Figure 4.35. Methane permeability
increased by 68% by ZIF-8 addition to PES/PI 20/80 blend due to high porosity of
ZIF-8 [6]. On the other hand, H2/CH4 selectivity decreased only 5%. The amount of
decrease in H2/CH4 selectivity is smaller than H2/CO2 selectivity. This may indicate
that non-selective interfacial voids are smaller than the molecular size of CH4;
therefore, non-selective voids may become insignificant upon large molecule
permeations.
20.00
200.00
2.00 20.00
CO
2/CH
4 SEL
ECTI
VIT
Y
CO2 PERMEABILITY (Barrer)
Pure PES
PES/PI 20/80
Pure PI
PES/ZIF-8(10%) [6]PES/PI/ZIF-820/80/10PI/ZIF-8 (10%)[56]Robeson

65
Figure 4.35 H2/CH4 vs. H2 Permeation of PES/ZIF-8, PI/ZIF-8, PES/PI/ZIF-8 20/80/10, Pure PES, Pure PI and PES/PI 20/80 membranes
4.3.3. Gas Permeation Results of PES/PI 20/80 Asymmetric Membranes
The permeance and selectivity values of PES/PI 20/80 asymmetric membranes were
given in Table 4.9, Figure 4.36, and Figure 4.37. Five PES/PI 20/80 asymmetric
membranes were synthesized at different times to observe the reproducibility of the
membranes. According to the results, it is possible to produce reproducible
asymmetric membranes with method explained in Section 3.1.2.2.
Table 4.9 Permeance and Selectivity Values of PES/PI 20/80 Asymmetric Membranes
Permeance (GPU) Selectivity H2 CO2 CH4 H2/CO2 CO2/CH4 H2/CH4 M1 1.407 0.426 0.01192 3.30 35.74 118.02 M2 1.438 0.403 0.01095 3.57 36.82 131.39 M3 1.508 0.403 0.01341 3.74 30.09 112.48 M4 1.437 0.394 0.01204 3.64 32.77 119.38 M5 1.508 0.403 0.01341 3.79 23.81 90.20 Average 1.496 0.415 0.01341 3.61 31.85 114.29 Std. Dev. 0.102 0.019 0.00277 0.17 4.66 13.53
30.00
300.00
6.00 60.00
H2/C
H4 SE
LEC
TIV
ITY
H2 PERMEABILITY (Barrer)
Pure PES
PES/PI 20/80
Pure PI
PES/ZIF-8(10%) [6]PES/PI/ZIF-820/80/10PI/ZIF-8 (10%)[56]Robeson

66
The permeance values of PES/PI 20/80 dense membranes were calculated by
Equation 1.4. H2 permeances of asymmetric PES/PI 20/80 membranes were ~3.5
fold of the dense membranes, due to the highly porous structure of the membrane.
Gas molecules prefer to go through less resistive pores, consequently permeation
rates of the gases trough the membrane increase significantly. In addition, very thin
skin layer with sub-micron size pores decreases the resistance against the gas
molecules. Asymmetric membrane production is advantageous compared to dense
membranes, because industrial gas separation membranes should have high
permeance values. The permeance values have found during this study are different
than literature values, may because of different membrane structures [14,15,33]. The
trend of increase in CO2 and CH4 permeances were found similar to H2 permeances.
Table 4.10 Permeance and Selectivity Values of PES/PI 20/80 Asymmetric Membranes
Permeance (GPU) Selectivity
H2 CO2 CH4 H2/CO2 CO2/CH4 H2/CH4
PES/PI 20/80 Dense
0.422 0.135 0.00379 3.13 35.6 111.35
PES/PI 20/80 Asymmetric
1.496 0.415 0.01341 3.61 31.85 114.29
Dense vs. Asym. +255% +207% +254% +15% -3% +3%

67
Figure 4.36 H2, CO2, and CH4 Permeances of PES/PI 20/80 Dense and Asymmetric
Membranes
Selectivity values of dense and asymmetric membranes were shown in Figure 4.37.
Although the great increase in permeances, selectivity values were found close to
that of PES/PI 20/80 dense membranes. In fact, H2/CO2 and H2/CH4 selectivity
values increased by 15% and 3%, respectively. CO2/CH4 selectivity decreased only
by 3%, which is considerably low.
Figure 4.37 H2/CO2, CO2/CH4, and H2/CH4 Selectivities of PES/PI 20/80 Dense and Asymmetric Membranes
0.00
0.20
0.40
0.60
0.80
1.00
1.20
1.40
1.60
H2 CO2 CH4*100
PER
MEA
NC
E (G
PU)
PES/PI 20/80 Dense PES/PI 20/80 Asymetric
0.00
20.00
40.00
60.00
80.00
100.00
120.00
140.00
H2/CO2 *10 CO2/CH4 H2/CH4
SELE
CTI
VIT
Y
PES/PI 20/80 Dense PES/PI 20/80 Asymetric

68
As a conclusion, the permeances of the PES/PI 20/80 membranes improved
considerably by altering the membrane structure from dense to asymmetric.
Moreover, selectivity values were not affected significantly by asymmetric
membrane production method. Therefore, it can be suggested that PES/PI blend
asymmetric membranes are worthy to investigate further and they can be good
candidates as an industrial membranes.

69
CHAPTER 5
CONCLUSION
In this study, the effects of blend composition on gas separation performances of
polymer blend based membranes were studied. At the beginning of the study PES/PC
blend membranes were prepared and characterized with DSC. The results revealed
that PES and PC are not compatible with each other, and prepared membranes were
not suitable for the purpose of this study. Then, dense PES/PI membranes were
prepared at different compositions. Further, 83nm ZIF-8 particles were added to
PES/PI 20/80 membrane to investigate the effect of ZIF-8 on gas separation
performances. Finally, asymmetric PES/PI 20/80 membranes were prepared and gas
permeation test were conducted. The conclusions were listed as follows:
1. Dense blend membranes were prepared according to solvent evaporation method.
Resulting membranes were clear as an early indication of miscibility and
compatibility of PES and PI. Further, DSC analysis were conducted to prove the
miscibility and compatibility. At the first runs of scans, only one glass transition
temperature in between the temperatures of the pure polymers. The glass
transition of the blend membranes increased as the %PI in the blend increased.
The glass transition temperatures were applied to Gordon-Taylor model and k
constant was calculated as 0.7, which is an indication of good interaction between
the polymers.
2. Gas separation performance of PI is better than PES, and gas separation
performance of the membranes increased as amount of PI in the blend increased.
Results were compared with linear and logarithmic theoretical models. H2 and

70
CO2 permeability and H2/CO2 and H2/CH4 selectivity values were in accordance
with the theoretical models. There were some deviations from these theoretical
models in case of CH4 permeability and CO2/CH4 selectivity. Interaction of CO2
molecules with polymer chains may alter the chain conformation and free volume,
consequently affected the CO2/CH4 selectivity. Since kinetic diameters of H2 and
CO2 were comparatively smaller than CH4, the permeabilities of H2 and CO2 were
not affected by leak rate and free volume as much as CH4. The gas separation
performance of PES/PI 20/80 membranes were the best among the blend
membranes for all gas pairs.
3. The incorporation of ZIF-8 with PES/PI 20/80 increased the H2, CO2, and CH4
permeabilities. H2/CO2 and H2/CH4 selectivities were decreased 5% and 6%,
respectively. On the other hand, CO2/CH4 selectivity increased 3% with addition
of ZIF-8 to PES/PI 20/80 matrix.
4. Asymmetric PES/PI 20/80 blend membranes were prepared by wet phase
inversion method. Coagulation bath was composed of v/v 75%IPA and 25%
DMF. Membranes had 14 micron thick nano-porous skin layer on sponge-like
porous support layer. This porous structure leaded to increase the permeance of
the membranes for all gas pair. On the other hand, H2/CO2 and H2/CH4 selectivity
values increased 15% and 3%, respectively. Unlikely, CO2/CH4 selectivity
decreased approximately 3%.
71
REFERENCES
[1] J.K. Adewole, a. L. Ahmad, S. Ismail, C.P. Leo, Current challenges in membrane separation of CO2 from natural gas: A review, Int. J. Greenh. Gas Control. 17 (2013) 46–65. doi:10.1016/j.ijggc.2013.04.012 Review.
[2] R. Nasir, H. Mukhtar, Z. Man, D.F. Mohshim, Material Advancements in Fabrication of Mixed-Matrix Membranes, Chem. Eng. Technol. 36 (2013) 717–727. doi:10.1002/ceat.201200734.
[3] Hydrogen, RSC. (2014). http://www.rsc.org/periodic-table/element/1/hydrogen.
[4] Y. Li, F. Liang, H. Bux, W. Yang, J. Caro, Zeolitic imidazolate framework ZIF-7 based molecular sieve membrane for hydrogen separation, J. Memb. Sci. 354 (2010) 48–54. doi:10.1016/j.memsci.2010.02.074.
[5] L. Shao, B.T. Low, T.S. Chung, A.R. Greenberg, Polymeric membranes for the hydrogen economy: Contemporary approaches and prospects for the future, J. Memb. Sci. 327 (2009) 18–31. doi:DOI 10.1016/j.memsci.2008.11.019.
[6] N. Keser, PRODUCTION AND PERFORMANCE EVALUATION OF ZIF-8 BASED BINARY AND TERNARY MIXED MATRIX GAS SEPARATION MEMBRANES, Middle East Technical University, 2012.
[7] S. Kentish, C. Scholes, G. Stevens, Carbon Dioxide Separation through Polymeric Membrane Systems for Flue Gas Applications, Recent Patents Chem. Eng. 1 (2008) 52–66. doi:10.2174/2211334710801010052.
[8] H.A. Mannan, H. Mukhtar, T. Murugesan, R. Nasir, D.F. Mohshim, A. Mushtaq, Recent Applications of Polymer Blends in Gas Separation Membranes, Chem. Eng. Technol. 36 (2013) 1838–1846. doi:10.1002/ceat.201300342.
[9] A. Mushtaq, H. Mukhtar, A.M. Shariff, H.A. Mannan, A Review :
Development of Polymeric Blend Membrane for Removal of CO2 from Natural Gas, Int. J. Eng. Technol. IJET-IJENS. 13 (2013) 53–60.

72
[10] M. Mulder, Basic Principles of Membrane Technology, Zeitschrift Für Phys. Chemie. 72 (1998) 564.
[11] S.S. Madaeni, A. Farhadian, V. Vatanpour, Effects of Phase Inversion and Composition of Casting Solution on Morphology and Gas Permeance of Polyethersulfone / Polyimide Blend Membranes, Adv. Polym. Technol. 31 (2012) 298–309. doi:10.1002/adv.
[12] L.M. Robeson, The upper bound revisited, J. Memb. Sci. 320 (2008) 390–400. doi:10.1016/j.memsci.2008.04.030.
[13] B.D. Freeman, Basis of Permeability/Selectivity Tradeoff Relations in Polymeric Gas Separation Membranes, Macromolecules. 32 (1999) 375–380. doi:10.1021/ma9814548.
[14] O.M. Ekiner, Blends of polyethersulfones with aromatic polyimides, polyamides or polyamide-imides and gas separation membranes made therefrom., EP 0 648 812 A2, 1994.
[15] S. Basu, A. Cano-Odena, I.F.J. Vankelecom, Asymmetric membrane based on Matrimid® and polysulphone blends for enhanced permeance and stability in binary gas (CO2/CH4) mixture separations, Sep. Purif. Technol. 75 (2010) 15–21. doi:10.1016/j.seppur.2010.07.004.
[16] Y. Zhang, J. Sunarso, S. Liu, R. Wang, Current status and development of membranes for CO2/CH4 separation: A review, Int. J. Greenh. Gas Control. 12 (2013) 84–107. doi:10.1016/j.ijggc.2012.10.009.
[17] A. Bos, I. Pünt, H. Strathmann, M. Wessling, Suppression of gas separation membrane plasticization by homogeneous polymer blending, AIChE J. 47 (2001) 1088–1093. doi:10.1002/aic.690470515.
[18] D.Q. Vu, W.J. Koros, S.J. Miller, Mixed matrix membranes using carbon molecular sieves I . Preparation and experimental results, 211 (2003) 311–334.
[19] T.-S. Chung, L.Y. Jiang, Y. Li, S. Kulprathipanja, Mixed matrix membranes (MMMs) comprising organic polymers with dispersed inorganic fillers for gas separation, Prog. Polym. Sci. 32 (2007) 483–507. doi:10.1016/j.progpolymsci.2007.01.008.
[20] D. Bastani, N. Esmaeili, M. Asadollahi, Polymeric mixed matrix membranes containing zeolites as a filler for gas separation applications: A review, J. Ind. Eng. Chem. 19 (2013) 375–393. doi:10.1016/j.jiec.2012.09.019.

73
[21] U. Cakal, NATURAL GAS PURIFICATION BY ZEOLITE FILLED POLYETHERSULFONE BASED MĠXED MATRIX MEMBRANES, Middle East Technical University, 2009.
[22] B. Zornoza, C. Téllez, J. Coronas, J. Gascon, F. Kapteijn, Metal organic framework based mixed matrix membranes: An increasingly important field of research with a large application potential, Microporous Mesoporous Mater. 166 (2013) 67–78. doi:10.1016/j.micromeso.2012.03.012.
[23] R. Adams, C. Carson, J. Ward, R. Tannenbaum, W. Koros, Metal organic framework mixed matrix membranes for gas separations, Microporous Mesoporous Mater. 131 (2010) 13–20. doi:10.1016/j.micromeso.2009.11.035.
[24] P.S. Goh, A.F. Ismail, S.M. Sanip, B.C. Ng, M. Aziz, Recent advances of inorganic fillers in mixed matrix membrane for gas separation, Sep. Purif. Technol. 81 (2011) 243–264. doi:10.1016/j.seppur.2011.07.042.
[25] N. Keser Demir, B. Topuz, L. Yilmaz, H. Kalipcilar, Synthesis of ZIF-8 from recycled mother liquors, Microporous Mesoporous Mater. 198 (2014) 291–300. doi:10.1016/j.micromeso.2014.07.052.
[26] B. Ghalei, M.-A. Semsarzadeh, A Novel Nano Structured Blend Membrane for Gas Separation, Macromol. Symp. 249-250 (2007) 330–335. doi:10.1002/masy.200750354.
[27] D. Jiang, X.R. Zhang, Y.M. Ma, C.Y. Ma, Compatibility of Polyethersulfone/Polycarbonate Blends, Adv. Mater. Res. 217-218 (2011) 1601–1605. doi:10.4028/www.scientific.net/AMR.217-218.1601.
[28] B. Gholizadeh, A. Arefazar, J. Barzin, Morphology and Gas Permeability of Polymeric Membrane by PC / PA6 / Nanoclay Ternary Nanocomposite, Polym. Polym. Compos. 20 (2012) 271–279.
[29] K. Liang, J. Grebowicz, E. Valles, F.E. Karasz, W.J. MacKnight, Thermal and rheological properties of miscible polyethersulfone/polyimide blends, J. Polym. Sci. Part B Polym. Phys. 30 (1992) 465–476. doi:10.1002/polb.1992.090300506.
[30] G.C. Kapantaidakis, S.P. Kaldis, X.S. Dabou, G.P. Sakellaropoulos, Gas permeation through PSF-PI miscible blend membranes, J. Memb. Sci. 110 (1996) 239–247. doi:10.1016/0376-7388(95)00265-0.
[31] S.S. Hosseini, M.M. Teoh, T.S. Chung, Hydrogen separation and purification in membranes of miscible polymer blends with interpenetration networks, Polymer (Guildf). 49 (2008) 1594–1603. doi:10.1016/j.polymer.2008.01.052.
74
[32] M. Iqbal, Z. Man, H. Mukhtar, B.K. Dutta, Solvent effect on morphology and CO2/CH4 separation performance of asymmetric polycarbonate membranes, J. Memb. Sci. 318 (2008) 167–175. doi:10.1016/j.memsci.2008.02.040.
[33] J. Han, W. Lee, J.M. Choi, R. Patel, B.R. Min, Characterization of polyethersulfone/polyimide blend membranes prepared by a dry/wet phase inversion: Precipitation kinetics, morphology and gas separation, J. Memb. Sci. 351 (2010) 141–148. doi:10.1016/j.memsci.2010.01.038.
[34] S.S. Hosseini, N. Peng, T.S. Chung, Gas separation membranes developed through integration of polymer blending and dual-layer hollow fiber spinning process for hydrogen and natural gas enrichments, J. Memb. Sci. 349 (2010) 156–166. doi:10.1016/j.memsci.2009.11.043.
[35] G.C. Kapantaidakis, G.H. Koops, High flux polyethersulfone–polyimide blend hollow fiber membranes for gas separation, J. Memb. Sci. 204 (2002) 153–171. doi:10.1016/S0376-7388(02)00030-3.
[36] S. Rafiq, Z. Man, A. Maulud, N. Muhammad, S. Maitra, Effect of varying solvents compositions on morphology and gas permeation properties on membranes blends for CO2 separation from natural gas, J. Memb. Sci. 378 (2011) 444–452. doi:10.1016/j.memsci.2011.05.025.
[37] F. Dorosti, M.R. Omidkhah, M.Z. Pedram, F. Moghadam, Fabrication and characterization of polysulfone/polyimide–zeolite mixed matrix membrane for gas separation, Chem. Eng. J. 171 (2011) 1469–1476. doi:10.1016/j.cej.2011.05.081.
[38] A.F. Ismail, R.A. Rahim, W.A.W.A. Rahman, Characterization of polyethersulfone/Matrimid® 5218 miscible blend mixed matrix membranes for O2/N2 gas separation, Sep. Purif. Technol. 63 (2008) 200–206. doi:10.1016/j.seppur.2008.05.007.
[39] S. Basu, A. Cano-Odena, I.F.J. Vankelecom, Asymmetric Matrimid®/[Cu3(BTC)2] mixed-matrix membranes for gas separations, J. Memb. Sci. 362 (2010) 478–487. doi:10.1016/j.memsci.2010.07.005.
[40] S. Rafiq, Z. Man, A. Maulud, N. Muhammad, S. Maitra, Separation of CO2 from CH4 using polysulfone/polyimide silica nanocomposite membranes, Sep. Purif. Technol. 90 (2012) 162–172. doi:10.1016/j.seppur.2012.02.031.
[41] Ġ. Ayas, Effect of the particle size of ZIF-8 on the separation performance of ZIF-8/pNA/PES membranes, Middle East Technical University, 2014.

75
[42] K.S. Park, Z. Ni, A.P. Côté, J.Y. Choi, R. Huang, F.J. Uribe-Romo, et al., Exceptional chemical and thermal stability of zeolitic imidazolate frameworks., Proc. Natl. Acad. Sci. U. S. A. 103 (2006) 10186–10191. doi:10.1073/pnas.0602439103.
[43] T. Ozawa, A New Method of Analyzing Thermogravimetric Data, Bull. Chem. Soc. Jpn. 38 (1965) 1881–1886. doi:10.1246/bcsj.38.1881.
[44] W.A.W.A. Rahman, FORMATION AND CHARACTERIZATION OF MIXED MATRIX COMPOSITE MATERIALS FOR EFFICIENT ENERGY GAS SEPARATION, 2006.
[45] J. Ahmad, M.-B. Hägg, Development of matrimid/zeolite 4A mixed matrix membranes using low boiling point solvent, Sep. Purif. Technol. 115 (2013) 190–197. doi:10.1016/j.seppur.2013.04.049.
[46] K. Liang, G. Bánhegyi, F.E. Karasz, W.J. MacKnight, Thermal, dielectric, and mechanical relaxation in poly(benzimidazole)/poly(etherimide) blends, J. Polym. Sci. Part B Polym. Phys. 29 (1991) 649–657. doi:10.1002/polb.1991.090290602.
[47] F.W. Billmeyer Jr., Textbook of Polymer Science, 3rd ed., John Wiley & Sons, Ltd, New York, 1984.
[48] E. Karatay, H. Kalıpçılar, L. Yılmaz, Preparation and performance assessment of binary and ternary PES-SAPO 34-HMA based gas separation membranes, J. Memb. Sci. 364 (2010) 75–81. doi:10.1016/j.memsci.2010.08.004.
[49] Y. Zhang, I.H. Musselman, J.P. Ferraris, K.J. Balkus, Gas permeability properties of Matrimid® membranes containing the metal-organic framework Cu–BPY–HFS, J. Memb. Sci. 313 (2008) 170–181. doi:10.1016/j.memsci.2008.01.005.
[50] M. Peydayesh, S. Asarehpour, T. Mohammadi, O. Bakhtiari, Preparation and characterization of SAPO-34 – Matrimid® 5218 mixed matrix membranes for CO2/CH4 separation, Chem. Eng. Res. Des. 91 (2013) 1335–1342. doi:10.1016/j.cherd.2013.01.022.
[51] S. Shahid, K. Nijmeijer, High pressure gas separation performance of mixed-matrix polymer membranes containing mesoporous Fe(BTC), J. Memb. Sci. 459 (2014) 33–44. doi:10.1016/j.memsci.2014.02.009.
[52] E. V. Perez, K.J. Balkus, J.P. Ferraris, I.H. Musselman, Mixed-matrix membranes containing MOF-5 for gas separations, J. Memb. Sci. 328 (2009) 165–173. doi:10.1016/j.memsci.2008.12.006.

76
[53] M.J.C. Ordoñez, K.J. Balkus, J.P. Ferraris, I.H. Musselman, Molecular sieving realized with ZIF-8/Matrimid® mixed-matrix membranes, J. Memb. Sci. 361 (2010) 28–37. doi:10.1016/j.memsci.2010.06.017.
[54] S. Basu, A. Cano-Odena, I.F.J. Vankelecom, MOF-containing mixed-matrix membranes for CO2/CH4 and CO2/N2 binary gas mixture separations, Sep. Purif. Technol. 81 (2011) 31–40. doi:10.1016/j.seppur.2011.06.037.
[55] K. Díaz, M. López-González, L.F. del Castillo, E. Riande, Effect of zeolitic imidazolate frameworks on the gas transport performance of ZIF8-poly(1,4-phenylene ether-ether-sulfone) hybrid membranes, J. Memb. Sci. 383 (2011) 206–213. doi:10.1016/j.memsci.2011.08.042.
[56] Q. Song, S.K. Nataraj, M. V. Roussenova, J.C. Tan, D.J. Hughes, W. Li, et al., Zeolitic imidazolate framework (ZIF-8) based polymer nanocomposite membranes for gas separation, Energy Environ. Sci. 5 (2012) 8359. doi:10.1039/c2ee21996d.
[57] R.J. Li, W.P. Hsu, T.K. Kwei, A.S. Myerson, Transport of gases in miscible polymer blends above and below the glass transition region, AIChE J. 39 (1993) 1509–1518. doi:10.1002/aic.690390910.
[58] L.M. Robeson, Polymer Blends in Membrane Transport Processes, Ind. Eng. Chem. Res. 49 (2010) 11859–11865. doi:10.1021/ie100153q.
[59] A.L. Khan, X. Li, I.F.J. Vankelecom, SPEEK/Matrimid blend membranes for CO2 separation, J. Memb. Sci. 380 (2011) 55–62. doi:10.1016/j.memsci.2011.06.030.

77
APPENDIX A
CALCULATION OF SINGLE PERMEABILITIES
Gas permeability results were calculated by depending on the rate of pressure change
in permeate with respect to time. Pressure changes were recorded by computer
program. A sample rate of change in pressure with respect to time is given in Figure
A.1.
Figure A.1 The time (s) vs. pressure change (atm) graph for H2 permeation test of
PES/PI 20/80
y = 0,000049x - 0,000002 R² = 0,999973
0.000.010.020.030.040.050.060.070.08
0 500 1000 1500
ΔP (a
tm)
time(s)
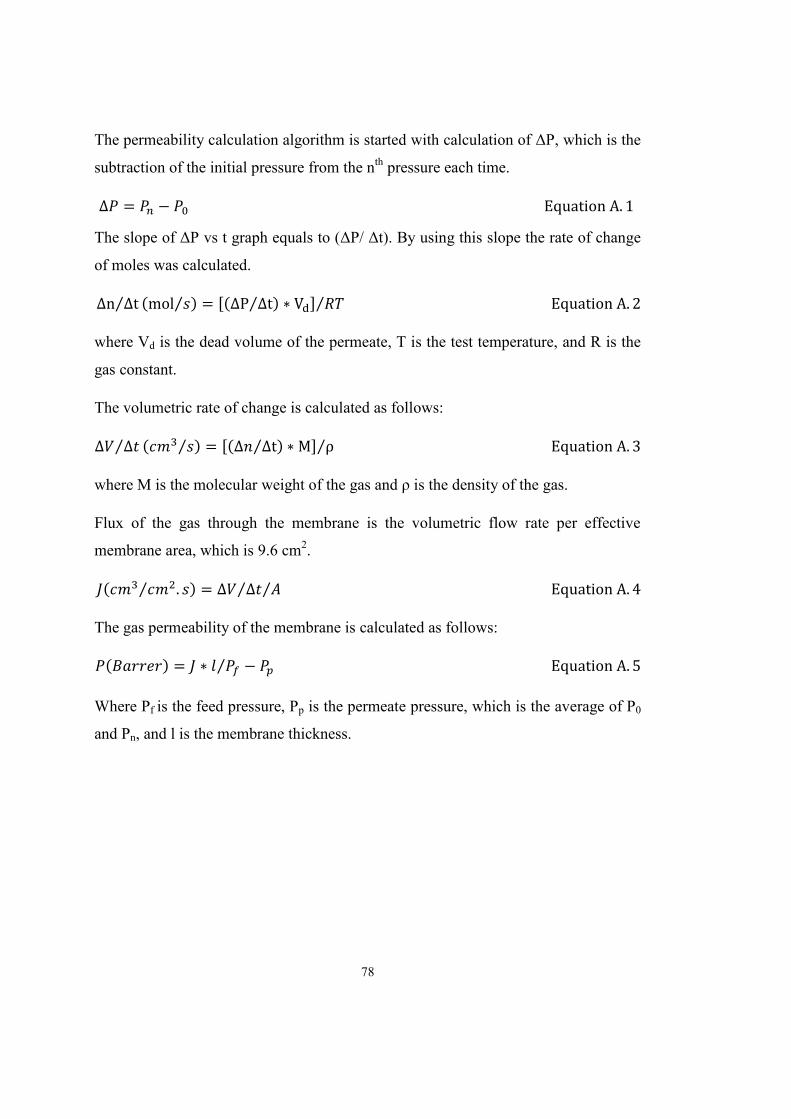
78
The permeability calculation algorithm is started with calculation of ΔP, which is the
subtraction of the initial pressure from the nth pressure each time.
The slope of ΔP vs t graph equals to (ΔP/ Δt). By using this slope the rate of change
of moles was calculated.
⁄ ⁄ ⁄ ⁄
where Vd is the dead volume of the permeate, T is the test temperature, and R is the
gas constant.
The volumetric rate of change is calculated as follows:
⁄ ⁄ ⁄ ⁄
where M is the molecular weight of the gas and ρ is the density of the gas.
Flux of the gas through the membrane is the volumetric flow rate per effective
membrane area, which is 9.6 cm2.
⁄ ⁄ ⁄
The gas permeability of the membrane is calculated as follows:
⁄
Where Pf is the feed pressure, Pp is the permeate pressure, which is the average of P0
and Pn, and l is the membrane thickness.

79
APPENDIX B
SAMPLE CALCULATION OF ZIF-8 YIELD AND AVERAGE PARTICLE
SIZE
ZIF-8 synthesis took place in methanol medium. The yield is calculated from the
initial amounts of reactants and final amount of synthesized ZIF-8. The reaction of
zinc nitrate hexahydrate and HMIM is given below:
→
Initial Reaction Mixtures:
where,
⁄
The dried weight of synthesized ZIF-8 was 1.36 g. Consumed and remained amounts
of Zn(NO3)2.6H2O, HMIM and methanol was calculated as follows:

80
The maximum amount of ZIF-8 that could be synthesized was calculated as follows:
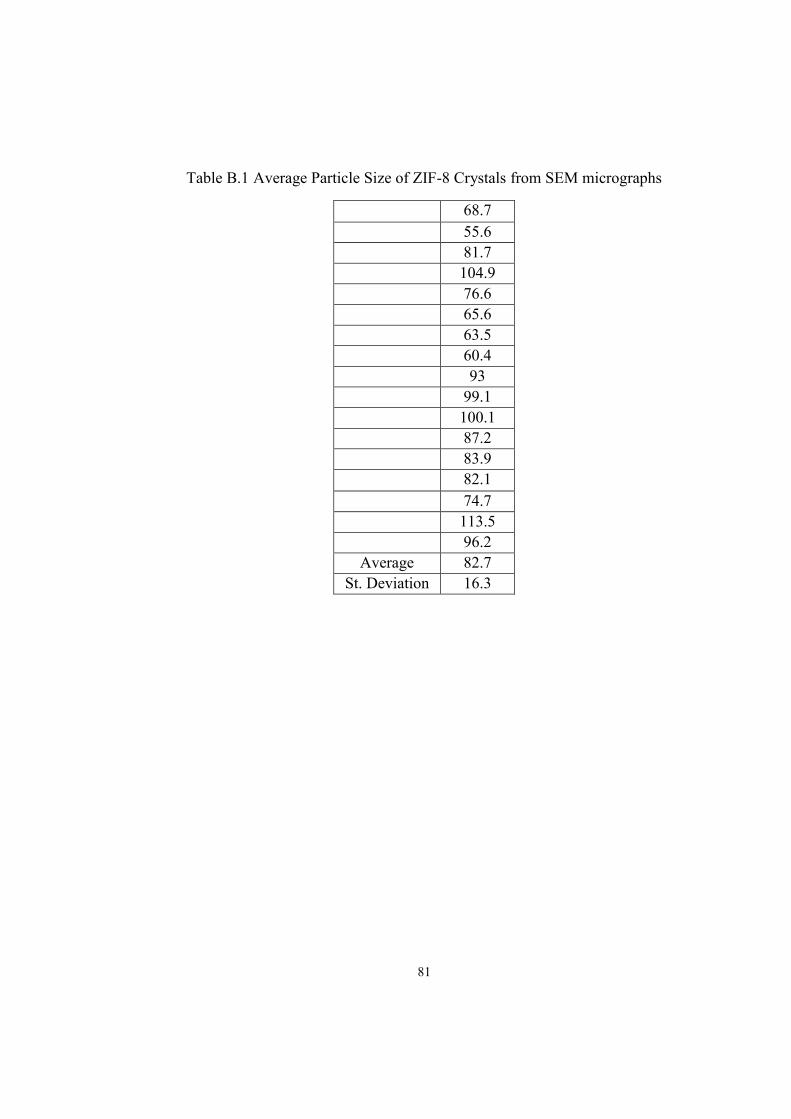
81
Table B.1 Average Particle Size of ZIF-8 Crystals from SEM micrographs
68.7 55.6 81.7 104.9 76.6 65.6 63.5 60.4 93 99.1 100.1 87.2 83.9 82.1 74.7 113.5 96.2
Average 82.7 St. Deviation 16.3

82

83
APPENDIX C
TGA THERMOGRAMS OF DENSE AND ASYMMETRIC PES/PI 20/80, AND
PES/PI/ZIF-8 20/80/10 MEMBRANES
Figure C.1 The TGA thermogram of Dense PES/PI 20/80 Membrane 1

84
Figure C.2 The TGA thermogram of Dense PES/PI 20/80 Membrane 2
Figure C.3 The TGA thermogram of Dense PES/PI/ZIF-8 20/80/10 Membrane 1
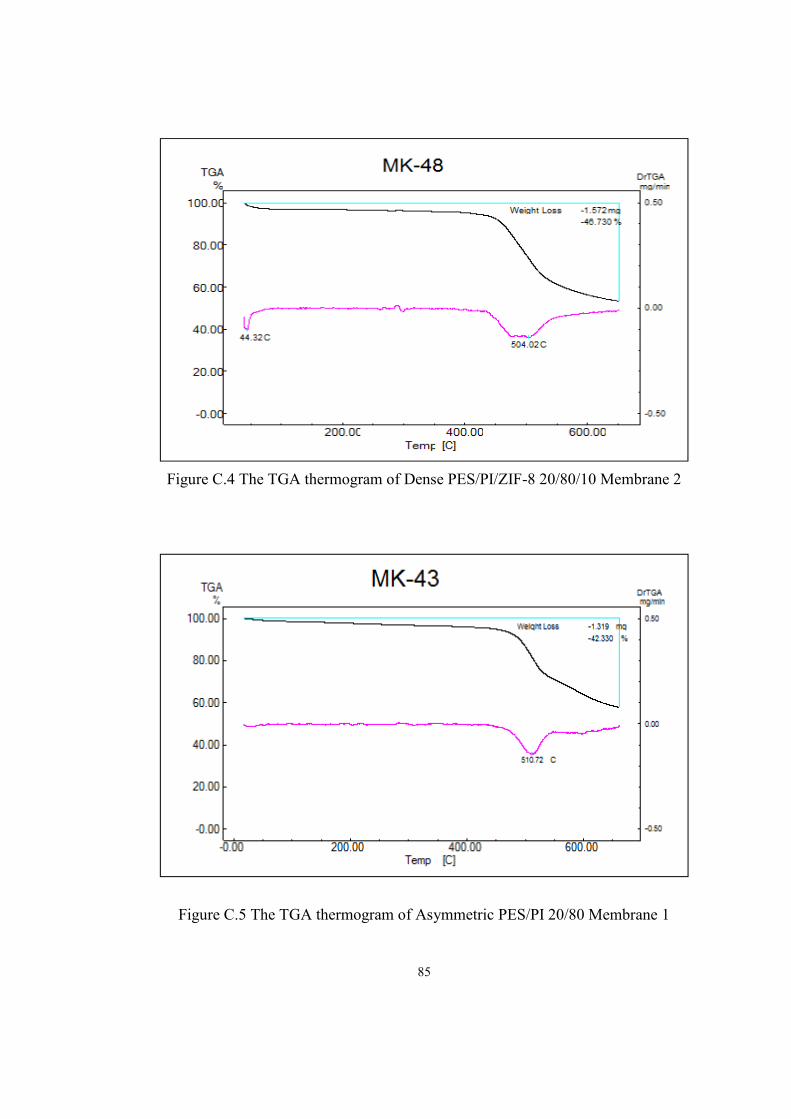
85
Figure C.4 The TGA thermogram of Dense PES/PI/ZIF-8 20/80/10 Membrane 2
Figure C.5 The TGA thermogram of Asymmetric PES/PI 20/80 Membrane 1

86
Figure C.6 The TGA thermogram of Asymmetric PES/PI 20/80 Membrane 2
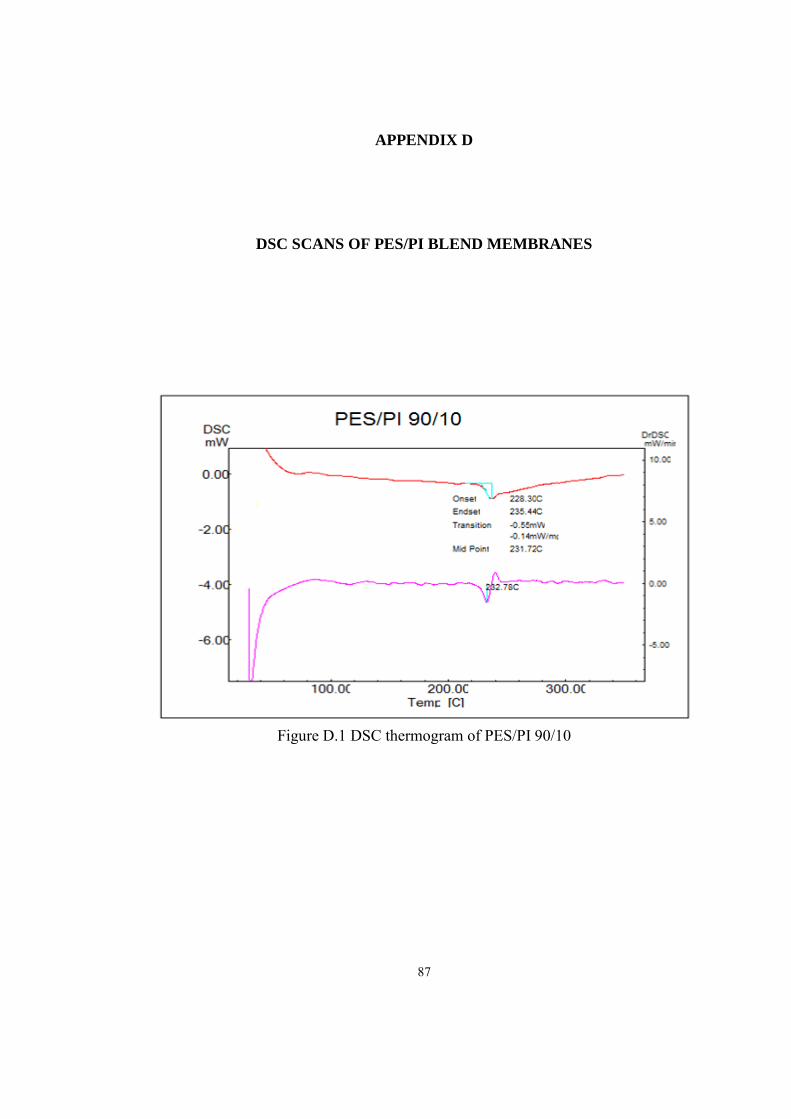
87
APPENDIX D
DSC SCANS OF PES/PI BLEND MEMBRANES
Figure D.1 DSC thermogram of PES/PI 90/10

88
Figure D.2 DSC thermogram of PES/PI 90/10 Run2
Figure D.3 DSC thermogram of PES/PI 75/25
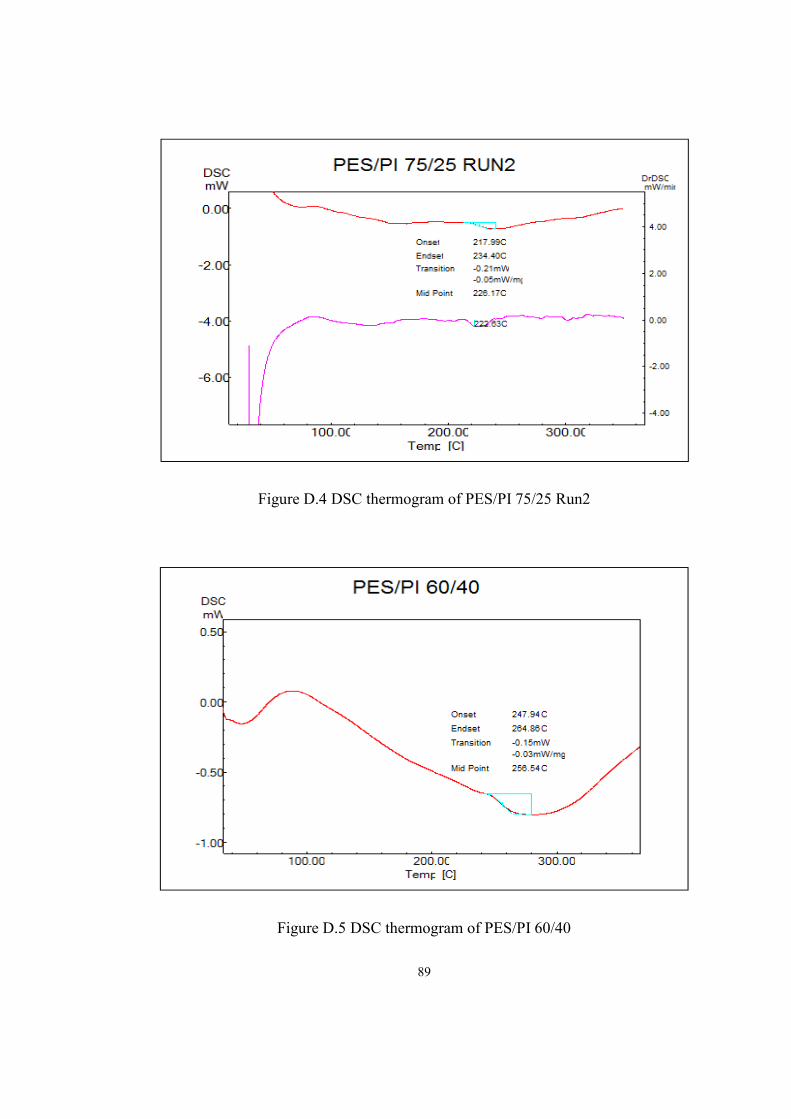
89
Figure D.4 DSC thermogram of PES/PI 75/25 Run2
Figure D.5 DSC thermogram of PES/PI 60/40
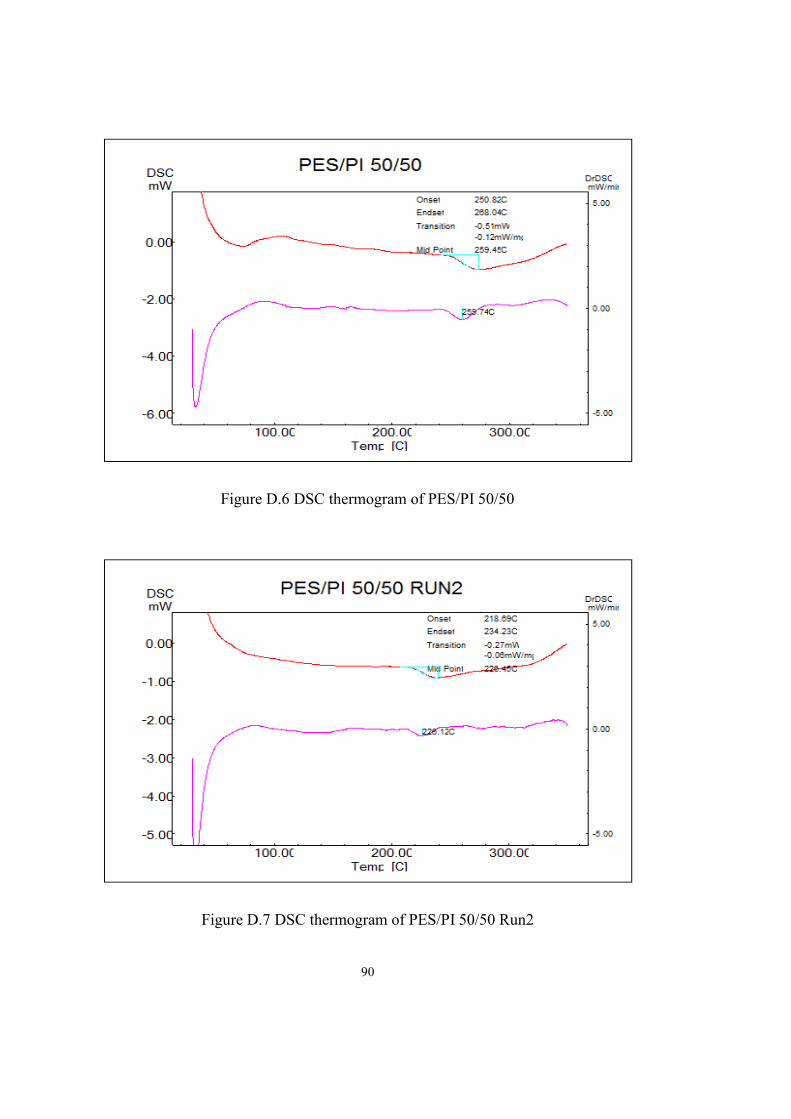
90
Figure D.6 DSC thermogram of PES/PI 50/50
Figure D.7 DSC thermogram of PES/PI 50/50 Run2

91
Figure D.8 DSC thermogram of PES/PI 25/75
Figure D.9 DSC thermogram of PES/PI 25/75 Run2

92
Figure D.10 DSC thermogram of PES/PI 20/80
Figure D.11 DSC thermogram of PES/PI 20/80 Run2
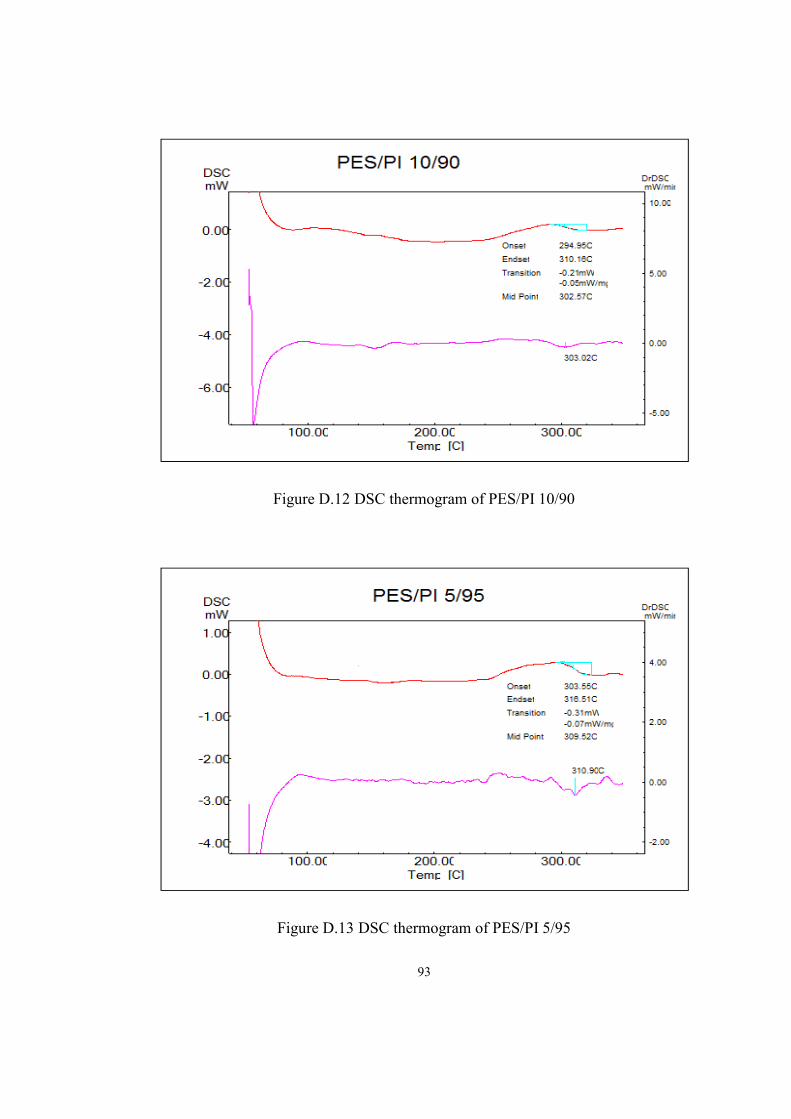
93
Figure D.12 DSC thermogram of PES/PI 10/90
Figure D.13 DSC thermogram of PES/PI 5/95
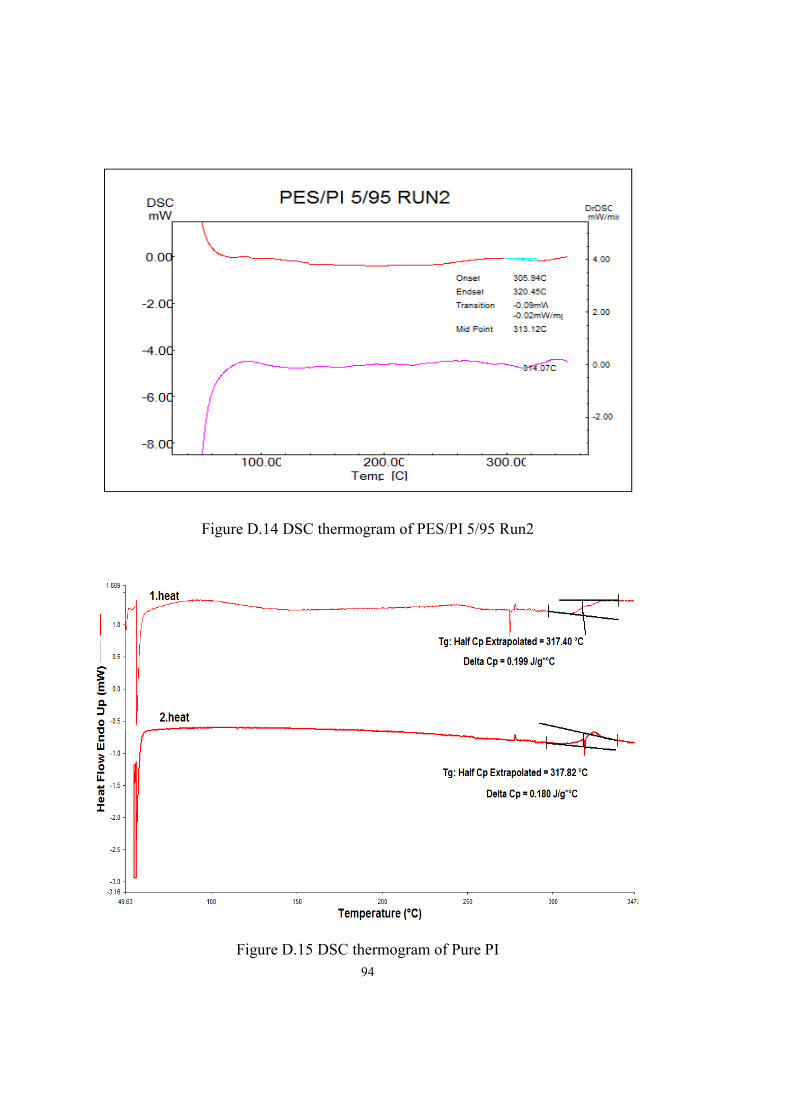
94
Figure D.14 DSC thermogram of PES/PI 5/95 Run2
Figure D.15 DSC thermogram of Pure PI
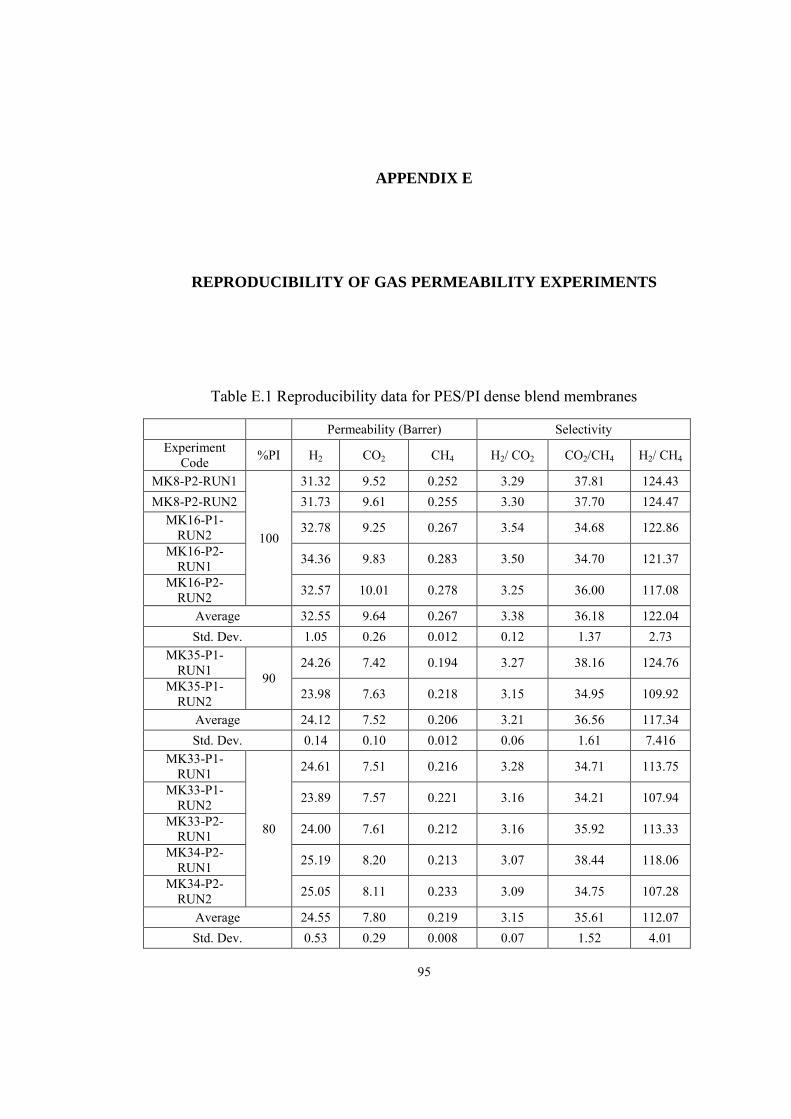
95
APPENDIX E
REPRODUCIBILITY OF GAS PERMEABILITY EXPERIMENTS
Table E.1 Reproducibility data for PES/PI dense blend membranes
Permeability (Barrer) Selectivity Experiment
Code %PI H2 CO2 CH4 H2/ CO2 CO2/CH4 H2/ CH4
MK8-P2-RUN1
100
31.32 9.52 0.252 3.29 37.81 124.43 MK8-P2-RUN2 31.73 9.61 0.255 3.30 37.70 124.47
MK16-P1-RUN2 32.78 9.25 0.267 3.54 34.68 122.86
MK16-P2-RUN1 34.36 9.83 0.283 3.50 34.70 121.37
MK16-P2-RUN2 32.57 10.01 0.278 3.25 36.00 117.08
Average 32.55 9.64 0.267 3.38 36.18 122.04 Std. Dev. 1.05 0.26 0.012 0.12 1.37 2.73
MK35-P1-RUN1 90
24.26 7.42 0.194 3.27 38.16 124.76
MK35-P1-RUN2 23.98 7.63 0.218 3.15 34.95 109.92
Average 24.12 7.52 0.206 3.21 36.56 117.34 Std. Dev. 0.14 0.10 0.012 0.06 1.61 7.416
MK33-P1-RUN1
80
24.61 7.51 0.216 3.28 34.71 113.75
MK33-P1-RUN2 23.89 7.57 0.221 3.16 34.21 107.94
MK33-P2-RUN1 24.00 7.61 0.212 3.16 35.92 113.33
MK34-P2-RUN1 25.19 8.20 0.213 3.07 38.44 118.06
MK34-P2-RUN2 25.05 8.11 0.233 3.09 34.75 107.28
Average 24.55 7.80 0.219 3.15 35.61 112.07 Std. Dev. 0.53 0.29 0.008 0.07 1.52 4.01

96
MK13-P1-RUN3
75
23.24 7.35 0.224 3.16 32.82 103.76
MK21-P1-RUN1 20.72 7.11 0.261 2.91 27.29 79.49
MK21-P1-RUN2 21.89 7.27 0.222 3.01 32.74 98.59
MK22-P1-RUN1 20.66 7.17 0.227 2.88 31.64 91.14
MK22-P1-RUN2 20.74 6.76 3.07
Average 21.45 7.13 0.233 3.01 31.12 93.25 Std. Dev. 1.00 0.20 0.016 0.10 2.26 9.12
MK36-P1-RUN1 70
22.52 8.03 0.198 2.80 40.52 113.60
MK36-P1-RUN2 22.18 8.01 0.201 2.77 39.86 110.29
Average 22.35 8.02 0.200 2.79 40.19 111.95 Std. Dev. 0.17 0.01 0.001 0.02 0.33 1.65
MK31-P2-RUN1
40
16.93 6.43 0.175 2.64 36.78 96.93
MK40-P1-RUN1 17.87 7.21 0.187 2.48 38.55 95.54
MK40-P1-RUN2 17.77 6.83 0.192 2.60 35.56 92.53
Average 17.52 6.82 0.185 2.57 36.96 95.00 Std. Dev. 0.42 0.32 0.007 0.07 1.23 1.84
MK14-P1-RUN1
25
16.17 6.53 0.188 2.48 34.71 85.93
MK14-P1- RUN2 16.18 6.57 0.199 2.46 33.04 81.42
MK14-P2- RUN1 16.03 6.20 0.238 2.58 26.03 67.28
MK14-P2- RUN2 15.89 6.02 2.64
MK27-P1- RUN1 16.76 6.45 0.362 2.60 17.79 46.26
MK27-P1-RUN2 16.43 6.26 0.320 2.62 19.59 51.39
Average 16.24 6.34 0.261 2.56 31.26 78.21 Std. Dev. 0.284 0.194 0.022 0.069 3.761 7.946
MK5-P1-RUN1
0
10.64 4.92 2.16 MK5-P1-RUN2 9.76 4.51 0.119 2.16 38.06 82.32 MK5-P2-RUN1 11.06 4.95 2.23 MK5-P2-RUN2 11.40 4.77 0.160 2.39 29.85 71.35
MK30-P1-RUN1 10.94 4.71 0.139 2.32 33.78 78.54
Average 10.76 4.77 0.139 2.25 33.90 77.40 Std. Dev. 0.56 0.16 0.017 0.09 3.35 4.55

97
Table E.2 Reproducibility data for PES/PI/ZIF-8 20/80/10
Permeability (Barrer) Selectivity Experiment Code H2 CO2 CH4 H2/CO2 CO2/CH4 H2/CH4
MK-41-P1-RUN1 41.13 14.20 0.385 2.90 36.86 106.77
MK-41-P1-RUN2 40.57 14.09 0.389 2.88 36.23 104.30
MK-42-P1-RUN1 38.24 13.09 0.344 2.92 38.06 111.17
MK-44-P1-RUN1 38.34 13.17 0.365 2.91 36.11 105.14
MK-48-P1-RUN1 37.23 13.09 0.356 2.84 36.80 104.65
Average 38.93 13.53 0.368 2.89 36.81 106.41
Std. Dev. 1.42 0.51 0.017 0.03 0.69 2.53