Easy Phytic Solution (Glycolic + Lactic + Mandelic + Phytic )
Upload
anisur-rahmanCategory
view
215download
1
Toxicology and Applied Pharmacology 267 (2013) 57–73
Contents lists available at SciVerse ScienceDirect
Toxicology and Applied Pharmacology
j ourna l homepage: www.e lsev ie r .com/ locate /ytaap
Poly(lactic-co-glycolic) acid loaded nano-insulin has greater potentials of combatingarsenic induced hyperglycemia in mice: Some novel findings
Asmita Samadder, Jayeeta Das, Sreemanti Das, Arnab De, Santu Kumar Saha,Soumya Sundar Bhattacharyya, Anisur Rahman Khuda-Bukhsh ⁎Cytogenetics and Molecular Biology Laboratory, Department of Zoology, University of Kalyani, Kalyani-741235, India
⁎ Corresponding author at: Department of Zoology, UniveW.B., India.
E-mail addresses: [email protected], khudabuk(A.R. Khuda-Bukhsh).
0041-008X/$ – see front matter © 2013 Elsevier Inc. Allhttp://dx.doi.org/10.1016/j.taap.2012.12.018
a b s t r a c t
a r t i c l e i n f oArticle history:Received 6 September 2012Revised 11 December 2012Accepted 18 December 2012Available online 29 December 2012
Keywords:PLGATransmission and atomic force microscopyCircular dichroic spectraArsenic induced hyperglycemiaMitochondriaMice
Diabetes is a menacing problem, particularly to inhabitants of groundwater arsenic contaminated areasneeding new medical approaches. This study examines if PLGA loaded nano-insulin (NIn), administeredeither intraperitoneally (i.p.) or through oral route, has a greater cost-effective anti-hyperglycemic poten-tial than that of insulin in chronically arsenite-fed hyperglycemic mice. The particle size, morphology andzeta potential of nano-insulin were determined using dynamic light scattering method, scanning electronicand atomic force microscopies. The ability of the nano-insulin (NIn) to cross the blood–brain barrier (BBB)was also checked. Circular dichroic spectroscopic (CD) data of insulin and nano-insulin in presence orabsence of arsenic were compared. Several diabetic markers in different groups of experimental and controlmice were assessed. The mitochondrial functioning through indices like cytochrome c, pyruvate-kinase,glucokinase, ATP/ADP ratio, mitochondrial membrane potential, cell membrane potential and calcium-ion level was also evaluated. Expressions of the relevant marker proteins and mRNAs like insulin, GLUT2,GLUT4, IRS1, IRS2, UCP2, PI3, PPARγ, CYP1A1, Bcl2, caspase3 and p38 for tracking-down the signalingcascadewere also analyzed. Results revealed that i.p.-injected nano-encapsulated-insulin showed better results;NIn, due to its smaller size, fastermobility, site-specific release, could cross BBB and showed positivemodulationin mitochondrial signaling cascades and other downstream signaling molecules in reducing arsenic-induced-hyperglycemia. CD data indicated that nano-insulin had less distorted secondary structure as compared withthat of insulin in presence of arsenic. Thus, overall analyses revealed that PLGA nano-insulin showed betterefficacy in combating arsenite-induced-hyperglycemia than that of insulin and therefore, has greater potentialsfor use in nano-encapsulated form.
© 2013 Elsevier Inc. All rights reserved.
Introduction
Diabetes mellitus (DM) is a metabolic disorder characterized byhyperglycemia, altered insulin secretory capacity of pancreatic β cells,and insulin resistance in the peripheral tissues (Fröde and Medeiros,2008). Established risk factors for DM include older age, obesity, physi-cal inactivity, stress, family history and genetic polymorphism (Zimmetet al., 2001). In addition, environmental toxicants, including arsenic,have been suggested to play an etiologic role in diabetes development(Longnecker and Daniels, 2001). Hydroarsenicism is a major publichealth problem since millions of people worldwide are exposed toarsenic, through contaminated drinking water (Banerjee et al., 2007;Jones, 2007). Epidemiological and experimental data indicate the diabe-togenic role of arsenic (Navas-Acien et al., 2006) and exposure to highlevel of arsenic in drinking water well above 100 ppb has been
rsity of Kalyani, Kalyani-741235,
rights reserved.
associated with an increased risk of diabetes in high arsenic areas ofTaiwan and Bangladesh (Lai et al., 1994). In arsenic contaminated areasin West Bengal, India, prevalence of arsenic induced hyperglycemiahas also been reported (Belon et al., 2006), necessitating large scaleadministration of insulin in the management of type 2 diabetes as alast resort for its effective control. But chronic use of insulin has its ownset of problems: its cost, development of drug-dependence, and some-times necessity for increase in dose, for which a strict monitoring andmanagement regimen is required, particularly because of the addedrisk of a sudden fall in sugar level in those who receive insulin as a con-ventional add-on therapy along with some other anti-diabetic drug(s).New approaches of drug development are therefore constantly beingharnessed that can give people inhabiting risk-prone areas a betterway of life. Experimental approach towards arsenic induced diabetesin animalmodels to determine the efficacy of newdrugs is oneof the ac-cepted norms through which various aspects of dose, efficacy and drugmetabolism can be tested. Diabetic rats andmicemodels have thus beendeveloped by different arsenic exposure protocols (Izquierdo-Vega etal., 2006; Paul et al., 2007) supporting epidemiological findings, ofwhich mice models are preferred in some studies because of their

58 A. Samadder et al. / Toxicology and Applied Pharmacology 267 (2013) 57–73
close genomic resemblances with human subjects. Efforts to find outmeans bywhich lesser amount of insulin may produce the same degreeof anti-hyperglycemic effects, and the drug may be released in asuspendedmanner led us to explore one of the current areas of techno-logical innovations – the nanotechnology – so that larger number ofpeople may get the benefit of use of smaller quantity of insulin tocontrol their arsenic-induced hyperglycemia. In recent years several ap-proaches, have beenmade by utilizing nanotechnology as a basic aswellas applied science tool (Bhattacharyya et al., 2010, 2011; Jonesand Grainger, 2009; Karakoti et al., 2006; Rahban et al., 2010) in thera-peutic applications. Nanoparticles of biodegradable non-toxic polymers,harmless to target organism or organ system or both, are preferred.Poly(lactic-co-glycolic) acid (PLGA) polymers offer an ideal carrier sys-tem for the delivery of drugswithin the cells (Weissenböck et al., 2004).The present study dealswith the formulation of PLGA loaded insulin andattempts for thefirst time to explore its targeted delivery,mitochondrialcascade within cells in arsenite-induced hyperglycemic condition.
In recent years, sporadic attempts have been made to administerinsulin through oral route (Parat et al., 2009), but most attemptsdid not yield the desirable result. Insulin, being protein, is prone todegradation in the alimentary canal before its assimilation andentry into the blood stream, for which the intra-peritoneal injectionroute is preferred.
Therefore, the main objectives of the present study were to test thehypotheses whether: i) insulin can be effectively nano-encapsulatedwith PLGA and if possible, whether ii) the encapsulated insulin (NIn)would showbetter potentials of reducing arsenic-induced hyperglycemiain mice at a reduced dose than un-encapsulated insulin, iii) to find outwhether intra-peritoneal (i.p.) route of administration gave better resultsthan that of oral administration, iv) to determine if it has the ability tocross the blood–brain barrier, and v) to address the molecular mecha-nism of action, particularly in respect of the mitochondrial signalingresponses triggered by the nano-insulin vis-à-vis the un-encapsulatedinsulin.
Materials and methods
Reagents. All the chemicals used were of analytical grade and pro-cured from Sigma, USA.
Formation of blank and drug loaded nanoparticles. Solvent displace-ment technique of Fessi et al. (1989) was deployed for the PLGA encap-sulation of insulin under optimal conditions. Briefly,we dried accuratelyweighed (50 mg) PLGA (purchased from Sigma Chemical Co., St. Louis,MO, USA) and dissolved 10 mg of dried insulin (bovine origin) in3 ml acetone. To this organic phase mixture (0.5 ml/min) 20 ml ofaqueous solution containing the stabilizer (1% polyoxyethylene-polyoxypropylene) (F68; w/v) was added in a drop-wise manner. Themixture was stirred continuously at room temperature until completeevaporation of the organic solvent. Removing the redundant stabilizerfrom the nanoparticles by centrifugation at 2500 g and 4 °C for 30 minthe pellet was re-suspended in Milli-Q water and washed three times.We stored the nanoparticles loaded suspensions at 4 °C until furtheruse. For blank nano-particles, the same method was deployed withoutthe addition of insulin particles. The blank nano-particles and thedrug-loaded nano-particles were then administered to arsenic-inducedhyperglycemic mice (in a preliminary trial). A decrease in the bloodglucose level was observed in drug-loaded nano-particles administeredseries of mice whereas no such changes were observed in blanknano-particles administered mice. Therefore, further studies werepreceded with the drug-loaded-nano-particles only.
Scanning electron microscopic (SEM) study. Surface morphology of thePLGA formulated nano-insulin (NIn) was determined by scanning elec-tron microscopy (SEM) (Hitachi S 500, USA) equipped with 15 kV, SEdetector with a collector bias of 300 V, the lyophilized samples being
spread over the double-sided conductive tape (12 mm) fixed ontometallic stud.
Atomic force microscopic (AFM) studies of nano-insulin. Samples forAFM imaging were prepared by placing a drop of NIn-suspension ona freshly cleanedmica sheet and allowed to dry in the air. Observationwas recorded through AFM (Veeco di CP-11) imaging in amplitudeand tapping modes.
Particle size determination by dynamic light scattering (DLS)method. Average size and distribution of the polymeric micelleswere determined by DLS using a Zetasizer, Nano-ZS instrument(Malvern Instruments, Southborough, UK). The intensity of scatteredlight was detected at 90° to an incident beam. The freeze-dried pow-der was dispersed in aqueous solution and measurements were done,after the aqueous micellar solution was filtered with membraneextruder having an average pore size of 0.22 μm (Millipore, St. Charles,MO). The sizesweremeasured and presented as the average value of 20runs, with triplicate measurements within each run. Zeta potential ofthe nanoparticles was measured in the same instrument and with thesame procedure.
Structural integrity assessment of insulin nanoparticle. Structural integ-rity of PLGA nano-insulin and insulin were analyzed by conducting andcomparing FTIR spectra of insulin and nano-insulin.
Insulin loading, encapsulation efficiency and burst release profile ofnano-insulin during its formulation. The entrapment efficiency (E%)of nano-insulin (NIn) loaded in PLGA and release of insulin fromthe nano-particles were determined by following the method of DeRosa et al. (2005). In brief, insulin standard curve was made byestimating the absorbance of different concentration of insulin(10 nM to 200 nM range) at 280 nm wavelength. The encapsulationefficiency (%, w/w) of insulin was calculated according to the follow-ing equation: Encapsulation efficiency (%)=E (%)=([Drug]tot−[Drug]free) / [Drug]tot×100.
Assessment of stability of nano-encapsulated insulin in a temperaturedependent manner. For the purpose of assessing the stability ofnano-encapsulated insulin, we recorded the absorbance of nano-encapsulated insulin at different temperatures (4 °C, 10 °C, 20 °C,30 °C, 37 °C, 40 °C) under UV spectrophotometer.
Assessment of the ability of PLGA-nano-insulin to cross blood–brainbarrier. To specifically determine if nano-insulin had the ability tocross the blood–brain barrier (BBB), PLGA-insulin-nano-particleswere administered intra-peritoneally to mice at a dose of 0.5 mIU/gb.w. and 1 mIU/g b.w. The intra-peritoneal injections were repeatedone more time after 3 days. At the end of treatment period the micewere sacrificed via cervical dislocation. The brain tissues were preparedfor TEM microscopy as per standard practice studied earlier (Biswas etal., 2008). In brief, the tissues were dissected out and fixed in 2% para-formaldehyde, 2.5% glutaraldehyde and in 1% osmium tetroxide solu-tion. They were then dehydrated in a graded series of ethanol, andembedded in Epon resin. Ultra-thin sections were cut and then stainedwith 1% uranyl acetate and observed under TEM with a Tecnai G2
electron microscope operating at 200 kV.
Analysis of interaction of arsenic with insulin and nano-insulin by meltingtemperature profile, stability curve and circular dichroic spectralstudies. Melting temperature profile data of insulin alone and with arse-nic, nano-insulin alone and with arsenic, were obtained with the aid of aSHIMADZU UV-1700 spectrophotometer fitted with a temperatureprogram to control the speed of temperature change in the denaturationexperiments at awavelength of 280 nm. The changes in the temperatureprofiles for denaturation of naked insulin (protein) and its nano-form

59A. Samadder et al. / Toxicology and Applied Pharmacology 267 (2013) 57–73
(encapsulated insulin) as a consequence of the exposure to arsenic werededuced from the stability curve by deploying the equation: y=mx+c;wherem=slopewhich is equivalent to the equilibrium constant K. Thenfrom this K, changes in Gibbs free energy was calculated from the equa-tion δG=−RT lnK, where R=Rydberg's constant (10.097×10⁷m−1),T=Change in temperature (here T=90 °C for all the series). The stabil-ity and changes in the temperature for denaturation of protein was thenascertained from the equation δG=δH−TδS, δH=enthalpy (whichwasconstant for all sets) and δS=entropy.
Circular dichroic spectral studywas undertaken in the region of 190–255 nm (range characteristic of secondary structure of insulin) using1 cm path length rectangular quartz cuvette (Jasco spectropolarimeter;model PC controlled J-815; Jasco International Co. Ltd) to compare andassess the extent of arsenic-induced changes in insulin and nano-insulin structure. The concentrations of insulin (0.6 mg/ml), nano-insulin (0.6 mg/ml) and arsenic (0.6 mg/ml) were kept constant duringthe experiments.
Animals. Healthy inbred strain of Swiss albino mice (Mus musculus)(6/8 weeks: ~25 g, both sexes), housed for at least 14 days in anenvironmentally controlled room(temperature, 24–26±2 °C; humidity,55±5%, 12-h light/dark cycle) with access to food and water ad libitumas the materials were used for the present study. The Animal EthicsCommittee, University of Kalyani, approved the experimentalprotocols under the supervision of the Animal Welfare Committee,University of Kalyani. (Vide: Certificate for Proposal No. KU/IAEC/Z-11/07 dt.18.5.2007).
Induction of experimental hyperglycemic condition by arsenic(iAs). Hyperglycemia was induced in mice by oral administration ofsodium arsenite (SA) at a dose of 20 mg/kg b.w. (Samadder et al.,2012; Sinha et al., 2008) for 8 weeks. Blood glucose was measuredlevel in pre- and post-fed mice. Mice having blood glucose level higherthan 180 mg/dl were used for the study.
Dose of insulin and NIn. Insulin and NIn were injected intraperitoneally(i.p.) in SA-induced hyperglycemic mice at a single dose of insulin1 mIU/g b.w (1 IU=1000 mIU) to each mouse and at two differentdoses of NIn, namely, 0.5 mIU/g b.w. and 1 mIU/g b.w., respectively; theintraperitoneal injections were repeated one more time after 3 days(Wullschleger et al., 2011). [In a range finding trial earlier, nano-insulinwas administered both orally and through i.p. injection in SA induced di-abetic mice; less responsive result was obtained for the oral gavage routethan that of i.p. injected ones, for which i.p. injection was selected as theadministration route of the drugs in this study (Supplementary Fig. 1)].
Release kinetics of nano-insulin. To determine the minimum time re-quired (in minutes) after which insulin can be released from its PLGA-capsule in mice, we undertook a study of time-dependent releasekinetics. In brief, after mice had been injected with nano-insulin, theywere sacrificed at different time intervals and their pancreatic β cellswere collected from each of them separately. The amount of insulinafter release from capsule was then quantified by using anti-insulin anti-body (Santa Cruz Biotechnology, USA) and alkaline phosphatase-conjugated secondary antibody (Sigma, USA), following the standardprotocol used for detection of specific protein by indirect ELISA method(Paul et al., 2011).
Randomization of mice. As conflicting reports of sex-specific differ-ence in arsenic-induced diabetes exist (Gale and Gillespie, 2001;Vahter et al., 2007), we initially treated 10 randomly selected maleand 10 female mice to arsenic to examine this aspect and found no in-dication of any sex bias in the development of diabetes in them.Therefore, in all our subsequent experiments we used equal numberof male and female mice without putting any more focus on thisaspect.
Experimental design. Total number of 30 healthy mice (15 male and 15female)weighing ~28–30 gwas randomly selected for use in the exper-iment. Themicewere subdivided into 5 groups, each comprising 6mice(3 male and 3 female).
Group 1 Negative control: Six mice (out of 30 randomly selected mice)were fed normal diet and water ad libitum. Phosphate-buffer-saline was injected (vehicle of insulin and NIn) at thecorresponding dose of insulin and NIn (10 μl/g b.w).
Group 2 Diabetic control: SA was fed in 24 mice (out of 30 randomlyselected mice) at a dose of 20 mg/kg b.w daily which servedas diabetic control.
Group 3 Insulin treated sub-group: Insulin (1 mIU/g b.w) i.p. wasinjected to a subgroup of six mice from group 2 (i.e. six micefrom group of 24 mice fed with SA) diabetic mice.
Group 4 NIn-treated subgroup 1: Nano-insulin (0.5 mIU/g) i.p. wasinjected to a subgroup of six mice from group 2 (i.e. six micefrom group of 24 mice fed with SA) diabetic mice.
Group 5 NIn-treated subgroup 2: Nano-insulin (1 mIU/g) i.p. wasinjected to a subgroup of six mice from group 2 (i.e. six micefrom group of 24 mice fed with SA) diabetic mice.
Oral glucose tolerance test (OGTT). Oral glucose test (OGTT) wasperformed by following the standard practice (Zheng et al., 2007)with minor modifications. Briefly, 24 h after confirmation of the dia-betic state, the mice were fasted overnight. Normal and diabeticmice were injected intraperitoneally with either 1 mIU/g b.w insulinor with two doses, 0.5 mIU/g b.w. and 1 mIU/g b.w, of NIn, 60 minprior to the challenge with 3 g/kg b.w. oral glucose load. Mice wereanesthetized and blood samples were taken from the tail vein bymaking a small incision in the tail tip, before administration of glu-cose, insulin or NIn, as the case may be, and again at 30 min intervalsfor a period of 120 min.
Diabetic marker analysis. Blood was collected frommice in Eppendorfftubes (without EDTA) and allowed to stand undisturbed for 7 min.Serum was obtained after centrifugation of the tubes at 700 g.
Blood glucose level. Blood glucose levels were measured using astandardized GOD-PODGlucose kit (Autospan) fromCogent DiagnosticsLtd, India (code: 93DP100-74) (Kaplan and Lavernel, 1983).
Glycosylated hemoglobin (GHB). To determine GHB (glycosylatedhemoglobin) quantitatively in blood, we used standardized GHB ionexchange resin method kit from Coral, Crest Biosystems, India(M.L.No.623, Lot: GHB1177) (Bunn, 1981).
Blood cholesterol. Total cholesterol, HDL cholesterol and LDL choles-terol level were measured using a standardized enzymatic CHOD-PAPkit in from Cogent Diagnostics Ltd, India (code: LG052) (Kaplan, 1984).
Triglycerides. To determine triglycerides quantitatively in blood, weused standardized GPO/PAP method kit from Coral, Crest Biosystems,India (code: TGL010, M.L.No.623, Lot: TGL1183) (Bucolo and David,1973).
Isolation of pancreatic β cells. Micewere sacrificed after 12 h of starving(beginning from the time they received the second dose of injection ofIn and NIn) and their pancreatic tissues were collected. Pancreatic βcells were isolated by following the protocol of standard collagenasedigestion (Smelt et al., 2008) with slight modifications like perfusionof pancreatic tissue with DMEM (Dulbecco's Modified Eagles Medium)and then subjecting the same to Kreb-Ringer-HEPES 10% bovine serumalbumin (BSA), (HEPES 25 mM/L containing 10%w/v BSA). Finally afterfollowing all other steps as per the protocol, the β cells were culturedovernight in DMEM containing 1% BSA.

60 A. Samadder et al. / Toxicology and Applied Pharmacology 267 (2013) 57–73
Detection of GLUT2 expression in pancreatic β cells. The immunofluo-rescence detection of GLUT2 in isolated β cells was undertaken forall groups of mice by following the procedure of Biswas et al. (2010).
Analysis of several proteins in pancreatic β cells by immunoblotting. To an-alyze the expressions of different proteins we conducted immunoblotby using anti-insulin, GLUT2, GLUT4, IRS1, IRS2, PI3, PPARγ, CYP1A1and p38 antibodies (Santa Cruz Biotechnology, USA) and alkalinephosphatase-conjugated secondary antibody (Sigma, USA) (Burnette,1981) for the purpose. For quantitative analysis of each band, we deter-mined the band intensity using the Total Lab software (Ultra Lum USA).
Immunofluorescence study. Pancreatic tissue samples were dissectedout from all the groups of mice and the level of insulin studied byfollowing standard protocol (Khuda-Bukhsh et al., 2011) andphotographed microscopically.
RNA extraction and quantitative reverse transcriptase-polymerase chainreaction (RT-PCR) analysis. Total RNA was extracted from the pancre-atic tissue using Trizol reagent according to the manufacturer's instruc-tions. Reverse transcriptase was used to convert RNA to cDNA by reversetranscriptase which was used as template for PCR amplification with theaid of Taq polymerase as per the standard practice (Bhattacharyya et al.,2010). Synthetic oligonucleotide was procured from Chromus Biotech,Bangalore, India. The sequences (Bioserve Biotech, Hyderabad, India) ofthe forward and reverse primers used for specific amplifications are asfollows: G3PDH(5′-ATGGGGAAGGTGAA-GGTCGG-3′ and 5′-GGATGCTAAGCAGTTGGT-3′); Preproinsulin(F:5′-AACCCACCAGGCTTTTGTC-3′ andR:5′-TGCAGTAGTTCTCCAGCTCG-3′),IRS1(F:5′-AGAGTGGTGGAGTTGAGTTG-3′ and R:5′-GGTGTAACAGAAGCAGAAGC-3′),IRS2(F:5′-GGATAATGGTGACTATACCGAGA-3′ and R:5′-CTCACATCGATGGCGCGATATAGTT-3′),GLUT2(5′-ATGTCAGAAGACAAGATCACCGG-A-3′ and 5′-CCTACTGGACGGATTTTGGCTC-3′); GLUT4(5′-AAGATGGCCACGGAGA-GAG-3′ and 5′GTGGGTTGTGGCAGTGAGTC-3′); Glucokinase(5′-CACCCAACTGCGAA-ATCACC-3′and5′CATTTGTGGGGTGTGGAGTC); PPARγ(F:5′-GCGGAGATCTCCAGTGATATC-3′ and F:5′-TCAGCGACTGGCACTTTTCT-3′), PI3(F:5′-TTAAACGCGAAGGCAACGA-3′ and R:5′-CAGTCTCCTCCTGCTGCTGAT-3′), PDK1(F:5′-CCCGCTACTACGTTTCTTATCTTCC-3′ and R:5′CCGAGAGACACATCAAAATCTGG-3′CYP1A1(F:5′-CCCACAGCACCACAAGAGATA-3′ and R:5′-AAGTAGGAGGCAGGCACAATGTC-3′), UCP2(F:5′GTACAGGAATTCAGCATCATGGTTGGGTT-3′ and R:5′-AGCAGCTCTAGAGGCTCAGAAGGCAGC-3′).
PCR was performed on an automated thermal cycler (AppliedBiosystems, USA). For each PCR reaction following sequence wasused: pre denaturation: 95 °C for 3 min, denaturation: 95 °C for 30 s,primer annealing: 60 °C (depends on the Tm value of the primers) for45 s, extension/polymerization: 72 °C, for 60 s, final extension phaseat 72 °C for 7 min. 30 PCR cycles were run for each experiment.
After PCR amplification, the amplified cDNA products were run andseparated on 1.5% agarose gel electrophoresis in TAE buffer (10 mMTris, 0.1 mM EDTA, 0.55 ml acetic acid) with 0.5 μg/ml ethidiumbromide and visualized under UV trans-illuminator and photographed.The DNA bands were then photographed and densitometricallyanalyzed through Total Lab software (Ultra Lum USA).
Analysis of glucokinase (GK) and pyruvate kinase (PK) activity andmeasurement of ATP-ase, total thiols (sulphydryl) group and glutathione(GSH) level. Enzymatic assay for GK and PK activity was undertakenon the basis of standard protocol described in EC.2.7.1.2 (Andrew etal., 1974) and EC.2.7.1.40 (Mazurek et al., 2002) respectively. The levelof ATPase enzyme was measured by the standard procedure(Ishmukhametov et al., 2008) using phenol red indicator. The totalthiol group and GSH level in pancreatic β cells were determined follow-ing the standard protocols (Manna et al., 2008).
Analysis of mitochondrial membrane potential (MMP). Changes inmito-chondrial membrane potential of isolated pancreatic β cells were
observed fromdifferent group ofmice, using a fluorescent probe, Rhoda-mine 123 (1 mM) and were analyzed by using a flow cytometer (BDFACS, ARIA). Carbonyl cyanide-meta-chlorophenylhydrazone (CCCP)(70 μM) quencher was used for positive control (Dhiman et al., 2008;Ratha et al., 2006).
Detection of cytochrome c from mitochondrial and cytosolic fraction of pan-creatic β cells to ascertain changes inmitochondrial signaling. Mitochondriawere isolated from pancreatic β cells following the protocol of Frezza etal. (2007) with slight modifications. In brief, after homogenizing the iso-lated pancreatic β cells collected from different groups of mice in isola-tion buffer (0.1 M Tris-MOPS, 0.1 M EGTA/Tris, 1 M sucrose of pH=7.4, the material was centrifuged at 600 g for 10 min at 4 °C to pelletdown the nuclei. The supernatant was again centrifuged at 7000 g for10 min at 4 °C to precipitate down the heavy membrane fractioncontainingmitochondria. The change inmitochondrialmembrane poten-tial mediated release of cytochrome c from mitochondria was analyzedby immuno-blot preparation of isolated mitochondrial and cytosolicfraction. COX2 and COX4 protein expressions for assessing the purityof mitochondrial fraction and beta actin for cytosolic fraction werealso analyzed.
Evaluation of apoptotic markers in response to mitochondrialsignaling cascade. The expressions of Bcl2 and caspase 3 proteinswere analyzed from immunoblots by using anti-Bcl2 and caspase3antibodies (Santa Cruz Biotechnology, USA) and alkaline phosphatase-conjugated secondary antibody (Sigma, USA) (Burnette, 1981). Forquantitative analysis of each band, we determined the band intensityusing the Total Lab software (Ultra Lum USA).
Determination of insulin sensitivity in hyperglycemic condition. Effect ofinsulin in SA induced hyperglycemic condition was examined by theprotein and mRNA expressions of forkhead box protein 1 (FOXO1)gene using the standard techniques for Western blot (Burnette, 1981)and RT-PCR (Bhattacharyya et al., 2010); densitometric analysis wasdone by using the Total Lab software (Ultra Lum USA). Anti-FOXO1antibody (Cell Signaling, MA, USA), alkaline phosphatase-conjugatedsecondary antibody (Sigma, USA) and the primers (forward: 5′-TGGATGGTTCAGAACGTGCCCTAT -3′ and Reverse: 5′-ACGCCGCTCTTCTTCTCACAGATT -3′) were also used.
Quantitative estimation of ATP/ADP ratio. Ratio of ATP/ADP was mea-sured using the Enzylight ADP/ATP ratio bioluminescence assay kit(ELDT 100) and assessed in a luminometer (Thermo-Scientific VarierSkan). The result obtained was inversed to get the ATP/ADP ratio(Schafer et al., 2009).
Cell membrane potential. The changes in membrane potential of pan-creatic β cell were determined by using the fluorescent dye 3,3′-diphenylthiocarbocyanine iodide in spectrofluorimeter (Thermo-Scientific Varier Skan) and flow cytometer (BD FACS, ARIA) (Panjaet al., 2006).
Quantitative analysis of intracellular calcium ion content. Incubatingthe isolated pancreatic β cells overnight in 1 ml PBS they were soni-cated (Sonics vibra) at an amplitude of 56 Hz, pulse 60 s with an in-terval of 5 s. Intracellular calcium ion (Ca2+) of pancreatic β cellswere estimated by the standard titration method in chemistry usingEriochrome black T indicator (Das, 2009).
Blinding of experimental samples. All the experiments conducted wereperformed in a “blinded” manner.
Statistical analysis. Themeans of values of all the data of three indepen-dent experiments were statistically analyzed using Student's t-test andone-way ANOVA by post-hoc testing. The software used for the analysis

61A. Samadder et al. / Toxicology and Applied Pharmacology 267 (2013) 57–73
was SPSS 14.0. Apb0.05 vs. normal control group, Bpb0.05 vs. SA treat-ed group Cpb0.05 vs. SA+in treated groupwere considered significant.
Results
Characterization and structural integrity assessment of insulinnanoparticle (NIn)
The surface morphology of the formulated NIn under SEM (Fig. 1a)and AFM (Fig. 1b), displayed a spherical shape of nanoparticles withsmooth surface, while the corresponding 3D image (AFM) (Fig. 1c)of NIn showed smooth surface without any pinholes or cracks. The2D Fast Fourier Transformation (FFT) image in AFM also showsuniform spatial frequency of topographic planar signal of insulin-nano-particles (Fig. 1d). Taking into purview the concept that the sec-ondary structure is generally a reflection of protein conformation bythe presence of amide band (1600–1700 cm−1), insulin and NInwas subjected to FTIR spectral analysis to reveal if the secondarystructure of insulin could also be detected in the NIn. Characteristicamide band of insulin was observed at position 1657, and this bandwas also present in NIn at 1653 position, thereby showing evidencefor structural resemblance of the characteristic band typical of insulinin both the samples (Fig. 1e) tested. DLS data showed that the meandiameter of NIn was 93.67 nm with polydispersity index (PDI) of0.265 and represented in Fig. 1f. The zeta potential of the drug encap-sulated form is −18.2 mV (Fig. 1g).
Assessment of insulin loading, encapsulation efficiency and burst releaseof insulin from PLGA-nano-insulin during the formation
The drug loading/encapsulation efficiency of insulin inside PLGAto form nano-encapsulated-insulin was calculated to be 90.2%. Insulinburst-release (i.e. loss of insulin during the formulation-process ofnano-insulin) from the PLGA-encapsulated-insulin was found to beof minimum amount (Supplementary Table 1a–b).
Release kinetics of insulin from its nano-encapsulated form
Constant release of insulin from its PLGA capsule was observedfrom 0 to 30 min of nano-insulin post treatment (SupplementaryFig. 2). The presence of insulin in pancreatic β cells as observedfrom the release kinetics result would suggest that the whole ofnano-insulin does not enter the β cells, instead PLGA is degradedbefore entry and only the insulin part enters the cells to activateother signaling cascades.
Assessment of stability of insulin nano-particles at different temperatures
From the UV spectral study we observed that NIn had a particularcharacteristic spectral band; the λmax was obtained at 280.9 nm.With variation in temperature (Fig. 2a) the characteristic bandshowed no disorientation or peak shift (the λmax was constant inall the cases), thereby signifying its stability in respect to varioustemperature ranges.
Transmission microscopic study to detect presence of nano-particles inmice brain
Black dot like structures (marked by arrow) were observed in thebrain tissue of mice which increased in a dose-dependent manner. Inlow dose of NIn they appeared in the cytoplasm only (B) but at higherdose of NIn they appeared in the cytoplasm as well as in the nucleus(Nu) of the brain tissue (C) as compared with the nano-insulinuntreated mice (Figs. 2b and c). This would clearly suggest the abilityof the nano-encapsulated-insulin to cross the blood–brain barrier(BBB).
Melting temperature profile and stability curve for determination ofarsenic-induced changes in insulin and PLGA-encapsulated nano-insulin
The temperature profile study revealed that themelting temperatureof insulin, without arsenic, was nearly 67.5±0.5 °C which on introduc-tion of arsenic was reduced to 35±0.5 °C. The results also revealedthat the melting temperature of nano-insulin was 90±0.5 °C, about23 °C higher than that of insulin. When arsenic was added withnano-insulin, the melting temperature was reduced to 70±0.5 °C,(Fig. 3a), still much higher than that obtained for arsenic plus insulin.
From the data of the stability curve, the δG values obtained were:−3202.97 for insulin, −2717.59 for insulin+SA, -3731.73 for NInand -3718.73 for NIn+SA (Fig. 3b). The proportionality values werefound to indicate NIn to be the most stable because of their most nega-tive δG value, which suggests that much higher temperature is neededfor its denaturation. The increasing order for denaturation temperatureof the experimental sets are as follows: Inb In+SAbNIn+SAbNIn,i.e. In+SA will denature first, followed by In and NIn+SA and NInwill denature last.
CD spectral evaluation for arsenic-induced changes in insulin andnano-insulin
In case of CD spectral study it was noteworthy that, the far-UV spec-tral region at 190–250 nm, gave characteristic band of insulin showingthe secondary structural features of insulin, (di-peptide joined by theS\S bond). On introduction of arsenic the positive band of insulin shiftedtowards the right side suggesting a possible interaction of arsenic withinsulin (Fig. 4a.i.). In case of nano-insulin, shifting of the standard CDspectral band (towards the right side) on introduction of arsenic wasreduced when compared to that of un-encapsulated insulin (Fig. 4a.ii.).
Determination of glucose tolerance in experimental sets
Treatment with insulin and nano-insulin significantly improved theglucose tolerance level and inhibited rise in blood glucose level in boththe time periods 90 min and 120 min after glucose load inmice as com-pared with SA-induced hyperglycemic mice (Supplementary Fig. 3).
Determination of GLUT2 expression in isolated β cells
Significant elevation in fluorescence intensity of GLUT2 protein inpancreaticβ cellswas observed in SA-fed insulin andNIn treated groupsofmice, when compared to that of only SA fed series, the intensity beingmore in the NIn treated ones (Figs. 4b and c).
Diabetes marker analysis: anti hyperglycemic effect of insulin and NIn on iAs
A significant elevation in the levels of blood glucose, glycosylatedhemoglobin, total cholesterol, LDL cholesterol, triglyceride level anddepletion in HDL cholesterol level in arsenic-induced-hyperglycemicmice was detected, when compared with control. Administration ofinsulin and NIn showed significant reversal in the above parameters(Table 1a and b). The PLGA–NIn had greater efficacy in modulatingthese parameters than un-encapsulated form of insulin.
Analysis of pyruvate kinase (PK) and glucokinase (GK) activity andmeasurement of ATP-ase, total thiols (sulphydryl) group and GSH levels
Activity of GK, which serves as the first enzyme in converting glu-cose to glucose-6-phosphate, and that of PK, which is the last enzymeof glucose metabolism, decreases rapidly in diabetic mice (Table 2a).But on administration of the insulin and its nano-encapsulated form,we observed a significant increase in their level bringing them near tonormal. We also observed a marked decrease in the level of totalthiol group and GSH and increase of ATPase in mice treated with

f g
Insulin
Nano-insulin
e
d
c
A
A
ba
Fig. 1. 1a. Scanning electron microscopic image of PLGA-encapsulated-nano-insulin showing surface morphology of the nano-particles. 1b. Atomic force microscopic image ofPLGA-encapsulated-nano-insulin (two-dimension mode) showing measured size of a single nano-particle. 1c. Atomic force microscopic image of PLGA-encapsulated-nano-insulin in thethree-dimension mode. 1d. Atomic force microscopic image of PLGA-encapsulated-nano-insulin in Two-dimension Fast Fourier Transformation mode showing the frequency of occurrenceof same-sized nano-particles. 1e. Structural integrity assessment of insulin and nano-encapsulated-insulin by FTIR. Similarity in the spectral band peaks was observed in nano-insulin as thatof insulin. 1f. Average particle size (Z-average-value) obtained from DLS data for PLGA-encapsulated-nano-insulin. 1g. Zeta potential of PLGA-encapsulated-nano-insulin.
62 A. Samadder et al. / Toxicology and Applied Pharmacology 267 (2013) 57–73

275
0.0
0.1
0.2
0.3
0.4
0.5
----- 40oC
----- 37oC
----- 30oC
----- 20oC
----- 10oC
----- 4oCA
bso
rban
ce (
a.u
.)
Wavelength (nm)
a
1µm
Nu
A 1µm Nu B
Nu
1µm C
b
c
300 325 350
Fig. 2. 2a. Assessment of stability of insulin nanoparticles at different temperature variances. 2b. Transmission electron microscopy of brain tissue to detect the capability ofinsulin-nano-particles to cross the blood brain barrier. A-Normal mice without any nano-particle administration, B- Mice after administration of nano-insulin at dose (I), C- Mice afteradministration of nano-insulin at dose (II). Arrowhead marks the presence of nanoparticles. Nu- stands for nucleus. 2c. Quantification of distribution of nano-insulin in brain inun-treated series and nano-insulin treated series in two respective doses. The number of nano-particles was expressed as % in the graph. &&&pb0.001 vs. lower dose of nano-insulin.
63A. Samadder et al. / Toxicology and Applied Pharmacology 267 (2013) 57–73
SA (Table 2b); the administration of insulin and NIn significantlyreversed the level of these enzymes. The modulations were morepronounced in nano-insulin than in insulin treated mice.
Quantitative analysis of intracellular calcium ion content
The intracellular calcium ion in iAs diminished in their level whencompared to that of normal group. On administration of the insulinand its nano-form we observed a reversal in the level of calcium ion(Table 2c).
Quantitative estimation of ATP/ADP ratio
Marked decrease was observed in the ATP/ADP ratio in SA treatedmice when compared with normal, but the ratio increased in insulinand NIn administered groups (Table 2c).
Cell membrane potential (CMP)
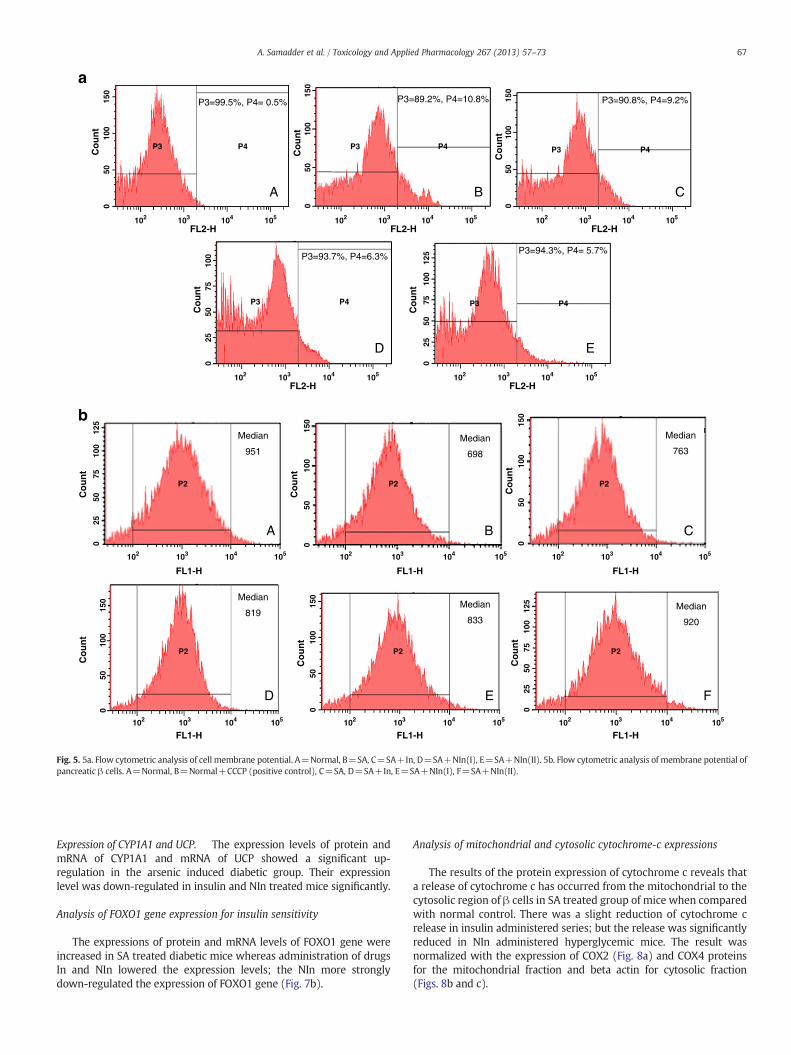
The membrane potential of pancreatic β cells was less towards neg-ativity in SA treated mice when compared with that of normal. The po-tential was re-established, i.e., was again brought towards negativityeffectively on administration of insulin and NIn (Table 2c) and this re-sult was also supported by the data obtained from flow cytometricstudy (Fig. 5a).
Analysis of mitochondrial membrane potential (MMP)
As compared with the control, MMP of CCCP quencher treated βcells were markedly decreased which served as the positive controlof the study. The MMP of pancreatic β cells in arsenite treatedgroup of mice showed decrease in the mitochondrial membranepotential value (indicating depolarization state as compared with

b
a
0.26
0.28
0.30
0.32
0.34
0.36
0.38
0.40
0.42
0.44K = 144.35R = 0.964
O.D
In
0.24
0.26
0.28
0.30
0.32
0.34
0.36
0.38
0.40
0.42 K = 146.88R = 0.934
In+SA
0.06
0.08
0.10
0.12
0.14
0.16K = 37.82R = 0.91
O.D
O.D
O.D
NIn
0.06
0.07
0.08
0.09
0.10
0.11
0.12
0.13
0.14 K = 72.43R = 0.935
NIn+SATemperature (oC)
0 20 40 60 80 100
Temperature (oC)
0 20 40 60 80 100
Temperature (oC)
0 20 40 60 80 100
Temperature (oC)
0 20 40 60 80 100
Fig. 3. 3a. Melting temperature profile of insulin and PLGA encapsulated nano-insulin in presence and absence of arsenic. 3b. Stability curve for Gibbs free energy in relation totemperature for denaturation of insulin and PLGA encapsulated nano-insulin in presence and absence of arsenic.
64 A. Samadder et al. / Toxicology and Applied Pharmacology 267 (2013) 57–73
that of normal. However, in the insulin and NIn treated iAs series(Fig. 5b) it was more pronounced in the case of NIn, indicating there-establishment of the hyper polarization state of mitochondrialmembrane potential as revealed from the quantitative data generatedby flow cytometry.
Immunofluorescence study
Immunofluorescence staining for extent of distribution of intracellular insulin level in the SA treated group of animals showed a
significant decrease in its expression as compared with that of normalcontrol while treatment with external insulin and NIn increased theirlevel when compared with iAs (Fig. 6a).
Western blot and RT-PCR
The immunoblot expression (Figs. 6b, c, d) and mRNA expressionlevels of different proteins (Fig. 7a) in different groups of mice wereanalyzed, and the results are individually presented below:

a1
a2
B C D EA
b
c
BA
CBA
CBA
Fig. 4. 4a. Circular dichroic spectral analysis of insulin (i) and PLGA encapsulated nano-insulin (ii) in presence and absence of arsenic. 4b. Fluorescence microscopic determination of GLUT2protein. A decrease in fluorescence was observed in SA treatedmice when compared with that of normal. There was again an increase in the fluorescence in In and NIn administered group.A=Normal, B=SA, C=SA+In, D=SA+NIn(I), E=SA+NIn(II). 4c. Quantitative determination of GLUT2 protein distribution (in %) by its fluorescence intensity in different experimentaland control set of mice. Apb0.05 vs. Normal control group, Bpb0.05 vs. SA treated group Cpb0.05 vs. SA+In treated group.
65A. Samadder et al. / Toxicology and Applied Pharmacology 267 (2013) 57–73

Table 11a and 1b. Mean blood glucose level, glycosylated hemoglobin, total cholesterol, HDLcholesterol, LDL cholesterol and triglycerides were measured in different groups ofexperimental and control mice. There was a modulation in their levels in SA treatedseries which were brought back near to normal after treatment with In and NIn.
1a
Group n Blood glucose(mg/dl)
Glycosylatedhemoglobin (GHb %)
Cholesterol(mg/dl)
Normal 5 125.21±1.43 5.52±0.90 73.90±9.83SA 5 200.00±3.08 17.00±1.26 225.12±1.68SA+In 5 140.66±1.25a,b 10.20±0.61a,b 75.12±13.88b
SA+NIn(0.5 mIU/g)
5 138.35±1.53a,b 7.56±1.30b 83.69±2.92b
SA+NIn(1 mIU/g)
5 135.14±1.28a,b,c 5.91±0.28b,c 82.75±1.53b
1b
Group n HDL cholesterol(mg/dl)
LDL cholesterol(mg/dl)
Triglyceride(mg/dl)
Normal 5 112.29±5.44 68.22±0.79 118.95±3.975SA 5 41.53±2.20 93.01±0.43 139.26±1.04SA+In 5 113.80±4.20b 81.33±0.3a,b 117.73±0.92b
SA+NIn(0.5 mIU/g)
5 107.25±0.45b 76.43±0.91a,b,c 110.3±3.06b
SA+NIn(1 mIU/g)
5 102.62±2.60b 72.32±1.03a,b,c 115.58±3.67b
a pb0.05 vs. Normal control group.b pb0.05 vs. SA treated group.c pb0.05 vs. SA+In treated group.
66 A. Samadder et al. / Toxicology and Applied Pharmacology 267 (2013) 57–73
Insulin and pre-proinsulin. The protein expression of insulin inpancreatic β cells showed a significant decrease in the diabeticgroup (SA treated mice). Their expression levels increased on insu-lin administration and further increased in NIn administered groupof mice at different doses at a significant level. The mRNA expressionof pre-proinsulin showed similar results.
Table 22a and 2b. Mean activities of glucokinase, pyruvate kinase, ATPase, total thiol and GSH levelsmarked decrease in their activities/levels, except that of ATPase (which was increased) in SAthe drugs.2c. Quantitative analysis of intracellular calcium ion content, ATP/ADP ratio and streatment of drugs. There was a decrease in the calcium ion concentration and ATP/ADP ratidition was brought back near to normal on administration of In and NIn.
2a
Group n Pyruvate kin
Normal 5 0.042±0.00SA 5 0.004±0.00SA+In 5 0.021±0.00SA+NIn (0.5 mIU/g) 5 0.044±0.00SA+NIn (1 mIU/g) 5 0.045±0.00
2b
Group n ATPase (mM/mg protein)
Normal 5 0.041±0.003SA 5 0.060±0.001SA+In 5 0.043±0.004b
SA+NIn (0.5 mIU/g) 5 0.038±0.003b
SA+NIn (1 mIU/g) 5 0.037±0.002b
2c
Group n Calcium ion (mg)
Normal 5 42.33±2.14SA 5 38.63±0.73SA+In 5 41.93±0.99b
SA+NIn (0.5 mIU/g) 5 42.15±0.0008b
SA+NIn (1 mIU/g) 5 42.33±0.08b
a pb0.05 vs. Normal control group.b pb0.05 vs. SA treated group.c pb0.05 vs. SA+In treated group.
Disruption of GLUT2 and GLUT4 glucose transporter. Gradual decreasein the expressions GLUT2 protein and mRNA of pancreatic β cells wasobserved in the hyperglycemic mice. Administration of insulin andNIn increased the level of GLUT2 in them. In the drug administeredgroup of mice an increased level of GLUT4 was observed, as comparedwith that of the drug-untreated hyperglycemic group. In both thecases, the modulations brought about in the expressions of the proteinswere more pronounced in NIn than that of In.
Expression of glucokinase. Decrease in glucokinase mRNA expres-sion was detected in hyperglycemic mice which were elevated in in-sulin and nano-insulin treated mice; the latter showed greaterefficacy.
Loss of integrity of IRS1 and IRS2 in iAs. There was a down-regulationof the expression of IRS1 and IRS2 proteins and mRNA of pancreaticβ cells in the hyperglycemic mice. Significant up-regulation in theexpression of the receptors on the administration of NIn was noticedwhich was more than that of insulin.
Role of PI3, PPARγ, and p38 as glucose transport mediators. Down-regulation in the proteins and mRNA expressions of the PI3 and PPARγglucose transport mediators was observed in the hyperglycemic mice,as compared with those of normal control. By contrast, their expres-sions in insulin and NIn injected series increased significantly. On theother hand there was no significant change in the expression of p38protein in all the groups of experimental mice.
Effect of PDK1 in iAs. There was a down-regulation in the expressionsof PDK1 mRNA of pancreatic β cells in the hyperglycemic mice. Onadministration of insulin and NIn, their expressions showed significantup-regulation.
in control and diabetic mice groups before and after the treatment of drugs. There was atreated series. The activities/levels were reverted back to normal on administration of
pectroflurometric analysis of cell membrane potential in diabetic mice before and aftero and the membrane potential was less towards negativity in SA treated mice. This con-
ase (U/mg protein/min) Glucokinase (U/mg protein/min)
7 0.038±0.0031 0.015±0.0024b 0.023±0.001a,b
07b,c 0.028±0.003b
05b,c 0.029±0.002b,c
Total thiols (μM/mg protein) GSH (μM/mg protein)
80.28±0.20 6.14±0.0353.11±0.11 2.24±0.000860.42±0.60a,b 4.86±0.03a,b
68.80±0.72a,b,c 5.37±0.02a,b,c
70.19±0.60a,b,c 5.67±0.03a,b,c
ATP/ADP CMP(mV)
0.997±0.001 −56.08±2.140.892±0.0005 −20.2±0.730.994±0.03b −31.03±0.99a,b
0.988±0.02b −44.68±0.0007a,b,c
0.996±0.02b −48.3±0.08a,b,c
050
100
Co
un
t15
0
025
50Co
un
t 7510
0
050
Co
un
t 100
150
050
Co
un
t
100
150
050
Co
un
t 100
150
050
Co
un
t 100
150
025
50
Co
un
t75
100
125
025
50Co
un
t 7510
012
5
025
50C
ou
nt
7510
012
5
050
100
Co
un
t15
0
P3
102 103
FL2-H104 105 102 103
FL2-H104 105 102 103
FL2-H
FL1-H FL1-H FL1-H
FL1-H FL1-H FL1-H
104 105
102 103
FL2-H104 105
102 103 104 105 102 103 104 105 102 103 104 105
102 103 104 105 102 103 104 105 102 103 104 105
102 103
FL2-H104 105
P4
P3
P2 P2 P2
P2P2P2
P4 P3 P4
P3 P4P3 P4
050
100
Co
un
t15
0
P3=99.5%, P4= 0.5%
A
P3=89.2%, P4=10.8%
B
P3=90.8%, P4=9.2%
C
P3=93.7%, P4=6.3%
D
P3=94.3%, P4= 5.7%
E
a
b
D
Median
819
E
Median
833
F
Median
920
A
Median
951
Median
763
C
Median
698
B
Fig. 5. 5a. Flow cytometric analysis of cell membrane potential. A=Normal, B=SA, C=SA+In, D=SA+NIn(I), E=SA+NIn(II). 5b. Flow cytometric analysis of membrane potential ofpancreatic β cells. A=Normal, B=Normal+CCCP (positive control), C=SA, D=SA+In, E=SA+NIn(I), F=SA+NIn(II).
67A. Samadder et al. / Toxicology and Applied Pharmacology 267 (2013) 57–73
Expression of CYP1A1 and UCP. The expression levels of protein andmRNA of CYP1A1 and mRNA of UCP showed a significant up-regulation in the arsenic induced diabetic group. Their expressionlevel was down-regulated in insulin and NIn treated mice significantly.
Analysis of FOXO1 gene expression for insulin sensitivity
The expressions of protein and mRNA levels of FOXO1 gene wereincreased in SA treated diabetic mice whereas administration of drugsIn and NIn lowered the expression levels; the NIn more stronglydown-regulated the expression of FOXO1 gene (Fig. 7b).
Analysis of mitochondrial and cytosolic cytochrome-c expressions
The results of the protein expression of cytochrome c reveals thata release of cytochrome c has occurred from the mitochondrial to thecytosolic region of β cells in SA treated group of mice when comparedwith normal control. There was a slight reduction of cytochrome crelease in insulin administered series; but the release was significantlyreduced in NIn administered hyperglycemic mice. The result wasnormalized with the expression of COX2 (Fig. 8a) and COX4 proteinsfor the mitochondrial fraction and beta actin for cytosolic fraction(Figs. 8b and c).

b
A B C D E
a
Insulin
GLUT2
IRS1
IRS2
Beta actin GLUT4
CYP1A1
PI3
PPARγ
P38
c
d
Fig. 6. 6a. Immunofluorescence detection of intracellular insulin distribution in pancreatic tissue in different groups of mice. The extent of distribution of intra cellular insulin level in the SAtreated group of animals showed a significant decrease in its expression as compared to that of normal whichwere reverted back near to normal on administration of the drugs. A=Normal,B=SA, C=SA+In, D=SA+NIn(I), E=SA+NIn(II). 6b. Expression of different proteins by immunoblot techniques in normal and hyperglycemic groups of mice before and after drugtreatment. Band intensities were expressed as mean±SE for three independent experiments and compared to beta-actin, the housekeeping gene. Ln1=Normal; Ln2=SA; Ln3=SA+In,Ln4=SA+NIn(I), Ln5=SA+NIn(II). 6c and 6d. Graphical representation of expression of band intensity of different proteins in different groups of experimental mice. A=Normal,B=SA, C=SA+In, D=SA+NIn(I), E=SA+NIn(II) Apb0.05 vs. Normal control group, Bpb0.05 vs. SA treated group Cpb0.05 vs. SA+In treated group.
68 A. Samadder et al. / Toxicology and Applied Pharmacology 267 (2013) 57–73
Evaluation of Bcl2 and Caspase3 apoptotic marker mediated cell deathand mitochondrial dysfunction
The expression of the anti-apoptotic protein Bcl2 was found to bedown regulated in the SA-treated hyperglycemic mice as comparedwith that of normal control. On the contrary, Bcl2 expression in drug fedseries increased significantly. Similarly, we observed over-expression of
the caspase3 protein in the hyperglycemic mice; in the drug fed groupthere was a significant decrease (Fig. 8d).
Discussion
The initial results of the present study would indicate that the oralroute of administration was much less effective than the injection

aLn1 Ln2 Ln3 Ln4 Ln5
G3PDH
1 1 1 1 1
1 0.22 0.39 0.64 0.69
1 0.49 0.74 0.9 0.82
1 0.23 0.38 0.48 0.44
1 0.41 0.58 0.82 0.79
Glucokinase
GLUT4
Preproinsulin
GLUT2
1 0.42 0.68 0.85 0.85
IRS1
Ln1 Ln2 Ln3 Ln4 Ln5
1 0.5 0.69 0.86 0.98
1 1.79 1.25 1.07 1.09
1 2.3 1.51 1.34 1.17
PPARγ
1 0.23 0.36 0.8 0.91
CYP1A1
UCP2
1 0.53 0.73 0.89 0.79
PI3
PDK1
1 0.51 0.82 0.99 0.91
IRS2
b
1 1.2 1.13 1.08 1.131 1.14 1.09 1.02 0.93
FOXO1
Ln1 Ln2 Ln3 Ln4 L5 Ln1 Ln2 Ln3 Ln4 L5
Fig. 7. 7a. RT-PCRanalysis ofmRNA expressions of G3PDH,GLUT2,GLUT4, glucokinase, IRS1, IRS2, PPARγ, PI3, PDK1, CYP1A1 andUCP2 innormal and hyperglycemic groups ofmice beforeand after drug treatment. Band intensities were expressed as mean±SE for three independent experiments and compared with that of G3PDH, the housekeeping gene. Ln1=Normal,Ln2=SA, Ln3=SA+In, Ln4=SA+NIn(I), Ln5=SA+NIn(II). 7b. Immunoblot and RT-PCR analysis for FOXO1 protein and mRNA expression in different experimental and control setof mice. Band intensities were expressed as mean±SE for three independent experiments and compared with that of beta actin, the housekeeping gene. Ln1=Normal, Ln2=SA,Ln3=SA+In, Ln4=SA+NIn(I), Ln5=SA+NIn(II).
69A. Samadder et al. / Toxicology and Applied Pharmacology 267 (2013) 57–73
route and that both sexes of mice responded more or less equally to so-dium arsenite treatment in regard to induction of hyperglycemia as wellas to the drug response. Chronic feeding of sodium arsenite causedbreak-down in the optimum glucose homeostatic balance, faulty tran-scription of genes involved in the process of glucose sensing, the signaltransduction needed to couple the stimulus with secretion, and/or thesecretion machinery itself, as also reported by Tseng (2004) andDiaz-Villasenor et al. (2006), resulting in an elevated level of bloodglucose, glycosylated hemoglobin, blood cholesterol and depletion in tri-glyceride level and glucose tolerance (Chapman, 2007; Cherrington et al.,2002). Insulin, the key hormone secreted by the pancreatic β cells, playsthe pivotal role in proper functioning for optimum glucose homeostasisin biological systems; even a mild depletion in the level of its secretionleads to hyperglycemia (Samadder et al., 2011; Tseng, 2004). Arsenicaffects insulin sensitivity by modifying the expression of genes involvedin insulin resistance and shifting away cells fromdifferentiation to prolif-eration pathway, and thereby perturbs the secondary structure of insulinpeptide.
The present findings also indicated that during encapsulation,there was a minimum loss of insulin. In other words, the encapsula-tion efficiency of PLGA was commendable. The UV spectral data clear-ly demonstrated the stability of the NIn, both at the treatment andstorage conditions. Further, the spectral peaks obtained for NInwere also characteristic of typical protein peaks, confirming therebythe presence of insulin in the PLGA capsules. Results of our present
study also depicted that action of insulin within the capsule was rel-atively less affected by arsenite treatment than that of insulin in nor-mal form, as revealed from the melting temperature profiles and CDspectral data. Analysis of the CD data revealed that for both insulinand nano insulin, the percentages of the alpha helix were reducedafter the treatment of arsenic, but the reduction was more palpablein the case of un-encapsulated insulin than its nano-encapsulatedform. This would confirm that arsenic treatment can perturb thesecondary structure of insulin and/or nano-insulin, bringing about astate of denaturation of the respective protein structure; but theeffects of arsenic were significantly less in NIn, presumably becauseof the rigidity PLGA gives to the capsules preventing arsenic fromdisrupting the disulfide bonds in insulin within the capsules.
Further, the release kinetic study indicated that insulin was releasedfrom the capsule in a suspended manner prior to entering the pancre-atic β cells. The observation of the presence of NIn in the brain tissue isalso significant. PLGA encapsulated nano-particles had also beenreported earlier to cross the blood–brain barrier (BBB) after in vivo ad-ministration of some hydrophobic drugs (Anand et al., 2009), coen-zyme Q10 (Ankola et al., 2007), etc. Brain, specially the hypothalamicregion, has been proposed to be the glucose sensor region, whichplays a critical role in initiating the counter regulatory response to glu-cose homeostasis. Transport of glucose across the brain capillary andinto neurons in this region is mediated by different glucose transporter(GLUT) gene family. BBB participates in brain-sensing of blood glucose

b
aLn1 Ln2 Ln3 Ln4 Ln5
1 0.3 0.42 0.83 0.8 1.21
Cytochrome c(mitochondria)
1 1.76 1.8 1.24 1.3
Cytochrome c(cytoplasm)
1 0.99 1.02 1.02 1.01
COX2(mitochondria)
COX4
Beta actin
Cytosolic fraction Mitochondrial fraction
c
dLn 1 Ln 2 Ln 3 Ln 4 Ln 5
1 0.60 0.78 0.86 0.92
1 1.18 0.83 0.71 0.77
Caspase 3
Bcl2
1 1 1 1 1
Beta actin
Fig. 8. 8a. Mitochondrial and cytosolic Cytochrome c protein and mitochondrial COX2 expressions in hyperglycemic mice, before and after drug treatment. Band intensities wereexpressed as mean±SE for three independent experiments.Ln1=Normal; Ln2=SA; Ln3=SA+In, Ln4=SA+NIn(I), Ln5=SA+NIn(II). 8b and 8c. Immunoblot and graphicalrepresentation for expression of COX-4 gene in the mitochondrial fraction and beta actin in the cytosolic fraction of different set of mice. Band intensities were expressed asmean±SE for three independent experiments Ln1=Normal; Ln2=SA; Ln3=SA+In, Ln4=SA+NIn(I), Ln5=SA+NIn(II). 8d. Immunoblot expression of apoptotic markerslike Bcl2 and caspase3 in relation to mitochondrial damage. Band intensities were expressed as mean±SE for three independent experiments and compared with that of betaactin, the house keeping gene. Ln1=Normal; Ln2=SA; Ln3=SA+In, Ln4=SA+NIn(I), Ln5=SA+NIn(II).
70 A. Samadder et al. / Toxicology and Applied Pharmacology 267 (2013) 57–73
concentration. Under normal physiological conditions, glucose is themajor metabolic fuel in the brain, and therefore, adequate insulinmediated glucose supply is essential for the maintenance of cerebralenergy production (Hasselbalch et al., 2001). The ability of nano-insulin to cross the BBB has therefore great implications.
The insulin receptor complex is an important structure containingtwo a- and two b-subunits, linked together by interchain disulfide
bridges (Massague et al., 1980). Insulin binds to the a-subunits, caus-ing auto-phosphorylation of tyrosine residues on the b-subunits,leading to the employment of insulin receptor substrate (IRS1 andIRS2) proteins via activation of the phosphatidyl-inositol-3-kinase(PI-3-kinase) pathway (Le-Roith and Zick, 2001). PI-3 kinase hasmetabolic and mitogenic actions on insulin. The increase in expres-sion of IRS1 and IRS2 on NIn administration would indicate its

71A. Samadder et al. / Toxicology and Applied Pharmacology 267 (2013) 57–73
binding ability to the insulin receptor, and thus may have increasedlevel of phosphorylation, having implications on restoration of insulinsecretion. Additionally, an increase in FOXO1 gene expression inabsence of insulin in the SA-induced diabetic mice, showed down-regulation on administration of insulin or NIn, possibly throughphosphorylation mediated de-activation of FOXO1 via PI-3 kinasepathway. The results were in conformity with similar findingsreported by Kodama et al. (2004).
From our study we also observed that arsenite in physiologicallyrelevant concentration showed inhibitory effect on the expressionof peroxisome-proliferator-activator-receptor γ (PPARγ), the prima-ry adipogenic transcription factor involved in insulin action.Nano-insulin re-establishes the PPARγ pathway to restore its activityas an insulin sensitizer and regulates the key gene expression for in-sulin sensitivity more effectively than insulin alone.
Arsenic-induced hyperglycemia per se can stimulate translocationof GLUTs through a pathway involving PKC (Rosen, 2002) and in-cludes its effect on glucose metabolism, which is generally attributedto its reactivity towards thiol (SH) groups (Delnomdedieu et al.,1994). Nano insulin could hinder the high affinity of arsenite forexofacial sulphydryl groups and the covalent bonds formed by the in-teraction of arsenite with the disulfide bridges in the molecules of in-sulin receptors, glucose transporters (GLUTs) and enzymes involvedin glucose metabolism more efficiently than insulin alone. Therefore,the elevation of GLUTs or more precisely GLUT2 expression, in drugtreated series indicates that the drugs were actually working on thepancreatic β cells by maintaining optimum glucose homeostasis.
Improper functioning of mitochondria leads to impaired insulinsecretion (Liu et al., 2009). Both mitochondrial and cytoplasmicmembrane potentials of pancreatic β cells play crucial roles infuel-stimulated insulin secretion. Pancreatic β cells sense the ambientplasma glucose concentration because (a) the high-Km glucose trans-porter GLUT2 facilitates rapid equilibration across the cell membrane,and (b) the high-Km hexokinase isoform glucokinase allows the gener-ation of a proportionate signal through glycolytic metabolism ofglucose (Maechler and Woheim, 2001). Our findings suggest that theexposure to arsenic possibly restricts the GLUT2 transporter fromworking normally, resulting in reduction of GK activity, therebyblocking glucose metabolism pathway. Introduction of nano-insulineliminates the blockage, thereby optimizing glucose metabolismmore efficiently than insulin. Pyruvate derived from glycolysis istransported into the mitochondria, where it is oxidized by the tricar-boxylic acid (TCA) cycle leading to transfer of reducing equivalents tothe respiratory chain, hyperpolarization of the mitochondrial mem-brane, and ATP generation (via oxidative-phosphorylation by theelectron-transport chain). The lowering of pyruvate kinase levels in hy-perglycemia hinders the adequate level of pyruvate formation, therebyleading to dysfunction in mitochondrial signaling involved in ATP gen-eration for maintenance of ATP/ADP ratio (Krauss et al., 2003). NIn wasfound to possess greater potentiality than insulin to normalize ATP/ADP ratio; this in turn would assist the downstream cascades formitochondrial signaling through the closure of ATP-dependent K+
(KATP) channels, depolarization of the cell membrane, opening of thevoltage-gated calcium channels, and increasing the concentration ofcytosolic calcium ([Ca2+]c) through Ca2+ influx. Pulses for calcium-stimulated insulin secretion is mediated by release of cytochrome cfrom the mitochondria to cytosolic region which further promotesthe release of bcl2 from the mitochondria and leads to activation ofcaspase3 mediated apoptotic pathway in SA treated hyperglycemiccondition. Our findings are also in agreement with the earlier findingsin this regard (Bojunga et al., 2004; Kelley et al., 2002). Administrationof NIn could reverse this condition back to normal state more efficient-ly than by the un-encapsulated form.
Arsenic also functionally impairs insulin secretion through theactivation of “uncoupling protein2” (UCP2), a negative regulator ofinsulin secretion (Jaburek et al., 1999). UCP2 diverts energy away
from ATP synthesis leading to lowering of the ATP/ADP ratio mediatedmitochondrial damage. NIn could block more efficiently the expressionof UCP2 protein, lowering themitochondrial damage-associated insulinsecretion.
The development of diabetes is a complex process involving actionsof many factors; arsenic induces the onset of the process leading todiabetes. Overall results of the present study opens up the possibilityof using NIn, as an effective new anti-diabetic strategy that may targetany of the several mechanisms that are involved in the developmentof diabetes; these may be done by adopting the proper correctionalmeasures to bring the regulatory events back to the right track. PLGAbeing composed of biodegradable, biocompatible and non-toxic poly-mers, and having satisfactory nano-encapsulation potentials, withsmaller size and uniform spatial planar frequency giving it the abilityto enter cells and act faster, provides an alternative approach for encap-sulation of insulin for an optimized cost-effective use in the control ofdiabetes, because the quantity of the drug entering the body is reducedby about ten folds.
Further studies are needed to investigate the probable extent ofefficacy of NIn against diabetes in some other higher animal modelsand humans.
List of abbreviations
DM Diabetes mellitusGHB Glycosylated hemoglobinHDL High density lipoproteinLDL Low density lipoproteinPLGA Poly(lactic-co-glycolic) acidSA Sodium arseniteIn InsulinNIn Nano-insulinGSH GlutathionePPAR Peroxisome-proliferator-activator-receptorIRS Insulin receptor substrateGLUT Glucose transporterUCP Uncoupler proteinATP Adenosine triphosphateADP Adenosine diphosphateCa2+ Calcium ionK+ Potassium ionPI3-kinase Phosphatidyl-inositol-3-kinaseiAs Arsenic induced hyperglycemiaMMP Mitochondrial membrane potentialRT-PCR Reverse transcriptase polymerase chain reactionCMP Cell membrane potentialGK GlucokinasePK Pyruvate kinaseFTIR Fourier transform infrared spectroscopySEM Scanning electron microscopyTEM Transmission electron microscopyAFM Atomic force microscopyDLS Dynamic light scatteringELISA Enzyme linked immunosorbent assayDMEM Dulbecco's Modified Eagle's MediumBSA Bovine serum albuminBBB Blood–brain barrierCD Circular dichroism spectroscopy
Conflict of interest
None to declare.

72 A. Samadder et al. / Toxicology and Applied Pharmacology 267 (2013) 57–73
Acknowledgment
Grateful acknowledgements are made to Boiron Laboratory, Lyon,France, for financial grant provided to Prof. A.R. Khuda Bukhsh.Sincere thanks are also due to Dr. Mamata Chawla Sarkar andMr. Parikshit Bagchi, Department of Virology, NICED, Kolkata, Indiafor their scientific help by providing us instrument facility. Thanksare also due to Dr. Tarak Das Basu and Mr. Arijit Kumar Chatterjeeof the Department of Biochemistry and Biophysics, Dr. KumareshGhosh, Mr. Tanmoy Sarkar and Dr. Avik Ranjan Sarkar, Departmentof Chemistry, Kalyani University for facilitating instrument usage.We are grateful to Dr. T.C. Nag and Dr. Sandeep Arya, Department ofAnatomy, AIIMS, India for TEM.
Appendix A. Supplementary data
Supplementary data to this article can be found online at http://dx.doi.org/10.1016/j.taap.2012.12.018.
References
Anand, P., Nair, H.B., Sung, B., Kunnumakkara, A.B., Yadav, V.R., Tekmal, R.R., Aggarwal,B.B., 2009. Design of curcumin loaded PLGA nanoparticles formulation withenhanced cellular uptake, and increased bioactivity in vitro and superior bioavail-ability in vivo. Biochem. Pharmacol. 10217, 1–9.
Andrew, C., Cornish-Bowden, S., Cornish-Bowden, A., 1974. The kinetics of coupledenzyme reactions — applications to the assay of glucokinase, with glucose-6-phosphate-dehydrogenase as coupling enzyme. Biochem. J. 141, 205–209.
Ankola, D.D., Viswanad, B., Bhardwaj, V., Ramarao, P., Kumar, M.N., 2007. Developmentof potent oral nanoparticulate formulation of coenzyme Q10 for treatment of hy-pertension: can the simple nutritional supplements be used as first line therapeu-tic agents for prophylaxis/therapy? Eur. J. Pharm. Biopharm. 67, 361–369.
Banerjee, P., Biswas, S.J., Belon, P., Khuda-Bukhsh, A.R., 2007. A potentized homeopathicdrug, Arsenicum Album 200, can ameliorate genotoxicity induced by repeatedinjections of arsenic trioxide in mice. J. Vet. Med. A 54, 370–376.
Belon, P., Banerjee, P., Choudhury, S.C., Banerjee, A., Biswas, S.J., Karmakar, S.R., Pathak,S., Guha, B., Chatterjee, S., Bhattacharjee, N., Das, J.K., Khuda-Bukhsh, A.R., 2006.Can administration of potentized homeopathic remedy, Arsenicum album, alterantinuclear antibody (ANA) titer in people living in high-risk arsenic contaminatedareas? I. A correlation with certain hematological parameters. Evid. Based Comple-ment. Alternat. Med. 3, 99–107.
Bhattacharyya, S.S., Paul, S., Khuda-Bukhsh, A.R., 2010. Encapsulated plant extract(Gelsemium sempervirens) PLGA nanoparticles enhance cellular uptake andincrease bioactivity in vitro. Exp. Biol. Med. 235, 678–688.
Bhattacharyya, S.S., Paul, S., De, A., Das, D., Samadder, A., Boujedaini, N., Khuda-Bukhsh,A.R., 2011. Poly(lactide-co-glycolide) acid nanoencapsulation of a synthetic cou-marin: cytotoxicity and bio-distribution in mice, in cancer cell line and interactionwith calf thymus DNA as target. Toxicol. Appl. Pharmacol. 253, 270–281.
Biswas, S.J., Bhattacharyya, N., Khuda-Bukhsh, A.R., 2008. Efficacy of a plant extract(Chelidonium majus L.) in combating induced hepatocarcinogenesis in mice. FoodChem. Toxicol. 46, 1474–1487.
Biswas, R., Mandal, S.K., Dutta, S., Bhattacharyya, S.S., Boujedaini, N., Khuda-Bukhsh,A.R., 2010. Thujone-rich fraction of Thuja occidentalis demonstrates major anti-cancer potentials: evidences from in vitro studies on A375 cells. eCAM http://dx.doi.org/10.1093/ecam/neq042.
Bojunga, J., Nowak, D., Mitrou, P.S., Hoelzer, D., Zeuzem, S., Chow, K.U., 2004.Antioxidative treatment prevents activation of death-receptor- and mitochondrion-dependent apoptosis in the hearts of diabetic rats. Diabetologia 2072–2080.
Bucolo, G., David, H., 1973. Quantitative determination of serum triglycerides by theuse of enzymes. Clin. Chem. 19, 476–482.
Bunn, H.F., 1981. Evaluation of glycosylated hemoglobin in diabetic patients. Diabetes30, 613–617.
Burnette, W.N., 1981. “Western blotting”: electrophoretic transfer of proteins fromsodium dodecyl sulfate-polyacrylamide gels to unmodified nitrocellulose andradiographic detection with antibody and radio iodinated protein. Anal. Biochem.112, 195–203.
Chapman, M.J., 2007. Metabolic syndrome and type 2 diabetes: lipid and physiologicalconsequences. Diab. Vasc. Dis. Res. 4, S5–S8.
Cherrington, A.D., Sindelar, D., Edgerton, D., Steiner, K., McGuinness, O.P., 2002. Physio-logical consequences of phasic insulin release in the normal animal. Diabetes 51,S103–S108.
Das, S.C., 2009. Advanced Practical Chemistry, Inorganic Quantitative Analysis.Subhasis Das, pp. 268–273.
De Rosa, G., Larobina, D., La Rotonda, M.I., Musto, P., Quaglia, F., Ungaro, F., 2005. Howcyclodextrin incorporation affects the properties of protein-loaded PLGA-basedmicrospheres: the case of insulin/hydroxypropyl-beta-cyclodextrin system.J. Control. Release 102, 71–83.
Delnomdedieu, M., Basti, M.M., Styblo, M., Otvos, J.D., Thomas, D.J., 1994. Complexationof arsenic species in rabbit erythrocytes. Chem. Biol. Interact. 98, 69–83.
Dhiman, R., Kathania, M., Raje, M., Majumder, S., 2008. Inhibition of bf1-1/A1 by SiRNAinhibits mycobacterial growth in THF-1 cells by enhancing phagosomal acidifica-tion. Biochim. Biophys. Acta 1780, 733–742.
Diaz-Villasenor, A., Sanchez-Soto, M.C., Cebrian, M.E., Ostrosky-Wegman, P., Hiriart, M.,2006. Sodium arsenite impairs insulin secretion and transcription in pancreaticbeta-cells. Toxicol. Appl. Pharmacol. 214, 30–34.
Fessi, H., Puisieux, F., Devissaquet, J.P., Ammoury, N., Benita, S., 1989. Nanocapsule formationby interfacial polymer deposition following solvent displacement. Int. J. Pharm. 55, 1–4.
Frezza, C., Cipolat, S., Scorrano, L., 2007. Organelle isolation: functional mitochondriafrom mouse liver, muscle and cultured fibroblasts. Nat. Protoc. 2, 287–295.
Fröde, T.S., Medeiros, Y.S., 2008. Animal models to test drugs with potentialantidiabetic activity. J. Ethnopharmacol. 115, 173–183.
Gale, E.A., Gillespie, K.M., 2001. Diabetes and gender. Diabetologia 44, 3–15.Hasselbalch, S.G., Knudsen, G.M., Capaldo, B., Postiglione, A., Paulson, O.B., 2001. Blood–
brain barrier transport and brain metabolism of glucose during acute hyperglycemiain humans. J. Clin. Endocrinol. Metabol. 86, 1986–1990.
Ishmukhametov, R.R., Pond, J.B., Al-Huqail, A., Galkin, M.A., Vik, S.B., 2008. ATP synthesiswithout R210 of subunit a in the Escherichia coli ATP synthase. Biochim. Biophys. Acta1777, 32–38.
Izquierdo-Vega, J.A., Soto, C.A., Sanchez-Penta, L.C., De Vizcaya-Ruiz, A., Del Razo, L.M.,2006. Diabetogenic effects and pancreatic oxidative damage in rats subchronicallyexposed to arsenite. Toxicol. Lett. 160, 135–142.
Jaburek, M., Vareeha, M., Gimeno, R.E., Dembski, M., Jezek, P., Zhang, M., Burn, P.,Tartaglia, L.A., Garlid, K.D., 1999. Transport function and regulation of mitochondrialuncoupling protein 2 and 3. J. Biol. Chem. 274, 260003–260007.
Jones, F.T., 2007. A broad view of arsenic. Poult. Sci. 86, 2–14.Jones, C.F., Grainger, D.W., 2009. In vitro assessments of nanomaterial toxicity. Adv.
Drug Deliv. Rev. 61, 438–456.Kaplan, L.A., 1984. Carbohydrates and metabolite. Clin. Chem. 1032–1040.Kaplan, A., Lavernel, L.S., 1983. Lipid metabolism, Clinical Chemistry: Interpretations
and Techniques, 2nd ed. Lea and Febiger, Philadelphia, pp. 333–336.Karakoti, A.S., Hench, L.L., Seal, S., 2006. The potential toxicity of nanomaterials — the
role of surfaces. JOM 58, 77–82.Kelley, D.E., He, J., Menshikova, E.V., Ritov, V.B., 2002. Dysfunction of mitochondria in
human skeletal muscle in type 2 diabetes. Diabetes 51, 2944–2950.Khuda-Bukhsh, A.R., Bhattacharyya, S.S., Paul, S., Dutta, S., Boujedaini, N., Belon, P., 2011.
Modulation of signal proteins: a plausible mechanism to explain how a potentizeddrug Secale Cor 30C diluted beyond Avogadro's limit combats skin papilloma inmice. eCAM http://dx.doi.org/10.1093/ecam/nep084.
Kodama, S., Koike, C., Negishi, M., Yamamoto, Y., 2004. Nuclear receptors CAR and PXRcross talk with FOXO1 to regulate genes that encode drug-metabolizing andgluconeogenic enzymes. Mol. Cell. Biol. 24, 7931–7940.
Krauss, S., Zhang, C.Y., Scorrano, L., Dalgaard, L.T., St-Pierre, J., Grey, S.T., Lowell, B.B.,2003. Superoxide-mediated activation of uncoupling protein 2 causes pancreaticbeta cell dysfunction. J. Clin. Invest. 112, 1831–1842.
Lai, M.S., Hsueh, Y.M., Chen, C.J., Shyu, M.P., Chen, S.Y., Kuo, T.L., 1994. Ingested inorganicarsenic and prevalence of diabetes mellitus. Am. J. Epidemiol. 139, 484–492.
Le-Roith, D., Zick, Y., 2001. Recent advances in our understanding of insulin action andinsulin resistance. Diabetes Care 24, 588–597.
Liu, S., Okada, T., Assmann, A., Soto, J., Liew, C.W., Bugger, H., Shirihai, O.S., Abel, E.D.,Kulkarni, R.N., 2009. Insulin signaling regulates mitochondrial function in pancreaticb-cells. PLoS One 4 (11), e7983 http://dx.doi.org/10.1371/journal.pone.0007983.
Longnecker, M.P., Daniels, J.L., 2001. Environmental contaminants as etiologic factorsfor diabetes. Environ. Health Perspect. 109, 871–876.
Maechler, P., Woheim, C.B., 2001. Mitochondrial function in normal and diabetic ß-cells.Nature 414, 807–812.
Manna, P., Sinha, M., Sil, P.C., 2008. Arsenic-induced oxidative myocardial injury:protective role of arjunolic acid. Arch. Toxicol. 82, 137–149.
Massague, J., Pilch, P.F., Czech, M.P., 1980. Electrophoretic resolution of three major insulin re-ceptor structureswith unique subunit stoichiometries. Proc. Natl. Acad. Sci. 77, 7137–7141.
Mazurek, S., Grimm, H., Boschek, C.B., Vaupel, P., Eigenbrodt, E., 2002. Pyruvate kinasetype M2: a crossroad in the tumor metabolome. Br. J. Nutr. 87, 23–29.
Navas-Acien, A., Silbergeld, E.K., Streeter, R.A., Clark, J.M., Burke, T.A., Guallar, E., 2006.Arsenic exposure and Type 2 diabetes: a systemic review of experimental andepidemiological evidence. Environ. Health Perspect. 114, 641–648.
Panja, S., Saha, S., Jana, B., Basu, T., 2006. Role of membrane potential on artificial transfor-mation of E. coli with plasmid DNA. J. Biotechnol. 127, 14–20.
Parat, A., Danicher, L., Frère, Y., Reix, N., Seyfritz, E., Sigrist, S., 2009. Double encapsula-tion of insulin: a new pharmaceutical vector for oral route. XVIIth InternationalConference on Bioencapsulation, Groningen, The Netherlands.
Paul, D.S., Harmon, A.W., Devesa, V., Thomas, D.J., Styblo, M., 2007. Molecular mecha-nisms of diabetogenic effects of arsenic:inhibition of insulin signaling by arseniteand methylarsonous acid. Environ. Health Perspect. 115, 734–742.
Paul, P., Bhattacharyya, S.S., Samaddar, A., Boujedaini, N., Khuda-Bukhsh, A.R., 2011.Anticancer potentials of root extract of Polygala senega against benzo[a] pyrene-induced lung cancer in mice. J. Chin. Integr. Med. 9, 320–327.
Rahban, M., Divsalar, A., Saboury, A.A., Golestani, A., 2010. Nanotoxicity and spectroscopystudies of silver nanoparticles: calf thymus DNA and K562 as targets. J. Phys. Chem.114, 5798–5803.
Ratha, J., Majumder, K.N., Mandal, S.K., Bera, R., Sarkar, C., Saha, B., Mandal, C., Saha,K.D., Bhadra, R., 2006. A sphingolipid rich lipid fraction isolated from attenuateddonovani promastigote induces apoptosis in mouse and human melanoma cellsin vitro. Mol. Cell. Biochem. 290, 113–123.
Rosen, B.P., 2002. Biochemistry of arsenic detoxification. FEBS Lett. 529, 86–92.Samadder, A., Chakraborty, D., De, A., Bhattacharyya, S.S., Bhadra, K., Khuda-Bukhsh, A.R.,
2011. Possible signaling cascades involved in attenuation of alloxan-induced oxidative

73A. Samadder et al. / Toxicology and Applied Pharmacology 267 (2013) 57–73
stress and hyperglycemia in mice by ethanolic extract of Syzygium jambolanum: drug-DNA interaction with calf thymus DNA as target. Eur. J. Pharm. Sci. 44, 207–217.
Samadder, A., Das, J., Das, S., Das, D., De, A., Bhadra, K., Khuda-Bukhsh, A.R., 2012.Dihydroxy-isosteviol methyl ester of Pulsatilla nigricans extract reduces arsenic-induced DNA damage in testis cells of male mice: its toxicity, drug-DNA interactionand signalling cascades. Zhong Xi Yi Jie He Xue Bao 10, 1433–1442.
Schafer, Z.T., Grassian, A.R., Song, L., Jiang, Z., Hines, Z.G., Irie, H.Y., Gao, S., Puigserver, P.,Brugge, J.S., 2009. Antioxidant and oncogene rescue of metabolic defects caused byloss of matrix attachment. Nature 461, 109–113.
Sinha, M., Manna, P., Sil, P.C., 2008. Protective effect of arjunolic acid against arsenicinduced oxidative stress in mouse brain. J. Biochem. Mol. Toxicol. 22, 15–26.
Smelt, M.J., Faas, M.M., de Haan, B.J., de Vos, P., 2008. Pancreatic beta-cell purificationby altering FAD and NAD (P)H metabolism. Exp. Diabetes Res. http://dx.doi.org/10.1155/2008/165360.
Tseng, C.H., 2004. The potential biological mechanisms of arsenic induced diabetesmellitus. Toxicol. Appl. Pharmacol. 197, 67–83.
Vahter, M., Åkesson, A., Lidén, C., Seccatelli, S., Berglund, M., 2007. Gender differencesin the disposition and toxicity of metals. Environ. Res. 104, 85–95.
Weissenböck, A., Wirth, M., Gabor, F., 2004. WGA-grafted PLGA-nanospheres: preparationand association with Caco-2 single cells. J. Control. Release 99, 383–392.
Wullschleger, S., Wasserman, D.H., Gray, A., Sakamoto, K., Alessi, D.R., 2011. Role of TAPP1and TAPP2 adaptors binding to PtdIns(3,4)P2 in regulating insulin sensitivity definedby knock-in analysis. Biochem. J. 434, 265–274.
Zheng, J., He, J., Ji, B., Li, Y., Zhang, X., 2007. Antihyperglycemic activity of Prunellavulgaris L. in streptozotocin-induced diabetic mice. Asia Pac. J. Clin. Nutr. 16,427–431.
Zimmet, P., Alberti, K.G., Shaw, J., 2001. Global and societal implications of the diabetesepidemic. Nature 414, 782–787.