Polyethylene & PET Outlook - Blow Molding · PDF filePolyethylene & PET Outlook Howard...
46
Polyethylene & PET Outlook Howard Rappaport Senior Director, Chemicals IHS Global Insight – Price & Purchasing October, 2012 28th Annual Blow Molding Conference
Transcript of Polyethylene & PET Outlook - Blow Molding · PDF filePolyethylene & PET Outlook Howard...

Polyethylene & PETOutlook
Howard RappaportSenior Director, ChemicalsIHS Global Insight – Price & PurchasingOctober, 2012
28th Annual Blow Molding Conference

© 2012, IHS Inc. No portion of this presentation may be reproduced, reused, or otherwise distributed in any form without prior written consent.
IHS – A leading information provider
We are over 5,600 people, in 40 countries, speaking 50 languages – all working each day to:
• Serve businesses and all levels of governments worldwide• Ranging from 80% of Global Fortune 500 to small businesses• Customers in 180 countries
• Provide comprehensive content, software and expert analysis and forecasts
Helping our customers drive critical processes and make high-impact decisions with speed and confidence
2
© 2012, IHS Inc. No portion of this presentation may be reproduced, reused, or otherwise distributed in any form without prior written consent.
IHS Capabilities
3
• Bringing content and expertise in pivotal areas that shape today’s business landscape
Areas of Expertise & Content

© 2012, IHS Inc. No portion of this presentation may be reproduced, reused, or otherwise distributed in any form without prior written consent.
IHS ChemicalIHS Chemical
CMAI + SRIC + HARRIMAN + CHEMICAL WEEK
IHS has brought together four strategic brands to create an unrivalled chemical industry offering...

© 2012, IHS Inc. No portion of this presentation may be reproduced, reused, or otherwise distributed in any form without prior written consent.
Transportation
Aerospace & Defense
Agriculture
Construction
Shipping
Electronics & Telecom
Government
Metals & Mining
Healthcare
Power & Utilities
Financial
Military & Security
EnergyOil & Gas
Consumer & Retail
IHS Chemical
Automotive
IHS Chemical
IHS Chemical Capabilities

© 2012, IHS Inc. No portion of this presentation may be reproduced, reused, or otherwise distributed in any form without prior written consent.
The IHS Chemical Portfolio
News & Events
Chemical Week
Magazine
Chemicals Events
Daily News & Information
Services
Market Services
Aromatics & Fibers
Olefins & Derivatives
Chlor-Alkali & Vinyls
Plastics & Polymers
Methanol & Derivatives
Planning & Company Services
Chemical Economics Handbook
Specialty Chemicals
World Analysis
Directory of Chemical Producers
China Report
Special Studies
Technology Services
Process Economics Program
Carbon Footprint
Special Studies
Consulting Services
Strategy
Commercial Analysis
Transaction
Technology
Renewables
Legal Services

© 2012, IHS Inc. No portion of this presentation may be reproduced, reused, or otherwise distributed in any form without prior written consent.
Center of the industry has shifted to Asia
Economic Expansion: Basic demand to fast
growth emerging economies is evident
Investment Decisions:Two Options: Produce in
demand centers or leverage a clear cost
advantage
Tomorrow’s Market:Sustainability includes a systematic addition of performance products
0%10%20%30%40%50%60%70%80%90%
100%
1990 1995 2000 2005 2010 2015 2020
W. EuropeMiddle East
All Others
Other Asia
China
N. America
Basic Chemicals and PlasticsDistribution of Global Demand
Basic Chemicals & Plastics Demand Distribution is Shifting

© 2012, IHS Inc. No portion of this presentation may be reproduced, reused, or otherwise distributed in any form without prior written consent.
NaturalGas
GasSeparation
Unit
RefineryCrudeOil
Reformer
Reformate BTXExtraction
SteamCracker
ButaneHydrogen
PropylenePygas
BTX
Raffinate
EthyleneEO/EG
POLYETHYLENE
ETHYLENE DICHLORIDE / PVC
EP RUBBER
ETHANOL
NaphthaGas Oil
EthanePropaneButane
TOLUENE
m-XYLENEp-XYLENE
BENZENE
o-XYLENE
XYLENES
PTA/DMT PET
PIA
PAN/DOP/Plasticizers
POLYPROPYLENE
Butadiene
MethanolSBR / PBR
ETHYLBENZENE/STYRENE
Crude Oil & Natural GasBuilding Blocks for the Industry

© 2012, IHS Inc. No portion of this presentation may be reproduced, reused, or otherwise distributed in any form without prior written consent.
0%
10%
20%
30%
40%
50%
60%
0
2
4
6
8
10
12
14
16
18
07 08 09 10 11 12 13 14 15 16 17 Crude (WTI) Natural Gas Gas as % of Crude
Dollars Per MMBtu Gas as a% of Crude, BTU Basis
North America Energy Price Trends

© 2012, IHS Inc. No portion of this presentation may be reproduced, reused, or otherwise distributed in any form without prior written consent.
0
2
4
6
8
10
0
40
80
120
160
200
07 08 09 10 11 12 13 14 15 16 17 Natural Gas Ethane Propane N-Butane
Gas Liquids, Cents Per Gallon Natural Gas, $/MMbtu
U.S. Natural Gas Liquids Price

© 2012, IHS Inc. No portion of this presentation may be reproduced, reused, or otherwise distributed in any form without prior written consent.
U.S. AverageMDE Avg.
Alberta Ethane
U.S. EthaneMDE
Ethane
West Europe Avg.
NE Asia Avg.SE Asia Avg.
50
250
450
650
850
1050
1250
1450
1650
0 20 40 60 80 100 120 140 160
(Dollars per Ton)
CUMULATIVE ETHYLENE CAPACITY (million tons)
2012 Ethylene Cost Curve
WTI Crude $94/Barrel Nat Gas $3.16/MMBtuEthane 35.3 cpg

© 2012, IHS Inc. No portion of this presentation may be reproduced, reused, or otherwise distributed in any form without prior written consent.
What Does Shale Gas Development Do?Increasing NGL supplies within North America
0
500
1,000
1,500
2,000
2,500
3,000
3,500
2005 2010 2015 2020 2025 2030
Ethane
Propane
n-Butane
i-ButaneNatural Gasoline
Barrels Per Day

© 2012, IHS Inc. No portion of this presentation may be reproduced, reused, or otherwise distributed in any form without prior written consent.
North American Feedslate Becoming Lighter
• Given its high selectivity to ethylene & relative cost position to other feeds, ethane is consistently the most favored feed
• Once oil & gas began to diverge, producers have been shifting feedslates lighter to capitalize on the advantage
13
0%
10%
20%
30%
40%
50%
60%
70%
80%
90%
100%
2003 2004 2005 2006 2007 2008 2009 2010 2011 2012 2013
Monthly Ethylene ProductionBy Feedstock
Ethane Propane Butane Naphtha Gas Oil
Wt% ProducedFrom Feedstock

© 2012, IHS Inc. No portion of this presentation may be reproduced, reused, or otherwise distributed in any form without prior written consent. 14
2012 U.S. Ethylene Production Losses (With Forecast)
0.0
0.5
1.0
1.5
2.0
2.5
3.0
3.5
0.0
0.2
0.4
0.6
0.8
1.0
1.2
Jan Feb Mar Apr May Jun Jul Aug Sep Oct Nov DecUnconfirmed Unplanned**'11 Cumulative Production Loss Forecast '13 Cumulative Production LossSeries4
* Includes both confirmed and unconfirmed outages **Forecast period assumes a forecast of unplanned outages
Million Pounds, Monthly Million Pounds, Cumulative
© 2012, IHS Inc. No portion of this presentation may be reproduced, reused, or otherwise distributed in any form without prior written consent.
15•Dow, Shell, NOVA, and Oxy capacity additions shown are CMAI estimates
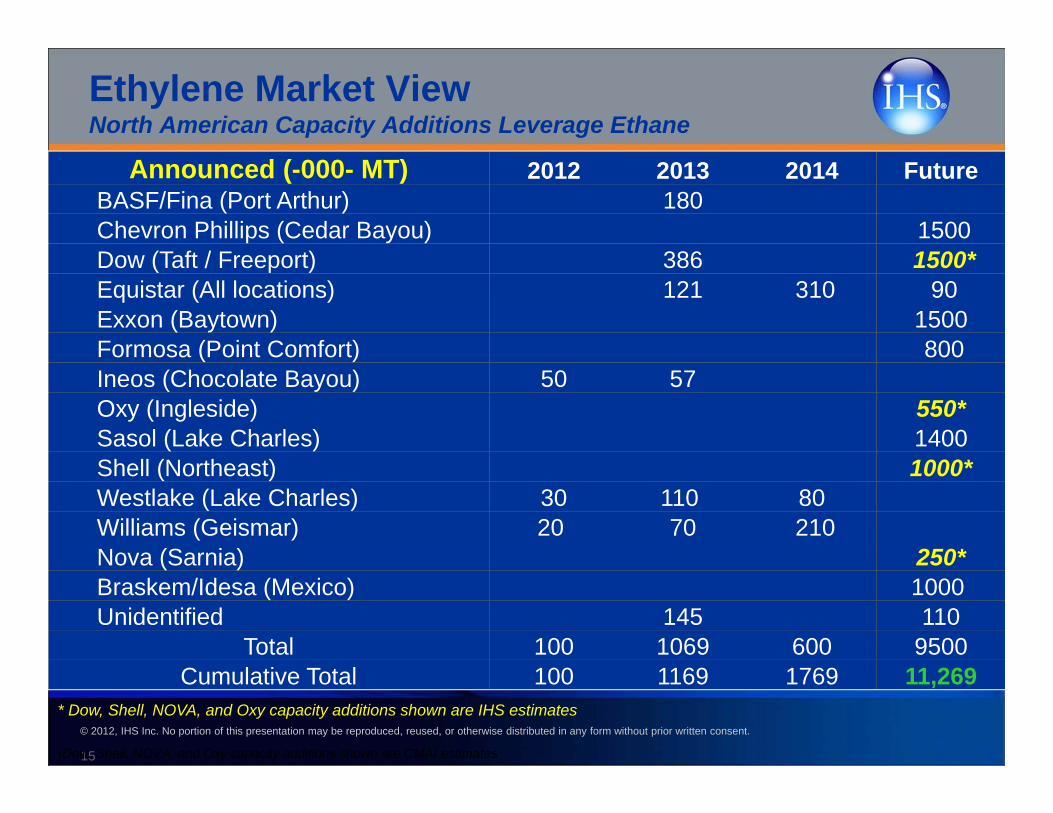
Announced (-000- MT) 2012 2013 2014 FutureBASF/Fina (Port Arthur) 180Chevron Phillips (Cedar Bayou) 1500Dow (Taft / Freeport) 386 1500*Equistar (All locations) 121 310 90Exxon (Baytown) 1500Formosa (Point Comfort) 800Ineos (Chocolate Bayou) 50 57Oxy (Ingleside) 550*Sasol (Lake Charles) 1400Shell (Northeast) 1000*Westlake (Lake Charles) 30 110 80Williams (Geismar) 20 70 210Nova (Sarnia) 250*Braskem/Idesa (Mexico) 1000Unidentified 145 110
Total 100 1069 600 9500Cumulative Total 100 1169 1769 11,269
* Dow, Shell, NOVA, and Oxy capacity additions shown are IHS estimates
Ethylene Market ViewNorth American Capacity Additions Leverage Ethane

© 2012, IHS Inc. No portion of this presentation may be reproduced, reused, or otherwise distributed in any form without prior written consent. 16
Global Annual Feedstock Cash Margins
-200
0
200
400
600
800
1,000
00 01 02 03 04 05 06 07 08 09 10 11 12 13 14 15 16 17U.S. Ethane U.S. Integrated Lt. NaphthaWEP Naphtha Discounted Price SEA NaphthaU.S. Weighted Average
Dollars Per Metric Ton

© 2012, IHS Inc. No portion of this presentation may be reproduced, reused, or otherwise distributed in any form without prior written consent.
Ethylene Market View Global Net Ethylene Capacity
Million Tons, Ethylene Capacity Growth (Bars) or Demand Growth (Line)
17
-8-6-4-202468
1012
2000 2002 2004 2006 2008 2010 2012 2014 2016Americas Europes/CIS/BalticsMiddle East/Africa AsiaChange in World Demand

© 2012, IHS Inc. No portion of this presentation may be reproduced, reused, or otherwise distributed in any form without prior written consent.
• Shale development has enabled the North American producer to become one of the lowest cost producers in the world
• Combined with the Middle East, over 40% of the global ethylene capacity is now cost advantaged
• Other cracking capacity likely to trend towards increased LPG consumption in order to try and remain competitive
• Higher cost countries may respond with protectionist measures
Ethylene Market ViewDevelopment of two low production cost regions
*
*

Polyethylene

© 2012, IHS Inc. No portion of this presentation may be reproduced, reused, or otherwise distributed in any form without prior written consent.
%: 12-17 Average Annual Growth Rate
Domestic Demand by Region
0.0 10.0 20.0 30.0 40.0
ISC
SAM
SEA
AFR/MDE
NAM
EUR
NEA
20122017
Demand by Region, Million Metric Tons
2.7%
8.5%
5.0%
4.9%
6.2%
2.4%
6.0% 2012-2017 Average Annual
Growth Rate, Total Demand: 4.7%
20122017

© 2012, IHS Inc. No portion of this presentation may be reproduced, reused, or otherwise distributed in any form without prior written consent.
Capacity, Million Metric Tons0 5 10 15 20 25 30 35 40 45 50 55 60 65
2017
2012
2007
LDPE LLDPE HDPE
Global Production Capacity Growth
Total:77.8
Total:94.3
Total:120
AAGR 12-17LDPE = +17.8%
LLDPE = +34.2%HDPE = +27.4%

© 2012, IHS Inc. No portion of this presentation may be reproduced, reused, or otherwise distributed in any form without prior written consent.
%: 12-17 Average Annual Growth Rate
World Consumption by End Use
0.0 10.0 20.0 30.0 40.0 50.0 60.0
Film & Sheet
Injection Molding
Pipe & Profile
Extrusion Coating
Blow Molding
Wire & Cable
Rotomolding
Fiber
Raffia
Other20122017
5.0%
5.0%
5.7%
3.0%
4.6%
3.4%
5.0%
6.0%
4.5%
2.6%
2012-2017 Average Annual
Growth Rate, Total Demand: 4.7%

© 2012, IHS Inc. No portion of this presentation may be reproduced, reused, or otherwise distributed in any form without prior written consent. 23
North America New PE ProjectsCompany Location Country LDPE LLDPE HDPE Startup Type
2014-2015Equistar LaPorte, TX United States 300 Q1 2014 Hypo (1)Equistar Morris, IL United States 50 Q1 2014 Hypo (1)Nova Sarnia Canada 100 Q1 2015 Hypo
2016Braskem Idesa Coatzacoalcos Mexico 300 750 Q1 2016 (1)Nova Joffre Canada 250 Q1 2016 Hypo (1)Formosa Point Comfort, TX United States 300 Q4 2016 (1)ExxonMobil Mont Belvieu, TX United States 650 650 Q3 2016 (1)
2017Dow Gulf Coast United States 550 650 Q3 2017 HypoCPChem Sweeny, TX United States 500 500 Q3 2017 (1)
2018-2019Nova Sarnia Canada 350 Q3 2018 Hypo (1)Sasol Gulf Coast United States 500 500 Q3 2018 HypoShell Marcellus, United States 500 500 Q3 2019 HypoTotals, 000's MT 1050 3300 3550 7900Notes: (1): Announced projects included in our capacity database; (2): Announced expansions with IHS estimate of product and size, also not included in database; Hypo (1): reported projects not fully verifiedor approved and not included in the database; Hypo: IHS estimates of product and size for announced ethylene crackers - PE not in database.

© 2012, IHS Inc. No portion of this presentation may be reproduced, reused, or otherwise distributed in any form without prior written consent.
-4.0
-2.0
0.0
2.0
4.0
6.0
8.0
10.0
2007 2008 2009 2010 2011 2012 2013 2014 2015 2016 2017Asia/Pacific Africa/ Middle EastNorth America South AmericaCentral Europe/ CIS West EuropeGlobal Demand Change
Capacity, Million Metric Tons
Global Polyethylene Capacity Additions
Global Capacity AAGR 12-17: 4.9%Global Demand AAGR 12-17: 4.7%

© 2012, IHS Inc. No portion of this presentation may be reproduced, reused, or otherwise distributed in any form without prior written consent.
PE: North America Current Situation
• Domestic demand is positive by 2.6% through August• Export volumes are negative by 3.5% YTD. • Total demand is higher versus 2011 YTD by 1.2%• Domestic / total demand has been trending higher since April
low point due to increased production capacity, lower prices, and restocking.
• Export volumes averaging about 700 million pounds per month = 22% of total through August. Exports as a % of production about 5% below 2011 level, and avg monthly shipments are about 25 million pounds lower than 2011 YTD.
• We expect demand to continue on the recent track and forecast total 2012 demand to approximate 2011 levels. 2013 growth slightly below GDP levels

© 2012, IHS Inc. No portion of this presentation may be reproduced, reused, or otherwise distributed in any form without prior written consent. 26
PE Demand: U.S. and Canada
0.0
0.5
1.0
1.5
2.0
2.5
3.0
3.5
4.0
Jan-10 May-10 Sep-10 Jan-11 May-11 Sep-11 Jan-12 May-12TotPE Domestic Demand TotPE Exports
Million Metric Tons
Total Demand = 37.4 MMT Total Demand = 38.2 MMT YTD Demand = 25.7 MMTAnnualized = 38.6 MMT
28.4 + 9.0 = 37.4 MMT 29.5 + 8.7 = 38.2 MMT 20.1 + 5.6 = 25.7 MMT30.1 + 8.5 = 38.6 MMT

© 2012, IHS Inc. No portion of this presentation may be reproduced, reused, or otherwise distributed in any form without prior written consent. 27
0
10
20
30
40
50
60
70
0
20
40
60
80
100
120
140
Jan-06 Jan-07 Jan-08 Jan-09 Jan-10 Jan-11 Jan-12Daily Demand Days Inventory
Million Pounds Days Inventory
U.S. & Canada PE Resin Producer Inventory

© 2012, IHS Inc. No portion of this presentation may be reproduced, reused, or otherwise distributed in any form without prior written consent. 28
0102030405060708090
100
Jan-07 Nov-07 Sep-08 Jul-09 May-10 Mar-11 Jan-12 Nov-12 Sep-13NAM Cash Cost, Integrated NAM LLDPEWEP LLDPE CHINA LLDPE (Spot)
Cents Per Pound
Regional LLDPE Butene Prices

© 2012, IHS Inc. No portion of this presentation may be reproduced, reused, or otherwise distributed in any form without prior written consent. 29
Polyethylene Chain Margins
-220
0
220
440
660
880
-10
0
10
20
30
40
2007 2008 2009 2010 2011 2012 2013 2014 2015 2016 2017
PE Margin - Contract HDPE Blow Molding Non-Int. Including DiscountsEthylene Margin - Average Acquisition Ethylene Price Minus Ethane Cracking Costs
Cents Per Pound, Polyethylene Dollars Per Metric Ton

© 2012, IHS Inc. No portion of this presentation may be reproduced, reused, or otherwise distributed in any form without prior written consent.
• Global demand growth exceeds GDP growth with particular strength in Asia and Latin America
• Domestic demand growth in developed economies continues to lag GDP
• Significant capacity additions forthcoming in North America as producers leverage shale based economics
• Primary threats to margin growth are continued weakness in the global economy and longer term the start up of new capacity in U.S. and MDE
• Environmental issues curtail growth for HDPE HMW applications but “green” PE demand growth remains attractive.
• M LLDPE resins represent superior demand and margin growth opportunities
30
PE Summary

Polyester Chain Market Review
© 2012, IHS Inc. No portion of this presentation may be reproduced, reused, or otherwise distributed in any form without prior written consent.
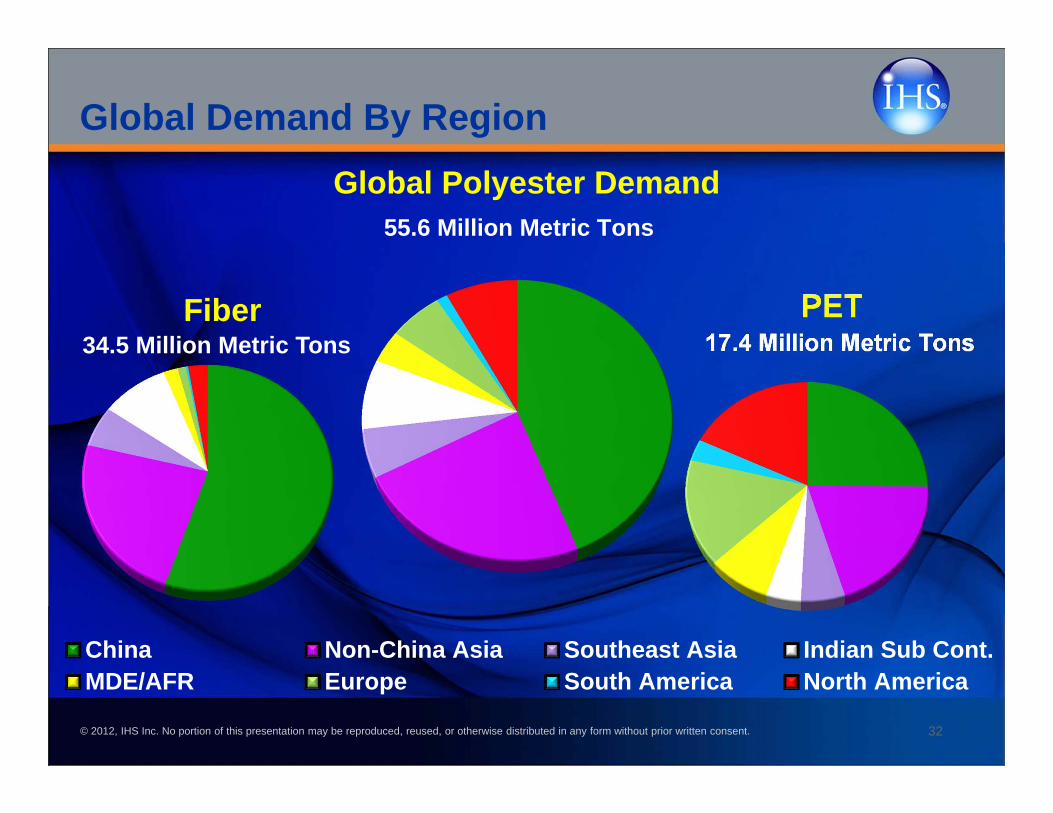
Global Polyester Demand
China Non-China Asia Southeast Asia Indian Sub Cont.MDE/AFR Europe South America North America
55.6 Million Metric Tons
PET17.4 Million Metric Tons
32
Global Demand By Region
Fiber34.5 Million Metric Tons

© 2012, IHS Inc. No portion of this presentation may be reproduced, reused, or otherwise distributed in any form without prior written consent. 33
World Polyester Demand Growth By Product
-3,000
-2,000
-1,000
0
1,000
2,000
3,000
4,000
5,000
6,000
2007 2008 2009 2010 2011 2012 2013 2014 2015 2016 2017
Filament Staple Fiber PET Packaging
Thousand Metric Tons
© 2012, IHS Inc. No portion of this presentation may be reproduced, reused, or otherwise distributed in any form without prior written consent. 34
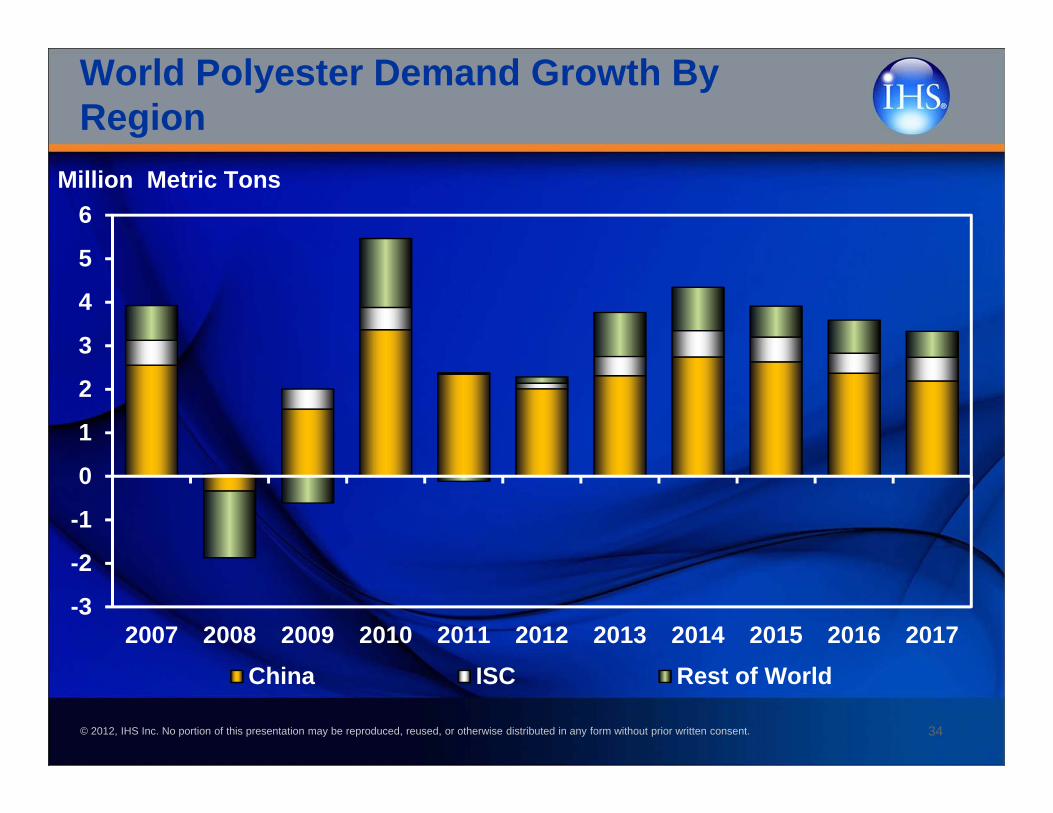
World Polyester Demand Growth By Region
-3
-2
-1
0
1
2
3
4
5
6
2007 2008 2009 2010 2011 2012 2013 2014 2015 2016 2017China ISC Rest of World
Million Metric Tons

© 2012, IHS Inc. No portion of this presentation may be reproduced, reused, or otherwise distributed in any form without prior written consent. 35
Polyester Raw Materials

© 2012, IHS Inc. No portion of this presentation may be reproduced, reused, or otherwise distributed in any form without prior written consent. 36
Refineries Are Built to Make Fuel! PET Must Buy Away Its Feedstocks
NaturalGas
GasSeparation
Unit
RefineryCrude
OilReformer
Reformate BTXExtraction
SteamCracker
ButaneHydrogen
Propylene/PP
BTX
Ethylene
ETHYLENE GLYCOL
POLYETHYLENES
ETHYLBENZENE/STYRENE
ETHYLENE DICHLORIDE/PVC
NaphthaGas OilEthanePropaneButane
TOLUENE
m-XYLENE
p-XYLENE
BENZENE
o-XYLENE
XYLENES
PTA/DMT PET
PIA
Methane
Gasoline
Heating Fuel
© 2012, IHS Inc. No portion of this presentation may be reproduced, reused, or otherwise distributed in any form without prior written consent. 37
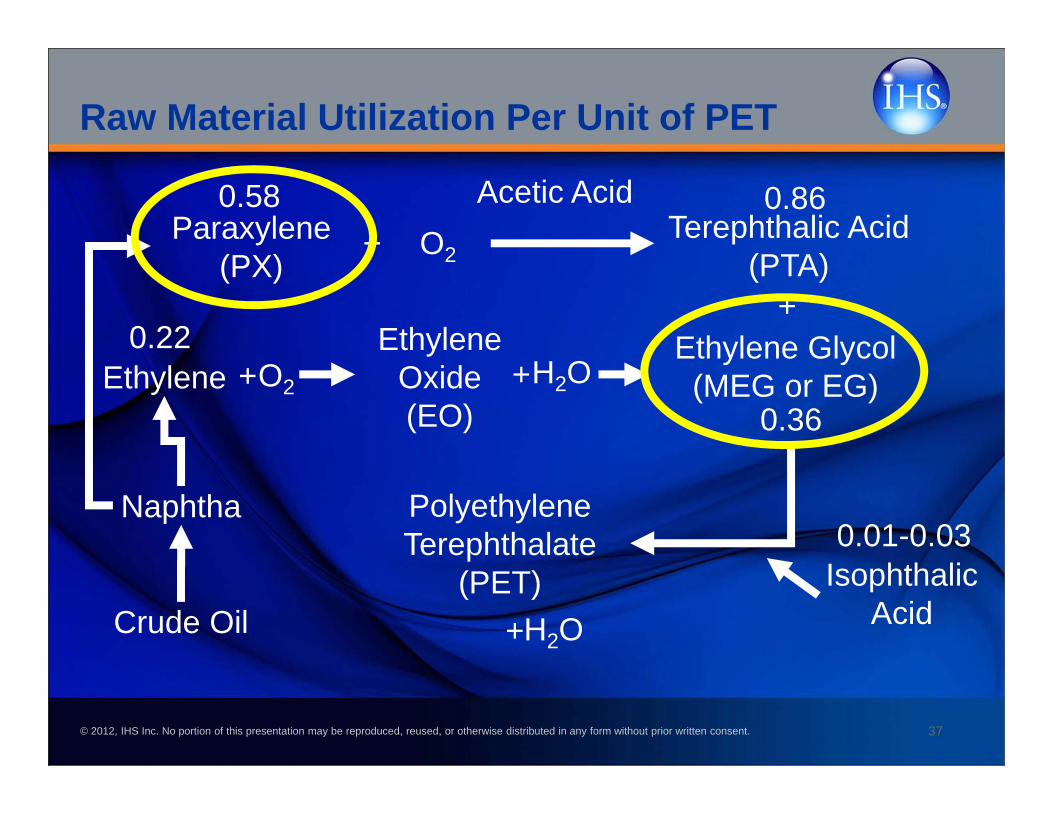
Raw Material Utilization Per Unit of PET
+Ethylene Glycol
(MEG or EG)0.36
Ethylene0.22
O2+ +H2OEthylene
Oxide(EO)
Paraxylene (PX)
0.58O2
Terephthalic Acid (PTA)
+0.86Acetic Acid
Polyethylene Terephthalate
(PET)+H2O
Isophthalic Acid
0.01-0.03Naphtha
Crude Oil

© 2012, IHS Inc. No portion of this presentation may be reproduced, reused, or otherwise distributed in any form without prior written consent. 38
Global PX Capacity Growth
60
65
70
75
80
85
90
95
-4-202468
10121416
2007 2008 2009 2010 2011 2012 2013 2014 2015 2016 2017
Asia Europe, Middle East, AfricaAmericas Global Demand GrowthExcess Capacity Operating Rate
Million Metric Tons Operating Rate, Percent
© 2012, IHS Inc. No portion of this presentation may be reproduced, reused, or otherwise distributed in any form without prior written consent. 39
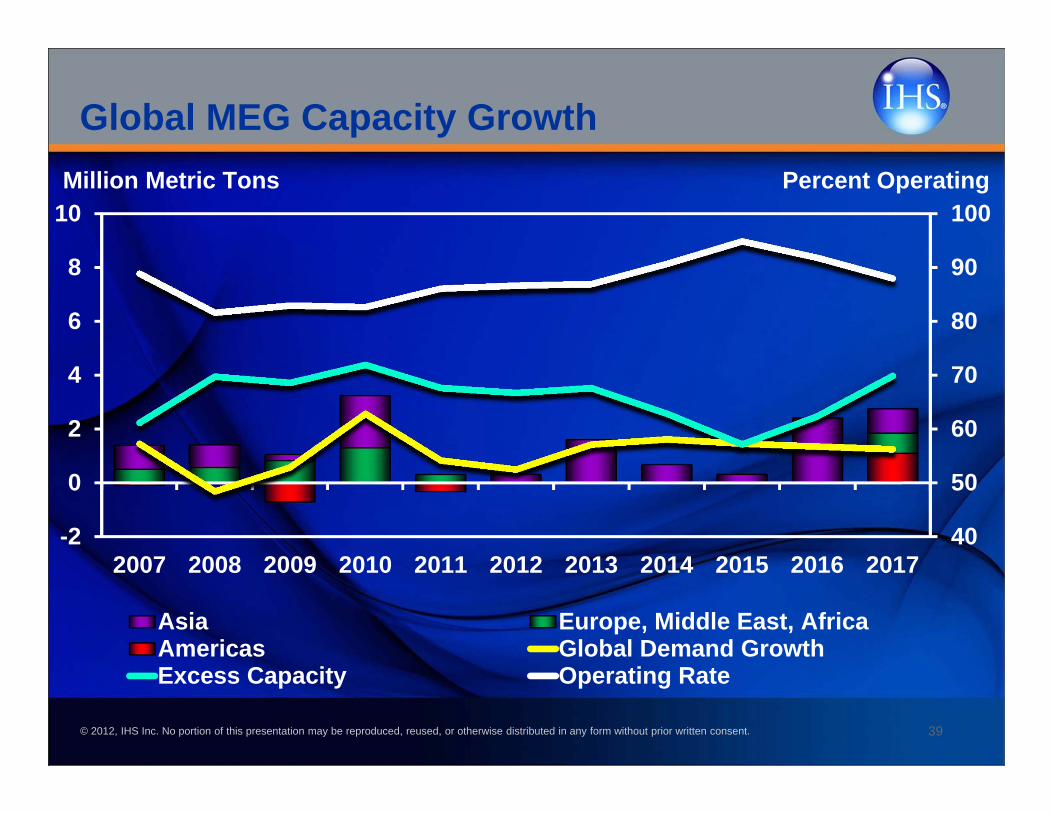
Global MEG Capacity Growth
40
50
60
70
80
90
100
-2
0
2
4
6
8
10
2007 2008 2009 2010 2011 2012 2013 2014 2015 2016 2017
Asia Europe, Middle East, AfricaAmericas Global Demand GrowthExcess Capacity Operating Rate
Million Metric Tons Percent Operating

© 2012, IHS Inc. No portion of this presentation may be reproduced, reused, or otherwise distributed in any form without prior written consent. 40
Global PTA Capacity Growth
50556065707580859095100
-5
0
5
10
15
20
25
2007 2008 2009 2010 2011 2012 2013 2014 2015 2016 2017Americas Europe, Middle East, AfricaAsia Global Demand GrowthExcess Capacity Operating Rate
Million Metric Tons Operating Rate, Percent
© 2012, IHS Inc. No portion of this presentation may be reproduced, reused, or otherwise distributed in any form without prior written consent. 41
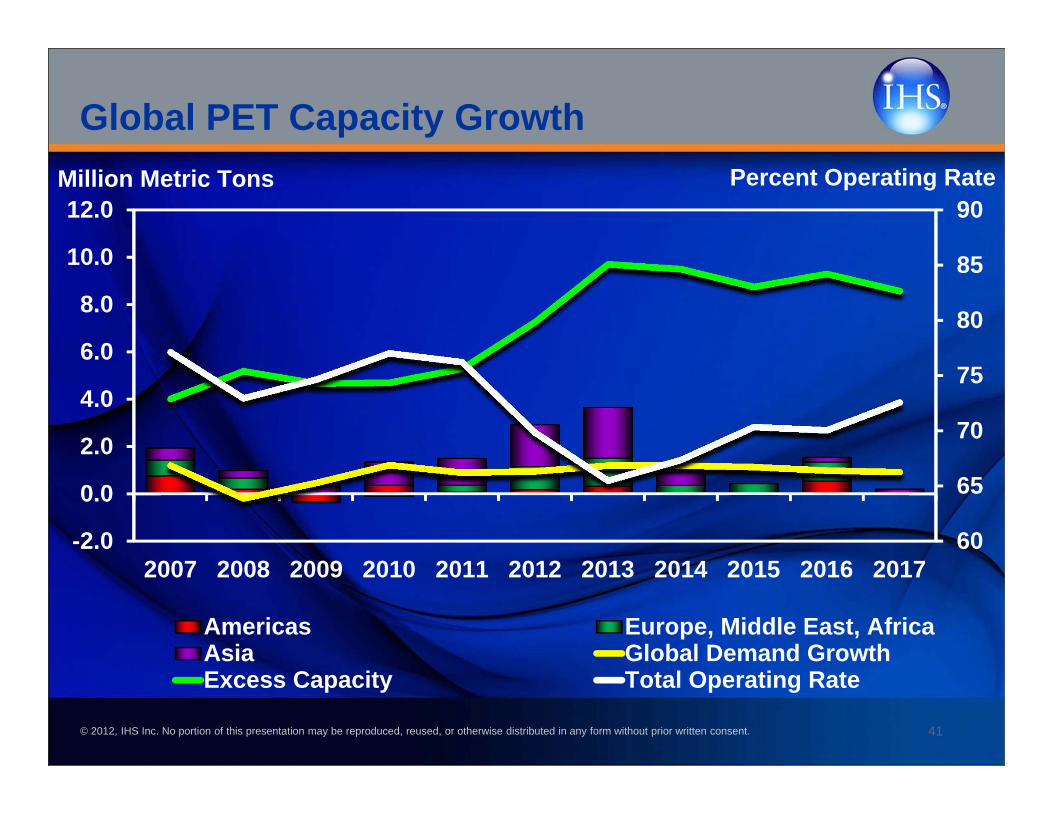
Global PET Capacity Growth
60
65
70
75
80
85
90
-2.0
0.0
2.0
4.0
6.0
8.0
10.0
12.0
2007 2008 2009 2010 2011 2012 2013 2014 2015 2016 2017
Americas Europe, Middle East, AfricaAsia Global Demand GrowthExcess Capacity Total Operating Rate
Million Metric Tons Percent Operating Rate

© 2012, IHS Inc. No portion of this presentation may be reproduced, reused, or otherwise distributed in any form without prior written consent.
30
40
50
60
70
80
90
100
-1
0
1
2
3
4
5
6
2007 2008 2009 2010 2011 2012 2013 2014 2015 2016 2017
U.S. Mexico Canada Net Exports Capacity Op. Rate
Million Metric Tons Percent Operating Rate
North America PET Demand

© 2012, IHS Inc. No portion of this presentation may be reproduced, reused, or otherwise distributed in any form without prior written consent.
14%
14%
19%9% 3%
9%
17%
15%
2010/2011Pre-Consolidation
DAK Indorama M&G Nan Ya Selenis Wellman Invista Eastman
Total Capacity = 4635 Million Metric Tons
North American PET Consolidation

© 2012, IHS Inc. No portion of this presentation may be reproduced, reused, or otherwise distributed in any form without prior written consent.
32%26%
33%7% 2%
DAK Indorama M&G Nan Ya Selenis
2014 North American PET Capacity

© 2012, IHS Inc. No portion of this presentation may be reproduced, reused, or otherwise distributed in any form without prior written consent.
0102030405060708090
100
Jan-06 Jan-07 Jan-08 Jan-09 Jan-10 Jan-11 Jan-12 Jan-13
Crude PX Comp PTA Comp MEG Comp PET Spread R/C Frt
Cents Per Pound
PET – U.S. Component CostsNet Costs – Total Equals PET Price

© 2012, IHS Inc. No portion of this presentation may be reproduced, reused, or otherwise distributed in any form without prior written consent.