Política fiscal, desigualdad y pobreza: Paraguay en un contexto … · Política fiscal,...
41
Política fiscal, desigualdad y pobreza: Paraguay en un contexto comparativo Nora Lustig Profesora Samuel Z. Stone y Directora del Instituto CEQ Universidad de Tulane Fellow no residente de Center for Global Development, Diálogo Interamericano y UNU-WIDER EFICIENCIA,EQUIDAD YSOSTENIBILIDAD FISCAL EN UN CONTEXTO DE VOLATILIDAD Y CAMBIO ESTRUCTURALES Banco Mundial y Ministerio de Hacienda Asunción, Paraguay – Septiembre 1, 2017
Transcript of Política fiscal, desigualdad y pobreza: Paraguay en un contexto … · Política fiscal,...
Políticafiscal,desigualdadypobreza:Paraguayenuncontextocomparativo
NoraLustigProfesoraSamuelZ.StoneyDirectoradelInstitutoCEQ
UniversidaddeTulaneFellownoresidentedeCenterforGlobalDevelopment,Diálogo
InteramericanoyUNU-WIDER
EFICIENCIA,EQUIDAD YSOSTENIBILIDAD FISCAL EN UN CONTEXTODE VOLATILIDAD Y CAMBIO ESTRUCTURALES
BancoMundialyMinisteriodeHaciendaAsunción,Paraguay– Septiembre1,2017

Guión
• Ladesigualdad ylapobreza en Latam yParaguay
• Elimpacto delastransferencias ylos impuestossobre ladesigualdad ylapobreza en países deingreso medio ybajo yParaguay
0.400
0.420
0.440
0.460
0.480
0.500
0.520
0.540
0.560
0.580
1992
1993
1994
1995
1996
1997
1998
1999
2000
2001
2002
2003
2004
2005
2006
2007
2008
2009
2010
2011
2012
2013
2014
2015
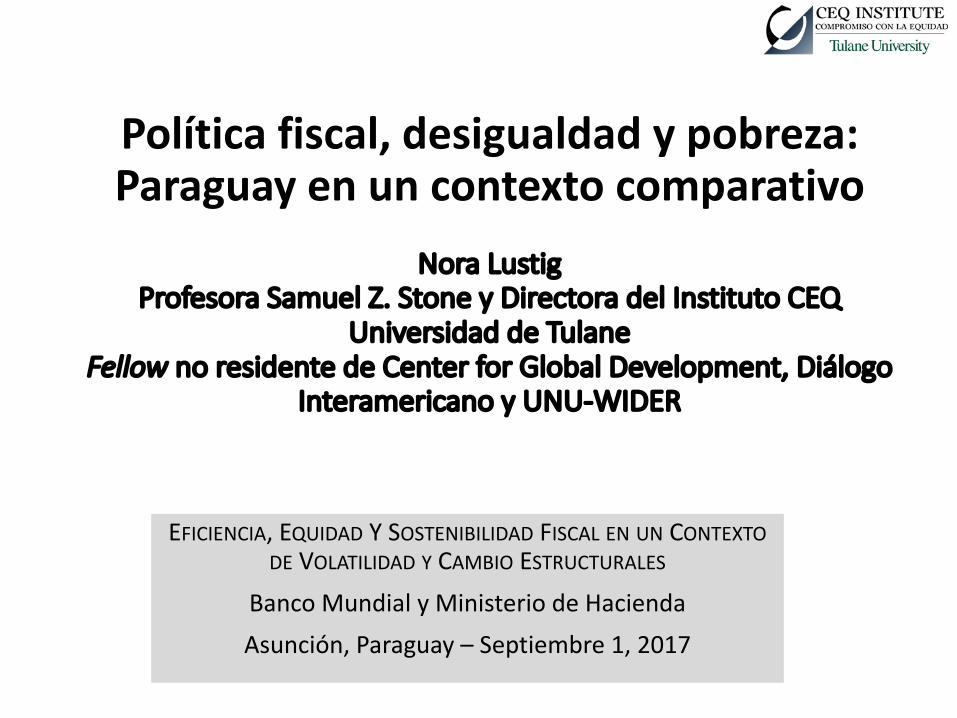
Unweighted averages of the Gini coefficient, Latin America (18 countries)
Household per capita income Household equivalized income
REDUCCIONDELADESIGUALDADLATAM:1992-2015
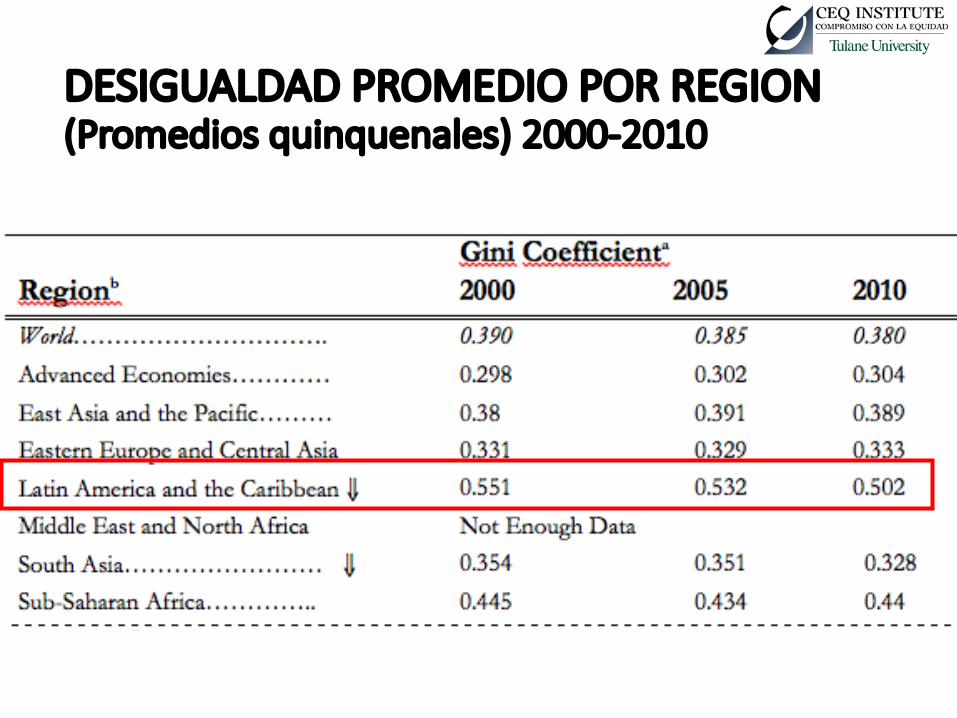
DESIGUALDADPROMEDIOPORREGION(Promedios quinquenales)2000-2010

-1.77-1.45 -1.37 -1.27 -1.18 -1.04 -0.96 -0.95 -0.92 -0.91 -0.88 -0.80 -0.73 -0.63 -0.58 -0.40 -0.29
-0.95
-3.00
-2.00
-1.00
0.00
1.00
2.00
3.00
Boliv
ia
Nic
arag
ua
El S
alvad
or
Ecu
ador
Arg
entin
a
Peru
Chile
Pana
ma
Braz
il
Dom
. Rep
.
Para
guay
Gua
tem
ala
Colo
mbi
a
Mex
ico
Hon
dura
s
Uru
guay
Cost
a Ri
ca
Latin
Am
eric
a
Annual percentage change in Gini coefficient between circa 2000 and 2015
REDUCCIONDELADESIGUALDADPORPAIS:2000-2015

0.0
5.0
10.0
15.0
20.0
25.0
30.0
35.0
40.0
45.0
50.0
2000 2001 2002 2003 2004 2005 2006 2007 2008 2009 2010 2011 2012 2013 2014 2015
Percentages of population by income groups, 2000-2015Latin America (17 countries)
Poverty $2.5/day Poverty $4/day Vulnerable $4-10/day Middle Class $10-50/day
REDUCCIONDELAPOBREZAYASCENSODELASCLASESMEDIASENLATAM:2000-2015
Source:Poverty&Inequality,SEDLAC

REDUCCIONDELAPOBREZA:CRECIMIENTOYREDUCCIONDELADESIGUALDADPORPAIS(2000-2012)
7
-35
-30
-25
-20
-15
-10
-5
0
5
10
-40%
-20%
0%
20%
40%
60%
80%
100%
120%
140%
Nic
arag
ua
Mex
ico
El S
alva
dor
Arg
enti
na
Dom
. Rep
.
Bol
ivia
Chi
le
Ecu
ador
Per
u
LA
C-1
8
Bra
zil
Pan
ama
Par
agua
y
Ven
ezue
la
Uru
guay
Hon
dura
s
Cos
ta R
ica
Gua
tem
ala
Col
ombi
a
Cha
nge
in p
over
ty (
perc
enta
ge p
oint
s)
% c
ontr
ibut
ion
of e
ach
effe
ct
Redistribution effect Growth effect Change in poverty ($4 a day) in percentage points
Lustigetal.(2014)basedonSEDLAC

8
¿PORQUEBAJOLADESIGUALDAD?

CAMBIOS EN LA DESIGUALDAD Y COMPOSICION DE LAFUERZA LABORAL POR NIVELES EDUCATIVOS: 2000-2012
Source: Own calculations, based on data from SEDLAC (CEDLAS, and The World Bank), December 2014.Notes: The average change in the Gini for each country is calculated as the percentage change between the end year and the initial year, divided by thenumber of years. The change in educational attainment is calculated as the absolute change between the shares in the end and initial years.According to years of schooling, the education groups are calculated as follows: secondary education (between 9 and 13 years of schooling) and tertiaryeducation (more than 13 years of schooling).
-2.64 -2.08 -1.68 -1.45 -1.28 -1.00 -0.92 -0.79 -0.74 -0.72 -0.70 -0.58 -0.50 -0.42 -0.40 -0.28 0.09
0.61
-4.0
-2.0
0.0
2.0
4.0
6.0
8.0
10.0
12.0
14.0
16.0
Nic
arag
ua
Boliv
ia
Ecu
ador
El S
alvad
or
Arg
entin
a
Braz
il
Peru
Dom
. Rep
.
Pana
ma
Chile
Mex
ico
Uru
guay
Colo
mbi
a
Gua
tem
ala
Para
guay
Vene
zuel
a
Cost
a Ri
ca
Hon
dura
s
Annual % change in the Gini coefficient
Change in share of labor force with secondary education (in percentage points)Change in share of labor force with tertiary education (in percentage points)

Guión
• Ladesigualdad ylapobreza en Latam yParaguay
• Elimpacto delastransferencias ylos impuestossobre ladesigualdad ylapobreza en países deingreso medio ybajo yParaguay
11
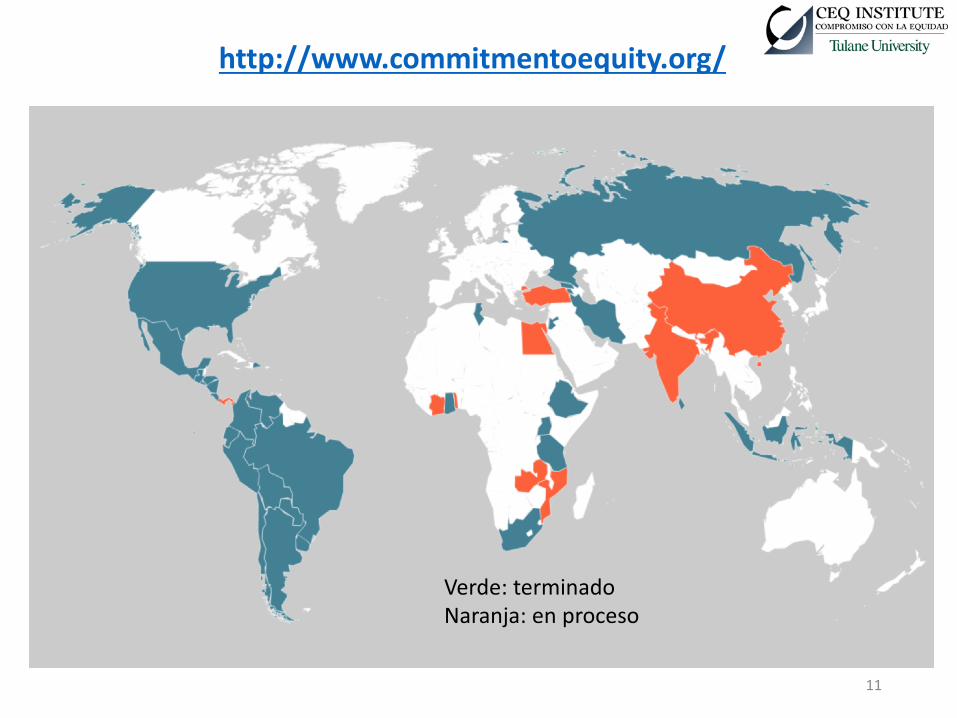
http://www.commitmentoequity.org/
Verde:terminadoNaranja:enproceso

Preguntasclave
• ¿Cuál es el efecto redistributivo y de reducciónde la pobreza de la política fiscal?• ¿Cuán igualadores y pro-pobres son losimpuestos y el gasto público?• ¿Cuánto beneficia a los pobres el gasto eneducación y salud?
12
Tamañoycomposicióndelosingresosygastos
gubernamentales

ComposicióndelosingresostotalesdelgobiernocomoproporcióndelProductoInternoBruto(PIB)(alrededorde2010)
14Fuente:Lustig(2018)
0
5,000
10,000
15,000
20,000
25,000
0%
5%
10%
15%
20%
25%
30%
35%
40%
Guatemala(2011)
Uganda(2013)
RepúblicaDominicana(2013)
Honduras(2011)
SriLanka(2010)
Colombia(2010)
Indonesia(2012)
Etiopía(2011)
Paraguay(2014)
ElSalvador(2011)
Ghana(2013)
Chile(2013)
CostaRica(2010)
México(2010)
Túnez(2010)
Nicaragua(2009)
Armenia(2011)
Perú(2009)
Tanzania(2011)
Jordania(2010)
Ecuador(2011)
Irán(2011)
Georgia(2013)
Venezuela(2013)
Uruguay(2009)
Sudáfrica(2010)
Bolivia(2009)
Argentina(2012)
Rusia(2010)
Brasil(2009)
Promedio
(Clasificadoporingresototaldegobierno/PIB;INBEjederecho)
Impuestosdirectos Impuestosindirectos Contribucionesalaseguridadsocial Otrosingresos INBpercápita(2011PPP)

15
ComposicióndelgastosocialcomoproporcióndelPIB(alrededorde2010)
Fuente:Lustig(2018)
0
5,000
10,000
15,000
20,000
25,000
0%
5%
10%
15%
20%
25%
30%
Uganda(2013)
Indonesia(2012)
SriLanka(2010)
Guatemala(2011)
Etiopía(2011)
Tanzania(2011)
Ghana(2013)
RepúblicaDominicana(2013)
Paraguay(2014)
Ecuador(2011)
Perú(2009)
Nicaragua(2009)
Honduras(2011)
ElSalvador(2011)
Armenia(2011)
Georgia(2013)
México(2010)
Colombia(2010)
Jordania(2010)
Chile(2013)
Venezuela(2013)
Irán(2011)
Túnez(2010)
Bolivia(2009)
Sudáfrica(2010)
CostaRica(2010)
Uruguay(2009)
Rusia(2010)
Brasil(2009)
Argentina(2012)
Promedio
OCDE(2011)
(Clasificadoporelgastosocialmáspensionescontributivas/PIB;INBejederecho)
Transferenciasdirectas Educación Salud Otrogastosocial Pensionescontributivas INBpercápita(2011PPP)
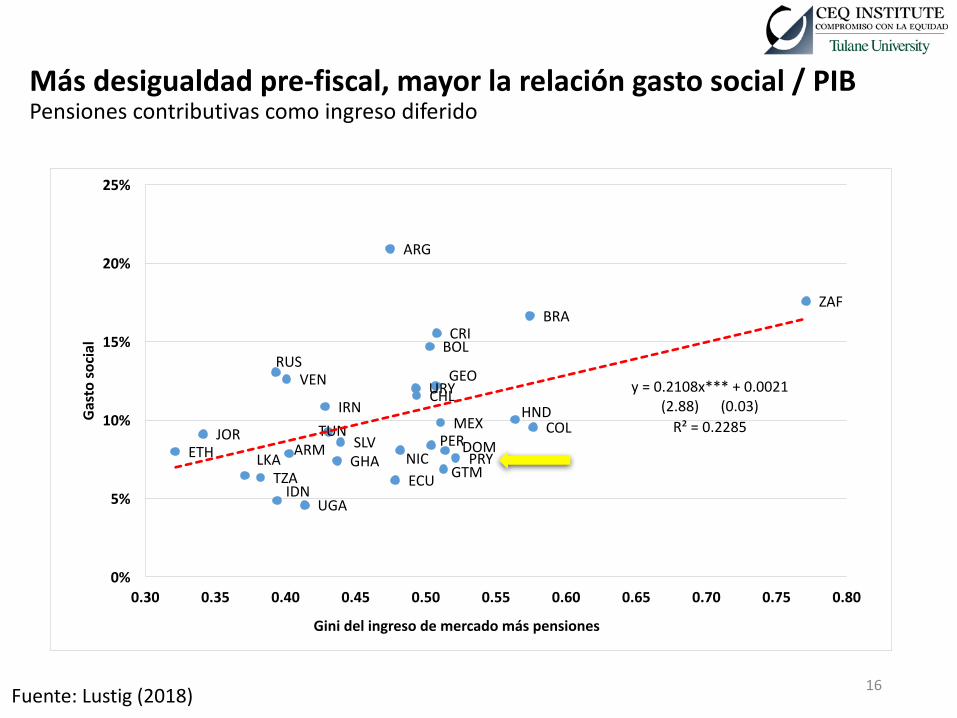
Másdesigualdadpre-fiscal,mayorlarelacióngastosocial/PIBPensionescontributivascomoingresodiferido
16Fuente:Lustig (2018)
ARG
ARM
BOL
BRA
CHL
COL
CRI
ECU
SLVETH
GEO
GHAGTM
HND
IDN
IRN
JORMEX
NIC PRYPERDOM
RUS
ZAF
LKATZA
TUN
UGA
URYVEN y=0.2108x***+0.0021(2.88)(0.03)R²=0.2285
0%
5%
10%
15%
20%
25%
0.30 0.35 0.40 0.45 0.50 0.55 0.60 0.65 0.70 0.75 0.80
Gastosocial
Ginidelingresodemercadomáspensiones

PolíticaFiscalyDesigualdad

INGRESODEMERCADO
INGRESODISPONIBLE
MÁSTRANSFERENCIASDIRECTASMENOSIMPUESTOSDIRECTOS
MÁSSUBSIDIOSINDIRECTOSMENOSIMPUESTOSINDIRECTOS
INGRESOCONSUMIBLE
MÁSELVALORMONETIZADODELOSSERVICIOSPÚBLICOSENEDUCACIÓNYSALUD
INGRESOFINAL
Evaluaciones CEQ:conceptos deingresos
18Fuente:Lustig (2018)
19
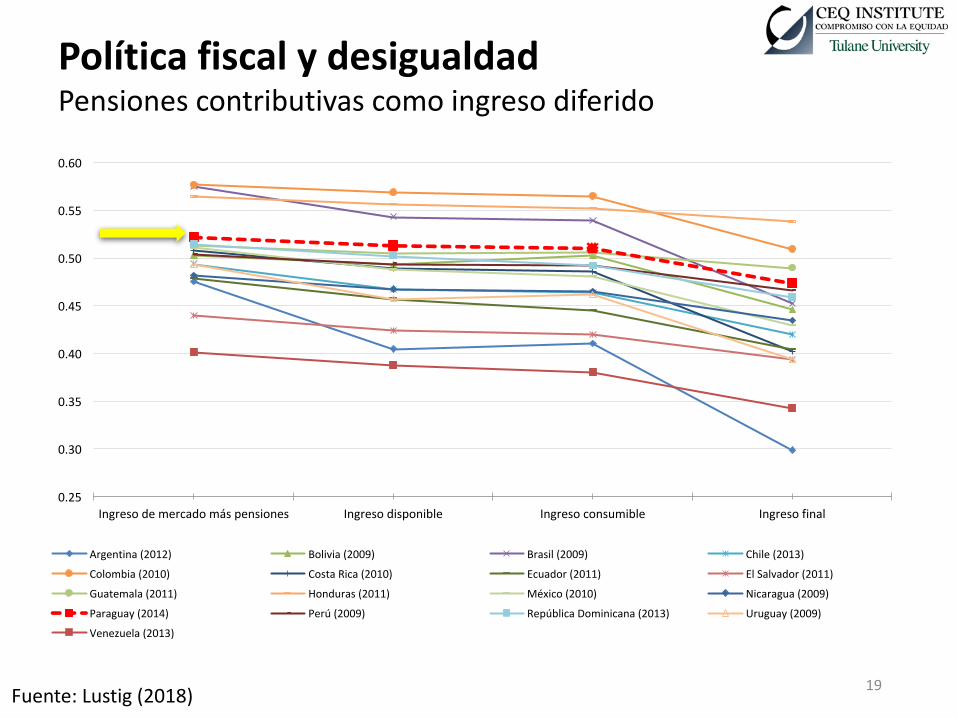
PolíticafiscalydesigualdadPensionescontributivascomoingresodiferido
Fuente:Lustig(2018)
0.25
0.30
0.35
0.40
0.45
0.50
0.55
0.60
Ingresodemercadomáspensiones Ingresodisponible Ingresoconsumible Ingresofinal
Argentina(2012) Bolivia(2009) Brasil(2009) Chile(2013)
Colombia(2010) CostaRica(2010) Ecuador(2011) ElSalvador(2011)
Guatemala(2011) Honduras(2011) México(2010) Nicaragua(2009)
Paraguay(2014) Perú(2009) RepúblicaDominicana(2013) Uruguay(2009)
Venezuela(2013)

Efectoredistributivo(CambioenelGini:ingresodemercadomáspensioneseingresodemercadoaingresodisponible,alrededorde2010)
20Fuente:Lustig(2018)
0.00
0.10
0.20
0.30
0.40
0.50
0.60
0.70
0.80
0.90
-0.20
-0.18
-0.16
-0.14
-0.12
-0.10
-0.08
-0.06
-0.04
-0.02
0.00
Indonesia(2012)
SriLanka(2010)
Honduras(2011)
Colombia(2010)
Guatemala(2011)
Paraguay(2014)
Bolivia(2009)
Perú(2009)
RepúblicaDominicana(2013)
Venezuela(2013)
Uganda(2013)
Ghana(2013)
Jordania(2010)
Nicaragua(2009)
ElSalvador(2011)
Etiopía(2011)
CostaRica(2010)
Ecuador(2011)
México(2010)
Tanzania(2011)
Chile(2013)
Armenia(2011)
Rusia(2010)
Brasil(2009)
Túnez(2010)
Uruguay(2009)
Irán(2011)
Sudáfrica(2010)
Argentina(2012)
Georgia(2013)
Promedio
EstadosUnidos(2011)
UE-28(2011)
Efecto
redistrib
utivo-Ingreso
dem
ercado
aingresodispon
ible
(Clasificadoporelefectoredistributivo(ejeizquierdo);Coeficientes deGinieje derecho)
Pensionescontributivascomoingresodiferido PensionescontributivascomotransferenciadirectaPromediodepensionescontributivascomoingresodiferido PromediodepensionescontributivascomotransferenciadirectaGinidelingresodemercadomáspensiones Ginidelingresodemercado

Efectoredistributivo(CambioenelGini:ingresodemercadomáspensioneseingresodemercadoaingresofinal,alrededorde2010)
21Fuente:Lustig(2018)
0.00
0.10
0.20
0.30
0.40
0.50
0.60
0.70
0.80
0.90
-0.25
-0.20
-0.15
-0.10
-0.05
0.00
Etiopía(2011)
Jordania(2010)
Guatemala(2011)
Indonesia(2012)
Honduras(2011)
SriLanka(2010)
Uganda(2013)
Ghana(2013)
Perú(2009)
ElSalvador(2011)
Armenia(2011)
Nicaragua(2009)
Paraguay(2014)
Tanzania(2011)
RepúblicaDominicana(2013)
Bolivia(2009)
Venezuela(2013)
Rusia(2010)
Colombia(2010)
Ecuador(2011)
Chile(2013)
Túnez(2010)
México(2010)
Irán(2011)
Uruguay(2009)
CostaRica(2010)
Brasil(2009)
Georgia(2013)
Sudáfrica(2010)
Argentina(2012)
Promedio
Efecto
redistrib
utivo-Ingreso
dem
ercado
aingresofin
al
(Clasificadoporelefectoredistributivo(eje izquierdo);CoeficientesdeGiniejederecho)
Pensionescontributivascomoingresodiferido Pensionescontributivascomotransferenciadirecta
Promediodepensionescontributivascomoingresodiferido Promediodepensionescontributivascomotransferenciadirecta
Ginidelingresodemercadomáspensiones Ginidelingresodemercado
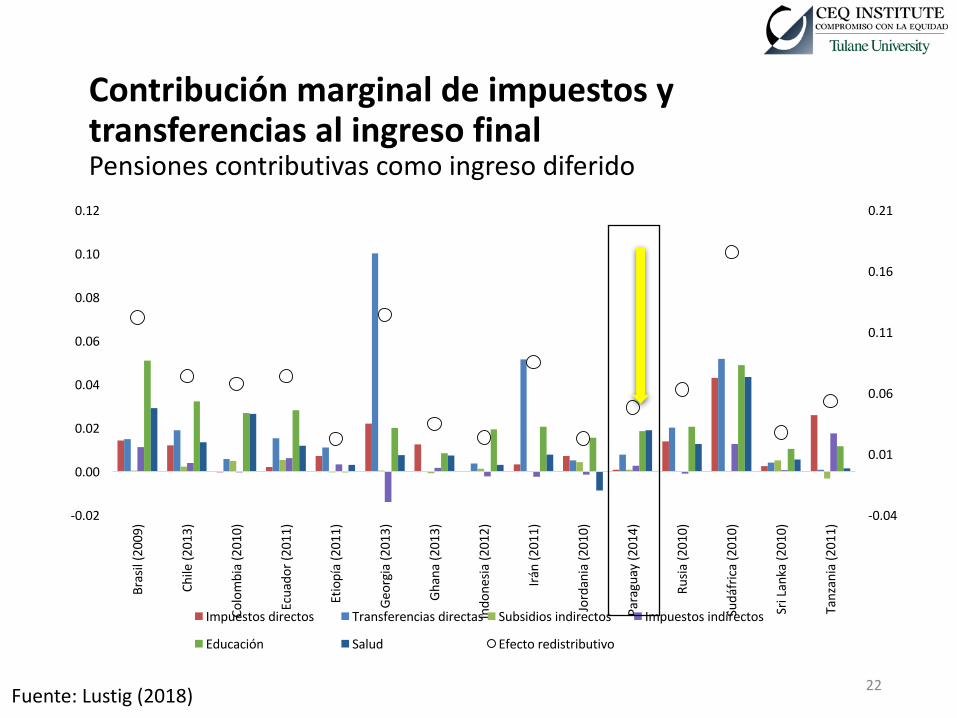
22
ContribuciónmarginaldeimpuestosytransferenciasalingresofinalPensionescontributivascomoingresodiferido
Fuente:Lustig(2018)
-0.04
0.01
0.06
0.11
0.16
0.21
-0.02
0.00
0.02
0.04
0.06
0.08
0.10
0.12
Brasil(2009)
Chile(2
013)
Colombia(2010)
Ecuado
r(2011)
Etiopía(2011)
Georgia(2013)
Ghana(2013)
Indo
nesia
(2012)
Irán(2011)
Jordania(2
010)
Paraguay(2
014)
Rusia
(2010)
Sudáfrica(2
010)
SriLanka(2
010)
Tanzania(2
011)
Impuestosdirectos Transferenciasdirectas Subsidiosindirectos Impuestosindirectos
Educación Salud Efectoredistributivo

PolíticaFiscalyPobreza

INGRESODEMERCADO
INGRESODISPONIBLE
MÁSTRANSFERENCIASDIRECTASMENOSIMPUESTOSDIRECTOS
MÁSSUBSIDIOSINDIRECTOSMENOSIMPUESTOSINDIRECTOS
INGRESOCONSUMIBLE
EvaluacionesCEQ:conceptosdeingresos
Fuente:Lustig(2018)
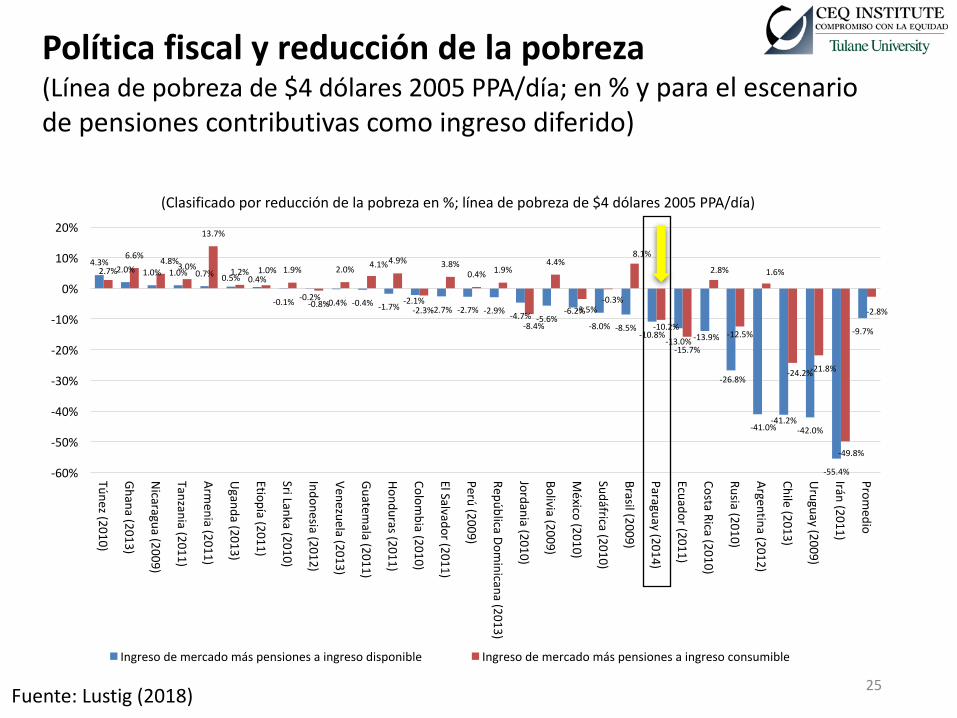
25
Políticafiscalyreduccióndelapobreza(Líneadepobrezade$4dólares 2005PPA/día; en%yparaelescenariodepensionescontributivascomoingresodiferido)
Fuente:Lustig(2018)
4.3%2.0% 1.0% 1.0% 0.7% 0.5% 0.4%
-0.1% -0.2% -0.4% -0.4% -1.7%-2.1%
-2.7% -2.7% -2.9% -4.7% -5.6%-6.2%
-8.0% -8.5%-10.8%
-13.0% -13.9%
-26.8%
-41.0%-41.2%
-42.0%
-55.4%
-9.7%
2.7%
6.6% 4.8%3.0%
13.7%
1.2% 1.0% 1.9%
-0.8%
2.0% 4.1%4.9%
-2.3%
3.8%0.4% 1.9%
-8.4%
4.4%
-3.5%-0.3%
8.1%
-10.2%
-15.7%
2.8%
-12.5%
1.6%
-24.2%-21.8%
-49.8%
-2.8%
-60%
-50%
-40%
-30%
-20%
-10%
0%
10%
20%
Túnez(2010)
Ghana(2013)
Nicaragua(2009)
Tanzania(2011)
Armenia(2011)
Uganda(2013)
Etiopía(2011)
SriLanka(2010)
Indonesia(2012)
Venezuela(2013)
Guatemala(2011)
Honduras(2011)
Colombia(2010)
ElSalvador(2011)
Perú(2009)
RepúblicaDominicana(2013)
Jordania(2010)
Bolivia(2009)
México(2010)
Sudáfrica(2010)
Brasil(2009)
Paraguay(2014)
Ecuador(2011)
CostaRica(2010)
Rusia(2010)
Argentina(2012)
Chile(2013)
Uruguay(2009)
Irán(2011)
Promedio
(Clasificadoporreduccióndelapobrezaen%;líneadepobrezade$4dólares 2005PPA/día)
Ingresodemercadomáspensionesaingresodisponible Ingresodemercadomáspensionesaingresoconsumible
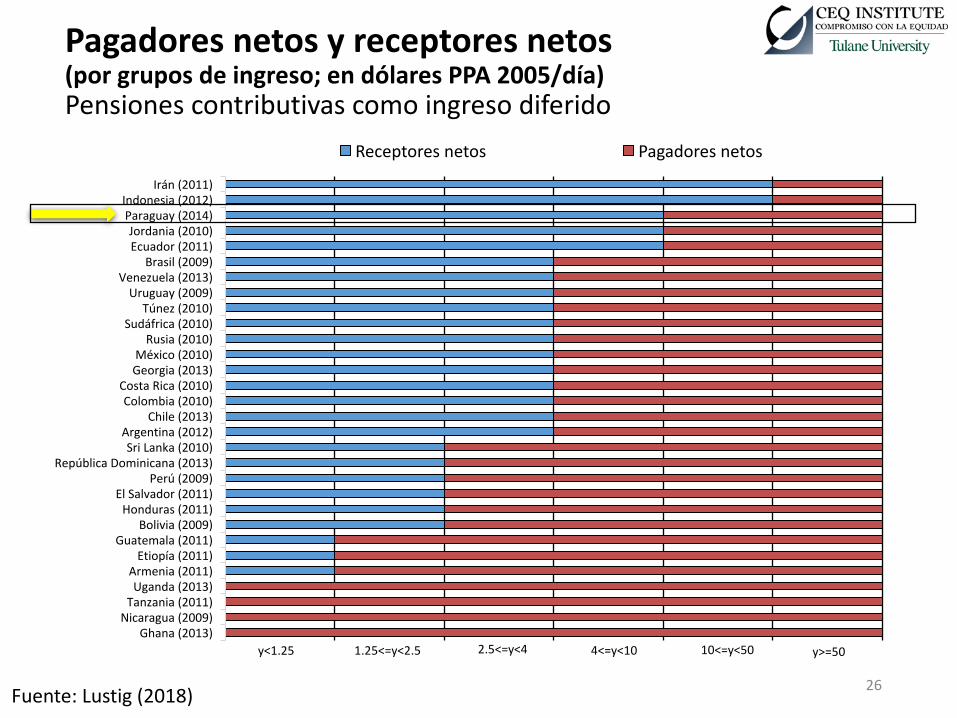
26
Pagadoresnetosyreceptoresnetos(porgruposdeingreso;endólaresPPA 2005/día)Pensionescontributivascomoingresodiferido
Fuente:Lustig(2018)
Ghana(2013)Nicaragua(2009)Tanzania(2011)Uganda(2013)Armenia(2011)Etiopía(2011)
Guatemala(2011)Bolivia(2009)
Honduras(2011)ElSalvador(2011)
Perú(2009)RepúblicaDominicana(2013)
SriLanka(2010)Argentina(2012)
Chile(2013)Colombia(2010)CostaRica(2010)Georgia(2013)México(2010)Rusia(2010)
Sudáfrica(2010)Túnez(2010)
Uruguay(2009)Venezuela(2013)
Brasil(2009)Ecuador(2011)Jordania(2010)Paraguay(2014)Indonesia(2012)
Irán(2011)
Receptoresnetos Pagadoresnetos
y<1.25 1.25<=y<2.5 2.5<=y<4 4<=y<10 10<=y<50 y>=50

¿Cuánto“beneficia”alospobreselgastoeneducaciónysalud?

ClasificaciónA = Igualador y pro-pobre, el gasto per
cápita disminuye con los ingresos
B = Neutral en términos absolutos eigualador; el mismo gasto per cápita para todos
C = Igualador pero no pro-pobre a lospobres, el gasto per cápita como proporción delingreso del mercado disminuye con los ingresos
D= Desigualador,elgastopercápitacomoproporcióndelosingresosdemercadoaumentaconlosingresos 28
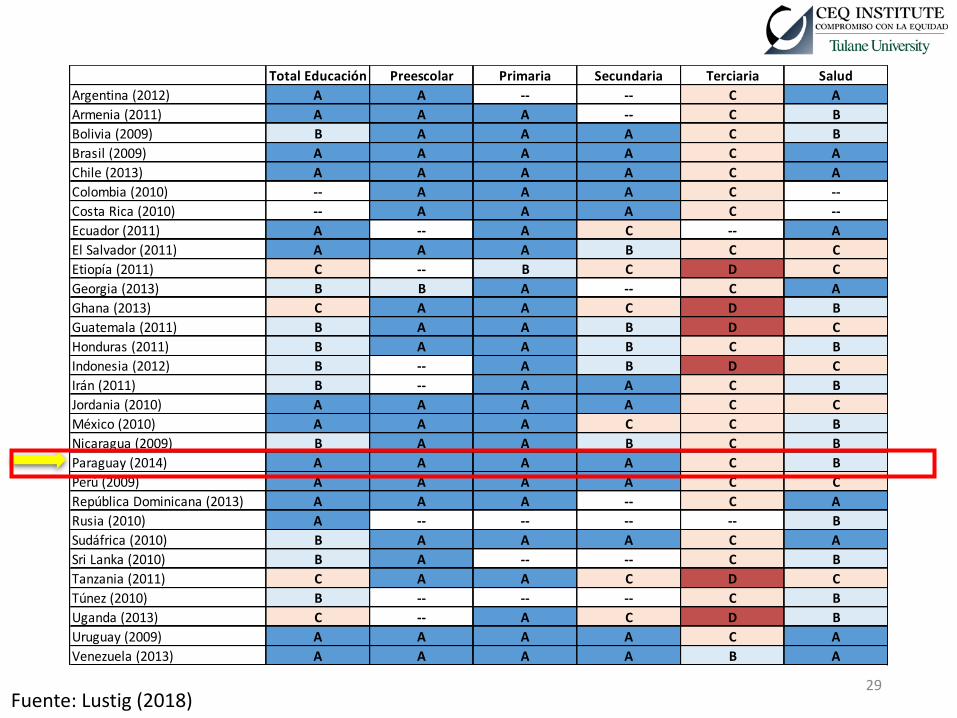
29Fuente:Lustig(2018)
TotalEducación Preescolar Primaria Secundaria Terciaria SaludArgentina(2012) A A -- -- C AArmenia(2011) A A A -- C BBolivia(2009) B A A A C BBrasil(2009) A A A A C AChile(2013) A A A A C AColombia(2010) -- A A A C --CostaRica(2010) -- A A A C --Ecuador(2011) A -- A C -- AElSalvador(2011) A A A B C CEtiopía(2011) C -- B C D CGeorgia(2013) B B A -- C AGhana(2013) C A A C D BGuatemala(2011) B A A B D CHonduras(2011) B A A B C BIndonesia(2012) B -- A B D CIrán(2011) B -- A A C BJordania(2010) A A A A C CMéxico(2010) A A A C C BNicaragua(2009) B A A B C BParaguay(2014) A A A A C BPerú(2009) A A A A C CRepúblicaDominicana(2013) A A A -- C ARusia(2010) A -- -- -- -- BSudáfrica(2010) B A A A C ASriLanka(2010) B A -- -- C BTanzania(2011) C A A C D CTúnez(2010) B -- -- -- C BUganda(2013) C -- A C D BUruguay(2009) A A A A C AVenezuela(2013) A A A A B A

Enconclusión…
• Los sistemas fiscales siempre son igualadores peroa menudo pueden reducir el poder adquisitivo delos pobresØAdvertencia: una consecuencia no deseada de la agendainternacional que enfatiza la movilización de recursosdomésticos podría ser que la condición de los pobresempeore
• El gasto en educación y salud es a menudo pro-pobre y casi universalmente igualitarioØAdvertencia: Este resultado favorable ¿se debe a que lasclases medias y los ricos están optando por serviciosprivados?
30

Enconclusión…
• En Paraguay…• Eltamañodelestado—larecaudación/PIB– esrelativamentebajoyelgastosocialcomoproporcióndelPIBesmuchomenorquelatendenciaparalos31paísesanalizados• Larecaudacióndescansaproporcionalmentemásenimpuestosindirectosqueenlosimpuestosalarenta
Ø Enconsecuencia,elimpactodelapolíticasfiscalsobreladesigualdadesrelativamentebajoysederiva,principalmente,delgastoeneducaciónysaludqueesmayoritariamentepro-pobre.

Enconclusión…
• Sinembargo,enrelaciónalacargafiscalsobrelapoblaciónpobre,elpaísquedaenmejorposiciónquemuchosotrospaísesdefueraydentrodelaregión• Estoesprincipalmentelaconsecuenciadequelastransferenciasmonetariasestánfocalizadasylosimpuestosalconsumonorecaensobrelospobresperoprincipalmenteporlainformalidad
ØElespacioparaaumentarlacapacidadredistributivadelfiscoseencuentraprincipalmenteenelimpuestoalarenta(¿propiedad?),mismosquerepresentanunaproporciónbajadelarecaudaciónyconunefectoredistributivocasineutroenlugardeserprogresivo

1. Argentina (2012-13; I): Rossignolo, Darío. 2018. “Taxes, Expenditures, Poverty, and Income Distribution in Argentina". EnCommitment to Equity Handbook. Estimating the Impact of Fiscal Policy on Inequality and Poverty, compilado por Nora Lustig(Brookings Institution Press and CEQ Institute, Tulane University)Rossignolo, Darío. 2017. “CEQ Master Workbook: Argentina. Version: May 19, 2017". Centro de Datos CEQ en Redistribución Fiscal(Instituto CEQ, Tulane University)2. Armenia (2011; I): Younger, Stephen D. y Artsvi Khachatryan. 2017. “Fiscal Incidence in Armenia". En The Distributional Impact ofFiscal Policy: Experience from Developing Countries, compilado por Gabriela Inchauste y Nora Lustig (Banco Mundial)Younger, Stephen D. y Artsvi Khachatryan. 2014. “CEQ Master Workbook: Armenia. Version: May 31, 2014". Centro de Datos CEQ enRedistribución Fiscal (Instituto CEQ, Tulane University y el Banco Mundial)3. Bolivia (2009; I): Paz Arauco, Verónica, George Gray-Molina, Wilson Jiménez y Ernesto Yáñez. 2014a. “Explaining LowRedistributive Impact in Bolivia". En The Redistributive Impact of Taxes and Social Spending in Latin America, compilado por NoraLustig, Carola Pessino y John Scott, Special Issue, Public Finance Review 42, no 3, pp. 326-345. DOI: 10.1177/1091142113496133Paz Arauco, Verónica, George Gray-Molina, Wilson Jiménez y Ernesto Yáñez. 2014b. “CEQ Master Workbook: Bolivia. Version:September 22, 2014". Centro de Datos CEQ en Redistribución Fiscal (Instituto CEQ, Tulane University)4. Brasil (2008-09; I): Higgins, Sean y Claudiney Pereira. 2014. “The Effects of Brazil’s Taxation and Social Spending on theDistribution of Household Income". En The Redistributive Impact of Taxes and Social Spending in Latin America, compilado por NoraLustig, Carola Pessino y John Scott, Special Issue, Public Finance Review 42, 3, pp. 346–67. DOI: 10.1177/1091142113501714Higgins, Sean y Claudiney Pereira. 2017. “CEQ Master Workbook: Brazil. Version: April 19, 2017". Centro de Datos CEQ enRedistribución Fiscal (Instituto CEQ, Tulane University)5. Chile (2013, I):Martínez- Aguilar, Sandra, Alan Fuchs, Eduardo Ortiz-Juárez y Giselle del Carmen. 2018. “The Impact of Fiscal Policyon Inequality and Poverty in Chile". En Commitment to Equity Handbook. Estimating the Impact of Fiscal Policy on Inequality andPoverty, compilado por Nora Lustig (Brookings Institution Press and CEQ Institute, Tulane University)Martínez-Aguilar, Sandra y Eduardo Ortiz-Juárez. 2016. “CEQ Master Workbook: Chile. Version: October 7, 2016". Centro de DatosCEQ en Redistribución Fiscal (Instituto CEQ, Tulane University y el Banco Mundial)6. Colombia (2010, I): Meléndez, Marcela y Valentina Martínez. 2015. “CEQ Master Workbook: Colombia. Version: December 17,2015". Centro de Datos CEQ en Redistribución Fiscal (Instituto CEQ, Tulane University y Banco Interamericano de Desarrollo)
33
Equipos yreferencias por país(Elaño paraelcual serealizó elanálisis entreparéntesis;C=consumo &I=ingreso)
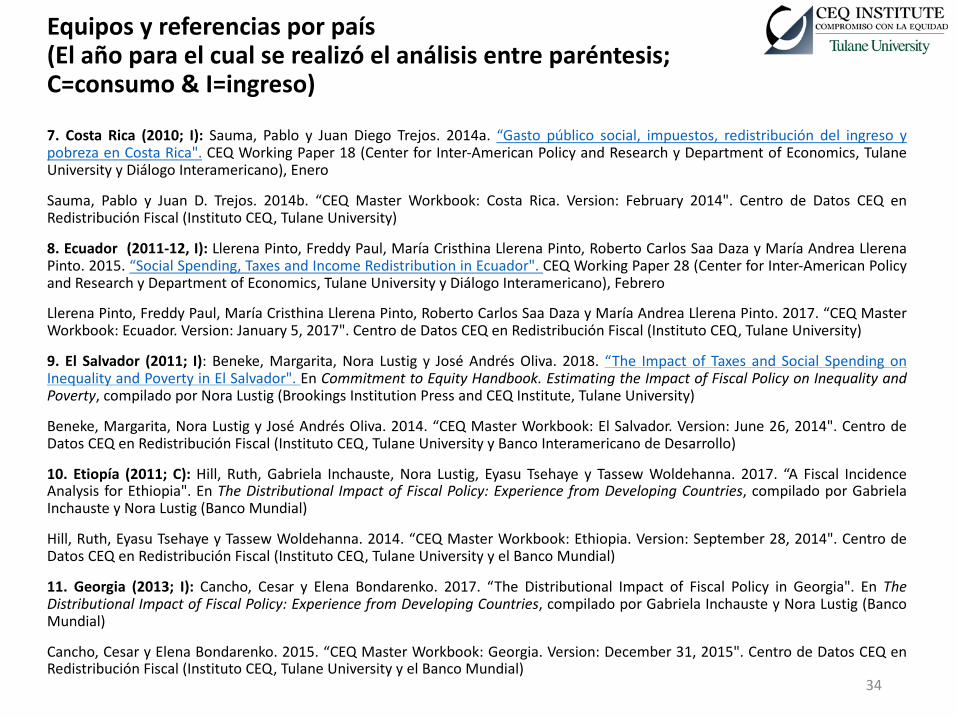
7. Costa Rica (2010; I): Sauma, Pablo y Juan Diego Trejos. 2014a. “Gasto público social, impuestos, redistribución del ingreso ypobreza en Costa Rica". CEQ Working Paper 18 (Center for Inter-American Policy and Research y Department of Economics, TulaneUniversity y Diálogo Interamericano), Enero
Sauma, Pablo y Juan D. Trejos. 2014b. “CEQ Master Workbook: Costa Rica. Version: February 2014". Centro de Datos CEQ enRedistribución Fiscal (Instituto CEQ, Tulane University)
8. Ecuador (2011-12, I): Llerena Pinto, Freddy Paul, María Cristhina Llerena Pinto, Roberto Carlos Saa Daza y María Andrea LlerenaPinto. 2015. “Social Spending, Taxes and Income Redistribution in Ecuador". CEQ Working Paper 28 (Center for Inter-American Policyand Research y Department of Economics, Tulane University y Diálogo Interamericano), Febrero
Llerena Pinto, Freddy Paul, María Cristhina Llerena Pinto, Roberto Carlos Saa Daza y María Andrea Llerena Pinto. 2017. “CEQ MasterWorkbook: Ecuador. Version: January 5, 2017". Centro de Datos CEQ en Redistribución Fiscal (Instituto CEQ, Tulane University)
9. El Salvador (2011; I): Beneke, Margarita, Nora Lustig y José Andrés Oliva. 2018. “The Impact of Taxes and Social Spending onInequality and Poverty in El Salvador". En Commitment to Equity Handbook. Estimating the Impact of Fiscal Policy on Inequality andPoverty, compilado por Nora Lustig (Brookings Institution Press and CEQ Institute, Tulane University)
Beneke, Margarita, Nora Lustig y José Andrés Oliva. 2014. “CEQ Master Workbook: El Salvador. Version: June 26, 2014". Centro deDatos CEQ en Redistribución Fiscal (Instituto CEQ, Tulane University y Banco Interamericano de Desarrollo)
10. Etiopía (2011; C): Hill, Ruth, Gabriela Inchauste, Nora Lustig, Eyasu Tsehaye y Tassew Woldehanna. 2017. “A Fiscal IncidenceAnalysis for Ethiopia". En The Distributional Impact of Fiscal Policy: Experience from Developing Countries, compilado por GabrielaInchauste y Nora Lustig (Banco Mundial)
Hill, Ruth, Eyasu Tsehaye y Tassew Woldehanna. 2014. “CEQ Master Workbook: Ethiopia. Version: September 28, 2014". Centro deDatos CEQ en Redistribución Fiscal (Instituto CEQ, Tulane University y el Banco Mundial)
11. Georgia (2013; I): Cancho, Cesar y Elena Bondarenko. 2017. “The Distributional Impact of Fiscal Policy in Georgia". En TheDistributional Impact of Fiscal Policy: Experience from Developing Countries, compilado por Gabriela Inchauste y Nora Lustig (BancoMundial)
Cancho, Cesar y Elena Bondarenko. 2015. “CEQ Master Workbook: Georgia. Version: December 31, 2015". Centro de Datos CEQ enRedistribución Fiscal (Instituto CEQ, Tulane University y el Banco Mundial)
34
Equipos yreferencias por país(Elaño paraelcual serealizó elanálisis entreparéntesis;C=consumo &I=ingreso)
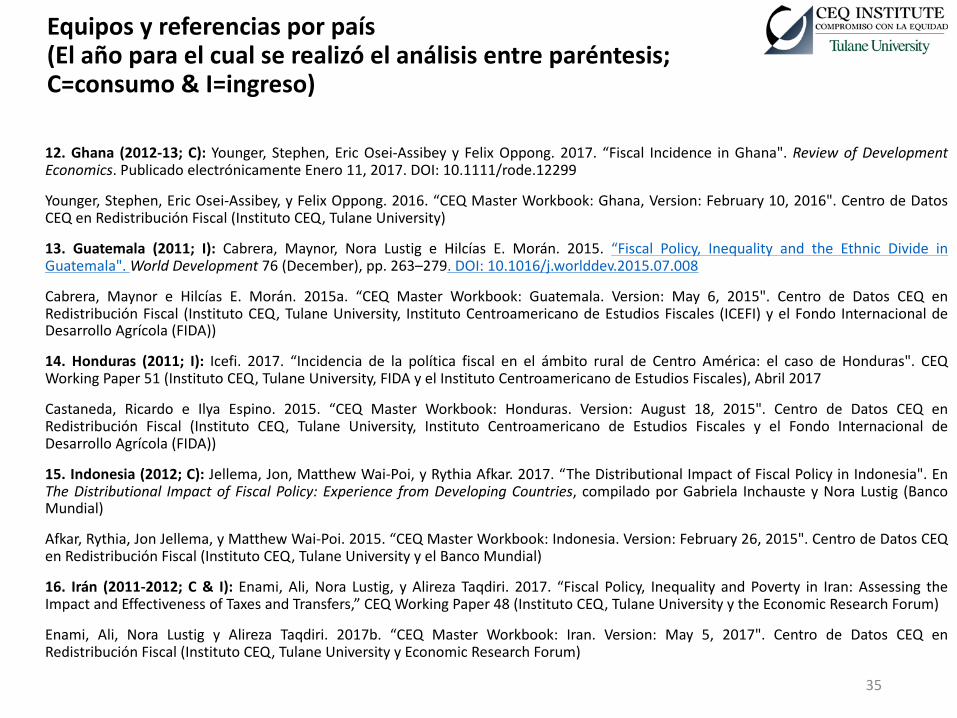
12. Ghana (2012-13; C): Younger, Stephen, Eric Osei-Assibey y Felix Oppong. 2017. “Fiscal Incidence in Ghana". Review of DevelopmentEconomics. Publicado electrónicamente Enero 11, 2017. DOI: 10.1111/rode.12299
Younger, Stephen, Eric Osei-Assibey, y Felix Oppong. 2016. “CEQ Master Workbook: Ghana, Version: February 10, 2016". Centro de DatosCEQ en Redistribución Fiscal (Instituto CEQ, Tulane University)
13. Guatemala (2011; I): Cabrera, Maynor, Nora Lustig e Hilcías E. Morán. 2015. “Fiscal Policy, Inequality and the Ethnic Divide inGuatemala".World Development 76 (December), pp. 263–279. DOI: 10.1016/j.worlddev.2015.07.008
Cabrera, Maynor e Hilcías E. Morán. 2015a. “CEQ Master Workbook: Guatemala. Version: May 6, 2015". Centro de Datos CEQ enRedistribución Fiscal (Instituto CEQ, Tulane University, Instituto Centroamericano de Estudios Fiscales (ICEFI) y el Fondo Internacional deDesarrollo Agrícola (FIDA))
14. Honduras (2011; I): Icefi. 2017. “Incidencia de la política fiscal en el ámbito rural de Centro América: el caso de Honduras". CEQWorking Paper 51 (Instituto CEQ, Tulane University, FIDA y el Instituto Centroamericano de Estudios Fiscales), Abril 2017
Castaneda, Ricardo e Ilya Espino. 2015. “CEQ Master Workbook: Honduras. Version: August 18, 2015". Centro de Datos CEQ enRedistribución Fiscal (Instituto CEQ, Tulane University, Instituto Centroamericano de Estudios Fiscales y el Fondo Internacional deDesarrollo Agrícola (FIDA))
15. Indonesia (2012; C): Jellema, Jon, Matthew Wai-Poi, y Rythia Afkar. 2017. “The Distributional Impact of Fiscal Policy in Indonesia". EnThe Distributional Impact of Fiscal Policy: Experience from Developing Countries, compilado por Gabriela Inchauste y Nora Lustig (BancoMundial)
Afkar, Rythia, Jon Jellema, y Matthew Wai-Poi. 2015. “CEQ Master Workbook: Indonesia. Version: February 26, 2015". Centro de Datos CEQen Redistribución Fiscal (Instituto CEQ, Tulane University y el Banco Mundial)
16. Irán (2011-2012; C & I): Enami, Ali, Nora Lustig, y Alireza Taqdiri. 2017. “Fiscal Policy, Inequality and Poverty in Iran: Assessing theImpact and Effectiveness of Taxes and Transfers,” CEQ Working Paper 48 (Instituto CEQ, Tulane University y the Economic Research Forum)
Enami, Ali, Nora Lustig y Alireza Taqdiri. 2017b. “CEQ Master Workbook: Iran. Version: May 5, 2017". Centro de Datos CEQ enRedistribución Fiscal (Instituto CEQ, Tulane University y Economic Research Forum)
35
Equipos yreferencias por país(Elaño paraelcual serealizó elanálisis entreparéntesis;C=consumo &I=ingreso)

17. Jordania (2010-11; C): Alam, Shamma A., Gabriela Inchauste y Umar Serajuddin. 2017. “The Distributional Impact of Fiscal Policyin Jordan". En The Distributional Impact of Fiscal Policy: Experience from Developing Countries, compilado por Gabriela Inchauste yNora Lustig (Banco Mundial)
Abdel-Halim, Morad, Shamma A. Alam, Yusuf Mansur, Umar Serajuddin y Paolo Verme. 2016. “CEQ Master Workbook: Jordan.Version: March 8, 2016". Centro de Datos CEQ en Redistribución Fiscal (Instituto CEQ, Tulane University y el Banco Mundial)
18. México (2010; C & I): Scott, John. 2014. “Redistributive Impact and Efficiency of Mexico’s Fiscal System". En The RedistributiveImpact of Taxes and Social Spending in Latin America, compilado por Nora Lustig, Carola Pessino, John Scott, Special Issue, PublicFinance Review 42, no. 3, pp. 368-390. DOI: 10.1177/1091142113497394
Scott, John. 2013. “CEQ Master Workbook: Mexico. Version: September 2, 2013". Centro de Datos CEQ en Redistribución Fiscal(Instituto CEQ, Tulane University)
19. Nicaragua (2009; I): Icefi. 2017. “Incidencia de la política fiscal en la desigualdad y la pobreza en Nicaragua". CEQ Working Paper52 (Instituto CEQ, Tulane University, IFAD e Instituto Centroamericano de Estudios Fiscales), Mayo 2017
Cabrera, Maynor e Hilcías E. Morán. 2015b. “CEQ Master Workbook: Nicaragua. Version: October 14, 2015". CEQ Data Center onFiscal Redistribution (Instituto CEQ, Tulane University, Instituto Centroamericano de Estudios Fiscales (Icefi) y el Fondo Internacionalde Desarrollo Agrícola (FIDA))
20. Paraguay (2014; I): Galeano, Juan José, María A. Lugo, Lea Giménez, Carolina Paredes, Flavia Sacco, Miguel A. Vega y FátimaFranco. 2017. “CEQ Master Workbook: Paraguay. Version: February 12, 2017". Centro de Datos CEQ en Redistribución Fiscal(Instituto CEQ, Tulane University)
21. Perú (2009; I): Jaramillo, Miguel. 2014. “The Incidence of Social Spending and Taxes in Peru". En The Redistributive Impact ofTaxes and Social Spending in Latin America, compilado por Nora Lustig, Carola Pessino y John Scott, Special Issue, Public FinanceReview 42, no. 3, pp. 391-412. DOI: 10.1177/1091142113496134
Jaramillo, Miguel. 2015. CEQ Master Workbook: Peru. Version: August 7,2015". Centro de Datos CEQ en Redistribución Fiscal(Instituto CEQ, Tulane University
36
Equipos yreferencias por país(Elaño paraelcual serealizó elanálisis entreparéntesis;C=consumo &I=ingreso)

22. República Dominicana (2006-07, I): Aristy-Escuder, Jaime, Maynor Cabrera, Blanca Moreno-Dodson y Miguel E. Sánchez-Martín.2018. “Fiscal Policy and Redistribution in the Dominican Republic". En Commitment to Equity Handbook. Estimating the Impact ofFiscal Policy on Inequality and Poverty, compilado por Nora Lustig (Brookings Institution Press and CEQ Institute, Tulane University)
Aristy-Escuder, Jaime, Maynor Cabrera, Blanca Moreno-Dodson y Miguel Sanchez-Martin. 2016. “CEQ Master Workbook: DominicanRepublic. Version: August 4, 2016". Centro de Datos CEQ en Redistribución Fiscal (Instituto CEQ, Tulane University y el BancoMundial)
23. Rusia (2010; I): López-Calva, Luis Felipe, Nora Lustig, Mikhail Matytsin y Daria Popova. 2017. “Who Benefits from FiscalRedistribution in Russia?". En The Distributional Impact of Fiscal Policy: Experience from Developing Countries, compilado porGabriela Inchauste y Nora Lustig (Banco Mundial)
Malytsin, Mikhail y Daria Popova. 2016. “CEQ Master Workbook: Russia. Version: March 17, 2016". Centro de Datos CEQ enRedistribución Fiscal (Instituto CEQ, Tulane University y el Banco Mundial)
24. Sudáfrica (2010-11; I): Inchauste, Gabriela, Nora Lustig, Mashekwa Maboshe, Catriona Purfield, Ingrid Woolard y PreciousZikhali. 2017. “The Distributional Impact of Fiscal Policy in South Africa". En The Distributional Impact of Fiscal Policy: Experiencefrom Developing Countries, compilado por Gabriela Inchauste y Nora Lustig (Banco Mundial)
Inchauste, Gabriela, Nora Lustig, Mashekwa Maboshe, Catriona Purfield, Ingrid Woolard y Precious Zikhali. 2016. “CEQ MasterWorkbook: South Africa. Version: March 6, 2016". Centro de Datos CEQ en Redistribución Fiscal (Instituto CEQ, Tulane University y elBanco Mundial)
25. Sri Lanka (2010; C): Arunatilake, Nisha, Gabriela Inchauste y Nora Lustig. 2017. “The Incidence of Taxes and Spending in SriLanka". En The Distributional Impact of Fiscal Policy: Experience from Developing Countries, compilado por Gabriela Inchauste y NoraLustig (Banco Mundial)
Arunatilake, Nisha, Camilo Gomez, Nipuni Perera y Kaushalya Attygalle. 2016. “CEQ Master Workbook: Sri Lanka. Version: March 10,2016". Centro de Datos CEQ en Redistribución Fiscal (Instituto CEQ, Tulane University y el Banco Mundial)
26. Tanzania (2011-12; C): Younger, Stephen, Flora Myamba y Kenneth Mdadila. 2016. “Fiscal Incidence in Tanzania". AfricanDevelopment Review 28, no. 3, pp. 264-276. DOI: 10.1111/1467-8268.12204. Tambén en CEQ Working Paper 36 (Instituto CEQ,Tulane University, e Ithaca College and REPOA), Enero
Younger, Stephen, Flora Myamba, y Kenneth Mdadila. 2016. “CEQ Master Workbook: Tanzania. Version: June 1, 2016". Centro deDatos CEQ en Redistribución Fiscal (Instituto CEQ, Tulane University) 37
Equiposyreferenciasporpaís(Elañoparaelcualserealizóelanálisisentreparéntesis;C=consumo&I=ingreso)

Equiposyreferenciasporpaís(Elañoparaelcualserealizóelanálisisentreparéntesis;C=consumo&I=ingreso)27. Túnez (2010, C): Jouini, Nizar, Nora Lustig, Ahmed Moummi y Abebe Shimeles. 2018. “Fiscal Incidence and Poverty Reduction:Evidence from Tunisia". En Commitment to Equity Handbook. Estimating the Impact of Fiscal Policy on Inequality and Poverty,compilado por Nora Lustig (Brookings Institution Press and CEQ Institute, Tulane University)
Jouini, Nizar, Nora Lustig, Ahmed Moummi y Abebe Shimeles. 2015. “CEQ Master Workbook: Tunisia. Version: October 1, 2015".Centro de Datos CEQ en Redistribución Fiscal (Instituto CEQ, Tulane University and African Development Bank)
28. Uganda (2012-2013, C & I): Jellema, Jon, Astrid Haas, Nora Lustig y Sebastian Wolf. 2018. “The Impact of Taxes, Transfers, andSubsidies on Inequality and Poverty in Uganda". En Commitment to Equity Handbook. Estimating the Impact of Fiscal Policy onInequality and Poverty, compilado por Nora Lustig (Brookings Institution Press and CEQ Institute, Tulane University)
Jellema, Jon, Astrid Haas, Nora Lustig y Sebastian Wolf. 2016. “CEQ Master Workbook: Uganda. Version: July 28, 2016". Centro deDatos CEQ en Redistribución Fiscal (Instituto CEQ, Tulane University e International Growth Center)
29. Unión Europea (2011, I): EUROMOD statistics on Distribution and Decomposition of Disposable Income, consultado enhttp://www.iser.essex.ac.uk/euromod/statistics/ using EUROMOD versión no. G2.0
30. Estados Unidos (2011, I): Higgins, Sean, Nora Lustig, Whitney Ruble y Timothy Smeeding. 2016. “Comparing the Incidence ofTaxes and Social Spending in Brazil and the United States". Review of Income and Wealth 62, no. 1 (August), pp. 22-46. DOI:10.1111/roiw.12201
31. Uruguay (2009; I): Bucheli, Marisa, Nora Lustig, Maximo Rossi y Florencia Amabile. 2014. “Social Spending, Taxes and IncomeRedistribution in Uruguay". En The Redistributive Impact of Taxes and Social Spending in Latin America, compilado por Nora Lustig,Carola Pessino y John Scott, Special Issue, Public Finance Review 42, no. 3, pp. 413-433. DOI: 10.1177/1091142113493493
Bucheli, Marisa, Nora Lustig, Maximo Rossi y Florencia Amabile. 2014. “CEQ Master Workbook: Uruguay. Version: August 18, 2014".Centro de Datos CEQ en Redistribución Fiscal (Instituto CEQ, Tulane University)
32. Venezuela (2012; I): Molina, Emiro. 2016. “CEQ Master Workbook: Venezuela. Version: November 15, 2016". Centro de DatosCEQ en Redistribución Fiscal (Instituto CEQ, Tulane University)
38

Referencias:• Enami, Ali. 2018. “Measuring the Effectiveness of Taxes and Transfers in Fighting Inequality and Poverty". En Lustig, Nora,
compiladora. 2018. Commitment to Equity Handbook. Estimating the Impact of Fiscal Policy on Inequality and Poverty.Brookings Institution Press and CEQ Institute, Tulane University
• Enami, Ali, Nora Lustig y Rodrigo Aranda. 2018. “Analytical Foundations: Measuring the Redistributive Impact of Taxes andTransfers". En Commitment to Equity Handbook. Estimating the Impact of Fiscal Policy on Inequality and Poverty, compiladopor Nora Lustig (Brookings Institution Press and CEQ Institute, Tulane University)
• Engel, Eduardo M., Alexander Galetovic y Claudio E. Raddatz. 1999. “Taxes and income distribution in Chile: some unpleasantredistributive arithmetic". Journal of Development Economics, 59 (1), pp. 155-192
• Higgins, Sean y Nora Lustig. 2018. “Allocating Taxes and Transfers, Constructing Income Concepts, and Completing Sections A,B, and C of CEQ Master Workbook". En Commitment to Equity Handbook. Estimating the Impact of Fiscal Policy on Inequalityand Poverty, compilado por Nora Lustig (Brookings Institution Press and CEQ Institute, Tulane University)
• Higgins, Sean y Nora Lustig. 2016. “Can a poverty-reducing and progressive tax and transfer system hurt the poor?". Journal ofDevelopment Economics 122, pp. 63-75
• Higgins, Sean, Nora Lustig, Whitney Ruble y Tim Smeeding “Comparing the Incidence of Taxes and Social Spending in Brazil andthe United States". Review of Income and Wealth, Publicación en línea 24 de mayo, 2015, DOI: 10.1111/roiw.12201
• Lambert, Peter. 2001. “The Distribution and Redistribution of Income”. Third edition (Manchester University Press)
• Lindert, Peter H. 2004. “Growing Public. Social Spending and Economic Growth since the Eighteenth Century”. Volumes I and II.(Cambridge, U.K.: Cambridge University Press)
• Lustig, Nora. 2018. “Fiscal Policy, Income Redistribution and Poverty Reduction in Low and Middle Income Countries". EnCommitment to Equity Handbook. Estimating the Impact of Fiscal Policy on Inequality and Poverty, compilado por Nora Lustig(Brookings Institution Press and CEQ Institute, Tulane University) Lustig, Nora. 2018. (avance, disponible en línea:http://www.commitmentoequity.org/publications/handbook.php )
• ________. 2016a. “The Sustainable Development Goals, Domestic Resource Mobilization and the Poor". Capítulo en JoseAntonio Ocampo y Joseph Stiglitz, editores. Welfare and Inequality, Columbia University Press, New York. También disponiblecomo CEQ Working Paper 61
39

Referencias:• ___________. 2016b. “El impacto del sistema tributario y el gasto social en la distribución del ingreso y la pobreza en América
Latina: Argentina, Bolivia, Brasil, Chile, Colombia, Costa Rica, Ecuador, El Salvador, Guatemala, Honduras, México, Perú yUruguay". CEQ Working Paper No. 47, Commitment to Equity Institute disponible en www.commitmentoequity.org. También,2017. El Trimestre Economico 335 (July-September 2017)
• _________. 2016c. “Inequality and Fiscal Redistribution in Middle Income Countries: Brazil, Chile, Colombia, Indonesia,Mexico, Peru and South Africa". Journal of Globalization and Development 7, no. 1, pp. 17-60. DOI: 10.1515/jgd-2016-0015
• ________.2015.“TheRedistributive Impact ofGovernment Spending on Education andHealth:Evidence from 13DevelopingCountries inthe CommitmenttoEquityProject”Chapter 16in Gupta,Sanjeev,MichaelKeen,BenedictClements andRuud deMooij,editors,Inequality andFiscalPolicy,Washington:InternationalMonetary Fund,2015
• O'Higgins,MichaelyPatriciaRuggles.1981.“TheDistribution ofPublic Expenditures andTaxes among Households intheUnited Kingdom".Review ofIncome andWealth 27,no.3,pp.298-326
• Ruggles,PatriciayMichaelO'Higgins.1981.“TheDistribution ofPublic Expenditure among Households inthe United States".Review ofIncome andWealth 27,no.2,pp.137-164
40

¡Gracias!
41