Urban Risk and Vulnerabilities of Coastal Megacity of Bangkok ...

Atmos. Chem. Phys., 14, 8679–8699, 2014www.atmos-chem-phys.net/14/8679/2014/doi:10.5194/acp-14-8679-2014© Author(s) 2014. CC Attribution 3.0 License.
PM2.5 pollution in a megacity of southwest China: sourceapportionment and implication
J. Tao1, J. Gao2, L. Zhang3, R. Zhang4, H. Che5, Z. Zhang1, Z. Lin 1, J. Jing6, J. Cao7, and S.-C. Hsu8
1South China Institute of Environmental Sciences, Ministry of Environmental Protection, Guangzhou, China2Chinese Research Academy of Environmental Sciences, Beijing, China3Air Quality Research Division, Science Technology Branch, Environment Canada, Toronto, Canada4RCE-TEA, Institute of Atmospheric Physics, Chinese Academy of Sciences, Beijing, China5Key Laboratory of Atmospheric Chemistry (LAC), Institute of Atmospheric Composition, Chinese Academy ofMeteorological Sciences (CAMS), China6Centre for Atmosphere Watch and Services (CAWAS), Meteorological Observation Center of CMA, Beijing, China7Key Laboratory of Aerosol, SKLLQG, Institute of Earth Environment, Chinese Academy of Sciences, Xi’an, China8Research Center for Environmental Changes (RCEC), Academia Sinica, Taipei, Taiwan
Correspondence to:S.-C. Hsu ([email protected]) and J. Gao ([email protected])
Received: 7 January 2014 – Published in Atmos. Chem. Phys. Discuss.: 25 February 2014Revised: 20 June 2014 – Accepted: 9 July 2014 – Published: 26 August 2014
Abstract. Daily PM2.5 (aerosol particles with an aerody-namic diameter of less than 2.5 µm) samples were collectedat an urban site in Chengdu, an inland megacity in southwestChina, during four 1-month periods in 2011, with each pe-riod in a different season. Samples were subject to chemicalanalysis for various chemical components ranging from ma-jor water-soluble ions, organic carbon (OC), element carbon(EC), trace elements to biomass burning tracers, anhydro-sugar levoglucosan (LG), and mannosan (MN). Two models,the ISORROPIA II thermodynamic equilibrium model andthe positive matrix factorization (PMF) model, were appliedto explore the likely chemical forms of ionic constituentsand to apportion sources for PM2.5. Distinctive seasonal pat-terns of PM2.5 and associated main chemical componentswere identified and could be explained by varying emissionsources and meteorological conditions. PM2.5 showed a typ-ical seasonality of waxing in winter and waning in summer,with an annual mean of 119 µg m−3. Mineral soil concentra-tions increased in spring, whereas biomass burning specieselevated in autumn and winter.
Six major source factors were identified to have con-tributed to PM2.5 using the PMF model. These were sec-ondary inorganic aerosols, coal combustion, biomass burn-ing, iron and steel manufacturing, Mo-related industries, andsoil dust, and they contributed 37± 18, 20± 12, 11± 10,
11± 9, 11± 9, and 10± 12 %, respectively, to PM2.5 masseson annual average, while exhibiting large seasonal vari-ability. On annual average, the unknown emission sourcesthat were not identified by the PMF model contributed1± 11 % to the measured PM2.5 mass. Various chemical trac-ers were used for validating PMF performance. Antimony(Sb) was suggested to be a suitable tracer of coal combus-tion in Chengdu. Results of LG and MN helped constrainthe biomass burning sources, with wood burning dominat-ing in winter and agricultural waste burning dominating inautumn. Excessive Fe (Ex-Fe), defined as the excessive por-tion in measured Fe that cannot be sustained by mineral dust,is corroborated to be a straightforward useful tracer of ironand steel manufacturing pollution. In Chengdu, Mo/ Ni massratios were persistently higher than unity, and considerablydistinct from those usually observed in ambient airs. V/ Niratios averaged only 0.7. Results revealed that heavy oil fuelcombustion should not be a vital anthropogenic source, andadditional anthropogenic sources for Mo are yet to be iden-tified. Overall, the emission sources identified in Chengducould be dominated by local sources located in the vicinityof Sichuan, a result different from those found in Beijing andShanghai, wherein cross-boundary transport is significant incontributing pronounced PM2.5. These results provided im-plications for PM2.5 control strategies.
Published by Copernicus Publications on behalf of the European Geosciences Union.

8680 J. Tao et al.: PM2.5 pollution in a megacity of southwest China
1 Introduction
Fine particulate matter (PM2.5) – those particles with an aero-dynamic diameter of less than 2.5 µm – is a key air pollu-tant in terms of adverse human health effects and visibilitydegradation (Pope III and Dockery, 2006; Watson, 2002).The specialized cancer agency of the World Health Orga-nization (WHO), the International Agency for Research onCancer (IARC), has classified outdoor PM as carcinogenic tohumans (Group 1) (http://www.iarc.fr/). For instance, dailymortality has been found to be related to the level of PM2.5sourced from traffic emission and coal combustion in six UScities (Laden et al., 2000). PM2.5 is a complex mixture of sul-fate (SO2−
4 ), nitrate (NO−
3 ), ammonium (NH+4 ), water (H2O),organic and element carbon (OC and EC), soil dust, traceelements, and persistent organic pollutants (Seinfeld et al.,2004; Zhang et al., 2013). It originates from both natural andanthropogenic sources, and includes both primary and sec-ondary particle species. Knowledge of sources and their con-tributions to PM2.5 is crucial in making feasible policies forcontrolling PM2.5 levels to protect human health and reducethe occurrence of hazy weather.
Source apportionment of PM2.5 has been achieved exten-sively around the world (Lee and Kang, 2001; Putaud et al.,2004; Hueglin et al., 2005; Lonati et al., 2005; Chen et al.,2010). Such a technique has been increasingly applied forthe past decade in China, although mostly focused on ur-ban cities and areas such as Beijing, the Yangtze River delta(YRD), and the Pearl River delta (PRD) (He et al., 2001;Ye et al., 2003; Tao et al., 2012; Zhang et al., 2013). Todate, PM2.5 pollution is still a severe problem in China. TheSichuan Basin is one of the most polluted regions in China(Cao et al., 2007; Zhao et al., 2010; Yang et al., 2011), asdemonstrated by the spatial distribution of aerosol opticaldepth (AOD) retrieved by satellites (Fig. 1; Remer et al.,2005).
Chengdu, located west of the Sichuan Basin (Fig. 1), is oneof the megacities in China with a population of more than10 million. This megacity is one of the few inland megac-ities worldwide which are far from oceans. Air pollution isa serious issue for this city, presumably due to the complextopography surrounding the city and huge amounts of coalconsumption (Tao et al., 2013). For example, PM2.5 concen-trations reached an annual mean of 165 µg m−3 in 2009 to2010, which is 5 times higher compared with the new na-tional ambient air quality standards (NAAQS) (35 µg m−3)and 16 times higher compared with the air quality guideline(10 µg m−3) recommended by the WHO (Tao et al., 2013).Achieving NAAQS in this city is apparently a challengingtask. A better understanding of PM2.5 sources and their rela-tive contributions is urgently needed to enact effective emis-sion control policies and to implement multi-pollutant reduc-tion measures. To date, studies on seasonal-based source ap-portionments remain lacking, yet they are critical in shed-ding light on emission control measures of air pollutants and
in creating emission control policies (Tao et al., 2013). Tofill these gaps, a comprehensive data set acquired in 2011 isanalyzed in the present study, with an emphasis on seasonal-based source apportionments.
Accordingly, the present study aims to accomplish the fol-lowing goals: to systematically characterize PM2.5 levels andtheir chemical compositions on seasonal and annual basis, toidentify PM2.5 source factors and to quantify their respectivecontributions, and to evaluate existing and recommend newenvironmental protection measures based on novel sourceapportionment results.
2 Methodology
2.1 Site description
PM2.5 samples were collected at the Chengdu ResearchAcademy of Environmental Sciences (CRAES) located in theurban area of Chengdu (30.65◦ N, 104.03◦ E) (Fig. 1). Instru-ments used in this study were installed on the roof (21 mabove ground) of an office building of CRAES. This sitewas built with unimpeded vision, although a residential areaand a park were situated about 100 m east of the samplingsite. In 2004, the Chengdu municipal government promul-gated the “Chengdu Plan of Industrial Development Layout(2003–2020)”, which forbids any pollution industries withinthe third-ring road inside the city (http://www.cdgy.gov.cn/Article/2004/200402/1165.html). The CRAES site is withinand more than 5 km away from the third-ring road (Supple-ment Fig. S1). Therefore, no major stationary air pollutionsources were present within a circumference of 5 km of thesite, except mobile emissions; however, the site was affectedby industrial pollution outside the third-ring road. Thus, thesite was considered to be representative of a typical urbanenvironment in Chengdu.
2.2 Sampling
PM2.5 samples were collected using two low-flow air sam-plers (MiniVol TAC, AirMetrics Corp., Eugene, OR, USA).Prior to the start of the sampling campaign, the flow rateof PM2.5 samplers was calibrated. Samples were collectedat a flow rate of 5 L min−1 on two types of filters: a 47 mmquartz fiber filter (Whatman QM-A) and a 47 mm Teflon fil-ter (Whatman PTFE). Quartz filters were pre-baked at 800◦Cfor 3 h prior to sampling. Collected filters were stored in afreezer at−18◦C before chemical analysis to minimize evap-oration of volatile components.
A total of 117 PM2.5 samples along with 12 blank sampleswere collected in 2011 during the following periods: 6–30January (representative of winter), 3 April–3 May (spring),1–31 July (summer), and 1–31 October (autumn). Collec-tion duration of each sample was 24 h, starting at 10:00 localtime (LT) each day and ending at 10:00 LT the following day.Three field blanks were collected with each sampler during
Atmos. Chem. Phys., 14, 8679–8699, 2014 www.atmos-chem-phys.net/14/8679/2014/

J. Tao et al.: PM2.5 pollution in a megacity of southwest China 8681
Figure 1. Sampling location (30.65◦ N, 104.03◦ E) in Chengdu on a regional map superimposed with spatial distribution of annual meanaerosol optical depth (AOD) retrieved from Moderate Resolution Imaging Spectrometer (MODIS) satellite remote sensing in 2011.
every seasonal campaign, which were then analyzed togetherwith the samples.
2.3 Gravimetric weighing
Teflon filters were measured gravimetrically for particle massconcentration using a Sartorius MC5 electronic microbal-ance with a sensitivity of±1 µg (Sartorius, Göttingen, Ger-many) after 24 h equilibration at 23± 1◦C with relative hu-midity at 40± 5 %. Each filter was weighed at least threetimes before and after sampling. Differences among repli-cate weights were mostly less than 20 µg for each sample.Net mass was obtained by subtracting pre-weight from post-weight.
2.4 Chemical analysis
2.4.1 OC and EC
An area of 0.526 cm2 punched from each quartz filter was an-alyzed for eight carbon fractions following the IMPROVE_Athermal/optical reflectance (TOR) protocol on a DRI model2001 carbon analyzer (Atmoslytic Inc., Calabasas, CA,USA) (Chow et al., 2007). This analysis acquired four OCfractions (OC1, OC2, OC3, and OC4 at 140, 280, 480, and580◦C, respectively, in a helium (He) atmosphere), OP (apyrolyzed carbon fraction determined when transmitted laserlight attains its original intensity after oxygen (O2) was addedto the analysis atmosphere), and three EC fractions (EC1,EC2, and EC3 at 580, 740, and 840◦C, respectively, in a 2 %O2 / 98% He atmosphere). IMPROVE_TOR OC is opera-tionally defined as OC1+ OC2+ OC3+ OC4+ OP and ECis defined as EC1+ EC2+ EC3− OP (Chow et al., 2007).
www.atmos-chem-phys.net/14/8679/2014/ Atmos. Chem. Phys., 14, 8679–8699, 2014
8682 J. Tao et al.: PM2.5 pollution in a megacity of southwest China
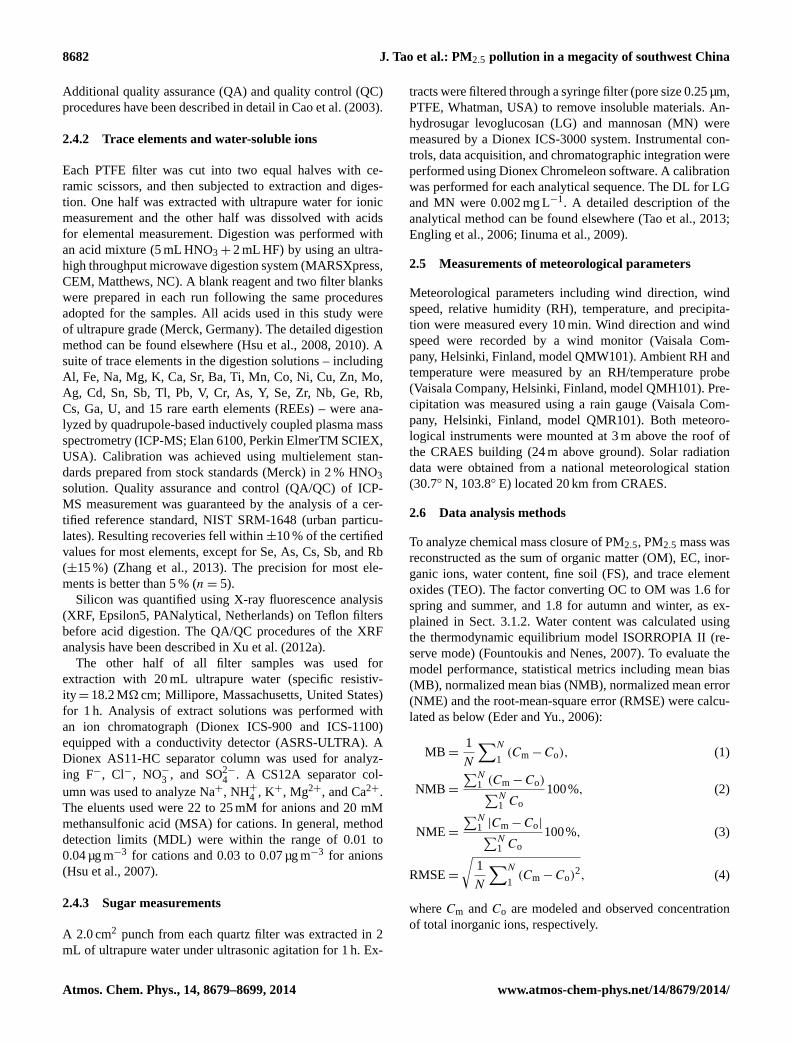
Additional quality assurance (QA) and quality control (QC)procedures have been described in detail in Cao et al. (2003).
2.4.2 Trace elements and water-soluble ions
Each PTFE filter was cut into two equal halves with ce-ramic scissors, and then subjected to extraction and diges-tion. One half was extracted with ultrapure water for ionicmeasurement and the other half was dissolved with acidsfor elemental measurement. Digestion was performed withan acid mixture (5 mL HNO3 + 2 mL HF) by using an ultra-high throughput microwave digestion system (MARSXpress,CEM, Matthews, NC). A blank reagent and two filter blankswere prepared in each run following the same proceduresadopted for the samples. All acids used in this study wereof ultrapure grade (Merck, Germany). The detailed digestionmethod can be found elsewhere (Hsu et al., 2008, 2010). Asuite of trace elements in the digestion solutions – includingAl, Fe, Na, Mg, K, Ca, Sr, Ba, Ti, Mn, Co, Ni, Cu, Zn, Mo,Ag, Cd, Sn, Sb, Tl, Pb, V, Cr, As, Y, Se, Zr, Nb, Ge, Rb,Cs, Ga, U, and 15 rare earth elements (REEs) – were ana-lyzed by quadrupole-based inductively coupled plasma massspectrometry (ICP-MS; Elan 6100, Perkin ElmerTM SCIEX,USA). Calibration was achieved using multielement stan-dards prepared from stock standards (Merck) in 2 % HNO3solution. Quality assurance and control (QA/QC) of ICP-MS measurement was guaranteed by the analysis of a cer-tified reference standard, NIST SRM-1648 (urban particu-lates). Resulting recoveries fell within±10 % of the certifiedvalues for most elements, except for Se, As, Cs, Sb, and Rb(±15 %) (Zhang et al., 2013). The precision for most ele-ments is better than 5 % (n = 5).
Silicon was quantified using X-ray fluorescence analysis(XRF, Epsilon5, PANalytical, Netherlands) on Teflon filtersbefore acid digestion. The QA/QC procedures of the XRFanalysis have been described in Xu et al. (2012a).
The other half of all filter samples was used forextraction with 20 mL ultrapure water (specific resistiv-ity = 18.2 M� cm; Millipore, Massachusetts, United States)for 1 h. Analysis of extract solutions was performed withan ion chromatograph (Dionex ICS-900 and ICS-1100)equipped with a conductivity detector (ASRS-ULTRA). ADionex AS11-HC separator column was used for analyz-ing F−, Cl−, NO−
3 , and SO2−
4 . A CS12A separator col-umn was used to analyze Na+, NH+
4 , K+, Mg2+, and Ca2+.The eluents used were 22 to 25 mM for anions and 20 mMmethansulfonic acid (MSA) for cations. In general, methoddetection limits (MDL) were within the range of 0.01 to0.04 µg m−3 for cations and 0.03 to 0.07 µg m−3 for anions(Hsu et al., 2007).
2.4.3 Sugar measurements
A 2.0 cm2 punch from each quartz filter was extracted in 2mL of ultrapure water under ultrasonic agitation for 1 h. Ex-
tracts were filtered through a syringe filter (pore size 0.25 µm,PTFE, Whatman, USA) to remove insoluble materials. An-hydrosugar levoglucosan (LG) and mannosan (MN) weremeasured by a Dionex ICS-3000 system. Instrumental con-trols, data acquisition, and chromatographic integration wereperformed using Dionex Chromeleon software. A calibrationwas performed for each analytical sequence. The DL for LGand MN were 0.002 mg L−1. A detailed description of theanalytical method can be found elsewhere (Tao et al., 2013;Engling et al., 2006; Iinuma et al., 2009).
2.5 Measurements of meteorological parameters
Meteorological parameters including wind direction, windspeed, relative humidity (RH), temperature, and precipita-tion were measured every 10 min. Wind direction and windspeed were recorded by a wind monitor (Vaisala Com-pany, Helsinki, Finland, model QMW101). Ambient RH andtemperature were measured by an RH/temperature probe(Vaisala Company, Helsinki, Finland, model QMH101). Pre-cipitation was measured using a rain gauge (Vaisala Com-pany, Helsinki, Finland, model QMR101). Both meteoro-logical instruments were mounted at 3 m above the roof ofthe CRAES building (24 m above ground). Solar radiationdata were obtained from a national meteorological station(30.7◦ N, 103.8◦ E) located 20 km from CRAES.
2.6 Data analysis methods
To analyze chemical mass closure of PM2.5, PM2.5 mass wasreconstructed as the sum of organic matter (OM), EC, inor-ganic ions, water content, fine soil (FS), and trace elementoxides (TEO). The factor converting OC to OM was 1.6 forspring and summer, and 1.8 for autumn and winter, as ex-plained in Sect. 3.1.2. Water content was calculated usingthe thermodynamic equilibrium model ISORROPIA II (re-serve mode) (Fountoukis and Nenes, 2007). To evaluate themodel performance, statistical metrics including mean bias(MB), normalized mean bias (NMB), normalized mean error(NME) and the root-mean-square error (RMSE) were calcu-lated as below (Eder and Yu., 2006):
MB =1
N
∑N
1(Cm − Co), (1)
NMB =
∑N1 (Cm − Co)∑N
1 Co100%, (2)
NME =
∑N1 |Cm − Co|∑N
1 Co100%, (3)
RMSE=
√1
N
∑N
1(Cm − Co)
2, (4)
whereCm andCo are modeled and observed concentrationof total inorganic ions, respectively.
Atmos. Chem. Phys., 14, 8679–8699, 2014 www.atmos-chem-phys.net/14/8679/2014/

J. Tao et al.: PM2.5 pollution in a megacity of southwest China 8683
The FS component was estimated using the following for-mula (Malm et al., 1994):
[FS]=2.20[Al ]+2.49[Si]+1.63[Ca]+2.42[Fe]+1.94[Ti]. (5)
However, Si is mostly volatilized as SiF4 in acid digestionwhen using HF. Thus, we used Si data analyzed by XRF,whereas the data for other four elements were obtained fromICP-MS measurement.
For TEO, the contribution of heavy metals as metal ox-ides was estimated using the following equation (Zhang etal., 2013):
TEO=1.3× [0.5× (Sr+ Ba+ Mn + Co+ Rb+ Ni + V)
+1.0× (Cu+ Zn+ Mo + Cd+ Sn+ Sb+ Tl + Pb
+As+ Se+ Ge+ Cs+ Ga)]. (6)
Source apportionment analysis was conducted using positivematrix factorization (PMF) model version 3.0 of the Environ-mental Protection Agency (EPA), US (Norris et al., 2008). Toreduce uncertainties of PMF results, chemical componentswith annual average concentrations below MDLs were re-moved, such as F− and REEs, which are essentially similarto the major crustal elements such as Al. Thirty-five chemi-cal components were used for the PMF model, including OC,EC, LG, Na+, NH+
4 , K+, Mg2+, Ca2+, Cl−, NO−
3 , SO2−
4 ,Al, Fe, Mg, Ca, Sr, Ba, Ti, Mn, Ni, Cu, Zn, Mo, Cd, Sn,Sb, Tl, Pb, V, Cr, As, Se, Zr, Ge, Rb, Cs, and Ga. To deter-mine the appropriate number of source factors, a reasonablepractice is to test different numbers of identifiable sourcescommonly used and to consider the major potential sourcesdocumented by the local Environmental Protection Bureau.In this study, we have tested five, six, seven, and even eightdifferent sources in the PMF analysis. Then, PMF was runseveral times with different Fpeak values to determine therange within which the objective functionQ values remainsrelatively constant (Supplement Fig. S2). In the six-factormodel, a value ofFpeak= −0.1 provided the most physicallyreasonable source profiles.
Three-day backward trajectories were calculated at an el-evation of 500 and 1500 m for every sampling day startingat 02:00 UTC (10:00 LT) using the HYbrid Single-ParticleLagrangian Integrated Trajectory (HYSPLIT) 4 trajectorymodel (http://ready.arl.noaa.gov/HYSPLIT.php) to investi-gate synoptic patterns and transport routes of air masses(Draxler and Rolph, 2013; Rolph, 2013). The model adoptedmeteorological data from FNL (final operational global anal-ysis) as input.
3 Results and discussion
3.1 General characteristics of PM2.5 andchemical components
The annual average of PM2.5 mass concentrations inChengdu was 119± 56 µg m−3 (Table 1), which was 3 times
higher than the NAAQS for annual PM2.5 (35 µg m−3). Assummarized in Table 1, the PM2.5 level in Chengdu wasonly significantly lower than that for one inland megacity,Xi’an (194 µg m−3), located in northwest China (Zhang etal., 2011), and was comparable with the other two megacities– Chongqing (Yang et al., 2011), also located in the SichuanBasin, and Beijing (Zhang et al., 2013). However, PM2.5 inChengdu was much higher than those observed in coastalmegacities, such as Tianjin (Gu et al., 2010), Shenyang (Maet al., 2011), Shanghai (Feng et al., 2009), Fuzhou (Xu et al.,2012b), Xiamen (Zhang et al., 2012), Guangzhou (Tao et al.,2014), and Hong Kong (Louie et al., 2005). The annual av-erage PM2.5 in Chengdu was higher by a factor of 3 to 15compared with those in other developed countries (Balasub-ramanian et al., 2003; Heo et al., 2009; Khan et al., 2009;Pinto et al., 2004; Querol et al., 2004). Thus, Chengdu is suf-fering from a considerably severe PM2.5 pollution problemin the world.
A typical seasonal variation in PM2.5 mass concentrationswas observed (Table 2), with higher concentrations in winter(158 µg m−3) and spring (126 µg m−3) and lower concentra-tions in autumn (111 µg m−3) and summer (89 µg m−3). Gen-erally, PM2.5 levels are governed by emissions, transporta-tion, chemical transformation, and depositional processes,which are all related to meteorological conditions. However,systematic investigations on PM2.5 emission inventories havenot been conducted in Sichuan (including Chengdu). Thehighest wintertime PM2.5 concentration could be partly re-lated to certain weather conditions in terms of low mixingheight because of weak solar radiation (Supplement Fig. S3).By contrast, the lowest summertime concentration was inpart due to frequent rainfall (Supplement Fig. S3), which ledto efficient removal of suspended particles from the atmo-sphere (Wang et al., 2010).
3.1.1 Carbonaceous aerosols and biomassburning markers
Annual mean concentrations of OC and EC were 17± 8 and7± 4 µg m−3, accounting for PM2.5 masses of 14.3± 4.4and 5.7± 1.5%, respectively (Table 2). Seasonal variationof EC was similar to that of PM2.5, following the orderof winter (8± 8 µg m−3) > spring (7± 5 µg m−3) ≥ autumn(7± 3 µg m−3) > summer (6± 3 µg m−3). However, theseasonal pattern of OC was somewhat different fromthose of EC and PM2.5, with the second highest sea-son in autumn (20± 9 µg m−3) instead of in spring(15± 7 µg m−3). The distinct seasonality between OCand EC implies likely changes in the strength of theirrespective sources in different seasons. LG concentra-tions were nearly identical in autumn (659± 441 ng m−3)and winter (635± 246 ng m−3), followed by spring(235± 151 ng m−3) and summer (152± 89 ng m−3), with anannual mean of 412± 352 ng m−3. However, MN showeda more typical seasonality compared with LG, with a
www.atmos-chem-phys.net/14/8679/2014/ Atmos. Chem. Phys., 14, 8679–8699, 2014
8684 J. Tao et al.: PM2.5 pollution in a megacity of southwest China
Table 1.Statistics of annual PM2.5 mass concentrations in urban Chengdu and other cities in the world.
City/nation Sampling PM2.5 Referenceperiod (µg m−3)
Chengdu, southwest China 2011 119 This studyChongqing, southwest China 2005–2006 129.0 Yang et al. (2011)Xi’an, northwest China 2009 194.1 Zhang et al. (2011)Beijing, north China 2009–2010 135.0 Zhang et al. (2013)Tianjin, north China 2008 109.8 Gu et al. (2010)Shenyang, northeast China 2006–2008 75 Ma et al. (2011)Shanghai, east China 2005–2006 90.3 Feng et al. (2009)Fuzhou, southeast China 2007–2008 44.33 Xu et al. (2012b)Xiamen, southeast China 2009–2010 86.16 Zhang et al. (2012)Guangzhou, south China 2009–2010 76.0 Tao et al. (2014)Hong Kong, south China 2000–2001 56.7 Louie et al. (2005)Seoul, Korea 2003–2006 43.5 Heo et al. (2009)Yokohama, Japan 2007–2008 20.6 Khan et al. (2009)Singapore, Singapore 2000 27.2 Balasubramanian et al. (2003)27 urban sites, US 1999–2000 < 35 Pinto et al. (2004)Austria; Germany; Switzerland; 1998–2002 16–30 Querol et al. (2004)Netherlands; UK (central Europe)Sweden (northern Europe) 1998–2002 8–15 Querol et al. (2004)Spain (southern Europe) 1998–2002 19–25 Querol et al. (2004)
maximum (80± 34 ng m−3) in winter, followed by autumn(36± 27 ng m−3), spring (19± 17 ng m−3), and summer(9± 7 ng m−3). The levels of these two markers were muchhigher than those measured in European countries such asSweden (Szidat et al., 2009), Belgium (Zdráhal et al., 2002),Switzerland (Szidat et al., 2006), and Norway (Yttri et al.,2009).
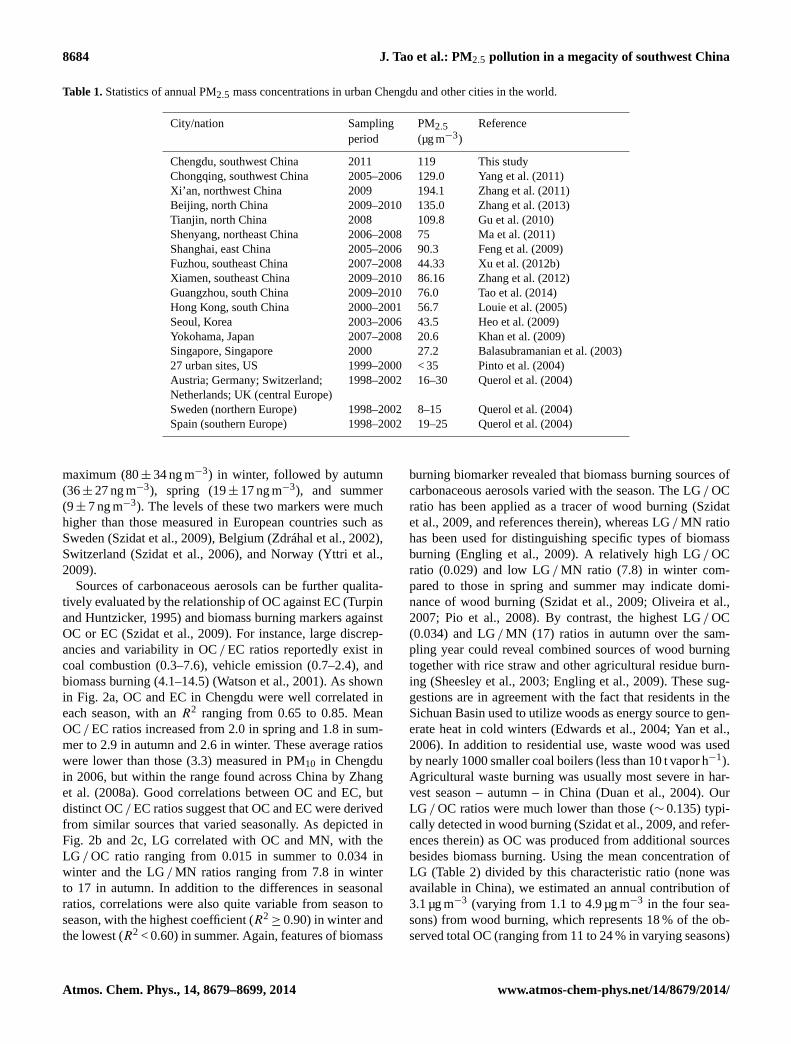
Sources of carbonaceous aerosols can be further qualita-tively evaluated by the relationship of OC against EC (Turpinand Huntzicker, 1995) and biomass burning markers againstOC or EC (Szidat et al., 2009). For instance, large discrep-ancies and variability in OC/ EC ratios reportedly exist incoal combustion (0.3–7.6), vehicle emission (0.7–2.4), andbiomass burning (4.1–14.5) (Watson et al., 2001). As shownin Fig. 2a, OC and EC in Chengdu were well correlated ineach season, with anR2 ranging from 0.65 to 0.85. MeanOC/ EC ratios increased from 2.0 in spring and 1.8 in sum-mer to 2.9 in autumn and 2.6 in winter. These average ratioswere lower than those (3.3) measured in PM10 in Chengduin 2006, but within the range found across China by Zhanget al. (2008a). Good correlations between OC and EC, butdistinct OC/ EC ratios suggest that OC and EC were derivedfrom similar sources that varied seasonally. As depicted inFig. 2b and 2c, LG correlated with OC and MN, with theLG / OC ratio ranging from 0.015 in summer to 0.034 inwinter and the LG/ MN ratios ranging from 7.8 in winterto 17 in autumn. In addition to the differences in seasonalratios, correlations were also quite variable from season toseason, with the highest coefficient (R2
≥ 0.90) in winter andthe lowest (R2 < 0.60) in summer. Again, features of biomass
burning biomarker revealed that biomass burning sources ofcarbonaceous aerosols varied with the season. The LG/ OCratio has been applied as a tracer of wood burning (Szidatet al., 2009, and references therein), whereas LG/ MN ratiohas been used for distinguishing specific types of biomassburning (Engling et al., 2009). A relatively high LG/ OCratio (0.029) and low LG/ MN ratio (7.8) in winter com-pared to those in spring and summer may indicate domi-nance of wood burning (Szidat et al., 2009; Oliveira et al.,2007; Pio et al., 2008). By contrast, the highest LG/ OC(0.034) and LG/ MN (17) ratios in autumn over the sam-pling year could reveal combined sources of wood burningtogether with rice straw and other agricultural residue burn-ing (Sheesley et al., 2003; Engling et al., 2009). These sug-gestions are in agreement with the fact that residents in theSichuan Basin used to utilize woods as energy source to gen-erate heat in cold winters (Edwards et al., 2004; Yan et al.,2006). In addition to residential use, waste wood was usedby nearly 1000 smaller coal boilers (less than 10 t vapor h−1).Agricultural waste burning was usually most severe in har-vest season – autumn – in China (Duan et al., 2004). OurLG / OC ratios were much lower than those (∼ 0.135) typi-cally detected in wood burning (Szidat et al., 2009, and refer-ences therein) as OC was produced from additional sourcesbesides biomass burning. Using the mean concentration ofLG (Table 2) divided by this characteristic ratio (none wasavailable in China), we estimated an annual contribution of3.1 µg m−3 (varying from 1.1 to 4.9 µg m−3 in the four sea-sons) from wood burning, which represents 18 % of the ob-served total OC (ranging from 11 to 24 % in varying seasons)
Atmos. Chem. Phys., 14, 8679–8699, 2014 www.atmos-chem-phys.net/14/8679/2014/
J. Tao et al.: PM2.5 pollution in a megacity of southwest China 8685
Figure 2.
Figure 2. Scatter plots of OC vs. EC(a), LG vs. OC(b), and LG vs. MN(c) in four seasons. Also shown are the linear regression lines withregression equations.
in Chengdu. The annual mean proportion is lower than that(∼ 30 %) acquired from PMF modeling, which is presentedbelow. This finding indicates that biomass burning other thanwood burning sources (e.g., agricultural waste burning) ac-counted for the rest of the contributions (i.e.,∼ 10 %) to theOC.
Lei et al. (2011) reported that the 2005 primary OC and ECemissions from anthropogenic sources in China were 1.51and 3.19 Tg, respectively. In Sichuan province, the residen-tial sector was the largest contributor, constituting 47 % toblack carbon (BC) and 81 % to OC. In other regions of China,the dominant sector could be different (Cao et al., 2006; Zhaoet al., 2012). For example, the industrial sector is dominantin northern China provinces such as Hebei, Shanxi, Shan-dong, and Henan. According to Qin and Xie (2012), annualBC emission from Sichuan in 2009 has increased to over0.14 Tg. Coal was still the most predominant fuel used inChina, which alone contributed nearly 50 % to the nationalBC emission (Qin and Xie, 2012). Based on the coincidenceof OC/ EC ratios between the PM2.5 aerosols (annual mean∼ 2.4) and emissions (∼ 2.1), coal combustion appeared tobe an important source of carbonaceous aerosols through-out the year. The factor converting OC to OM has been sug-gested to vary with its dominant sources and the age of or-ganic aerosols (Turpin and Lim, 2001; Andreae and Rosen-feld, 2008). In the present study, a value of 1.6 was adoptedfor spring and summer, and 1.8 for autumn and winter. Thesevalues were consistent with those recently observed acrossChina (Xing et al., 2013), although slightly lower than thosefound across the US, which had a median value of 1.80 to1.95 (Simon et al., 2011).
3.1.2 Water-soluble ions
Water-soluble ions also comprised important constituents ofPM2.5. The sum of all the major water-soluble ions aver-aged 52± 29 µg m−3 in Chengdu (Table 2), accounting for42± 9 % of PM2.5 mass. SO2−
4 , NO−
3 , and NH+
4 were the
dominant ions, and their combination constituted 90± 5 %of total ion concentrations. To investigate the associationsamong ions, a thermodynamic equilibrium model, ISOR-ROPIA II (Fountoukis and Nenes, 2007), was applied to sim-ulate chemical components and phase state of major ions inthermodynamic equilibrium conditions. Water and inorganicsalt concentrations were simultaneously estimated by ISOR-ROPIA II model (reserve mode) at a fixed relative humidity(RH 40 %) and temperature (23◦C). Seven compounds thathad concentrations larger than zero were derived (Table 3).On annual average, the total concentrations of all inorganicchemical species calculated by ISORROPIA II model was51± 28 µg m−3, which was very close to the sum of all theobserved ions concentrations (52± 29 µg m−3). To evaluateISORROPIA II model performances, the statistical parame-ters MB, NMB, NME, and RMSE for total ion concentra-tions were calculated by Eqs. (1)–(4). The MB, NMB, NME,and RMSE values are−1.2, −2.3, 2.3, and 1.6 %, suggest-ing that the ISORROPIA II model can reasonably simulatemost of the observed ions. Both SO2−
4 and NO−
3 were mostlyassociated with NH+4 , present in the forms of (NH4)2SO4and NH4NO3. All Cl − were exclusively present in the formof NH4Cl. Besides NH+4 , the other four cations (K+, Na+,Ca2+, and Mg2+) were also associated with SO2−
4 . Sea-sonal variations in concentrations of the predominant chem-ical species, (NH4)2SO4 and NH4NO3, were consistent withthose of SO2−
4 and NO−
3 concentrations that showed the high-est concentrations in winter and the lowest in summer or au-tumn (Table 2). Liquid water derived by the ISORROPIA IImodel reached 15.0± 8.4 µg m−3 on the average, followingsimilar seasonal patterns of major ions.
3.1.3 Metal elements
Daily concentrations of FS and TEO were calculated us-ing Eqs. (5) and (6). Annual concentrations of FS andTEO were 6.7± 4.4 and 1.1± 0.6 µg m−3, which accountedfor 6.3± 4.8 and 0.9± 0.3 %, respectively, of PM2.5 mass.
www.atmos-chem-phys.net/14/8679/2014/ Atmos. Chem. Phys., 14, 8679–8699, 2014
8686 J. Tao et al.: PM2.5 pollution in a megacity of southwest China
Table 2.Statistics of PM2.5 chemical components in four seasons.
Annual Spring Summer Autumn Winter(n = 117) (n = 31) (n = 30) (n = 31) (n = 25)
PM2.5/µg m−3 119± 56 126± 66 89± 35 111± 49 158± 51OC/µg m−3 17± 8 15± 7 11± 4 20± 9 22± 7EC/µg m−3 7± 4 7± 5 6± 3 7± 3 8± 4Na+/µg m−3 0.6± 0.3 0.7± 0.3 0.5± 0.2 0.5± 0.3 0.5± 0.2NH+
4 /µg m−3 11.6± 7.3 11.9± 10.0 9.0± 5.0 11.1± 6.0 15.3± 5.7K+/µg m−3 1.7± 0.8 1.5± 0.8 1.3± 0.6 1.8± 0.7 2.1± 0.7Mg2+/µg m−3 0.1± 0.0 0.1± 0.1 0.1± 0.0 0.0± 0.0 0.1± 0.0Ca2+/µg m−3 0.4± 0.3 0.6± 0.4 0.3± 0.2 0.3± 0.1 0.3± 0.1F−/µg m−3 0.1± 0.1 0.1± 0.1 0.0± 0.0 0.1± 0.1 0.1± 0.0Cl−/µg m−3 1.7± 1.7 1.5± 1.5 0.4± 0.4 2.5± 1.6 2.8± 1.9NO−
3 /µg m−3 10.7± 7.8 10.2± 8.7 5.3± 3.2 12.9± 8.5 15.5± 5.4
SO2−
4 /µg m−3 25.0± 14.1 26.4± 18.1 23.7± 13.5 19.2± 9.6 31.8± 10.7LG/ng m−3 412± 352 235± 151 152± 89 659± 441 635± 246MN/ng m−3 34± 35 19± 17 9± 7 36± 27 80± 34Al/ng m−3 560± 420 898± 581 427± 331 462± 217 426± 201Fe/ng m−3 693± 420 899± 561 610± 363 640± 303 606± 335Na/ng m−3 837± 680 865± 413 736± 342 847± 344 658± 283Mg/ng m−3 196± 164 299± 251 147± 123 166± 78 164± 86K/ng m−3 1576± 751 1575± 876 1312± 623 1757± 777 1681± 640Ca/ng m−3 402± 339 588± 440 341± 344 389± 218 262± 203Sr/ng m−3 5.7± 4.1 7.5± 4.9 3.6± 2.5 5.4± 3.1 6.6± 4.6Ba/ng m−3 22± 17 26± 13 13± 6 23± 15 30± 24Ti/ng m−3 50 ± 33 71± 43 46± 32 47± 23 35± 17Mn/ng m−3 66± 37 78± 51 59± 28 63± 32 65± 28Ni/ng m−3 2.5± 1.6 2.5± 1.4 2.0± 0.8 2.6± 1.5 3.2± 2.3Cu/ng m−3 23± 12 26± 15 23± 10 18± 10 27± 12Zn/ng m−3 350± 230 440± 318 324± 182 310± 164 319± 205Mo/ng m−3 3.8± 3.8 2.6± 1.7 2.7± 1.5 4.6± 4.3 5.4± 5.8Cd/ng m−3 3.5± 1.9 4.1± 2.4 3.1± 1.5 3.0± 1.6 4.0± 2.0Sn/ng m−3 10.6± 6.9 12.7± 9.3 9.0± 4.7 9.7± 5.9 11.0± 6.6Sb/ng m−3 6.5± 4.2 8.2± 5.5 4.8± 2.4 5.2± 2.9 8.1± 4.3Tl/ng m−3 1.9± 1.1 2.5± 1.6 1.4± 0.4 1.6± 0.8 2.3± 1.1Pb/ng m−3 172± 86 198± 107 142± 58 154± 68 198± 94V/ng m−3 1.7± 0.9 2.2± 1.2 1.4± 0.7 1.6± 0.7 1.6± 0.6Cr/ng m−3 9.2± 5.0 10.0± 6.4 9.7± 3.8 8.6± 5.0 8.3± 4.2As/ng m−3 20± 11 19± 12 21± 12 22± 10 18± 10Se/ng m−3 2.7± 1.2 2.9± 1.6 2.3± 0.7 2.9± 1.3 2.9± 1.0Zr/ng m−3 2.8± 1.6 4.0± 1.9 2.3± 1.2 2.5± 1.3 2.4± 1.2Ge/ng m−3 1.1± 0.6 1.2± 0.7 0.9± 0.3 1.0± 0.5 1.2± 0.5Rb/ng m−3 7.6± 3.7 8.6± 5.0 6.6± 2.7 7.2± 3.2 8.2± 3.0Cs/ng m−3 1.2± 0.6 1.1± 0.7 1.2± 0.6 1.3± 0.7 1.2± 0.5Ga/ng m−3 5.8± 3.1 5.9± 3.5 5.1± 2.1 6.3± 3.5 5.8± 3.1Si∗/ng m−3 1204± 860 1962± 1142 933± 719 868± 392 1020± 351
∗ Si analysis by XRF method.
Seasonal concentrations of FS decreased from 10.1 µg m−3
in spring to 5.5 µg m−3 in autumn and 5.4 µg m−3 in win-ter and summer. For TEO, seasonal variability was relativelysmall, declining from 1.3 µg m−3 in spring to 1.1 µg m−3 inwinter, 1.0 µg m−3 in autumn, and 0.9 µg m−3 in summer.
Both FS and TEO concentrations similarly waxed in spring,with small fluctuations seen in the other seasons.
The total concentration of all the trace metals (i.e., exclud-ing Al, Fe, Na, Mg, K, and Ca) was 0.8± 0.4 µg m−3, con-stituting 0.7± 0.3 % of PM2.5 mass. As, Cd, Co, Cr, Ni, Pb,
Atmos. Chem. Phys., 14, 8679–8699, 2014 www.atmos-chem-phys.net/14/8679/2014/

J. Tao et al.: PM2.5 pollution in a megacity of southwest China 8687
Table 3.The calculated chemical components and phase state of ions (µg m−3) in lab condition (temp: 23◦C; RH: 40 %) in Chengdu. Resultswere modeled by the ISORROPIA II.
Annual Spring Summer Autumn Winter(n = 117) (n = 31) (n = 30) (n = 31) (n = 25)
(NH4)2SO4 28.3± 18.1 29.2± 23.1 27.5± 17.6 20.7± 12.0 37.4± 13.8Na2SO4 1.8± 0.9 2.2± 1.0 1.6± 0.7 1.7± 0.8 1.6± 0.7K2SO4 3.8± 1.7 3.4± 1.9 3.0± 1.3 4.1± 1.7 4.7± 1.6MgSO4 0.3± 0.2 0.5± 0.4 0.3± 0.2 0.2± 0.1 0.4± 0.2CaSO4 1.2± 0.9 2.0± 1.3 0.9± 0.7 0.9± 0.5 1.0± 0.4NH4NO3 13.5± 10.3 12.8± 11.3 5.9± 4.3 16.7± 10.9 19.6± 7.3NH4Cl 1.9± 2.5 1.6± 2.4 0.3± 0.4 3.7± 2.3 2.1± 2.7H2O(aq) 15.0± 8.4 15.3± 10.6 12.4± 6.9 13.1± 6.8 19.8± 6.96 species 64.2± 36.4 66.7± 46.9 50.9± 27.3 58.2± 30.9 84.7± 29.36 species/PM2.5(%) 54.8± 16.1 51.2± 14.6 61.7± 20.6 51.2± 16.0 55.3± 6.7
and Se are well-known carcinogenic heavy metals registeredin the US Agency for Toxic Substances and Disease Registry.Noticeably, the annual mean concentration of As in Chengduexceeded the WHO standard (6.6 ng m−3, lifetime risk levelis 1 : 100 000) by a factor of 3 (World Health Organization,2000). Twenty-five of the 117 samples exceeded 5 ng m−3
Cd concentration, which is the WHO’s guide value (WorldHealth Organization, 2000).
Enrichment factors (EFs) relative to the Earth’s upper crustcomposition can be used for assessing the anomaly of el-emental composition of aerosol particles. In this study, Alserved as a reference element. The average composition ofEarth’s crust was referenced from Hans Wedepohl (1995).The EFs of Zr, Ca, Mg, Ti, Sr, Fe, Ba, V, Na, and K wereless than 10; EFs of Rb, Mn, Ni, Cs, Cr, Ga, and Ge rangedfrom 10 to 100; and EFs of Cu, Tl, Mo, Sn, Zn, Pb, As,Sb, Cd, and Se were larger than 100 (Fig. 3). The EFs ofcarcinogenic heavy metals, As, Cd, Co, Cr, Ni, Pb, and Sewere 1772± 1091, 6060± 3942, 6± 5, 47± 31, 25± 21,1753± 814, and 6095± 3261, respectively, indicating thatthese heavy metals were of anthropogenic origins, exceptfor Co, which was further analyzed below by the PMF re-sults. Therefore, carcinogenic heavy metal pollution, espe-cially As, in Chengdu was serious. Control strategies mustbe undertaken to alleviate heavy metal loadings.
3.2 Reconstructed PM2.5 mass
The PM2.5 mass in Chengdu was reconstructed on seasonaland annual basis by employing the methods described inSect. 2.6. PM2.5 mass concentrations could be reconstructedby combining the main components, as depicted in Fig. 4.The correlations (R2) between the reconstructed and mea-sured mass concentrations were higher than 0.93 in all theseasons and the seasonal average mass ratio ranged from0.90 to 0.99. On average, the reconstructed masses explained92± 11 % of measured ones, indicating a good performanceof the formulations applied. Based on the results, PM2.5
Figure 3.
Figure 3. Enrichment factors of trace elements.
in the urban area of Chengdu was composed of OM, EC,FS, TEO, inorganic ions, and water, with contributions of24.5± 8.4, 5.7± 1.5, 6.3± 4.8, 0.9± 0.3, 42.2± 9.0, and12.2± 3.0 %, respectively.
As illustrated in Fig. 5, the total of inorganic ions was thelargest contributor to PM2.5, accounting for a relatively con-stant fraction of 40 to 44 % in the four seasons. Also, con-tributions of EC, TEO, and water to PM2.5 were relativelyconstant from season to season. However, seasonal varia-tions were evident for the contributions of OM and FS toPM2.5, with OM contributed 19.4, 19.8, 33.4, and 25.6 %in spring, summer, autumn, and winter, respectively, and FScontributed 9.3, 6.4, 5.3, and 3.7 %, respectively. Fig. 2aand b show relatively higher OC/ EC ratios (2.9 and 2.6,respectively) and better correlations (R2
= 0.73 and 0.90,respectively) between biomass burning tracer LG and OCin autumn and winter, demonstrating more OM contributedfrom biomass burning in autumn and winter. Because PM2.5concentrations were lower in summer than those in autumnand winter, the resulting contribution of FS to PM2.5 was
www.atmos-chem-phys.net/14/8679/2014/ Atmos. Chem. Phys., 14, 8679–8699, 2014

8688 J. Tao et al.: PM2.5 pollution in a megacity of southwest China
Figure 4.
Figure 4. Correlation between reconstructed and measured PM2.5mass concentrations in four seasons. Also shown are the linear re-gression lines with regression equations.
relatively higher in summer than those in autumn and winter.These results suggest that biomass burning and soil dust hadcontrasting trends in contributing to PM2.5, with more OMcontributions in autumn and winter and more dust contribu-tions in spring and summer, which is also consistent with thePMF results, as discussed in the next section.
3.3 Source apportionment
Based on the PMF modeling results, six main source factorswere identified, including secondary inorganic aerosols, coalcombustion, biomass burning, the iron and steel industry,Mo-related industries, and soil dust. Modeled source profilestogether with the relative contributions of individual sourcesto each analyzed species are shown in Fig. 6. Their contri-butions are summarized in Table 4. The annual and seasonalaverages of the absolute (µg m−3) and fractional (%) contri-butions from each source were calculated based on their dailyvalues simulated by PMF model. As expected, the annual av-erages of absolute and fractional contributions from identi-fied sources, except the obvious seasonal sources – biomassburning and soil dust – are larger than their respective stan-dard deviations. This suggests that the PMF results mightbe reasonable. To further confirm this assumption, the mod-eled time series of the contributions from each source wascompared with the observed time series of certain chemicalspecies that could represent respective sources (Fig. 7).
Figure 5.
Figure 5. Chemical mass closures of PM2.5 mass concentrationsin four seasons. The major chemical components include inorganicsalts, organic matter (OM), elemental carbon (EC), fine soil (FS),trace element oxides (TEO), and water content, as well as othersthat were unidentified.
The first source comprises secondary inorganic aerosols,characterized by high NH+4 , SO2−
4 , and NO−
3 concentrations(Fig. 6a) (Zhang et al., 2013). The PMF-derived secondaryinorganic aerosols accounted for 37± 18 % of the PM2.5 (Ta-ble 4). These secondary products were formed from the ox-idation of main precursor gases, sulfur dioxide (SO2) andnitrogen oxides (NOx), that were mainly emitted from coalcombustion, vehicle exhausts, and even biomass burning,which in turn interacted with ammonia (NH3) emitted mainlyfrom agricultural activities and livestock waste. The ammo-nium ion is a typical secondary pollutant that is often a goodtracer of secondary inorganic aerosols. As expected, tempo-ral variations of secondary inorganic aerosol and NH+
4 con-centrations were coincident (Fig. 7a), with anR2 of 0.76.
The second source is coal combustion, characterized byhigh EC, Zn, Cu, Sn, Sb, Tl, and Pb concentrations (Fig. 6b).This source represented a mean contribution of 20± 12 % toPM2.5, with a maximal absolute contribution (∼ 29 µg m−3)in spring and winter (Table 4), which agrees with the seasonaldistribution of coal consumption in China. Coal combustionwas the most dominant contributor of national CO2 emissionin China, representing 72 % (Gregg et al., 2008). In Sichuan,the main sources were industrial coal boilers and residential
Atmos. Chem. Phys., 14, 8679–8699, 2014 www.atmos-chem-phys.net/14/8679/2014/
J. Tao et al.: PM2.5 pollution in a megacity of southwest China 8689
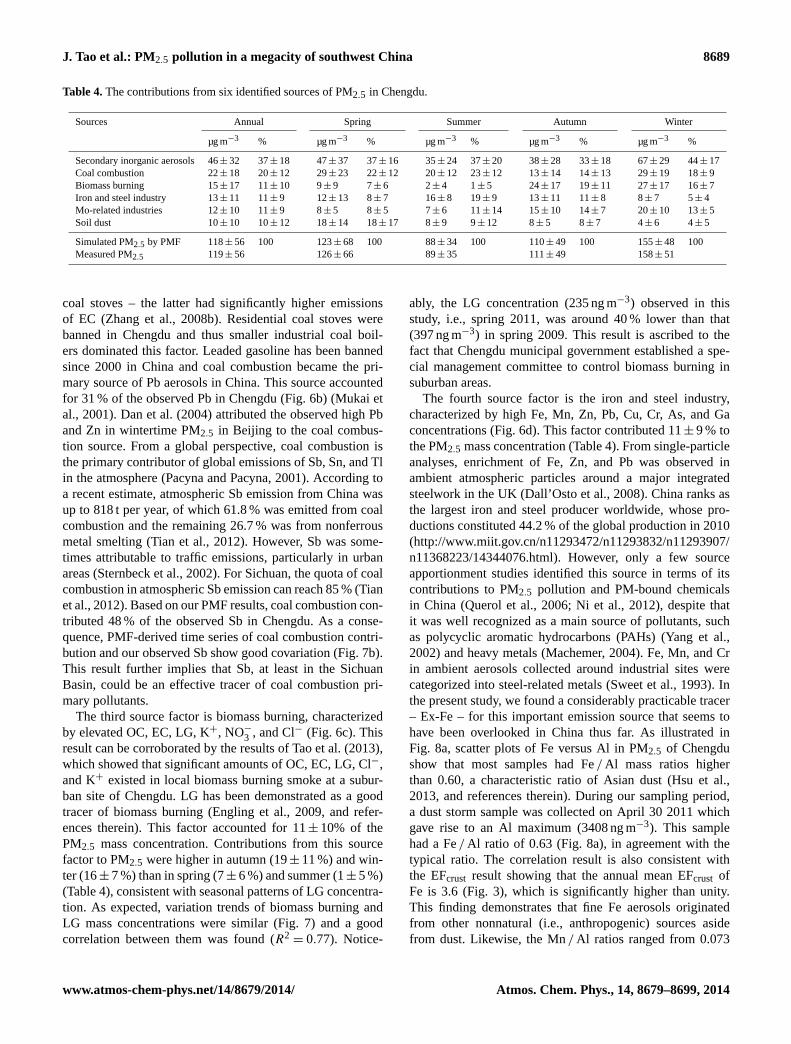
Table 4.The contributions from six identified sources of PM2.5 in Chengdu.
Sources Annual Spring Summer Autumn Winter
µg m−3 % µg m−3 % µg m−3 % µg m−3 % µg m−3 %
Secondary inorganic aerosols 46± 32 37± 18 47± 37 37± 16 35± 24 37± 20 38± 28 33± 18 67± 29 44± 17Coal combustion 22± 18 20± 12 29± 23 22± 12 20± 12 23± 12 13± 14 14± 13 29± 19 18± 9Biomass burning 15± 17 11± 10 9± 9 7± 6 2± 4 1± 5 24± 17 19± 11 27± 17 16± 7Iron and steel industry 13± 11 11± 9 12± 13 8± 7 16± 8 19± 9 13± 11 11± 8 8± 7 5± 4Mo-related industries 12± 10 11± 9 8± 5 8± 5 7± 6 11± 14 15± 10 14± 7 20± 10 13± 5Soil dust 10± 10 10± 12 18± 14 18± 17 8± 9 9± 12 8± 5 8± 7 4± 6 4± 5
Simulated PM2.5 by PMF 118± 56 100 123± 68 100 88± 34 100 110± 49 100 155± 48 100Measured PM2.5 119± 56 126± 66 89± 35 111± 49 158± 51
coal stoves – the latter had significantly higher emissionsof EC (Zhang et al., 2008b). Residential coal stoves werebanned in Chengdu and thus smaller industrial coal boil-ers dominated this factor. Leaded gasoline has been bannedsince 2000 in China and coal combustion became the pri-mary source of Pb aerosols in China. This source accountedfor 31 % of the observed Pb in Chengdu (Fig. 6b) (Mukai etal., 2001). Dan et al. (2004) attributed the observed high Pband Zn in wintertime PM2.5 in Beijing to the coal combus-tion source. From a global perspective, coal combustion isthe primary contributor of global emissions of Sb, Sn, and Tlin the atmosphere (Pacyna and Pacyna, 2001). According toa recent estimate, atmospheric Sb emission from China wasup to 818 t per year, of which 61.8 % was emitted from coalcombustion and the remaining 26.7 % was from nonferrousmetal smelting (Tian et al., 2012). However, Sb was some-times attributable to traffic emissions, particularly in urbanareas (Sternbeck et al., 2002). For Sichuan, the quota of coalcombustion in atmospheric Sb emission can reach 85 % (Tianet al., 2012). Based on our PMF results, coal combustion con-tributed 48 % of the observed Sb in Chengdu. As a conse-quence, PMF-derived time series of coal combustion contri-bution and our observed Sb show good covariation (Fig. 7b).This result further implies that Sb, at least in the SichuanBasin, could be an effective tracer of coal combustion pri-mary pollutants.
The third source factor is biomass burning, characterizedby elevated OC, EC, LG, K+, NO−
3 , and Cl− (Fig. 6c). Thisresult can be corroborated by the results of Tao et al. (2013),which showed that significant amounts of OC, EC, LG, Cl−,and K+ existed in local biomass burning smoke at a subur-ban site of Chengdu. LG has been demonstrated as a goodtracer of biomass burning (Engling et al., 2009, and refer-ences therein). This factor accounted for 11± 10% of thePM2.5 mass concentration. Contributions from this sourcefactor to PM2.5 were higher in autumn (19± 11 %) and win-ter (16± 7 %) than in spring (7± 6 %) and summer (1± 5 %)(Table 4), consistent with seasonal patterns of LG concentra-tion. As expected, variation trends of biomass burning andLG mass concentrations were similar (Fig. 7) and a goodcorrelation between them was found (R2
= 0.77). Notice-
ably, the LG concentration (235 ng m−3) observed in thisstudy, i.e., spring 2011, was around 40 % lower than that(397 ng m−3) in spring 2009. This result is ascribed to thefact that Chengdu municipal government established a spe-cial management committee to control biomass burning insuburban areas.
The fourth source factor is the iron and steel industry,characterized by high Fe, Mn, Zn, Pb, Cu, Cr, As, and Gaconcentrations (Fig. 6d). This factor contributed 11± 9 % tothe PM2.5 mass concentration (Table 4). From single-particleanalyses, enrichment of Fe, Zn, and Pb was observed inambient atmospheric particles around a major integratedsteelwork in the UK (Dall’Osto et al., 2008). China ranks asthe largest iron and steel producer worldwide, whose pro-ductions constituted 44.2 % of the global production in 2010(http://www.miit.gov.cn/n11293472/n11293832/n11293907/n11368223/14344076.html). However, only a few sourceapportionment studies identified this source in terms of itscontributions to PM2.5 pollution and PM-bound chemicalsin China (Querol et al., 2006; Ni et al., 2012), despite thatit was well recognized as a main source of pollutants, suchas polycyclic aromatic hydrocarbons (PAHs) (Yang et al.,2002) and heavy metals (Machemer, 2004). Fe, Mn, and Crin ambient aerosols collected around industrial sites werecategorized into steel-related metals (Sweet et al., 1993). Inthe present study, we found a considerably practicable tracer– Ex-Fe – for this important emission source that seems tohave been overlooked in China thus far. As illustrated inFig. 8a, scatter plots of Fe versus Al in PM2.5 of Chengdushow that most samples had Fe/ Al mass ratios higherthan 0.60, a characteristic ratio of Asian dust (Hsu et al.,2013, and references therein). During our sampling period,a dust storm sample was collected on April 30 2011 whichgave rise to an Al maximum (3408 ng m−3). This samplehad a Fe/ Al ratio of 0.63 (Fig. 8a), in agreement with thetypical ratio. The correlation result is also consistent withthe EFcrust result showing that the annual mean EFcrust ofFe is 3.6 (Fig. 3), which is significantly higher than unity.This finding demonstrates that fine Fe aerosols originatedfrom other nonnatural (i.e., anthropogenic) sources asidefrom dust. Likewise, the Mn/ Al ratios ranged from 0.073
www.atmos-chem-phys.net/14/8679/2014/ Atmos. Chem. Phys., 14, 8679–8699, 2014

8690 J. Tao et al.: PM2.5 pollution in a megacity of southwest China
Figure 6. Six source profiles (bars) resolved from the PMF model (in units of µg µg−1). Also shown are contribution percentages (blackdots) from each source factor.
to 0.145 in the four seasons (Fig. 8b), which is significantlylarger than that (0.015) in average crust (Taylor, 1964). Thisresult is indicative of enrichment and thus the dominanceof other sources aside from natural dust. Accordingly, wedefined Ex-Fe and excessive Mn (Ex-Mn) as follows:
[Ex− Fe] = [FeMeasured] − [AlMeasured] × 0.60,
[Ex− Mn] = [MnMeasured] − [AlMeasured] × 0.015.
where AlMeasured, FeMeasured, and MnMeasureddenote the mea-sured concentrations of Al, Fe, and Mn, respectively, and thefactors of 0.60 and 0.015 are the Fe/ Al and Mn/ Al massratios, respectively, in average crust composition. We thencompared the derived time series of Ex-Fe and the iron andsteel source contribution and found that they have a strongcorrelation (R2
= 0.72). Furthermore, we explored the cor-relations of steel-related metals, such as Mn, Ex-Mn, Zn, andCr, against the derived Ex-Fe (Machemer, 2004), as depicted
Atmos. Chem. Phys., 14, 8679–8699, 2014 www.atmos-chem-phys.net/14/8679/2014/

J. Tao et al.: PM2.5 pollution in a megacity of southwest China 8691
Figure 7. Time series of daily contributions from each identified source (continuous line) and specific chemical species (black dots) betweenJanuary and October 2011.
in Supplement Fig. S4. Obvious linear correlations were ob-served, with anR2 ranging from 0.28 to 0.81, demonstratingthat the iron and steel industry could be a vital source, inagreement with the PMF results (Fig. 6d).
Notably, the iron and steel manufacturing sources con-tributed more As than coal combustion sources in Chengdu(i.e., 48 versus 19 %) (Fig. 6d). Along with Se (Hsu etal., 2009), arsenic is considered one of the more usefultracers of coal combustion. The As/ Se ratio in PM2.5 inChengdu averaged 6.8± 2.6, which is much higher than thatin coal combustion emission in Sichuan (1.1) and acrossChina (0.94) (Tian et al., 2010). This finding suggests thatcoal combustion is not the main contributor of fine aerosol
As and merits further investigation in other provinces/cities,which would facilitate emission estimation of this carcino-genic metal across China. Moreover, contributions from thissource to PM2.5 varied significantly with season, rangingfrom 19± 9 % in summer to 11± 8 % in autumn, 8± 7 %in spring, and 5± 4 % in winter. Seasonality may be relevantto variability in production capacities of iron smelting fac-tories. In fact, air pollutants (SO2, NO2, and PM10) emittedfrom certain most productive manufacturers around Chengduwere higher in summer than in other seasons based on routinemonitoring results.
The fifth source is the Mo-related industries, character-ized by high Mo and Ni. This source contributed 11± 9 %
www.atmos-chem-phys.net/14/8679/2014/ Atmos. Chem. Phys., 14, 8679–8699, 2014

8692 J. Tao et al.: PM2.5 pollution in a megacity of southwest China
Figure 8.
Figure 8. Scatter plots of Fe versus Al and Mn versus Al in PM2.5 of Chengdu.
Figure 9.
Figure 9. Scatter plots of Mo and Ni in four seasons.
to the PM2.5 mass concentration but varied seasonally, e.g.,14± 7 % in autumn, 13± 5 % in winter, 11± 14 % in sum-mer, and 8± 5 % in spring (Table 4). Six samples had Moconcentrations over 10 ng m−3; of these three occurred inautumn and the other three in winter. The EFcrust values ofMo and Ni in fine aerosols in Chengdu were∼ 500 and∼ 30 (Fig. 3), respectively, which are much higher than unity,
indicative of the dominance of anthropogenic origins. At-mospheric Mo can originate from traffic emission, biomassburning, and industrial activities (Tsukuda et al., 2005; Don-garrà et al., 2007; Alleman et al., 2010). It usually has aconcentration lower than 1 ng m−3 (Negral et al., 2008; Alle-man et al., 2010; Mooiborek et al., 2011); in contrast, mea-surements in this study showed a mean concentration of3.8± 3.8 ng m−3. Sn, Sb, and Cr were not found in the sourceprofiles of this factor (Fig. 6e), suggesting that traffic emis-sions should not be a significant source for these elements,although Sb is often enriched in aerosols from vehicle emis-sions (Gómez et al., 2005; Varrica et al., 2013). A muchhigher OC/ EC ratio (∼ 100) also rules out the likelihoodof traffic emission. This factor can be discriminated from thesecond and fourth factors, i.e., coal combustion and the ironand steel industry, as the missing three metals are represen-tatives of the latter two source factors, as discussed above.For Ni, heavy oil combustion has often been suggested tobe its most important anthropogenic source along with non-ferrous smelters (Sweet et al., 1993). Heavy oil combustionin Chengdu appeared to be an insignificant source for Ni, asthe V/ Ni ratio was averaged only 0.7± 0.3, which is muchlower than the value (2–4) characterized for this industrysector (Almeida et al., 2005; Mamane et al., 2008). Further-more, Mo and Ni correlated with each other in every season(Fig. 9), despite that their ratio (Mo/ Ni) varied with seasonwith higher ratios (1.7–1.9) in autumn and winter and lowerratios (1.0–1.3) in spring and summer. This trait is a distinc-tive feature (Mo-rich and Ni-deplete) from what is usuallyfound in ambient atmosphere, e.g., a ratio significantly lowerthan unity (Negral et al., 2008; Mooibroek et al., 2011; Alle-man et al., 2010). This factor may indicate the existence ofa specific Mo source with a characteristic Mo/ Ni ratio of
Atmos. Chem. Phys., 14, 8679–8699, 2014 www.atmos-chem-phys.net/14/8679/2014/
J. Tao et al.: PM2.5 pollution in a megacity of southwest China 8693
Table 5.Summary of measures taken by local and national government in Chengdu.
Source Measures taken by Measures taken bylocal government national government
Secondary inorganic aerosols All industrial factories relocated out Chengdu urban area Industrial emission standardCoal combustion Coal combustion forbidden in urban area Industrial emission standardBiomass burning Special management committee established NoneIron and steel industry None Industrial emission standardMo-related industries None NoneTraffic emissions Hybrid electric vehicles used in public transportation system Emission standards for new vehiclesSoil dust None None
2.0 or higher, as demonstrated by the dashed line in Fig. 9. Itis thus designated as Mo-related industries, which warrantsfurther investigation, particularly in terms of which specificindustry it belongs to. This finding is comparable with the re-sult in Pittsburgh, where source apportionment studies havefound Mo and Cr association with a source factor called thespecialty steel factor (Pekney et al., 2006). The time series ofthis source contribution and the observed Mo concentrationscorrelated well, with anR2 of 0.47.
The sixth source factor is soil dust, which is characterizedby elevated Al, Fe, Mg, Ca, Sr, Ti, V, and Zr. A few previousstudies have found that Ca could have originated from an-thropogenic activities in China and thus argued that Ca couldserve as a marker for cement and construction dust (Zhanget al., 2005; Liu et al., 2005). However, the chemical profileof this identified source shows that Ca content is only 7.2 %(Fig. 6f), which is much lower than that of cement (∼ 30 %)and close to that in the northern China dust (7 %) (Zhang etal., 2003). This indicates that cement and construction dustshould not be a significant dust source in Chengdu. This fac-tor accounted for 10± 10 % of the PM2.5 mass concentra-tion, which is lower than that in Beijing (15 %) (Zhang et al.,2013). The contribution of soil dust to PM2.5 mass concen-trations was much higher in spring (18± 17 %) than in otherseasons (9± 12, 8± 7, and 4± 5 % in summer, autumn, andwinter, respectively). This seasonal pattern is also consistentwith that of the FS concentration. The soil dust factor cov-ers desert dust that usually prevails in spring and comes fromnorth China via long-range transport, fugitive dust, and streetdust, among which the latter two were dominated by localsources. Al, Fe, Ca, and Ti are typically major crustal ele-ments that are often used to calculate soil dust mass concen-tration (Malm et al., 1994), similar to what was done in thecurrent study. The EFs of Al, Fe, Mg, Ca, Sr, Ti, V, and Zrwere lower than 10, indicative of the dominance of a natu-ral mineral origin. Aluminum is a good tracer of soil dust.As expected, the time series of soil dust contribution and Alconcentrations were consistent (Fig. 7f), with anR2 of 0.85.
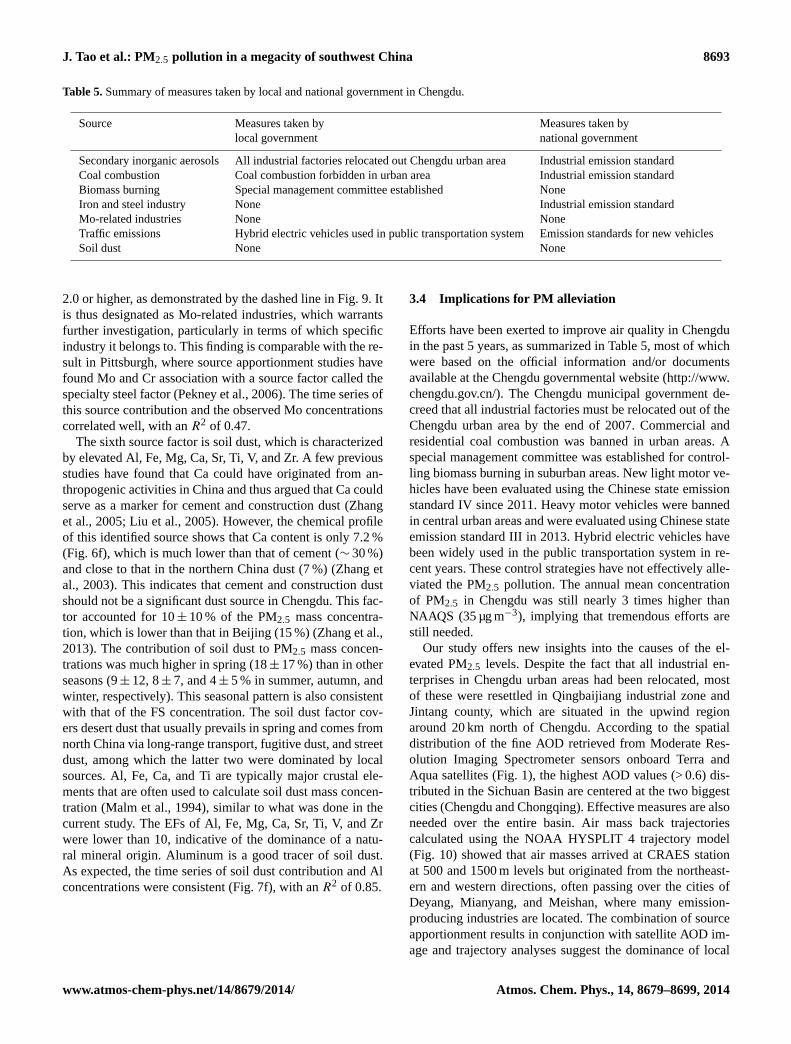
3.4 Implications for PM alleviation
Efforts have been exerted to improve air quality in Chengduin the past 5 years, as summarized in Table 5, most of whichwere based on the official information and/or documentsavailable at the Chengdu governmental website (http://www.chengdu.gov.cn/). The Chengdu municipal government de-creed that all industrial factories must be relocated out of theChengdu urban area by the end of 2007. Commercial andresidential coal combustion was banned in urban areas. Aspecial management committee was established for control-ling biomass burning in suburban areas. New light motor ve-hicles have been evaluated using the Chinese state emissionstandard IV since 2011. Heavy motor vehicles were bannedin central urban areas and were evaluated using Chinese stateemission standard III in 2013. Hybrid electric vehicles havebeen widely used in the public transportation system in re-cent years. These control strategies have not effectively alle-viated the PM2.5 pollution. The annual mean concentrationof PM2.5 in Chengdu was still nearly 3 times higher thanNAAQS (35 µg m−3), implying that tremendous efforts arestill needed.
Our study offers new insights into the causes of the el-evated PM2.5 levels. Despite the fact that all industrial en-terprises in Chengdu urban areas had been relocated, mostof these were resettled in Qingbaijiang industrial zone andJintang county, which are situated in the upwind regionaround 20 km north of Chengdu. According to the spatialdistribution of the fine AOD retrieved from Moderate Res-olution Imaging Spectrometer sensors onboard Terra andAqua satellites (Fig. 1), the highest AOD values (> 0.6) dis-tributed in the Sichuan Basin are centered at the two biggestcities (Chengdu and Chongqing). Effective measures are alsoneeded over the entire basin. Air mass back trajectoriescalculated using the NOAA HYSPLIT 4 trajectory model(Fig. 10) showed that air masses arrived at CRAES stationat 500 and 1500 m levels but originated from the northeast-ern and western directions, often passing over the cities ofDeyang, Mianyang, and Meishan, where many emission-producing industries are located. The combination of sourceapportionment results in conjunction with satellite AOD im-age and trajectory analyses suggest the dominance of local
www.atmos-chem-phys.net/14/8679/2014/ Atmos. Chem. Phys., 14, 8679–8699, 2014

8694 J. Tao et al.: PM2.5 pollution in a megacity of southwest China
Figure 10.Analytical results of the 48 h air mass back trajectories at 500 m(a) and 1500 m(b) elevation during the sampling periods, whichwere run four times per day.
anthropogenic sources instead of regional and/or naturalsources.
According to the PMF results, fossil-fuel-combustion-related activities including source factors of secondary in-organic aerosols, coal combustion, iron and steel manufac-turing, and Mo-related industries contributed nearly 80 % toPM2.5 and 96 % to sulfate aerosols. Therefore, coal qualityin terms of sulfur and heavy metal content, and coal usage
in Sichuan province, should be managed, whereas PM con-centration in coal-combustion-generated emissions should beabated. It is noted that traffic emission was not identified asa major factor by the PMF although the number of motorvehicles in Chengdu has exceeded 2 million. This raised thepostulation that the management of traffic pollution might beeffective to certain extent and that the traffic emission is rel-atively insignificant in contributing to the PM2.5 pollution.
Atmos. Chem. Phys., 14, 8679–8699, 2014 www.atmos-chem-phys.net/14/8679/2014/

J. Tao et al.: PM2.5 pollution in a megacity of southwest China 8695
It should be noted that emissions from the traffic might beincorporated into the source factor of soil dust as its weight-ing contents of Zn, Pb, Cu, Sn, and Sb were relatively ele-vated, and might also be incorporated into the factor of sec-ondary inorganic aerosols. Thus, more studies are needed toexplore the contributions of traffic emissions to PM2.5 pol-lution. In addition, biomass burning activities are presently atough issue for China’s environmental protection administra-tion. Biomass fuel is widely used for cooking in rural areas inChina. Waste straw produced in harvest seasons is habituallyburned for fertilizing soils. The law forbidding straw burningwas only enacted recently. A common strategy used by smallboiler industries in Sichuan is to replace coal with biomassfuel as an energy source considering that sulfur dioxide emis-sions from biomass fuels may be much lower than from coal(Andreae and Merlet, 2001). However, more effort is neededin reducing air pollutant emissions from small boilers, whichrequires establishing new air pollutant emission standards forbiomass fuel boilers. Rigorous efforts should be jointly ex-erted by different regions and cities and at various levels ofthe government.
4 Conclusions
The annual average PM2.5 concentration reached119± 56 µg m−3 in 2011 in Chengdu, an inland megacityof southwest China. A typical seasonality of waxing inwinter and waning in summer was observed. The annualPM2.5 level in this city was three times greater than theNAAQS standard (35 µg m−3) and higher than those in manycities around the world. The annual mean concentrationof carcinogenic As in Chengdu was up to 20± 11 ng m−3,which is also 3 times higher than the WHO’s guide value(6.6 ng m−3). Based on the results of chemical measurementsand ISORROPIA-II thermodynamic equilibrium model re-sults, major components of fine aerosols were identified tobe inorganic ions, organic matter, elemental carbon, mineralsoils, trace element oxides, and water, the sum of whichaccounted for 92± 11 % of the observed masses.
Six source factors were identified using the PMF sourceapportionment model. The absolute (µg m−3) and fractional(%) contributions from each source factor varied with sea-son. Distinctive chemical species were successfully used ascharacteristic tracers of individually modeled sources to val-idate source apportionment results. Biomarkers of biomassburning, LG and MN, were applied to constrain the morelikely biomass burning sources. Wood burning was iden-tified to be the main source in winter, while agriculturalwaste burning was the main source in autumn. The presentstudy found a straightforward surrogate of iron and steelmanufacturing pollution, namely excessive Fe, which is wellcorrelated to the contribution from this source. A specialsource, Mo-related heavy industries, was modeled by PMF,corresponding to a persistently high Mo/ Ni ratio of ≥ 1.0
throughout the sampling period. A preliminarily hypothesiscould be that the special source was relevant to specific alloyindustries and/or military industries, pending further investi-gations.
The high PM2.5 levels in Chengdu were mainly domi-nated by local anthropogenic emissions in the territory ofthe Sichuan Basin, in contrast to those found in Beijing.The unique topography surrounding the city is conduciveto air pollutant accumulation and enhanced PM2.5 pollution.Stricter emission standards are needed to alleviate elevatedPM2.5 loadings in this region. The source apportionment re-sults presented here could serve as a valuable scientific basisfor enacting effective emission control measures and poli-cies.
The Supplement related to this article is available onlineat doi:10.5194/acp-14-8679-2014-supplement.
Acknowledgements.This study was supported by the SpecialScientific Research Funds for National Basic Research Program ofChina (2013FY112700) and the Environment Protection Common-weal Section (201009001).
Edited by: X. Tie
References
Alleman, L. Y., Lamaison, L., Perdrix, E., Robache, A., andGalloo, J.-C.: PM10 metal concentrations and source identi-fication using positive matrix factorization and wind sector-ing in a French industrial zone, Atmos. Res., 96, 612–625,doi:10.1016/j.atmosres.2010.02.008, 2010.
Almeida, S., Pio, C., Freitas, M., Reis, M., and Trancoso, M.:Source apportionment of fine and coarse particulate matter in asub-urban area at the Western European Coast, Atmos. Environ.,39, 3127–3138, doi:10.1016/j.atmosenv.2005.01.048, 2005.
Andreae, M. O. and Merlet, P.: Emission of trace gases and aerosolsfrom biomass burning, Global Biogeochem. Cy., 15, 955–966,doi:10.1029/2000GB001382, 2001.
Andreae, M. O. and Rosenfeld, D.: Aerosol–cloud–precipitation interactions. Part 1. The nature and sourcesof cloud-active aerosols, Earth-Sci. Rev., 89, 13–41,doi:10.1016/j.earscirev.2008.03.001, 2008.
Balasubramanian, R., Qian, W., Decesari, B. S., Facchini,M. C., and Fuzzi, S. Comprehensive characterization ofPM2.5 aerosols in Singapore, J. Geophys. Res., 108, 4523,doi:10.1029/2002JD002517, 2003.
Cao, G., Zhang, X., and Zheng, F.: Inventory of black carbon and or-ganic carbon emissions from China, Atmos. Environ., 40, 6516–6527, doi:10.1016/j.atmosenv.2006.05.070, 2006.
Cao, J., Lee, S., Ho, K., Zhang, X., Zou, S., Fung, K., Chow,J. C., and Watson, J. G.: Characteristics of carbonaceousaerosol in Pearl River Delta Region, China during 2001 win-ter period, Atmos. Environ., 37, 1451–1460, doi:10.1016/S1352-2310(02)01002-6, 2003.
www.atmos-chem-phys.net/14/8679/2014/ Atmos. Chem. Phys., 14, 8679–8699, 2014

8696 J. Tao et al.: PM2.5 pollution in a megacity of southwest China
Cao, J., Lee, S., Chow, J. C., Watson, J. G., Ho, K., Zhang, R., Jin,Z., Shen, Z., Chen, G., and Kang, Y.: Spatial and seasonal distri-butions of carbonaceous aerosols over China, J. Geophys. Res.-Atmos., 112, D22S11, doi:10.1029/2006JD008205, 2007.
Chen, L.-W. A., Lowenthal, D. H., Watson, J. G., Koracin, D., Ku-mar, N., Knipping, E. M., Wheeler, N., Craig, K., and Reid, S.:Toward effective source apportionment using positive matrix fac-torization: experiments with simulated PM2.5 data, J. Air WasteManage. Assoc., 60, 43–54, doi:10.3155/1047-3289.60.1.43,2010.
Chow, J. C., Watson, J. G., Chen, L.-W. A., Chang, M. O., Robin-son, N. F., Trimble, D., and Kohl, S.: The IMPROVE_A temper-ature protocol for thermal/optical carbon analysis: maintainingconsistency with a long-term database, J. Air Waste Manage. As-soc., 57, 1014–1023, doi:10.3155/1047-3289.57.9.1014, 2007.
Dall’Osto, M., Booth, M., Smith, W., Fisher, R., and Harri-son, R. M.: A study of the size distributions and the chem-ical characterization of airborne particles in the vicinity of alarge integrated steelworks, Aerosol Sci. Technol., 42, 981–991,doi:10.1080/02786820802339587, 2008.
Dan, M., Zhuang, G., Li, X., Tao, H., and Zhuang, Y.: Thecharacteristics of carbonaceous species and their sourcesin PM2.5 in Beijing, Atmos. Environ., 38, 3443–3452,doi:10.1016/j.atmosenv.2004.02.052, 2004.
Dongarrà, G., Manno, E., Varrica, D., and Vultaggio, M.:Mass levels, crustal component and trace elements inPM10 in Palermo, Italy, Atmos. Environ., 41, 7977–7986,doi:10.1016/j.atmosenv.2007.09.015, 2007.
Draxler, R. R. and Rolph, G. D.: HYSPLIT (HYbrid Single-ParticleLagrangian Integrated Trajectory) Model Access via NOAAARL READY Website, available at:http://www.arl.noaa.gov/HYSPLIT.php, NOAA Air Resources Laboratory, College Park,MD.
Duan, F., Liu, X., Yu, T., and Cachier, H.: Identification and estimateof biomass burning contribution to the urban aerosol organic car-bon concentrations in Beijing, Atmos. Environ., 38, 1275–1282,doi:10.1016/j.atmosenv.2003.11.037, 2004.
Eder, B. and Yu, S.: A performance evaluation of the 2004 re-lease of Models-3 CMAQ. Atmos. Environ., 40, 4811–4824,doi:10.1016/j.atmosenv.2005.08.045, 2006.
Edwards, R. D., Smith, K. R., Zhang, J., and Ma, Y.: Implications ofchanges in household stoves and fuel use in China, Energ. Policy,32, 395–411, doi:10.1016/S0301-4215(02)00309-9, 2004.
Engling, G., Carrico, C. M., Kreidenweis, S. M., Collett Jr., J. L.,Day, D. E., Malm, W. C., Lincoln, E., Min Hao, W., Iinuma, Y.,and Herrmann, H.: Determination of levoglucosan in biomasscombustion aerosol by high-performance anion-exchange chro-matography with pulsed amperometric detection, Atmos. Envi-ron., 40, 299–311, doi:10.1016/j.atmosenv.2005.12.069, 2006.
Engling, G., Lee, J. J., Tsai, Y.-W., Lung, S.-C. C., Chou,C. C.-K., and Chan, C.-Y.: Size-resolved anhydrosugarcomposition in smoke aerosol from controlled field burn-ing of rice straw, Aerosol Sci. Technol., 43, 662–672,doi:10.1080/02786820902825113, 2009.
Feng, Y., Chen, Y., Guo, H., Zhi, G., Xiong, S., Li, J., Sheng, G.,and Fu, J.: Characteristics of organic and elemental carbon inPM2.5 samples in Shanghai, China, Atmos. Res., 92, 434–442,doi:10.1016/j.atmosres.2009.01.003, 2009.
Fountoukis, C. and Nenes, A.: ISORROPIA II: a computationallyefficient thermodynamic equilibrium model for K+ − Ca2+
−
Mg2+− H+
4 − Na+− SO2−
4 − NO−
3 − Cl− − H2O aerosols,Atmos. Chem. Phys., 7, 4639–4659, doi:10.5194/acp-7-4639-2007, 2007.
Gómez, D. R., Giné, M. F., Bellato, A. C. S., and Smichowski,P.: Antimony: a traffic-related element in the atmosphere ofBuenos Aires, Argentina, J. Environ. Monit., 7, 1162–1168,doi:10.1039/B508609D, 2005.
Gregg, J. S., Andres, R. J., and Marland, G.: China: Emissionspattern of the world leader in CO2 emissions from fossil fuelconsumption and cement production, Geophys. Res. Lett., 35,L08806, doi:10.1029/2007GL032887, 2008.
Gu, J., Bai, Z., Liu, A., Wu, L., Xie, Y., Li, W., Dong, H., and Zhang,X.: Characterization of Atmospheric Organic Carbon and Ele-ment Carbon of PM2. 5 and PM10 at Tianjin, China, Aerosol AirQual. Res, 10, 167–176, doi:10.4209/aaqr.2009.12.0080, 2010.
Hans Wedepohl, K.: The composition of the continental crust,Geochim. Cosmochim. Acta, 59, 1217–1232, doi:10.1016/0016-7037(95)00038-2, 1995.
He, K., Yang, F., Ma, Y., Zhang, Q., Yao, X., Chan, C. K.,Cadle, S., Chan, T., and Mulawa, P.: The characteristics ofPM2.5 in Beijing, China, Atmos. Environ., 35, 4959–4970,doi:10.1016/S1352-2310(01)00301-6, 2001.
Heo, J. B., Hopke, P. K., and Yi, S. M.: Source apportionmentof PM2.5 in Seoul, Korea, Atmos. Chem. Phys., 9, 4957–4971,doi:10.5194/acp-9-4957-2009, 2009.
Hsu, S.-C., Liu, S. C., Kao, S.-J., Jeng, W.-L., Huang, Y.-T., Tseng,C.-M., Tsai, F., Tu, J.-Y., and Yang, Y.: Water-soluble speciesin the marine aerosol from the northern South China Sea: Highchloride depletion related to air pollution, J. Geophys. Res., 112,D19304, doi:10.1029/2007JD008844, 2007.
Hsu, S.-C., Liu, S. C., Huang, Y.-T., Lung, S.-C. C., Tsai, F., Tu, J.-Y., and Kao, S.-J.: A criterion for identifying Asian dust eventsbased on Al concentration data collected from northern Taiwanbetween 2002 and early 2007, J. Geophys. Res., 113, D18306,doi:10.1029/2007JD009574, 2008.
Hsu, S. C., Liu, S. C., Huang, Y. T., Chou, C. C. K., Lung, S. C.C., Liu, T. H., Tu, J. Y., and Tsai, F.: Long-range southeast-ward transport of Asian biosmoke pollution: signature detectedby aerosol potassium in Northern Taiwan, J. Geophys. Res., 114,D14301, doi:10.1029/2009JD011725, 2009.
Hsu, S., Liu, S., Tsai, F., Engling, G., Lin, I., Chou, C., Kao, S.,Lung, S., Chan, C., and Lin, S.: High wintertime particulate mat-ter pollution over an offshore island (Kinmen) off southeasternChina: An overview, J. Geophys. Res.-Atmos., 115, D17309,doi:10.1029/2009JD013641, 2010.
Hsu, S. C., Tsai, F., Lin, F. J., Chen, W. N., Shiah, F. K., HuangJr, C., Chan, C. Y., Chen, C. C., Liu, T. H., and Chen, H. Y.:A super Asian dust storm over the East and South China Seas:Disproportionate dust deposition, J. Geophys. Res.-Atmos., 118,7169–7181, doi:10.1002/jgrd.50405, 2013.
Hueglin, C., Gehrig, R., Baltensperger, U., Gysel, M., Monn,C., and Vonmont, H.: Chemical characterisation of PM2.5,PM10 and coarse particles at urban, near-city and ru-ral sites in Switzerland, Atmos. Environ., 39, 637–651,doi:10.1016/j.atmosenv.2004.10.027, 2005.
Iinuma, Y., Engling, G., Puxbaum, H., and Herrmann, H.: A highlyresolved anion-exchange chromatographic method for determi-
Atmos. Chem. Phys., 14, 8679–8699, 2014 www.atmos-chem-phys.net/14/8679/2014/

J. Tao et al.: PM2.5 pollution in a megacity of southwest China 8697
nation of saccharidic tracers for biomass combustion and primarybio-particles in atmospheric aerosol, Atmos. Environ., 43, 1367–1371, doi:10.1016/j.atmosenv.2008.11.020, 2009.
Khan, M. F., Shirasuna, Y., Hirano, K., and Masunaga, S.:Characterization of PM2.5, PM2.5−10 and PM10 in am-bient air, Yokohama, Japan, Atmos. Res., 96, 159–172,doi:10.1016/j.atmosres.2009.12.009, 2010.
Laden, F., Neas, L. M., Dockery, D. W., and Schwartz, J.: Associ-ation of fine particulate matter from different sources with dailymortality in six US cities, Environ. Health Perspect., 108, 941–947, 2000.
Lee, H. S. and Kang, B.-W.: Chemical characteristics of principalPM2.5 species in Chongju, South Korea, Atmos. Environ., 35,739–746, doi:10.1016/S1352-2310(00)00267-3, 2001.
Lei, Y., Zhang, Q., He, K., and Streets, D.: Primary anthropogenicaerosol emission trends for China, 1990–2005, Atmos. Chem.Phys., 11, 931–954, doi:10.5194/acp-11-931-2011, 2011.
Liu, X., Zhu, J., Van Espen, P., Adams, F., Xiao, R., Dong,S., and Li, Y.: Single particle characterization of spring andsummer aerosols in Beijing: Formation of composite sulfateof calcium andpotassium. Atmos. Environ., 39, 6909–6918,doi:10.1016/j.atmosenv.2005.08.007, 2005.
Lonati, G., Giugliano, M., Butelli, P., Romele, L., and Tardivo, R.:Major chemical components of PM2.5 in Milan (Italy), Atmos.Environ., 39, 1925–1934, doi:10.1016/j.atmosenv.2004.12.012,2005.
Louie, P. K., Watson, J. G., Chow, J. C., Chen, A., Sin, D. W.,and Lau, A. K.: Seasonal characteristics and regional trans-port of PM2.5 in Hong Kong, Atmos. Environ., 39, 1695–1710,doi:10.1016/j.atmosenv.2004.11.017, 2005.
Ma, Y., Chen, R., Pan, G., Xu, X., Song, W., Chen, B., andKan, H.: Fine particulate air pollution and daily mortalityin Shenyang, China, Sci. Total Environ. 409, 2473–2477,doi:10.1016/j.scitotenv.2011.03.017, 2011.
Machemer, S. D.: Characterization of airborne and bulk particulatefrom iron and steel manufacturing facilities, Environ. Sci. Tech-nol., 38, 381–389, doi:10.1021/es020897v, 2004.
Malm, W. C., Sisler, J. F., Huffman, D., Eldred, R. A., and Cahill, T.A.: Spatial and seasonal trends in particle concentration and op-tical extinction in the United States, J. Geophys. Res., 99, 1347–1370, doi:10.1029/93JD02916, 1994.
Mamane, Y., Perrino, C., Yossef, O., and Catrambone, M.:Source characterization of fine and coarse particles at theEast Mediterranean coast, Atmos. Environ. 42, 6114–6130,doi:10.1016/j.atmosenv.2008.02.045, 2008.
Mooibroek, D., Schaap, M., Weijers, E., and Hoogerbrugge, R.:Source apportionment and spatial variability of PM2.5 usingmeasurements at five sites in the Netherlands, Atmos. Environ.,45, 4180–4191, doi:10.1016/j.atmosenv.2011.05.017, 2011.
Mukai, H., Tanaka, A., Fujii, T., Zeng, Y., Hong, Y., Tang, J.,Guo, S., Xue, H., Sun, Z., and Zhou, J.: Regional characteris-tics of sulfur and lead isotope ratios in the atmosphere at sev-eral Chinese urban sites, Environ. Sci. Technol., 35, 1064–1071,doi:10.1021/es001399u, 2001.
Negral, L., Moreno-Grau, S., Moreno, J., Querol, X., Viana, M., andAlastuey, A.: Natural and anthropogenic contributions to PM10and PM2.5 in an urban area in the western Mediterranean coast,Water Air Soil Pollut., 192, 227–238, doi:10.1007/s11270-008-9650-y, 2008.
Ni, Z.-Y., Chen, Y.-J., Li, N., and Zhang, H.: Pb–Sr–Nd iso-tope constraints on the fluid source of the Dahu Au–Modeposit in Qinling Orogen, central China, and implicationfor Triassic tectonic setting, Ore Geol. Rev., 46, 60–67,doi:10.1016/j.oregeorev.2012.01.004, 2012.
Norris, G., Vedantham, R., Wade, K., Brown, S., Prouty, J., and Fo-ley, C.: EPA positive matrix factorization (PMF) 3.0 fundamen-tals & user guide, US Environmental Protection Agency, Officeof Research and Development, Washington, DC, 2008.
Oliveira, C., Pio, C., Alves, C., Evtyugina, M., Santos, P.,Gonçalves, V., Nunes, T., Silvestre, A. J., Palmgren, F.,and Wåhlin, P.: Seasonal distribution of polar organic com-pounds in the urban atmosphere of two large cities from theNorth and South of Europe, Atmos. Environ., 41, 5555–5570,doi:10.1016/j.atmosenv.2007.03.001, 2007.
Pacyna, J. M. and Pacyna, E. G.: An assessment of global andregional emissions of trace metals to the atmosphere fromanthropogenic sources worldwide, Environ. Rev., 9, 269–298,doi:10.1139/a01-012, 2001.
Pekney, N. J., Davidson, C. I., Robinson, A., Zhou, L., Hopke,P., Eatough, D., and Rogge, W. F.: Major source categories forPM2.5 in Pittsburgh using PMF and UNMIX, Aerosol Sci. Tech-nol., 40, 910–924, doi:10.1080/02786820500380271, 2006.
Pinto, J. P., Lefohn, A. S., and Shadwick, D. S.: Spa-tial Variability of PM2.5 in Urban Areas in the UnitedStates, J. Air Waste Manage. Assoc., 54, 440–449,doi:10.1080/10473289.2004.10470919, 2004.
Pio, C., Legrand, M., Alves, C., Oliveira, T., Afonso, J., Caseiro,A., Puxbaum, H., Sánchez-Ochoa, A., and Gelencsér, A.: Chem-ical composition of atmospheric aerosols during the 2003 sum-mer intense forest fire period, Atmos. Environ., 42, 7530–7543,doi:10.1016/j.atmosenv.2008.05.032, 2008.
Pope III, C. A., and Dockery, D. W.: Health effects of fine partic-ulate air pollution: lines that connect, J. Air Waste Manage. As-soc., 56, 709–742, doi:10.1080/10473289.2006.10464485, 2006.
Putaud, J.-P., Raes, F., Van Dingenen, R., Brüggemann, E., Fac-chini, M., Decesari, S., Fuzzi, S., Gehrig, R., Hüglin, C., andLaj, P.: A European aerosol phenomenology – 2: chemical char-acteristics of particulate matter at kerbside, urban, rural andbackground sites in Europe, Atmos. Environ., 38, 2579–2595,doi:10.1016/j.atmosenv.2004.01.041, 2004.
Qin, Y. and Xie, S.: Spatial and temporal variation of anthropogenicblack carbon emissions in China for the period 1980–2009, At-mos. Chem. Phys., 12, 4825–4841, doi:10.5194/acp-12-4825-2012, 2012.
Querol, X., Alastuey, A., Ruiz, C., Artinano, B., Hansson, H.,Harrison, R., Buringh, E. t., Ten Brink, H., Lutz, M., andBruckmann, P.: Speciation and origin of PM10 and PM2.5in selected European cities, Atmos. Environ., 38, 6547–6555,doi:10.1016/j.atmosenv.2004.08.037, 2004.
Querol, X., Zhuang, X., Alastuey, A., Viana, M., Lv, W., Wang,Y., López, A., Zhu, Z., Wei, H., and Xu, S.: Speciation andsources of atmospheric aerosols in a highly industrialised emerg-ing mega-city in Central China, J. Environ. Monit., 8, 1049–1059, doi:10.1039/B608768J, 2006.
Remer, L. A., Kaufman, Y. J., Tanré, D., Mattoo, S., Chu, D. A.,Martins, J. V., Li, R.-R., Ichoku, C., Levy, R. C., Kleidman, R.G., Eck, T. F., Vermote, E., and Holben, B. N.: The MODIS
www.atmos-chem-phys.net/14/8679/2014/ Atmos. Chem. Phys., 14, 8679–8699, 2014

8698 J. Tao et al.: PM2.5 pollution in a megacity of southwest China
Aerosol Algorithm, Products, and Validation, J. Atmos. Sci., 62,947–973, doi:10.1175/JAS3385.1, 2005.
Rolph, G. D.: Real-time Environmental Applications and Displaysystem (READY) Website, available at:http://www.ready.noaa.gov, NOAA Air Resources Laboratory, College Park, MD, 2013.
Seinfeld, J. H., Carmichael, G. R., Arimoto, R., Conant, W. C.,Brechtel, F. J., Bates, T. S., Cahill, T. A., Clarke, A .D., Doherty,S. J., and Flatau, P. J.: ACE-ASIA-Regional climatic and atmo-spheric chemical effects of Asian dust and pollution, B. Am. Me-teorol.Soc., 85, 367–380, doi:10.1175/BAMS-85-3-367, 2004.
Sheesley, R. J., Schauer, J. J., Chowdhury, Z., Cass, G. R., and Si-moneit, B. R.: Characterization of organic aerosols emitted fromthe combustion of biomass indigenous to South Asia, J. Geophys.Res., 108, 4285, doi:10.1029/2002JD002981, 2003.
Simon, H., Bhave, P., Swall, J., Frank, N., and Malm, W.: Deter-mining the spatial and seasonal variability in OM/ OC ratiosacross the US using multiple regression, Atmos. Chem. Phys.,11, 2933–2949, doi:10.5194/acp-11-2933-2011, 2011.
Sternbeck, J., Sjödin, Å., and Andréasson, K.: Metal emissionsfrom road traffic and the influence of resuspension – re-sults from two tunnel studies, Atmos. Environ. 36, 4735–4744,doi:10.1016/S1352-2310(02)00561-7, 2002.
Sweet, C. W., Vermette, S. J., and Landsberger, S.: Sources of toxictrace elements in urban air in Illinois, Environ. Sci. Technol., 27,2502–2510, doi:10.1021/es00048a030, 1993.
Szidat, S., Jenk, T. M., Synal, H. A., Kalberer, M., Wacker, L., Ha-jdas, I., Kasper-Giebl, A., and Baltensperger, U.: Contributionsof fossil fuel, biomass burning, and biogenic emissions to car-bonaceous aerosols in Zurich as traced by14C, J. Geophys. Res.-Atmos., 111, D07206, doi:10.1029/2005JD006590, 2006.
Szidat, S., Ruff, M., Perron, N., Wacker, L., Synal, H.-A., Hallquist,M., Shannigrahi, A. S., Yttri, K., Dye, C., and Simpson, D.: Fos-sil and non-fossil sources of organic carbon (OC) and elemen-tal carbon (EC) in Göteborg, Sweden, Atmos. Chem. Phys., 9,1521–1535, doi:10.5194/acp-9-1521-2009, 2009.
Tao, J., Shen, Z., Zhu, C., Yue, J., Cao, J., Liu, S., Zhu, L., andZhang, R.: Seasonal variations and chemical characteristics ofsub-micrometer particles (PM1) in Guangzhou, China, Atmos.Res., 115, 222–231, doi:10.1016/j.atmosres.2012.06.025, 2012.
Tao, J., Zhang, L., Engling, G., Zhang, R., Yang, Y., Cao, J., Zhu,C., Wang, Q., and Luo, L.: Chemical composition of PM2.5 in anurban environment in Chengdu, China: Importance of springtimedust storms and biomass burning, Atmos. Res., 122, 270–283,doi:10.1016/j.atmosres.2012.11.004, 2013.
Tao, J., Zhang, L., Ho, K., Zhang, R., Lin, Z., Zhang, Z., Lin,M., Cao, J., Liu, S., and Wang, G.: Impact of PM2.5 chemi-cal compositions on aerosol light scattering in Guangzhou – thelargest megacity in South China, Atmos. Res., 135–136, 48–58,doi:10.1016/j.atmosres.2013.08.015, 2014.
Taylor, S. R.: Trace element abundances and the chondriticEarth model, Geochim. Cosmochim. Ac., 28, 1989–1998,doi:10.1016/0016-7037(64)90142-5, 1964.
Tian, H., Wang, Y., Xue, Z., Cheng, K., Qu, Y., Chai, F., andHao, J.: Trend and characteristics of atmospheric emissions ofHg, As, and Se from coal combustion in China, 1980–2007,Atmos. Chem. Phys., 10, 11905–11919, doi:10.5194/acp-10-11905-2010, 2010.
Tian, H., Zhao, D., Cheng, K., Lu, L., He, M., and Hao, J.: An-thropogenic atmospheric emissions of antimony and its spatial
distribution characteristics in China, Environ. Sci. Technol., 46,3973–3980, doi:10.1021/es2041465, 2012.
Tsukuda, S., Sugiyama, M., Harita, Y., and Nishimura, K.: At-mospheric bulk deposition of soluble phosphorus in Ashiu Ex-perimental Forest, Central Japan: source apportionment andsample contamination problem, Atmos. Environ. 39, 823–836,doi:10.1016/j.atmosenv.2004.10.028, 2005.
Turpin, B. J. and Huntzicker, J. J.: Identification of secondary or-ganic aerosol episodes and quantitation of primary and secondaryorganic aerosol concentrations during SCAQS, Atmos. Environ.,29, 3527–3544, doi:10.1016/1352-2310(94)00276-Q, 1995.
Turpin, B. J. and Lim, H.-J.: Species contributions to PM2.5mass concentrations: Revisiting common assumptions for es-timating organic mass, Aerosol Sci. Technol., 35, 602–610,doi:10.1080/02786820119445, 2001.
Varrica, D., Bardelli, F., Dongarrà, G., and Tamburo, E.: Speci-ation of Sb in airborne particulate matter, vehicle brake lin-ings, and brake pad wear residues. Atmos. Environ., 64, 18–24,doi:10.1016/j.atmosenv.2012.08.067, 2013.
Wang, X., Zhang, L., and Moran, M.: Uncertainty assessment ofcurrent size-resolved parameterizations for below-cloud parti-cle scavenging by rain, Atmos. Chem. Phys., 10, 5685–5705,doi:10.5194/acp-10-5685-2010, 2010.
Watson, J. G.: Visibility: Science and regulation,J. Air Waste Manage. Assoc., 52, 628–713,doi:10.1080/10473289.2002.10470813, 2002.
Watson, J. G., Chow, J. C., and Houck, J. E.: PM2.5 chemicalsource profiles for vehicle exhaust, vegetative burning, geolog-ical material, and coal burning in Northwestern Colorado dur-ing 1995, Chemosphere, 43, 1141–1151, doi:10.1016/S0045-6535(00)00171-5, 2001.
World Health Organization: Regional Office for Europe, Air qualityguidelines for Europe, No. 91, WHO Regional Office Europe,2000.
Xing, L., Fu, T.-M., Cao, J., Lee, S., Wang, G., Ho, K., Cheng,M.-C., You, C.-F., and Wang, T.: Seasonal and spatial variabil-ity of the OM/ OC mass ratios and high regional correlation be-tween oxalic acid and zinc in Chinese urban organic aerosols,Atmos. Chem. Phys., 13, 4307–4318, doi:10.5194/acp-13-4307-2013, 2013.
Xu, H., Cao, J., Ho, K., Ding, H., Han, Y., Wang, G., Chow,J., Watson, J., Khol, S., and Qiang, J.: Lead concentrationsin fine particulate matter after the phasing out of leadedgasoline in Xi’an, China, Atmos. Environ., 46, 217–224,doi:10.1016/j.atmosenv.2011.09.078, 2012a.
Xu, L., Chen, X., Chen, J., Zhang, F., He, C., Zhao, J., and Yin, L.:Seasonal variations and chemical compositions of PM2.5 aerosolin the urban area of Fuzhou, China, Atmos. Res., 104, 264–272,doi:10.1016/j.atmosres.2011.10.017, 2012b.
Yan, X., Ohara, T., and Akimoto H.: Bottom-up estimate of biomassburning in mainland China. Atmos. Environ., 40, 5262–5273,doi:10.1016/j.atmosenv.2006.04.040, 2006.
Yang, F., Tan, J., Zhao, Q., Du, Z., He, K., Ma, Y., Duan, F., andChen, G.: Characteristics of PM2.5 speciation in representativemegacities and across China, Atmos. Chem. Phys., 11, 5207–5219, doi:10.5194/acp-11-5207-2011, 2011.
Yang, H.-H., Lai, S.-O., Hsieh, L.-T., Hsueh, H.-J., and Chi, T.-W.:Profiles of PAH emission from steel and iron industries, Chemo-
Atmos. Chem. Phys., 14, 8679–8699, 2014 www.atmos-chem-phys.net/14/8679/2014/

J. Tao et al.: PM2.5 pollution in a megacity of southwest China 8699
sphere, 48, 1061–1074, doi:10.1016/S0045-6535(02)00175-3,2002.
Ye, B., Ji, X., Yang, H., Yao, X., Chan, C. K., Cadle, S. H., Chan,T., and Mulawa, P. A.: Concentration and chemical compositionof PM2.5 in Shanghai for a 1-year period, Atmos. Environ., 37,499–510, doi:10.1016/S1352-2310(02)00918-4, 2003.
Yttri, K., Dye, C., Braathen, O.-A., Simpson, D., and Steinnes, E.:Carbonaceous aerosols in Norwegian urban areas, Atmos. Chem.Phys., 8, 2007–2020, doi:10.5194/acp-9-2007-2009, 2009.
Zdráhal, Z., Oliveira, J., Vermeylen, R., Claeys, M., and Maenhaut,W.: Improved method for quantifying levoglucosan and relatedmonosaccharide anhydrides in atmospheric aerosols and applica-tion to samples from urban and tropical locations, Environ. Sci.Technol., 36, 747–753, doi:10.1021/es015619v, 2002.
Zhang, D., Shi, G., Iwasaka, Y., Hu, M., and Zang, J.: Anthro-pogenic calcium particles observed in Beijing and Qingdao,China, Water Air Soil Pollut., 5, 261–276, doi:10.1007/s11267-005-0743-y, 2005.
Zhang, F., Xu, L., Chen, J., Yu, Y., Niu, Z., and Yin, L.: Chemicalcompositions and extinction coefficients of PM2.5 in peri-urbanof Xiamen, China, during June 2009–May 2010, Atmos. Res.,106, 150–158, doi:10.1016/j.atmosres.2011.12.005, 2012.
Zhang, R., Jing, J., Tao, J., Hsu, S. C., Wang, G., Cao, J., Lee,C. S. L., Zhu, L., Chen, Z., Zhao, Y., and Shen, Z.: Chemi-cal characterization and source apportionment of PM2.5 in Bei-jing: seasonal perspective, Atmos. Chem. Phys., 13, 7053–7074,doi:10.5194/acp-13-7053-2013, 2013.
Zhang, T., Cao, J., Tie, X., Shen, Z., Liu, S., Ding, H.,Han, Y., Wang, G., Ho, K., and Qiang, J.: Water-solubleions in atmospheric aerosols measured in Xi’an, China: sea-sonal variations and sources, Atmos. Res., 102, 110–119,doi:10.1016/j.atmosres.2011.06.014, 2011.
Zhang, X. Y., Gong, S. L., Shen, Z. X., Mei, F. M., Xi, X. X., Liu,L. C., Zhou, Z. J., Wang, D., Wang, Y. Q., and Cheng, Y.: Char-acterization of soil dust aerosol in China and its transport anddistribution during 2001 ACE-Asia: 1. Network observations. J.Geophys. Res., 108, 4261, doi:10.1029/2002JD002632, 2003.
Zhang, X. Y., Wang, Y. Q., Zhang, X. C., Guo, W., and Gong,S. L.: Carbonaceous aerosol composition over various re-gions of China during 2006, J. Geophys. Res., 113, D14111,doi:10.1029/2007JD009525, 2008a.
Zhang, Y., Schauer, J. J., Zhang, Y., Zeng, L., Wei, Y., Liu, Y., andShao, M.: Characteristics of particulate carbon emissions fromreal-world Chinese coal combustion, Environ. Sci. Technol., 42,5068–5073, doi:10.1021/es7022576, 2008b.
Zhao, B., Wang, P., Ma, J. Z., Zhu, S., Pozzer, A., and Li, W.:A high-resolution emission inventory of primary pollutants forthe Huabei region, China, Atmos. Chem. Phys., 12, 481–501,doi:doi:10.5194/acp-12-481-2012, 2012.
Zhao, Q., He, K., Rahn, K., Ma, Y., Jia, Y., Yang, F., Duan, F.,Lei, Y., Cheng, Y., and Wang, S.: Dust storms come to Cen-tral and Southwestern China, too: implications from a majordust event in Chongqing, Atmos. Chem. Phys., 10, 2615–2630,doi:10.5194/acp-10-2615-2010, 2010.
www.atmos-chem-phys.net/14/8679/2014/ Atmos. Chem. Phys., 14, 8679–8699, 2014