Pollution Control Study Report, Regional Watersheds ...
250
Pollution Source Control Study for Lake Banook & Lake Micmac Final Report April 11, 2019 Prepared for: Halifax Regional Municipality 40 Alderney Drive Dartmouth, NS B2Y 2N5 Prepared by: Stantec Consulting Ltd. 102-40 Highfield Park Drive Dartmouth, NS B3A 0A3 Item 10.1.2
Transcript of Pollution Control Study Report, Regional Watersheds ...
Pollution Source Control Study for Lake Banook & Lake MicmacFinal Report
April 11, 2019
Prepared for:
Halifax Regional Municipality 40 Alderney Drive Dartmouth, NS B2Y 2N5
Prepared by:
Stantec Consulting Ltd. 102-40 Highfield Park DriveDartmouth, NS B3A 0A3
Item 10.1.2

Sign-off Sheet
This document entitled Pollution Source Control Study for Lake Banook & Lake Micmac Final Report was prepared by Stantec Consulting Ltd. (“Stantec”) for the account of Halifax Regional Municipality (the “Client”). Any reliance on this document by any third party is strictly prohibited. The material in it reflects Stantec’s professional judgment in light of the scope, schedule and other limitations stated in the document and in the contract between Stantec and the Client. The opinions in the document are based on conditions and information existing at the time the document was published and do not take into account any subsequent changes. In preparing the document, Stantec did not verify information supplied to it by others. Any use which a third party makes of this document is the responsibility of such third party. Such third party agrees that Stantec shall not be responsible for costs or damages of any kind, if any, suffered by it or any other third party as a result of decisions made or actions taken based on this document.
Prepared by
(signature)
Janeen McGuigan, M.A.Sc., E.I.T.
Reviewed by
(signature)
Igor Iskra, P.Eng., Ph.D.
Approved by
(signature)
Marc Skinner, C.D., Ph.D.
POLLUTION SOURCE CONTROL STUDY FOR LAKE BANOOK & LAKE MICMAC FINAL REPORT
File: 121415826 i
Executive Summary
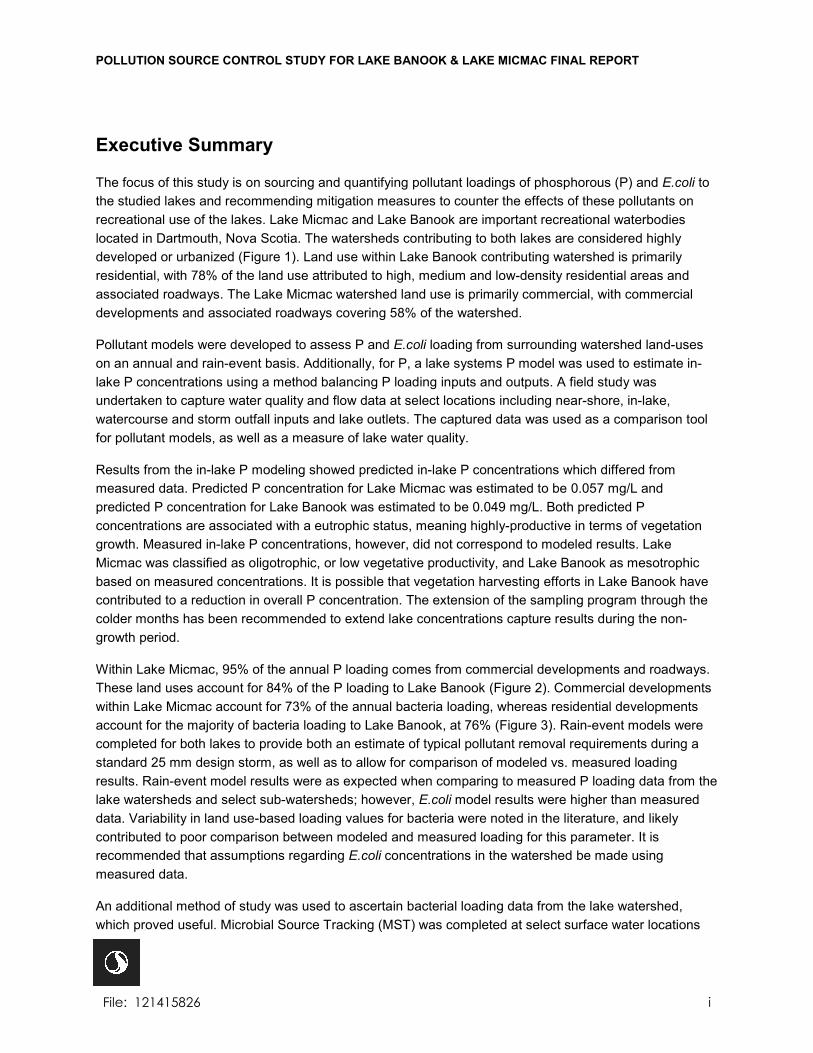
The focus of this study is on sourcing and quantifying pollutant loadings of phosphorous (P) and E.coli to the studied lakes and recommending mitigation measures to counter the effects of these pollutants on recreational use of the lakes. Lake Micmac and Lake Banook are important recreational waterbodies located in Dartmouth, Nova Scotia. The watersheds contributing to both lakes are considered highly developed or urbanized (Figure 1). Land use within Lake Banook contributing watershed is primarily residential, with 78% of the land use attributed to high, medium and low-density residential areas and associated roadways. The Lake Micmac watershed land use is primarily commercial, with commercial developments and associated roadways covering 58% of the watershed.
Pollutant models were developed to assess P and E.coli loading from surrounding watershed land-uses on an annual and rain-event basis. Additionally, for P, a lake systems P model was used to estimate in-lake P concentrations using a method balancing P loading inputs and outputs. A field study was undertaken to capture water quality and flow data at select locations including near-shore, in-lake, watercourse and storm outfall inputs and lake outlets. The captured data was used as a comparison tool for pollutant models, as well as a measure of lake water quality.
Results from the in-lake P modeling showed predicted in-lake P concentrations which differed from measured data. Predicted P concentration for Lake Micmac was estimated to be 0.057 mg/L and predicted P concentration for Lake Banook was estimated to be 0.049 mg/L. Both predicted P concentrations are associated with a eutrophic status, meaning highly-productive in terms of vegetation growth. Measured in-lake P concentrations, however, did not correspond to modeled results. Lake Micmac was classified as oligotrophic, or low vegetative productivity, and Lake Banook as mesotrophic based on measured concentrations. It is possible that vegetation harvesting efforts in Lake Banook have contributed to a reduction in overall P concentration. The extension of the sampling program through the colder months has been recommended to extend lake concentrations capture results during the non-growth period.
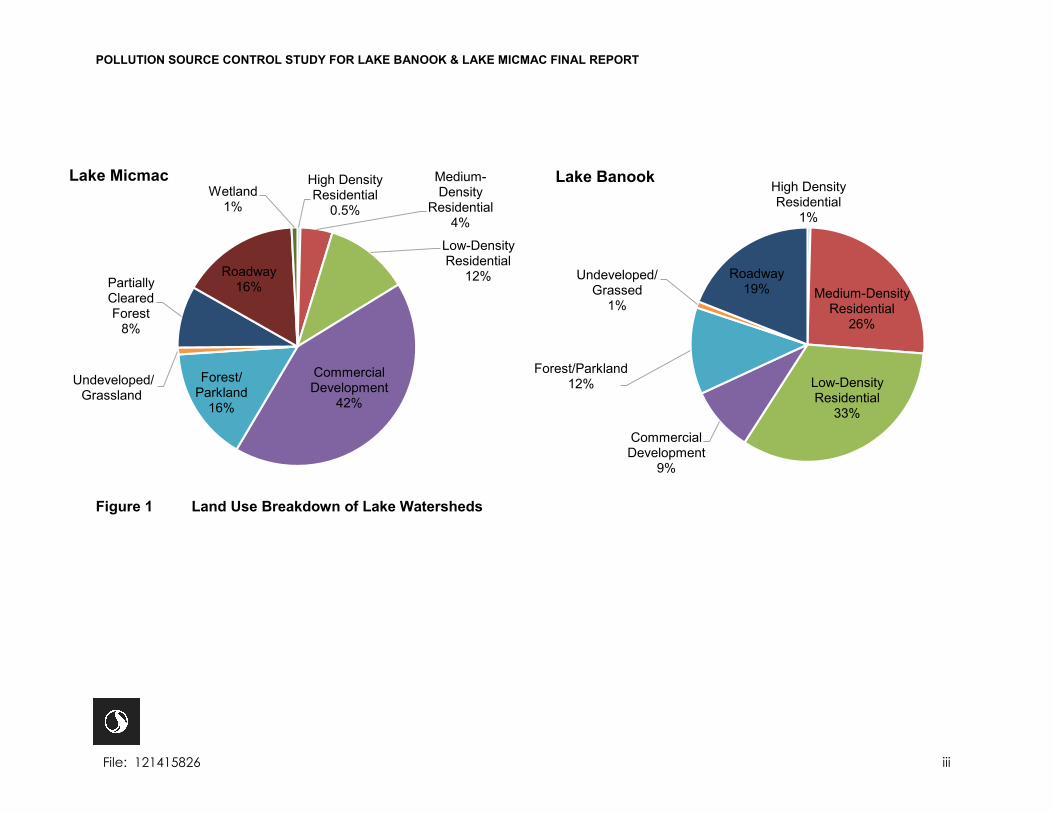
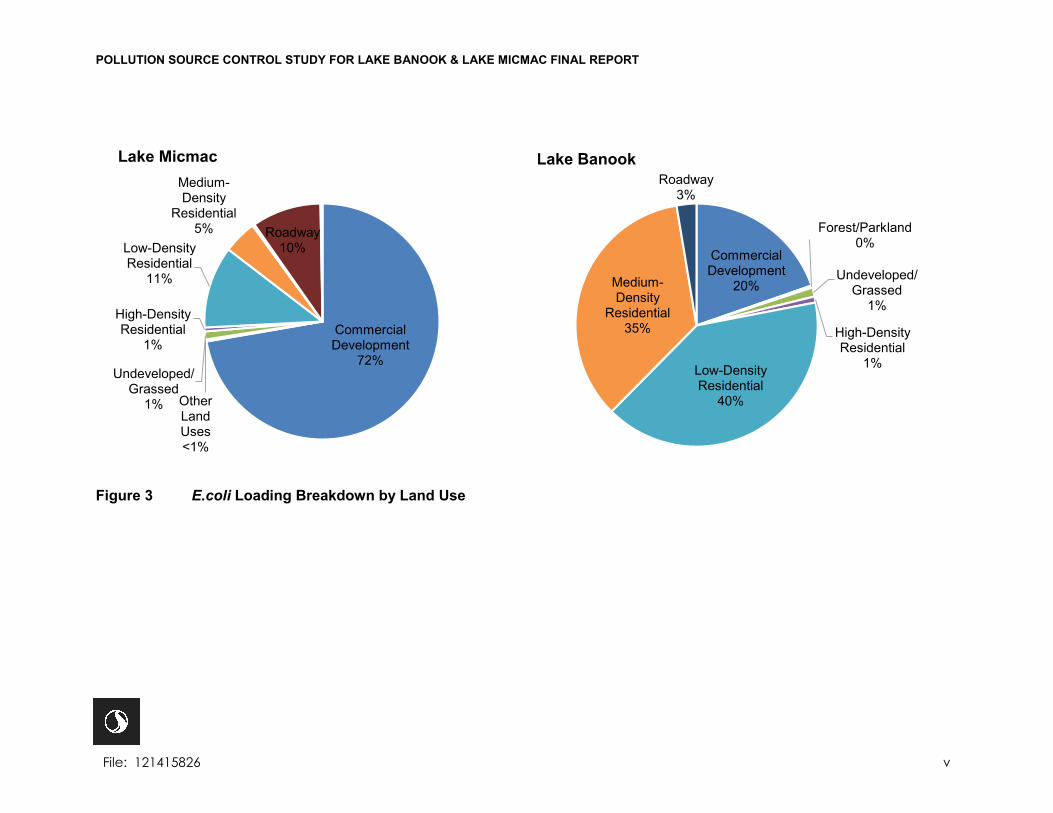
Within Lake Micmac, 95% of the annual P loading comes from commercial developments and roadways. These land uses account for 84% of the P loading to Lake Banook (Figure 2). Commercial developments within Lake Micmac account for 73% of the annual bacteria loading, whereas residential developments account for the majority of bacteria loading to Lake Banook, at 76% (Figure 3). Rain-event models were completed for both lakes to provide both an estimate of typical pollutant removal requirements during a standard 25 mm design storm, as well as to allow for comparison of modeled vs. measured loading results. Rain-event model results were as expected when comparing to measured P loading data from the lake watersheds and select sub-watersheds; however, E.coli model results were higher than measured data. Variability in land use-based loading values for bacteria were noted in the literature, and likely contributed to poor comparison between modeled and measured loading for this parameter. It is recommended that assumptions regarding E.coli concentrations in the watershed be made using measured data.
An additional method of study was used to ascertain bacterial loading data from the lake watershed, which proved useful. Microbial Source Tracking (MST) was completed at select surface water locations

POLLUTION SOURCE CONTROL STUDY FOR LAKE BANOOK & LAKE MICMAC FINAL REPORT
File: 121415826 ii
within both lake systems. MST uses genetic marker detection to trace E.coli to a specific host-of origin. This study focused on human, canine, ruminant (deer) and avian genetic markers, with results showing high occurrence of each marker at specific lake locations. For example, high instances of avian genetic markers were found to be associated with high E.coli concentration events near a bridge separating the two lakes. Human genetic markers were detected at several locations discharging to the lake systems.
Recommendations have been made to mitigate pollutant loading and associated risk from the studied parameters through a varied combination of maintenance undertakings, infrastructure assessment, stormwater treatment implementation, land use changes, public consultation and continuation of existing mitigation activities in the form of submerged aquatic vegetation harvesting programs.
POLLUTION SOURCE CONTROL STUDY FOR LAKE BANOOK & LAKE MICMAC FINAL REPORT
File: 121415826 iii
Figure 1 Land Use Breakdown of Lake Watersheds
High Density Residential
0.5%
Medium-Density
Residential4%
Low-Density Residential
12%
Commercial Development
42%
Forest/ Parkland
16%
Undeveloped/Grassland
Partially Cleared Forest
8%
Roadway16%
Wetland1%
Lake MicmacHigh Density Residential
1%
Medium-Density Residential
26%
Low-Density Residential
33%
Commercial Development
9%
Forest/Parkland12%
Undeveloped/ Grassed
1%
Roadway19%
Lake Banook
POLLUTION SOURCE CONTROL STUDY FOR LAKE BANOOK & LAKE MICMAC FINAL REPORT
File: 121415826 iv
Figure 2 Phosphorous Loading Breakdown by Land Use
Commercial Development
58%
Other Land Uses <1%
Low-Density Residential
2%
Medium-Density
Residential1%
Partially Cleared Forest
2%
Roadway37%
Lake Micmac
Commercial Development
18%
Other Land Uses<1%
Low-Density Residential
8%Medium-Density
Residential8%
Roadway66%
Lake Banook
POLLUTION SOURCE CONTROL STUDY FOR LAKE BANOOK & LAKE MICMAC FINAL REPORT
File: 121415826 v
Figure 3 E.coli Loading Breakdown by Land Use
Commercial Development
20%
Forest/Parkland0%
Undeveloped/Grassed
1%
High-Density Residential
1%Low-Density Residential
40%
Medium-Density
Residential35%
Roadway3%
Lake Banook
Commercial Development
72%
Other Land Uses <1%
Undeveloped/Grassed
1%
High-Density Residential
1%
Low-Density Residential
11%
Medium-Density
Residential5% Roadway
10%
Lake Micmac
POLLUTION SOURCE CONTROL STUDY FOR LAKE BANOOK & LAKE MICMAC FINAL REPORT
File: 121415826 vi
Table of Contents
1.0 BACKGROUND ........................................................................................................... 1.1 1.1 STUDIED WATERSHEDS ............................................................................................ 1.1 1.2 REPORT OBJECTIVE .................................................................................................. 1.4 1.3 SAMPLING PLAN DEVELOPMENT ............................................................................. 1.4
1.3.1 Site Reconnaissance .................................................................................. 1.4 1.3.2 Background Information Review .................................................................. 1.4
1.4 APPLICABLE GUIDELINES ......................................................................................... 1.5 1.5 CLIMATE DATA ........................................................................................................... 1.5
1.5.1 Precipitation ................................................................................................ 1.5 1.5.2 Climate Normals .......................................................................................... 1.7
2.0 METHODOLOGY ......................................................................................................... 2.1 2.1 FIELD STUDIES ........................................................................................................... 2.1
2.1.1 Surface Water Flow Monitoring ................................................................... 2.2 2.1.2 Surface Water Quality Monitoring ................................................................ 2.3
2.2 MICROBIAL SOURCE TRACKING .............................................................................. 2.4 2.3 WATERSHED DELINEATION ...................................................................................... 2.4 2.4 WATER QUALITY MODELLING .................................................................................. 2.5
2.4.1 Rainfall Event-Based Model ........................................................................ 2.5 2.4.2 Annual Loading Model................................................................................. 2.7 2.4.3 Lake System Model ..................................................................................... 2.9
3.0 MONITORING RESULTS ............................................................................................. 3.1 3.1 SURFACE WATER FLOW AND CONTAMINANT LOADING ....................................... 3.1 3.2 SURFACE WATER QUALITY MONITORING .............................................................. 3.5
3.2.1 In-Situ Water Monitoring .............................................................................. 3.5 3.2.2 Surface Water Quality ................................................................................. 3.9
3.3 FECAL SOURCE IDENTIFICATION .......................................................................... 3.13
4.0 MODELLING RESULTS .............................................................................................. 4.1 4.1 ANNUAL WATERSHED LOADING .............................................................................. 4.1
4.1.1 Phosphorous ............................................................................................... 4.1 4.1.2 Fecal Coliform ............................................................................................. 4.2
4.2 PRECIPITATION EVENT-BASED LOADING ............................................................... 4.3 4.2.1 Phosphorous ............................................................................................... 4.3 4.2.2 Fecal Coliform ............................................................................................. 4.5
4.3 LAKE SYSTEM PHOSPHOROUS LOADING ............................................................... 4.6
5.0 ANALYSIS ................................................................................................................... 5.1 5.1.1 Surface Water Flow and Contaminant Loading ........................................... 5.1 5.1.2 Surface Water Quality Summary ................................................................. 5.1 5.1.3 Fecal Source Identification Summary .......................................................... 5.2 5.1.4 Modelling Results Summary ........................................................................ 5.3
POLLUTION SOURCE CONTROL STUDY FOR LAKE BANOOK & LAKE MICMAC FINAL REPORT
File: 121415826 vii
6.0 RECOMMENDATIONS TO MITIGATE LOADING ....................................................... 6.1 6.1 PHOSPHOROUS LOADING MITIGATION ................................................................... 6.1
6.1.1 Land Use-Based Mitigation ......................................................................... 6.1 6.1.2 Vegetation Harvesting ................................................................................. 6.1 6.1.3 On-going Monitoring .................................................................................... 6.2
6.2 E.COLI LOADING MITIGATION ................................................................................... 6.2 6.2.1 Infrastructure-Based Mitigation .................................................................... 6.2 6.2.2 Public Education ......................................................................................... 6.3 6.2.3 On-going Monitoring .................................................................................... 6.3
6.3 ADDITIONAL POLLUTANT MITIGATION .................................................................... 6.3
7.0 CONCLUSIONS ........................................................................................................... 7.1
8.0 REFERENCES ............................................................................................................. 8.1
LIST OF TABLES Table 1 Sample Location and Selection Rationale ......................................................... 2.1 Table 2 Field Monitoring Event Summary ...................................................................... 2.2 Table 3 Surface Water Flow Monitoring Methods Summary Table ................................. 2.2 Table 4 Summary of Land Use Runoff Parameters ........................................................ 2.5 Table 5 Phosphorous Event Mean Concentrations for Select Land Use ........................ 2.6 Table 6 Fecal Coliform Event Mean Concentrations for Select Land Uses .................... 2.7 Table 7 Area-based Phosphorous Loading Rates for Select Land Uses ........................ 2.8 Table 8 Area-based Fecal Coliform Loading Rates for Select Land Uses ...................... 2.9 Table 9 Summary of Select Lake System Model Parameters ...................................... 2.10 Table 10 Phosphorous Loading at HDW Locations .......................................................... 3.3 Table 11 E.coli Loading at HDW Locations ...................................................................... 3.4 Table 12 Summary of E. coli Concentrations and Identified Fecal Markers by
Sample Location ............................................................................................. 3.14 Table 13 E. coli Concentrations (CFU/100 mL) and Potential Contributing Sources ...... 3.15 Table 14 Predicted Annual P Loading to Lake Micmac .................................................... 4.1 Table 15 Predicted Annual P Loading to Lake Banook .................................................... 4.2 Table 16 Predicted Annual FC Loading to Lake Micmac .................................................. 4.2 Table 17 Predicted Annual FC Loading to Lake Banook .................................................. 4.3 Table 18 Lake Micmac Predicted P Loading during 25 mm Rain Event ........................... 4.3 Table 19 Lake Banook Predicted P Loading during 25 mm Rain Event ........................... 4.4 Table 20 Outfall 8 (to Lake Banook) Predicted P Loading during 25mm Rain Event ........ 4.4 Table 21 Lake Micmac Predicted FC Loading during 25 mm Rain Event ......................... 4.5 Table 22 Lake Banook Predicted FC Loading during 25 mm Rain Event ......................... 4.5 Table 23 Outfall 8 (to Lake Banook) Sub-watershed Predicted FC Loading during
25 mm Rain Event ............................................................................................ 4.6 Table 24 Lake System P Model Results Summary, Lake Micmac and Lake Banook ....... 4.6 Table 25 Model Validation of Predicted vs. Measured P Concentrations ......................... 4.7
POLLUTION SOURCE CONTROL STUDY FOR LAKE BANOOK & LAKE MICMAC FINAL REPORT
File: 121415826 viii
LIST OF FIGURES Figure 1 Land Use Breakdown of Lake Watersheds ......................................................... iii Figure 2 Phosphorous Loading Breakdown by Land Use .................................................. iv Figure 3 E.coli Loading Breakdown by Land Use ............................................................... v Figure 4 Project Location ................................................................................................ 1.2 Figure 5 Land Use Breakdown for Lake Banook and Lake Micmac Watersheds ............. 1.3 Figure 6 Daily Rainfall (mm), Lake Major Climate Station (ID: 8202896) ......................... 1.6 Figure 7 Measured Surface Water Flow by Sample Location .......................................... 3.1 Figure 8 Measured P Loading by Sample Location ......................................................... 3.2 Figure 9 Measured E.coli Loading by Sample Location ................................................... 3.2 Figure 10 In-Situ Temperature (⁰C) Profiles for the Lake Micmac In-Lake Station ............. 3.5 Figure 11 In-Situ Dissolved Oxygen (mg/L) Profiles for the Lake Micmac In-Lake
Station .............................................................................................................. 3.6 Figure 12 In-Situ pH Profiles for the Lake Micmac In-Lake Station .................................... 3.6 Figure 13 In-Situ Temperature (⁰C) Profiles for the Lake Banook In-Lake Station ............. 3.7 Figure 14 In-Situ Dissolved Oxygen (mg/L) Profiles for the Lake Banook In-Lake
Station .............................................................................................................. 3.8 Figure 15 In-Situ pH Profiles for the Lake Banook In-Lake Station .................................... 3.8 Figure 16 In-lake Phosphorous Concentrations, Lake Micmac .......................................... 3.9 Figure 17 In-lake Chloride Concentrations, Lake Micmac ............................................... 3.10 Figure 18 In-lake Copper Concentrations, Lake Micmac ................................................. 3.11 Figure 19 In-lake Phosphorous Concentrations, Lake Banook ........................................ 3.12 Figure 20 In-lake Chloride Concentrations, Lake Banook ............................................... 3.12 Figure 21 In-lake Copper Concentrations, Lake Banook ................................................. 3.13
LIST OF APPENDICES APPENDIX A MAPS A.1 – Monitoring Sites A.2 – Delineated Watersheds APPENDIX B RESULTS TABLES B.1 – Water Quality Parameters by Sampling Location B.2. – Surface Water Flow Monitoring B.3 – In-Situ Water Quality Monitoring B.4 – Surface Water Grab Samples B.5 – Microbial Source Tracking APPENDIX C LABORATORY REPORTS APPENDIX D MODELLING OUTPUTS D.1 – Rain-Event Based Model D.2 – Annual Loading Model D.3 – Lake System P Model D.4 – PCSWMM Reports APPENDIX E SUPPORTING INFORMATION E.1 – Microbial Source Tracking Methodology E.2 – User’s Manual for Prediction of Phosphorus Concentration in Nova Scotia Lakes
POLLUTION SOURCE CONTROL STUDY FOR LAKE BANOOK & LAKE MICMAC FINAL REPORT
Background April 11, 2019
File: 121415826 1.1
1.0 BACKGROUND
1.1 STUDIED WATERSHEDS
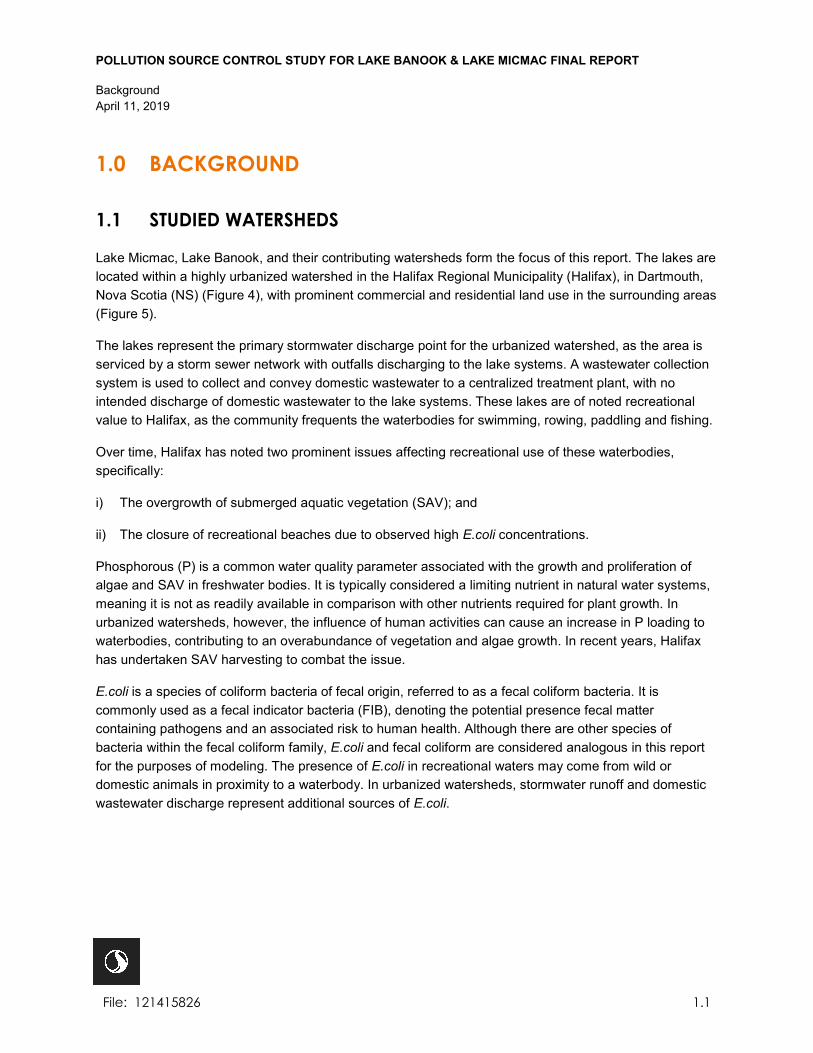
Lake Micmac, Lake Banook, and their contributing watersheds form the focus of this report. The lakes are located within a highly urbanized watershed in the Halifax Regional Municipality (Halifax), in Dartmouth, Nova Scotia (NS) (Figure 4), with prominent commercial and residential land use in the surrounding areas (Figure 5).
The lakes represent the primary stormwater discharge point for the urbanized watershed, as the area is serviced by a storm sewer network with outfalls discharging to the lake systems. A wastewater collection system is used to collect and convey domestic wastewater to a centralized treatment plant, with no intended discharge of domestic wastewater to the lake systems. These lakes are of noted recreational value to Halifax, as the community frequents the waterbodies for swimming, rowing, paddling and fishing.
Over time, Halifax has noted two prominent issues affecting recreational use of these waterbodies, specifically:
i) The overgrowth of submerged aquatic vegetation (SAV); and
ii) The closure of recreational beaches due to observed high E.coli concentrations.
Phosphorous (P) is a common water quality parameter associated with the growth and proliferation of algae and SAV in freshwater bodies. It is typically considered a limiting nutrient in natural water systems, meaning it is not as readily available in comparison with other nutrients required for plant growth. In urbanized watersheds, however, the influence of human activities can cause an increase in P loading to waterbodies, contributing to an overabundance of vegetation and algae growth. In recent years, Halifax has undertaken SAV harvesting to combat the issue.
E.coli is a species of coliform bacteria of fecal origin, referred to as a fecal coliform bacteria. It is commonly used as a fecal indicator bacteria (FIB), denoting the potential presence fecal matter containing pathogens and an associated risk to human health. Although there are other species of bacteria within the fecal coliform family, E.coli and fecal coliform are considered analogous in this report for the purposes of modeling. The presence of E.coli in recreational waters may come from wild or domestic animals in proximity to a waterbody. In urbanized watersheds, stormwater runoff and domestic wastewater discharge represent additional sources of E.coli.

ProjectLocation
LakeMicmac
LakeBanook
Figure 4
ProjectLocation
NAD 1983 CSRS UTM Zone 20N
Pollution Source Control Study for Lake Banook & Lake Micmac,Halifax Regional Municipality
0 1 2 3 4 5
Kilometres
Project Location
121415826-003
Disclaimer: This map is for illustrative purposes to support this Stantec project; questions can be directed to the issuing agency.
\\Ca0213-ppfss01\work_group\1214\active\121415826\03_data\gis_cad\gis\mapping\mxd\report\121415826-003_site_overview.mxd
Service Layer Credits: Sources: Esri, HERE, Garmin, Intermap, increment P Corp., GEBCO, USGS, FAO, NPS, NRCAN, GeoBase, IGN,Kadaster NL, Ordnance Survey, Esri Japan, METI, Esri China (Hong Kong), swisstopo, © OpenStreetMap contributors, and the GIS UserCommunity
($$¯
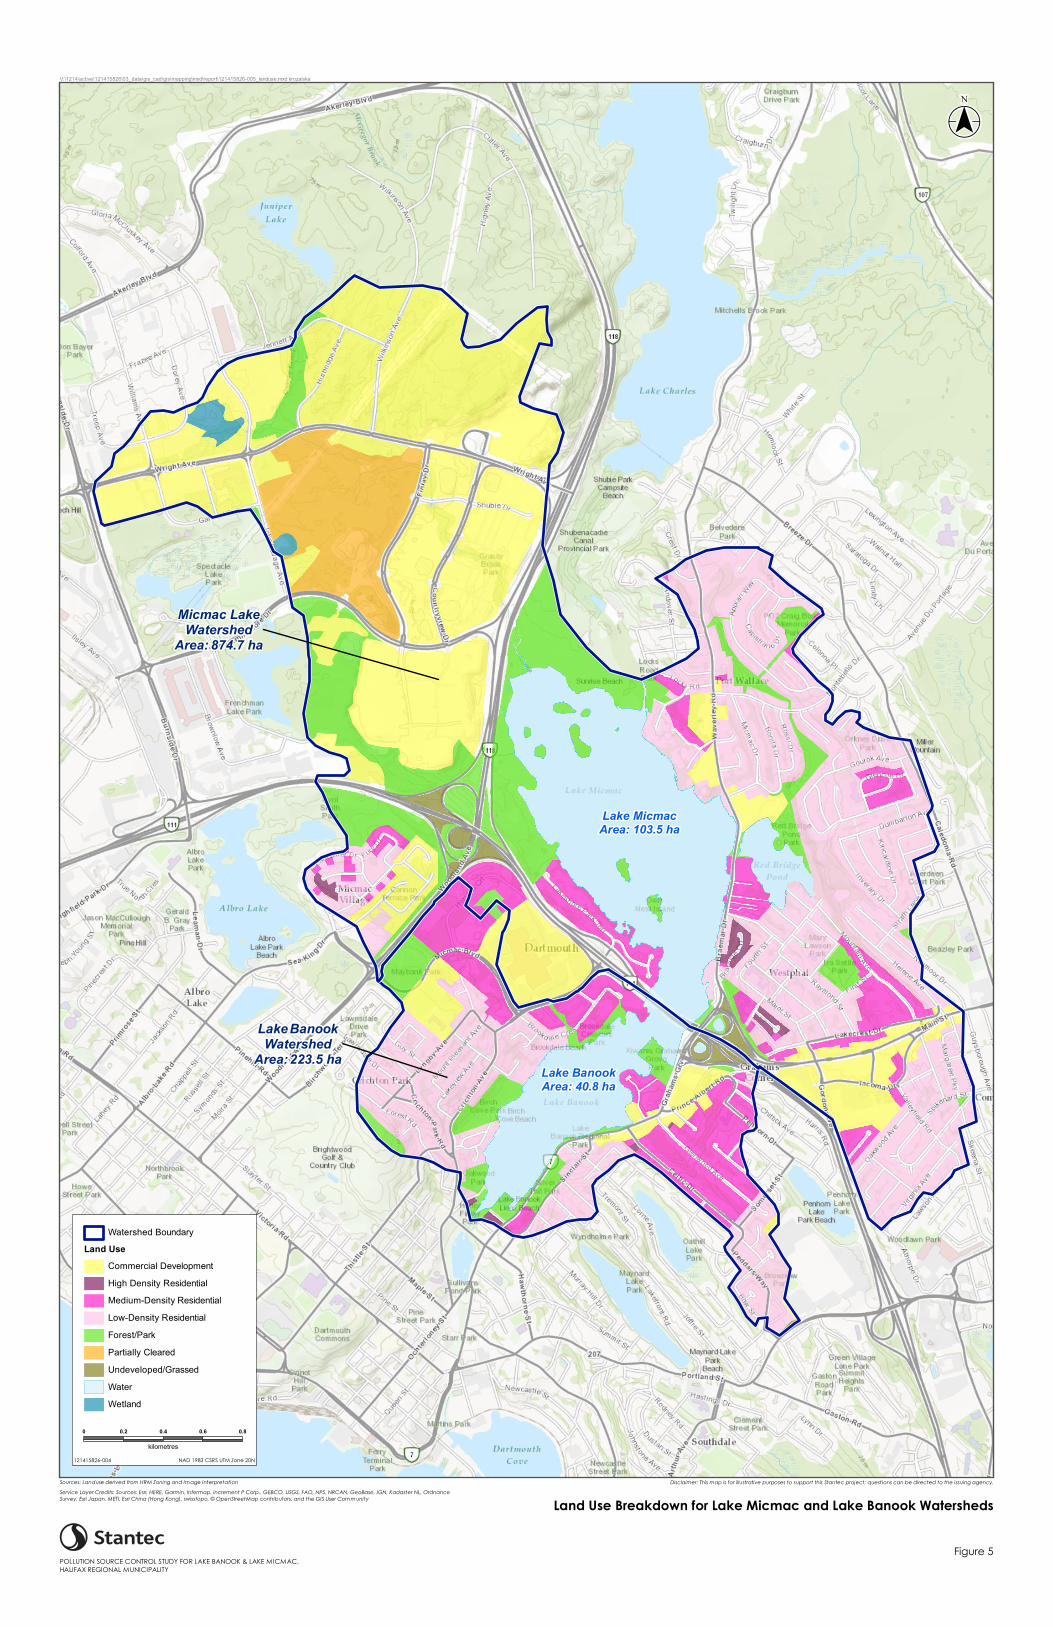
Lake MicmacArea: 103.5 ha
Lake BanookArea: 40.8 ha
Micmac LakeWatershed
Area: 874.7 ha
Lake BanookWatershed
Area: 223.5 ha
($$¯
Watershed BoundaryLand Use
Commercial DevelopmentHigh Density ResidentialMedium-Density ResidentialLow-Density ResidentialForest/ParkPartially ClearedUndeveloped/GrassedWaterWetland
V:\1214\active\121415826\03_data\gis_cad\gis\mapping\mxd\report\121415826-005_landuse.mxd krozalska
NAD 1983 CSRS UTM Zone 20N 121415826-004
Disclaimer: This map is for illustrative purposes to support this Stantec project; questions can be directed to the issuing agency.
Figure 5
Land Use Breakdown for Lake Micmac and Lake Banook WatershedsService Layer Credits: Sources: Esri, HERE, Garmin, Intermap, increment P Corp., GEBCO, USGS, FAO, NPS, NRCAN, GeoBase, IGN, Kadaster NL, OrdnanceSurvey, Esri Japan, METI, Esri China (Hong Kong), swisstopo, © OpenStreetMap contributors, and the GIS User Community
Sources: Landuse derived from HRM Zoning and Image Interpretation
POLLUTION SOURCE CONTROL STUDY FOR LAKE BANOOK & LAKE MICMAC,HALIFAX REGIONAL MUNICIPALITY
0 0.2 0.4 0.6 0.8
kilometres

POLLUTION SOURCE CONTROL STUDY FOR LAKE BANOOK & LAKE MICMAC FINAL REPORT
Background April 11, 2019
File: 121415826 1.4
1.2 REPORT OBJECTIVE
The objective of this report is to present the results of a watershed assessment focusing on the loading of two pollutants, E.coli and total P, into two recreational waterbodies within Halifax. The selection of these specific pollutants is based on the observation of adverse effects to the recreational use of the studied waterbodies from these pollutants. To complete the report objective, the following tasks were undertaken:
1. The review and summary of pertinent background information.
2. The development of pollutant loading models to estimate E.coli and P loads into the study lakes and identify potential land use-based sources.
3. The completion of a field monitoring program to assess pollutant concentration and loading into the study lakes during baseflows and storm events.
4. The development of recommendations to reduce pollutant loading and improve water quality based on results of the field monitoring program and pollutant load model.
Assessment of E.coli loading included high-level source identification through the analysis of select water samples for host-specific DNA markers (i.e., human, canine, avian). A summary of general water quality is also provided in order to identify any additional pollutants that may affect lake water quality.
1.3 SAMPLING PLAN DEVELOPMENT
1.3.1 Site Reconnaissance
Preliminary site reconnaissance field work was completed prior to the initiation of water quality sampling and flow monitoring program. This reconnaissance work was completed by Stantec on June 19, 2018 with the primary aim of confirming sampling locations, site access issues, and to identify locations of congregating wildlife or waterfowl. Based on the site reconnaissance, work location sample sites were divided into those that were to be sampled by a shore-based field team and those that required vessel access and would be sampled by a vessel-based field team. As outlined in the proposal, reconnaissance work was completed following a rainfall event to identify any additional inflows into the lake system and the presence/absence of stormwater outfalls discharging to the lakes. Many of the outfalls were noted to have no flow during the monitoring program except when sampling after heavy rainfall.
1.3.2 Background Information Review
Stantec reviewed GIS information provided by Halifax and Halifax Regional Water Commission to help identify outlet and inlet locations of the lake systems. This information was incorporated into field planning figures and mapping presented with this report. The provided information includes:
• Watershed boundaries • Storm sewer outfall locations • Wastewater pumping stations • Storm sewer drainage area/infrastructure mapping
POLLUTION SOURCE CONTROL STUDY FOR LAKE BANOOK & LAKE MICMAC FINAL REPORT
Background April 11, 2019
File: 121415826 1.5
• Land use mapping, including roads and other transportation infrastructure (AECOM 2013) • Available location information on stormwater management (SWM) infrastructure within the
watersheds • Existing water quality monitoring locations
Stantec also reviewed information collected during previous monitoring studies conducted on the lake system, as referenced throughout this report. Useful information gained from the aquatic vegetation reports previously completed by Stantec (Stantec 2012, 2014, 2015, 2016a, 2016b, 2017a, 2017b, 2018) included sampling site access locations and lake water depth profiles.
1.4 APPLICABLE GUIDELINES
There are two primary guidance documents used within Canada to assess the quality of fresh surface waters, as described below:
Canadian Council of Ministers of the Environment (CCME) Guidelines for the Protection of Freshwater Aquatic Life (FAL) – the CCME has a published set of guidelines used to assess risk to freshwater aquatic species for a selection of parameters within a freshwater source. Concentration-based guideline values are presented for both short-term and long-term exposure. Guidance frameworks are also provided for assessing nutrient status and baseline water quality conditions.
Health Canada Guidelines for Canadian Recreational Water Quality (CRWQ) – Health Canada provides a published set of concentration-based guidelines and guidance commentary for a selection of parameters used to assess risk to human health during recreational use of waters. Guidelines cover various exposure scenarios, including primary and secondary contact activities.
These guidance documents are used to assess water quality where applicable.
1.5 CLIMATE DATA
1.5.1 Precipitation
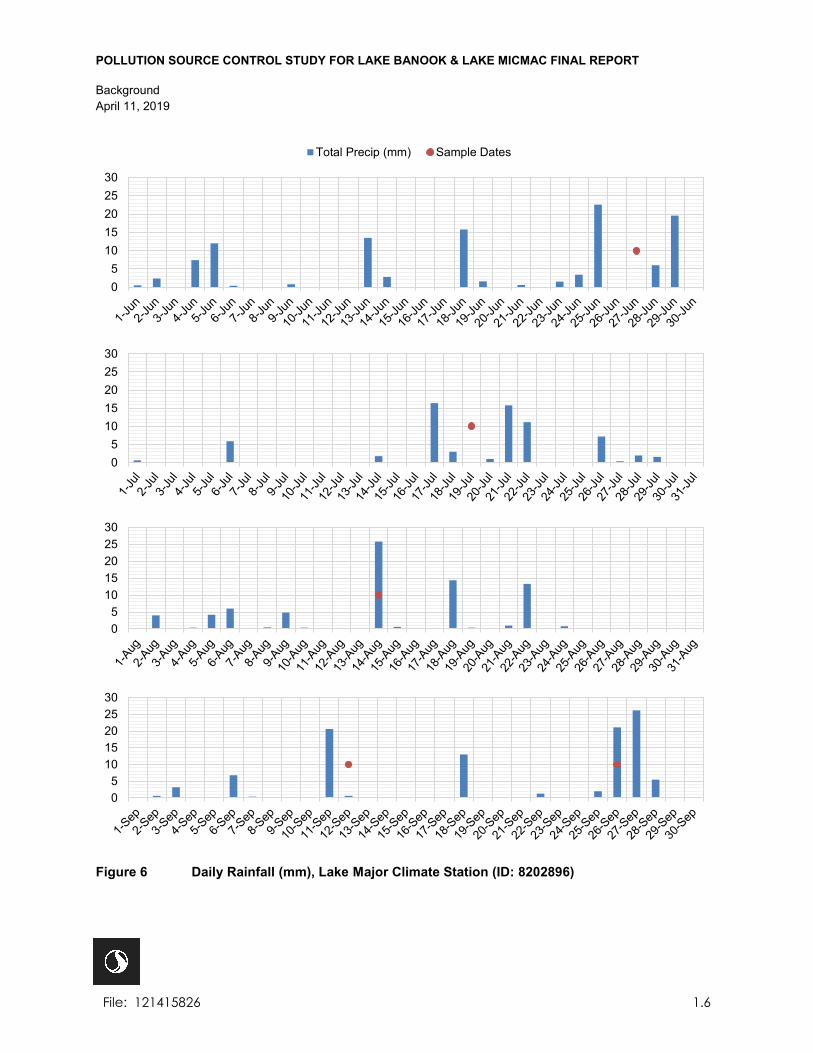
Graphs of daily precipitation for June - September 2018 are given in Figure 6. Daily precipitation data were taken from the Environment Canada Lake Major Climate Station (Climate ID: 8202896) located approximately 7 kilometres northeast of Lake Micmac. This station is the closest station to Lake Micmac with daily data for the sampling period. For the purpose of this study, a qualifying rainfall event is defined as having a minimum 3-hour duration and producing a minimum of 10 mm of rain, preceded by a dry period lasting a minimum of 48-hours. Sampling was to occur within 24-hours of a qualifying event. Sample events on August 14, 2018 and September 26, 2018 occurred during measured rainfall events with associated rainfall depths of 26 mm and 21 mm, respectively. The sample event on September 12, 2018 occurred within 24-hours of a recorded rainfall event of 21 mm, whereas events on June 27, 2018 and July 19, 2018 had minimal to no rainfall on the preceding day.
POLLUTION SOURCE CONTROL STUDY FOR LAKE BANOOK & LAKE MICMAC FINAL REPORT
Background April 11, 2019
File: 121415826 1.6
Figure 6 Daily Rainfall (mm), Lake Major Climate Station (ID: 8202896)
05
1015202530
Total Precip (mm) Sample Dates
05
1015202530
05
1015202530
05
1015202530
POLLUTION SOURCE CONTROL STUDY FOR LAKE BANOOK & LAKE MICMAC FINAL REPORT
Background April 11, 2019
File: 121415826 1.7
1.5.2 Climate Normals
Climate normal data were used for an estimate of the annual rainfall in the study area. The Environment Canada Shearwater Airport Climate Station (Climate ID: 8205090) data from 1981 to 2010 were used. This station is located approximately 7 km from Lake Micmac and is the closest climate station to the study area with climate normal data. For the thirty-year data period, the average annual precipitation is 1,261.2 mm per year.
POLLUTION SOURCE CONTROL STUDY FOR LAKE BANOOK & LAKE MICMAC FINAL REPORT
Methodology April 11, 2019
File: 121415826 2.1
2.0 METHODOLOGY
2.1 FIELD STUDIES
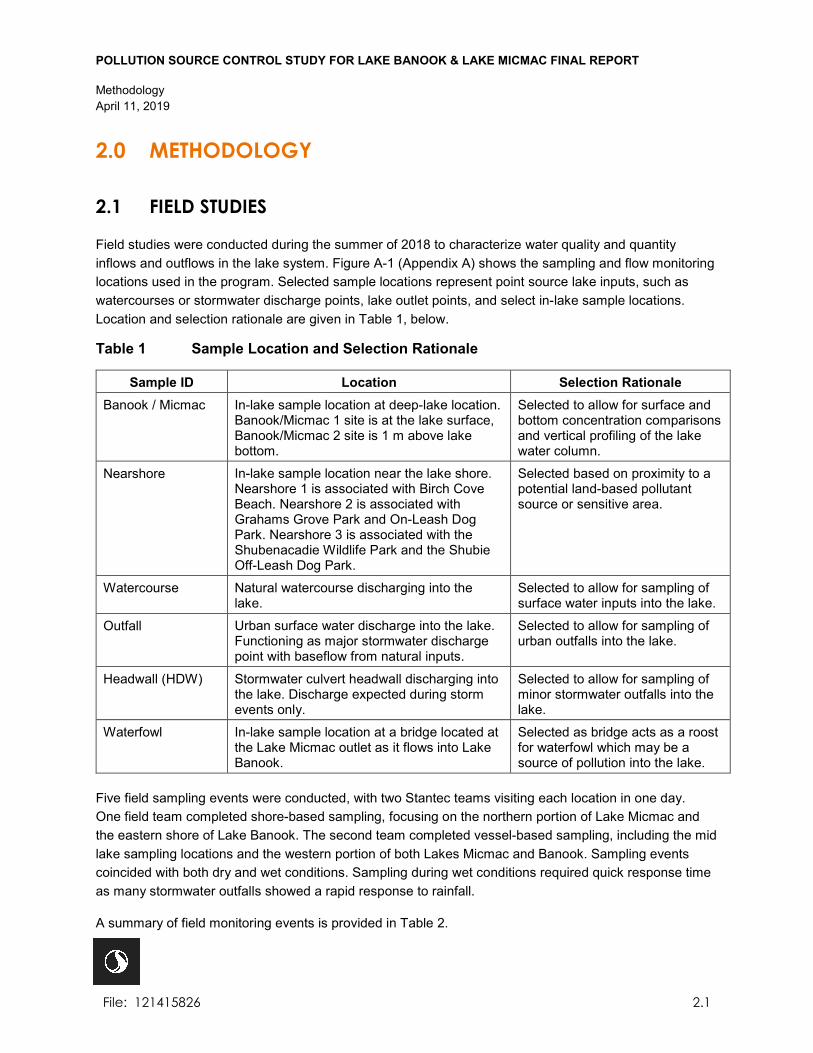
Field studies were conducted during the summer of 2018 to characterize water quality and quantity inflows and outflows in the lake system. Figure A-1 (Appendix A) shows the sampling and flow monitoring locations used in the program. Selected sample locations represent point source lake inputs, such as watercourses or stormwater discharge points, lake outlet points, and select in-lake sample locations. Location and selection rationale are given in Table 1, below.
Table 1 Sample Location and Selection Rationale
Sample ID Location Selection Rationale Banook / Micmac In-lake sample location at deep-lake location.
Banook/Micmac 1 site is at the lake surface, Banook/Micmac 2 site is 1 m above lake bottom.
Selected to allow for surface and bottom concentration comparisons and vertical profiling of the lake water column.
Nearshore In-lake sample location near the lake shore. Nearshore 1 is associated with Birch Cove Beach. Nearshore 2 is associated with Grahams Grove Park and On-Leash Dog Park. Nearshore 3 is associated with the Shubenacadie Wildlife Park and the Shubie Off-Leash Dog Park.
Selected based on proximity to a potential land-based pollutant source or sensitive area.
Watercourse Natural watercourse discharging into the lake.
Selected to allow for sampling of surface water inputs into the lake.
Outfall Urban surface water discharge into the lake. Functioning as major stormwater discharge point with baseflow from natural inputs.
Selected to allow for sampling of urban outfalls into the lake.
Headwall (HDW) Stormwater culvert headwall discharging into the lake. Discharge expected during storm events only.
Selected to allow for sampling of minor stormwater outfalls into the lake.
Waterfowl In-lake sample location at a bridge located at the Lake Micmac outlet as it flows into Lake Banook.
Selected as bridge acts as a roost for waterfowl which may be a source of pollution into the lake.
Five field sampling events were conducted, with two Stantec teams visiting each location in one day. One field team completed shore-based sampling, focusing on the northern portion of Lake Micmac and the eastern shore of Lake Banook. The second team completed vessel-based sampling, including the mid lake sampling locations and the western portion of both Lakes Micmac and Banook. Sampling events coincided with both dry and wet conditions. Sampling during wet conditions required quick response time as many stormwater outfalls showed a rapid response to rainfall.
A summary of field monitoring events is provided in Table 2.
POLLUTION SOURCE CONTROL STUDY FOR LAKE BANOOK & LAKE MICMAC FINAL REPORT
Methodology April 11, 2019
File: 121415826 2.2
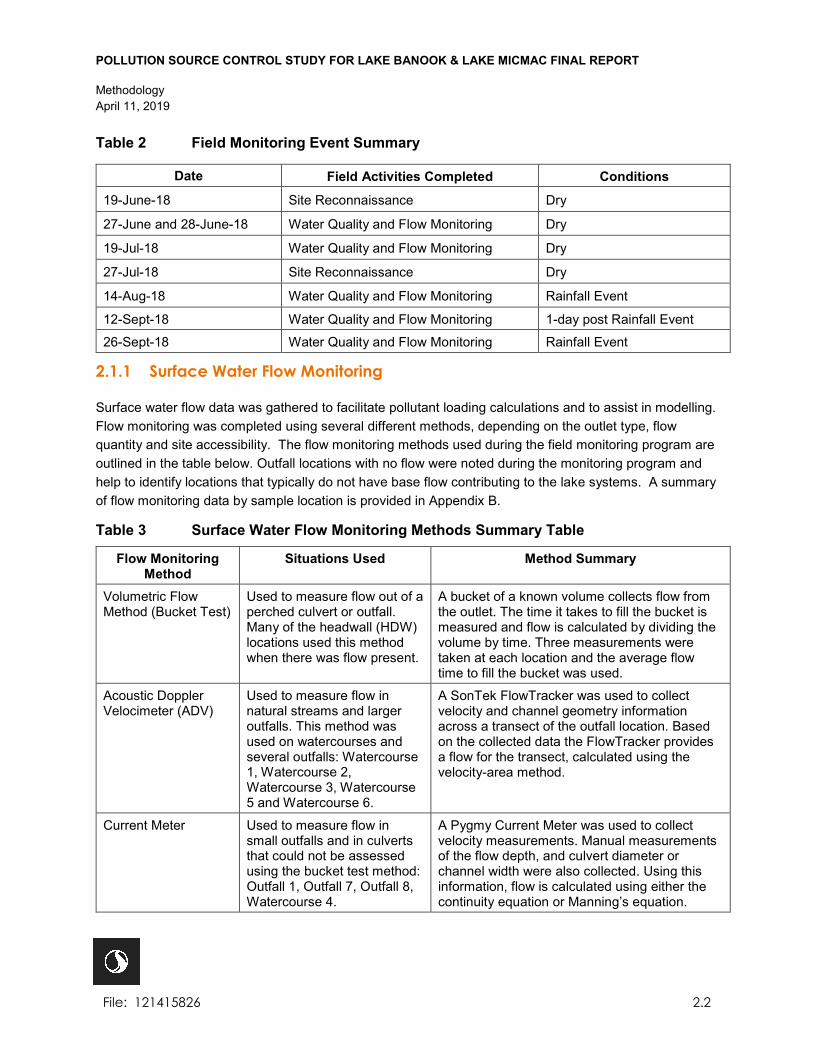
Table 2 Field Monitoring Event Summary
Date Field Activities Completed Conditions
19-June-18 Site Reconnaissance Dry
27-June and 28-June-18 Water Quality and Flow Monitoring Dry
19-Jul-18 Water Quality and Flow Monitoring Dry
27-Jul-18 Site Reconnaissance Dry
14-Aug-18 Water Quality and Flow Monitoring Rainfall Event
12-Sept-18 Water Quality and Flow Monitoring 1-day post Rainfall Event
26-Sept-18 Water Quality and Flow Monitoring Rainfall Event
2.1.1 Surface Water Flow Monitoring
Surface water flow data was gathered to facilitate pollutant loading calculations and to assist in modelling. Flow monitoring was completed using several different methods, depending on the outlet type, flow quantity and site accessibility. The flow monitoring methods used during the field monitoring program are outlined in the table below. Outfall locations with no flow were noted during the monitoring program and help to identify locations that typically do not have base flow contributing to the lake systems. A summary of flow monitoring data by sample location is provided in Appendix B.
Table 3 Surface Water Flow Monitoring Methods Summary Table
Flow Monitoring Method
Situations Used Method Summary
Volumetric Flow Method (Bucket Test)
Used to measure flow out of a perched culvert or outfall. Many of the headwall (HDW) locations used this method when there was flow present.
A bucket of a known volume collects flow from the outlet. The time it takes to fill the bucket is measured and flow is calculated by dividing the volume by time. Three measurements were taken at each location and the average flow time to fill the bucket was used.
Acoustic Doppler Velocimeter (ADV)
Used to measure flow in natural streams and larger outfalls. This method was used on watercourses and several outfalls: Watercourse 1, Watercourse 2, Watercourse 3, Watercourse 5 and Watercourse 6.
A SonTek FlowTracker was used to collect velocity and channel geometry information across a transect of the outfall location. Based on the collected data the FlowTracker provides a flow for the transect, calculated using the velocity-area method.
Current Meter Used to measure flow in small outfalls and in culverts that could not be assessed using the bucket test method: Outfall 1, Outfall 7, Outfall 8, Watercourse 4.
A Pygmy Current Meter was used to collect velocity measurements. Manual measurements of the flow depth, and culvert diameter or channel width were also collected. Using this information, flow is calculated using either the continuity equation or Manning’s equation.
POLLUTION SOURCE CONTROL STUDY FOR LAKE BANOOK & LAKE MICMAC FINAL REPORT
Methodology April 11, 2019
File: 121415826 2.3
2.1.2 Surface Water Quality Monitoring
Field staff conducted surface water sampling in accordance with Stantec’s standard operating procedures (SOPs). Special care was taken at the sampling locations not to disturb sediments to avoid water column disturbance and contamination. Sampling was completed by shore-based and vessel-based teams consisting of a minimum of two employees for safety reasons. Samples were collected at lake inlet and outlet locations that had sufficient flow. Locations with no or low flow were noted. During wet weather sampling events, priority was given to locations that routinely reported no flow conditions.
2.1.2.1 In-Situ Monitoring
In-situ physical water quality parameters of temperature, pH, dissolved oxygen (DO), total dissolved solids (TDS), oxidation-reduction potential (ORP), and conductivity were measured using a YSI 556 multi meter. At the two in-lake deep-water locations, a vertical profile measurement was collected to outline the lake thermocline.
2.1.2.2 Surface Water Quality Grab Sampling
Grab samples were collected in laboratory supplied containers and preserved in insulated coolers provided by Maxxam Analytics (Maxxam). Samples were uniquely labeled, and control was maintained using chain of custody forms. Laboratory analytical services were also provided by Maxxam. Maxxam’s Bedford Laboratory is accredited by the Standards Council of Canada (SCC) according to the International Standards Organization (ISO) Standard 17025:2005, RB-LAB (SCC-Accredited Laboratory No. 161). Deep water quality samples collected at in-lake sampling points were collected 1 m above the lake bottom using a Kemmerer sampler that allowed discrete water sample collection at depth.
Water quality samples for each location were analyzed for a suite of parameters which included some of or all of the following listed below:
• General Chemistry (RCAp) – a 30-parameter general chemistry analysis package that includes select minerals (calcium, potassium), nutrients (nitrate, nitrite, soluble reactive phosphorus); general water quality and nutrient concentration data;
• Total Kjeldahl Nitrogen (TKN) – TKN represents the summation of total ammonia and organic nitrogen (N) concentrations; TKN in combination with ammonia, nitrate and nitrite concentrations captured as part of the above general chemistry analysis can provide a better indication of nitrogen concentrations;
• Total Phosphorus (P) – represents the sum of the dissolved and particulate forms of phosphorus; • Soluble reactive phosphorus (SRP) – also referred to as ortho-phosphate (PO4-P) represents the
biologically available phosphorus fraction; • Chlorophyll a (Chl a) – commonly used to indicate water column algal biomass within lake systems; • Total suspended solids (TSS) – represents suspended solids within a water sample that cannot pass
through typically a filter with a 1.5 µm pore size; • Escherichia coli (E. coli) – a commonly used fecal indicator bacteria (FIB) in freshwater systems; • Enterococci –can provide additional insight to potential bacteria sources if E. coli is not present and
MST results indicate specific DNA markers are present; • MST – Microbial Source Tracking used to analyze for ruminant, human, canine and avian DNA
markers.
POLLUTION SOURCE CONTROL STUDY FOR LAKE BANOOK & LAKE MICMAC FINAL REPORT
Methodology April 11, 2019
File: 121415826 2.4
Water quality sampling parameters were different for the various sampling locations, based on upgradient activities, public land use near the site (i.e. beach), and flow conditions. A summary of the water quality sampling parameters and number of sampling events completed at each location is provided in Appendix B. This table shows the sampling parameters for each location; however, the number of sampling events varied by location for various reasons (no flow, weather-related access issues).
2.2 MICROBIAL SOURCE TRACKING
Microbial source tracking (MST) has become a useful alternate to the fecal indicator bacteria method for assessing fecal contamination in a source water as it can determine not only the presence-absence of fecal contamination, but also provides valuable information on the source of the fecal contamination (Ravaliya et al. 2014). A method for identifying specific sources through MST is to analyze samples for host-specific genetic markers using a library independent microbial source tracking (LI-MST) method. The LI-MST method is used to detect fecal-associated bacteria, chemicals or host genes from specific markers (McDonald et al. 2016). The markers used for this project are derived from human, canine, avian and ruminant sources and marker selection is supported by current research-based literature. To complete the LI-MST method, Bacteroidales-based genetic markers were selected for human and ruminant sources (Bonjoch et al. 2004; Savichtcheva et al. 2007; Walters et al. 2007; Lee et al. 2010). A genetic marker based on Heliobacter was used for avian sources (Ahmed et al. 2016), and a mitochondrial deoxyribonucleic acid (DNA) marker (Kortbaoui et al. 2009; Ballesté et al. 2010; Baker-Austin et al. 2010) was used for canine sources. Ruminant markers were assessed for select sites near Shubie Park and the Red Bridge Pond outflow only, based on Stantec’s observations that deer (a ruminant species) are commonly present in these areas. Samples for LI-MST analysis were taken from surface water at select sample sites and transported to the Dalhousie University Centre for Water Resources Studies (CWRS) laboratory for analysis. As significant changes in MST analysis have occurred since the publishing of the USEPA 2005 MST guidance document (USEPA 2005), an updated method of analysis used by Dalhousie is provided in Appendix E, with details provided by Stea et al. (2015).
2.3 WATERSHED DELINEATION
Watershed delineation was completed in two steps to account for topography and the contributing storm sewer shed network. Provincially delineated watershed data (NS Department of Environment) were first used to define the large-scale watershed area contributing to both Lake Banook and Lake Micmac. Municipal LiDAR data (Halifax) were then used to delineate sub-watersheds contributing to each individual lake and identified outfall points of interest. Sub-watersheds contributing to a body of water within the primary lake watershed were considered separately for the purposes of modeling as these inputs would be captured as stream outlet points (i.e. Red Bridge Pond and Oathill Lake sub-watersheds). Storm-sewer network data provided by the Halifax Regional Water Commission were then integrated into the delineation and adjustments were made for any locations where catch basins and storm piping altered the delineated boundaries of the topographic sub-watersheds. Watercourse and waterbody GIS data was provided through the Nova Scotia Topographic Database.

POLLUTION SOURCE CONTROL STUDY FOR LAKE BANOOK & LAKE MICMAC FINAL REPORT
Methodology April 11, 2019
File: 121415826 2.5
Delineated watershed and sub-watershed maps are provided in Appendix A, Figure A-2.
2.4 WATER QUALITY MODELLING
2.4.1 Rainfall Event-Based Model
Rainfall event-based modeling is useful as it aids in design of stormwater treatment. A rainfall event-based pollutant load model uses literature-based pollutant concentration values derived for specific land uses to determine a stormwater pollutant load for a single precipitation event. Event mean concentration (EMC) data is derived from sampling runoff from specific land uses over the duration of a storm event. It is used for the purposes of modeling as it represents an average pollutant concentration generated over the duration of an event.
For the rainfall-event based model, the event-associated contaminant export load is calculated using the following formula:
𝑃𝑃𝐸𝐸𝐸𝐸𝐸𝐸𝐸𝐸𝐸𝐸 = �𝑅𝑅𝑥𝑥𝐴𝐴𝐿𝐿𝐿𝐿𝑥𝑥𝐸𝐸𝐸𝐸𝐸𝐸𝐿𝐿𝐿𝐿𝑥𝑥𝑅𝑅𝐸𝐸𝐿𝐿𝐿𝐿 Where:
PEvent = total pollutant load on an event basis, kg or CFU
R = rainfall depth associated with selected precipitation event, mm
ALU = area associated with a specific land use, m2
EMCLU = pollutant event mean concentrations associated with a specific land use, mg/L or CFU/100 mL
RCLU = rainfall runoff coefficient associated with a specific land use, unitless
To determine the volume of runoff discharging from each land use during the rain event, a hydrologic model was developed using PCSWMM (Computational Hydraulics Inc. of Guelph, Ontario, CA) to firstly estimate the runoff from the total watershed. A 25-mm 4-hr duration Chicago design storm was used to simulate the rain event and land use-based curve numbers (CN) were selected for use with the SCS method of rainfall runoff estimation (Table 4). Initial abstraction of 1.5 mm accounts for depression storage, interception and infiltration occurring before runoff begins and was estimated for pervious land use areas as per USDA 1986. When the total watershed runoff volume was determined, runoff for each land use was estimated using the formula provided above, with the runoff coefficients (RC) given in Table 4. The hydrologic model results were then used to validate the runoff volumes from the rain-event based model. A 25 mm 4-hr duration Chicago storm event was used as it represents a commonly used design storm for the sizing of stormwater treatment infrastructure.
Table 4 Summary of Land Use Runoff Parameters
Land Use Curve Number1 Runoff Coefficient1 Commercial Development 92 0.89
Forest/Parkland 65 0.14
Undeveloped/Grassed 61 0.24

POLLUTION SOURCE CONTROL STUDY FOR LAKE BANOOK & LAKE MICMAC FINAL REPORT
Methodology April 11, 2019
File: 121415826 2.6
Table 4 Summary of Land Use Runoff Parameters
Land Use Curve Number1 Runoff Coefficient1 High-Density Residential 85 0.39
Medium-Density Residential 72 0.35
Low-Density Residential 68 0.28
Partially Cleared Forest 66 0.28
Roadway 98 0.82
Water 99 0.99
Wetland 99 0.99 1 McCuen 1998
2.4.1.1 Parameter Selection for Rain Event-Based Phosphorous Model
EMC P data were sourced for the land use distribution found within the studied watersheds. As there is limited availability of local data, EMC values were taken from commonly referenced literature sources, and are given in Table 5, below.
Table 5 Phosphorous Event Mean Concentrations for Select Land Use
Land Use Phosphorous Event Mean Concentration (mg/L)
Commercial Development 0.301
Forest/Parkland 0.152
Undeveloped/Grassed 0.562
High-Density Residential 0.222
Medium-Density Residential 0.452
Low-Density Residential 0.362
Partially Cleared Forest 0.683
Roadway 0.622
Wetland 0.101 1 CH2M HILL 1993; 2 Pitt and MacLean 1986; 3 USEPA 2001
2.4.1.2 Parameter Selection for Precipitation Event-Based Fecal Coliform Loading Model
EMC FC data were sourced for the land use distribution found within the studied watersheds, as given in Table 6, below. Data is given in units of CFU/100 mL, which refers to the number of colony forming units (CFU) of bacteria per 100 mL of sample volume. FC EMC values were used as there is limited available data for land-used associated E.coli concentrations. These values are considered comparable to E. coli concentrations for the purpose of this study. Where available, data were taken from a study completed by
POLLUTION SOURCE CONTROL STUDY FOR LAKE BANOOK & LAKE MICMAC FINAL REPORT
Methodology April 11, 2019
File: 121415826 2.7
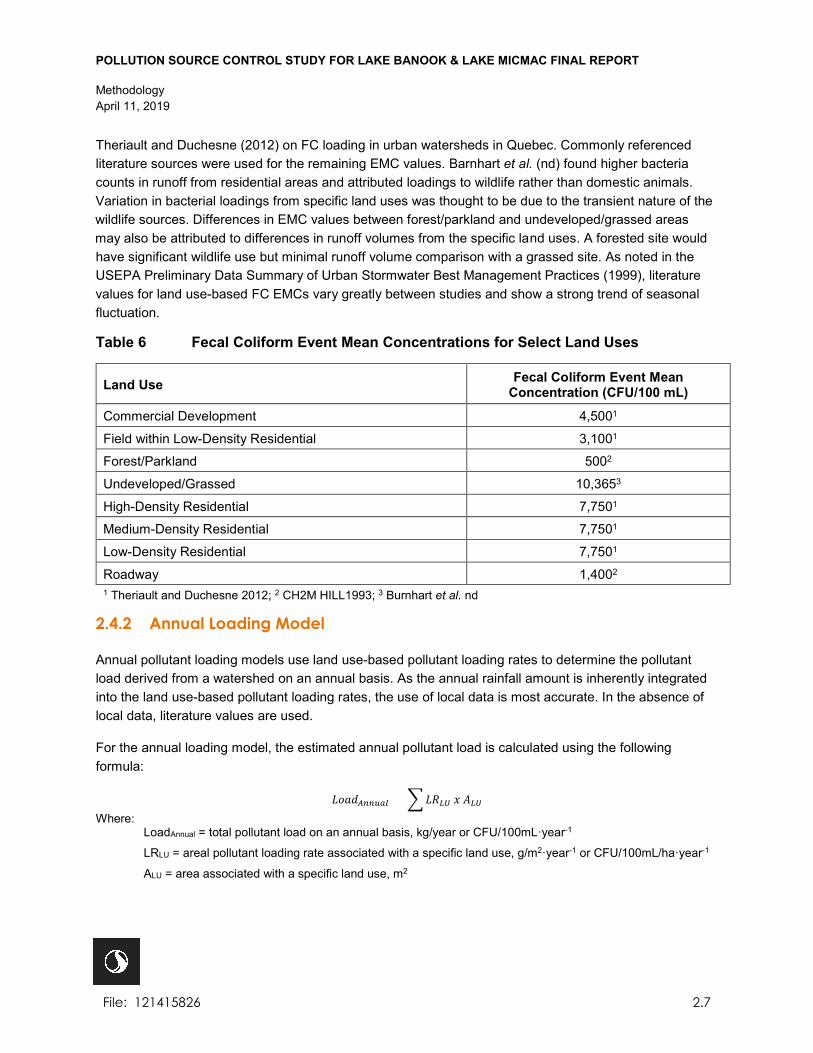
Theriault and Duchesne (2012) on FC loading in urban watersheds in Quebec. Commonly referenced literature sources were used for the remaining EMC values. Barnhart et al. (nd) found higher bacteria counts in runoff from residential areas and attributed loadings to wildlife rather than domestic animals. Variation in bacterial loadings from specific land uses was thought to be due to the transient nature of the wildlife sources. Differences in EMC values between forest/parkland and undeveloped/grassed areas may also be attributed to differences in runoff volumes from the specific land uses. A forested site would have significant wildlife use but minimal runoff volume comparison with a grassed site. As noted in the USEPA Preliminary Data Summary of Urban Stormwater Best Management Practices (1999), literature values for land use-based FC EMCs vary greatly between studies and show a strong trend of seasonal fluctuation.
Table 6 Fecal Coliform Event Mean Concentrations for Select Land Uses
Land Use Fecal Coliform Event Mean Concentration (CFU/100 mL)
Commercial Development 4,5001
Field within Low-Density Residential 3,1001
Forest/Parkland 5002
Undeveloped/Grassed 10,3653
High-Density Residential 7,7501
Medium-Density Residential 7,7501
Low-Density Residential 7,7501
Roadway 1,4002 1 Theriault and Duchesne 2012; 2 CH2M HILL1993; 3 Burnhart et al. nd
2.4.2 Annual Loading Model
Annual pollutant loading models use land use-based pollutant loading rates to determine the pollutant load derived from a watershed on an annual basis. As the annual rainfall amount is inherently integrated into the land use-based pollutant loading rates, the use of local data is most accurate. In the absence of local data, literature values are used.
For the annual loading model, the estimated annual pollutant load is calculated using the following formula:
𝐿𝐿𝐿𝐿𝐿𝐿𝐿𝐿𝐴𝐴𝐸𝐸𝐸𝐸𝐴𝐴𝐴𝐴𝐴𝐴 = �𝐿𝐿𝑅𝑅𝐿𝐿𝐿𝐿 𝑥𝑥 𝐴𝐴𝐿𝐿𝐿𝐿 Where:
LoadAnnual = total pollutant load on an annual basis, kg/year or CFU/100mL·year-1
LRLU = areal pollutant loading rate associated with a specific land use, g/m2·year-1 or CFU/100mL/ha·year-1
ALU = area associated with a specific land use, m2
POLLUTION SOURCE CONTROL STUDY FOR LAKE BANOOK & LAKE MICMAC FINAL REPORT
Methodology April 11, 2019
File: 121415826 2.8
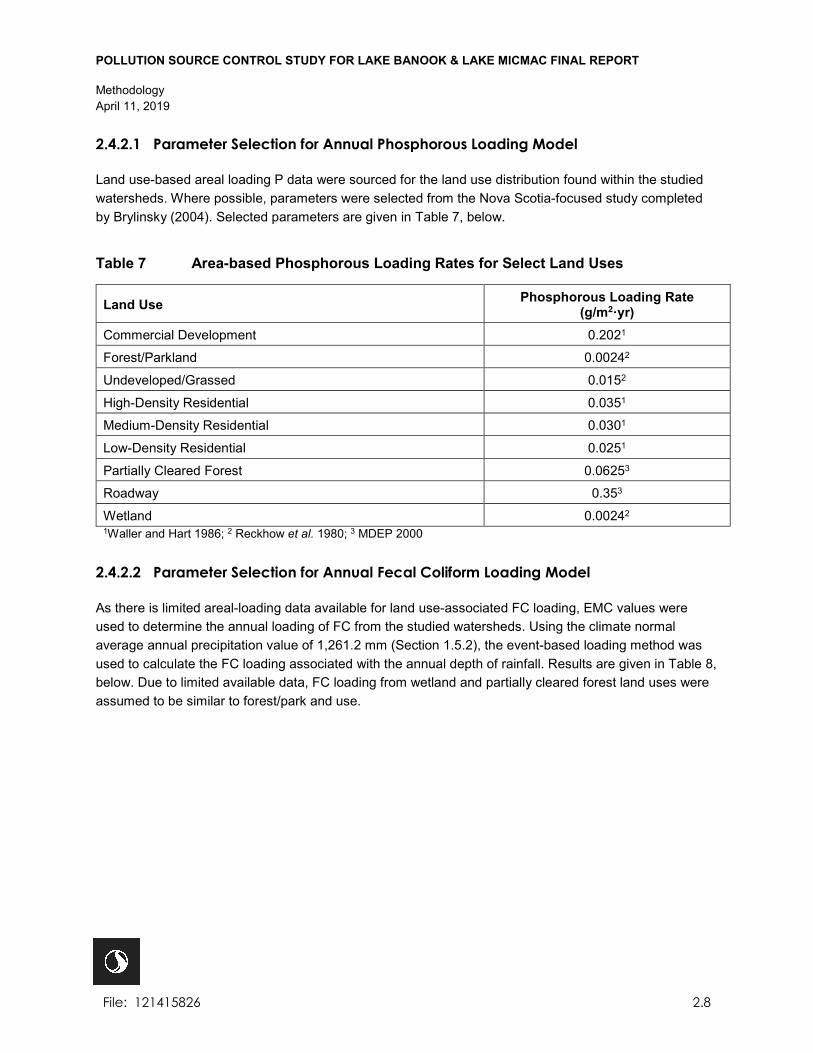
2.4.2.1 Parameter Selection for Annual Phosphorous Loading Model
Land use-based areal loading P data were sourced for the land use distribution found within the studied watersheds. Where possible, parameters were selected from the Nova Scotia-focused study completed by Brylinsky (2004). Selected parameters are given in Table 7, below.
Table 7 Area-based Phosphorous Loading Rates for Select Land Uses
Land Use Phosphorous Loading Rate (g/m2·yr)
Commercial Development 0.2021
Forest/Parkland 0.00242
Undeveloped/Grassed 0.0152
High-Density Residential 0.0351
Medium-Density Residential 0.0301
Low-Density Residential 0.0251
Partially Cleared Forest 0.06253
Roadway 0.353
Wetland 0.00242 1Waller and Hart 1986; 2 Reckhow et al. 1980; 3 MDEP 2000
2.4.2.2 Parameter Selection for Annual Fecal Coliform Loading Model
As there is limited areal-loading data available for land use-associated FC loading, EMC values were used to determine the annual loading of FC from the studied watersheds. Using the climate normal average annual precipitation value of 1,261.2 mm (Section 1.5.2), the event-based loading method was used to calculate the FC loading associated with the annual depth of rainfall. Results are given in Table 8, below. Due to limited available data, FC loading from wetland and partially cleared forest land uses were assumed to be similar to forest/park and use.
POLLUTION SOURCE CONTROL STUDY FOR LAKE BANOOK & LAKE MICMAC FINAL REPORT
Methodology April 11, 2019
File: 121415826 2.9
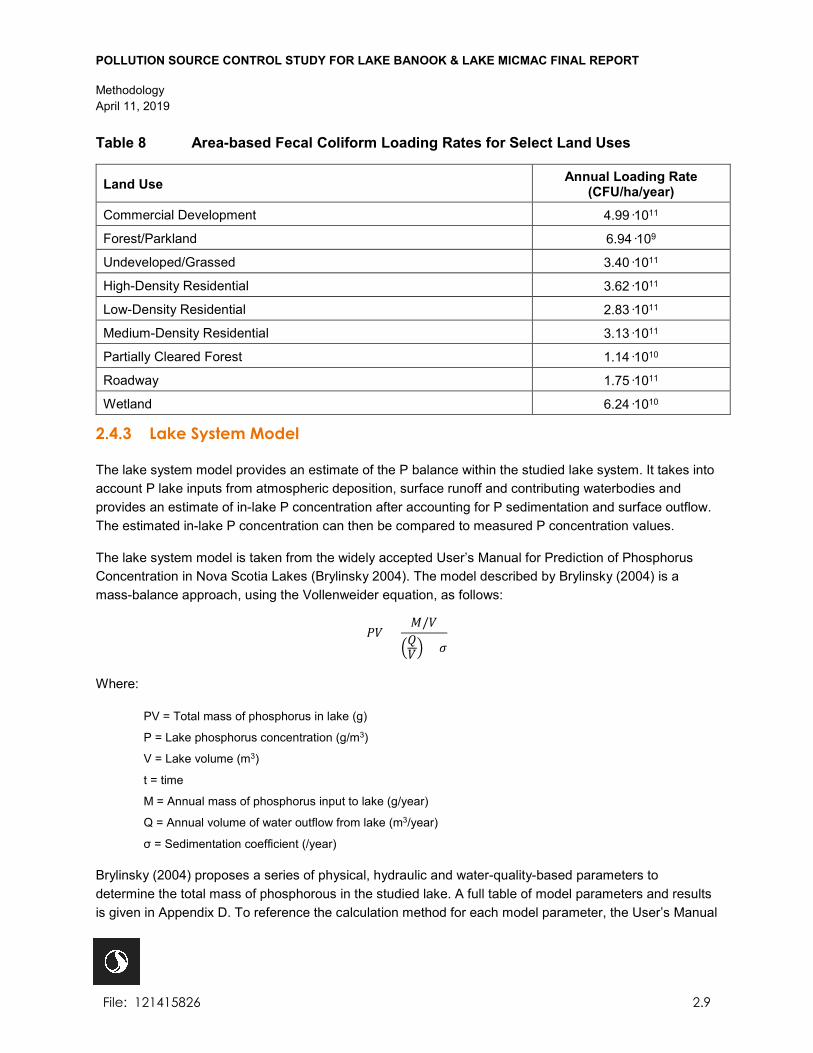
Table 8 Area-based Fecal Coliform Loading Rates for Select Land Uses
Land Use Annual Loading Rate (CFU/ha/year)
Commercial Development 4.99·1011
Forest/Parkland 6.94·109
Undeveloped/Grassed 3.40·1011
High-Density Residential 3.62·1011
Low-Density Residential 2.83·1011
Medium-Density Residential 3.13·1011
Partially Cleared Forest 1.14·1010
Roadway 1.75·1011
Wetland 6.24·1010
2.4.3 Lake System Model
The lake system model provides an estimate of the P balance within the studied lake system. It takes into account P lake inputs from atmospheric deposition, surface runoff and contributing waterbodies and provides an estimate of in-lake P concentration after accounting for P sedimentation and surface outflow. The estimated in-lake P concentration can then be compared to measured P concentration values.
The lake system model is taken from the widely accepted User’s Manual for Prediction of Phosphorus Concentration in Nova Scotia Lakes (Brylinsky 2004). The model described by Brylinsky (2004) is a mass-balance approach, using the Vollenweider equation, as follows:
𝑃𝑃𝑃𝑃 =𝐸𝐸/𝑃𝑃
�𝑄𝑄𝑃𝑃� + 𝜎𝜎
Where:
PV = Total mass of phosphorus in lake (g)
P = Lake phosphorus concentration (g/m3)
V = Lake volume (m3)
t = time
M = Annual mass of phosphorus input to lake (g/year)
Q = Annual volume of water outflow from lake (m3/year)
σ = Sedimentation coefficient (/year)
Brylinsky (2004) proposes a series of physical, hydraulic and water-quality-based parameters to determine the total mass of phosphorous in the studied lake. A full table of model parameters and results is given in Appendix D. To reference the calculation method for each model parameter, the User’s Manual

POLLUTION SOURCE CONTROL STUDY FOR LAKE BANOOK & LAKE MICMAC FINAL REPORT
Methodology April 11, 2019
File: 121415826 2.10
is included in Appendix E. A summary of select lake system model parameters are given in Table 9, below.
Table 9 Summary of Select Lake System Model Parameters
Parameter Abbrev. Value Units Source
Annual Unit Precipitation Pr 1.26 m/yr Estimated using climate normals data
Annual Unit Lake Evaporation Ev 0.51 m/yr Calculated using Thornthwaite method
Annual Unit Hydraulic Runoff - Developed Ruv 1.10 m/yr Brylinsky (2004)
Annual Unit Atmospheric P Deposition Da 0.0173 g P m2/yr Brylinsky (2004)
Phosphorus Retention Coefficient v 12.40 n/a Brylinsky (2004)
As Lake Banook receives input from three adjacent water bodies, Lake Charles, Red Bridge Pond and Oathill Lake, a model was completed for these contributing waterbodies to account for P input from these sources. For Lake Charles, watershed land use and lake volume data was taken from the Shubenacadie Lakes Subwatershed Study, completed for Halifax by AECOM (2013). For Red Bridge Pond and Oathill Lake, the sub-watersheds were delineated as part of this study and land use and lake bathymetry mapping was used to complete the model for these water bodies.
POLLUTION SOURCE CONTROL STUDY FOR LAKE BANOOK & LAKE MICMAC FINAL REPORT
Monitoring Results April 11, 2019
File: 121415826 3.1
3.0 MONITORING RESULTS
3.1 SURFACE WATER FLOW AND CONTAMINANT LOADING
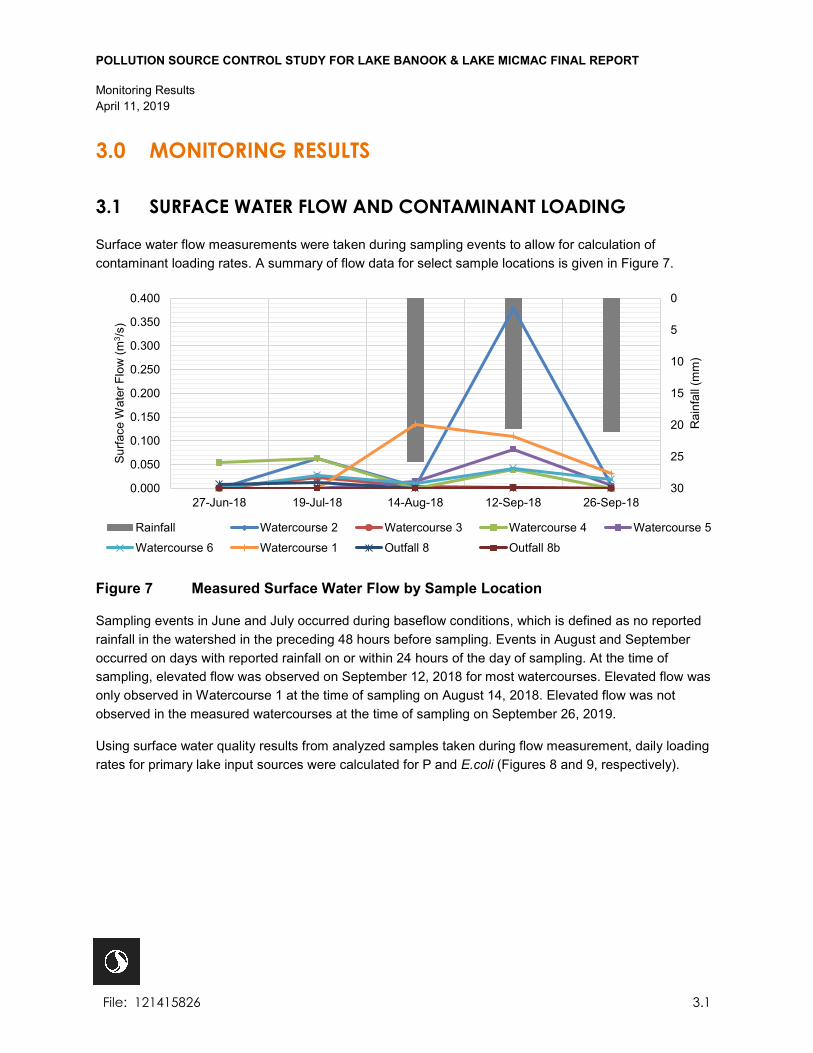
Surface water flow measurements were taken during sampling events to allow for calculation of contaminant loading rates. A summary of flow data for select sample locations is given in Figure 7.
Figure 7 Measured Surface Water Flow by Sample Location
Sampling events in June and July occurred during baseflow conditions, which is defined as no reported rainfall in the watershed in the preceding 48 hours before sampling. Events in August and September occurred on days with reported rainfall on or within 24 hours of the day of sampling. At the time of sampling, elevated flow was observed on September 12, 2018 for most watercourses. Elevated flow was only observed in Watercourse 1 at the time of sampling on August 14, 2018. Elevated flow was not observed in the measured watercourses at the time of sampling on September 26, 2019.
Using surface water quality results from analyzed samples taken during flow measurement, daily loading rates for primary lake input sources were calculated for P and E.coli (Figures 8 and 9, respectively).
0
5
10
15
20
25
300.000
0.050
0.100
0.150
0.200
0.250
0.300
0.350
0.400
27-Jun-18 19-Jul-18 14-Aug-18 12-Sep-18 26-Sep-18
Rai
nfal
l (m
m)
Sur
face
Wat
er F
low
(m3 /s
)
Rainfall Watercourse 2 Watercourse 3 Watercourse 4 Watercourse 5
Watercourse 6 Watercourse 1 Outfall 8 Outfall 8b
POLLUTION SOURCE CONTROL STUDY FOR LAKE BANOOK & LAKE MICMAC FINAL REPORT
Monitoring Results April 11, 2019
File: 121415826 3.2
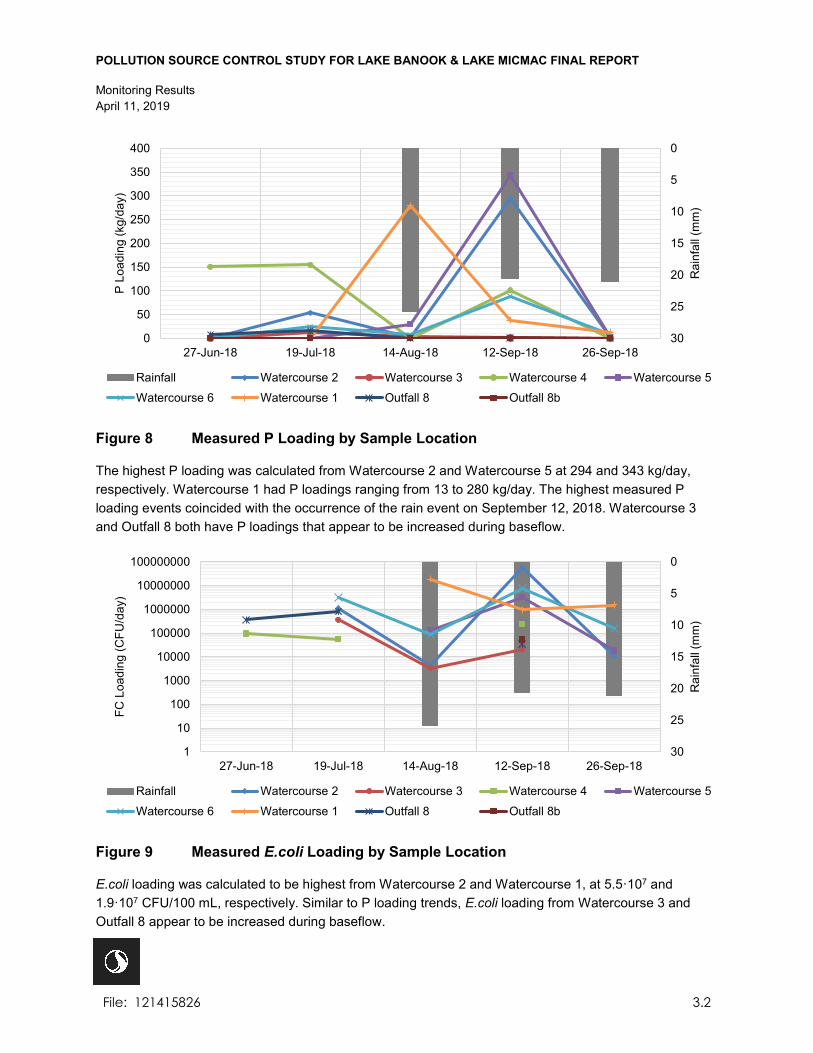
Figure 8 Measured P Loading by Sample Location
The highest P loading was calculated from Watercourse 2 and Watercourse 5 at 294 and 343 kg/day, respectively. Watercourse 1 had P loadings ranging from 13 to 280 kg/day. The highest measured P loading events coincided with the occurrence of the rain event on September 12, 2018. Watercourse 3 and Outfall 8 both have P loadings that appear to be increased during baseflow.
Figure 9 Measured E.coli Loading by Sample Location
E.coli loading was calculated to be highest from Watercourse 2 and Watercourse 1, at 5.5·107 and 1.9·107 CFU/100 mL, respectively. Similar to P loading trends, E.coli loading from Watercourse 3 and Outfall 8 appear to be increased during baseflow.
0
5
10
15
20
25
300
50
100
150
200
250
300
350
400
27-Jun-18 19-Jul-18 14-Aug-18 12-Sep-18 26-Sep-18
Rai
nfal
l (m
m)
P L
oadi
ng (k
g/da
y)
Rainfall Watercourse 2 Watercourse 3 Watercourse 4 Watercourse 5
Watercourse 6 Watercourse 1 Outfall 8 Outfall 8b
0
5
10
15
20
25
301
10
100
1000
10000
100000
1000000
10000000
100000000
27-Jun-18 19-Jul-18 14-Aug-18 12-Sep-18 26-Sep-18
Rai
nfal
l (m
m)
FC L
oadi
ng (C
FU/d
ay)
Rainfall Watercourse 2 Watercourse 3 Watercourse 4 Watercourse 5
Watercourse 6 Watercourse 1 Outfall 8 Outfall 8b

POLLUTION SOURCE CONTROL STUDY FOR LAKE BANOOK & LAKE MICMAC FINAL REPORT
Monitoring Results April 11, 2019
File: 121415826 3.3
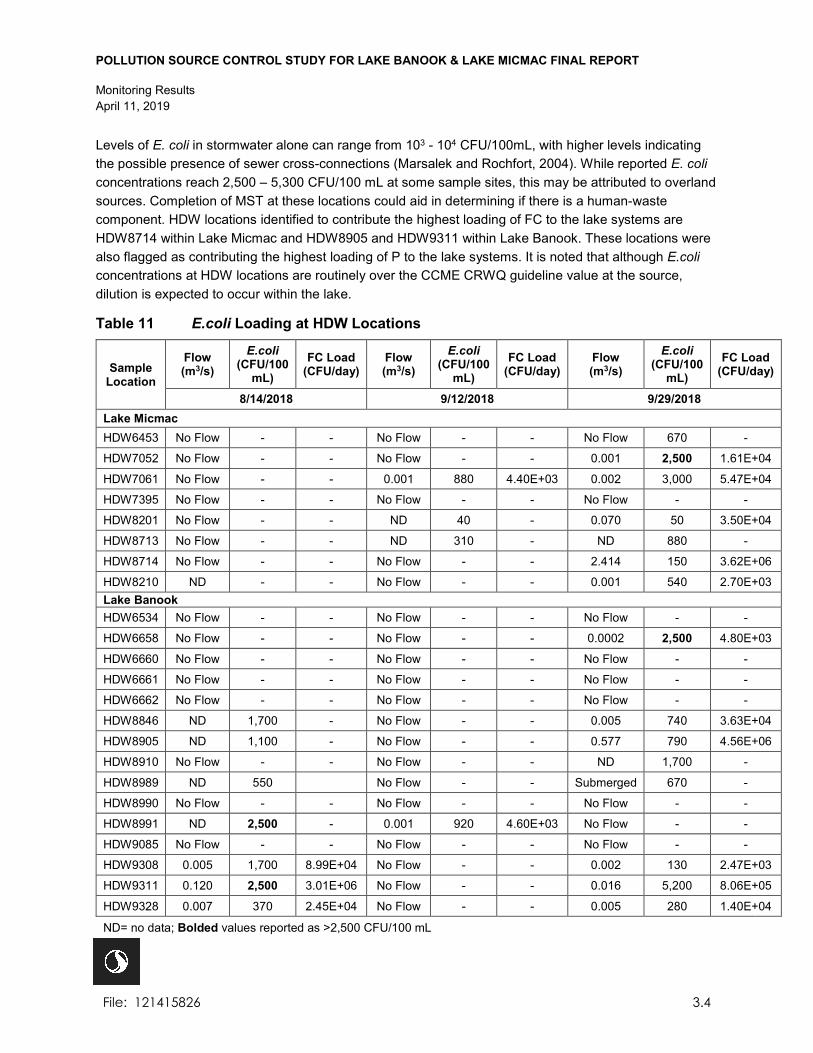
Stormwater discharge points (HDW) were also assessed to determine flow and point-source loading rates discharging to the lakes from stormwater infrastructure within the watersheds. Associated P and E.coli loading rates for sampled HDW locations are given in Tables 10 and 11 below. As shown in the tables, the majority of HDW locations had no flow during the assessment. The June and July events are omitted from the tables as no flow was observed at HDW locations during these events.
HDW locations which contribute the highest loading of P to the lake systems are HDW8714 within Lake Micmac and HDW8905 and HDW9311 within Lake Banook.
Table 10 Phosphorous Loading at HDW Locations
Sample Location
Flow (m3/s) P (mg/L) P Load
(kg/day) Flow (m3/s) P (mg/L) P Load
(kg/day) Flow (m3/s) P (mg/L) P Load
(kg/day) 8/14/2018 9/12/2018 9/29/2018
Lake Micmac HDW6453 No Flow - - No Flow - - No Flow 0.039 -
HDW7052 No Flow - - No Flow - - 0.001 0.220 0.012
HDW7061 No Flow - - 0.001 0.035 0.002 0.002 0.140 0.022
HDW7395 No Flow - - No Flow - - No Flow - -
HDW8201 No Flow - - ND 0.007 - 0.070 0.012 0.073
HDW8713 No Flow - - ND 0.071 - ND 0.240 -
HDW8714 No Flow - - No Flow - - 2.414 0.130 27.113
HDW8210 ND - - No Flow - - 0.001 0.053 0.002
Lake Banook HDW6534 No Flow - - No Flow - - No Flow - -
HDW6658 No Flow - - No Flow - - 0.0002 0.180 0.003
HDW6660 No Flow - - No Flow - - No Flow - -
HDW6661 No Flow - - No Flow - - No Flow - -
HDW6662 No Flow - - No Flow - - No Flow - -
HDW8846 ND 0.500 - No Flow - - 0.005 0.170 0.072
HDW8905 ND 0.310 - No Flow - - 0.577 0.170 8.470
HDW8910 No Flow - - No Flow - - ND 0.091 -
HDW8989 ND 0.210 - No Flow - - Submerged 0.460 -
HDW8990 No Flow - - No Flow - - No Flow - -
HDW8991 ND 0.100 - 0.001 0.015 0.001 No Flow - -
HDW9085 No Flow - - No Flow - - No Flow - -
HDW9308 0.005 0.027 0.012 No Flow - - 0.002 0.009 0.001
HDW9311 0.120 0.660 6.857 No Flow - - 0.016 2.300 3.080
HDW9328 0.007 0.110 0.063 No Flow - - 0.005 0.240 0.104
ND= no data
POLLUTION SOURCE CONTROL STUDY FOR LAKE BANOOK & LAKE MICMAC FINAL REPORT
Monitoring Results April 11, 2019
File: 121415826 3.4
Levels of E. coli in stormwater alone can range from 103 - 104 CFU/100mL, with higher levels indicating the possible presence of sewer cross-connections (Marsalek and Rochfort, 2004). While reported E. coli concentrations reach 2,500 – 5,300 CFU/100 mL at some sample sites, this may be attributed to overland sources. Completion of MST at these locations could aid in determining if there is a human-waste component. HDW locations identified to contribute the highest loading of FC to the lake systems are HDW8714 within Lake Micmac and HDW8905 and HDW9311 within Lake Banook. These locations were also flagged as contributing the highest loading of P to the lake systems. It is noted that although E.coli concentrations at HDW locations are routinely over the CCME CRWQ guideline value at the source, dilution is expected to occur within the lake.
Table 11 E.coli Loading at HDW Locations
Sample Location
Flow (m3/s)
E.coli (CFU/100
mL) FC Load
(CFU/day) Flow (m3/s)
E.coli (CFU/100
mL) FC Load
(CFU/day) Flow (m3/s)
E.coli (CFU/100
mL) FC Load
(CFU/day)
8/14/2018 9/12/2018 9/29/2018 Lake Micmac HDW6453 No Flow - - No Flow - - No Flow 670 -
HDW7052 No Flow - - No Flow - - 0.001 2,500 1.61E+04
HDW7061 No Flow - - 0.001 880 4.40E+03 0.002 3,000 5.47E+04
HDW7395 No Flow - - No Flow - - No Flow - -
HDW8201 No Flow - - ND 40 - 0.070 50 3.50E+04
HDW8713 No Flow - - ND 310 - ND 880 -
HDW8714 No Flow - - No Flow - - 2.414 150 3.62E+06
HDW8210 ND - - No Flow - - 0.001 540 2.70E+03 Lake Banook HDW6534 No Flow - - No Flow - - No Flow - -
HDW6658 No Flow - - No Flow - - 0.0002 2,500 4.80E+03
HDW6660 No Flow - - No Flow - - No Flow - -
HDW6661 No Flow - - No Flow - - No Flow - -
HDW6662 No Flow - - No Flow - - No Flow - -
HDW8846 ND 1,700 - No Flow - - 0.005 740 3.63E+04
HDW8905 ND 1,100 - No Flow - - 0.577 790 4.56E+06
HDW8910 No Flow - - No Flow - - ND 1,700 -
HDW8989 ND 550 No Flow - - Submerged 670 -
HDW8990 No Flow - - No Flow - - No Flow - -
HDW8991 ND 2,500 - 0.001 920 4.60E+03 No Flow - -
HDW9085 No Flow - - No Flow - - No Flow - -
HDW9308 0.005 1,700 8.99E+04 No Flow - - 0.002 130 2.47E+03
HDW9311 0.120 2,500 3.01E+06 No Flow - - 0.016 5,200 8.06E+05
HDW9328 0.007 370 2.45E+04 No Flow - - 0.005 280 1.40E+04
ND= no data; Bolded values reported as >2,500 CFU/100 mL
POLLUTION SOURCE CONTROL STUDY FOR LAKE BANOOK & LAKE MICMAC FINAL REPORT
Monitoring Results April 11, 2019
File: 121415826 3.5
3.2 SURFACE WATER QUALITY MONITORING
3.2.1 In-Situ Water Monitoring
In-situ water quality profiles were collected throughout the water column at both in-lake stations (Banook and Micmac) during each sampling event. In-situ water quality parameters included:
• Temperature (⁰C) • Conductivity (mS/cm) • pH • Dissolved Oxygen (mg/L) • Total Dissolved Solids (g/L)
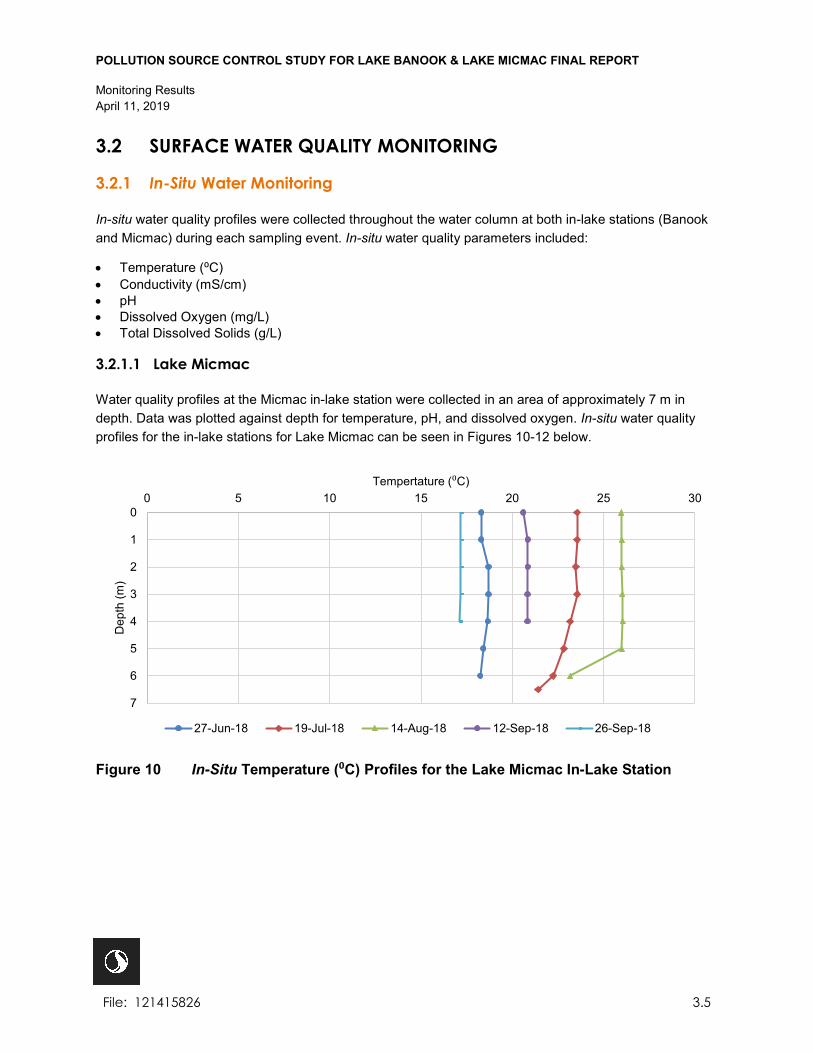
3.2.1.1 Lake Micmac
Water quality profiles at the Micmac in-lake station were collected in an area of approximately 7 m in depth. Data was plotted against depth for temperature, pH, and dissolved oxygen. In-situ water quality profiles for the in-lake stations for Lake Micmac can be seen in Figures 10-12 below.
Figure 10 In-Situ Temperature (⁰C) Profiles for the Lake Micmac In-Lake Station
0
1
2
3
4
5
6
7
0 5 10 15 20 25 30
Dep
th (m
)
Tempertature (⁰C)
27-Jun-18 19-Jul-18 14-Aug-18 12-Sep-18 26-Sep-18
POLLUTION SOURCE CONTROL STUDY FOR LAKE BANOOK & LAKE MICMAC FINAL REPORT
Monitoring Results April 11, 2019
File: 121415826 3.6
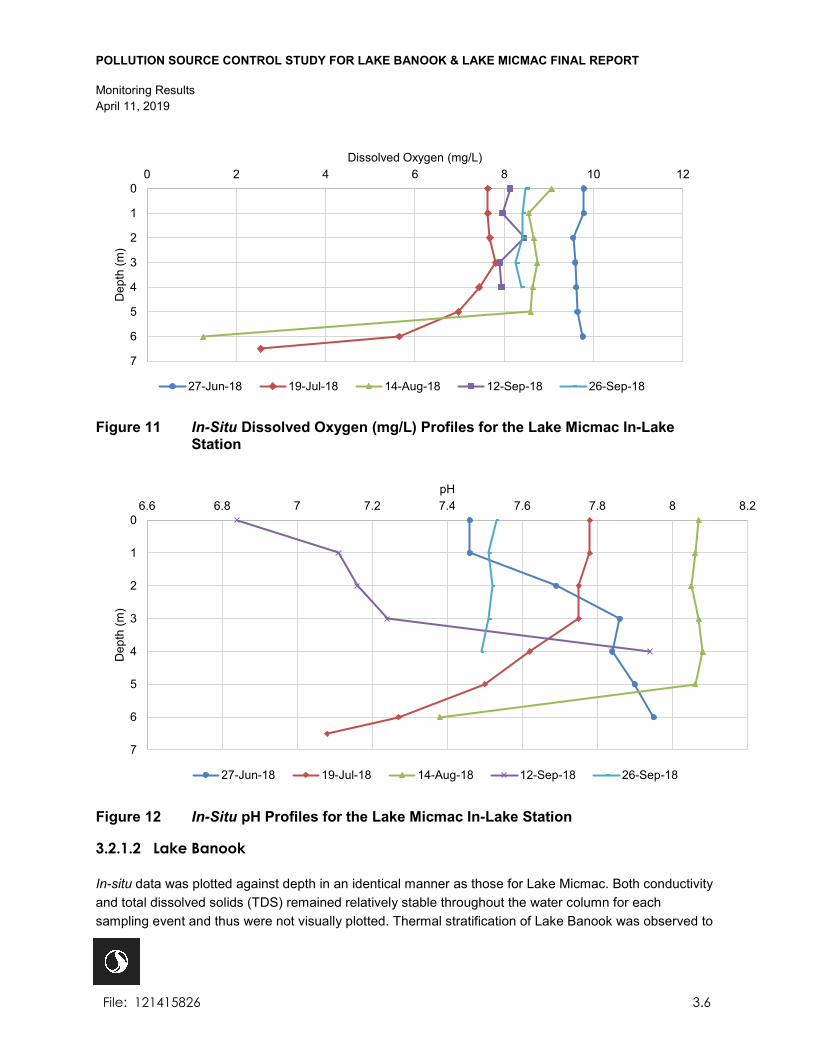
Figure 11 In-Situ Dissolved Oxygen (mg/L) Profiles for the Lake Micmac In-Lake Station
Figure 12 In-Situ pH Profiles for the Lake Micmac In-Lake Station
3.2.1.2 Lake Banook
In-situ data was plotted against depth in an identical manner as those for Lake Micmac. Both conductivity and total dissolved solids (TDS) remained relatively stable throughout the water column for each sampling event and thus were not visually plotted. Thermal stratification of Lake Banook was observed to
0
1
2
3
4
5
6
7
0 2 4 6 8 10 12
Dep
th (m
)
Dissolved Oxygen (mg/L)
27-Jun-18 19-Jul-18 14-Aug-18 12-Sep-18 26-Sep-18
0
1
2
3
4
5
6
7
6.6 6.8 7 7.2 7.4 7.6 7.8 8 8.2
Dep
th (m
)
pH
27-Jun-18 19-Jul-18 14-Aug-18 12-Sep-18 26-Sep-18
POLLUTION SOURCE CONTROL STUDY FOR LAKE BANOOK & LAKE MICMAC FINAL REPORT
Monitoring Results April 11, 2019
File: 121415826 3.7
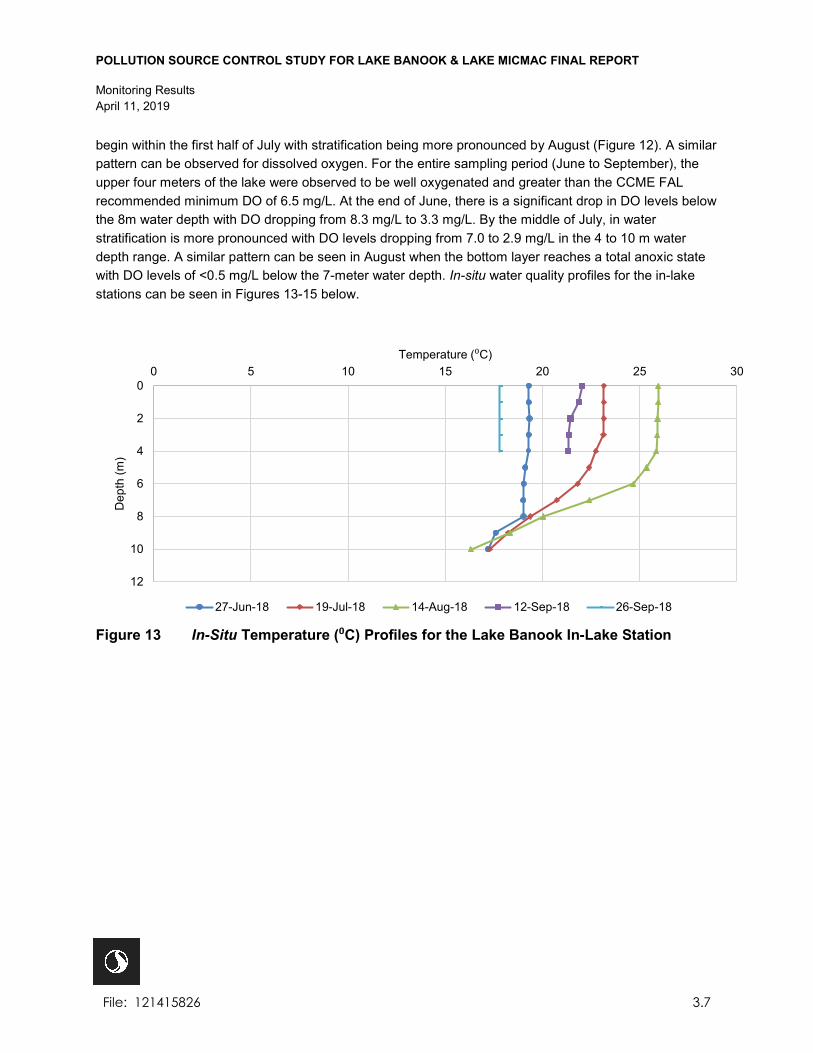
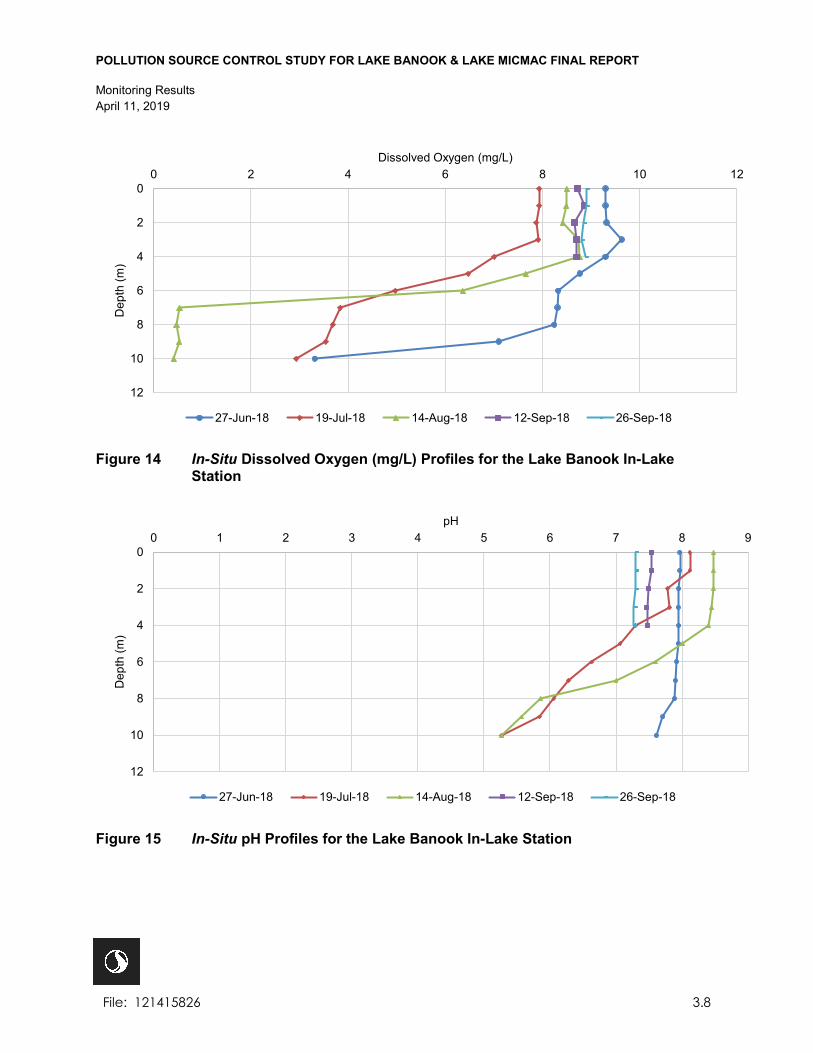
begin within the first half of July with stratification being more pronounced by August (Figure 12). A similar pattern can be observed for dissolved oxygen. For the entire sampling period (June to September), the upper four meters of the lake were observed to be well oxygenated and greater than the CCME FAL recommended minimum DO of 6.5 mg/L. At the end of June, there is a significant drop in DO levels below the 8m water depth with DO dropping from 8.3 mg/L to 3.3 mg/L. By the middle of July, in water stratification is more pronounced with DO levels dropping from 7.0 to 2.9 mg/L in the 4 to 10 m water depth range. A similar pattern can be seen in August when the bottom layer reaches a total anoxic state with DO levels of <0.5 mg/L below the 7-meter water depth. In-situ water quality profiles for the in-lake stations can be seen in Figures 13-15 below.
Figure 13 In-Situ Temperature (⁰C) Profiles for the Lake Banook In-Lake Station
0
2
4
6
8
10
12
0 5 10 15 20 25 30
Dep
th (m
)
Temperature (⁰C)
27-Jun-18 19-Jul-18 14-Aug-18 12-Sep-18 26-Sep-18
POLLUTION SOURCE CONTROL STUDY FOR LAKE BANOOK & LAKE MICMAC FINAL REPORT
Monitoring Results April 11, 2019
File: 121415826 3.8
Figure 14 In-Situ Dissolved Oxygen (mg/L) Profiles for the Lake Banook In-Lake Station
Figure 15 In-Situ pH Profiles for the Lake Banook In-Lake Station
0
2
4
6
8
10
12
0 2 4 6 8 10 12
Dep
th (m
)
Dissolved Oxygen (mg/L)
27-Jun-18 19-Jul-18 14-Aug-18 12-Sep-18 26-Sep-18
0
2
4
6
8
10
12
0 1 2 3 4 5 6 7 8 9
Dep
th (m
)
pH
27-Jun-18 19-Jul-18 14-Aug-18 12-Sep-18 26-Sep-18
POLLUTION SOURCE CONTROL STUDY FOR LAKE BANOOK & LAKE MICMAC FINAL REPORT
Monitoring Results April 11, 2019
File: 121415826 3.9
3.2.2 Surface Water Quality
The following section provides a summary of the surface water quality as indicated by laboratory analysis of grab samples. Of the analyzed parameters, chloride and copper concentrations were found to be consistently above the CCME FAL guidelines within both lakes, with results described in further detail, below.
3.2.2.1 Lake Micmac
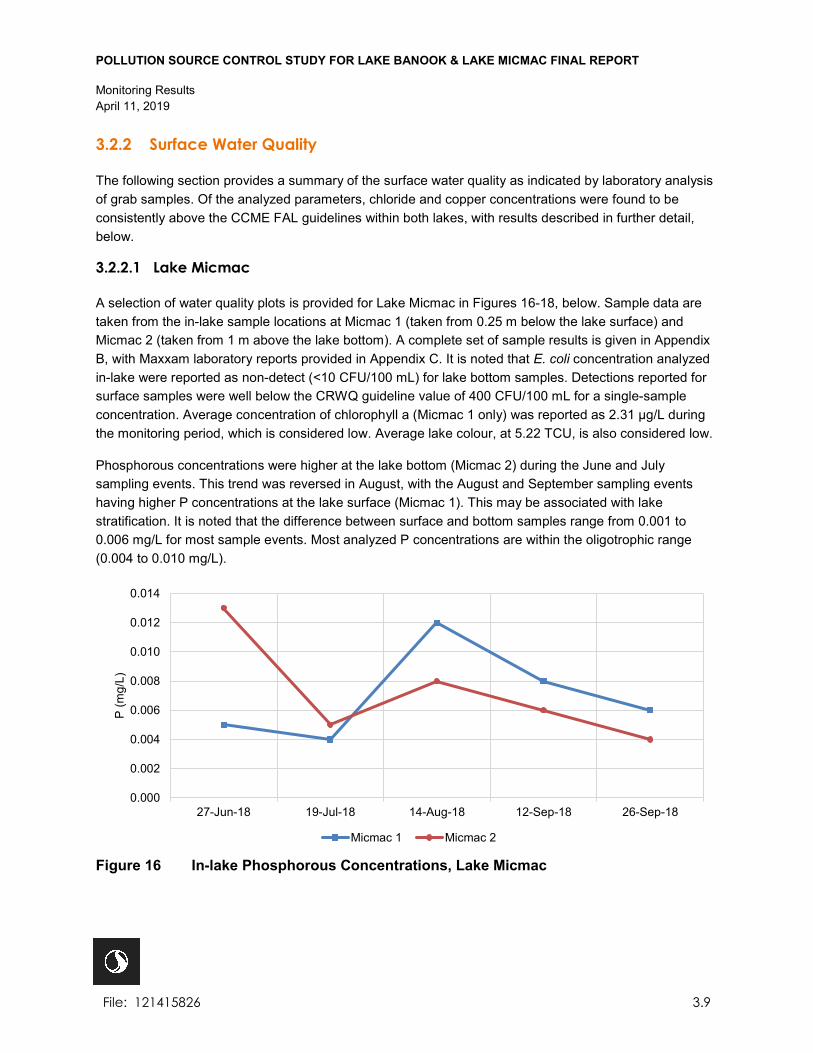
A selection of water quality plots is provided for Lake Micmac in Figures 16-18, below. Sample data are taken from the in-lake sample locations at Micmac 1 (taken from 0.25 m below the lake surface) and Micmac 2 (taken from 1 m above the lake bottom). A complete set of sample results is given in Appendix B, with Maxxam laboratory reports provided in Appendix C. It is noted that E. coli concentration analyzed in-lake were reported as non-detect (<10 CFU/100 mL) for lake bottom samples. Detections reported for surface samples were well below the CRWQ guideline value of 400 CFU/100 mL for a single-sample concentration. Average concentration of chlorophyll a (Micmac 1 only) was reported as 2.31 µg/L during the monitoring period, which is considered low. Average lake colour, at 5.22 TCU, is also considered low.
Phosphorous concentrations were higher at the lake bottom (Micmac 2) during the June and July sampling events. This trend was reversed in August, with the August and September sampling events having higher P concentrations at the lake surface (Micmac 1). This may be associated with lake stratification. It is noted that the difference between surface and bottom samples range from 0.001 to 0.006 mg/L for most sample events. Most analyzed P concentrations are within the oligotrophic range (0.004 to 0.010 mg/L).
Figure 16 In-lake Phosphorous Concentrations, Lake Micmac
0.000
0.002
0.004
0.006
0.008
0.010
0.012
0.014
27-Jun-18 19-Jul-18 14-Aug-18 12-Sep-18 26-Sep-18
P (m
g/L)
Micmac 1 Micmac 2

POLLUTION SOURCE CONTROL STUDY FOR LAKE BANOOK & LAKE MICMAC FINAL REPORT
Monitoring Results April 11, 2019
File: 121415826 3.10
Chloride was analyzed for in-lake samples at Lake Micmac, with results shown in Figure 17. Sample results were consistent between surface and bottom samples, and all sampled events showed exceedances of the CCME FAL chronic exposure guideline value of 120 mg/L for chloride concentration. Chloride concentrations in freshwater lakes may be attributed to anthropogenic sources such as the use of fertilizer and road salt within an urban watershed (Dugan et al. 2017).
Figure 17 In-lake Chloride Concentrations, Lake Micmac
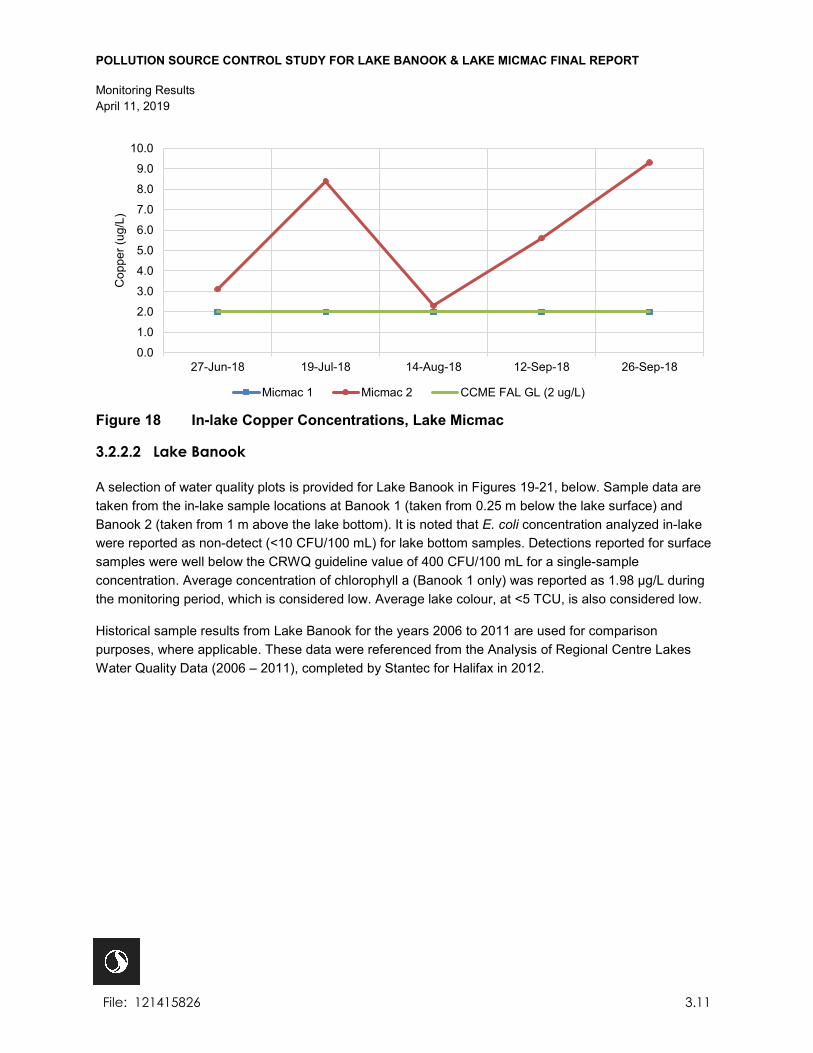
Copper concentrations in Lake Micmac for all lake bottom samples (Micmac 2) were also routinely above the CCME FAL guideline value, with analyzed samples having concentrations above 2 μg/L. It is noted that all surface samples (Micmac 1) were reported as below the guideline value. Results are shown in Figure 18. Copper is a contaminant typically found in stormwater, with the source deriving from vehicular wear, pesticides and fungicides as well as corrosion of building materials (Makepeace et al. 1995; Vaccari et al. 2006). The higher reported concentration of copper at the lake bottom indicates the metal is likely sediment-associated.
0
50
100
150
200
250
27-Jun-18 19-Jul-18 14-Aug-18 12-Sep-18 26-Sep-18
Chl
orid
e (m
g/L)
Micmac 1 Micmac 2 CCME FAL CE GL (120 mg/L)
POLLUTION SOURCE CONTROL STUDY FOR LAKE BANOOK & LAKE MICMAC FINAL REPORT
Monitoring Results April 11, 2019
File: 121415826 3.11
Figure 18 In-lake Copper Concentrations, Lake Micmac
3.2.2.2 Lake Banook
A selection of water quality plots is provided for Lake Banook in Figures 19-21, below. Sample data are taken from the in-lake sample locations at Banook 1 (taken from 0.25 m below the lake surface) and Banook 2 (taken from 1 m above the lake bottom). It is noted that E. coli concentration analyzed in-lake were reported as non-detect (<10 CFU/100 mL) for lake bottom samples. Detections reported for surface samples were well below the CRWQ guideline value of 400 CFU/100 mL for a single-sample concentration. Average concentration of chlorophyll a (Banook 1 only) was reported as 1.98 µg/L during the monitoring period, which is considered low. Average lake colour, at <5 TCU, is also considered low.
Historical sample results from Lake Banook for the years 2006 to 2011 are used for comparison purposes, where applicable. These data were referenced from the Analysis of Regional Centre Lakes Water Quality Data (2006 – 2011), completed by Stantec for Halifax in 2012.
0.0
1.0
2.0
3.0
4.0
5.0
6.0
7.0
8.0
9.0
10.0
27-Jun-18 19-Jul-18 14-Aug-18 12-Sep-18 26-Sep-18
Cop
per (
ug/L
)
Micmac 1 Micmac 2 CCME FAL GL (2 ug/L)
POLLUTION SOURCE CONTROL STUDY FOR LAKE BANOOK & LAKE MICMAC FINAL REPORT
Monitoring Results April 11, 2019
File: 121415826 3.12
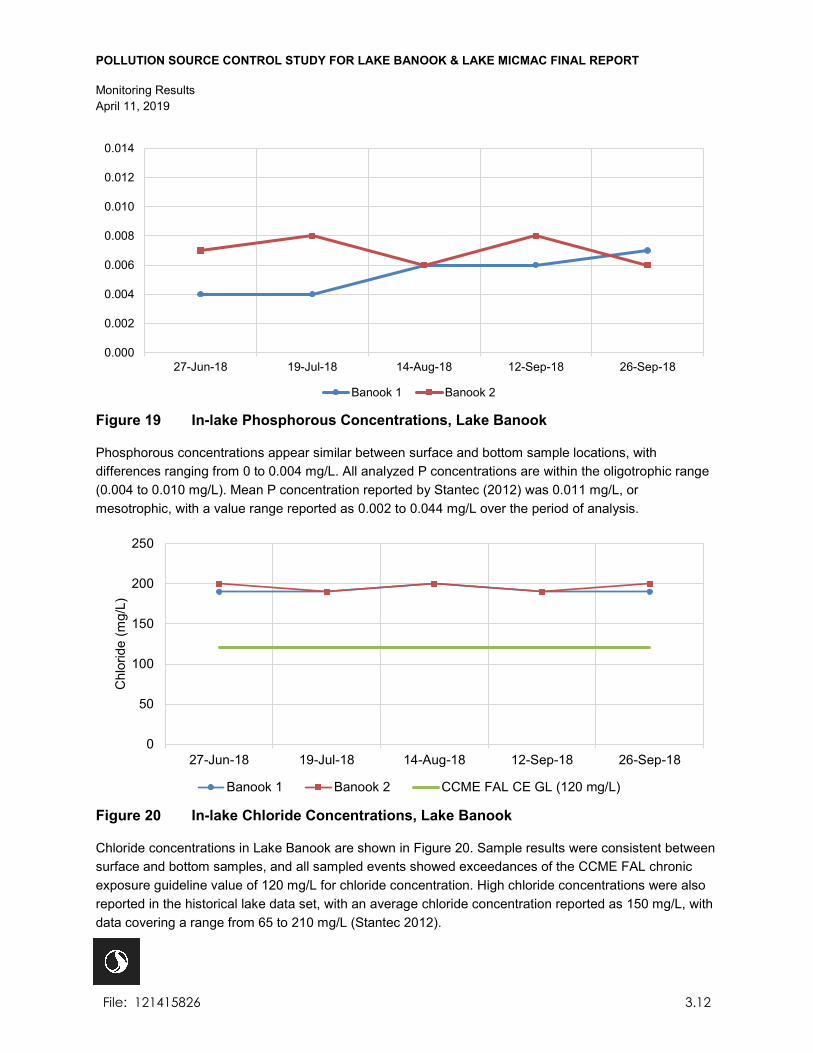
Figure 19 In-lake Phosphorous Concentrations, Lake Banook
Phosphorous concentrations appear similar between surface and bottom sample locations, with differences ranging from 0 to 0.004 mg/L. All analyzed P concentrations are within the oligotrophic range (0.004 to 0.010 mg/L). Mean P concentration reported by Stantec (2012) was 0.011 mg/L, or mesotrophic, with a value range reported as 0.002 to 0.044 mg/L over the period of analysis.
Figure 20 In-lake Chloride Concentrations, Lake Banook
Chloride concentrations in Lake Banook are shown in Figure 20. Sample results were consistent between surface and bottom samples, and all sampled events showed exceedances of the CCME FAL chronic exposure guideline value of 120 mg/L for chloride concentration. High chloride concentrations were also reported in the historical lake data set, with an average chloride concentration reported as 150 mg/L, with data covering a range from 65 to 210 mg/L (Stantec 2012).
0.000
0.002
0.004
0.006
0.008
0.010
0.012
0.014
27-Jun-18 19-Jul-18 14-Aug-18 12-Sep-18 26-Sep-18
Banook 1 Banook 2
0
50
100
150
200
250
27-Jun-18 19-Jul-18 14-Aug-18 12-Sep-18 26-Sep-18
Chl
orid
e (m
g/L)
Banook 1 Banook 2 CCME FAL CE GL (120 mg/L)
POLLUTION SOURCE CONTROL STUDY FOR LAKE BANOOK & LAKE MICMAC FINAL REPORT
Monitoring Results April 11, 2019
File: 121415826 3.13
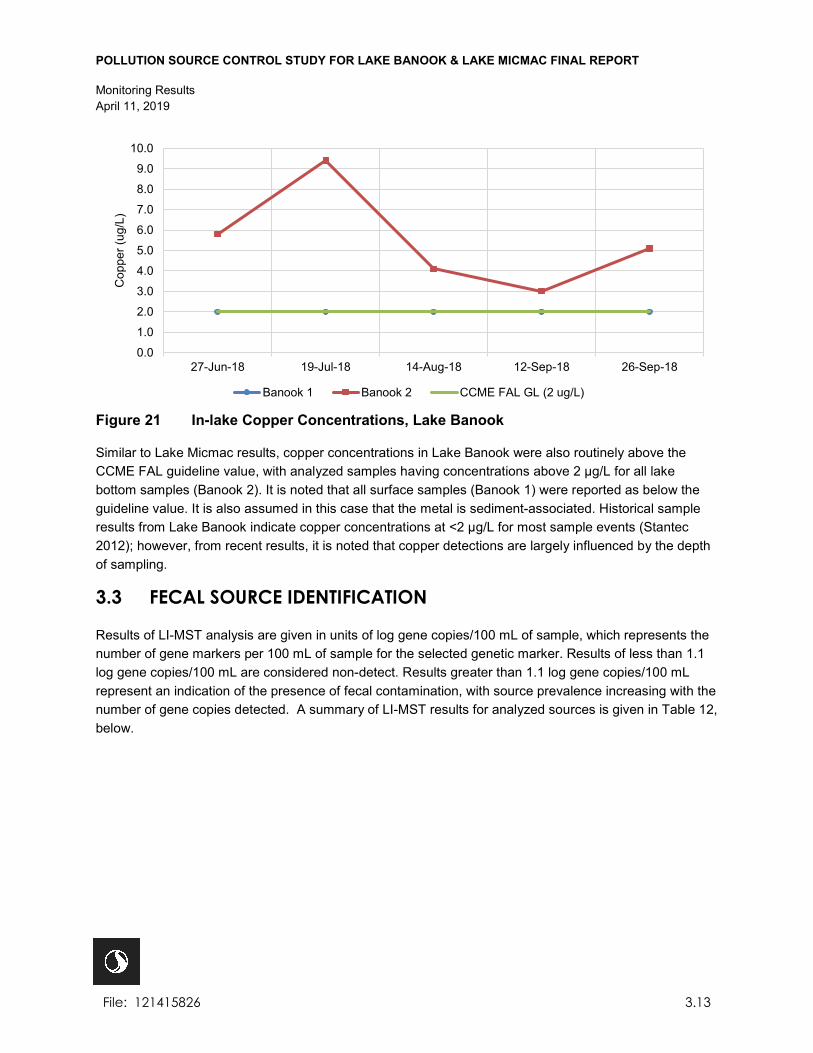
Figure 21 In-lake Copper Concentrations, Lake Banook
Similar to Lake Micmac results, copper concentrations in Lake Banook were also routinely above the CCME FAL guideline value, with analyzed samples having concentrations above 2 μg/L for all lake bottom samples (Banook 2). It is noted that all surface samples (Banook 1) were reported as below the guideline value. It is also assumed in this case that the metal is sediment-associated. Historical sample results from Lake Banook indicate copper concentrations at <2 μg/L for most sample events (Stantec 2012); however, from recent results, it is noted that copper detections are largely influenced by the depth of sampling.
3.3 FECAL SOURCE IDENTIFICATION
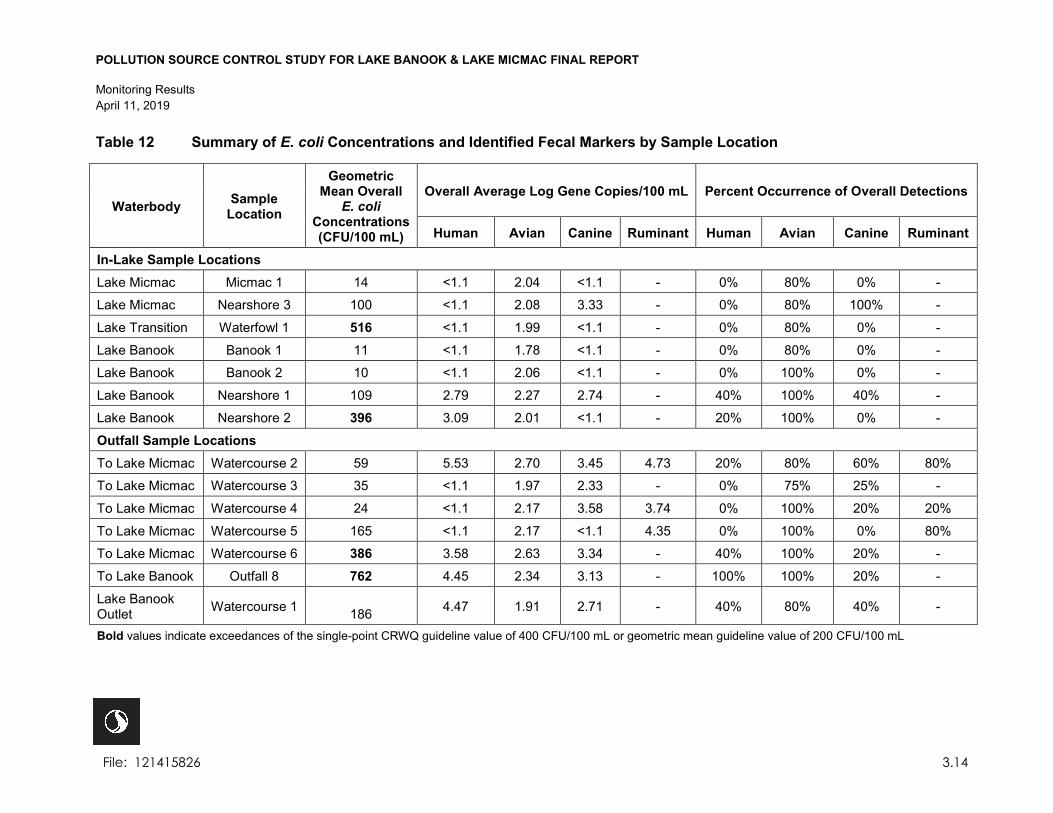
Results of LI-MST analysis are given in units of log gene copies/100 mL of sample, which represents the number of gene markers per 100 mL of sample for the selected genetic marker. Results of less than 1.1 log gene copies/100 mL are considered non-detect. Results greater than 1.1 log gene copies/100 mL represent an indication of the presence of fecal contamination, with source prevalence increasing with the number of gene copies detected. A summary of LI-MST results for analyzed sources is given in Table 12, below.
0.0
1.0
2.0
3.0
4.0
5.0
6.0
7.0
8.0
9.0
10.0
27-Jun-18 19-Jul-18 14-Aug-18 12-Sep-18 26-Sep-18
Cop
per (
ug/L
)
Banook 1 Banook 2 CCME FAL GL (2 ug/L)
POLLUTION SOURCE CONTROL STUDY FOR LAKE BANOOK & LAKE MICMAC FINAL REPORT
Monitoring Results April 11, 2019
File: 121415826 3.14
Table 12 Summary of E. coli Concentrations and Identified Fecal Markers by Sample Location
Waterbody Sample Location
Geometric Mean Overall
E. coli Concentrations (CFU/100 mL)
Overall Average Log Gene Copies/100 mL Percent Occurrence of Overall Detections
Human Avian Canine Ruminant Human Avian Canine Ruminant
In-Lake Sample Locations Lake Micmac Micmac 1 14 <1.1 2.04 <1.1 - 0% 80% 0% -
Lake Micmac Nearshore 3 100 <1.1 2.08 3.33 - 0% 80% 100% -
Lake Transition Waterfowl 1 516 <1.1 1.99 <1.1 - 0% 80% 0% -
Lake Banook Banook 1 11 <1.1 1.78 <1.1 - 0% 80% 0% -
Lake Banook Banook 2 10 <1.1 2.06 <1.1 - 0% 100% 0% -
Lake Banook Nearshore 1 109 2.79 2.27 2.74 - 40% 100% 40% -
Lake Banook Nearshore 2 396 3.09 2.01 <1.1 - 20% 100% 0% -
Outfall Sample Locations To Lake Micmac Watercourse 2 59 5.53 2.70 3.45 4.73 20% 80% 60% 80%
To Lake Micmac Watercourse 3 35 <1.1 1.97 2.33 - 0% 75% 25% -
To Lake Micmac Watercourse 4 24 <1.1 2.17 3.58 3.74 0% 100% 20% 20%
To Lake Micmac Watercourse 5 165 <1.1 2.17 <1.1 4.35 0% 100% 0% 80%
To Lake Micmac Watercourse 6 386 3.58 2.63 3.34 - 40% 100% 20% -
To Lake Banook Outfall 8 762 4.45 2.34 3.13 - 100% 100% 20% -
Lake Banook Outlet Watercourse 1 186 4.47 1.91 2.71 - 40% 80% 40% -
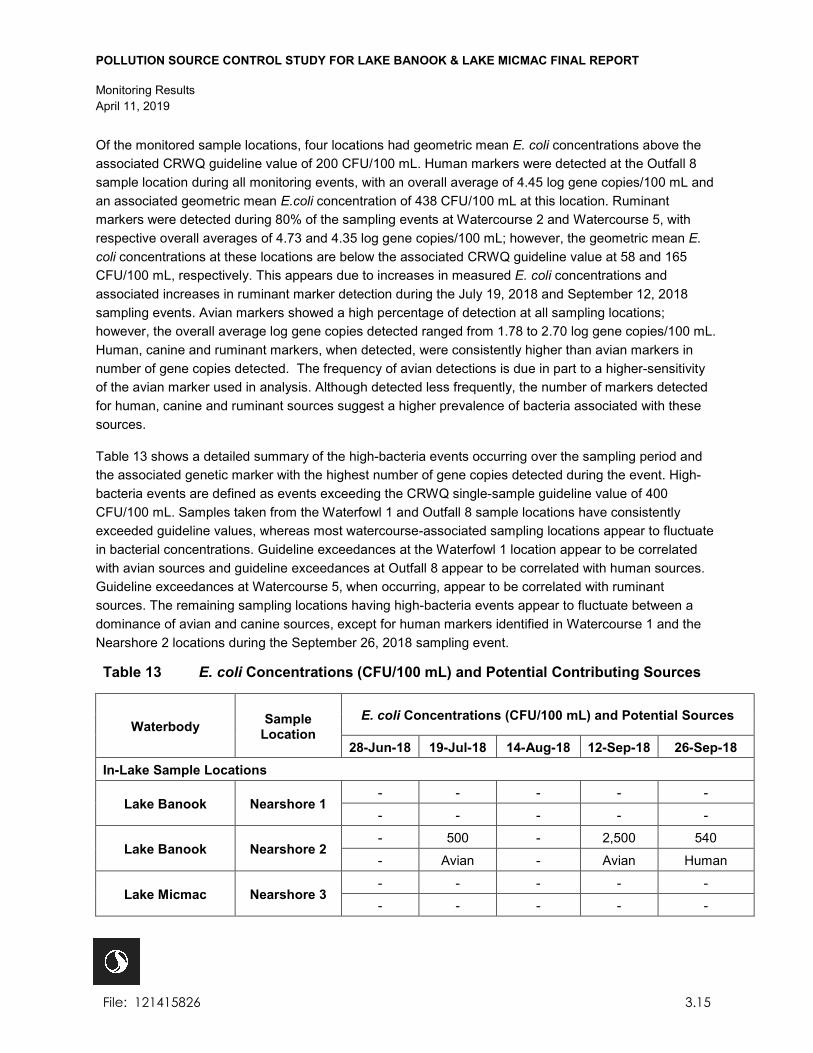
Bold values indicate exceedances of the single-point CRWQ guideline value of 400 CFU/100 mL or geometric mean guideline value of 200 CFU/100 mL
POLLUTION SOURCE CONTROL STUDY FOR LAKE BANOOK & LAKE MICMAC FINAL REPORT
Monitoring Results April 11, 2019
File: 121415826 3.15
Of the monitored sample locations, four locations had geometric mean E. coli concentrations above the associated CRWQ guideline value of 200 CFU/100 mL. Human markers were detected at the Outfall 8 sample location during all monitoring events, with an overall average of 4.45 log gene copies/100 mL and an associated geometric mean E.coli concentration of 438 CFU/100 mL at this location. Ruminant markers were detected during 80% of the sampling events at Watercourse 2 and Watercourse 5, with respective overall averages of 4.73 and 4.35 log gene copies/100 mL; however, the geometric mean E. coli concentrations at these locations are below the associated CRWQ guideline value at 58 and 165 CFU/100 mL, respectively. This appears due to increases in measured E. coli concentrations and associated increases in ruminant marker detection during the July 19, 2018 and September 12, 2018 sampling events. Avian markers showed a high percentage of detection at all sampling locations; however, the overall average log gene copies detected ranged from 1.78 to 2.70 log gene copies/100 mL. Human, canine and ruminant markers, when detected, were consistently higher than avian markers in number of gene copies detected. The frequency of avian detections is due in part to a higher-sensitivity of the avian marker used in analysis. Although detected less frequently, the number of markers detected for human, canine and ruminant sources suggest a higher prevalence of bacteria associated with these sources.
Table 13 shows a detailed summary of the high-bacteria events occurring over the sampling period and the associated genetic marker with the highest number of gene copies detected during the event. High-bacteria events are defined as events exceeding the CRWQ single-sample guideline value of 400 CFU/100 mL. Samples taken from the Waterfowl 1 and Outfall 8 sample locations have consistently exceeded guideline values, whereas most watercourse-associated sampling locations appear to fluctuate in bacterial concentrations. Guideline exceedances at the Waterfowl 1 location appear to be correlated with avian sources and guideline exceedances at Outfall 8 appear to be correlated with human sources. Guideline exceedances at Watercourse 5, when occurring, appear to be correlated with ruminant sources. The remaining sampling locations having high-bacteria events appear to fluctuate between a dominance of avian and canine sources, except for human markers identified in Watercourse 1 and the Nearshore 2 locations during the September 26, 2018 sampling event.
Table 13 E. coli Concentrations (CFU/100 mL) and Potential Contributing Sources
Waterbody Sample Location
E. coli Concentrations (CFU/100 mL) and Potential Sources
28-Jun-18 19-Jul-18 14-Aug-18 12-Sep-18 26-Sep-18 In-Lake Sample Locations
Lake Banook Nearshore 1 - - - - -
- - - - -
Lake Banook Nearshore 2 - 500 - 2,500 540
- Avian - Avian Human
Lake Micmac Nearshore 3 - - - - -
- - - - -

POLLUTION SOURCE CONTROL STUDY FOR LAKE BANOOK & LAKE MICMAC FINAL REPORT
Monitoring Results April 11, 2019
File: 121415826 3.16
Table 13 E. coli Concentrations (CFU/100 mL) and Potential Contributing Sources
Waterbody Sample Location
E. coli Concentrations (CFU/100 mL) and Potential Sources
28-Jun-18 19-Jul-18 14-Aug-18 12-Sep-18 26-Sep-18 Outlet Sample Locations
Lake Micmac Outlet Waterfowl 1 - 530 690 640 490
- Avian Avian Avian Indeterminate
Lake Banook Outlet Watercourse 1 - - 1,600 - 580
- - Avian - Human
To Lake Micmac Watercourse 2 - - - 1,700 -
- - - Ruminant/Human -
To Lake Micmac Watercourse 5 - - - 450 -
- - - Ruminant -
To Lake Micmac Watercourse 6 - 1,300 - 2,100 -
- Canine - Avian -
To Lake Banook Outfall 8 470 790 550 660 1,900
Human Human Human Human Human
Although prominently detected, non-human fecal sources may not pose as significant a risk to human health. Most viruses exhibit species-specificity, indicating a higher likelihood of infecting species from which the virus was sourced from (Dufour et al. 2012). From a human health perspective, it is recommended that remediation of locations identified to have human markers be priority. It is noted, however, that bacterial and parasitic pathogens, such as Cryptosporidium, may be transmitted from animal species to humans (Penakalapati et al. 2017). For this reason, sources of animal feces should be eliminated where possible and monitoring of E.coli concentrations at recreational beaches should continue.
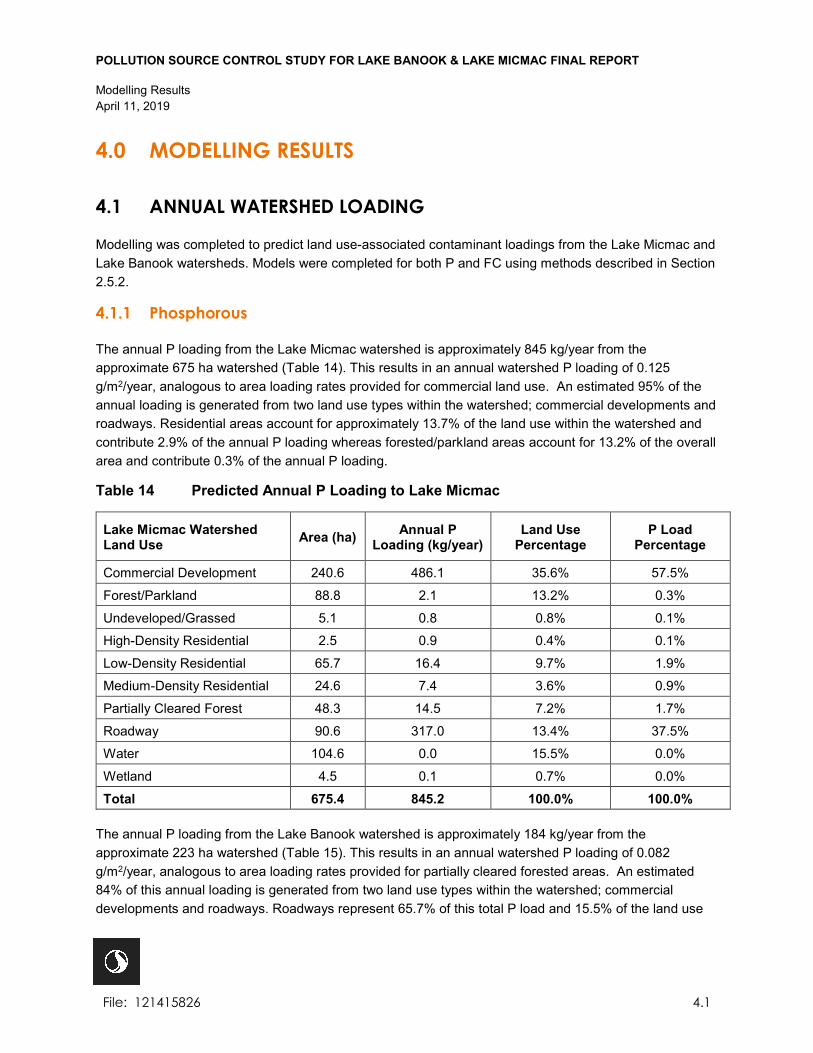
POLLUTION SOURCE CONTROL STUDY FOR LAKE BANOOK & LAKE MICMAC FINAL REPORT
Modelling Results April 11, 2019
File: 121415826 4.1
4.0 MODELLING RESULTS
4.1 ANNUAL WATERSHED LOADING
Modelling was completed to predict land use-associated contaminant loadings from the Lake Micmac and Lake Banook watersheds. Models were completed for both P and FC using methods described in Section 2.5.2.
4.1.1 Phosphorous
The annual P loading from the Lake Micmac watershed is approximately 845 kg/year from the approximate 675 ha watershed (Table 14). This results in an annual watershed P loading of 0.125 g/m2/year, analogous to area loading rates provided for commercial land use. An estimated 95% of the annual loading is generated from two land use types within the watershed; commercial developments and roadways. Residential areas account for approximately 13.7% of the land use within the watershed and contribute 2.9% of the annual P loading whereas forested/parkland areas account for 13.2% of the overall area and contribute 0.3% of the annual P loading.
Table 14 Predicted Annual P Loading to Lake Micmac
Lake Micmac Watershed Land Use Area (ha) Annual P
Loading (kg/year) Land Use
Percentage P Load
Percentage
Commercial Development 240.6 486.1 35.6% 57.5%
Forest/Parkland 88.8 2.1 13.2% 0.3%
Undeveloped/Grassed 5.1 0.8 0.8% 0.1%
High-Density Residential 2.5 0.9 0.4% 0.1%
Low-Density Residential 65.7 16.4 9.7% 1.9%
Medium-Density Residential 24.6 7.4 3.6% 0.9%
Partially Cleared Forest 48.3 14.5 7.2% 1.7%
Roadway 90.6 317.0 13.4% 37.5%
Water 104.6 0.0 15.5% 0.0%
Wetland 4.5 0.1 0.7% 0.0%
Total 675.4 845.2 100.0% 100.0%
The annual P loading from the Lake Banook watershed is approximately 184 kg/year from the approximate 223 ha watershed (Table 15). This results in an annual watershed P loading of 0.082 g/m2/year, analogous to area loading rates provided for partially cleared forested areas. An estimated 84% of this annual loading is generated from two land use types within the watershed; commercial developments and roadways. Roadways represent 65.7% of this total P load and 15.5% of the land use
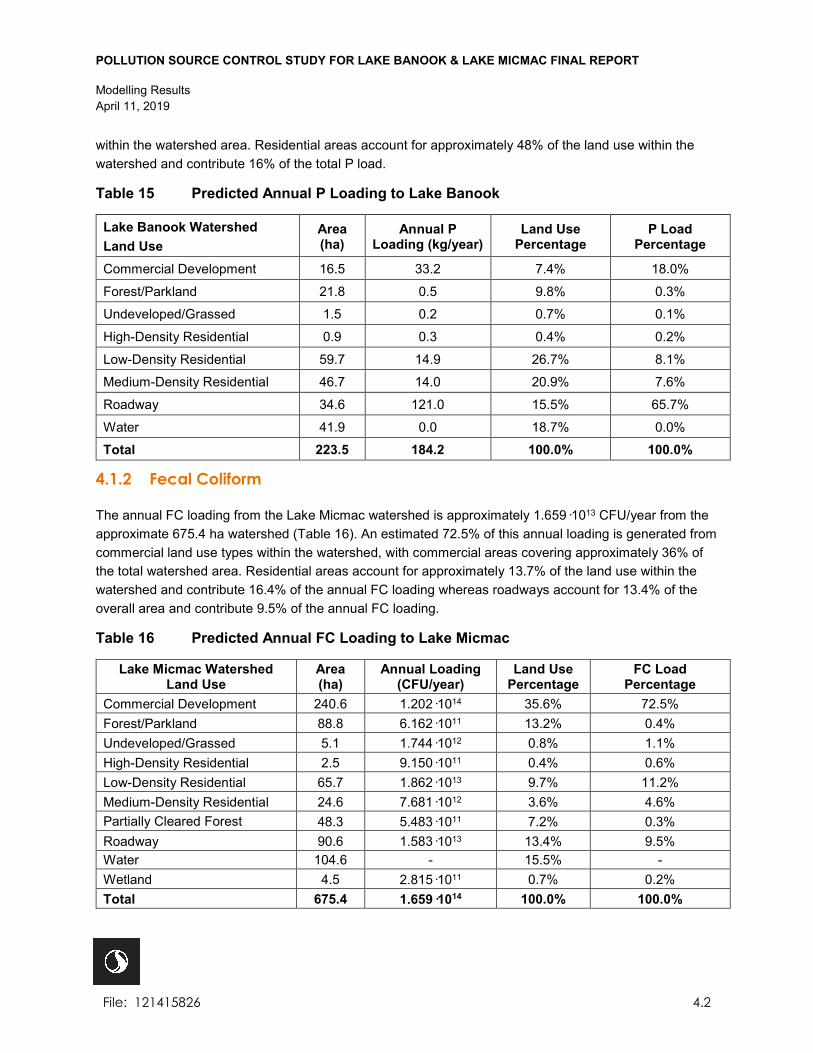
POLLUTION SOURCE CONTROL STUDY FOR LAKE BANOOK & LAKE MICMAC FINAL REPORT
Modelling Results April 11, 2019
File: 121415826 4.2
within the watershed area. Residential areas account for approximately 48% of the land use within the watershed and contribute 16% of the total P load.
Table 15 Predicted Annual P Loading to Lake Banook
Lake Banook Watershed Land Use
Area (ha)
Annual P Loading (kg/year)
Land Use Percentage
P Load Percentage
Commercial Development 16.5 33.2 7.4% 18.0%
Forest/Parkland 21.8 0.5 9.8% 0.3%
Undeveloped/Grassed 1.5 0.2 0.7% 0.1%
High-Density Residential 0.9 0.3 0.4% 0.2%
Low-Density Residential 59.7 14.9 26.7% 8.1%
Medium-Density Residential 46.7 14.0 20.9% 7.6%
Roadway 34.6 121.0 15.5% 65.7%
Water 41.9 0.0 18.7% 0.0%
Total 223.5 184.2 100.0% 100.0%
4.1.2 Fecal Coliform
The annual FC loading from the Lake Micmac watershed is approximately 1.659·1013 CFU/year from the approximate 675.4 ha watershed (Table 16). An estimated 72.5% of this annual loading is generated from commercial land use types within the watershed, with commercial areas covering approximately 36% of the total watershed area. Residential areas account for approximately 13.7% of the land use within the watershed and contribute 16.4% of the annual FC loading whereas roadways account for 13.4% of the overall area and contribute 9.5% of the annual FC loading.
Table 16 Predicted Annual FC Loading to Lake Micmac
Lake Micmac Watershed Land Use
Area (ha)
Annual Loading (CFU/year)
Land Use Percentage
FC Load Percentage
Commercial Development 240.6 1.202·1014 35.6% 72.5% Forest/Parkland 88.8 6.162·1011 13.2% 0.4% Undeveloped/Grassed 5.1 1.744·1012 0.8% 1.1% High-Density Residential 2.5 9.150·1011 0.4% 0.6% Low-Density Residential 65.7 1.862·1013 9.7% 11.2% Medium-Density Residential 24.6 7.681·1012 3.6% 4.6% Partially Cleared Forest 48.3 5.483·1011 7.2% 0.3% Roadway 90.6 1.583·1013 13.4% 9.5% Water 104.6 - 15.5% - Wetland 4.5 2.815·1011 0.7% 0.2% Total 675.4 1.659·1014 100.0% 100.0%
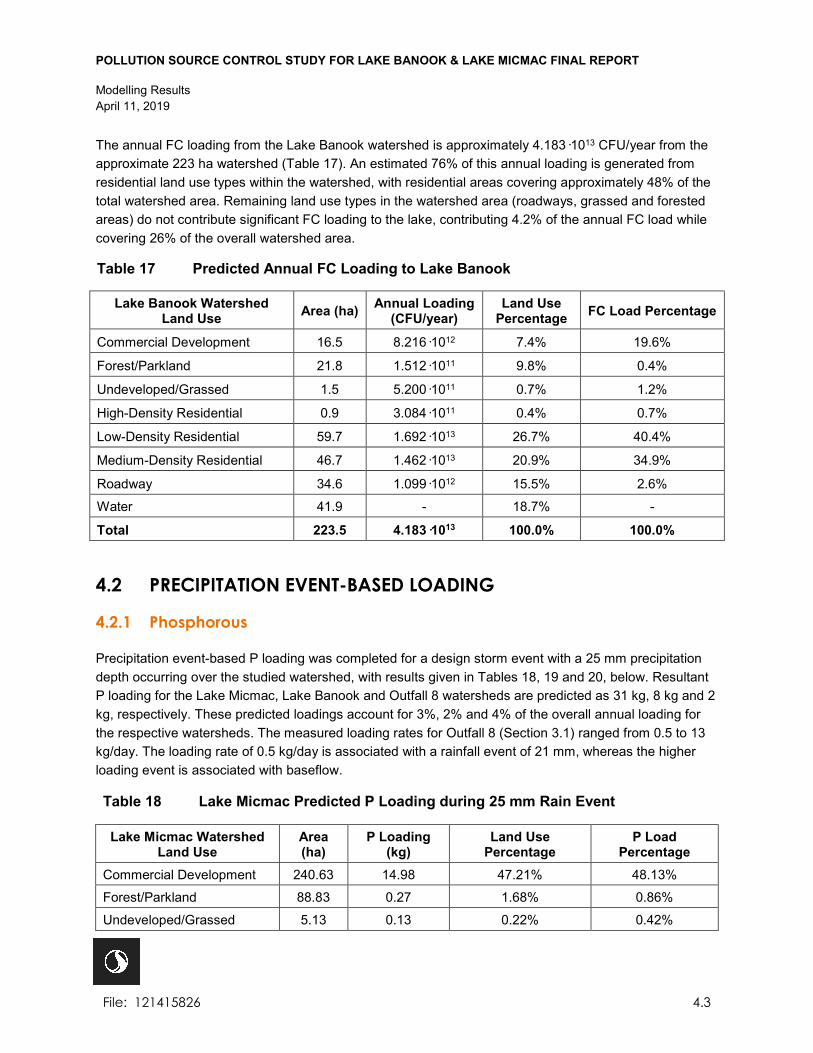
POLLUTION SOURCE CONTROL STUDY FOR LAKE BANOOK & LAKE MICMAC FINAL REPORT
Modelling Results April 11, 2019
File: 121415826 4.3
The annual FC loading from the Lake Banook watershed is approximately 4.183·1013 CFU/year from the approximate 223 ha watershed (Table 17). An estimated 76% of this annual loading is generated from residential land use types within the watershed, with residential areas covering approximately 48% of the total watershed area. Remaining land use types in the watershed area (roadways, grassed and forested areas) do not contribute significant FC loading to the lake, contributing 4.2% of the annual FC load while covering 26% of the overall watershed area.
Table 17 Predicted Annual FC Loading to Lake Banook
Lake Banook Watershed Land Use Area (ha) Annual Loading
(CFU/year) Land Use
Percentage FC Load Percentage
Commercial Development 16.5 8.216·1012 7.4% 19.6%
Forest/Parkland 21.8 1.512·1011 9.8% 0.4%
Undeveloped/Grassed 1.5 5.200·1011 0.7% 1.2%
High-Density Residential 0.9 3.084·1011 0.4% 0.7%
Low-Density Residential 59.7 1.692·1013 26.7% 40.4%
Medium-Density Residential 46.7 1.462·1013 20.9% 34.9%
Roadway 34.6 1.099·1012 15.5% 2.6%
Water 41.9 - 18.7% -
Total 223.5 4.183·1013 100.0% 100.0%
4.2 PRECIPITATION EVENT-BASED LOADING
4.2.1 Phosphorous
Precipitation event-based P loading was completed for a design storm event with a 25 mm precipitation depth occurring over the studied watershed, with results given in Tables 18, 19 and 20, below. Resultant P loading for the Lake Micmac, Lake Banook and Outfall 8 watersheds are predicted as 31 kg, 8 kg and 2 kg, respectively. These predicted loadings account for 3%, 2% and 4% of the overall annual loading for the respective watersheds. The measured loading rates for Outfall 8 (Section 3.1) ranged from 0.5 to 13 kg/day. The loading rate of 0.5 kg/day is associated with a rainfall event of 21 mm, whereas the higher loading event is associated with baseflow.
Table 18 Lake Micmac Predicted P Loading during 25 mm Rain Event
Lake Micmac Watershed Land Use
Area (ha)
P Loading (kg)
Land Use Percentage
P Load Percentage
Commercial Development 240.63 14.98 47.21% 48.13%
Forest/Parkland 88.83 0.27 1.68% 0.86%
Undeveloped/Grassed 5.13 0.13 0.22% 0.42%
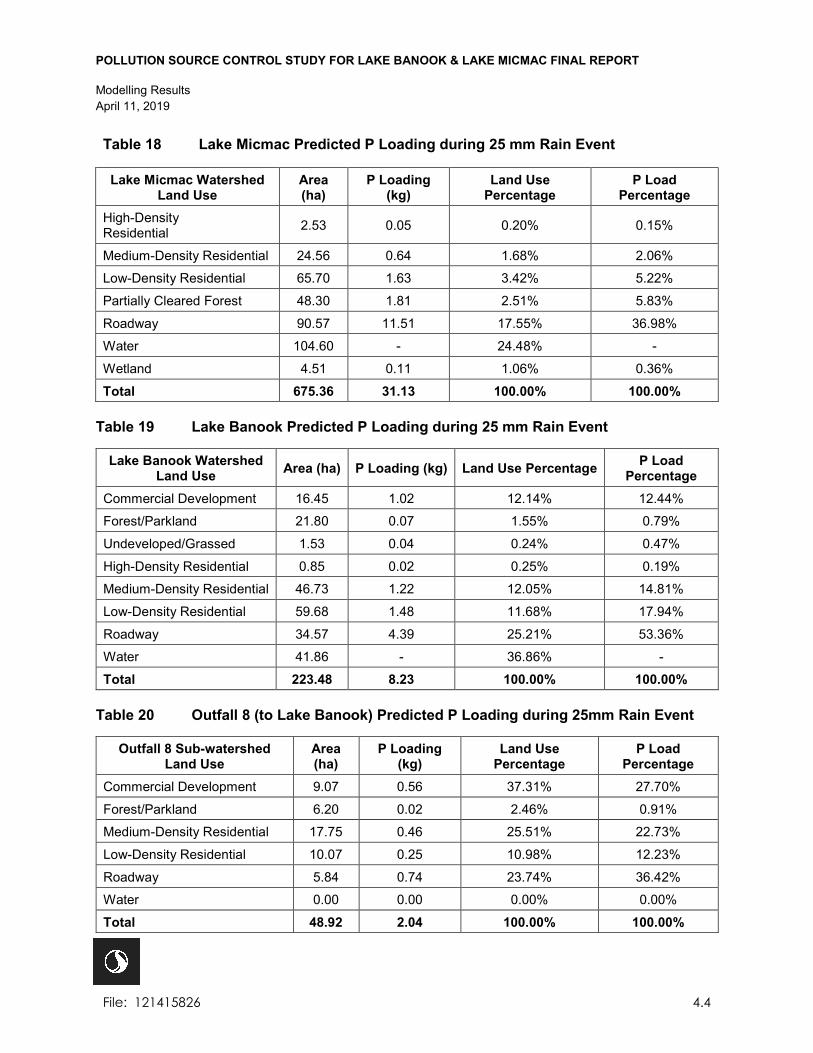
POLLUTION SOURCE CONTROL STUDY FOR LAKE BANOOK & LAKE MICMAC FINAL REPORT
Modelling Results April 11, 2019
File: 121415826 4.4
Table 18 Lake Micmac Predicted P Loading during 25 mm Rain Event
Lake Micmac Watershed Land Use
Area (ha)
P Loading (kg)
Land Use Percentage
P Load Percentage
High-Density Residential 2.53 0.05 0.20% 0.15%
Medium-Density Residential 24.56 0.64 1.68% 2.06%
Low-Density Residential 65.70 1.63 3.42% 5.22%
Partially Cleared Forest 48.30 1.81 2.51% 5.83%
Roadway 90.57 11.51 17.55% 36.98%
Water 104.60 - 24.48% -
Wetland 4.51 0.11 1.06% 0.36%
Total 675.36 31.13 100.00% 100.00%
Table 19 Lake Banook Predicted P Loading during 25 mm Rain Event
Lake Banook Watershed Land Use Area (ha) P Loading (kg) Land Use Percentage P Load
Percentage Commercial Development 16.45 1.02 12.14% 12.44%
Forest/Parkland 21.80 0.07 1.55% 0.79%
Undeveloped/Grassed 1.53 0.04 0.24% 0.47%
High-Density Residential 0.85 0.02 0.25% 0.19%
Medium-Density Residential 46.73 1.22 12.05% 14.81%
Low-Density Residential 59.68 1.48 11.68% 17.94%
Roadway 34.57 4.39 25.21% 53.36%
Water 41.86 - 36.86% -
Total 223.48 8.23 100.00% 100.00%
Table 20 Outfall 8 (to Lake Banook) Predicted P Loading during 25mm Rain Event
Outfall 8 Sub-watershed Land Use
Area (ha)
P Loading (kg)
Land Use Percentage
P Load Percentage
Commercial Development 9.07 0.56 37.31% 27.70%
Forest/Parkland 6.20 0.02 2.46% 0.91%
Medium-Density Residential 17.75 0.46 25.51% 22.73%
Low-Density Residential 10.07 0.25 10.98% 12.23%
Roadway 5.84 0.74 23.74% 36.42%
Water 0.00 0.00 0.00% 0.00%
Total 48.92 2.04 100.00% 100.00%
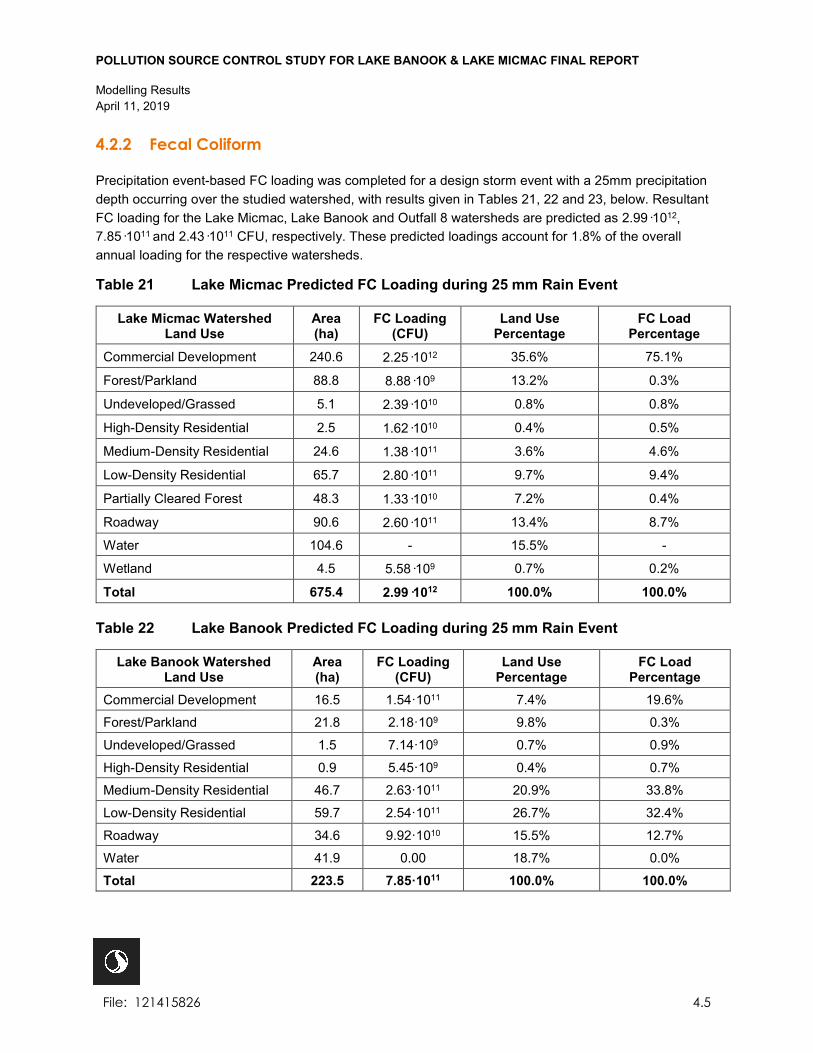
POLLUTION SOURCE CONTROL STUDY FOR LAKE BANOOK & LAKE MICMAC FINAL REPORT
Modelling Results April 11, 2019
File: 121415826 4.5
4.2.2 Fecal Coliform
Precipitation event-based FC loading was completed for a design storm event with a 25mm precipitation depth occurring over the studied watershed, with results given in Tables 21, 22 and 23, below. Resultant FC loading for the Lake Micmac, Lake Banook and Outfall 8 watersheds are predicted as 2.99·1012, 7.85·1011 and 2.43·1011 CFU, respectively. These predicted loadings account for 1.8% of the overall annual loading for the respective watersheds.
Table 21 Lake Micmac Predicted FC Loading during 25 mm Rain Event
Lake Micmac Watershed Land Use
Area (ha)
FC Loading (CFU)
Land Use Percentage
FC Load Percentage
Commercial Development 240.6 2.25·1012 35.6% 75.1%
Forest/Parkland 88.8 8.88·109 13.2% 0.3%
Undeveloped/Grassed 5.1 2.39·1010 0.8% 0.8%
High-Density Residential 2.5 1.62·1010 0.4% 0.5%
Medium-Density Residential 24.6 1.38·1011 3.6% 4.6%
Low-Density Residential 65.7 2.80·1011 9.7% 9.4%
Partially Cleared Forest 48.3 1.33·1010 7.2% 0.4%
Roadway 90.6 2.60·1011 13.4% 8.7%
Water 104.6 - 15.5% -
Wetland 4.5 5.58·109 0.7% 0.2%
Total 675.4 2.99·1012 100.0% 100.0%
Table 22 Lake Banook Predicted FC Loading during 25 mm Rain Event
Lake Banook Watershed Land Use
Area (ha)
FC Loading (CFU)
Land Use Percentage
FC Load Percentage
Commercial Development 16.5 1.54·1011 7.4% 19.6%
Forest/Parkland 21.8 2.18·109 9.8% 0.3%
Undeveloped/Grassed 1.5 7.14·109 0.7% 0.9%
High-Density Residential 0.9 5.45·109 0.4% 0.7%
Medium-Density Residential 46.7 2.63·1011 20.9% 33.8%
Low-Density Residential 59.7 2.54·1011 26.7% 32.4%
Roadway 34.6 9.92·1010 15.5% 12.7%
Water 41.9 0.00 18.7% 0.0%
Total 223.5 7.85·1011 100.0% 100.0%

POLLUTION SOURCE CONTROL STUDY FOR LAKE BANOOK & LAKE MICMAC FINAL REPORT
Modelling Results April 11, 2019
File: 121415826 4.6
Table 23 Outfall 8 (to Lake Banook) Sub-watershed Predicted FC Loading during 25 mm Rain Event
Outfall 8 Sub-watershed Land Use Area (ha) FC Loading
(CFU) Land Use
Percentage FC Load
Percentage Commercial Development 9.1 8.47·1010 18.5% 34.8%
Forest/Parkland 6.2 6.20·108 12.7% 0.3%
Medium-Density Residential 17.7 9.97·1010 36.3% 41.0%
Low-Density Residential 10.1 4.29·1010 20.6% 17.6%
Roadway 5.8 1.55·1010 11.9% 6.4%
Water 0.0 0.00 0.0% 0.0%
Total 48.9 2.43·1011 100.0% 100.0%
4.3 LAKE SYSTEM PHOSPHOROUS LOADING
A lake system P loading model was completed for Lake Micmac and Lake Banook using a method developed by Brylinsky (2004), as described in Section 2.5.1. A summary of results is given in Table 24, below.
Table 24 Lake System P Model Results Summary, Lake Micmac and Lake Banook
Lake Micmac Lake Banook Lake Characteristics Drainage Area (ha) 570.8 181.7
Lake Surface Area (ha) 103.5 40.8
Lake Volume (106 m3) 3.49 1.65
Lake Flushing Rate (times/year) 5.82 13.65
Phosphorous Budget (g/yr) Upstream Inflow 1,032,357.0 1,067,582.0
Atmosphere 17,905.5 7,058.40
Land Runoff 845,237.0 184,332.0
Development 0 0
Sedimentation -739,245.0 -226,615.0
Total Outflow 1,156,255.0 1,032,357.0
Phosphorous input sources are partitioned into four categories: input from upstream waterbodies, atmospheric deposition, overland runoff and development (largely septic system inputs). Phosphorous exits the lake system through either in-lake sedimentation or lake outflow. As the lake watersheds are serviced by a centralized wastewater collection system, development inputs from septic systems are not considered within the model. Within Lake Micmac, approximately 40% of P input remains in-lake through

POLLUTION SOURCE CONTROL STUDY FOR LAKE BANOOK & LAKE MICMAC FINAL REPORT
Modelling Results April 11, 2019
File: 121415826 4.7
sedimentation and approximately 60% is discharged. Within Lake Banook, approximately 20% of P inputs remains in-lake and approximately 80% is discharged. As the flushing rate of Lake Banook is over twice the rate of Lake Micmac, this may contribute to the higher P discharge rate. When looking at drainage area runoff inputs versus lake volume, Lake Micmac accepts 0.242 g of P input per unit of volume, whereas Lake Banook accepts 0.111 g. There is an increase in predicted P loading from the Lake Micmac drainage area, at 1,480 g/ha, over the predicted loading of 1,014 g/ha from the Lake Banook Drainage area. This is consistent with expectations as the Lake Micmac drainage area is dominated by commercial land use whereas the Lake Banook drainage area is largely residential in nature.
Table 25 Model Validation of Predicted vs. Measured P Concentrations
Model Validation Lake Micmac Lake Banook Predicted P – Lake system model (mg/L) 0.057 0.045
Measured P - 2018 monitoring (mg/L) 0.006 0.006
% Difference 843.0% 663.0%
As a result of the lake system nutrient loading modeling, in-lake P concentrations were predicated at 0.057 mg/L within Lake Micmac and 0.045 mg/L within Lake Banook. This represents a trophic status of eutrophic, or highly productive for vegetation growth, under the CCME FAL guidelines. There is a noted difference in model validation depending on the measured P data used in the validation. A comparionson of predicted verusus measured P concentrations is given in Table 25, above. The measured P concentration for the model validation is taken from the average P concentration for each lake (0.006 mg/L, oligotrophic or low productivity for vegetation growth) calculated with results from the 2018 in-lake monitoring, which occurred during the growing season between the months of June and September. Poor comparison is found between the model and sampled results when using this data set.
When comparing to measured P concentration for Lake Banook taken from a historical P data set (Stantec 2012), with the specific sample result of 0.044 mg/L (eutrophic) occurring in May of 2010, model comparison is good (4% difference). When assessing the historical P data set, in-lake concentrations range from 0.002 to 0.044 mg/L (ultra-oligotrophic to eutrophic), with an average concentration of 0.011 mg/L (mesotrophic), corresponding to an average percent difference of 316%. For complete model validation, it is suggested to incorporate sampling data taken during the non-growing season (typically November through May) to assess if there are increased P concentrations in the lakes after vegetation decay and lake turnover (if applicable) has occurred. It is noted that there is good correlation between the predicted annual overland runoff loading from the lake system model and the results from the annual watershed loading model.
POLLUTION SOURCE CONTROL STUDY FOR LAKE BANOOK & LAKE MICMAC FINAL REPORT
Analysis April 11, 2019
File: 121415826 5.1
5.0 ANALYSIS
5.1.1 Surface Water Flow and Contaminant Loading
The measurement of flow provides valuable interpretation to grab sample concentration data as it allows for the calculation of pollutant loading to a waterbody using measured data. High pollutant concentrations may represent acute risk to aquatic species or human health, but in the absence of significant associated flow, the pollutant load to a waterbody may minimal.
The highest P loading was calculated from Watercourse 2 and Watercourse 5 at 294 and 343 kg/day, respectively, with the highest measured P loading events coinciding with the occurrence of the rain event on September 12, 2018. E.coli loading was calculated to be highest from Watercourse 2 and Watercourse 1, at 5.5 x 10⁷ and 1.9 x 10⁷ CFU/100 mL, respectively. These loadings were associated with the September 12, 2018 and August 14, 2018 rain events.
Watercourse 3 and Outfall 8 both have P and E.coli loadings that appear to be increased during baseflow. This may be an indication of domestic wastewater discharge to these locations. Stormwater events would provide additional flow to dilute the wastewater, resulting in lower concentrations during storm events in comparison with baseflow.
Many HDW sites had no flow during the monitoring period. For sites with measurable flow, the sample locations with the highest loading of both P and E.coli were noted as HDW8714 within Lake Micmac and HDW8905 and HDW9311 within Lake Banook. Sample site HDW9311 had the single highest reported concentration of both P and E.coli of all sampled sites, at 2.3 mg/L and 5,200 CFU/100 mL, respectively. Sample site HDW8714 reported the highest loading of both parameters, at 27.1 kg/day P and 3.62 x 10⁶ CFU/100 mL E.coli.
Although grab sample concentrations of P and E.coli were reported as higher at the HDW8714 sample location, calculated loadings are higher at the watercourse sample locations; therefore, the implementation of loading reduction strategies may be more effective at the watercourse sample locations.
5.1.2 Surface Water Quality Summary
5.1.2.1 In-Situ Monitoring
Thermal stratification and associated low DO values at lake bottom are important factors in P release from benthic sediments. For P release to occur, an anoxic zone must develop at the lake bottom. P is release into this anoxic zone and is distributed throughout the entire water column when seasonal temperature changes temporarily de-stratify the lake.
In-situ water quality profiles were collected throughout the water column at both in-lake stations (Banook and Micmac) during each sampling event. Thermal stratification in Lake Banook was found to begin within
POLLUTION SOURCE CONTROL STUDY FOR LAKE BANOOK & LAKE MICMAC FINAL REPORT
Analysis April 11, 2019
File: 121415826 5.2
the first half of July, with a similar pattern being observed for DO. For the entire sampling period the upper four meters of Lake Banook was well oxygenated with DO levels found to be above the CCME FAL Guidelines. By mid-August a strong thermocline was observed to be present with DO levels dropping significantly under the four-meter mark. DO levels below the seven-meter mark were found to be anoxic in Lake Banook. A similar pattern was observed for pH, with the upper six meters meeting CCME FAL guidelines for pH concentrations. As the summer progressed and a thermocline developed, some pH values fell below these guidelines below water depths of six meters.
Thermal stratification in Lake Micmac was found to be less pronounced than Lake Banook. Lake Micmac is much shallower and appeared to be well mixed throughout the sampling period. Water quality data indicated that by mid-July, DO concentrations were below the CCME FAL guidelines for water depths below five meters. For all sampling events pH concentrations fell within the CCME FAL guideline range.
5.1.2.2 Surface Water Quality
Sampled surface water quality parameters met the referenced CCME FAL and Health Canada CRWQ guidelines in most instances, except for consistent exceedances of the CCME FAL guideline value for chloride (120 mg/L) and copper (2 μg/L) within both Lake Micmac and Lake Banook. Chloride exceedances appear consistent throughout the water column in both lakes, whereas copper exceedances were limited to the lake bottom sample locations (Banook 2 and Micmac 2). Both parameters are associated with anthropogenic sources and are considered common stormwater contaminants.
Bacteria concentrations (E. coli) were reported as non-detect or well below the single-sample CRWQ guideline of 400 CFU/100 mL at both in-lake deep-water sample locations; however, the Nearshore 2 location reported routine exceedances of the guideline value. The trophic status, based on in-lake P concentrations, is reported as oligotrophic to mesotrophic within Lake Micmac and oligotrophic in Lake Banook. These trophic statuses are associated with lower vegetative productivity and lower risk for algal blooms. Although thermal stratification and reduced DO was observed in deep-lake in-site profiles, lake bottom samples did not show an increase in P concentration over surface sample results.
Data from the current monitoring period (June to September 2018) were compared to historical data for Lake Banook for select parameters. Chloride exceedances were historically reported for this lake. Copper was not flagged as a contaminant of concern in the historical data set; however, data shows that depth of sampling is important in picking up exceedances of this parameter and surface sample data may not be indicative of bottom water quality.
5.1.3 Fecal Source Identification Summary
MST was conducted at a selection of watercourse and outfall locations within both lakes to identify potential sources of fecal contamination within the lake systems.
Human genetic markers were identified within the Lake Banook system at the following sampling locations: Nearshore 1 (in-lake), Nearshore 2 (in-lake), Outfall 8 (stormwater outfall), and Watercourse 1 (Lake Banook discharge point). High-bacteria events associated with a high number of human markers occurred at Nearshore 2, Watercourse 1 and Outfall 8. Human genetic markers were identified within the
POLLUTION SOURCE CONTROL STUDY FOR LAKE BANOOK & LAKE MICMAC FINAL REPORT
Analysis April 11, 2019
File: 121415826 5.3
Lake Micmac system at the following sampling locations: Watercourse 2 and Watercourse 6. High-bacteria events associated with a high number of human markers occurred at Watercourse 2. It is anticipated that the detection of human genetic markers is most likely associated with the unintentional discharge of domestic wastewater in areas where markers are detected. This is attributed to either leaking pipe networks, or unintentional cross-connections between wastewater and stormwater collection systems.
Ruminant genetic markers were identified within the Lake Micmac system at the following sampling locations: Watercourse 2, 4 and 5. High-bacteria events associated with a high number of ruminant markers occurred at Watercourse 2 and Watercourse 5. Watercourses 2 and 4 are discharge points within the Shubenacadie Wildlife Park and Watercourse 4 is the outfall of the Red Bridge Pond watershed. Deer have been observed in the wild at these locations.
Canine markers were also identified Nearshore 1, Nearshore 3, Watercourse 1, Watercourse 2, Watercourse 3, Watercourse 4, Watercourse 6 and Outfall 8. A high-bacteria event associated with a high number of canine markers occurred at Watercourse 6. Nearshore 1 and Nearshore 3 are beach locations and Nearshore 3 is also associated with an off-leash dog park.
Avian genetic markers were identified at all sampled locations at a high degree of occurrence. High-bacteria events associated with a high number of avian markers occurred at Waterfowl 1, Nearshore 1, Nearshore 2, Nearshore 3, Watercourse 1 and Watercourse 6. The bridge located at the Waterfowl 1 sample location is a common congregation point for waterfowl, as are the beach locations at Nearshore 1, 2 and 3.
With the exception of human markers, assumptions on why detections have occurred at watercourse locations are more difficult to make as canine, ruminant and avian detections may be a result of overland flow contributions or animal congregation within the watercourse. It is important to note, however, that high bacteria events have been reported associated with watercourses within the lake systems.
5.1.4 Modelling Results Summary
5.1.4.1 Phosphorous
Area and concentration-based P loadings within each watershed are largely generated by anthropogenic sources, namely commercial development and roadways. These two land uses contributed approximately 95% of the 845 kg/year loading to Lake Micmac and 84% of the 184 kg/year loading to Lake Banook. The influence of residential land use on P loadings would be greatly increased if the watersheds were not serviced by wastewater collection systems and centralized wastewater treatment.
During a design storm rainfall event of 25 mm, P loadings were calculated for Lake Banook, Lake Micmac, and a sub-watershed of Outfall 8, discharging to Lake Banook. Rain event-based loadings of 31 kg and 8 kg were calculated for Lake Micmac and Lake Banook, respectively. This would suggest that mitigation of rainfall-associated P loadings within each watershed could be achieved through the use of stormwater treatment designed to remove the loading associated with the modeled rain event.
POLLUTION SOURCE CONTROL STUDY FOR LAKE BANOOK & LAKE MICMAC FINAL REPORT
Analysis April 11, 2019
File: 121415826 5.4
A rain event-based loading of 2 kg was calculated for the Outfall 8 sub-watershed. When comparing the Outfall 8 model result to loading calculations from measured data during a captured 21 mm rain event, results are comparable at 0.5 kg measured and 2 kg modeled loading values. The measured loading rates for Outfall 8 during a baseflow sampling event increase to 13 kg/day. This indicates loading at this outfall may be more associated with domestic wastewater influence than overland runoff, as it decreases during rain events. Alternatively, measured loading rates for select watercourses captured during rain events suggest a significant increase in P loading from predicted values. Measured P loadings from Watercourse 1, 2 and 5 during a single rain event were analogous to estimated annual P loadings. These events were also associated with high bacteria events and genetic marker detections of human, ruminant and avian sources. This suggests that fecal-associated P may be present at these locations in concentrations that are higher than what is captured in the literature-based EMC values used in the model.
According to results of the lake systems P model, Lake Micmac retains approximately 740 kg of P on an annual basis and Lake Banook retains approximately 243 kg. Modeled in-lake P concentrations predict eutrophic status for both lakes; however, sample results show P concentrations within the lakes as oligotrophic during the sampled period. This is thought to be in part due to vegetation harvesting efforts that have been undertaken in Lake Banook over the past several years. It is also possible that the sampling program was carried out during the active growing season, where vegetation growth removes P from the water column. The extension of sampling into the colder months may capture changes in lake P concentration as vegetation die-off releases P into the environment.
5.1.4.2 Fecal Coliform
According to EMC-based model results, area and concentration-based FC loadings within Lake Banook are largely generated by residential developments (76%) and area and concentration-based FC loadings within Lake Micmac are largely generated by commercial developments (73%). It is noted, however, that model parameters used for FC have a high degree of variability. Results from rainfall-event modeling at Outfall 8 give a calculated loading of 2.43 x 10¹¹ CFU/100 mL during a 25 mm design storm event. When compared to captured loading data for a similar rainfall within the watershed, at 3.51 x 10⁴ CFU/100 mL, the model results appear to overestimate FC loading from the sub-watershed. With more definitive bacteria source conclusions made as a result of MST sampling, it is recommended that future E.coli studies in the watershed be carried out using analytical methods as opposed to watershed modeling.
POLLUTION SOURCE CONTROL STUDY FOR LAKE BANOOK & LAKE MICMAC FINAL REPORT
Recommendations to Mitigate Loading April 11, 2019
File: 121415826 6.1
6.0 RECOMMENDATIONS TO MITIGATE LOADING
6.1 PHOSPHOROUS LOADING MITIGATION
6.1.1 Land Use-Based Mitigation
Commercial and road land uses contribute the highest percentage of P loading to both lake systems on an annual basis. As a result, the following suggested mitigation measured are designed to counter the effects of existing urban development by changing land-use loading rates derived from these developments.
1) The implementation of street maintenance programs to remove sediment-associated P from roadways prior to it being carried to the lake systems via stormwater runoff. Street sweeping and catch basin clean out are required routine maintenance for urban street systems to minimize sediment transport to downstream receptors.
2) The promotion of green space creation or reclamation within the highly urbanized watersheds. The loading rate for P changes significantly from commercial developments (0.2 gm/m2 yr) to green space (0.015 gm/m2 yr), meaning the promotion of green space can reduce P loadings to downstream receptors.
3) The implementation of both source-based and end-of-pipe P removal stormwater design best-management practices (BMPs). Infiltration-based or settling-based low-impact design (LID) techniques may be used to reduce sediment and sediment-associated P loadings from reaching discharge points within the lakes. Based on preliminary loading data captured within this study, P loading is greater from watercourse sample locations than stormwater headwall locations. Treatment should primarily focus on mitigating stormwater loading to watercourses within the watershed. This should be a requirement of new developments in the area. The installation of decentralized catch-basin-type treatment devices are a viable option in previously-developed areas. For design purposes, P loading derived from the precipitation-based model (25 mm, 4-hr duration Chicago storm) can be used as a benchmark for P loading removal requirements of selected stormwater management BMPs.
6.1.2 Vegetation Harvesting
Differences between modeled P loading and actual measured in-lake P concentrations suggest that the current lake P concentration and associated trophic status is better than expected for a highly urbanized watershed. The lake system model uses estimated P inputs and outputs to calculate an in-lake P concentration. The continuation of vegetation harvesting efforts in Lake Banook is recommended as this represents an additional P output from the lake system. If land-use based mitigation measures are successful in reducing P loading to the lake systems, the requirement for vegetation harvesting may be lessened over time.
POLLUTION SOURCE CONTROL STUDY FOR LAKE BANOOK & LAKE MICMAC FINAL REPORT
Recommendations to Mitigate Loading April 11, 2019
File: 121415826 6.2
6.1.3 On-going Monitoring
On-going monitoring provides a method to measure the success of implemented mitigation measures while keeping record of water quality within the lake system. The following monitoring activities are recommended to be carried out on an on-going basis within the lake systems:
1) The extension of in-lake P monitoring at deep lake locations through the vegetation die-off period. This is recommended to capture any increase in lake P concentrations and associated trophic status caused by a release of P from vegetation decay. If carried out after seasonal lake turnover, this data can also capture any increase in P concentration from the lake anoxic zone.
2) The continuation of profiling and surface and lake bottom sampling at deep-water lake locations. This will allow for the monitoring of P release from benthic sediments, through the identification of anoxic zones at lake bottom and surface and lake bottom concentration comparison.
3) The continuation of flow monitoring and grab sampling at select monitoring locations to track loading reductions as a result of mitigation measures. Suggested locations would be watercourse locations where stormwater treatment BMPs are being implemented, or headwall locations where roadway maintenance is being implemented.
6.2 E.COLI LOADING MITIGATION
6.2.1 Infrastructure-Based Mitigation
Fecal source identification is helpful in identifying changes to infrastructure that may aid in the reduction of E.coli loading to recreational water bodies. Of specific interest are various locations where human genetic markers have been identified in the lake systems, as well as a bridge structure at the outlet of Lake Micmac thought to be associated with the detection of avian markers. The following mitigation measures are recommended to reduce infrastructure-associated E.coli loading:
1) The identification of domestic wastewater sources contributing to human marker detection within the lake system. It is concluded that the likely source of human genetic markers within the lake systems is domestic wastewater, either from leaking pipework or stormwater network cross-connections. The completion of wastewater collection system inspections should be carried out to pinpoint the source. Based on the occurrence of high bacteria events in conjunction with human genetic marker detection, the focus should be on wastewater collection systems in the vicinity of Outfall 8 and Watercourses 2 and 6.
2) The installation of bird-deterrents on the bridge located at the Lake Micmac outlet (Waterfowl 1) is recommended. This bridge is a known congregation area for birds and sampling has shown recurring high bacteria events at this location associated with a strong presence of avian genetic markers.

POLLUTION SOURCE CONTROL STUDY FOR LAKE BANOOK & LAKE MICMAC FINAL REPORT
Recommendations to Mitigate Loading April 11, 2019
File: 121415826 6.3
6.2.2 Public Education
Public education efforts are expected to be most effective regarding E.coli loading to the lake systems as bacteria loading has a direct and potentially serious implication to human health, it affects the use of recreational water bodies, and public involvement with mitigation measures is expected to be more possible than with P loading sources. The following public education items are recommended as a result of study findings:
1) Increased public education on the need to pick-up droppings from domestic dogs. Canine markers were identified at numerous sample locations, with several hits near public beaches and an off-leash dog park. Increased awareness of the requirement to remove pet waste from public beaches, walkways, recreational and forested areas may aid in the reduction of canine marker detection.
2) Increased public education of the risk of swimming in areas where wildlife congregates. Ruminant and avian markers were detected at several locations with the lake systems, with some detections associated with high bacteria events. As these species are wild, control of these sources is difficult. Public risk awareness is needed to mitigate risk to human health from these sources.
3) Continuation of public education with respect to public beach closures. Regardless of the source of bacteria loadings, high bacteria events represent a risk to public health when they occur in areas used for recreational purposes.
6.2.3 On-going Monitoring
To further aid in the identification of infrastructure upgrade needs, further monitoring is recommended as follows:
1) The completion of MST sampling at HDW locations during storm events. During the assessment of HDW locations, E. coli was detected at all outfalls having flow at the time of sampling. While fecal bacteria is commonly present in stormwater from overland runoff and animal sources, the use of MST for fecal source identification at the sampled HDW sites could flag HDW locations that may be impacted by human waste. Sample location HDW9311 reported the highest measured concentration of E.coli during monitoring, whereas sample location HDW8714 reported the highest loading.
6.3 ADDITIONAL POLLUTANT MITIGATION
Through the analysis of general surface water quality, it was noted that copper and chloride concentrations within both lakes exceeded the CCME FAL guideline values. Both are common stormwater pollutants found in urbanized watersheds and may be mitigated through road-salt reduction strategies (chloride) and implementation of stormwater treatment BMPS (both chloride and copper). Continuation of monitoring for both parameters is recommended to assess changes in concentrations over time.
POLLUTION SOURCE CONTROL STUDY FOR LAKE BANOOK & LAKE MICMAC FINAL REPORT
Conclusions April 11, 2019
File: 121415826 7.1
7.0 CONCLUSIONS
Lake Micmac and Lake Banook are valued recreational water bodies, used by the community for boating, swimming, fishing and as a means to interact and enjoy the natural environment. These lakes are situated within a highly urbanized watershed which presents challenges to their water quality and has a direct effect on the use of the lake system.
Increased P loading to these water bodies is a direct result of urbanization of the areas surrounding the lake and has the potential to increase vegetation growth within the lakes. Water sampling results show satisfactory P concentrations in-lake at the time of sampling. Current vegetation removal activities within Lake Banook may have contributed to lower P concentration within the lake system. Recommendations are made to further reduce P loading to the lakes to curb vegetation growth and maintain the recreational function of the lake system.
Potential impact on human health has also been identified by observing elevated concentrations of E.coli in the lakes. Elevated E.coli concentrations have been attributed to human, avian, canine and ruminant sources through the use of microbial source tracking. Recommendations have been made to mitigate human or human-controlled bacteria sources (human, canine and select avian sources) and to limit recreational use in areas where bacteria sources are outside of human control (avian and ruminant sources).

POLLUTION SOURCE CONTROL STUDY FOR LAKE BANOOK & LAKE MICMAC FINAL REPORT
References April 11, 2019
File: 121415826 8.1
8.0 REFERENCES
AECOM. 2013. Shubenacadie Lakes Subwatershed Study – Final Report. Prepared for Halifax Regional Municipality. Project Number 60221657. April 2013.
Baker-Austin, C., Rangdale, R., Lowther, J., Lees, D.N. 2010. Application of mitochondrial DNA analysis for microbial source tracking purposes in shellfish harvesting waters. Water Science and Technology, 61(1), 1-7.
Ballesté, E., Bonjoch, X., Belanche, L.A., Blanch, A.R. 2010. Molecular indicators used in the development of predictive models for microbial source tracking. Applied and Environmental Microbiology, 76(6), 1789-1795.
Bonjoch, X., Ballesté, E., Blanch, A.R. 2004. Multiplex PCR with 16s rRNA gene-target primers of Bifidobacterium spp. to identify sources of fecal contamination. Applied and Environmental Microbiology, 3171-3175.
Burnhart, M., Bannerman, R., Owens, D., Hornewer, N. nd. Sources of Bacteria in Wisconsin Stormwater. Wisconsin Department of Natural Resources. Available online at: http://cws.msu.edu/documents/SourcesofBacteriainWIStormwater.pdf
Brylinsky, M. 2004. User’s Manual for Prediction of Phosphorus Concentration In Nova Scotia Lakes: A Tool for Decision Making. Prepared for The Nova Scotia Water Quality Objectives and Model Development Steering Committee. Nova Scotia Department of Environment and Labour. Version 1.0. January 2004.
CH2M HILL. 1993. Urban Stormwater Pollutant Event Mean Concentrations (EMCs) and Annual Runoff Coefficients for Calculation of Annual Pollutant Loads - Task F1 - “Pollutant Loadings”, DERM Stormwater Management Master Plan, Phase I (C-9 East Basin Study). Prepared for the Metropolitan Dade County Department of Environmental Resources Management, Miami, FL.
Dufour, A., Bartram, J., Bos, R. and Gannon, V. (Eds.) 2012. Animal Waste, Water Quality and Human Health. World Health Organization.
Dugan, H.A. et al. 2017. Long-term Chloride Concentrations in North American and European Freshwater Lakes. Scientific Data. Available online at: https://www.ncbi.nlm.nih.gov/pmc/articles/PMC5548073/
Kortbaoui, R., Locas, A., Imbeau, M., Payment, P., Villemur, R. 2009. Universal mitochondrial PCR combined with species-specific dot-blot assay as a source-tracking method of human, bovine, chicken, ovine, and procine in fecal-contaminated source-water. Water Research, 43(7), 2002-2010.

POLLUTION SOURCE CONTROL STUDY FOR LAKE BANOOK & LAKE MICMAC FINAL REPORT
References April 11, 2019
File: 121415826 8.2
Lee, D.Y., Weir, S.C., Lee, H., Trevors, J.T. 2010. Quantitative identification of fecal water pollution sources by TaqMan real-time PCR assays using Bacteroidales 16s rRNA genetic markers. Applied Microbiology and Biotechnology, 88, 1373-1383.
Maine Department of Environmental Protection. 2000 (MDEP). Report No. DEPLW-112, Final Lakes TDML Report. Maine Department of Environmental Protection, Lakes Assessment Division, Augusta, Maine.
Makepeace, D., Smith, D. and Stanley, S. 1995. Urban Stormwater Quality: Summary of Contaminant Data. Critical Reviews in Environmental Science and Technology, 25(2): 93-139.
Marsalek, J. and Rochfort, Q. 2004. Urban Wet-Weather Flows: Sources of fecal contamination impacting on recreational waters and threatening drinking-water sources. Journal of Toxicology and Environmental Health, Part A: Current Issues, 67 (20-22): 1765-1777.
McCuen, R.H. 1998. Hydrologic Analysis and Design. Prentice-Hall, Inc.
McDonald, M., Truelstrip-Hansen, L., and Jamieson, R. 2016. Assessing Sources of Fecal Contamination and Pathogen Presence at Four Freshwater Beaches in the Halifax Regional Municipality. Prepared for Halifax Regional Municipality. Centre for Water Resources Studies, Dalhousie. March 2016.
Penakalapati, G., Swarthout, J., Delahoy, M.J., McAliley, L., Wodnik, B., Levy, K., and M.C. Freeman. 2017. Exposure to Animal Feces and Human Health: A Systematic Review and Proposed Research Priorities. Environmental Science & Technology. 51 (20): 11537-11552.
Pitt, R. and J. McLean. 1986. Toronto Area Watershed Management Strategy Study. Humber River Pilot Watershed Project. Ontario Ministry of the Environment. Toronto, Ontario.
Ravaliya, K., Gentry-Shields, J., Garcia, S. Heredia, N., Fabiszewski de Aceituno, A., Bartz, F.E., Leon, J.S. and L.A. Jaykus. 2014. Applied Environmental Microbiology.80(2): 612–617. Available online at: https://www.ncbi.nlm.nih.gov/pmc/articles/PMC3911084/
Reckhow, K.H., M.W. Beaulac and J.T. Simpson. 1980. Modeling phosphorus loading and lake response under uncertainty: A manual and compilation of export coefficients. U.S. Environmental. Protection Agency, EPA 440/5-80-011.
Savichtcheva, O., Okayama, N., Okabe, S. 2007. Relationships between Bacteroides 16s rRNA genetic markers and presence of bacterial enteric pathogens and conventional fecal indicators. Water Research, 41(16), 3615-3628.
Stantec. 2012. Analysis of Regional Centre Lakes Water Quality Data (2006 – 2011). Prepared for Halifax Regional Municipality. File: 121510918. October 2012.
Stantec Consulting Ltd. 2014. Assessment of Aquatic Vegetation Overgrowth in Lake Banook. Development of Mitigation Alternatives. 42 pp.
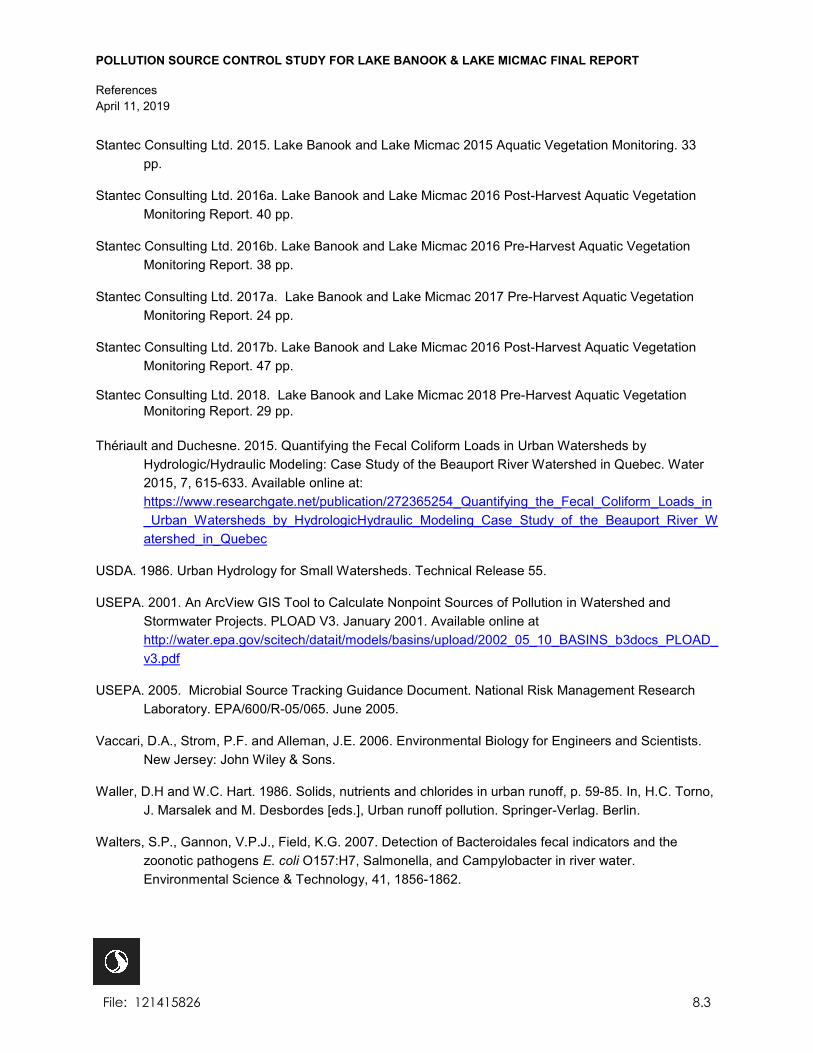
POLLUTION SOURCE CONTROL STUDY FOR LAKE BANOOK & LAKE MICMAC FINAL REPORT
References April 11, 2019
File: 121415826 8.3
Stantec Consulting Ltd. 2015. Lake Banook and Lake Micmac 2015 Aquatic Vegetation Monitoring. 33 pp.
Stantec Consulting Ltd. 2016a. Lake Banook and Lake Micmac 2016 Post-Harvest Aquatic Vegetation Monitoring Report. 40 pp.
Stantec Consulting Ltd. 2016b. Lake Banook and Lake Micmac 2016 Pre-Harvest Aquatic Vegetation Monitoring Report. 38 pp.
Stantec Consulting Ltd. 2017a. Lake Banook and Lake Micmac 2017 Pre-Harvest Aquatic Vegetation Monitoring Report. 24 pp.
Stantec Consulting Ltd. 2017b. Lake Banook and Lake Micmac 2016 Post-Harvest Aquatic Vegetation Monitoring Report. 47 pp.
Stantec Consulting Ltd. 2018. Lake Banook and Lake Micmac 2018 Pre-Harvest Aquatic Vegetation Monitoring Report. 29 pp.
Thériault and Duchesne. 2015. Quantifying the Fecal Coliform Loads in Urban Watersheds by Hydrologic/Hydraulic Modeling: Case Study of the Beauport River Watershed in Quebec. Water 2015, 7, 615-633. Available online at: https://www.researchgate.net/publication/272365254_Quantifying_the_Fecal_Coliform_Loads_in_Urban_Watersheds_by_HydrologicHydraulic_Modeling_Case_Study_of_the_Beauport_River_Watershed_in_Quebec
USDA. 1986. Urban Hydrology for Small Watersheds. Technical Release 55.
USEPA. 2001. An ArcView GIS Tool to Calculate Nonpoint Sources of Pollution in Watershed and Stormwater Projects. PLOAD V3. January 2001. Available online at http://water.epa.gov/scitech/datait/models/basins/upload/2002_05_10_BASINS_b3docs_PLOAD_v3.pdf
USEPA. 2005. Microbial Source Tracking Guidance Document. National Risk Management Research Laboratory. EPA/600/R-05/065. June 2005.
Vaccari, D.A., Strom, P.F. and Alleman, J.E. 2006. Environmental Biology for Engineers and Scientists. New Jersey: John Wiley & Sons.
Waller, D.H and W.C. Hart. 1986. Solids, nutrients and chlorides in urban runoff, p. 59-85. In, H.C. Torno, J. Marsalek and M. Desbordes [eds.], Urban runoff pollution. Springer-Verlag. Berlin.
Walters, S.P., Gannon, V.P.J., Field, K.G. 2007. Detection of Bacteroidales fecal indicators and the zoonotic pathogens E. coli O157:H7, Salmonella, and Campylobacter in river water. Environmental Science & Technology, 41, 1856-1862.

APPENDIX A Maps
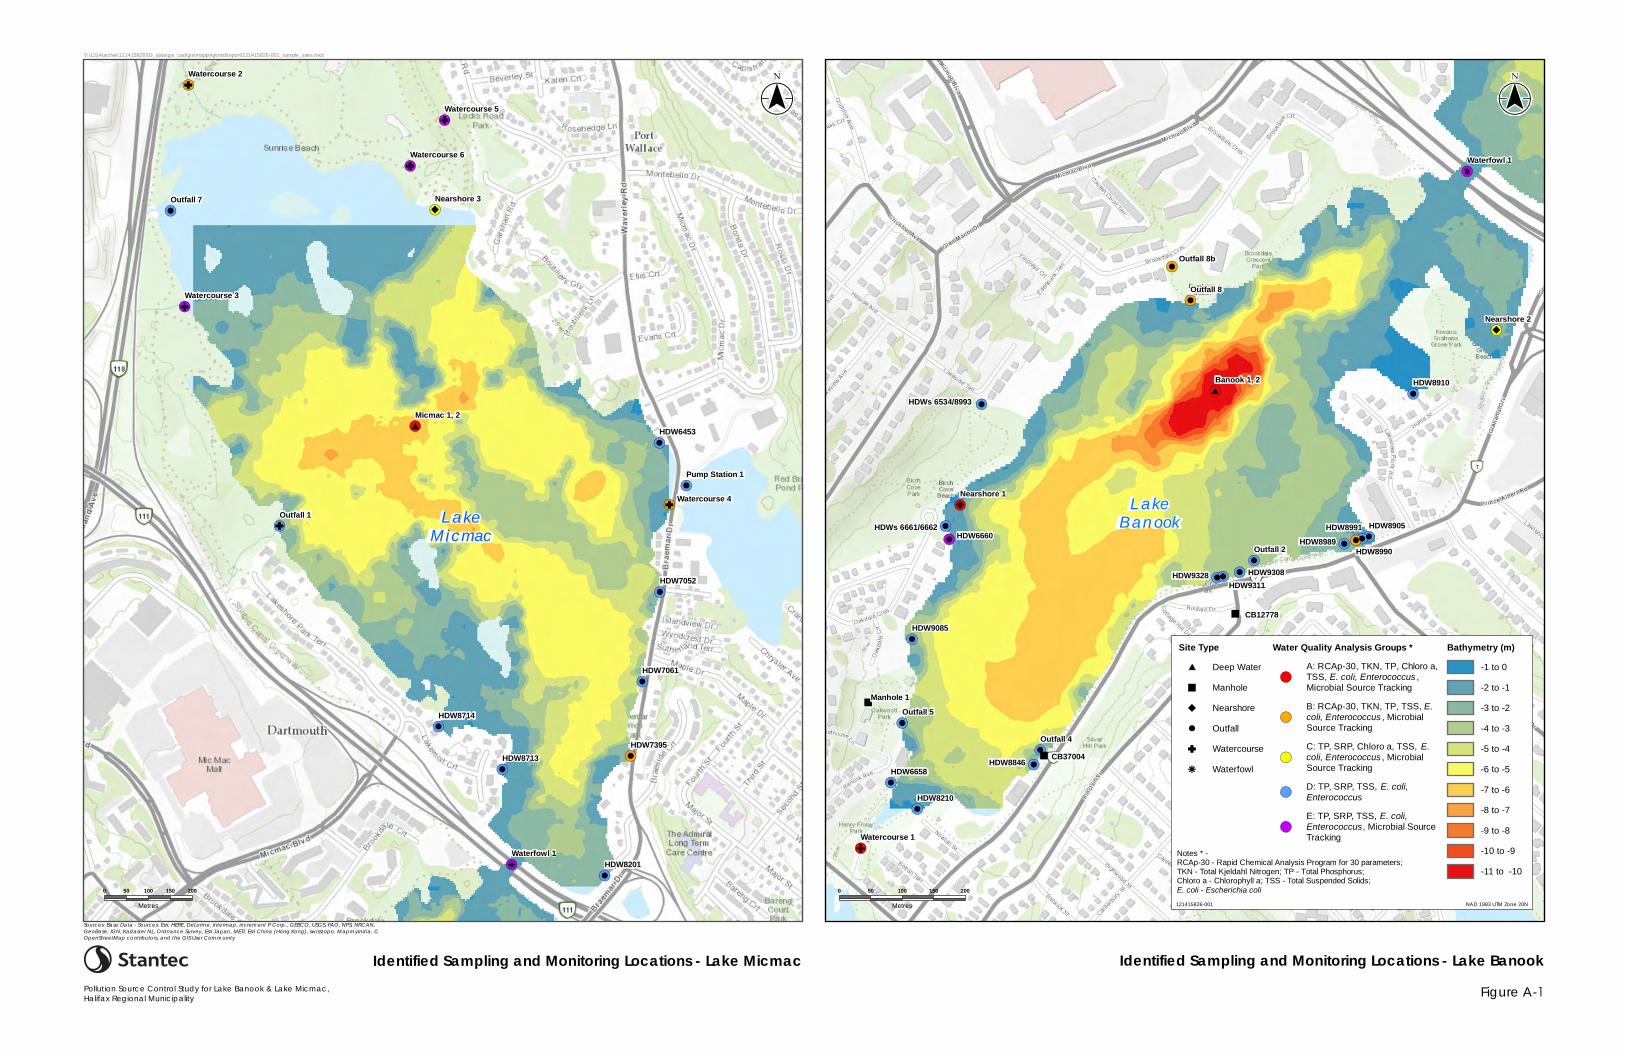
!
!
!
!
!
!
!
!
!
!
!!
!
!
(
(
(
(
(
(
(
(
( (
(
(
(
(
!(
!
!
!
!
(
(
(
(
#*
!
!
!
!
!
!
!
!
GF
GF
GF
k
")!
GF
GF
GF
LakeMicmac
Micmac 1, 2
Pump Station 1
HDW6453
HDW7052
HDW7061
HDW7395
HDW8201
HDW8713
HDW8714
Outfall 1
Watercourse 3
Watercourse 4
Waterfowl 1
Nearshore 3Outfall 7
Watercourse 6
Watercourse 2
Watercourse 5
Figure A-1Pollution Source Control Study for Lake Banook & Lake Micmac,Halifax Regional Municipality
Identified Sampling and Monitoring Locations - Lake Banook
V:\1214\active\121415826\03_data\gis_cad\gis\mapping\mxd\report\121415826-001_sample_sites.mxd
!(
!(
!(
!(
!(!(!(
!(!( !(
!(
!(
!(
!(
!(
!(
!(!(
!(
!(
!(
!(
!(
!(
!(
#*
")
")
!
!!!
!!!
!
!
!
!
GF
k
!
!
!
")
!")
!
")
!
!
!
!
LakeBan ook
Outfall 8b
Banook 1, 2
Nearshore 1
Nearshore 2
HDW8910
HDW8905HDW8991
HDW8990
HDW9328HDW9311
HDW9308
HDW8846
HDW8210
HDW6658
Outfall 8
Watercourse 1
Waterfowl 1
HDW6660HDWs 6661/6662
HDWs 6534/8993
Outfall 2
CB12778
Outfall 4CB37004
Outfall 5Manhole 1
HDW8989
HDW9085
Identified Sampling and Monitoring Locations - Lake Micmac
Sources: Base Data - Sources: Esri, HERE, DeLorme, Intermap, increment P Corp., GEBCO, USGS, FAO, NPS, NRCAN,GeoBase, IGN, Kadaster NL, Ordnance Survey, Esri Japan, METI, Esri China (Hong Kong), swisstopo, MapmyIndia, ©OpenStreetMap contributors, and the GIS User Community
NAD 1983 UTM Zone 20N
Site Type#* Deep Water") Manhole") Nearshore! OutfallGF Watercoursek Waterfowl
Water Quality Analysis Groups *
!(A: RCAp-30, TKN, TP, Chloro a,TSS, E. coli, Enterococcus ,Microbial Source Tracking
!(B: RCAp-30, TKN, TP, TSS, E.coli, Enterococcus , MicrobialSource Tracking
!(C: TP, SRP, Chloro a, TSS, E.coli, Enterococcus , MicrobialSource Tracking
!(D: TP, SRP, TSS, E. coli,Enterococcus
!(E: TP, SRP, TSS, E. coli,Enterococcus, Microbial SourceTracking
Bathymetry (m)-1 to 0-2 to -1-3 to -2-4 to -3-5 to -4-6 to -5-7 to -6-8 to -7-9 to -8-10 to -9-11 to -10
121415826-001
Primary Thematic Date/Revision AND/OR Notes
0 50 100 150 200
Metres0 50 100 150 200
Metres
($$¯($$¯
Notes * -RCAp-30 - Rapid Chemical Analysis Program for 30 parameters;TKN - Total Kjeldahl Nitrogen; TP - Total Phosphorus; Chloro a - Chlorophyll a; TSS - Total Suspended Solids; E. coli - Escherichia coli
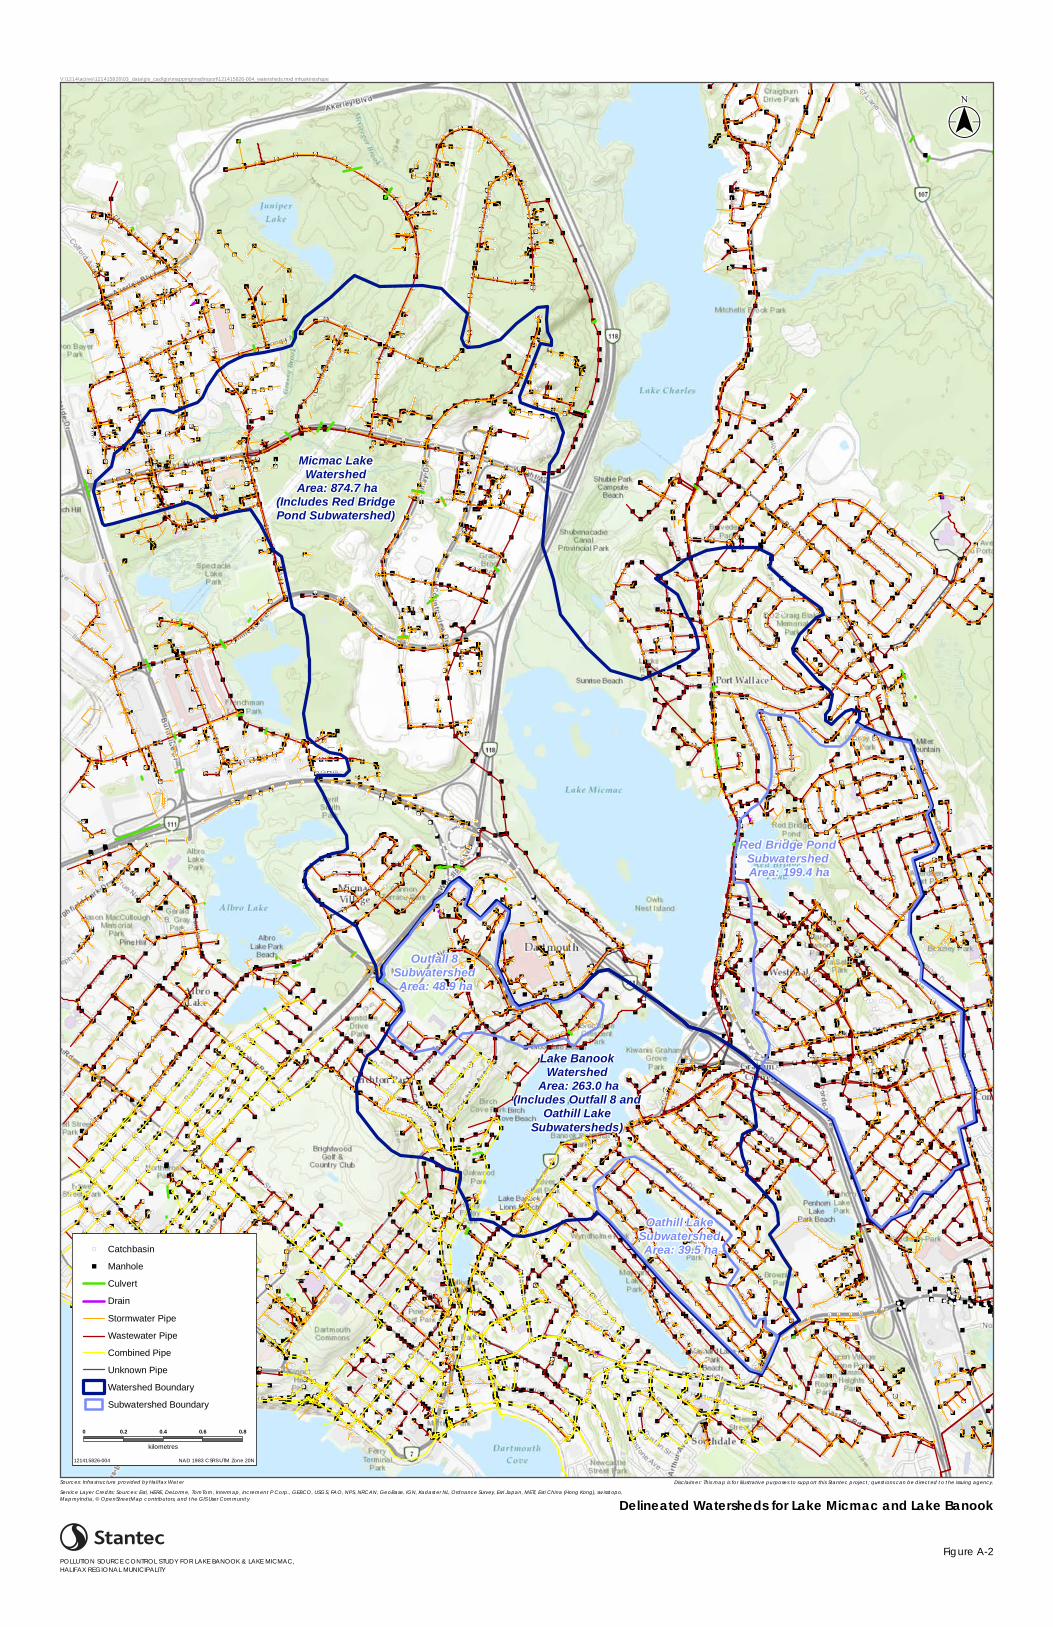
"
"
""
"
"
""
"""
""
""
"
"
"""
"
"
"
" ""
"
"" "
"
""
" " "
"
""
"
"
"
"
"
"
"
"
"
""""
"
"
""
"
"
"
"
"
""
"
"
"
"
""
"
"
""
"
"
"
""
"
"
""
""
" "
""
"
"
""""
" ""
"
"
"
"
"
"
"
"
"
"
"
"
"
"
"
"" "
" ""
"
"
"
"
"
"
""
"
""
"""
"
"
"""
"
" ""
"
"
"
"
"
"""
""
"
"
"
"
"""
" "
"
"
"
"
"
" "
"""
"
"
"
"
"
""""""
"
"""
"
"
"
"
"
""
"
"
"
"
"
"
"
"""
""
"
"
"
"
"
""
"
""
"
"
"
"
"
"
""
"
"
"
"
" "
"
"
"
"
"
"
"
""
"
"""
"" " "
""
""""
"
""
"
"
"
"
"
"
"
"
"
"
"
""" "
"
""""
""""" """
" """
" ""
"""
"
"
"
"
""
""
"
"
"
"
"
"
"
""
"
"
""
"
"
""
""
"
"
"
"
"
"
"
"
"
""
"
"
"
""
""
"
"
""
"
""
"
"
"""""
""""
""
"
"
"
"
""
"
""""""""
""""""" " "
""
"
" ""
"
""""
"
""
"""
"
""
"
""
"
"
"
"
"""""""
"
""""
"""
" ""
""" """
"
"
"""
"
"
"""
"
"
"
"
""
"""
"
"""
"
""""
"
""
""
"
"
"
"
""
"
"
"
""
""
"""
"
"""""
""
"
"
"
"
"
"""
"
"
"
"
"
"
""
" """
"
"
"
""
""
""
""
"
"
"""
" "
"
"
"
"
" ""
""
"
"
""
"
"
"
"
"
"
"
"""
""
"
""
"
" "
"
"" """
"""
""
"
"
"
"
"
"
"
"
"""
"
"
"
"
"
"
"
"
"
""
""
"
"
"
"
"
"
"
"
"
"
"
"
"
"
"
"
"
""""""
""
""
"" """"
""
""
""
""
"
"
"
"
""
"
"
"
"
"
"
"
"
"
"
" "
"
""
"
"
"
"
"
"
"
"""" "
""
" """"
" "
"
"
"" "
"
"
"
"
"
"
"
""
"
""
"
"
"
""""" "" " """"
" " """
""" " """ "" " "
" "" ""
""
"
" "" "
"
"
""
"
""
"""
""
"
"
""
"""
""
"
"
"
"
"
"
"
"
"
"
"
"
"
""
"
""
"
""
"
"
"
"
""
"
""
"
" ""
"
"
"
"
"
""
"
""
"
""
"
"
"
"
""
""
""
"
"
""
"
""
""
"
""
"
"
"
"
"
"
"""
"
"
""
"
"
""
"
"""
"""
""
"
"
"
"
" """
""
"
"
"
"
"
"
"
"
""
"
"
""
"
"
"
"
"
"
"
"
""
"
"
""
"""
"""""
"""
"
""
""
"
"
"
"
""
"
""
""
"
"
"
" """
"
""
"
"
""" "" "
"
"
""
"""
"
""
""
"
"
"
"
"
"
""""
"
"
""
"
"
"
"
"
"
"
"
"
"
"
""
""
" ""
""
"
"
"
"
"
""
"
"
"
"
"
"" "
"
"
"
"
"
"
""
""
"
"
"
""
""
"
"
"
"
"
"
"""
"
"
"
"
"
"
"
"
"
"
"
"
"
"
"
"
" ""
"" "
"
"
""
" "
"
"
"
"
"
"
"
"
"
"
"
"
""
"
"
"
"
"
"
""
"""
"
"""" ""
"
"
"""""
"
""""
"
""
"
"
"
"
"
"
"""
"""
""" "
" " "
""
"
"
"
"
"
"
"
""
"
""
"
""
""
""
"
"
"
"
"
"
"
"
"
"
"
"
"
"
""
"
"
"""""
"
"
"
""""
"" "
""
"
"
""
"
"
"
"
"""""
"
"" """
"
"
""""
" "" "
"
""
"
"
"
""
"""
""
"
"
"
""
""" " "
"
""
""
"
"
"
"
"
"
"
" "
"
"
"
"
"
"
"
"
"
"
"
"
""
"
""""
""
"
"
"
""
"
"
"
"
"
"
"
"""
""
"
"
"
"
""
" """"
" """""
"
"
"
"
"
" "
"
"
"
""
" """"
"""
"""" ""
"
"
"
""" "
"
""
""
""
""
""
"
"
"
"
"
"
""" "" " """ ""
"
""
"
"
"""" """
"
"""
""""
" """""
"
""
"
"
"
"
""" "
"
"
""
"
"
"
"
""
"
"""
""
""
"
"
"
"
"
"
""
""
" "
"
"" " "
"
"
"
"
"
"
"
"
"
""
"
"
""
"
"
"
"
"
"""
"
"""" "" """" "" "
" """ """ "
"
""
"
"
"
"
"
"
"
"
"
"
""
""
"
"
""
"
"
"
""
"
""
"""
"
"
""
"
"
""
"
"
"
"
"""
"
"
"
"
"
"
"
"
"
"
"
"
""
"
"
"
""
"
" "
"
"
"
" "" " "
"
"
"
"
"" "" "" " "" ""
"
"
""
"
" "
"
""
"
"
"
"
"
"
""
""
""
" """ "" ""
"
"
"
"
"
"
""
"
"""
""""" ""
"
"
"
"
"
"
"
"
"
"
"
"""
"
"
"
" """
""
"
"
"
""
"
""
"
"
""
"""
"" "
"
"
"
""""
"""
""
"
"
"
"
"
"
"
"
"
"
"
"
""
"""
"
"
"
"""" "
""" "
""
"
"
"
"
" """ "
""
"
"
""" ""
" "
""
"" ""
"" ""
" """
"""
"
"
"
"
"
"
"
"
"
"
"
"
"
"
"
"
""
"
"
""
"
"
"
"
"
"
"
"
" """"
"""
""
"
"
"
"
"
"
"
"
"
"
" "
"
"
"
"
"
"
"
"
"
"
"
"
"
"
"
"
""
"
"
"
"
"
"
"
"
"
"
"
"
"
"
"
"
"
"
"
"
"
"
""
"
"
"
"
"
"
"
"
"
"
"
"
"
"
"
"
"
"
"
"
"
"
"
"
"
"
" "
""
"
"
"
"
"
"
"
"
"
"
"
"
"
"
"
"
"
"
"
"
"
"
"
"
"
"
"
""
"
"
"
"
"
" "
"
"
"""
""
"
"
"
"
"
"
"
"
"
"
"
" "
"
"
"
"
"
""
"
"
"""""""
"
"
"
"
""
"
"
"
"
"
"
"
"
"
"
"
"
"
"
"
"
"
"
""
"
"
"
"
"
"
""
"
"
"
"
"
"
"
"
"
"
"
"
""
"
"
" "
"
"
"
"
""
"
""
"
"
"
"
"
"
"
"
"
" "
"
"
"
"
"
"
""
"
"
"
"
"
"
"
"
"
"
"
"
""
"
"
"
"
"
"
"
""
"
"
"
"
"
"
"
"
" "" "" "
""
" """ "
"
""" "" """ """" """""
""
"
"
" "
"
" " " " "
"
"" " "" "" """""""
"""
""""" "" """
"" """ ""
"
""
""
" ""
" "" "
" """""
""
""""""
" "" "" ""
"
"""
"
""
""""" """" "
"
""
"
"
"""
"
""
""" ""
"
"
"
"
"
""
""
""
"
"
"
"
"
" ""
"
"
"
"
"
"
"
"
"
""
"
"
"
""
"
""
"
"
"
"
"""
"
" "" " " "
"
"
""
"
"
"
"
"
""" """""""" """
""
""
"
""
"
"
"
"
"
"
"
"
"""
" """"
"
"""" "" """ " "
""
"" """"""" "" "
"
"
"
"""" " " "
"
"
""""
"
"
"
"""
"
"
"
"
""
"
"
"
"
"
"
"
"
"
"
"
""
"
"
"
""
""
"
"
"
"
"
"
"
"
"
"
"
"
"
"
"
"
"""
"
"
"
""
"
"
"
"
"
"
""" """
"
""
"
"
"
"
"
"""
"
"
"
""
"
""
"
"
"
"
"
"
"
"""
""
"
"
"
"
"
"
"
"
""""
"""
"
"
"
"
""""""
"
"
"
""
"
"
"
""
"
"
" "
"
"
"
"
"
"
"
"
"
"
"
"
"
"
"
"
"
"
"
"
"
"
"
""
"""
"
""
"
"
"
"
"
"
"
"
"
"
"
"
"
"
""
"
"
"
"
""
"" "
" "" "
" "
"
"
"
"""
"
"
" """"
" "" """
"
"
"
"
" ""
"
""
"
"""
""""
""""
" "" """"
"""""""" "" """ ""
"
"
""
"
""
"
""
"""""
""""""
"
"
""
""" """"
""""""" ""
"
" "
"" """"
"
""
"
""
"
""
""
"" """
"
"""
"
"" "
"""""""
""
""" " "" ""
"
""
"
"
""
"
"
""
""
"
""
"
"
"
"
"""""
"
""" "
"""" ""
"
"
""
"
"
"
"
"
"
"
"
"
" """"" """"
"
"
"
""
"
"
"
"
""" """""""" "" """"
"
"
"
" ""
"
"
"
""
"
"
"
""
"
"
"
"
" ""
"
""""
""
"
"
""
"
"
""
""
"
"
"
"
"
"
"
"
"
"
"
"
"
"
""
"
"""
"
""
"
"
"
" """ """
"
"
""
"
" ""
""" "" """
"
""
""""
" """""
"
"""
"
""""
""
"
"
""
""
"
"
"
""""" "" "
"""
"
"
"""
""
"
"
"
""
""
"
"""
"
"
"
"
"
"""
" " "" """
""
""" "
"
"""
""
" " "" "
"
"
"
"
"
"" "
"
""
""
"
"
"
" "
"""
" """"" "
"""
" "
"""" "" ""
" ""
""
"
"
"""""
"
"
"
"
""" " " ""
"
"
"
"
"
"
""
""
"
""
"
"
"
"
"
""
""""" "
""" """"
"
""
""
""
" "" "
"
" """ """
"
"
"
"
"
"
"
"
"
" "
"""
"
"
"
""
"
"
"""
"
"
"
""
"" ""
"
" "
"
"
"
"
"
"
"
"
"
"
"
""
"
"
"
"
"
"
""
"
"
"
""
"
"" "
" ""
"
"
"
"
"
""
"
"
""
""
"
"
"
"
""
"
"
"
"
"
""
"
"
"
"
"
"
"
"
"
"
"
"
"
"
"
"
"
"
"
"
"
"
"
"""
"
"
"
"""
"
"
"
"
"
"
"
"
"
"
"
"
"
"
"
"
"
"
"
"
"
"
"
"
"
"
"
"
"
"
"
"
"
"
"
"
"
"
"
"
"
"
"
"
"
"
"
"
"
"
""
"
"
"
"
"
"
"
"
"
"
""
"
"
""
""
"
"
"
""
"
"
"
"
"
""
"
"
"
""""""
""
""
"
"
" ""
"
"
"
"
""
"
"
"
"
"
"
"
"
"
"
"
"
"
"
"
"
"
"
"
"
"
"
"
""
"
"
""
"
"
"
"
"
"
"
"
"
""
" "
"
"
"
"""
""
"""
"" "
""
"
"
"
"""""
"
""
"
"
"
"
"
"
"
"
"
"
"
""
"
"
"
"
"
"
"
"
"
"
"
"
"
"
"
"
"
"
""" "
"""
"
""
"
"
"
"
"
"
"
"
"
"
"
"
"
"
"
"
"
"
"
"
"
"
"
"
"
"
"
"
"
"
"
"
"
"
"
"
""
""
"
"
"
""
"
"
"
"
"
"
"
"
"
"
"
"
"
"
""
"
"
"
"
"
"
"
"
"
""
"
"
"
"
"
"
"
"
"
"
""
""
""
""
"
"
"
""
"
"
"
""
"
"
"
"
"
"
"
"
""
"
"
"
""""
""""""
"
"
"
"
"
"
""
"
"
"
"
"
"
"
"
""
"
" ""
"
"
"
"
"
"
"
"
"
"
"
"
"
"
"
"
"
"
"
"
"
"
"
"
""
"
"
"
"
"
"
"
"
"
"
"
"
"
"
"
"""""
""
"
"
""
"
"
"
"
"
" "
"
"" "
"
"
"
"
"
"
"
"
""
"
"
"
"
"
"
"
"
"
"
"
"
"
"
"
"""
""
"
"
"
"
"
"
""""""""
"
"
"
"
""
""
"
"
"
"
""
""
"
"
"
"
"
"
"""
"
"
"
"
"
"
"
"
"
"
"
"
"
"
"
"
""
""
"
""
"
"
""
"
"
"" "
"""
"
"
"
""
""
"
"
"
""
"
"""
"
"
"
"
"
"
"
"
"
"
"
"
"
"
"
"
"
"
"
"
"
"
"
"
""
"
"
""
"
"
"
"
"
""
"
"
""
"
"
"
"
"
"
"
"
"
"
"
"
"
"
"
"
"
"
"
"
"
"
"
"
"
"
"
"
"
"
"
""
"
"
"
"
"
"
"
"
"
"
"
"
"
"" "
"
"
"
"
"
"
"
"
"
"
"
"
"
"
"
"
"
"
"
"
"
"
"
"
"
"
"
"
"
"
"
"
" "
"
"
"
"
"
"
"
"
"
"""
"
"
"
"
"
"
""
"
"
"
"
"
"
"
"
""
"
"
"
"
"
"
"
"
"
"
""
"
"
"
"
""
"
"
"
"
"
"
"
"
"
"
"
"
"""""
"
"
"
"
"
"
"
""
"" "
""
"
""" """ """ "" " """" " "
"
"
"
"
"
"
""
"
""
""
"
"
"
" "" ""
"
"
"
"
"
"
"
"
"
"
"
"
"
"
"
""
"
"
"
"
"
"
"
""
"
" "
"
"
"
"
"
"
"
"
"
"
"
"
"
"
"
"
"
"
"
"
"
"
"
"
"
"
"
"
"
"
"
"
"
"
"
"
"
"
"
"
"
"
"
"
"
"
"
"
"
"
"
"
"
"
"
"
"
""
"
"
"
"
"
"
"
"
"
"
""
"
"
"""
"
"
"
"
"
""
"
"
"
"
"
"
"
"
"
"
"
"
"
"
"
"" ""
"
""
"" """
"
"
"
"
"
"
"""
""
""
"
"
"
"
"
"
"
"
"
""" ""
"
"
"
"
"
"
"
"
"
"
"
"
"
"
"
"
"
"
"
"
"
"
"
"
"
"
"
"""
"
"
"
"
"
"
"
"
"
"
"
"
""
"
"
"
"
""
"
"" " "" ""
"
"""""
" " ""
"" """ "
"
"
"
"
"
"
"
"
"
"
"
"
"
"
"
"
"
"
"
"""
"
"
""
"
"
""
"
"
"
"
"
"
"
"
"
"
"
""
"""
"
""
""
"
"
"
"
"
"
"
"
"
"
"
"
"
"
"
"
"
"
"
"
"
"
"
"
"""
"
"
"
"
"
"
"
"
"
"
"
"""""
"
" """ ""
""
"
"
"
"
"
"
"
"
"
"
"
"
"
"
"
"
"
"
"
"
"
"""" """ """
""
""
""
" " "
"""
" ""
"
""
"
"
"
"
"
"
"
"
"
"
"
"
"
"
"
"
"
"
""
"
"
"
"
"
"
"
"
"
"
"
"
"
"
""
""
"
""
""
" "
"
"
""
"
"
" ""
"
"
"
"
"
"
"
"
"
"
""
"
"
"
"
"
"
"
"
"
""
"
""""""
"
"
"
"
"" " "
""""
"
"
"
""
"""
""
"
""
"
"""
"
"
"
""""
""
"
""
" """
"
"
"
"""
"
"
"
"
"
"""
"
""
"
"
" ""
""""" "" "" "
" ""
""
""
"
"
"
"
"
"
" " ""
"
"
"
"""
"
"
"
"
"
"
"
""
"
"
"
"" ""
"
"
"
"
""
""
"
""
"""
"
"
""
"
"
"
"
"
"
"
"
"
"
"
"
"
"
"
""
"
"
"
""
"
""
"
""
"
"
"
""
"
"
"
""
"
"""
" ""
"""
""
"
"""
"
"
""
"
" "
"
"
"
"
"
"
"
"
"
""
""
"
"
"
"
""
"
"
"
"
"
"
"
"
"
"""
"
"" "
"
""
"
"
"
"
"
"
"
"
"
"
"
"
"
"
"
"
"
"
"
"
"""
"
"
"
"
"
""
"
"""
"
"
"
"
" ""
" """
"
"""
"
"
"
"
"
"
"
"
"
"
"
"
"
"
"
"
"
"
"
"
"
"""
""
""""
"
"
"
"
"
"
"
"
"
"
"
"
"
"
"
"
"
"
"
"
"
"
"
"
"
"
"
"
""
""
"
""
"
"
"
"
"
"
"
"""
"
"""""""
""""
"
""
""
"
"
"
"
""
"
""
"
"
"
"
"
"
"
"
"
"
"
"
"
"
" """ ""
"
"
"
""
"
"
"
"
"
"
"
"
"
"
"
""
"
"
"
""
"
" "
"
"""
" "
"
""
"
" "" """""
"
"
"
"
"
"
"
"
"
"
"
"
"
"
"
"
"
"" ""
"
""
"
"
"
"
"
"
"
"
"
"
"
"
"
"
"
"
"
"
""
""
"
"
"
"
"
"
"
" "
"
""
"
"
"" "
"
"""
"
"
"
"
"
"
"
"""
" "" " """"" """ "
"
"
"
"
"
""
"
"
"
"
"""
"
"
"
""
"
"
"""
""
"
""" " """ """ """ " "
"
"
"
"
"
"
"
"
"
"
"
""
"" "
"
"
"
"""
"""" """ " "" "
"
"
"
""
"
"
"
"
"
"
"
"
"
"
""
"" """ "" ""
"""""
"" " ""
" "
"
""""
"
"
""
"
"
"
"
"
"
"
"
"
""
"
" " " """ """ """"
"
"
"
"
"
"
"
"
"
"
""
"
"
"
""
"
"
"
"""
"" """"" "
" "" "" "
"
"
"
"
"
"
""
"
"
"
"
""""
"
""
"
"
"
"
" "" "" " """ """
""
" "" ""
"
" "
"
"
""
"
"
"
"
"
"
""
"
"
""
""
"
"
" """ " """ "
"" """" "" ""
"
"
"
"
"
"
"
"
""
"
"
""
"
"
"
"
"
"
"""
"
"""
"""
""
"
"
"
"
"
"
"
"
"
""
"
""""
"
"
"
"
"
"
"
"
"
"
"
"
"
"
"
"
"
"
" """ "" "
" "
"
"
"
"
"
"
"
"
"
"
"
""
"
"
"
"
"
"
"
"
"
"
""
"
"
"
"
"
"
"
"
"""
""
"
"
"
"" "
""""
"""""
" "
""
""
"
"
"
"
"
"
"
"
"
""
"
"
"
"
"
"
"
"
""
"
"
""
" "
"
" "
"
"
"
""
"
"
""
""
""
""
"" "
"
"
"
"
"
"
"
"
" ""
"
"
"
"
"
"
""
"
"
"
"
"
"
"
"" "
""
"""
"
"""
""
"
"
"
"
"
"
"
"
"
"
""
"
"
"
"
"
""
"
""
"
"
""""
"
"
""
"
""
"
"""
"" "
" " """ """
" """
""
"
""
"
"
"
""""
"
"
"
"
" "
"
"
"
"
"
"
"
"
"
"
"
"
"
"
"
"
"
"
"
"
"
"
""
"
"
""
"
""" """ """ """"
"
"
"
"
"
"
"
"
"
""
"
"
"
""
"
"
"
"
"
"
"
"
"
"
"
""
"
"
""""
"
"
"
"
""
""" """ " "
"" "
"
"
""
"
"
""
""
" ""
"
"
""
"
""
"
"
"
"" "" "" ""
"
"
""
""
""
""
""
""
""
"
"
"""
"
""" "
""" """ """ " " ""
" """" "
"
"
"" ""
" "
"
""""""
" "
""
"""
"
""
" ""
""" """ """"
" """ """ "" "
""
"" " "
" "" " ""
"" """ "
"" "" """" "
" "
"" "" "
"" "" "" """ " " " "
"""
"
"
""
""""""
"
""
"""""""
"
""
"" """ " "
""
"" " ""
" " " ""
" " " """"" " " "" "" " "" ""
""
""
" """ ""
"" " """"
"
"" """ """
" "" "" "
"
"
"
"
"
""
"
"""
"
"
"
"
"
"
"
""
""
"" "" " "
"
"
""
" "
"
""
""
"
"
"
"
"
"
"
" ""
"" " "" " """"""
"
"
"""
"
"
"
"""
""
"
""
"""
"
""
"
""""
"" """ """
"" "
"""" "" ""
" "
""
"
"
"""
""
""
""
"
"
"
""
"
"
""
"
"
"
""
"
"
"
"
"
"
"
"
"
"
"
""
" "
"
"
"
""
"
""
"
"
"
"""
"
"
"
"
"
"
"
""
"""
""
"
""
"
"
"
"
"
"
"
"
"
"
"
"
"
"
"
"
"
"
"
""
"
"
"
"
"
"
""
"
"
""
"
""
"
"
"
" ""
"
""""""
""
"
""
""
""
"
"
"
"""""
"
"
"
"
"
"
"
"
"
""
""
"""""
"
"
"
"
"
" "
"
"
"
""
"
"
"
"
""
"
"
"
"
"
"
"
"
"""
"
"
"
"
"
"
"
"
""
"
"
""
"
"
"
"
"
"
"
"
"
""
"
""
"""
""
"""""
"
"
"
"
"
" "
"
"
"
"
"
"
""
"
""
""
"
"
"
"
"
"
"
"
"
""
"
"
"
"
""
"
""
""
"
"
"
"
"
"
"
""
"
"
"
"
"
"
"
"""
"" " """" " "
" ""
""
" "
"
"
""
"
"
"
"
"
"
"
"
"
"
"
"
"
"
""
"
""
"" "
""
"
""
"
"
"
"""""
"
"""
"
""""
""""
""
"
""
"
"
""""
""
"
"""
"
"
"
""
"""
"" ""
""
"
"""""
""""
"
"
"""
"
"
"
"" "
"""
"
""""
""
""""""
"
"
"
"
""
""""""
"" """ ""
"""
""
""
"""
""
"""""
"""
""""
"
"
"" ""
"""" ""
"
"
"
"""" """""""
"
"
"
"
"
!(!( !(
!(
!(
!(!(
!(
!(
!(
!(
!(
!(
!(
!(
!(
!(
!(
!(
!(
!(
!(
!(
!(
!(
!(
!(
!(
!(
!(
!(
!(
!(
!(
!(
!(
!(
!(
!(
!(
!(
!(
!(
!(
!(
!(
!( !(!(
!(
!(
!(!(!(
!(!(
!(!(
!(
!(
!(
!(
!(
!(!(
!(
!(
!(!(
!(
!(
!(
!(
!(
!(
!(
!(
!(
!(
!(
!(
!(
!(!(
!(
!(
!(
!(
!(
!(
!(
!(
!(
!(
!(
!(
!(!(
!(
!(
!(
!(!(
!(
!(
!(
!(
!(
!(
!(
!(
!( !(
!(
!(
!(
!(
!(
!(
!(
!(
!(
!(
!(
!(
!(
!(
!(
!(
!(
!(!(!(!(!(!(
!(!(
!(
!(
!(
!(
!(
!(
!(!(!(
!(
!(
!(!(
!(
!(!(!(
!(
!(
!(
!(
!(
!(!(
!(
!(
!(
!(!(
!(!(!(!(
!(!( !(!(
!(!(
!(!(!(
!(
!(
!(
!(!( !(!(!(
!(
!(!(!(!(!(!(!(!(
!(!(!(
!(!(
!( !(!(
!(!(
!(!(
!(
!(
!(
!(
!(
!(!(!(
!(
!( !(
!(!( !(!(
!(
!(
!(!(!(!(
!(!(
!(
!(
!(
!(!(
!(!( !(
!(!(!(!(
!(!(!(
!(!(!(
!(
!(
!(
!(!(
!(!(
!(!(
!( !(
!(
!(
!(!(
!(!(!(
!(!(
!(
!(!(
!(!(!(
!(
!(
!(
!(!(
!(!(
!( !(
!(
!( !(
!(
!(
!(!(
!(
!(
!(
!(
!(
!(
!(!(
!(
!(
!(
!(!( !(
!(
!(!(
!(
!( !(!(
!(!(
!(
!(
!(
!(
!(
!(
!(
!(!(
!(
!(
!(
!(
!(
!(
!( !( !(!(!( !(!( !(!(!( !( !(!(
!(
!(
!(
!(
!(
!(
!(!(!(!( !(!( !(
!(
!(
!(!(
!(
!(
!(
!(
!( !(!(
!(
!(!( !(
!(!(!(!( !(!(
!(!(
!(
!(
!(
!(
!(
!(
!(
!(!(!(
!(
!(
!(
!(
!(
!(
!(
!(
!(
!(
!(
!(!(!( !(!(!(!(!(!(
!(!(
!(!(
!(
!(
!(
!(
!(
!(
!(
!(
!(
!(!(!(
!(!(
!(!(
!(
!(
!(
!(
!(
!(
!(!( !(!(!( !(
!(
!(!( !(!( !(!(!(
!( !(!( !( !(!(
!( !(
!(
!(
!(
!(
!(
!(
!(
!(
!(
!(
!(
!(
!(!(
!(!(
!(
!(
!(!(
!(
!(
!(
!(
!(!(
!(
!(
!(
!(
!(
!(
!(!(
!(
!(
!(!(!(
!(!(!(
!(!(
!(!(
!(
!(
!(!(
!(
!(
!(
!( !(
!(!(
!(!(
!(
!(
!(
!(
!(
!(
!(!(
!(
!(
!(
!(
!(
!(
!(
!(
!(!(
!(
!(
!(
!(!(!(!(!(!(
!(!(
!(!(!(
!(!(!(!(
!(
!(
!(
!(!(
!(
!(
!(
!(
!(
!(
!(
!(
!(!(
!(!(
!(
!(
!(
!(
!(
!(!(!(
!(!(
!(
!(!(
!(
!(!(!(
!(
!(
!(!(
!(
!( !(
!( !(!(!(
!(
!(!(
!(
!(
!(!(
!(!(
!(!(
!(!(
!( !(!(!(!(
!(
!(!(
!(!(
!(!(
!( !( !(
!(!(
!(
!(
!(!(
!(
!(
!(
!(!(!( !(!( !( !(!( !(
!(
!(
!(
!(
!(
!(
!(
!(
!(
!(
!(
!(
!(
!(
!(
!(!(
!(
!(
!(
!(
!(
!(
!(
!(
!(
!(
!(
!(
!(
!(
!(
!(
!(
!( !(!(
!(
!(
!(
!(
!(!(
!(
!(
!(
!(
!(
!(
!(
!(
!(
!(
!(
!(
!(
!(
!(
!(
!(
!(
!(
!(
!(
!(
!(
!(
!(
!(
!(
!(
!(
!(
!(
!(
!(
!(
!(
!(
!(
!(
!(
!(
!(
!(
!(
!(
!(
!(!(!(!(!(
!(!(!(!(!(!(!(!(
!(
!(
!(
!(!(
!(
!(
!(
!(
!(
!(!(
!(
!(
!(
!(
!(
!(
!(
!(
!(
!(
!(
!(
!(
!(
!(
!(
!(
!(
!(!(
!(
!(
!(
!(
!(
!(
!(
!(!(
!(
!(
!(
!(
!(
!(
!(
!(
!(
!(
!(
!(
!(
!(
!(
!(
!(
!(
!(
!(!(
!(
!(!(
!(
!(
!(!(
!(
!(!(
!(
!(!(
!(
!(
!(
!(
!(
!(
!(
!(
!(
!(
!(
!(
!(
!(
!(
!(
!(
!( !(!(
!(
!(
!(!(!(
!(
!(
!(
!(
!(
!(
!(
!(
!(
!(
!(
!(
!(
!(
!(
!(
!(
!(
!(
!(
!(
!(
!(
!(
!(
!(
!(
!(
!(
!(
!(
!(
!(
!(
!(
!(
!(
!(
!(
!(
!(
!(
!(
!(!(
!(!(!(
!(
!(!(
!(
!(!(
!(
!(
!(
!(
!(
!(
!(
!(
!(
!(
!(
!(
!(
!(
!(
!(
!(
!(
!(
!(
!(
!(
!(
!(
!(
!(
!(
!(
!(
!(
!(
!(
!(
!(!(
!(
!(
!(
!(
!(
!(
!(
!(
!(
!(
!(
!(!(!(
!(
!(
!(
!(
!(
!(
!(
!(
!(
!(
!(
!(
!(
!(
!(
!(
!(
!(
!(
!(
!(
!(
!(
!(
!(
!(
!(
!(
!(
!(
!(
!(
!(
!(
!(
!(
!(
!(
!(
!(!(
!(
!(
!(
!(
!(
!(
!(
!(
!(
!(
!(
!(
!(
!(
!(
!(
!(
!(
!(
!(
!(
!(
!(
!(
!(
!(
!(
!(
!(
!(
!(
!(
!(
!(
!(
!(
!(
!(
!(
!(
!(
!(
!(
!(
!(
!(
!(
!(
!(
!(
!(
!(
!(
!(
!(
!(
!(
!(
!(
!(
!(
!(
!(
!(
!(
!(
!(
!(
!(
!( !(
!(
!(
!(
!(
!(
!(
!(
!(
!(
!(
!(
!(
!(
!(
!(
!(
!(
!(
!(
!(
!(
!(
!(
!(
!(
!(
!(
!(
!(
!(
!(!(
!(!(
!(!(
!(!(
!(!( !( !(!( !(
!( !(!(
!(!(
!(!(
!(
!(!(
!(!(
!(!(
!(!(
!(
!(!(
!(
!(!(
!(
!(!(
!(!(
!(
!(!(
!(!(
!(!(
!(!(
!(!(
!(!(
!(!(
!(
!(
!(!(
!(
!(
!(
!(!(
!(!(
!(!(
!(!(
!(
!(
!(!(
!(
!(
!(!(
!(
!(
!(
!(
!(
!(
!(
!(
!(
!(
!(
!(!(
!(
!(
!(!(
!(!(
!(
!( !(!(!(!( !(!(!(
!(
!(!(
!(
!(
!(
!(!(
!(!( !(!( !(!( !(
!(!( !(!( !( !(!( !(!( !(!(
!(!(
!(
!(
!(!( !(!(
!(!(!( !(!( !(!( !(
!(
!(
!(!(!(
!(
!(
!(!(
!(
!(
!(
!(!(
!(
!(
!(
!(
!(!(
!(
!(
!(
!(
!(
!(
!(!(
!(
!(!(
!(
!( !(!(!(!( !(!(
!(
!(
!(!(!(
!(
!(!(
!(!(
!( !(
!(
!(!(
!(
!(
!(
!(
!(
!(
!(
!(
!(
!(
!(
!(
!(!(
!(
!(
!(
!(!(
!(
!(
!(
!(
!(!(
!(
!(
!(
!(
!(!(!(!(!(!(!(!(!(
!(
!(!( !(
!(
!(!(
!(
!(
!(
!(
!(
!(!(
!(
!(
!(!(
!(
!(
!(!(
!(
!(!(
!(
!(
!(
!(
!(
!(
!(!(!(
!(!(
!(
!(
!(
!(
!(
!(!(!(
!(!(
!(
!(
!(
!( !(
!(
!(
!(
!(
!(
!(
!(
!(!( !(!( !(!(!(
!(!(
!(
!(!(
!(
!(
!(!(
!(
!(
!(
!(
!(
!(!(!(!(
!(
!(!(!(
!(
!(
!(
!(!(
!(!(
!(
!(
!(
!(
!(
!(
!(
!(
!( !(!(
!(!(
!(
!(
!(!(!(
!(
!(
!(
!(
!(
!(
!(
!(
!(
!(
!(
!(
!(
!(
!(!(
!(!(
!(!(
!(
!(!(!(
!(!(
!(
!(!(
!(
!(
!(
!(
!(
!(
!(!(
!(
!(
!(
!(!(
!(
!(!(
!(!(
!(
!(
!(!(!(
!(!(!(!(
!(
!( !(
!(
!(!(
!(
!(!( !(
!(!(
!(
!(!(
!(
!(
!(
!(
!(
!(
!(
!(
!(!(
!(!(!(!(
!(!(
!(
!(!(
!(!(
!(
!(
!(
!(
!(
!(
!(
!(
!(!(
!(!(
!(
!(!(
!(!(!( !(
!(
!(!(!(!(
!(!(
!(!(!(
!(!(
!(!(
!( !( !(!(
!(!(!(!(
!(
!( !(!(
!(!(!(!(!(
!( !(
!(!(!(
!(!(!(!(
!(
!(!(
!(
!(!(!(
!(!(!(!(
!(
!(
!(
!(
!(!(
!(
!(
!(!(
!(
!( !(
!(!(!(
!(
!(
!(!(!(!( !(
!(!(
!(!(!(!(!(!(
!(!(!(!(
!(!( !(
!(
!(!(!(
!( !(!(
!(!(
!(
!(!(!(
!(
!( !(!(
!(
!(!(!(!( !(
!(!( !(!(!(
!(
!(
!(
!(!( !(
!(
!(!(!(
!(!(!(!(
!(!(
!(
!(!(
!(!(!(
!(!(
!(
!(
!(!(!(
!(
!(
!(
!(
!(
!(
!(
!(!(
!(
!(
!(
!(
!(
!(
!(
!(
!(
!(!(
!(
!(!(!(!(
!(!(
!(!(!(
!( !(!(
!(
!(
!(
!(
!(
!(!(
!(
!(
!(
!(
!(!(!(
!(
!(!( !(
!(!(!(!(
!( !(!(
!(!( !(!(
!(!(
!(
!(
!(
!(
!(
!(!(
!(
!(
!(!(!(
!(
!(
!(!(
!(!(
!(
!(
!(
!(
!(
!(
!(
!(
!(
!(!(!(
!(!(!(
!(
!(!(
!(
!(
!(
!(!(
!(
!(
!(!(
!(
!(
!(
!(
!(!(
!(
!(
!(
!(
!(
!(
!(
!(
!( !(
!(!(!(!(
!(
!(
!(
!(!(!(
!(
!(
!(
!(
!(!(!(
!(!(
!(
!(
!(
!(
!(!(
!(
!(
!(
!(!(
!(!(
!(
!( !(!(
!(!(
!(!(!(!(
!(
!( !(!(!(!(
!(!(!(
!(!( !(!(!(!(!(!(
!( !(!(!(
!(!(
!(!(!(!( !(!(
!(!(
!(!(
!(!(
!(
!(!(!(
!(
!(
!(
!(
!(!( !(!(!(
!(
!(
!(
!(
!(!(!(
!(
!(!(
!(
!(
!(
!(
!(
!(!(
!(
!( !(
!(!( !( !( !(
!(!(
!(!(
!(
!(!(
!(!(
!(!(
!(
!(
!(
!(
!(
!(
!(!(
!(
!(
!( !(
!(!(
!(
!(!(
!(
!(
!(
!(
!(
!(
!(
!(!(
!(
!(!(
!(!(
!(!(!(
!(
!(!(
!(
!(!(!(!(
!(
!(
!(
!(
!(!(
!(!(
!(!(
!(!(
!(
!(
!(!(
!(
!(!(
!(
!(!(
!(
!(
!(
!(
!(
!(
!(
!(!(!(!(
!( !(!( !( !(!(
!( !(
!( !(!(!(
!(!(!(
!(!(!(
!(
!(
!( !(!(
!(!( !( !(!( !(!(!(!(!(
!(!(!(
!(!(
!(!(
!(!(
!(!(!(!(
!(!( !(!(!( !(!(!(!(
!(!(!(
!(!(!( !(!(
!(
!(!(
!(
!(
!(
!(
!(!(!(!(
!(!(
!(
!(!(
!(!(!(!(
!(
!(
!(
!(
!(
!(
!(
!(
!(
!(
!(
!(
!(
!(
!(
!(
!(
!(
!(
!(
!(
!(!(
!(
!(
!(!(
!(
!(
!(!(!(
!(
!(
!(
!(
!(
!(
!(
!(
!(
!(
!(
!(
!(
!(
!(
!(!(
!(
!(
!(
!(
!(!(
!(
!(
!(
!(!(
!( !(
!(
!(
!(
!(!(
!(
!(
!(
!(
!(!(
!(
!(
!(
!(
!(
!(
!(
!(
!(
!(
!(
!(!(
!(
!(
!(
!(
!(
!(
!(!(
!(
!(
!(
!(
!(
!(
!(
!(!(!(
!( !(
!(
!(
!(
!(
!(
!(
!(
!(
!( !(
!(
!(
!(
!(!(
!(
!(
!(
!(!(
!(
!(
!(
!(
!(
!(
!(
!(!(!( !(!(
!(!(
!(!(!( !(!( !(
!(
!(
!(
!(
!( !(!(!(
!(!(!(!(!(
!(!(
!(
!(!( !(
!(
!(
!(
!(!(
!(
!(
!(!(
!(
!(
!(
!(
!(
!(
!(
!(
!(
!(!(!(!(
!(
!(!(
!(
!(!(
!(
!(!(
!(
!(
!(
!(
!( !(
!(!(
!(
!(
!(
!(!(
!(
!(!(
!(
!(
!(!(!(!(
!(
!(!(
!(
!(
!(
!(
!(
!(!(
!(
!(!(
!(
!(
!(
!(!(
!(!(
!(
!(!(!(
!(!(
!( !(!(
!(!(
!(!(!(
!(!(
!(
!(
!(!(!(!(
!(
!(
!(!( !(!(
!(
!(
!(
!(
!(
!(
!(
!(
!(
!(
!(!(
!(
!(
!(
!(
!(
!(
!(!(!(!( !( !(
!(
!(
!(
!(!(
!(
!(
!(
!(
!(
!(!(!(
!(!(!(
!(!(!(!(!( !(!(!(
!(
!(
!(!(
!(!( !(
!(!(
!(
!(
!(
!(!( !(
!(!(!(
!(
!(
!( !(!(!(!(!( !(!(
!(
!(
!(!(!(
!(
!(
!(
!(!(
!(
!(!(
!(!(
!(
!(!(
!( !(!( !(
!(!(!(!(
!(
!(
!(!(
!(!(
!(!(!(
!(
!(
!(
!(
!(
!(
!(!(
!(!(
!(
!(
!( !(!(
!(!(
!(!(
!(
!(
!(!(
!(!(
!(
!(!(
!(!(
!(
!(
!(!(
!(!(
!(
!(!(!(!(
!(
!(
!(
!(
!(
!(
!(!(
!(
!(
!( !(!(!(!(
!(!(
!(!(
!(
!(
!(
!(
!(
!(!(
!(
!(
!(!(
!(
!(
!(
!(!(
!(
!(!(!(
!(!(
!( !(
!(
!(!(!(
!(
!(!(
!(!(
!(!(
!(!(
!(!(!(
!(
!(
!(!(
!(!(
!(!(
!(!(
!(
!(
!(
!(!(
!(!(
!(!(
!(
!(
!(!(!(!(!(
!(!(
!(
!(
!(
!(
!(
!(
!(!(
!(
!(!(!(
!(
!(
!(
!(
!(
!(
!(!(!(
!(
!(!(
!(
!(!(
!(!(!(
!(
!(
!(
!(
!(!(
!(!( !(!(!(!(
!(
!(
!(!(
!(!(
!(
!(
!(
!(
!(
!(
!(
!(
!(
!(
!(
!(
!(
!(
!(
!( !(
!(!(
!(!(
!(
!(
!(!(
!(!(!(
!(
!(
!(
!(!(!(!(
!(
!(
!(
!(!(!(!(
!(
!(!(
!(!(
!(
!(
!(
!(
!(
!(
!(
!(
!(
!(
!(
!(
!(
!(
!(
!(
!(
!(
!(!(
!(
!(!(
!(
!(
!(!(
!(
!(!(
!(
!(!(!(
!(
!(
!(
!(
!(
!(!(
!(
!(
!(
!(
!(
!(
!(
!(
!(
!(
!(
!(
!(
!(
!(
!(
!(
!(
!(!(
!(
!(
!(!(!(!(!(!(!(!( !(!(!(
!(
!(
!(
!(
!(
!(
!(
!(
!(
!(
!(!(!(!(!(
!(
!(!(
!(!( !(
!(
!(!(
!(
!(!(!(
!(!(
!(!(
!(!( !(
!(!( !(!(
!(
!(!(!(
!(!(
!(
!(
!(!(
!(!(
!(
!(
!(
!(!(
!(
!(
!(
!(
!(
!(
!(
!(!(!(!(
!(!(!(!(
!(!(
!(
!( !(!(
!(!( !(
!(
!(
!(
!(
!(
!(
!( !(
!(!(
!(!(
!(
!(
!(
!(
!(
!(
!(
!(
!(
!(
!(
!(
!(
!(
!(!(
!(!(
!(!(
!(
!(
!(
!( !(
!(
!(
!(!(
!(!(
!(!(
!(!(
!(
!(
!(!(
!(!(!(
!(
!(!(!(!(
!(
!(!(
!(
!(
!(!(!(
!(
!(!(
!(
!(
!(
!(!(
!(!(!(!(!(
!(
!(!(!(!(
!(
!(!(
!(
!(
!(!(!(
!(!(
!(!(
!(
!(!(
!(
!(
!(
!(
!(
!(
!(
!(
!(
!(
!(!(!( !(!(!(!(!(!(
!(!( !(!(!( !(!(!(
!( !(!( !(
!(!( !(!(
!(
!(
!(!(
!(!(
!(
!(
!(!(!(!( !(!( !(!(
!(!(!(!(
!(!(!(!(
!(!(
!(
!(
!(
!(
!( !(!( !(!(!(!(
!(!(!(!(
!( !(!( !(
!( !( !( !(!( !(!(!(!(
!( !(
!(
!(
!(
!(
!(
!(!(!( !(!(
!( !(!( !(!(!( !(!(!(!( !( !(
!(!(!(!( !(!(
!(
!(
!(
!(
!(
!(
!(
!(
!(!( !(!( !(!( !( !(!( !( !(!(!(!( !( !( !(!(!( !(
!( !(
!(
!(
!(
!(
!(
!(
!(
!(
!(
!( !(
!(
!(!(
!(
!(
!(!(
!(!(
!(
!(
!(
!(
!(!(
!( !(!( !(!(!(!(!(!(!( !(
!(!(
!( !(!(
!(!(!(!(!( !(
!(!(
!(
!(
!(
!(
!(
!(
!(!(
!(
!(
!(!(
!(!(
!(
!(
!(
!(
!(
!(
!(!( !( !(!(!(!( !(!(!( !( !(!( !(
!( !(
!(
!(
!(
!(
!(
!(
!(
!(
!(
!(!(!(
!(
!(
!(
!(
!(!(!(
!(!(
!(
!(
!(
!(
!(
!(
!(
!(
!(
!(
!(
!(
!(
!(
!(
!(
!(!(
!(!(
!( !(
!(
!(
!(
!(!(!( !(!(!(!(!(
!( !(!(!( !(!(!(!( !(!( !(!(!(
!(!(
!(
!(
!(!(
!(
!(
!(
!(
!(
!(
!(
!(
!(
!(
!(
!(
!(
!(
!(
!(
!(!(!( !(!( !( !(!(!(!( !(
!(
!(!(
!(!(!(!(
!( !(!( !(!(!(!(!( !( !(!( !(!( !(
!(!(
!(
!(
!(
!(
!(
!(!(!( !(!( !(!( !(!(
!(!( !(!( !(!( !(!( !(!( !(!(
!(!(!(
!(
!(
!(
!(
!(
!(
!(!(!(
!(!(!( !(!( !(!(!( !( !(!(!( !(!(!( !(!( !(
!(!(
!( !(
!(
!(
!(
!(
!(
!(
!(
!( !(!(!( !(!(!( !(!(
!(!(!( !(!( !(!(!(!(!(!(!(
!(
!(!( !(
!(
!(
!(
!(
!(!(!(
!(
!(!(!(!(
!(
!(
!(!(!(!(
!(!(!(!(
!(!(!(!(
!(!(!(
!(!(!( !(!(!(
!(!( !( !(
!(
!(
!(
!(
!(
!(
!(
!(!(!( !(
!(!( !(!( !( !(!( !( !( !(!(!( !(!(!( !(
!(
!(!(!(
!(
!(
!(
!(
!(
!(
!(!( !(!(
!(!(!(
!(
!(!(
!(!(
!(
!(
!(!(
!(!(!(
!(!(!(
!(
!(
!(
!(
!(
!(
!(!(
!(
!(!(
!(
!(
!(
!(
!(!(!(
!(
!(!(
!(!(
!(!(!(!(
!(
!(!(
!(!(
!(
!(!(
!(!(
!(
!(
!(!(!(!(
!(
!( !(!(
!(!(
!(!(
!(!(
!(!(!(!(
!(!(
!(!(!( !(
!(!(
!(
!(
!(
!(
!(
!(!(
!(!(
!(
!(
!(
!(
!(!(
!(!(
!(
!(!(
!(
!(
!(
!(
!(
!(
!(!(
!(
!(
!(
!(
!(
!(
!(
!(!(
!(
!(!(!(
!(!(
!(
!(!(!(
!(!(
!(!(!(!(
!(
!(!(
!(
!(
!(
!(
!(
!(!(!(
!(
!( !(!(!(!(!(!(!(!(
!(
!(!(
!(!(
!(!(
!(!(
!(!(
!(
!(!(
!(!(!(
!( !(!(
!(!(
!(!(
!(!(
!(!(
!(!(
!(!(
!(!(
!(!( !(!(!(!( !(
!( !(!(!(
!(
!(!(!(
!(
!(
!(
!(
!(!(!(
!( !(!(!(
!(
!(
!(
!(
!( !(
!(
!(
!(
!(!(
!(
!(
!(!(
!(
!(!(
!(
!(!(
!(
!(
!(
!(!(
!(
!( !(
!(!(
!(!(
!(!(!(
!(!(!(!(!(!(
!(
!(
!(
!(
!(
!(
!(
!(!(
!(
!(
!(
!(
!(
!(
!(
!(
!(
!(
!(
!(!(
!(
!( !(
!(
!(
!(!(
!(
!(
!(
!(
!(
!(
!(
!(
!(
!(
!(!(
!(
!(!( !(
!(
!( !(
!(
!(!(
!(
!(!(
!(
!(
!(
!(
!(
!(
!(
!(!(
!(
!(!(!(
!(!(
!(
!(
!(!(
!(
!(
!(
!(
!(
!(!(
!(
!(
!(
!(
!(!( !( !(!(!( !(!( !(!(!( !(!(!(!(!( !(!( !(!(
!( !(!( !(!(
!(!( !(!(!(!(
!(!(!(
!( !(!(!(!(
!(!( !(!(!( !(!( !(!(
!(!(
!(!(!(!(!(!(!(
!(!(!( !(
!(
!(!(
!(
!(
!(
!(
!(!(
!(
!(
!(
!(
!(!(!(!(
!(!(!(
!(!(!(!(!( !(!(!(!( !(
!(!(!( !(!(!(!(
!(
!(!(
!(!(
!(
!(
!(!(
!(
!(!(
!(!(
!(!(
!(!(
!(!(
!(
!(
!(!(
!(!(
!(!(!(!(!( !(!(!( !(!(
!(!(
!(!(
!(!( !(!( !(
!(!(!(
!(!(
!(
!(
!(
!(
!(
!(!(!(
!(
!(
!(
!(
!(!(!(
!(!(
!(
!(
!(
!(
!(
!(
!(
!(
!(
!(
!(!(!(!( !( !(!( !(!(!( !(!(!(
!(!( !(!( !(!( !(!( !(!(!(
!(
!(!(
!(
!(
!(
!(
!(
!(!(
!(
!(!(
!(
!(
!(
!(
!(
!(
!(
!(
!(
!(
!(
!(
!(
!(
!(
!(
!(
!(
!(
!(
!(
!(
!(
!(
!( !(
!(
!(
!(
!(!(
!(
!(!(
!(
!(
!(
!(
!(
!(
!(
!(
!(
!(!(!(
!(
!(
!(!(!(
!(
!(
!(
!(
!(
!(
!(
!(
!(
!(
!(
!(!(
!(
!(
!(
!(!(
!(!(!(!(
!( !(!(!( !(!(
!(
!(!(
!(
!(!(
!(
!(
!(
!(
!(
!( !(
!(
!(
!(
!(
!(
!(
!(
!(
!(
!(
!(
!(
!(
!(
!(
!(
!(
!(
!(!(
!(
!(!(!(
!(
!(
!(
!(
!(
!(
!(
!(
!(
!(
!(
!(
!(!(!(!(
!(
!(!(!(
!(!(
!(!(!( !(!(!(!(!(
!(
!(!(
!(!( !(!(
!(
!(
!(!(!(
!(
!(
!(!(
!(
!(
!(
!(
!(
!(
!(
!(
!(
!(
!(
!(
!(!(!(
!(
!(!(
!(
!(
!( !(!(!(!(
!(
!(
!(
!(
!(
!(
!(
!(
!( !(
!(
!(
!(!(!(!(
!(
!(
!(
!(
!(!(
!(
!(
!(
!(
!(
!(
!(
!(
!(
!(
!(
!(!(!(!(
!(
!(
!(
!(
!(
!(!(
!(
!(
!(
!(
!(
!(
!(
!(!(
!(
!(
!(
!(
!(
!(
!(
!(
!(
!(
!(
!(
!(
!(
!(!(!(
!(!(
!(!(
!(
!(!(
!(
!(
!(
!(!(
!(
!(
!(
!(
!(
!(
!(
!(!(
!(!(
!(
!(
!(
!(
!(
!(!(
!(
!( !(
!(!(
!(
!(
!(
!(
!(
!(
!( !(
!( !(!( !( !(!(!( !( !(
!(
!(
!(
!(
!(
!(
!(
!(!(
!(
!(
!(
!(
!(
!(
!(
!(
!(
!( !(
!(
!(!(
!(
!(
!(!(!( !(
!(!( !(!( !( !( !(!(!( !( !(!(!(!( !( !(!(
!(!(
!(
!(
!(
!(
!(
!(!(
!(
!(
!(
!(
!(
!(
!(
!(
!(!(
!(!(
!(!(!(!(
!(
!(
!(!(
!(!(
!(!(
!(
!(
!(
!(
!(!(
!(
!(
!(
!(!(
!(
!(
!(
!(
!(
!(
!(
!(
!(
!(!(
!(
!(
!(
!(
!(
!(!(
!(!( !( !(!(!( !(!(
!( !(!( !(!( !(!(!( !( !(!(
!(!(
!(
!(
!(
!(!(
!( !(
!(
!(
!(
!(
!(!(!(
!(!(
!(
!(!(
!(
!(!(
!(
!(
!(!(
!(!(
!(!(
!(!(
!(
!(
!(
!(
!(
!(
!(!(
!(
!(
!(
!(!( !(
!(
!(
!(!(
!(
!(!(
!(
!(
!(!( !(!( !( !(!(!( !(
!(
!(
!(
!(!(
!(
!(!(!(
!(
!(
!(
!(
!(!(
!(
!(
!(
!(
!(
!(
!(
!(
!(
!(
!(
!(
!(
!(!(
!(!(
!(!(
!(
!(
!(
!(
!(
!(
!(
!(
!(
!(
!(
!(!(!(
!(
!(
!(!(
!( !(!( !(
!(!(
!(
!(
!(
!(
!(!(
!(!(
!(
!(
!(
!(
!(
!(
!(
!(
!(
!(!(
!(
!(
!(
!(!(
!(
!(
!(!(!(
!(
!(
!(
!(!(
!(
!(!(!(!(
!(
!(
!(
!(
!(!(
!(
!(
!(
!(
!(
!(
!(!(
!(
!(
!(!(
!(
!(
!(
!(
!(!(
!( !(!(
!(!(!(!(!(
!(
!(
!(
!(!(
!(
!(!(
!(
!(
!(
!(
!(
!(
!(
!(!(
!(
!(!(
!(
!(
!(
!(
!(
!(
!(
!(
!(
!(
!(
!(
!(
!(!(
!(!(
!(
!(
!(
!(
!(
!(
!(
!(
!(
!(
!(!(
!(
!(!(
!(
!(!(
!(
!(!(!(!(
!(
!(
!(
!(!(
!(
!(
!(
!(
!(!(!(!(
!(!(
!(!(
!(
!(
!(
!(
!(!(
!(
!(
!(
!(
!(
!(
!(
!(
!(
!(
!(
!(
!(
!(
!(
!(
!(
!(!(!(
!(!(
!(
!(
!(
!(!(!(
!(!(
!(
!(!(
!(
!(
!(
!(
!(
!(!(
!(!(
!(
!(
!(
!(
!(
!(
!(
!(
!(
!(
!(
!(
!(!(
!(
!(
!(!(
!(!(
!(
!(!(
!(
!(
!(
!(
!(
!(!(
!(
!(
!(
!(!(!(!(
!(
!(
!(
!(!(
!(
!(
!(!(
!(
!(
!(
!(
!(
!(
!(
!(
!(
!(
!(
!(!(
!(
!(
!(
!(
!(
!(!(!(
!(
!(!(!(!(!(!(
!(
!(
!(!(
!(
!(!(
!(
!(
!(
!( !(!(!( !(!(!(!(!(
!(
!(
!(
!(
!(
!(!(
!(
!(
!(!(
!(
!(
!(
!(
!(
!(
!(!(
!(!(
!(
!(!(
!(!(
!(
!(
!(
!(
!(!(
!(
!(
!(
!(
!(
!(
!(
!(
!(
!(
!(
!(
!(
!(
!(
!(
!(!(!(
!(!(!( !( !(!(
!(!(!( !(!( !(!(!( !(!(!(!(
!(
!(!( !(
!(!( !(!(
!(
!(
!(
!(!(
!(!(!(
!(!(
!(!(
!( !( !( !( !(!(
!(
!(
!(
!(!(
!(!(
!(
!(
!(!(
!(
!(
!(
!(
!(
!(!(
!(
!(
!(!(
!( !(
!(
!(
!(
!(
!(
!(
!(
!(
!(
!(
!(!(
!(
!(
!(
!(
!( !(!( !( !(!(!( !( !( !(!( !(!( !(!(!(!(!( !(
!(
!(!(
!(
!(
!(
!(!(!(
!(!(!(
!(
!(
!(
!(
!(
!(
!(
!(
!(
!(
!(!(
!(
!(!(!(
!(
!(
!(
!(
!(
!(
!(!(
!(
!(
!(
!(
!( !(!( !(!(!(!(
!(!( !(!(
!(!( !(!( !( !(!(
!( !( !(!(!(
!(
!(!( !(
!(!(
!(
!(
!(
!(!( !(!(
!(
!(
!(
!(
!(!(
!(!(
!(
!(
!(!(
!(
!(
!(!(
!(
!(
!(!(
!(
!(
!(
!(
!(
!(
!(!( !(
!(!(
!(
!( !( !(!(!(!(
!(!(!( !(!( !( !(!(!(
!(!(!(
!(
!(
!(
!(
!(
!(
!(!(
!(
!(
!(
!(
!(
!(
!(
!(
!(
!(
!(
!(
!(
!(
!(!(!(!(
!(
!(!(
!(
!(!( !(!(
!(!( !(
!(!( !( !( !( !(
!(!( !( !(!( !(!(!(!(!( !(!( !(!(
!(!(!(
!(
!(
!(
!(
!(!(
!(!(!(!(!(
!(!(!(
!(
!(
!(
!(
!(
!(
!(
!(
!(
!(
!(
!(!(
!(!(
!(
!(
!(
!(
!(
!(
!(!(!(
!(
!(!(!(
!(!( !(!(!( !( !(!(!( !(!(!(!(!(!(!(
!(
!(
!(!(
!(!(
!(!(
!(
!(!(!(
!(!(!(!(!(
!(
!(!(
!(
!(
!(
!(!(
!(
!(
!(
!(!(
!(!(
!(!(!(
!( !(
!(!(
!(
!(!(!( !(!( !(!( !(
!(!(!(!( !(!(
!(!(!(
!( !(
!(
!( !(!(!(!(
!(
!(!(!( !(
!(
!(!(
!(!(
!(
!(
!(
!(!(
!( !(
!(!(
!(!(
!(
!(!(
!(
!( !( !(
!(
!(!( !(
!(
!(!(
!(
!(!(
!( !(
!(
!(
!(!(
!(
!(
!(
!(
!(!(
!(!(
!(
!(
!(
!(
!(!(
!(!(
!(!(
!(!(!(
!(!(
!(
!(!(
!( !(!(
!(
!(!(!(
!(!(
!(
!(!(
!( !(
!(
!(
!(!(!(
!(
!( !(
!(
!(
!(!(!(!(!(
!(
!(!(!(
!(!(
!(
!(
!(
!(!(!(
!( !(!(!(!( !( !(
!(
!(!(!(!(!(
!(!(
!(!(!(!(
!(!(!( !(!(!(!(
!( !(
!(!(
!(!(
!(!(
!(
!(
!( !(!(
!(
!(
!(
!(
!(!(
!(
!(
!(!(!(!(
!(
!(!(
!(
!(!(
!(
!(
!(
!(
!(
!(
!(!(
!(
!(
!(!(
!(
!(!(
!(!(
!(!(
!(!(
!(!(!(
!(!(
!(!(
!(!( !(
!(!(!(!(
!(!(
!(
!(!(
!(!( !(
!( !(
!(
!(
!(
!(!(
!(!(
!(!(!(
!(!(!(
!(!(
!(!(!(
!(!(!(!(
!(!(!(
!(
!(
!(!(!(
!(!(
!(!(
!(
!(!(
!(!(
!(!(
!(!(!(!(
!(
!(!(
!(!(
!(!(
!(!(
!(!(!(
!(
!(
!(
!(
!(
!(!(!(
!(
!(!(
!(!(
!(!(!(
!(
!(!(!(
!(
!(
!(
!(
!(
!(!(
!( !(!(!( !(!(!(!(!( !(!(!( !(!(
!(
!(!( !(
!(
!(
!(
!(!(!(
!(!(
!(
!(
!(
!(!(
!(
!( !(
!(!(
!(
!(!( !(!(
!( !(!(!(!(
!(
!(!(
!(!(
!(!(
!(
!(
!(
!(!(
!(!(
!(!(!(
!(
!(!(
!(!(
!(!(
!(
!(
!(!(
!(
!(!(
!(!(
!(!(!(!(
!(!(
!(!(
Oathill LakeSubwatershed Area: 39.5 ha
Micmac LakeWatershed
Area: 874.7 ha(Includes Red BridgePond Subwatershed)
Lake BanookWatershed
Area: 263.0 ha(Includes Outfall 8 and
Oathill LakeSubwatersheds)
Red Bridge PondSubwatershed Area: 199.4 ha
Outfall 8Subwatershed Area: 48.9 ha
($$¯
!( Catchbasin" Manhole
CulvertDrainStormwater PipeWastewater PipeCombined PipeUnknown PipeWatershed BoundarySubwatershed Boundary
V:\1214\active\121415826\03_data\gis_cad\gis\mapping\mxd\report\121415826-004_watersheds.mxd mhuskinsshupe
NAD 1983 CSRS UTM Zone 20N 121415826-004
Disclaimer: This map is for illustrative purposes to support this Stantec project ; quest ions can be direct ed t o t he issuing agency.
Figure A-2
Delineated Watersheds for Lake Micmac and Lake BanookService Layer Credits: Sources: Esri, HERE, DeLorme, TomTom, Intermap, increment P Corp., GEBCO, USGS, FAO, NPS, NRCAN, GeoBase, IGN, Kadast er NL, Ordnance Survey, Esri Japan, METI, Esri China (Hong Kong), swisst opo,MapmyIndia, © OpenStreetMap contributors, and t he GIS User Communit y
Sources: Infrastructure provided by Halifax Wat er
POLLUTION SOURCE CONTROL STUDY FOR LAKE BANOOK & LAKE MICMAC,HALIFAX REGIONAL MUNICIPALITY
0 0.2 0.4 0.6 0.8
kilometres

APPENDIX B Results Tables

B.1 – Water Quality Parameters by Sampling Location

Sample ID
RC
Ap-
30 (g
ener
al c
hem
istr
y an
d m
etal
s un
filte
red)
with
low
-le
vel s
olub
le re
activ
e ph
osph
orus
TKN
T ota
l Pho
spho
rous
(low
, M
issi
ssau
ga L
ab, 4
µg/
L)
Solu
ble
Rea
ctiv
e Ph
osph
orus
(lo
w le
vel)
Chl
orop
hyll
a
TSS
(low
1 m
g/L)
e. c
oli
Ente
roco
ccus
MST
Num
ber o
f Sam
plin
g Ev
ents
Banook 1 x x x - x x x x x 5Banook 2 x x x - - x x x x 5Near-Shore 1 x x x - x x x x x 5Near-Shore 2 - - x x x x x x x 5
Watercourse 1 x x x - x x x x x 5Outfall 2 - - x x - x x x - 1Outfall 4 - - x x - x x x - 2Outfall 5 - - x x - x x x - 0Outfall 8 x x x - - x x x x 4Outfall 8b x x x - - x x x x 2HDW6453 - - x x - x x x - 1HDW6658 - - x x - x x x - 1HDW6660 - - x x - x x x x 0HDW6661/6662 - - x x - x x x - 0HDW7052 - - x x - x x x - 1HDW7061 - - x x - x x x - 2HDW7395 x x x - - x x x x 0HDW8201 - - x x - x x x - 2HDW8210 - - x x - x x x - 1HDW8713 - - x x - x x x - 2HDW8714 - - x x - x x x - 1HDW8846 - - x x - x x x - 2HDW8905 - - x x - x x x - 2
Micmac 1 x x x - x x x x x 5Micmac 2 x x x - - x x x x 5Waterfowl 1 - - x x - x x x x 5Near-Shore 3 - - x x x x x x x 5
Watercourse 2 x x x - - x x x x 5Watercourse 3 x x x - - x x x x 5Watercourse 4 x x x - - x x x x 5Watercourse 5 x x x - - x x x x 5Watercourse 6 x x x - - x x x x 5Outfall 1 - - x x - x x x - 5Outfall 7 - - x x - x x x - 5Pump Station 1 - - x x - x x x - 1HDWs 6534/8993 - - x x - x x x - 0HDW8910 - - x x - x x x - 1HDW8989 - - x x - x x x - 2HDW8990 x x x - x x x x 0HDW8991 - - x x - x x x - 2HDW9085 - - x x - x x x - 0HDW9308 - - x x - x x x - 2HDW9311 - - x x - x x x - 2HDW9328 - - x x - x x x - 2
Lake Inflow Samples
Water Quality Parameters By Sampling Location
Lake BanookIn-Lake Samples
Lake Inflow Samples
Lake MicmacIn-Lake Samples

B.2 – Surface Water Flow Monitoring
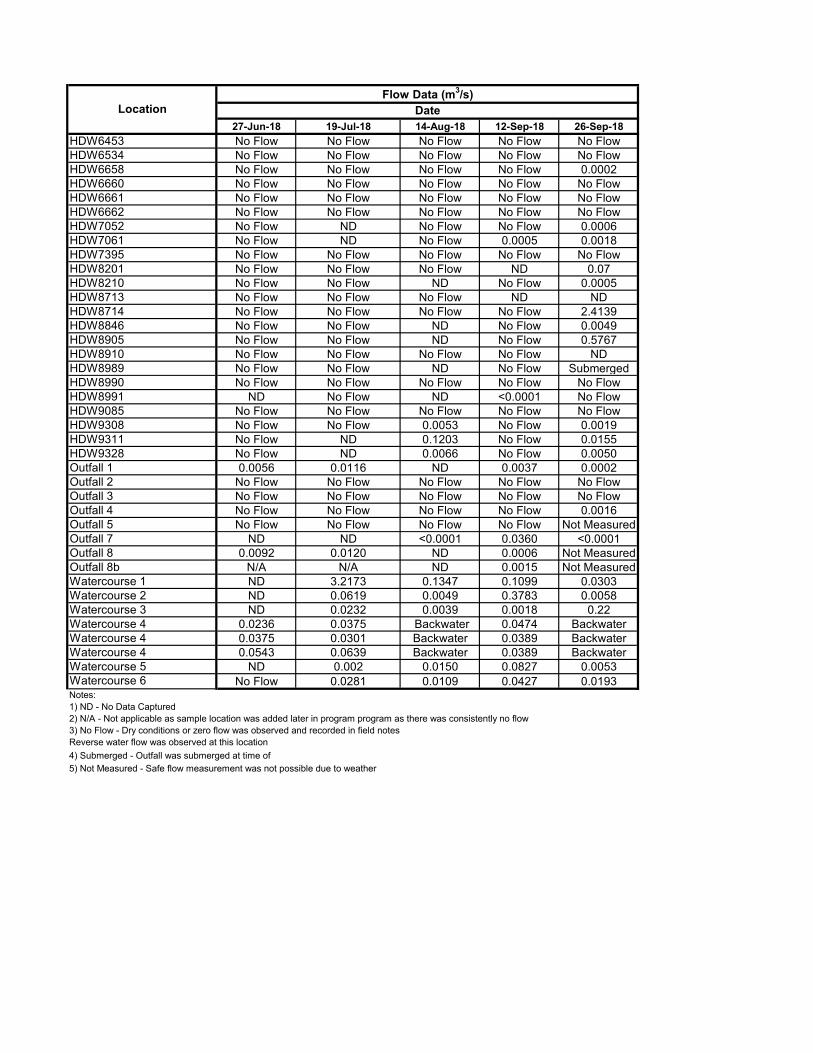
27-Jun-18 19-Jul-18 14-Aug-18 12-Sep-18 26-Sep-18HDW6453 No Flow No Flow No Flow No Flow No FlowHDW6534 No Flow No Flow No Flow No Flow No FlowHDW6658 No Flow No Flow No Flow No Flow 0.0002HDW6660 No Flow No Flow No Flow No Flow No FlowHDW6661 No Flow No Flow No Flow No Flow No FlowHDW6662 No Flow No Flow No Flow No Flow No FlowHDW7052 No Flow ND No Flow No Flow 0.0006HDW7061 No Flow ND No Flow 0.0005 0.0018HDW7395 No Flow No Flow No Flow No Flow No FlowHDW8201 No Flow No Flow No Flow ND 0.07HDW8210 No Flow No Flow ND No Flow 0.0005HDW8713 No Flow No Flow No Flow ND NDHDW8714 No Flow No Flow No Flow No Flow 2.4139HDW8846 No Flow No Flow ND No Flow 0.0049HDW8905 No Flow No Flow ND No Flow 0.5767HDW8910 No Flow No Flow No Flow No Flow NDHDW8989 No Flow No Flow ND No Flow SubmergedHDW8990 No Flow No Flow No Flow No Flow No FlowHDW8991 ND No Flow ND <0.0001 No FlowHDW9085 No Flow No Flow No Flow No Flow No FlowHDW9308 No Flow No Flow 0.0053 No Flow 0.0019HDW9311 No Flow ND 0.1203 No Flow 0.0155HDW9328 No Flow ND 0.0066 No Flow 0.0050Outfall 1 0.0056 0.0116 ND 0.0037 0.0002Outfall 2 No Flow No Flow No Flow No Flow No FlowOutfall 3 No Flow No Flow No Flow No Flow No FlowOutfall 4 No Flow No Flow No Flow No Flow 0.0016Outfall 5 No Flow No Flow No Flow No Flow Not MeasuredOutfall 7 ND ND <0.0001 0.0360 <0.0001Outfall 8 0.0092 0.0120 ND 0.0006 Not MeasuredOutfall 8b N/A N/A ND 0.0015 Not MeasuredWatercourse 1 ND 3.2173 0.1347 0.1099 0.0303Watercourse 2 ND 0.0619 0.0049 0.3783 0.0058Watercourse 3 ND 0.0232 0.0039 0.0018 0.22Watercourse 4 0.0236 0.0375 Backwater 0.0474 BackwaterWatercourse 4 0.0375 0.0301 Backwater 0.0389 BackwaterWatercourse 4 0.0543 0.0639 Backwater 0.0389 BackwaterWatercourse 5 ND 0.002 0.0150 0.0827 0.0053Watercourse 6 No Flow 0.0281 0.0109 0.0427 0.0193
4) Submerged - Outfall was submerged at time of 5) Not Measured - Safe flow measurement was not possible due to weather
Location DateFlow Data (m3/s)
Notes: 1) ND - No Data Captured2) N/A - Not applicable as sample location was added later in program program as there was consistently no flow3) No Flow - Dry conditions or zero flow was observed and recorded in field notesReverse water flow was observed at this location

B.3 – In-Situ Water Quality Monitoring
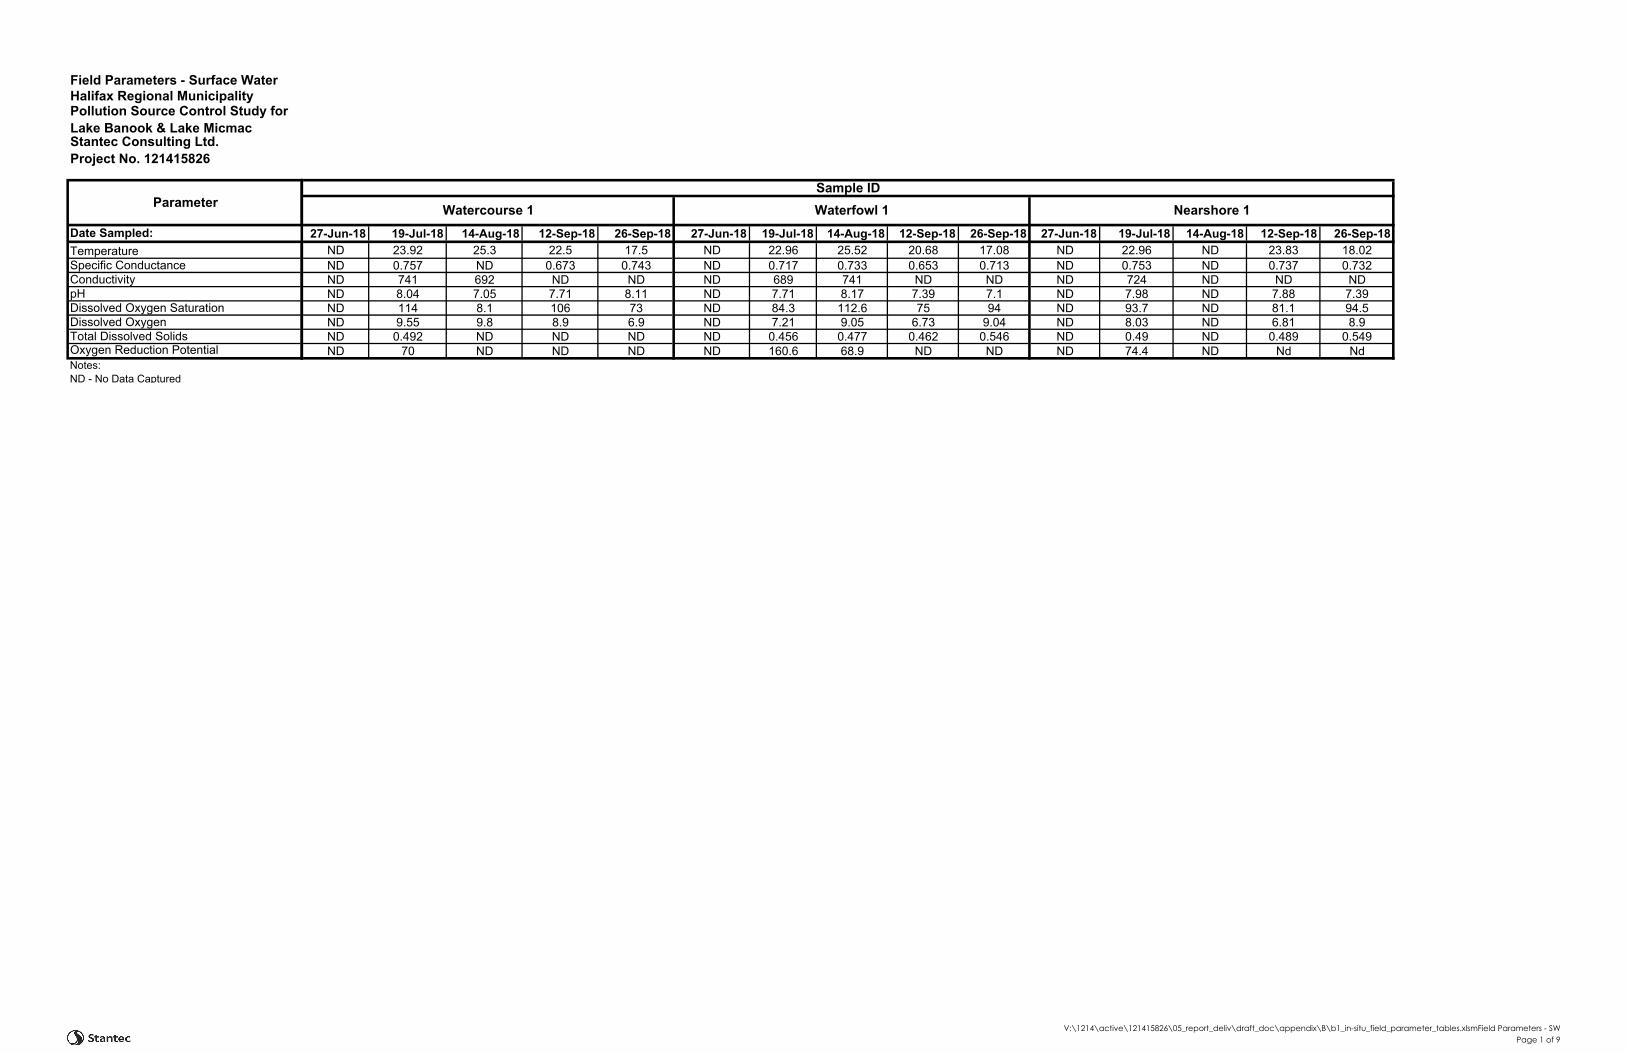
Pollution Source Control Study for Lake Banook & Lake Micmac
TemperatureSpecific ConductanceConductivitypHDissolved Oxygen SaturationDissolved OxygenTotal Dissolved SolidsOxygen Reduction PotentialNotes: ND - No Data Captured
Date Sampled:
Field Parameters - Surface WaterHalifax Regional Municipality
Stantec Consulting Ltd. Project No. 121415826
Parameter
27-Jun-18 19-Jul-18 14-Aug-18 12-Sep-18 26-Sep-18 27-Jun-18 19-Jul-18 14-Aug-18 12-Sep-18 26-Sep-18 27-Jun-18 19-Jul-18 14-Aug-18 12-Sep-18 26-Sep-18ND 23.92 25.3 22.5 17.5 ND 22.96 25.52 20.68 17.08 ND 22.96 ND 23.83 18.02ND 0.757 ND 0.673 0.743 ND 0.717 0.733 0.653 0.713 ND 0.753 ND 0.737 0.732ND 741 692 ND ND ND 689 741 ND ND ND 724 ND ND NDND 8.04 7.05 7.71 8.11 ND 7.71 8.17 7.39 7.1 ND 7.98 ND 7.88 7.39ND 114 8.1 106 73 ND 84.3 112.6 75 94 ND 93.7 ND 81.1 94.5ND 9.55 9.8 8.9 6.9 ND 7.21 9.05 6.73 9.04 ND 8.03 ND 6.81 8.9ND 0.492 ND ND ND ND 0.456 0.477 0.462 0.546 ND 0.49 ND 0.489 0.549ND 70 ND ND ND ND 160.6 68.9 ND ND ND 74.4 ND Nd Nd
Sample IDWatercourse 1 Waterfowl 1 Nearshore 1
V:\1214\active\121415826\05_report_deliv\draft_doc\appendix\B\b1_in-situ_field_parameter_tables.xlsmField Parameters - SWPage 1 of 9

Pollution Source Control Study for Lake Banook & Lake Micmac
TemperatureSpecific ConductanceConductivitypHDissolved Oxygen SaturationDissolved OxygenTotal Dissolved SolidsOxygen Reduction PotentialNotes: ND - No Data Captured
Date Sampled:
Field Parameters - Surface WaterHalifax Regional Municipality
Stantec Consulting Ltd. Project No. 121415826
Parameter
27-Jun-18 19-Jul-18 14-Aug-18 12-Sep-18 26-Sep-18 19-Jun-18 19-Jul-18 14-Aug-18 12-Sep-18 26-Sep-18 19-Jun-18 19-Jul-18 14-Aug-18 12-Sep-18 26-Sep-1818.38 24 25.54 22.16 16.8 ND ND ND ND 18 ND ND 23.4 ND 18.40.752 0.729 0.744 0.692 0.722 ND ND ND ND 0.718 ND ND ND ND 0.031656 175 752 ND ND ND ND ND ND ND ND ND 6.6 ND ND7.7 8.1 8.17 7.52 7.5 ND ND ND ND 7.58 ND ND 7.21 ND 7.97ND 101.2 110.7 78.3 95.2 ND ND ND ND 75 ND ND ND ND 819.22 8.5 9.01 6.79 9.17 ND ND ND ND 7.1 ND ND 7.3 ND 7.6
0.488 ND 0.484 0.475 0.577 ND ND ND ND ND ND ND ND ND ND92 ND 67.6 ND ND ND ND ND ND ND ND ND ND ND ND
Outfall 2SAMPLE ID
Nearshore 2 Outfall 4
V:\1214\active\121415826\05_report_deliv\draft_doc\appendix\B\b1_in-situ_field_parameter_tables.xlsmField Parameters - SWPage 2 of 9

Pollution Source Control Study for Lake Banook & Lake Micmac
TemperatureSpecific ConductanceConductivitypHDissolved Oxygen SaturationDissolved OxygenTotal Dissolved SolidsOxygen Reduction PotentialNotes: ND - No Data Captured
Date Sampled:
Field Parameters - Surface WaterHalifax Regional Municipality
Stantec Consulting Ltd. Project No. 121415826
Parameter
19-Jun-18 19-Jul-18 14-Aug-18 12-Sep-18 26-Sep-18 27-Jun-18 19-Jul-18 14-Aug-18 12-Sep-18 26-Sep-18 27-Jun-18 19-Jul-18 14-Aug-18 12-Sep-18 26-Sep-18ND ND ND ND ND 15.25 15.53 19.68 18.11 ND ND ND 17.09 17.12 NDND ND ND ND ND 1.713 2.117 2.444 1.864 ND ND ND 2.334 1.896 NDND ND ND ND ND 1392 1734 2195 ND ND ND ND 1981 ND NDND ND ND ND ND 8.25 6.73 8.2 7.53 ND ND ND 8.01 7.13 NDND ND ND ND ND ND 93.3 114.9 102.5 ND ND ND 173.8 102.2 NDND ND ND ND ND 11.1 9.24 10.36 9.64 ND ND ND 14.4 9.78 NDND ND ND ND ND 1.112 1.376 1.589 1.395 ND ND ND 1.519 1.451 NDND ND ND ND ND 192.6 202.5 86.5 ND ND ND ND 55 ND ND
Outfall 5SAMPLE IDOutfall 8 Oufall 8b
V:\1214\active\121415826\05_report_deliv\draft_doc\appendix\B\b1_in-situ_field_parameter_tables.xlsmField Parameters - SWPage 3 of 9

Pollution Source Control Study for Lake Banook & Lake Micmac
TemperatureSpecific ConductanceConductivitypHDissolved Oxygen SaturationDissolved OxygenTotal Dissolved SolidsOxygen Reduction PotentialNotes: ND - No Data Captured
Date Sampled:
Field Parameters - Surface WaterHalifax Regional Municipality
Stantec Consulting Ltd. Project No. 121415826
Parameter
27-Jun-18 19-Jul-18 14-Aug-18 12-Sep-18 26-Sep-18 27-Jun-18 19-Jul-18 14-Aug-18 12-Sep-18 26-Sep-18 27-Jun-18 19-Jul-18 14-Aug-18 12-Sep-18 26-Sep-18ND ND ND ND ND ND ND ND ND ND ND ND ND ND NDND ND ND ND ND ND ND ND ND ND ND ND ND ND NDND ND ND ND ND ND ND ND ND ND ND ND ND ND NDND ND ND ND ND ND ND ND ND ND ND ND ND ND NDND ND ND ND ND ND ND ND ND ND ND ND ND ND NDND ND ND ND ND ND ND ND ND ND ND ND ND ND NDND ND ND ND ND ND ND ND ND ND ND ND ND ND NDND ND ND ND ND ND ND ND ND ND ND ND ND ND ND
SAMPLE IDHDW6660 HDW6661 HDW6662
V:\1214\active\121415826\05_report_deliv\draft_doc\appendix\B\b1_in-situ_field_parameter_tables.xlsmField Parameters - SWPage 4 of 9

Pollution Source Control Study for Lake Banook & Lake Micmac
TemperatureSpecific ConductanceConductivitypHDissolved Oxygen SaturationDissolved OxygenTotal Dissolved SolidsOxygen Reduction PotentialNotes: ND - No Data Captured
Date Sampled:
Field Parameters - Surface WaterHalifax Regional Municipality
Stantec Consulting Ltd. Project No. 121415826
Parameter
27-Jun-18 19-Jul-18 14-Aug-18 12-Sep-18 26-Sep-18 27-Jun-18 19-Jul-18 14-Aug-18 12-Sep-18 26-Sep-18 27-Jun-18 19-Jul-18 14-Aug-18 12-Sep-18 26-Sep-18ND ND ND ND 18.8 ND ND ND ND 18.7 ND ND 22.8 ND 18.1ND ND ND ND 0.002 ND ND ND ND 0.058 ND ND ND ND 0.0028ND ND ND ND ND ND ND ND ND ND ND ND 12.1 ND NDND ND ND ND 7.62 ND ND ND ND 7.75 ND ND 6.88 ND 7.98ND ND ND ND 82 ND ND ND ND 79 ND ND ND ND 84ND ND ND ND 7.7 ND ND ND ND 7.4 ND ND 7.3 ND 8ND ND ND ND ND ND ND ND ND ND ND ND ND ND NDND ND ND ND ND ND ND ND ND ND ND ND ND ND ND
SAMPLE IDHDW8846HDW8210HDW6658
V:\1214\active\121415826\05_report_deliv\draft_doc\appendix\B\b1_in-situ_field_parameter_tables.xlsmField Parameters - SWPage 5 of 9
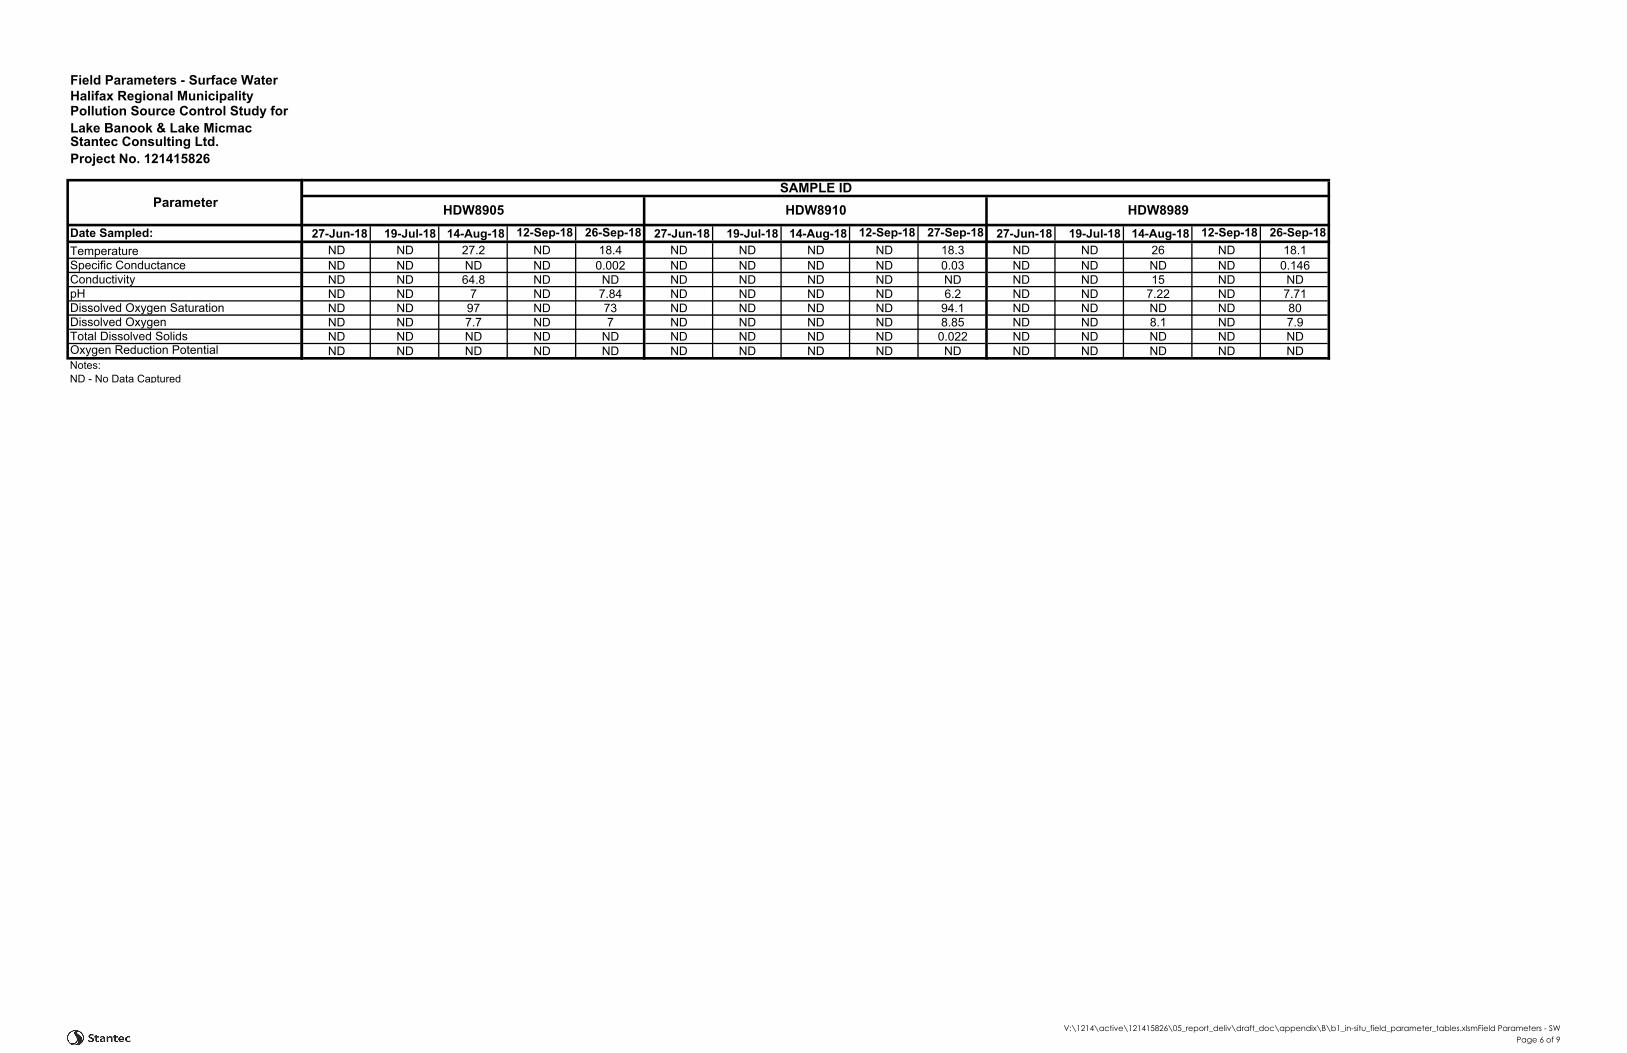
Pollution Source Control Study for Lake Banook & Lake Micmac
TemperatureSpecific ConductanceConductivitypHDissolved Oxygen SaturationDissolved OxygenTotal Dissolved SolidsOxygen Reduction PotentialNotes: ND - No Data Captured
Date Sampled:
Field Parameters - Surface WaterHalifax Regional Municipality
Stantec Consulting Ltd. Project No. 121415826
Parameter
27-Jun-18 19-Jul-18 14-Aug-18 12-Sep-18 26-Sep-18 27-Jun-18 19-Jul-18 14-Aug-18 12-Sep-18 27-Sep-18 27-Jun-18 19-Jul-18 14-Aug-18 12-Sep-18 26-Sep-18ND ND 27.2 ND 18.4 ND ND ND ND 18.3 ND ND 26 ND 18.1ND ND ND ND 0.002 ND ND ND ND 0.03 ND ND ND ND 0.146ND ND 64.8 ND ND ND ND ND ND ND ND ND 15 ND NDND ND 7 ND 7.84 ND ND ND ND 6.2 ND ND 7.22 ND 7.71ND ND 97 ND 73 ND ND ND ND 94.1 ND ND ND ND 80ND ND 7.7 ND 7 ND ND ND ND 8.85 ND ND 8.1 ND 7.9ND ND ND ND ND ND ND ND ND 0.022 ND ND ND ND NDND ND ND ND ND ND ND ND ND ND ND ND ND ND ND
SAMPLE IDHDW8989HDW8905 HDW8910
V:\1214\active\121415826\05_report_deliv\draft_doc\appendix\B\b1_in-situ_field_parameter_tables.xlsmField Parameters - SWPage 6 of 9

Pollution Source Control Study for Lake Banook & Lake Micmac
TemperatureSpecific ConductanceConductivitypHDissolved Oxygen SaturationDissolved OxygenTotal Dissolved SolidsOxygen Reduction PotentialNotes: ND - No Data Captured
Date Sampled:
Field Parameters - Surface WaterHalifax Regional Municipality
Stantec Consulting Ltd. Project No. 121415826
Parameter
27-Jun-18 19-Jul-18 14-Aug-18 12-Sep-18 26-Sep-18 27-Jun-18 19-Jul-18 14-Aug-18 12-Sep-18 26-Sep-18 27-Jun-18 19-Jul-18 14-Aug-18 12-Sep-18 26-Sep-18ND ND ND ND ND ND ND ND 22.15 ND ND ND ND ND NDND ND ND ND ND ND ND ND 0.683 ND ND ND ND ND NDND ND ND ND ND ND ND ND ND ND ND ND ND ND NDND ND ND ND ND ND ND ND 8.49 ND ND ND ND ND NDND ND ND ND ND ND ND ND 94.8 ND ND ND ND ND NDND ND ND ND ND ND ND ND 8.26 ND ND ND ND ND NDND ND ND ND ND ND ND ND 0.469 ND ND ND ND ND NDND ND ND ND ND ND ND ND ND ND ND ND ND ND ND
SAMPLE IDHDW8991HDW8990 HDW/6534HDW8993
V:\1214\active\121415826\05_report_deliv\draft_doc\appendix\B\b1_in-situ_field_parameter_tables.xlsmField Parameters - SWPage 7 of 9

Pollution Source Control Study for Lake Banook & Lake Micmac
TemperatureSpecific ConductanceConductivitypHDissolved Oxygen SaturationDissolved OxygenTotal Dissolved SolidsOxygen Reduction PotentialNotes: ND - No Data Captured
Date Sampled:
Field Parameters - Surface WaterHalifax Regional Municipality
Stantec Consulting Ltd. Project No. 121415826
Parameter
27-Jun-18 19-Jul-18 14-Aug-18 12-Sep-18 26-Sep-18 27-Jun-18 19-Jul-18 14-Aug-18 12-Sep-18 27-Sep-18 27-Jun-18 19-Jul-18 14-Aug-18 12-Sep-18 27-Sep-18ND ND ND ND ND NA ND 22.5 NA 19 ND ND 24.1 ND 18.3ND ND ND ND ND NA ND ND NA 0.0122 ND ND ND ND 0.0566ND ND ND ND ND NA ND 5.3 NA ND ND ND 2.9 ND NDND ND ND ND ND NA ND 6.6 NA 7.94 ND ND 6.7 ND 7.62ND ND ND ND ND NA ND ND NA 78 ND ND ND ND 91ND ND ND ND ND NA ND 9 NA 7.2 ND ND 8.3 ND 8.6ND ND ND ND ND NA ND ND NA ND ND ND ND ND NDND ND ND ND ND NA ND ND NA ND ND ND ND ND ND
SAMPLE IDHDW9308 HDW9311HDW9085
V:\1214\active\121415826\05_report_deliv\draft_doc\appendix\B\b1_in-situ_field_parameter_tables.xlsmField Parameters - SWPage 8 of 9
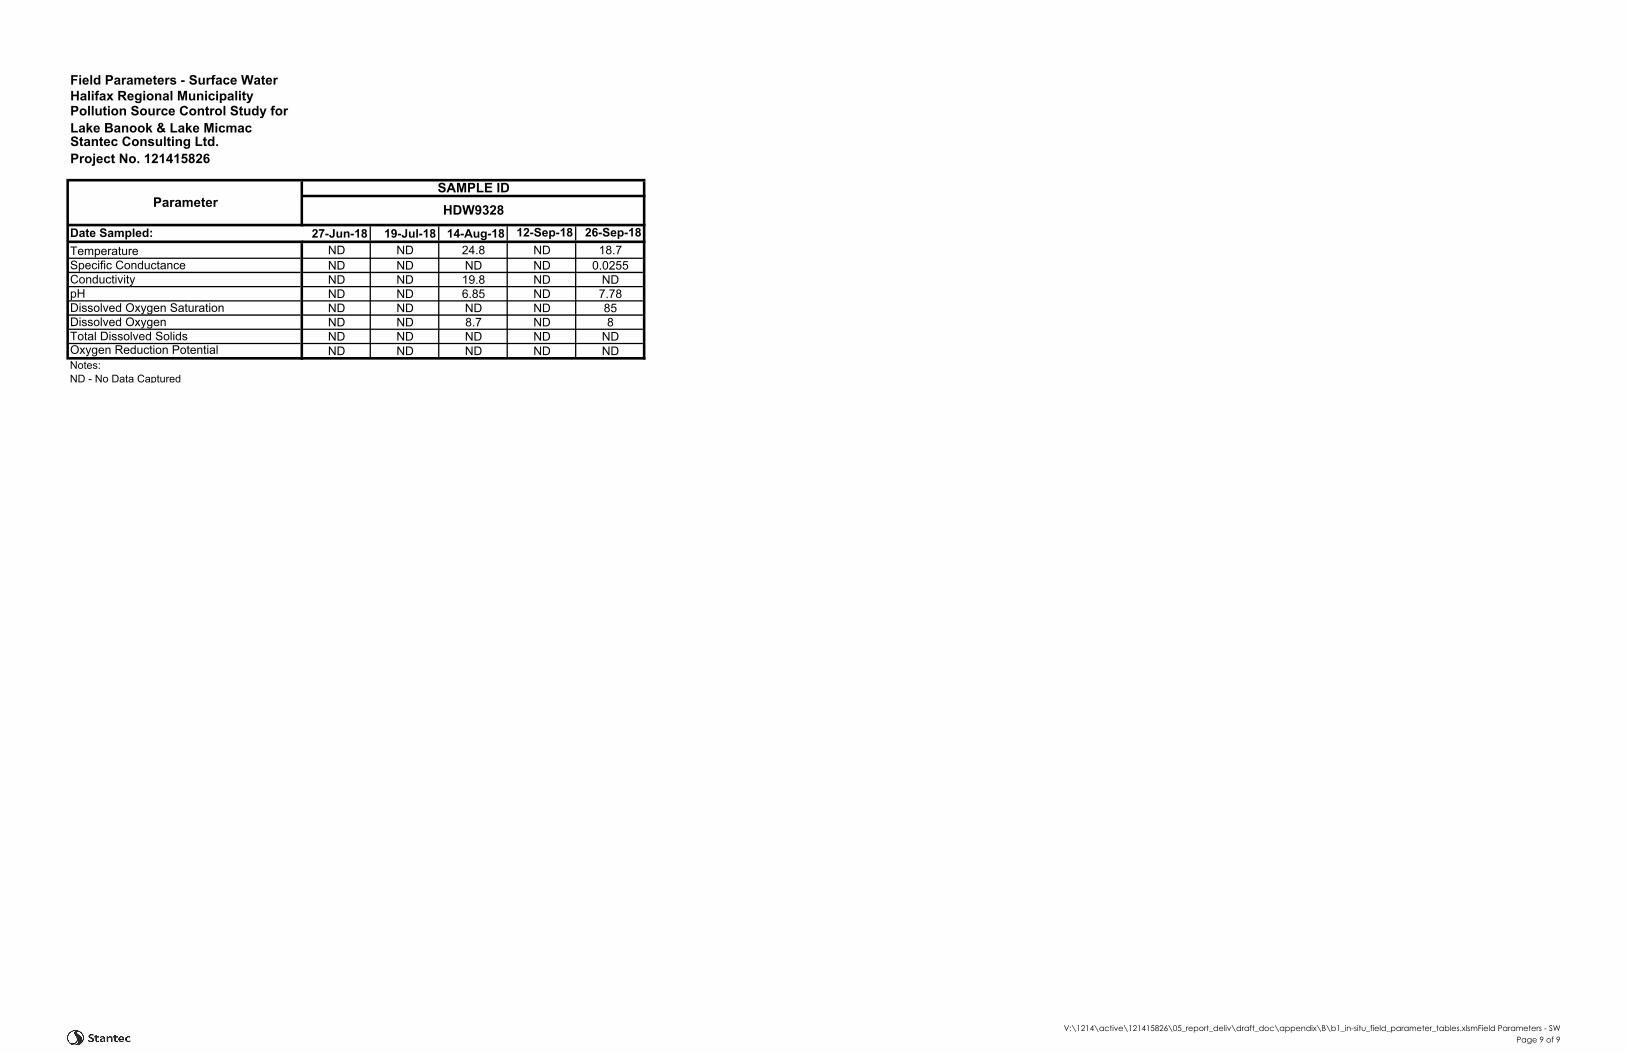
Pollution Source Control Study for Lake Banook & Lake Micmac
TemperatureSpecific ConductanceConductivitypHDissolved Oxygen SaturationDissolved OxygenTotal Dissolved SolidsOxygen Reduction PotentialNotes: ND - No Data Captured
Date Sampled:
Field Parameters - Surface WaterHalifax Regional Municipality
Stantec Consulting Ltd. Project No. 121415826
Parameter
27-Jun-18 19-Jul-18 14-Aug-18 12-Sep-18 26-Sep-18ND ND 24.8 ND 18.7ND ND ND ND 0.0255ND ND 19.8 ND NDND ND 6.85 ND 7.78ND ND ND ND 85ND ND 8.7 ND 8ND ND ND ND NDND ND ND ND ND
SAMPLE IDHDW9328
V:\1214\active\121415826\05_report_deliv\draft_doc\appendix\B\b1_in-situ_field_parameter_tables.xlsmField Parameters - SWPage 9 of 9
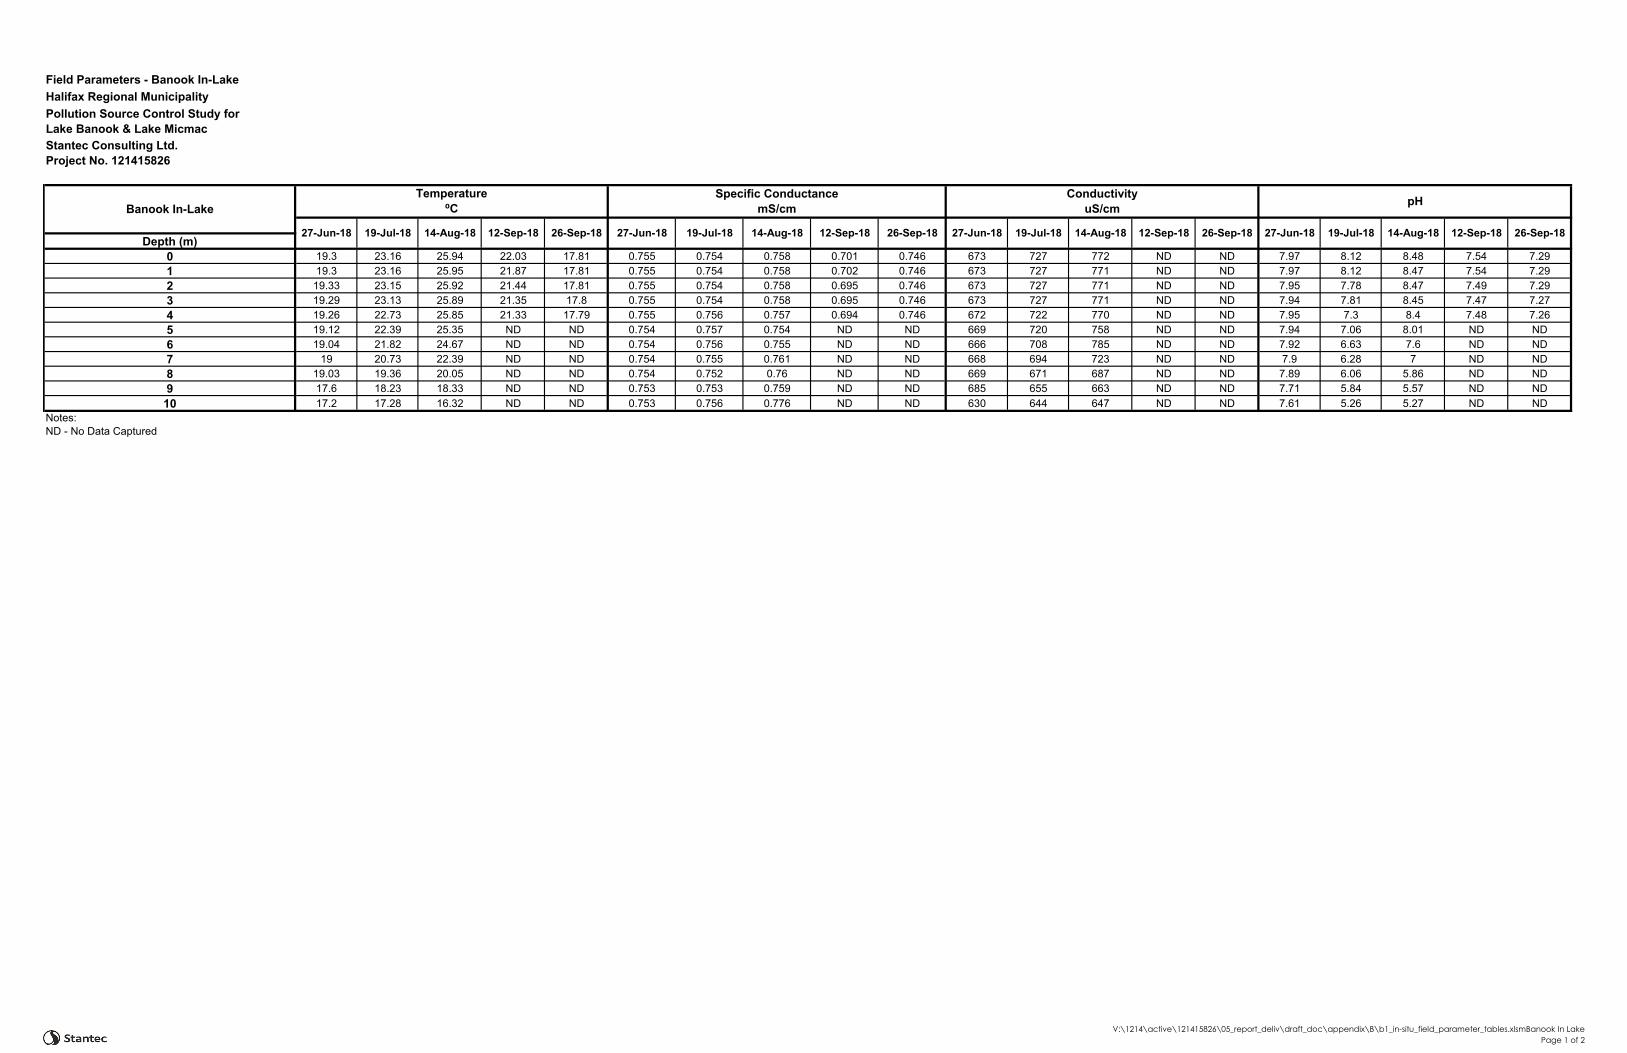
Depth (m)0 19.3 23.16 25.94 22.03 17.81 0.755 0.754 0.758 0.701 0.746 673 727 772 ND ND 7.97 8.12 8.48 7.54 7.291 19.3 23.16 25.95 21.87 17.81 0.755 0.754 0.758 0.702 0.746 673 727 771 ND ND 7.97 8.12 8.47 7.54 7.292 19.33 23.15 25.92 21.44 17.81 0.755 0.754 0.758 0.695 0.746 673 727 771 ND ND 7.95 7.78 8.47 7.49 7.293 19.29 23.13 25.89 21.35 17.8 0.755 0.754 0.758 0.695 0.746 673 727 771 ND ND 7.94 7.81 8.45 7.47 7.274 19.26 22.73 25.85 21.33 17.79 0.755 0.756 0.757 0.694 0.746 672 722 770 ND ND 7.95 7.3 8.4 7.48 7.265 19.12 22.39 25.35 ND ND 0.754 0.757 0.754 ND ND 669 720 758 ND ND 7.94 7.06 8.01 ND ND6 19.04 21.82 24.67 ND ND 0.754 0.756 0.755 ND ND 666 708 785 ND ND 7.92 6.63 7.6 ND ND7 19 20.73 22.39 ND ND 0.754 0.755 0.761 ND ND 668 694 723 ND ND 7.9 6.28 7 ND ND8 19.03 19.36 20.05 ND ND 0.754 0.752 0.76 ND ND 669 671 687 ND ND 7.89 6.06 5.86 ND ND9 17.6 18.23 18.33 ND ND 0.753 0.753 0.759 ND ND 685 655 663 ND ND 7.71 5.84 5.57 ND ND10 17.2 17.28 16.32 ND ND 0.753 0.756 0.776 ND ND 630 644 647 ND ND 7.61 5.26 5.27 ND ND
Notes: ND - No Data Captured
Field Parameters - Banook In-Lake Halifax Regional MunicipalityPollution Source Control Study for Lake Banook & Lake MicmacStantec Consulting Ltd. Project No. 121415826
Temperature⁰C
Specific ConductancemS/cm
ConductivityuS/cm pH
27-Jun-18 19-Jul-18 14-Aug-18 12-Sep-18 26-Sep-18 27-Jun-18 19-Jul-18 14-Aug-18 12-Sep-18 26-Sep-18 19-Jul-18 14-Aug-18 12-Sep-18 26-Sep-1827-Jun-18 19-Jul-18 14-Aug-18 12-Sep-18 26-Sep-18
Banook In-Lake
27-Jun-18
V:\1214\active\121415826\05_report_deliv\draft_doc\appendix\B\b1_in-situ_field_parameter_tables.xlsmBanook In LakePage 1 of 2
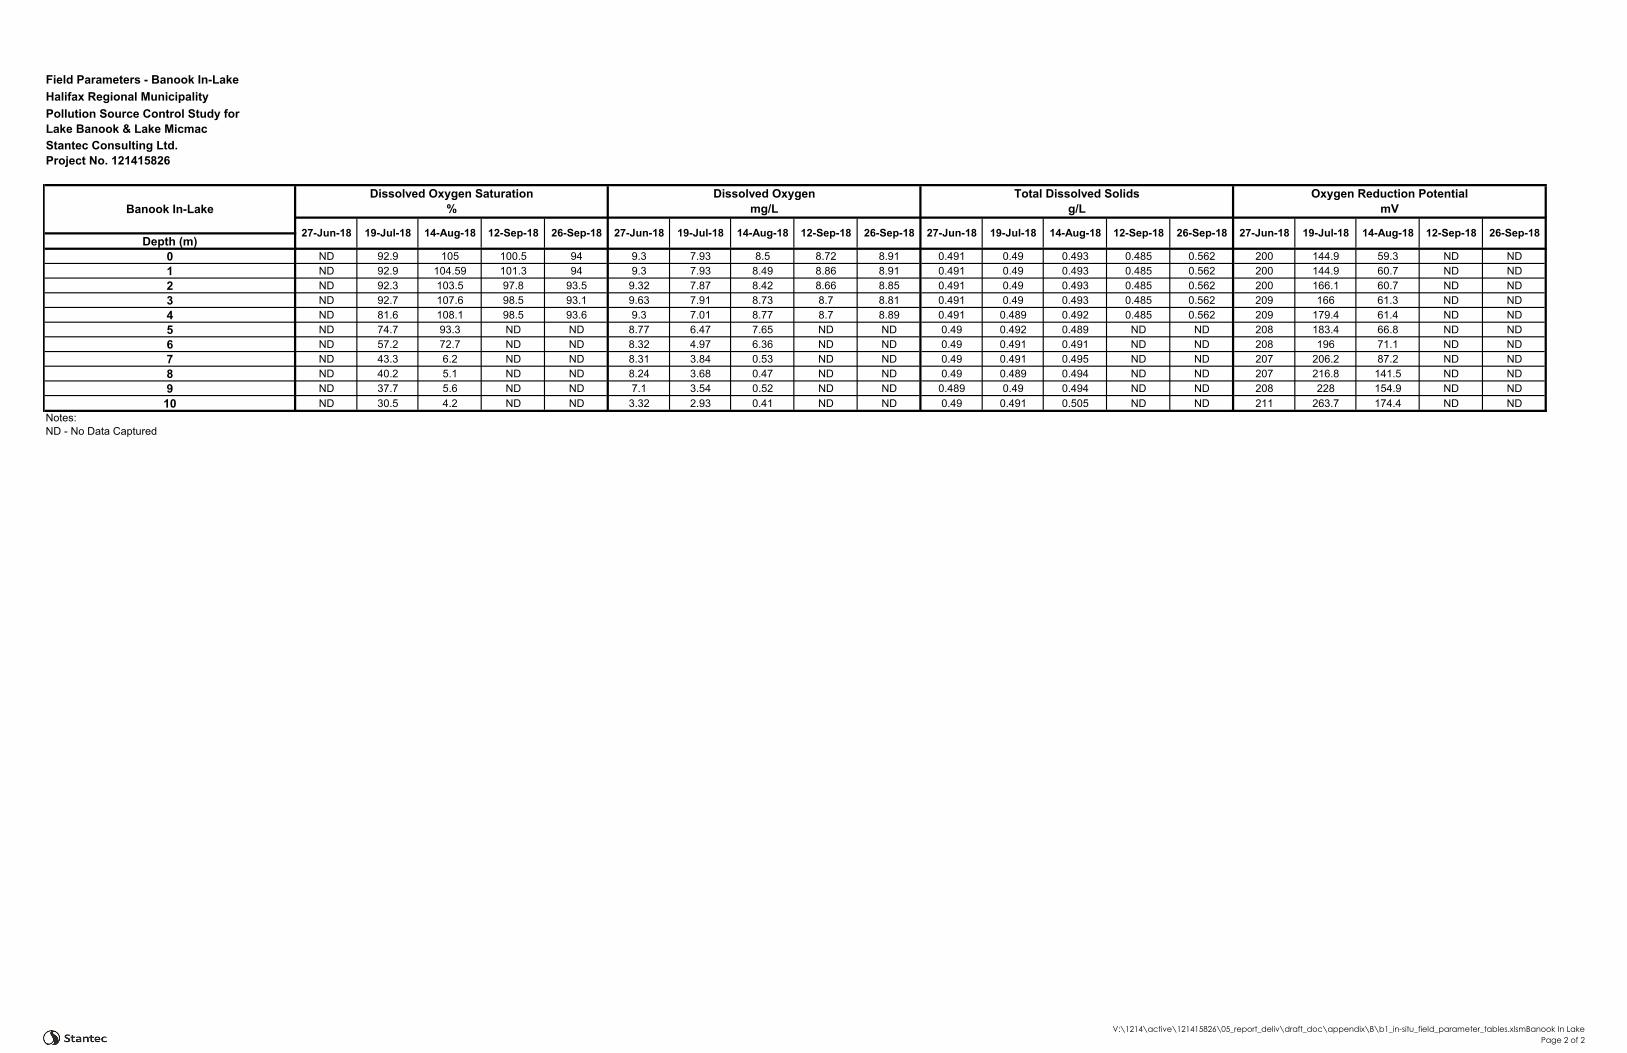
Depth (m)012345678910
Notes: ND - No Data Captured
Field Parameters - Banook In-Lake Halifax Regional MunicipalityPollution Source Control Study for Lake Banook & Lake MicmacStantec Consulting Ltd. Project No. 121415826
Banook In-Lake
ND 92.9 105 100.5 94 9.3 7.93 8.5 8.72 8.91 0.491 0.49 0.493 0.485 0.562 200 144.9 59.3 ND NDND 92.9 104.59 101.3 94 9.3 7.93 8.49 8.86 8.91 0.491 0.49 0.493 0.485 0.562 200 144.9 60.7 ND NDND 92.3 103.5 97.8 93.5 9.32 7.87 8.42 8.66 8.85 0.491 0.49 0.493 0.485 0.562 200 166.1 60.7 ND NDND 92.7 107.6 98.5 93.1 9.63 7.91 8.73 8.7 8.81 0.491 0.49 0.493 0.485 0.562 209 166 61.3 ND NDND 81.6 108.1 98.5 93.6 9.3 7.01 8.77 8.7 8.89 0.491 0.489 0.492 0.485 0.562 209 179.4 61.4 ND NDND 74.7 93.3 ND ND 8.77 6.47 7.65 ND ND 0.49 0.492 0.489 ND ND 208 183.4 66.8 ND NDND 57.2 72.7 ND ND 8.32 4.97 6.36 ND ND 0.49 0.491 0.491 ND ND 208 196 71.1 ND NDND 43.3 6.2 ND ND 8.31 3.84 0.53 ND ND 0.49 0.491 0.495 ND ND 207 206.2 87.2 ND NDND 40.2 5.1 ND ND 8.24 3.68 0.47 ND ND 0.49 0.489 0.494 ND ND 207 216.8 141.5 ND NDND 37.7 5.6 ND ND 7.1 3.54 0.52 ND ND 0.489 0.49 0.494 ND ND 208 228 154.9 ND NDND 30.5 4.2 ND ND 3.32 2.93 0.41 ND ND 0.49 0.491 0.505 ND ND 211 263.7 174.4 ND ND
Dissolved Oxygen Saturation%
Dissolved Oxygenmg/L
Total Dissolved Solidsg/L
Oxygen Reduction PotentialmV
26-Sep-1827-Jun-18 19-Jul-18 14-Aug-18 12-Sep-18 26-Sep-18 27-Jun-18 19-Jul-18 14-Aug-18 12-Sep-1827-Jun-18 19-Jul-18 14-Aug-18 12-Sep-18 26-Sep-1827-Jun-18 19-Jul-18 14-Aug-18 12-Sep-18 26-Sep-18
V:\1214\active\121415826\05_report_deliv\draft_doc\appendix\B\b1_in-situ_field_parameter_tables.xlsmBanook In LakePage 2 of 2

Depth (m)0 18.3 23.55 25.96 20.6 17.17 0.718 0.708 0.714 0.646 0.648 632 721 ND ND 7.46 7.78 8.07 6.84 7.531 18.3 23.55 26 20.85 17.17 0.718 0.708 0.716 0.648 0.645 632 689 730 ND ND 7.46 7.78 8.06 7.11 7.512 18.7 23.48 26 20.85 17.17 0.716 0.711 0.717 0.648 0.688 632 690 731 ND ND 7.69 7.75 8.05 7.16 7.523 18.7 23.55 26.03 20.84 17.17 0.716 0.713 0.717 0.648 0.692 631 692 731 ND ND 7.86 7.75 8.07 7.24 7.514 18.66 23.17 26.04 20.83 17.12 0.716 0.716 0.717 0.648 0.691 627 690 731 ND ND 7.84 7.62 8.08 7.94 7.495 18.42 22.82 26 ND ND 0.716 0.715 0.717 ND ND 626 685 731 ND ND 7.9 7.5 8.06 ND ND6 18.25 22.24 23.17 ND ND 0.716 0.722 0.725 ND ND 622 684 700 ND ND 7.95 7.27 7.38 ND ND
6.5 ND 21.42 ND ND ND ND 0.733 ND ND ND ND 682 ND ND ND ND 7.08 ND ND ND
ConductivityuS/cm pH
27-Jun-18
Specific ConductancemS/cm
14-Aug-1819-Jul-18 14-Aug-18 12-Sep-18 26-Sep-18 27-Jun-18 19-Jul-18
Field Parameters - Micmac In-Lake Halifax Regional MunicipalityPollution Source Control Study for Lake Banook & Lake MicmacStantec Consulting Ltd. Project No. 121415826
Temperature⁰CMicmac In-Lake
14-Aug-18 12-Sep-18 26-Sep-1827-Jun-18 19-Jul-18 14-Aug-18 12-Sep-18 26-Sep-18 27-Jun-18 19-Jul-18 12-Sep-18 26-Sep-18
V:\1214\active\121415826\05_report_deliv\draft_doc\appendix\B\b1_in-situ_field_parameter_tables.xlsmMicmac In LakePage 1 of 2
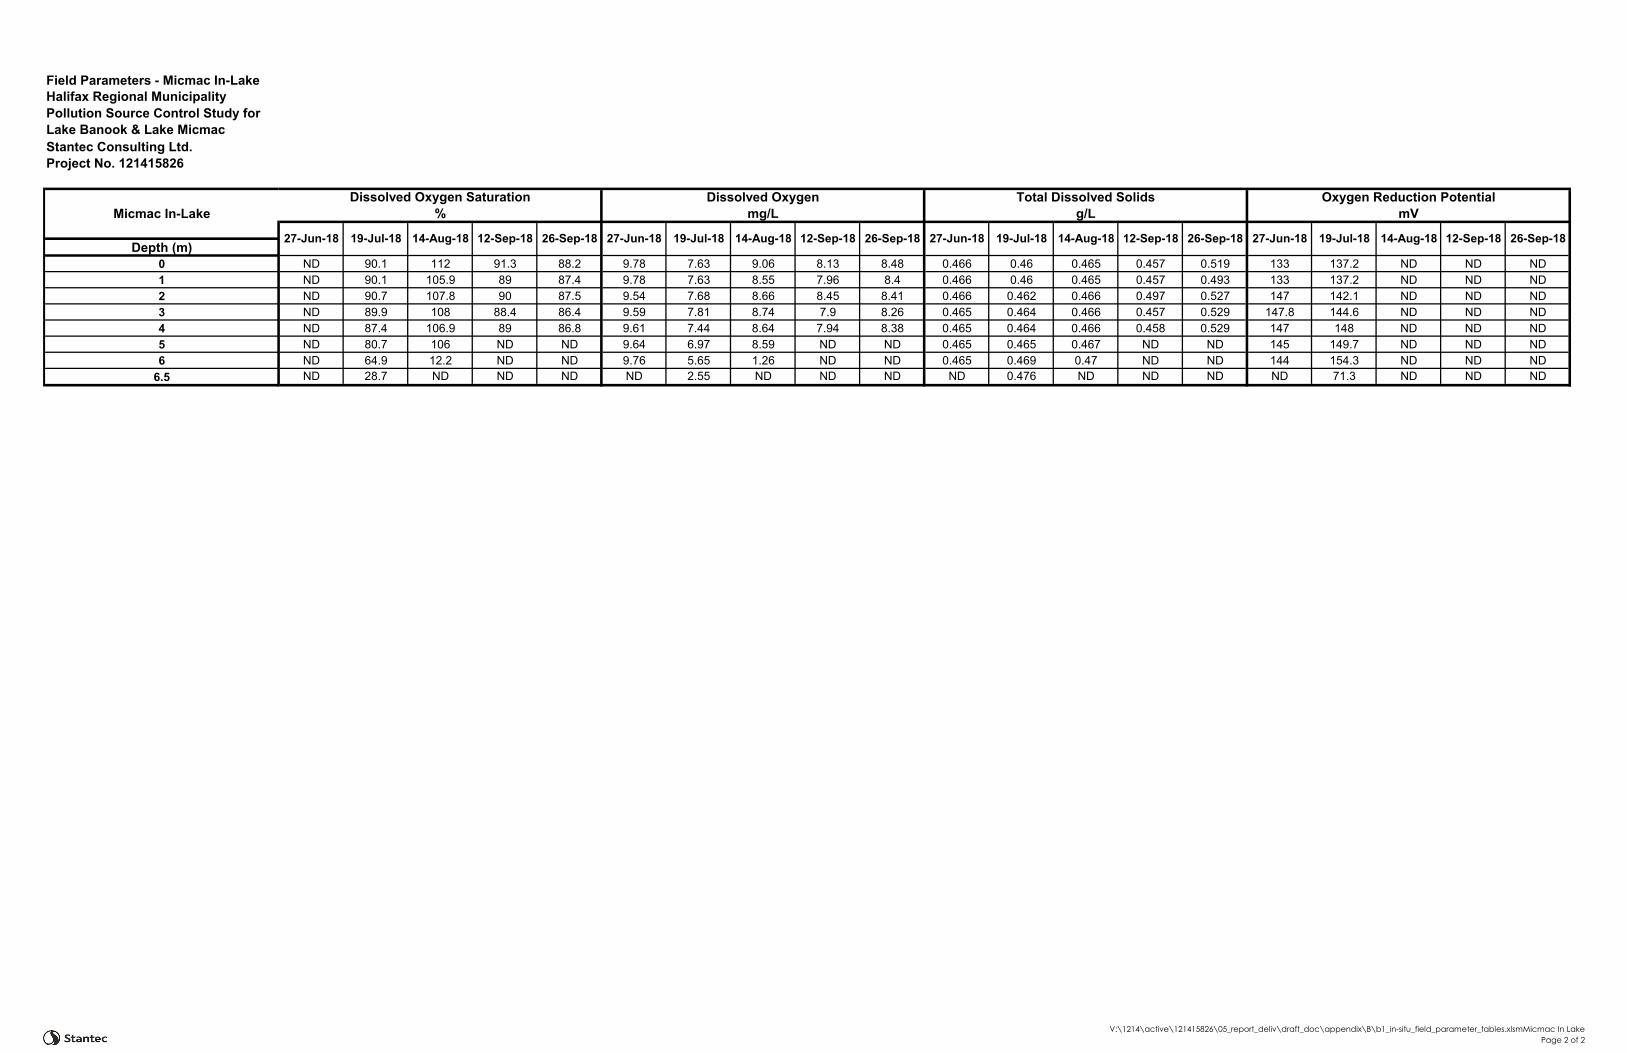
Depth (m)0123456
6.5
Field Parameters - Micmac In-Lake Halifax Regional MunicipalityPollution Source Control Study for Lake Banook & Lake MicmacStantec Consulting Ltd. Project No. 121415826
Micmac In-Lake
ND 90.1 112 91.3 88.2 9.78 7.63 9.06 8.13 8.48 0.466 0.46 0.465 0.457 0.519 133 137.2 ND ND NDND 90.1 105.9 89 87.4 9.78 7.63 8.55 7.96 8.4 0.466 0.46 0.465 0.457 0.493 133 137.2 ND ND NDND 90.7 107.8 90 87.5 9.54 7.68 8.66 8.45 8.41 0.466 0.462 0.466 0.497 0.527 147 142.1 ND ND NDND 89.9 108 88.4 86.4 9.59 7.81 8.74 7.9 8.26 0.465 0.464 0.466 0.457 0.529 147.8 144.6 ND ND NDND 87.4 106.9 89 86.8 9.61 7.44 8.64 7.94 8.38 0.465 0.464 0.466 0.458 0.529 147 148 ND ND NDND 80.7 106 ND ND 9.64 6.97 8.59 ND ND 0.465 0.465 0.467 ND ND 145 149.7 ND ND NDND 64.9 12.2 ND ND 9.76 5.65 1.26 ND ND 0.465 0.469 0.47 ND ND 144 154.3 ND ND NDND 28.7 ND ND ND ND 2.55 ND ND ND ND 0.476 ND ND ND ND 71.3 ND ND ND
Oxygen Reduction PotentialmV
Dissolved Oxygen Saturation%
Dissolved Oxygenmg/L
Total Dissolved Solidsg/L
19-Jul-18 14-Aug-18 12-Sep-18 26-Sep-1827-Jun-18 19-Jul-18 14-Aug-18 12-Sep-18 26-Sep-18 27-Jun-1826-Sep-1827-Jun-18 19-Jul-18 14-Aug-18 12-Sep-1827-Jun-18 19-Jul-18 14-Aug-18 12-Sep-18 26-Sep-18
V:\1214\active\121415826\05_report_deliv\draft_doc\appendix\B\b1_in-situ_field_parameter_tables.xlsmMicmac In LakePage 2 of 2

B.4 – Surface Water Grab Samples

Table B.1 Surface Water Analytical Data - BANOOK 1
Minimum Median Mean Maximum
Date Sampled: 27-Jun-18 19-Jul-18 14-Aug-18 12-Sep-18 26-Sep-18
Parameter
Calculated Parameters
Anion Sum meq/L 6.41 6.54 6.54 6.63 - - 6.49 6.54 6.63 6.41 6.62
Bicarbonate (as CaCO3) mg/L 31 35 34.8 39 - - 31 34 35 35 39
Total Dissolved Solids mg/L 370 380 378 380 - - 380 370 380 380 380
Carbonate (as CaCO3) mg/L <1 <1 <1 <1 - - <1.0 <1.0 <1.0 <1.0 <1.0
Cation Sum meq/L 6.18 6.28 6.31 6.46 - - 6.39 6.18 6.28 6.46 6.24
Hardness (as CaCO3) mg/L 64 65 65.2 67 - - 64 64 66 67 65
Ion Balance (% Difference) % 0.39 2.71 1.93 2.95 - - 0.780 2.83 2.71 0.390 2.95
Langelier Index (@ 20C) - -1.01 -0.838 -0.83 -0.698 - - -1.01 -0.838 -0.698 -0.876 -0.730
Langelier Index (@ 4C) - -1.26 -1.09 -1.08 -0.946 - - -1.26 -1.09 -0.946 -1.13 -0.979
Nitrate (as N) mg/L <0.05 <0.05 <0.05 0.13 13 - 0.13 <0.050 <0.050 <0.050 <0.050
Saturation pH (@ 20C) - 8.5 8.54 8.55 8.59 - - 8.59 8.57 8.54 8.54 8.50
Saturation pH (@ 4C) - 8.75 8.79 8.8 8.84 - - 8.84 8.82 8.79 8.79 8.75
Inorganics
Alkalinity (as CaCO3) mg/L 32 35 35.4 40 - - 32 34 36 35 40
Chloride mg/L 190 190 192 200 120 - 190 190 200 190 190
Colour TCU <5 <5 <5 6.6 - - 6.6 <5.0 <5.0 <5.0 <5.0
Nitrate + Nitrite (as N) mg/L <0.05 <0.05 <0.05 0.13 - - 0.13 <0.050 <0.050 <0.050 <0.050
Nitrite mg/L <0.01 <0.01 <0.01 <0.01 0.06 - <0.010 <0.010 <0.010 <0.010 <0.010
Ammonia mg/L <0.05 <0.05 <0.05 <0.05 20 - <0.050 <0.050 <0.050 <0.050 <0.050
Kjeldahl Nitrogen (TKN) mg/L <0.1 0.1 0.1 0.18 - - 0.18 0.12 0.10 <0.10 <0.10
TOC mg/L 2.5 2.6 2.6 2.7 - - 2.6 2.7 2.7 2.5 2.5
Ortho Phosphate (as P) mg/L <0.001 0.0024 0.00288 <0.01 - - <0.010 <0.001 <0.010 0.0024 0.0015
Low Level Orthophosphate mg/L 0.0019 <0.003 <0.003 <0.003 - - 0.0019 - <0.0030 - -
pH pH 7.58 7.73 7.72 7.84 6.5 to 9.0 5.0 to 9.0 7.58 7.73 7.84 7.67 7.77
Reactive Silica (as SiO2) mg/L 0.53 1.9 1.89 3 - - 0.53 1.1 1.9 3.0 2.9
Sulphate mg/L 17 18 18.6 21 - - 21 20 18 17 17
Turbidity NTU 0.59 0.72 0.754 1.1 - 50 0.72 0.63 1.1 0.73 0.59
Conductivity µS/cm 740 760 764 790 - - 760 790 770 760 740
Phosphorus mg/L <0.004 0.006 0.005 0.007 - - 0.004 <0.004 0.006 0.006 0.007
TSS mg/L <1 <1 <1 <1 - - <1.0 <1.0 <1.0 <1.0 <1.0
Metals
Calcium µg/L 22000 22000 22400 23000 - - 22000 22000 23000 23000 22000
Copper µg/L <2 <2 <2 <2 2 - <2.0 <2.0 <2.0 <2.0 <2.0
Iron µg/L <50 <50 <50 <50 300 - <50 <50 <50 <50 <50
Magnesium µg/L 2100 2300 2320 2500 - - 2100 2300 2400 2500 2300
Manganese µg/L 43 59 58.6 82 - - 82 43 59 50 59
Potassium µg/L 1600 1600 1640 1700 - - 1600 1600 1600 1700 1700
Sodium µg/L 110000 110000 114000 120000 - - 120000 110000 110000 120000 110000
Zinc µg/L <5 <5 <5 <5 30 - <5.0 <5.0 <5.0 <5.0 <5.0
Microbiological
Escherichia coli CFU/100mL 10 10 10 20 - 400 10 20 <10 <10 10
Enterococci CFU/100mL 5 7.5 7.5 10 - 70 5.0 10 - - -
Chlorophyll a
Chl a - Acidification μg/L 0.92 1.48 1.98 3.64 - - 2.84 1.48 3.64 0.92 1.02
Chl a - Welschmeyer μg/L 1.45 2.69 2.69 3.93 - - 3.93 1.45 - - -
Genetic Markers
Average Human Marker Log copies/100 mL water <1.1 <1.1 <1.1 <1.1 - - <1.1 <1.1 <1.1 <1.1 <1.1
Average Avian Marker Log copies/100 mL water <1.1 1.7 1.54 2.34 - - 1.81 1.7 1.28 2.34 <1.1
Average Dog Marker Log copies/100 mL water <1.1 <1.1 <1.1 <1.1 - - <1.1 <1.1 <1.1 <1.1 <1.1
ResultsGCRWQParameter UnitsStatistics
CCME FAL
121415826Page 1 of 38

Table B.2 Surface Water Analytical Data - BANOOK 2
Minimum Median Mean Maximum
Date Sampled: 27-Jun-18 19-Jul-18 14-Aug-18 12-Sep-18 26-Sep-18
Parameter
Calculated Parameters
Anion Sum meq/L 6.6 6.63 6.72 6.99 - - 6.61 6.60 6.99 6.63 6.77
Bicarbonate (as CaCO3) mg/L 31 39 39.2 46 - - 31 35 46 45 39
Total Dissolved Solids mg/L 380 380 384 390 - - 380 380 390 390 380
Carbonate (as CaCO3) mg/L <1 <1 <1 <1 - - <1.0 <1.0 <1.0 <1.0 <1.0
Cation Sum meq/L 6.07 6.31 6.28 6.53 - - 6.33 6.16 6.31 6.53 6.07
Hardness (as CaCO3) mg/L 63 65 65.8 70 - - 63 65 68 70 63
Ion Balance (% Difference) % 0.76 3.45 3.39 5.45 - - 2.16 3.45 5.11 0.760 5.45
Langelier Index (@ 20C) - -1.1 -1.05 -1.01 -0.877 - - -1.06 -1.10 -0.943 -1.05 -0.877
Langelier Index (@ 4C) - -1.35 -1.3 -1.26 -1.13 - - -1.31 -1.35 -1.19 -1.30 -1.13
Nitrate (as N) mg/L <0.05 <0.05 0.0604 0.16 13 - 0.16 0.067 <0.050 <0.050 <0.050
Saturation pH (@ 20C) - 8.41 8.51 8.5 8.61 - - 8.61 8.55 8.41 8.41 8.51
Saturation pH (@ 4C) - 8.65 8.76 8.74 8.85 - - 8.85 8.80 8.66 8.65 8.76
Inorganics
Alkalinity (as CaCO3) mg/L 31 39 39.4 46 - - 31 35 46 46 39
Chloride mg/L 190 200 196 200 120 - 200 190 200 190 200
Colour TCU <5 5.1 <5 6.6 - - <5.0 <5.0 5.1 6.6 5.6
Nitrate + Nitrite (as N) mg/L <0.05 <0.05 0.071 0.16 - - 0.16 0.12 <0.050 <0.050 <0.050
Nitrite mg/L <0.01 <0.01 0.0202 0.05 0.06 - <0.010 0.050 0.036 <0.010 <0.010
Ammonia mg/L <0.05 0.14 0.119 0.23 20 - 0.051 0.14 0.15 0.23 <0.050
Kjeldahl Nitrogen (TKN) mg/L 0.11 0.23 0.21 0.27 - - 0.25 0.23 0.19 0.27 0.11
TOC mg/L 2.3 2.5 2.44 2.6 - - 2.5 2.3 2.3 2.6 2.5
Ortho Phosphate (as P) mg/L 0.0013 <0.01 <0.01 <0.01 - - <0.010 0.002 <0.010 0.0052 0.0013
Low Level Orthophosphate mg/L 0.0024 0.0028 0.0028 0.0032 - - 0.0024 - 0.0032 - -
pH pH 7.35 7.47 7.49 7.64 6.5 to 9.0 5.0 to 9.0 7.55 7.44 7.47 7.35 7.64
Reactive Silica (as SiO2) mg/L 0.71 2.7 2.26 3.1 - - 0.71 1.9 2.7 3.1 2.9
Sulphate mg/L 17 18 18.8 21 - - 21 20 18 18 17
Turbidity NTU 0.6 1.1 1.47 2.6 - 50 0.66 2.6 2.4 1.1 0.60
Conductivity µS/cm 740 780 774 790 - - 780 780 790 780 740
Phosphorus mg/L 0.006 0.007 0.007 0.008 - - 0.007 0.008 0.006 0.008 0.006
TSS mg/L <1 <1 <1 1.9 - - <1.0 1.9 <1.1 1.4 <1.0
Metals
Calcium µg/L 22000 22000 22800 24000 - - 22000 22000 24000 24000 22000
Copper µg/L 3 5.1 5.48 9.4 2 - 5.8 9.4 4.1 3.0 5.1
Iron µg/L <50 <50 <50 140 300 - <50 140 <50 <50 <50
Magnesium µg/L 2000 2300 2260 2400 - - 2000 2300 2300 2400 2300
Manganese µg/L 46 450 2050 6800 - - 46 450 2900 6800 65
Potassium µg/L 1600 1700 1700 1900 - - 1600 1700 1700 1900 1600
Sodium µg/L 110000 110000 114000 120000 - - 120000 110000 110000 120000 110000
Zinc µg/L <5 <5 5.22 11 30 - <5.0 11 <5.0 7.6 <5.0
Microbiological
Escherichia coli CFU/100mL <10 <10 <10 10 - 400 <10 <10 <10 10 <10
Enterococci CFU/100mL 2 <10 <10 <10 - 70 2.0 <10 - - -
Genetic Markers
Average Human Marker Log copies/100 mL water <1.1 <1.1 <1.1 <1.1 - - <1.1 <1.1 - - -
Average Avian Marker Log copies/100 mL water 1.84 2.06 2.06 2.28 - - 2.28 1.84 - - -
Average Dog Marker Log copies/100 mL water <1.1 <1.1 <1.1 <1.1 - - <1.1 <1.1 - - -
ResultsGCRWQParameter UnitsStatistics
CCME FAL
121415826Page 2 of 38

Table B.19 Surface Water Analytical Data - BANOOK 3
Minimum Median Mean Maximum
Date Sampled: 14-Aug-18
Parameter
Calculated Parameters
Anion Sum meq/L 6.7 6.7 6.7 6.7 - - 6.70
Bicarbonate (as CaCO3) mg/L 38 38 38 38 - - 38
Total Dissolved Solids mg/L 380 380 380 380 - - 380
Carbonate (as CaCO3) mg/L <1 <1 <1 <1 - - <1.0
Cation Sum meq/L 6.34 6.34 6.34 6.34 - - 6.34
Hardness (as CaCO3) mg/L 66 66 66 66 - - 66
Ion Balance (% Difference) % 2.76 2.76 2.76 2.76 - - 2.76
Langelier Index (@ 20C) - -1.16 -1.16 -1.16 -1.16 - - -1.16
Langelier Index (@ 4C) - -1.41 -1.41 -1.41 -1.41 - - -1.41
Nitrate (as N) mg/L <0.05 <0.05 <0.05 <0.05 13 - <0.050
Saturation pH (@ 20C) - 8.51 8.51 8.51 8.51 - - 8.51
Saturation pH (@ 4C) - 8.76 8.76 8.76 8.76 - - 8.76
Inorganics
Alkalinity (as CaCO3) mg/L 38 38 38 38 - - 38
Chloride mg/L 200 200 200 200 120 - 200
Colour TCU 6.4 6.4 6.4 6.4 - - 6.4
Nitrate + Nitrite (as N) mg/L 0.14 0.14 0.14 0.14 - - 0.14
Nitrite mg/L 0.11 0.11 0.11 0.11 0.06 - 0.11
Ammonia mg/L <0.05 <0.05 <0.05 <0.05 20 - <0.050
Kjeldahl Nitrogen (TKN) mg/L 0.16 0.16 0.16 0.16 - - 0.16
TOC mg/L 2.5 2.5 2.5 2.5 - - 2.5
Ortho Phosphate (as P) mg/L <0.01 <0.01 <0.01 <0.01 - - <0.010
Low Level Orthophosphate mg/L 0.0091 0.0091 0.0091 0.0091 - - 0.0091
pH pH 7.36 7.36 7.36 7.36 6.5 to 9.0 5.0 to 9.0 7.36
Reactive Silica (as SiO2) mg/L 2.9 2.9 2.9 2.9 - - 2.9
Sulphate mg/L 17 17 17 17 - - 17
Turbidity NTU 3 3 3 3 - 50 3.0
Conductivity µS/cm 760 760 760 760 - - 760
Phosphorus mg/L <0.004 <0.004 <0.004 <0.004 - - <0.004
TSS mg/L <1 <1 <1 <1 - - <1.0
Metals
Calcium µg/L 23000 23000 23000 23000 - - 23000
Copper µg/L 6.2 6.2 6.2 6.2 2 - 6.2
Iron µg/L <50 <50 <50 <50 300 - <50
Magnesium µg/L 2400 2400 2400 2400 - - 2400
Manganese µg/L 290 290 290 290 - - 290
Potassium µg/L 1700 1700 1700 1700 - - 1700
Sodium µg/L 110000 110000 110000 110000 - - 110000
Zinc µg/L <5 <5 <5 <5 30 - <5.0
Microbiological
Escherichia coli CFU/100mL <10 <10 <10 <10 - 400 <10
Chlorophyll a
Chl a - Acidification μg/L 2.16 2.16 2.16 2.16 - - 2.16
ResultsGCRWQParameter UnitsStatistics
CCME FAL
121415826Page 3 of 38
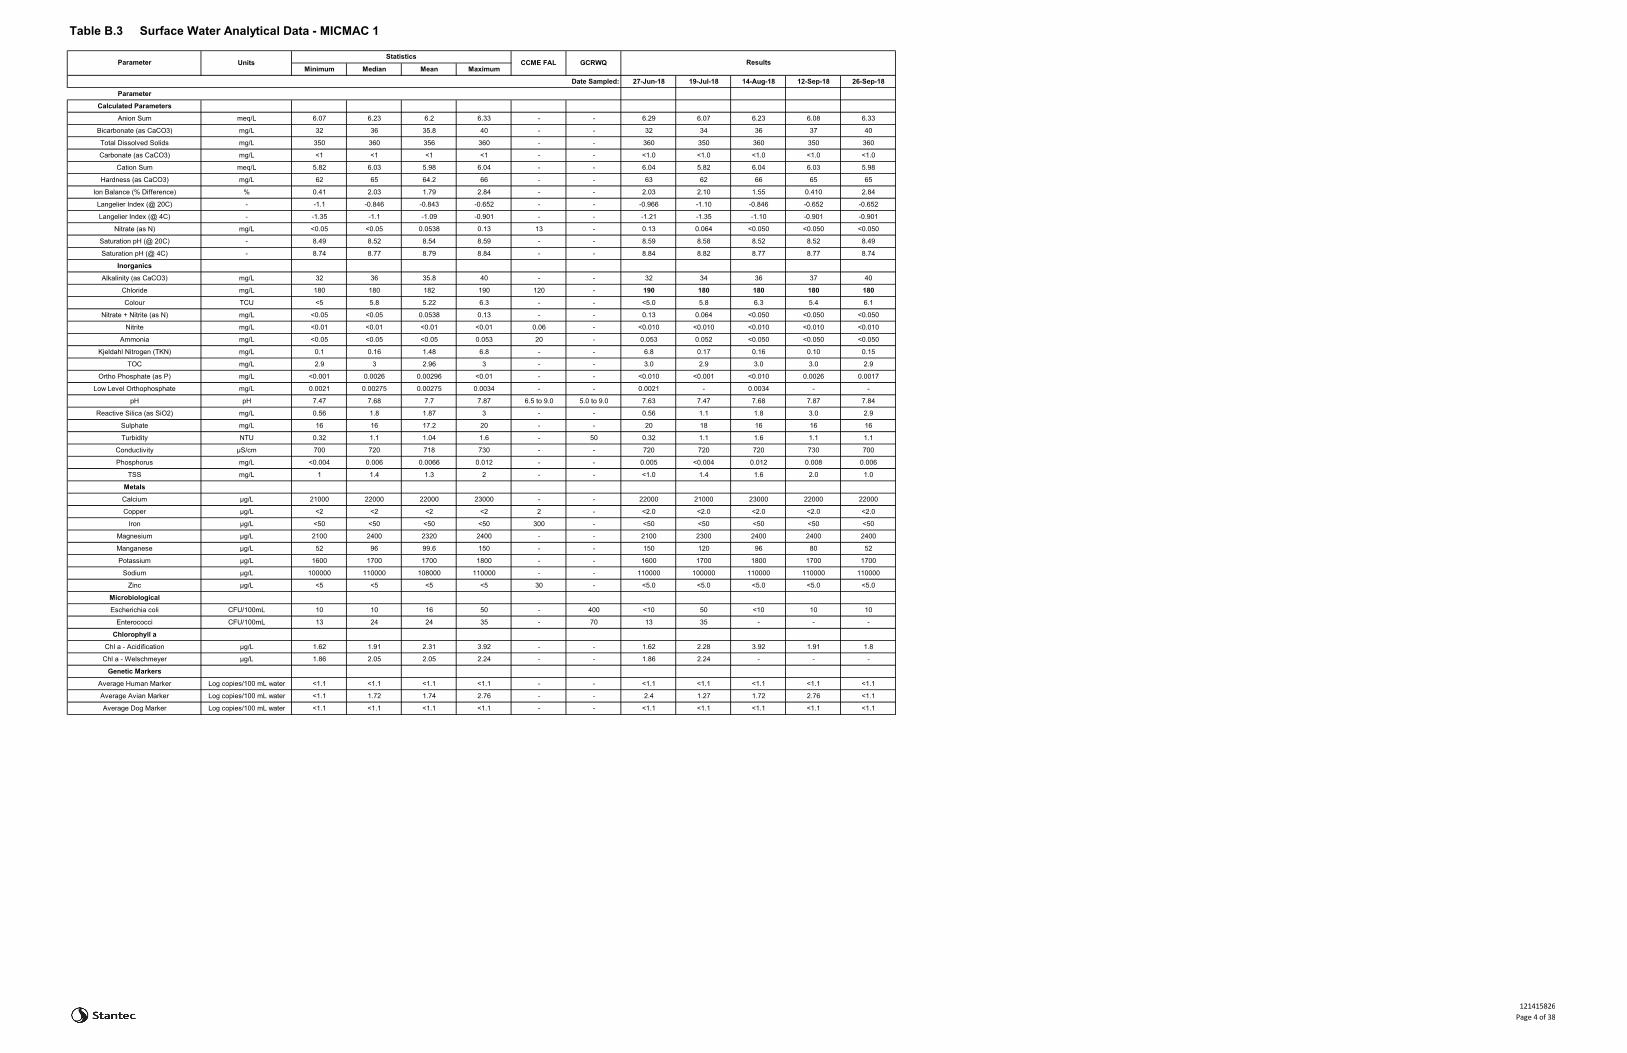
Table B.3 Surface Water Analytical Data - MICMAC 1
Minimum Median Mean Maximum
Date Sampled: 27-Jun-18 19-Jul-18 14-Aug-18 12-Sep-18 26-Sep-18
Parameter
Calculated Parameters
Anion Sum meq/L 6.07 6.23 6.2 6.33 - - 6.29 6.07 6.23 6.08 6.33
Bicarbonate (as CaCO3) mg/L 32 36 35.8 40 - - 32 34 36 37 40
Total Dissolved Solids mg/L 350 360 356 360 - - 360 350 360 350 360
Carbonate (as CaCO3) mg/L <1 <1 <1 <1 - - <1.0 <1.0 <1.0 <1.0 <1.0
Cation Sum meq/L 5.82 6.03 5.98 6.04 - - 6.04 5.82 6.04 6.03 5.98
Hardness (as CaCO3) mg/L 62 65 64.2 66 - - 63 62 66 65 65
Ion Balance (% Difference) % 0.41 2.03 1.79 2.84 - - 2.03 2.10 1.55 0.410 2.84
Langelier Index (@ 20C) - -1.1 -0.846 -0.843 -0.652 - - -0.966 -1.10 -0.846 -0.652 -0.652
Langelier Index (@ 4C) - -1.35 -1.1 -1.09 -0.901 - - -1.21 -1.35 -1.10 -0.901 -0.901
Nitrate (as N) mg/L <0.05 <0.05 0.0538 0.13 13 - 0.13 0.064 <0.050 <0.050 <0.050
Saturation pH (@ 20C) - 8.49 8.52 8.54 8.59 - - 8.59 8.58 8.52 8.52 8.49
Saturation pH (@ 4C) - 8.74 8.77 8.79 8.84 - - 8.84 8.82 8.77 8.77 8.74
Inorganics
Alkalinity (as CaCO3) mg/L 32 36 35.8 40 - - 32 34 36 37 40
Chloride mg/L 180 180 182 190 120 - 190 180 180 180 180
Colour TCU <5 5.8 5.22 6.3 - - <5.0 5.8 6.3 5.4 6.1
Nitrate + Nitrite (as N) mg/L <0.05 <0.05 0.0538 0.13 - - 0.13 0.064 <0.050 <0.050 <0.050
Nitrite mg/L <0.01 <0.01 <0.01 <0.01 0.06 - <0.010 <0.010 <0.010 <0.010 <0.010
Ammonia mg/L <0.05 <0.05 <0.05 0.053 20 - 0.053 0.052 <0.050 <0.050 <0.050
Kjeldahl Nitrogen (TKN) mg/L 0.1 0.16 1.48 6.8 - - 6.8 0.17 0.16 0.10 0.15
TOC mg/L 2.9 3 2.96 3 - - 3.0 2.9 3.0 3.0 2.9
Ortho Phosphate (as P) mg/L <0.001 0.0026 0.00296 <0.01 - - <0.010 <0.001 <0.010 0.0026 0.0017
Low Level Orthophosphate mg/L 0.0021 0.00275 0.00275 0.0034 - - 0.0021 - 0.0034 - -
pH pH 7.47 7.68 7.7 7.87 6.5 to 9.0 5.0 to 9.0 7.63 7.47 7.68 7.87 7.84
Reactive Silica (as SiO2) mg/L 0.56 1.8 1.87 3 - - 0.56 1.1 1.8 3.0 2.9
Sulphate mg/L 16 16 17.2 20 - - 20 18 16 16 16
Turbidity NTU 0.32 1.1 1.04 1.6 - 50 0.32 1.1 1.6 1.1 1.1
Conductivity µS/cm 700 720 718 730 - - 720 720 720 730 700
Phosphorus mg/L <0.004 0.006 0.0066 0.012 - - 0.005 <0.004 0.012 0.008 0.006
TSS mg/L 1 1.4 1.3 2 - - <1.0 1.4 1.6 2.0 1.0
Metals
Calcium µg/L 21000 22000 22000 23000 - - 22000 21000 23000 22000 22000
Copper µg/L <2 <2 <2 <2 2 - <2.0 <2.0 <2.0 <2.0 <2.0
Iron µg/L <50 <50 <50 <50 300 - <50 <50 <50 <50 <50
Magnesium µg/L 2100 2400 2320 2400 - - 2100 2300 2400 2400 2400
Manganese µg/L 52 96 99.6 150 - - 150 120 96 80 52
Potassium µg/L 1600 1700 1700 1800 - - 1600 1700 1800 1700 1700
Sodium µg/L 100000 110000 108000 110000 - - 110000 100000 110000 110000 110000
Zinc µg/L <5 <5 <5 <5 30 - <5.0 <5.0 <5.0 <5.0 <5.0
Microbiological
Escherichia coli CFU/100mL 10 10 16 50 - 400 <10 50 <10 10 10
Enterococci CFU/100mL 13 24 24 35 - 70 13 35 - - -
Chlorophyll a
Chl a - Acidification μg/L 1.62 1.91 2.31 3.92 - - 1.62 2.28 3.92 1.91 1.8
Chl a - Welschmeyer μg/L 1.86 2.05 2.05 2.24 - - 1.86 2.24 - - -
Genetic Markers
Average Human Marker Log copies/100 mL water <1.1 <1.1 <1.1 <1.1 - - <1.1 <1.1 <1.1 <1.1 <1.1
Average Avian Marker Log copies/100 mL water <1.1 1.72 1.74 2.76 - - 2.4 1.27 1.72 2.76 <1.1
Average Dog Marker Log copies/100 mL water <1.1 <1.1 <1.1 <1.1 - - <1.1 <1.1 <1.1 <1.1 <1.1
ResultsGCRWQParameter UnitsStatistics
CCME FAL
121415826Page 4 of 38
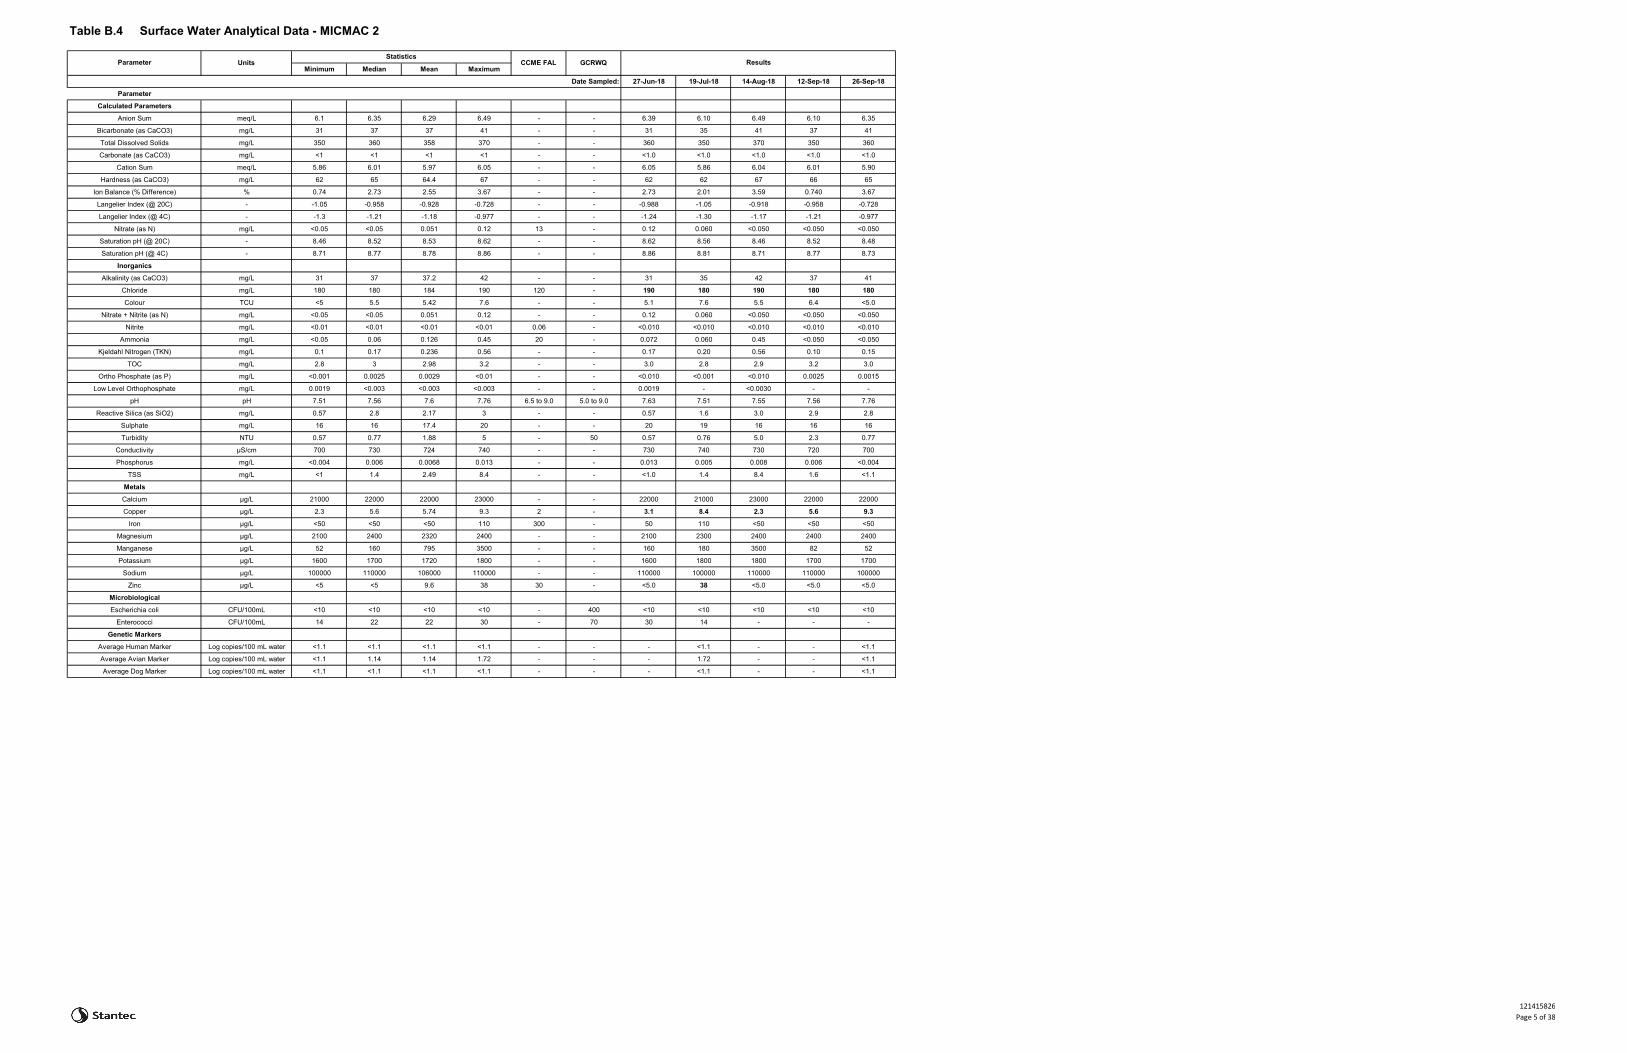
Table B.4 Surface Water Analytical Data - MICMAC 2
Minimum Median Mean Maximum
Date Sampled: 27-Jun-18 19-Jul-18 14-Aug-18 12-Sep-18 26-Sep-18
Parameter
Calculated Parameters
Anion Sum meq/L 6.1 6.35 6.29 6.49 - - 6.39 6.10 6.49 6.10 6.35
Bicarbonate (as CaCO3) mg/L 31 37 37 41 - - 31 35 41 37 41
Total Dissolved Solids mg/L 350 360 358 370 - - 360 350 370 350 360
Carbonate (as CaCO3) mg/L <1 <1 <1 <1 - - <1.0 <1.0 <1.0 <1.0 <1.0
Cation Sum meq/L 5.86 6.01 5.97 6.05 - - 6.05 5.86 6.04 6.01 5.90
Hardness (as CaCO3) mg/L 62 65 64.4 67 - - 62 62 67 66 65
Ion Balance (% Difference) % 0.74 2.73 2.55 3.67 - - 2.73 2.01 3.59 0.740 3.67
Langelier Index (@ 20C) - -1.05 -0.958 -0.928 -0.728 - - -0.988 -1.05 -0.918 -0.958 -0.728
Langelier Index (@ 4C) - -1.3 -1.21 -1.18 -0.977 - - -1.24 -1.30 -1.17 -1.21 -0.977
Nitrate (as N) mg/L <0.05 <0.05 0.051 0.12 13 - 0.12 0.060 <0.050 <0.050 <0.050
Saturation pH (@ 20C) - 8.46 8.52 8.53 8.62 - - 8.62 8.56 8.46 8.52 8.48
Saturation pH (@ 4C) - 8.71 8.77 8.78 8.86 - - 8.86 8.81 8.71 8.77 8.73
Inorganics
Alkalinity (as CaCO3) mg/L 31 37 37.2 42 - - 31 35 42 37 41
Chloride mg/L 180 180 184 190 120 - 190 180 190 180 180
Colour TCU <5 5.5 5.42 7.6 - - 5.1 7.6 5.5 6.4 <5.0
Nitrate + Nitrite (as N) mg/L <0.05 <0.05 0.051 0.12 - - 0.12 0.060 <0.050 <0.050 <0.050
Nitrite mg/L <0.01 <0.01 <0.01 <0.01 0.06 - <0.010 <0.010 <0.010 <0.010 <0.010
Ammonia mg/L <0.05 0.06 0.126 0.45 20 - 0.072 0.060 0.45 <0.050 <0.050
Kjeldahl Nitrogen (TKN) mg/L 0.1 0.17 0.236 0.56 - - 0.17 0.20 0.56 0.10 0.15
TOC mg/L 2.8 3 2.98 3.2 - - 3.0 2.8 2.9 3.2 3.0
Ortho Phosphate (as P) mg/L <0.001 0.0025 0.0029 <0.01 - - <0.010 <0.001 <0.010 0.0025 0.0015
Low Level Orthophosphate mg/L 0.0019 <0.003 <0.003 <0.003 - - 0.0019 - <0.0030 - -
pH pH 7.51 7.56 7.6 7.76 6.5 to 9.0 5.0 to 9.0 7.63 7.51 7.55 7.56 7.76
Reactive Silica (as SiO2) mg/L 0.57 2.8 2.17 3 - - 0.57 1.6 3.0 2.9 2.8
Sulphate mg/L 16 16 17.4 20 - - 20 19 16 16 16
Turbidity NTU 0.57 0.77 1.88 5 - 50 0.57 0.76 5.0 2.3 0.77
Conductivity µS/cm 700 730 724 740 - - 730 740 730 720 700
Phosphorus mg/L <0.004 0.006 0.0068 0.013 - - 0.013 0.005 0.008 0.006 <0.004
TSS mg/L <1 1.4 2.49 8.4 - - <1.0 1.4 8.4 1.6 <1.1
Metals
Calcium µg/L 21000 22000 22000 23000 - - 22000 21000 23000 22000 22000
Copper µg/L 2.3 5.6 5.74 9.3 2 - 3.1 8.4 2.3 5.6 9.3
Iron µg/L <50 <50 <50 110 300 - 50 110 <50 <50 <50
Magnesium µg/L 2100 2400 2320 2400 - - 2100 2300 2400 2400 2400
Manganese µg/L 52 160 795 3500 - - 160 180 3500 82 52
Potassium µg/L 1600 1700 1720 1800 - - 1600 1800 1800 1700 1700
Sodium µg/L 100000 110000 106000 110000 - - 110000 100000 110000 110000 100000
Zinc µg/L <5 <5 9.6 38 30 - <5.0 38 <5.0 <5.0 <5.0
Microbiological
Escherichia coli CFU/100mL <10 <10 <10 <10 - 400 <10 <10 <10 <10 <10
Enterococci CFU/100mL 14 22 22 30 - 70 30 14 - - -
Genetic Markers
Average Human Marker Log copies/100 mL water <1.1 <1.1 <1.1 <1.1 - - - <1.1 - - <1.1
Average Avian Marker Log copies/100 mL water <1.1 1.14 1.14 1.72 - - - 1.72 - - <1.1
Average Dog Marker Log copies/100 mL water <1.1 <1.1 <1.1 <1.1 - - - <1.1 - - <1.1
ResultsGCRWQParameter UnitsStatistics
CCME FAL
121415826Page 5 of 38
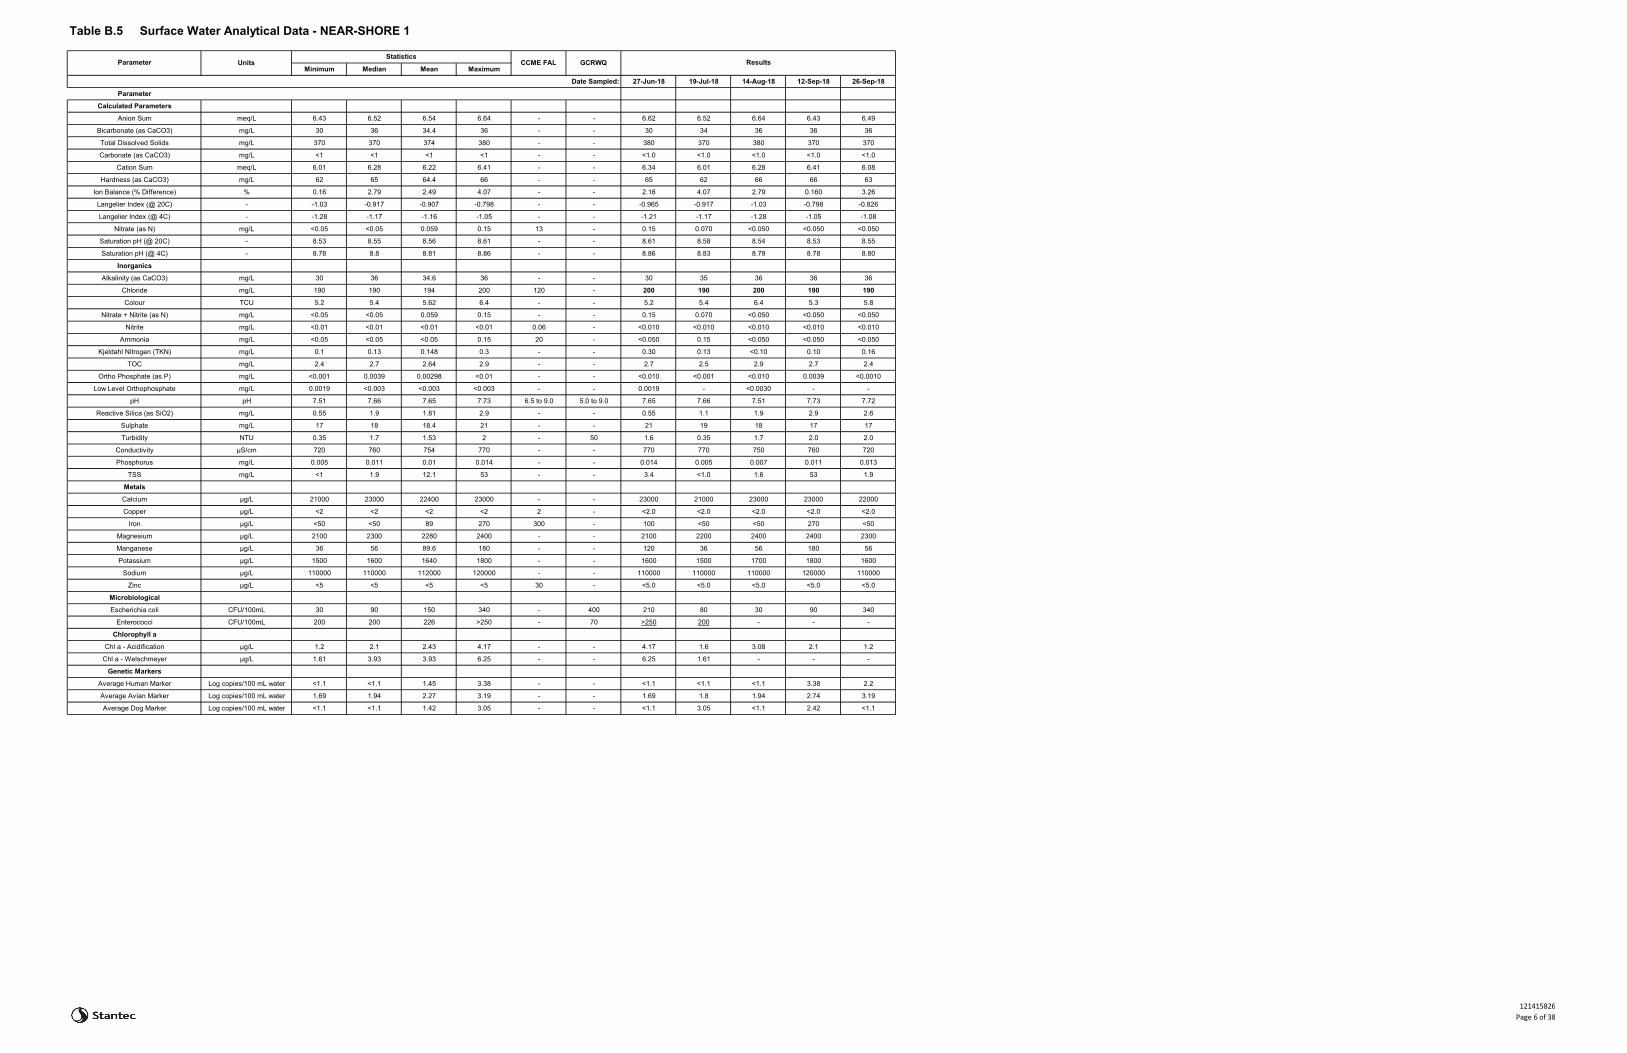
Table B.5 Surface Water Analytical Data - NEAR-SHORE 1
Minimum Median Mean Maximum
Date Sampled: 27-Jun-18 19-Jul-18 14-Aug-18 12-Sep-18 26-Sep-18
Parameter
Calculated Parameters
Anion Sum meq/L 6.43 6.52 6.54 6.64 - - 6.62 6.52 6.64 6.43 6.49
Bicarbonate (as CaCO3) mg/L 30 36 34.4 36 - - 30 34 36 36 36
Total Dissolved Solids mg/L 370 370 374 380 - - 380 370 380 370 370
Carbonate (as CaCO3) mg/L <1 <1 <1 <1 - - <1.0 <1.0 <1.0 <1.0 <1.0
Cation Sum meq/L 6.01 6.28 6.22 6.41 - - 6.34 6.01 6.28 6.41 6.08
Hardness (as CaCO3) mg/L 62 65 64.4 66 - - 65 62 66 66 63
Ion Balance (% Difference) % 0.16 2.79 2.49 4.07 - - 2.16 4.07 2.79 0.160 3.26
Langelier Index (@ 20C) - -1.03 -0.917 -0.907 -0.798 - - -0.965 -0.917 -1.03 -0.798 -0.826
Langelier Index (@ 4C) - -1.28 -1.17 -1.16 -1.05 - - -1.21 -1.17 -1.28 -1.05 -1.08
Nitrate (as N) mg/L <0.05 <0.05 0.059 0.15 13 - 0.15 0.070 <0.050 <0.050 <0.050
Saturation pH (@ 20C) - 8.53 8.55 8.56 8.61 - - 8.61 8.58 8.54 8.53 8.55
Saturation pH (@ 4C) - 8.78 8.8 8.81 8.86 - - 8.86 8.83 8.79 8.78 8.80
Inorganics
Alkalinity (as CaCO3) mg/L 30 36 34.6 36 - - 30 35 36 36 36
Chloride mg/L 190 190 194 200 120 - 200 190 200 190 190
Colour TCU 5.2 5.4 5.62 6.4 - - 5.2 5.4 6.4 5.3 5.8
Nitrate + Nitrite (as N) mg/L <0.05 <0.05 0.059 0.15 - - 0.15 0.070 <0.050 <0.050 <0.050
Nitrite mg/L <0.01 <0.01 <0.01 <0.01 0.06 - <0.010 <0.010 <0.010 <0.010 <0.010
Ammonia mg/L <0.05 <0.05 <0.05 0.15 20 - <0.050 0.15 <0.050 <0.050 <0.050
Kjeldahl Nitrogen (TKN) mg/L 0.1 0.13 0.148 0.3 - - 0.30 0.13 <0.10 0.10 0.16
TOC mg/L 2.4 2.7 2.64 2.9 - - 2.7 2.5 2.9 2.7 2.4
Ortho Phosphate (as P) mg/L <0.001 0.0039 0.00298 <0.01 - - <0.010 <0.001 <0.010 0.0039 <0.0010
Low Level Orthophosphate mg/L 0.0019 <0.003 <0.003 <0.003 - - 0.0019 - <0.0030 - -
pH pH 7.51 7.66 7.65 7.73 6.5 to 9.0 5.0 to 9.0 7.65 7.66 7.51 7.73 7.72
Reactive Silica (as SiO2) mg/L 0.55 1.9 1.81 2.9 - - 0.55 1.1 1.9 2.9 2.6
Sulphate mg/L 17 18 18.4 21 - - 21 19 18 17 17
Turbidity NTU 0.35 1.7 1.53 2 - 50 1.6 0.35 1.7 2.0 2.0
Conductivity µS/cm 720 760 754 770 - - 770 770 750 760 720
Phosphorus mg/L 0.005 0.011 0.01 0.014 - - 0.014 0.005 0.007 0.011 0.013
TSS mg/L <1 1.9 12.1 53 - - 3.4 <1.0 1.6 53 1.9
Metals
Calcium µg/L 21000 23000 22400 23000 - - 23000 21000 23000 23000 22000
Copper µg/L <2 <2 <2 <2 2 - <2.0 <2.0 <2.0 <2.0 <2.0
Iron µg/L <50 <50 89 270 300 - 100 <50 <50 270 <50
Magnesium µg/L 2100 2300 2280 2400 - - 2100 2200 2400 2400 2300
Manganese µg/L 36 56 89.6 180 - - 120 36 56 180 56
Potassium µg/L 1500 1600 1640 1800 - - 1600 1500 1700 1800 1600
Sodium µg/L 110000 110000 112000 120000 - - 110000 110000 110000 120000 110000
Zinc µg/L <5 <5 <5 <5 30 - <5.0 <5.0 <5.0 <5.0 <5.0
Microbiological
Escherichia coli CFU/100mL 30 90 150 340 - 400 210 80 30 90 340
Enterococci CFU/100mL 200 200 226 >250 - 70 >250 200 - - -
Chlorophyll a
Chl a - Acidification μg/L 1.2 2.1 2.43 4.17 - - 4.17 1.6 3.08 2.1 1.2
Chl a - Welschmeyer μg/L 1.61 3.93 3.93 6.25 - - 6.25 1.61 - - -
Genetic Markers
Average Human Marker Log copies/100 mL water <1.1 <1.1 1.45 3.38 - - <1.1 <1.1 <1.1 3.38 2.2
Average Avian Marker Log copies/100 mL water 1.69 1.94 2.27 3.19 - - 1.69 1.8 1.94 2.74 3.19
Average Dog Marker Log copies/100 mL water <1.1 <1.1 1.42 3.05 - - <1.1 3.05 <1.1 2.42 <1.1
ResultsGCRWQParameter UnitsStatistics
CCME FAL
121415826Page 6 of 38
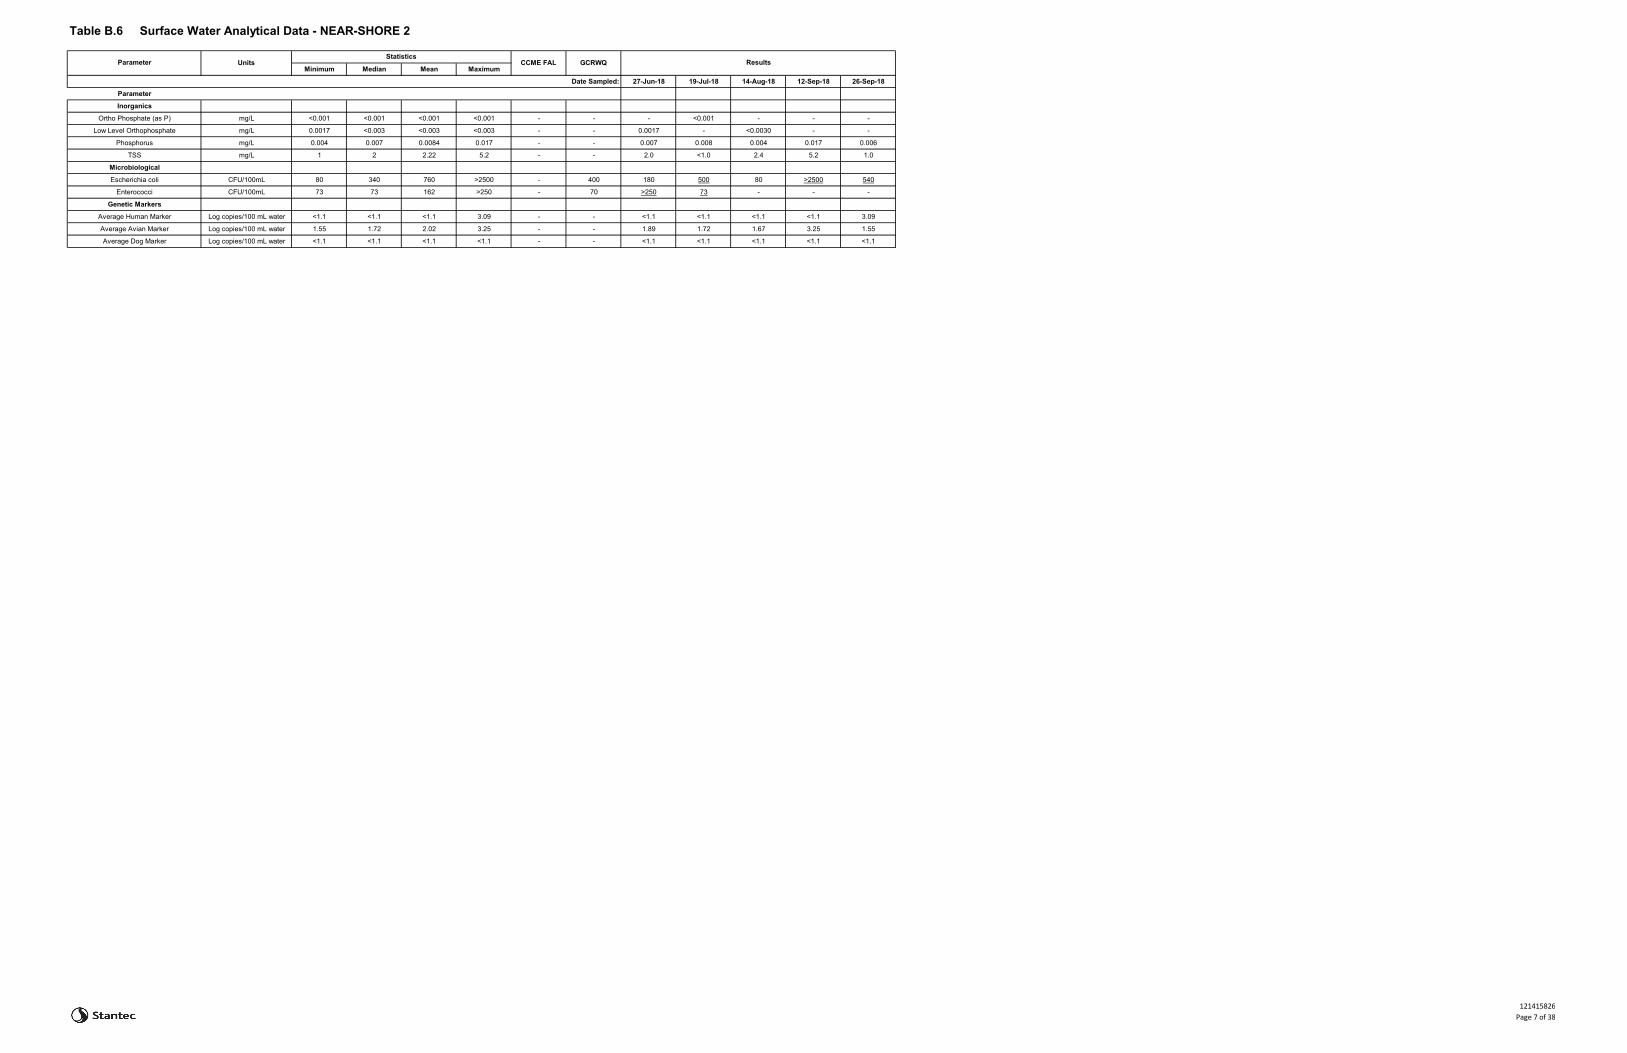
Table B.6 Surface Water Analytical Data - NEAR-SHORE 2
Minimum Median Mean Maximum
Date Sampled: 27-Jun-18 19-Jul-18 14-Aug-18 12-Sep-18 26-Sep-18
Parameter
Inorganics
Ortho Phosphate (as P) mg/L <0.001 <0.001 <0.001 <0.001 - - - <0.001 - - -
Low Level Orthophosphate mg/L 0.0017 <0.003 <0.003 <0.003 - - 0.0017 - <0.0030 - -
Phosphorus mg/L 0.004 0.007 0.0084 0.017 - - 0.007 0.008 0.004 0.017 0.006
TSS mg/L 1 2 2.22 5.2 - - 2.0 <1.0 2.4 5.2 1.0
Microbiological
Escherichia coli CFU/100mL 80 340 760 >2500 - 400 180 500 80 >2500 540
Enterococci CFU/100mL 73 73 162 >250 - 70 >250 73 - - -
Genetic Markers
Average Human Marker Log copies/100 mL water <1.1 <1.1 <1.1 3.09 - - <1.1 <1.1 <1.1 <1.1 3.09
Average Avian Marker Log copies/100 mL water 1.55 1.72 2.02 3.25 - - 1.89 1.72 1.67 3.25 1.55
Average Dog Marker Log copies/100 mL water <1.1 <1.1 <1.1 <1.1 - - <1.1 <1.1 <1.1 <1.1 <1.1
ResultsGCRWQParameter UnitsStatistics
CCME FAL
121415826Page 7 of 38

Table B.7 Surface Water Analytical Data - NEAR-SHORE 3
Minimum Median Mean Maximum
Date Sampled: 27-Jun-18 19-Jul-18 14-Aug-18 12-Sep-18 26-Sep-18
Parameter
Inorganics
Ortho Phosphate (as P) mg/L <0.001 <0.001 <0.001 <0.001 - - - <0.001 - - -
Low Level Orthophosphate mg/L 0.0021 <0.003 <0.003 <0.003 - - 0.0021 - <0.0030 - -
Phosphorus mg/L <0.004 0.0045 0.0075 0.019 - - 0.005 - 0.019 0.004 <0.004
TSS mg/L 1 2 2.04 3.2 - - 1.4 3.2 2.6 2.0 1.0
Microbiological
Escherichia coli CFU/100mL <10 200 157 280 - 400 200 80 280 220 <10
Enterococci CFU/100mL 28 129 129 230 - 70 28 230 - - -
Chlorophyll a
Chl a - Acidification μg/L 1.49 1.53 2.01 3.87 - - 1.49 1.65 3.87 1.53 1.52
Chl a - Welschmeyer μg/L 1.8 1.88 1.88 1.95 - - 1.95 1.8 - - -
Genetic Markers
Average Human Marker Log copies/100 mL water <1.1 <1.1 <1.1 <1.1 - - <1.1 <1.1 <1.1 <1.1 <1.1
Average Avian Marker Log copies/100 mL water <1.1 1.91 1.77 2.63 - - 1.91 1.82 1.94 2.63 <1.1
Average Dog Marker Log copies/100 mL water 2.23 3.25 3.33 4.92 - - 2.5 4.92 3.77 2.23 3.25
ResultsGCRWQParameter UnitsStatistics
CCME FAL
121415826Page 8 of 38

Table B.8 Surface Water Analytical Data - OUTFALL 1
Minimum Median Mean Maximum
Date Sampled: 27-Jun-18 19-Jul-18 14-Aug-18 12-Sep-18 26-Sep-18
Parameter
Inorganics
Ortho Phosphate (as P) mg/L 0.002 0.002 0.002 0.002 - - - 0.002 - - -
Low Level Orthophosphate mg/L 0.0036 0.0037 0.0037 0.0038 - - 0.0038 - 0.0036 - -
Phosphorus mg/L 0.006 0.008 0.0104 0.023 - - 0.006 0.007 0.023 0.008 0.008
TSS mg/L <1 2.2 5.74 20 - - 2.2 <1.0 20 2.0 4.0
Microbiological
Escherichia coli CFU/100mL 30 120 176 350 - 400 110 350 30 270 120
Enterococci CFU/100mL 77 149 149 220 - 70 77 220 - - -
ResultsGCRWQParameter UnitsStatistics
CCME FAL
121415826Page 9 of 38

Table B.9 Surface Water Analytical Data - OUTFALL 7
Minimum Median Mean Maximum
Date Sampled: 27-Jun-18 19-Jul-18 14-Aug-18 12-Sep-18 26-Sep-18
Parameter
Inorganics
Ortho Phosphate (as P) mg/L 0.0033 0.00465 0.00465 0.006 - - - 0.006 - 0.0033 -
Low Level Orthophosphate mg/L 0.0043 0.00465 0.00465 0.005 - - 0.005 - 0.0043 - -
Phosphorus mg/L 0.007 0.007 0.0096 0.018 - - 0.007 0.009 0.007 0.007 0.018
TSS mg/L 1 1 2.87 9.7 - - <1.0 2.6 9.7 1.0 <1.1
Microbiological
Escherichia coli CFU/100mL 10 150 524 2200 - 400 60 150 10 200 2200
Genetic Markers
Average Human Marker Log copies/100 mL water 2.47 2.47 2.47 2.47 - - - 2.47 - - -
Average Avian Marker Log copies/100 mL water 2.65 2.65 2.65 2.65 - - - 2.65 - - -
Average Dog Marker Log copies/100 mL water <1.1 <1.1 <1.1 <1.1 - - - <1.1 - - -
ResultsGCRWQParameter UnitsStatistics
CCME FAL
121415826Page 10 of 38
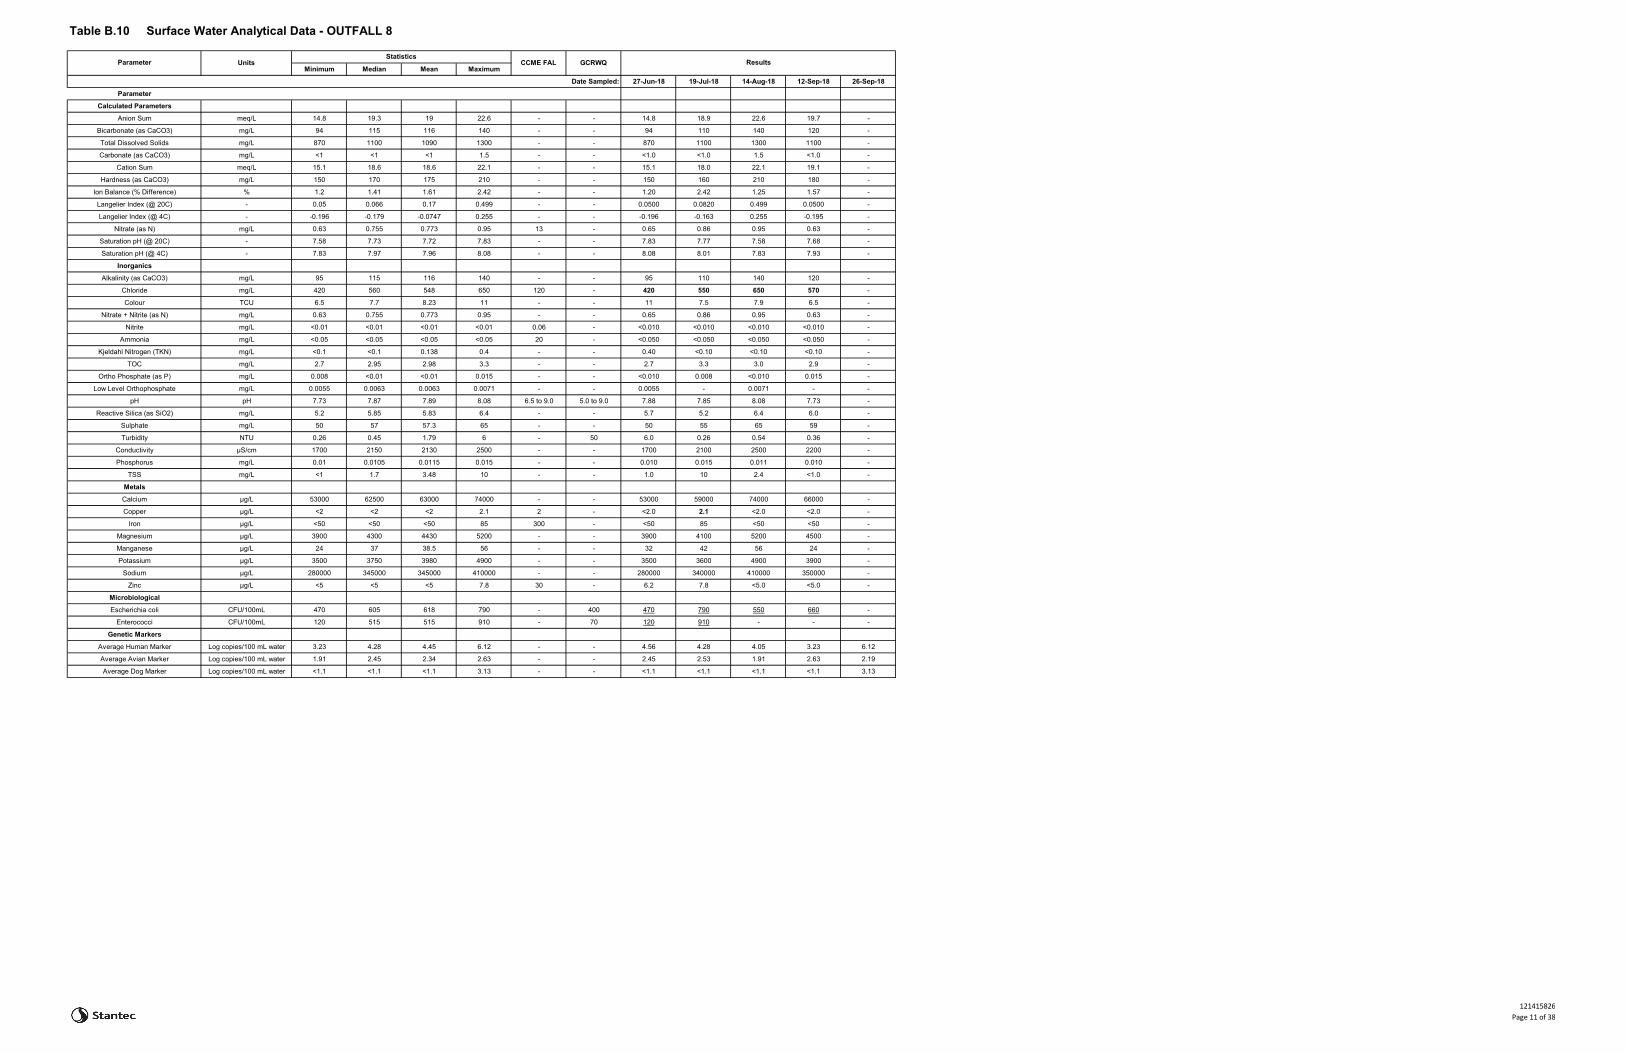
Table B.10 Surface Water Analytical Data - OUTFALL 8
Minimum Median Mean Maximum
Date Sampled: 27-Jun-18 19-Jul-18 14-Aug-18 12-Sep-18 26-Sep-18
Parameter
Calculated Parameters
Anion Sum meq/L 14.8 19.3 19 22.6 - - 14.8 18.9 22.6 19.7 -
Bicarbonate (as CaCO3) mg/L 94 115 116 140 - - 94 110 140 120 -
Total Dissolved Solids mg/L 870 1100 1090 1300 - - 870 1100 1300 1100 -
Carbonate (as CaCO3) mg/L <1 <1 <1 1.5 - - <1.0 <1.0 1.5 <1.0 -
Cation Sum meq/L 15.1 18.6 18.6 22.1 - - 15.1 18.0 22.1 19.1 -
Hardness (as CaCO3) mg/L 150 170 175 210 - - 150 160 210 180 -
Ion Balance (% Difference) % 1.2 1.41 1.61 2.42 - - 1.20 2.42 1.25 1.57 -
Langelier Index (@ 20C) - 0.05 0.066 0.17 0.499 - - 0.0500 0.0820 0.499 0.0500 -
Langelier Index (@ 4C) - -0.196 -0.179 -0.0747 0.255 - - -0.196 -0.163 0.255 -0.195 -
Nitrate (as N) mg/L 0.63 0.755 0.773 0.95 13 - 0.65 0.86 0.95 0.63 -
Saturation pH (@ 20C) - 7.58 7.73 7.72 7.83 - - 7.83 7.77 7.58 7.68 -
Saturation pH (@ 4C) - 7.83 7.97 7.96 8.08 - - 8.08 8.01 7.83 7.93 -
Inorganics
Alkalinity (as CaCO3) mg/L 95 115 116 140 - - 95 110 140 120 -
Chloride mg/L 420 560 548 650 120 - 420 550 650 570 -
Colour TCU 6.5 7.7 8.23 11 - - 11 7.5 7.9 6.5 -
Nitrate + Nitrite (as N) mg/L 0.63 0.755 0.773 0.95 - - 0.65 0.86 0.95 0.63 -
Nitrite mg/L <0.01 <0.01 <0.01 <0.01 0.06 - <0.010 <0.010 <0.010 <0.010 -
Ammonia mg/L <0.05 <0.05 <0.05 <0.05 20 - <0.050 <0.050 <0.050 <0.050 -
Kjeldahl Nitrogen (TKN) mg/L <0.1 <0.1 0.138 0.4 - - 0.40 <0.10 <0.10 <0.10 -
TOC mg/L 2.7 2.95 2.98 3.3 - - 2.7 3.3 3.0 2.9 -
Ortho Phosphate (as P) mg/L 0.008 <0.01 <0.01 0.015 - - <0.010 0.008 <0.010 0.015 -
Low Level Orthophosphate mg/L 0.0055 0.0063 0.0063 0.0071 - - 0.0055 - 0.0071 - -
pH pH 7.73 7.87 7.89 8.08 6.5 to 9.0 5.0 to 9.0 7.88 7.85 8.08 7.73 -
Reactive Silica (as SiO2) mg/L 5.2 5.85 5.83 6.4 - - 5.7 5.2 6.4 6.0 -
Sulphate mg/L 50 57 57.3 65 - - 50 55 65 59 -
Turbidity NTU 0.26 0.45 1.79 6 - 50 6.0 0.26 0.54 0.36 -
Conductivity µS/cm 1700 2150 2130 2500 - - 1700 2100 2500 2200 -
Phosphorus mg/L 0.01 0.0105 0.0115 0.015 - - 0.010 0.015 0.011 0.010 -
TSS mg/L <1 1.7 3.48 10 - - 1.0 10 2.4 <1.0 -
Metals
Calcium µg/L 53000 62500 63000 74000 - - 53000 59000 74000 66000 -
Copper µg/L <2 <2 <2 2.1 2 - <2.0 2.1 <2.0 <2.0 -
Iron µg/L <50 <50 <50 85 300 - <50 85 <50 <50 -
Magnesium µg/L 3900 4300 4430 5200 - - 3900 4100 5200 4500 -
Manganese µg/L 24 37 38.5 56 - - 32 42 56 24 -
Potassium µg/L 3500 3750 3980 4900 - - 3500 3600 4900 3900 -
Sodium µg/L 280000 345000 345000 410000 - - 280000 340000 410000 350000 -
Zinc µg/L <5 <5 <5 7.8 30 - 6.2 7.8 <5.0 <5.0 -
Microbiological
Escherichia coli CFU/100mL 470 605 618 790 - 400 470 790 550 660 -
Enterococci CFU/100mL 120 515 515 910 - 70 120 910 - - -
Genetic Markers
Average Human Marker Log copies/100 mL water 3.23 4.28 4.45 6.12 - - 4.56 4.28 4.05 3.23 6.12
Average Avian Marker Log copies/100 mL water 1.91 2.45 2.34 2.63 - - 2.45 2.53 1.91 2.63 2.19
Average Dog Marker Log copies/100 mL water <1.1 <1.1 <1.1 3.13 - - <1.1 <1.1 <1.1 <1.1 3.13
ResultsGCRWQParameter UnitsStatistics
CCME FAL
121415826Page 11 of 38

Table B.20 Surface Water Analytical Data - OUTFALL 8B
Minimum Median Mean Maximum
Date Sampled: 14-Aug-18 12-Sep-18 26-Sep-18
Parameter
Calculated Parameters
Anion Sum meq/L 20.6 21.4 21.4 22.1 - - 22.1 20.6 -
Bicarbonate (as CaCO3) mg/L 120 125 125 130 - - 130 120 -
Total Dissolved Solids mg/L 1200 1250 1250 1300 - - 1300 1200 -
Carbonate (as CaCO3) mg/L <1 <1 <1 1.1 - - 1.1 <1.0 -
Cation Sum meq/L 19.7 20.8 20.8 21.8 - - 21.8 19.7 -
Hardness (as CaCO3) mg/L 190 195 195 200 - - 200 190 -
Ion Balance (% Difference) % 0.73 1.56 1.56 2.38 - - 0.730 2.38 -
Langelier Index (@ 20C) - 0.134 0.24 0.24 0.346 - - 0.346 0.134 -
Langelier Index (@ 4C) - -0.112 -0.0055 -0.0055 0.101 - - 0.101 -0.112 -
Nitrate (as N) mg/L 0.7 0.775 0.775 0.85 13 - 0.85 0.70 -
Saturation pH (@ 20C) - 7.61 7.64 7.64 7.66 - - 7.61 7.66 -
Saturation pH (@ 4C) - 7.86 7.88 7.88 7.9 - - 7.86 7.90 -
Inorganics
Alkalinity (as CaCO3) mg/L 120 125 125 130 - - 130 120
Chloride mg/L 600 625 625 650 120 - 650 600 -
Colour TCU 7.2 7.4 7.4 7.6 - - 7.2 7.6 -
Nitrate + Nitrite (as N) mg/L 0.7 0.785 0.785 0.87 - - 0.87 0.70 -
Nitrite mg/L <0.01 0.016 0.016 0.027 0.06 - 0.027 <0.010 -
Ammonia mg/L <0.06 0.1 0.1 0.17 20 - 0.17 <0.060 -
Kjeldahl Nitrogen (TKN) mg/L <0.1 <0.1 <0.1 0.1 - - 0.10 <0.10 -
TOC mg/L 2.8 2.85 2.85 2.9 - - 2.9 2.8 -
Ortho Phosphate (as P) mg/L 0.01 <0.01 <0.01 0.01 - - <0.010 0.010 -
Low Level Orthophosphate mg/L 0.0048 0.0048 0.0048 0.0048 - - 0.0048 - -
pH pH 7.79 7.88 7.88 7.96 6.5 to 9.0 5.0 to 9.0 7.96 7.79
Reactive Silica (as SiO2) mg/L 6.1 6.45 6.45 6.8 - - 6.8 6.1 -
Sulphate mg/L 59 59.5 59.5 60 - - 60 59 -
Turbidity NTU 0.48 0.515 0.515 0.55 - 50 0.48 0.55 -
Conductivity µS/cm 2300 2350 2350 2400 - - 2400 2300 -
Phosphorus mg/L 0.004 0.006 0.006 0.008 - - 0.004 0.008 -
TSS mg/L <1 <1 <1 <1.1 - - <1.0 <1.1 -
Metals
Calcium µg/L 69000 70500 70500 72000 - - 72000 69000 -
Copper µg/L <2 <2 <2 <2 2 - <2.0 <2.0 -
Iron µg/L 100 110 110 120 300 - 120 100 -
Magnesium µg/L 4500 4900 4900 5300 - - 5300 4500 -
Manganese µg/L 200 255 255 310 - - 310 200 -
Potassium µg/L 3800 4300 4300 4800 - - 4800 3800 -
Sodium µg/L 360000 385000 385000 410000 - - 410000 360000 -
Zinc µg/L <5 <5 <5 7.3 30 - <5.0 7.3 -
Microbiological
Escherichia coli CFU/100mL 420 435 435 450 - 400 450 420 -
Genetic Markers
Average Human Marker Log copies/100 mL water 3.7 3.75 4.52 6.12 - - 3.75 3.7 6.12
Average Avian Marker Log copies/100 mL water 1.72 2.15 2.18 2.67 - - 1.72 2.67 2.15
Average Dog Marker Log copies/100 mL water <1.1 <1.1 1.28 2.75 - - <1.1 <1.1 2.75
ResultsGCRWQParameter UnitsStatistics
CCME FAL
121415826Page 12 of 38
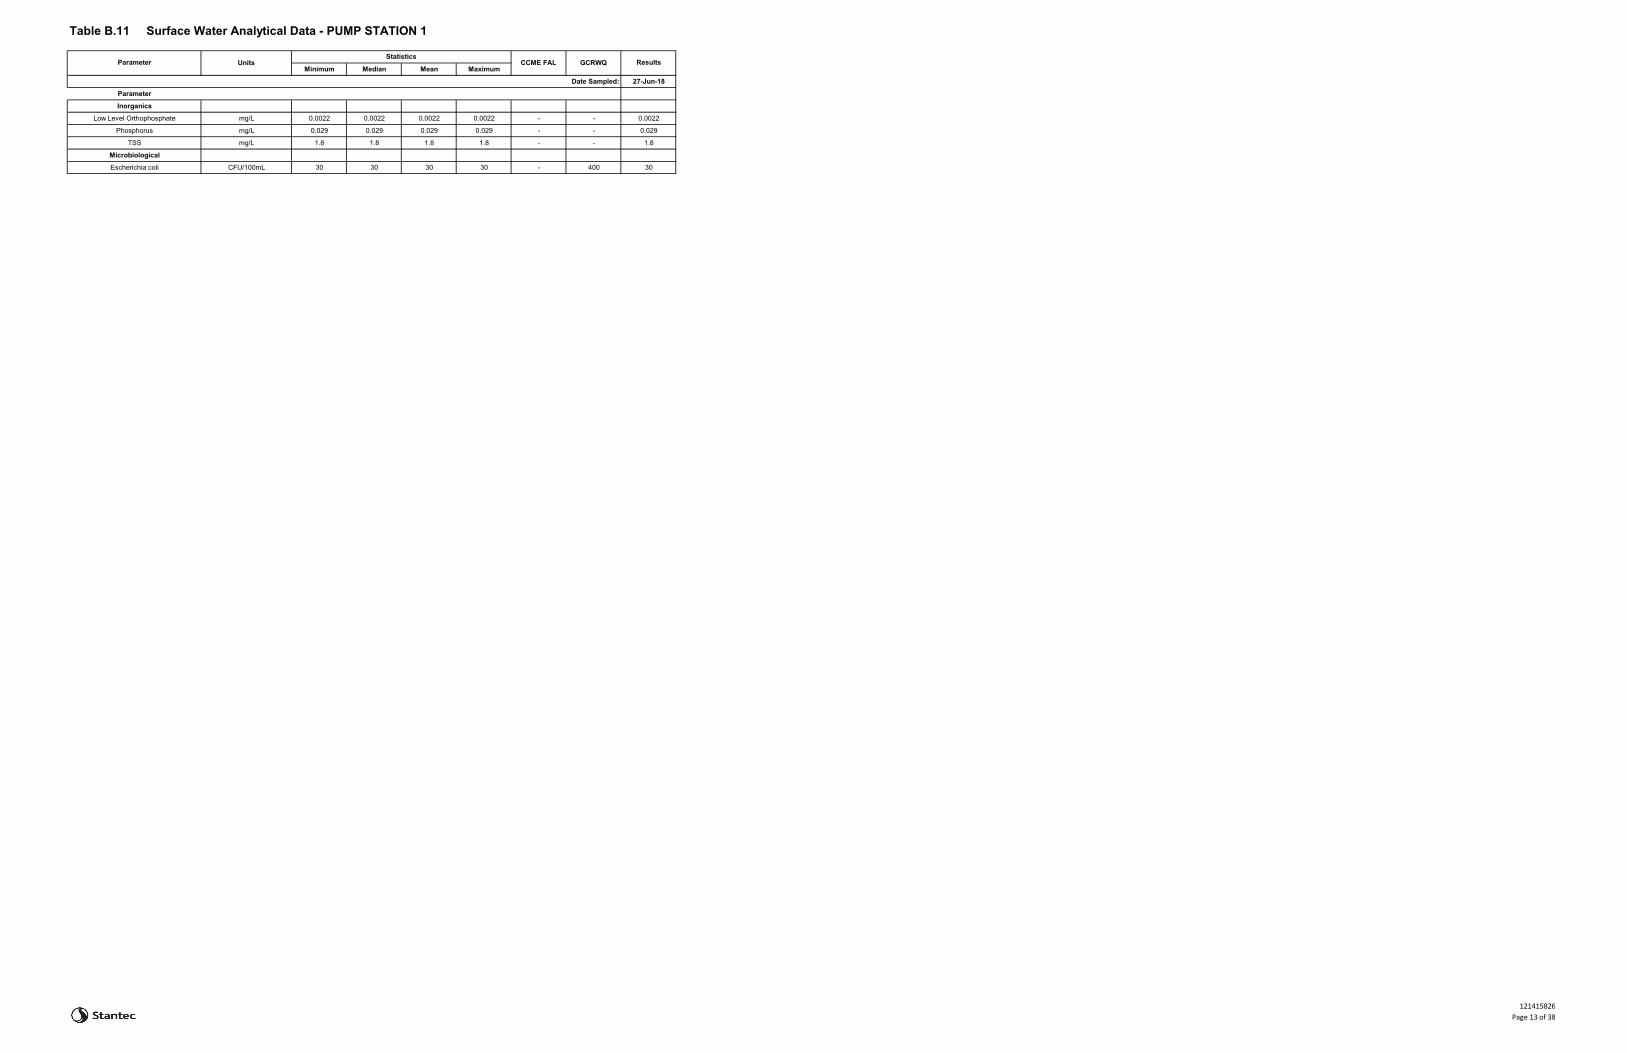
Table B.11 Surface Water Analytical Data - PUMP STATION 1
Minimum Median Mean Maximum
Date Sampled: 27-Jun-18
Parameter
Inorganics
Low Level Orthophosphate mg/L 0.0022 0.0022 0.0022 0.0022 - - 0.0022
Phosphorus mg/L 0.029 0.029 0.029 0.029 - - 0.029
TSS mg/L 1.8 1.8 1.8 1.8 - - 1.8
Microbiological
Escherichia coli CFU/100mL 30 30 30 30 - 400 30
ResultsGCRWQParameter UnitsStatistics
CCME FAL
121415826Page 13 of 38
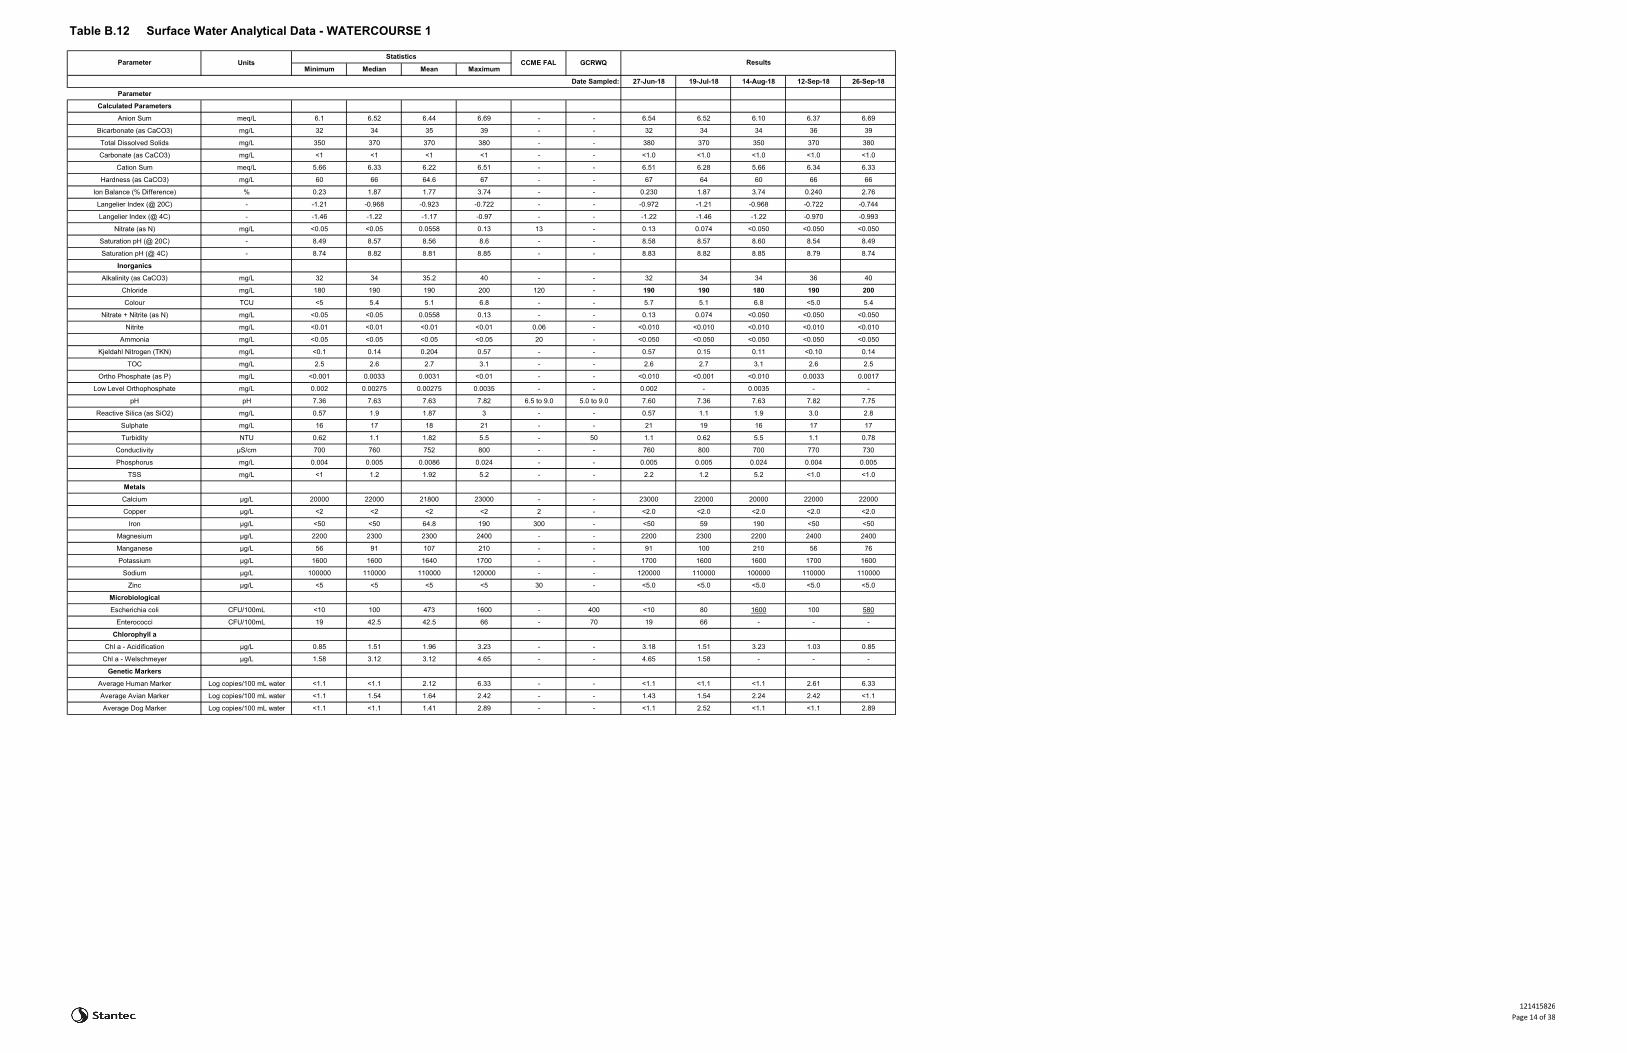
Table B.12 Surface Water Analytical Data - WATERCOURSE 1
Minimum Median Mean Maximum
Date Sampled: 27-Jun-18 19-Jul-18 14-Aug-18 12-Sep-18 26-Sep-18
Parameter
Calculated Parameters
Anion Sum meq/L 6.1 6.52 6.44 6.69 - - 6.54 6.52 6.10 6.37 6.69
Bicarbonate (as CaCO3) mg/L 32 34 35 39 - - 32 34 34 36 39
Total Dissolved Solids mg/L 350 370 370 380 - - 380 370 350 370 380
Carbonate (as CaCO3) mg/L <1 <1 <1 <1 - - <1.0 <1.0 <1.0 <1.0 <1.0
Cation Sum meq/L 5.66 6.33 6.22 6.51 - - 6.51 6.28 5.66 6.34 6.33
Hardness (as CaCO3) mg/L 60 66 64.6 67 - - 67 64 60 66 66
Ion Balance (% Difference) % 0.23 1.87 1.77 3.74 - - 0.230 1.87 3.74 0.240 2.76
Langelier Index (@ 20C) - -1.21 -0.968 -0.923 -0.722 - - -0.972 -1.21 -0.968 -0.722 -0.744
Langelier Index (@ 4C) - -1.46 -1.22 -1.17 -0.97 - - -1.22 -1.46 -1.22 -0.970 -0.993
Nitrate (as N) mg/L <0.05 <0.05 0.0558 0.13 13 - 0.13 0.074 <0.050 <0.050 <0.050
Saturation pH (@ 20C) - 8.49 8.57 8.56 8.6 - - 8.58 8.57 8.60 8.54 8.49
Saturation pH (@ 4C) - 8.74 8.82 8.81 8.85 - - 8.83 8.82 8.85 8.79 8.74
Inorganics
Alkalinity (as CaCO3) mg/L 32 34 35.2 40 - - 32 34 34 36 40
Chloride mg/L 180 190 190 200 120 - 190 190 180 190 200
Colour TCU <5 5.4 5.1 6.8 - - 5.7 5.1 6.8 <5.0 5.4
Nitrate + Nitrite (as N) mg/L <0.05 <0.05 0.0558 0.13 - - 0.13 0.074 <0.050 <0.050 <0.050
Nitrite mg/L <0.01 <0.01 <0.01 <0.01 0.06 - <0.010 <0.010 <0.010 <0.010 <0.010
Ammonia mg/L <0.05 <0.05 <0.05 <0.05 20 - <0.050 <0.050 <0.050 <0.050 <0.050
Kjeldahl Nitrogen (TKN) mg/L <0.1 0.14 0.204 0.57 - - 0.57 0.15 0.11 <0.10 0.14
TOC mg/L 2.5 2.6 2.7 3.1 - - 2.6 2.7 3.1 2.6 2.5
Ortho Phosphate (as P) mg/L <0.001 0.0033 0.0031 <0.01 - - <0.010 <0.001 <0.010 0.0033 0.0017
Low Level Orthophosphate mg/L 0.002 0.00275 0.00275 0.0035 - - 0.002 - 0.0035 - -
pH pH 7.36 7.63 7.63 7.82 6.5 to 9.0 5.0 to 9.0 7.60 7.36 7.63 7.82 7.75
Reactive Silica (as SiO2) mg/L 0.57 1.9 1.87 3 - - 0.57 1.1 1.9 3.0 2.8
Sulphate mg/L 16 17 18 21 - - 21 19 16 17 17
Turbidity NTU 0.62 1.1 1.82 5.5 - 50 1.1 0.62 5.5 1.1 0.78
Conductivity µS/cm 700 760 752 800 - - 760 800 700 770 730
Phosphorus mg/L 0.004 0.005 0.0086 0.024 - - 0.005 0.005 0.024 0.004 0.005
TSS mg/L <1 1.2 1.92 5.2 - - 2.2 1.2 5.2 <1.0 <1.0
Metals
Calcium µg/L 20000 22000 21800 23000 - - 23000 22000 20000 22000 22000
Copper µg/L <2 <2 <2 <2 2 - <2.0 <2.0 <2.0 <2.0 <2.0
Iron µg/L <50 <50 64.8 190 300 - <50 59 190 <50 <50
Magnesium µg/L 2200 2300 2300 2400 - - 2200 2300 2200 2400 2400
Manganese µg/L 56 91 107 210 - - 91 100 210 56 76
Potassium µg/L 1600 1600 1640 1700 - - 1700 1600 1600 1700 1600
Sodium µg/L 100000 110000 110000 120000 - - 120000 110000 100000 110000 110000
Zinc µg/L <5 <5 <5 <5 30 - <5.0 <5.0 <5.0 <5.0 <5.0
Microbiological
Escherichia coli CFU/100mL <10 100 473 1600 - 400 <10 80 1600 100 580
Enterococci CFU/100mL 19 42.5 42.5 66 - 70 19 66 - - -
Chlorophyll a
Chl a - Acidification μg/L 0.85 1.51 1.96 3.23 - - 3.18 1.51 3.23 1.03 0.85
Chl a - Welschmeyer μg/L 1.58 3.12 3.12 4.65 - - 4.65 1.58 - - -
Genetic Markers
Average Human Marker Log copies/100 mL water <1.1 <1.1 2.12 6.33 - - <1.1 <1.1 <1.1 2.61 6.33
Average Avian Marker Log copies/100 mL water <1.1 1.54 1.64 2.42 - - 1.43 1.54 2.24 2.42 <1.1
Average Dog Marker Log copies/100 mL water <1.1 <1.1 1.41 2.89 - - <1.1 2.52 <1.1 <1.1 2.89
ResultsGCRWQParameter UnitsStatistics
CCME FAL
121415826Page 14 of 38

Table B.13 Surface Water Analytical Data - WATERCOURSE 2
Minimum Median Mean Maximum
Date Sampled: 27-Jun-18 19-Jul-18 14-Aug-18 12-Sep-18 26-Sep-18
Parameter
Calculated Parameters
Anion Sum meq/L 4.58 8.66 8.71 12.7 - - 8.66 5.80 12.7 4.58 11.8
Bicarbonate (as CaCO3) mg/L 31 62 67.8 100 - - 62 48 98 31 100
Total Dissolved Solids mg/L 270 500 500 720 - - 500 330 720 270 680
Carbonate (as CaCO3) mg/L <1 <1 <1 <1 - - <1.0 <1.0 <1.0 <1.0 <1.0
Cation Sum meq/L 4.51 8.33 8.45 12 - - 8.33 5.52 12.0 4.51 11.9
Hardness (as CaCO3) mg/L 61 130 137 210 - - 130 83 200 61 210
Ion Balance (% Difference) % 0.63 1.94 1.79 3.12 - - 1.94 2.47 3.12 0.770 0.630
Langelier Index (@ 20C) - -1.1 -0.367 -0.317 0.257 - - -0.367 -0.552 0.179 -1.10 0.257
Langelier Index (@ 4C) - -1.35 -0.615 -0.565 0.01 - - -0.615 -0.801 -0.0680 -1.35 0.0100
Nitrate (as N) mg/L 0.14 0.76 0.624 0.92 13 - 0.76 0.42 0.88 0.14 0.92
Saturation pH (@ 20C) - 7.63 8.04 8.05 8.62 - - 8.04 8.30 7.68 8.62 7.63
Saturation pH (@ 4C) - 7.88 8.29 8.3 8.87 - - 8.29 8.55 7.93 8.87 7.88
Inorganics
Alkalinity (as CaCO3) mg/L 31 63 68.2 100 - - 63 48 99 31 100
Chloride mg/L 130 240 238 350 120 - 240 160 350 130 310
Colour TCU 6.4 9 9.96 15 - - 9.0 15 7.4 12 6.4
Nitrate + Nitrite (as N) mg/L 0.14 0.76 0.624 0.92 - - 0.76 0.42 0.88 0.14 0.92
Nitrite mg/L <0.01 <0.01 <0.01 <0.01 0.06 - <0.010 <0.010 <0.010 <0.010 <0.010
Ammonia mg/L <0.05 <0.05 <0.05 <0.05 20 - <0.050 <0.050 <0.050 <0.050 <0.050
Kjeldahl Nitrogen (TKN) mg/L <0.1 0.11 <0.1 0.15 - - 0.15 0.11 <0.10 <0.10 0.11
TOC mg/L 2.5 3 3.22 4 - - 3.0 4.0 2.9 3.7 2.5
Ortho Phosphate (as P) mg/L <0.001 <0.001 0.0023 <0.01 - - <0.010 <0.001 <0.010 <0.0010 <0.0010
Low Level Orthophosphate mg/L 0.003 0.00305 0.00305 0.0031 - - 0.0031 - 0.003 - -
pH pH 7.52 7.75 7.74 7.89 6.5 to 9.0 5.0 to 9.0 7.67 7.75 7.86 7.52 7.89
Reactive Silica (as SiO2) mg/L 5.1 5.2 5.56 6.6 - - 5.1 5.1 6.6 5.8 5.2
Sulphate mg/L 13 27 27.4 41 - - 27 18 38 13 41
Turbidity NTU 0.17 1.3 1.13 1.7 - 50 0.17 1.7 1.2 1.3 1.3
Conductivity µS/cm 530 960 976 1400 - - 960 690 1400 530 1300
Phosphorus mg/L <0.004 <0.004 0.005 0.01 - - <0.004 0.010 <0.004 0.009 <0.004
TSS mg/L <1 2.2 2.4 5.4 - - <1.0 5.4 <1.0 3.4 2.2
Metals
Calcium µg/L 20000 43000 46000 71000 - - 43000 28000 68000 20000 71000
Copper µg/L <2 <2 <2 <2 2 - <2.0 <2.0 <2.0 <2.0 <2.0
Iron µg/L 84 97 117 200 300 - 84 93 97 200 110
Magnesium µg/L 2600 4600 5320 8300 - - 4600 3300 7800 2600 8300
Manganese µg/L 46 97 99.2 160 - - 97 46 160 83 110
Potassium µg/L 1300 2300 2300 3100 - - 2300 1700 3100 1300 3100
Sodium µg/L 75000 130000 129000 180000 - - 130000 88000 180000 75000 170000
Zinc µg/L <5 <5 <5 <5 30 - <5.0 <5.0 <5.0 <5.0 <5.0
Microbiological
Escherichia coli CFU/100mL 10 20 390 1700 - 400 10 210 10 1700 20
Enterococci CFU/100mL 20 200 200 380 - 70 20 380 - - -
Genetic Markers
Average Human Marker Log copies/100 mL water <1.1 <1.1 1.55 5.53 - - <1.1 <1.1 <1.1 <1.1 5.53
Average Avian Marker Log copies/100 mL water <1.1 2.3 2.27 3.58 - - 2.04 2.87 2.3 3.58 <1.1
Average Dog Marker Log copies/100 mL water <1.1 2.68 2.29 4.34 - - <1.1 3.33 <1.1 2.68 4.34
Average Ruminant Marker Log copies/100 mL water <1.1 4.91 3.89 6.93 - - 1.59 4.91 5.47 6.93 <1.1
ResultsGCRWQParameter UnitsStatistics
CCME FAL
121415826Page 15 of 38
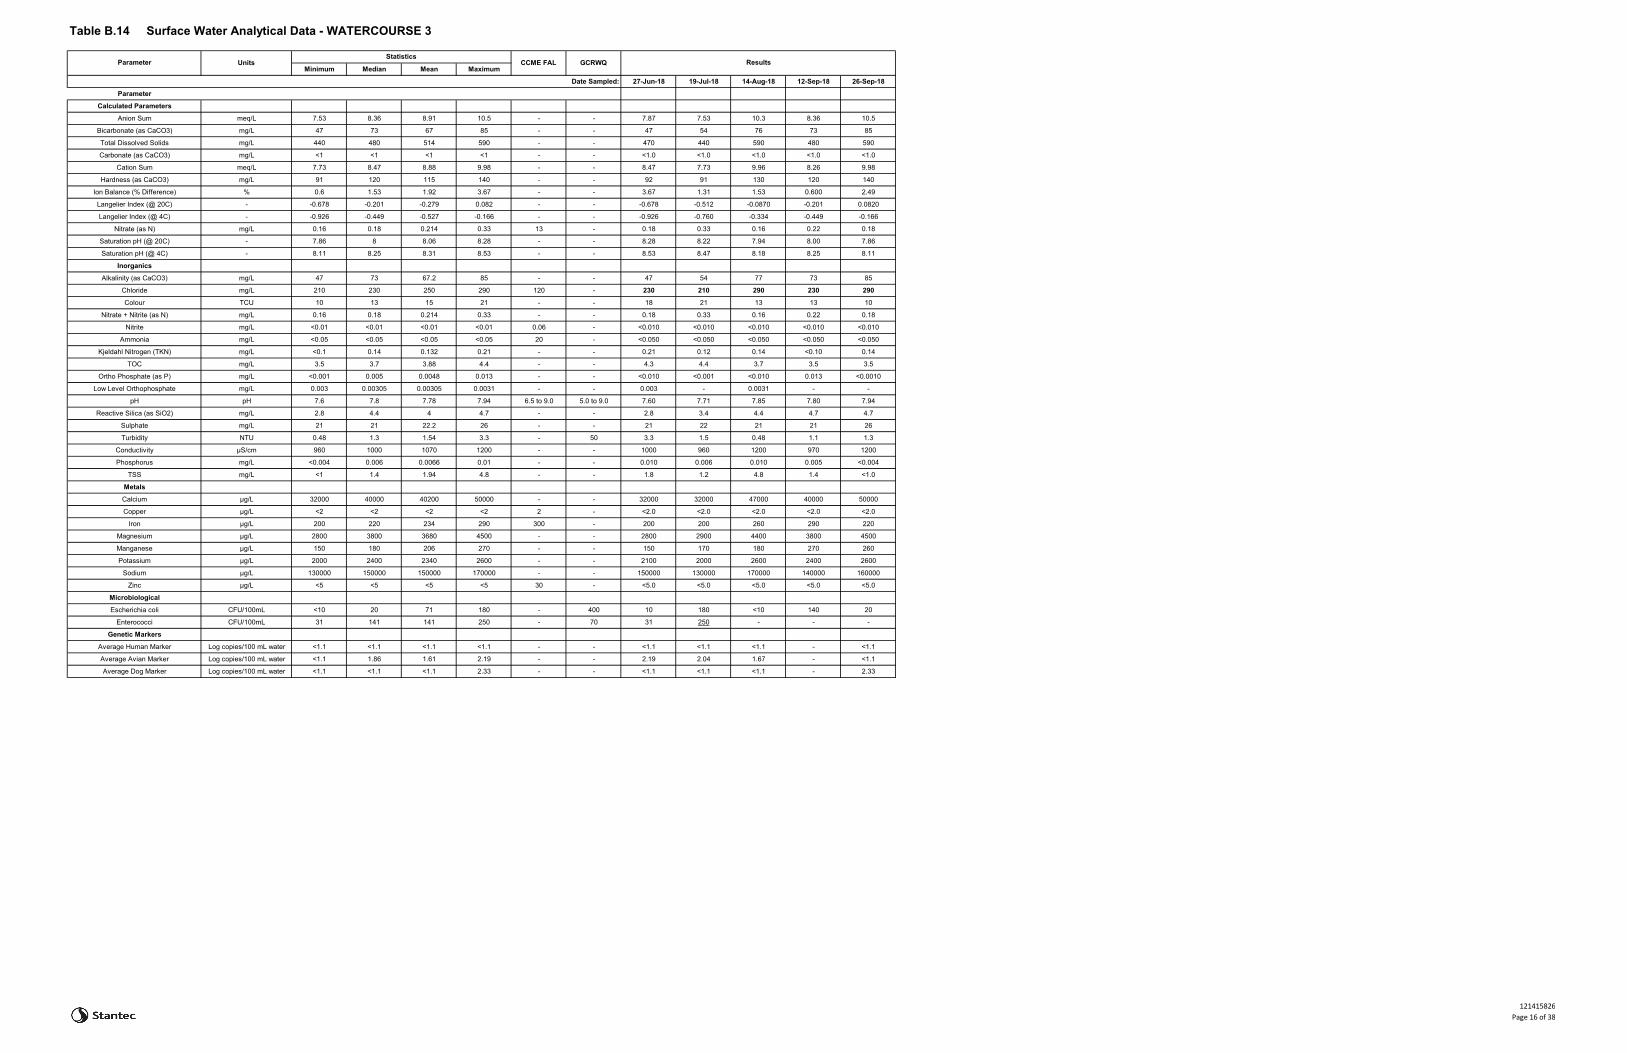
Table B.14 Surface Water Analytical Data - WATERCOURSE 3
Minimum Median Mean Maximum
Date Sampled: 27-Jun-18 19-Jul-18 14-Aug-18 12-Sep-18 26-Sep-18
Parameter
Calculated Parameters
Anion Sum meq/L 7.53 8.36 8.91 10.5 - - 7.87 7.53 10.3 8.36 10.5
Bicarbonate (as CaCO3) mg/L 47 73 67 85 - - 47 54 76 73 85
Total Dissolved Solids mg/L 440 480 514 590 - - 470 440 590 480 590
Carbonate (as CaCO3) mg/L <1 <1 <1 <1 - - <1.0 <1.0 <1.0 <1.0 <1.0
Cation Sum meq/L 7.73 8.47 8.88 9.98 - - 8.47 7.73 9.96 8.26 9.98
Hardness (as CaCO3) mg/L 91 120 115 140 - - 92 91 130 120 140
Ion Balance (% Difference) % 0.6 1.53 1.92 3.67 - - 3.67 1.31 1.53 0.600 2.49
Langelier Index (@ 20C) - -0.678 -0.201 -0.279 0.082 - - -0.678 -0.512 -0.0870 -0.201 0.0820
Langelier Index (@ 4C) - -0.926 -0.449 -0.527 -0.166 - - -0.926 -0.760 -0.334 -0.449 -0.166
Nitrate (as N) mg/L 0.16 0.18 0.214 0.33 13 - 0.18 0.33 0.16 0.22 0.18
Saturation pH (@ 20C) - 7.86 8 8.06 8.28 - - 8.28 8.22 7.94 8.00 7.86
Saturation pH (@ 4C) - 8.11 8.25 8.31 8.53 - - 8.53 8.47 8.18 8.25 8.11
Inorganics
Alkalinity (as CaCO3) mg/L 47 73 67.2 85 - - 47 54 77 73 85
Chloride mg/L 210 230 250 290 120 - 230 210 290 230 290
Colour TCU 10 13 15 21 - - 18 21 13 13 10
Nitrate + Nitrite (as N) mg/L 0.16 0.18 0.214 0.33 - - 0.18 0.33 0.16 0.22 0.18
Nitrite mg/L <0.01 <0.01 <0.01 <0.01 0.06 - <0.010 <0.010 <0.010 <0.010 <0.010
Ammonia mg/L <0.05 <0.05 <0.05 <0.05 20 - <0.050 <0.050 <0.050 <0.050 <0.050
Kjeldahl Nitrogen (TKN) mg/L <0.1 0.14 0.132 0.21 - - 0.21 0.12 0.14 <0.10 0.14
TOC mg/L 3.5 3.7 3.88 4.4 - - 4.3 4.4 3.7 3.5 3.5
Ortho Phosphate (as P) mg/L <0.001 0.005 0.0048 0.013 - - <0.010 <0.001 <0.010 0.013 <0.0010
Low Level Orthophosphate mg/L 0.003 0.00305 0.00305 0.0031 - - 0.003 - 0.0031 - -
pH pH 7.6 7.8 7.78 7.94 6.5 to 9.0 5.0 to 9.0 7.60 7.71 7.85 7.80 7.94
Reactive Silica (as SiO2) mg/L 2.8 4.4 4 4.7 - - 2.8 3.4 4.4 4.7 4.7
Sulphate mg/L 21 21 22.2 26 - - 21 22 21 21 26
Turbidity NTU 0.48 1.3 1.54 3.3 - 50 3.3 1.5 0.48 1.1 1.3
Conductivity µS/cm 960 1000 1070 1200 - - 1000 960 1200 970 1200
Phosphorus mg/L <0.004 0.006 0.0066 0.01 - - 0.010 0.006 0.010 0.005 <0.004
TSS mg/L <1 1.4 1.94 4.8 - - 1.8 1.2 4.8 1.4 <1.0
Metals
Calcium µg/L 32000 40000 40200 50000 - - 32000 32000 47000 40000 50000
Copper µg/L <2 <2 <2 <2 2 - <2.0 <2.0 <2.0 <2.0 <2.0
Iron µg/L 200 220 234 290 300 - 200 200 260 290 220
Magnesium µg/L 2800 3800 3680 4500 - - 2800 2900 4400 3800 4500
Manganese µg/L 150 180 206 270 - - 150 170 180 270 260
Potassium µg/L 2000 2400 2340 2600 - - 2100 2000 2600 2400 2600
Sodium µg/L 130000 150000 150000 170000 - - 150000 130000 170000 140000 160000
Zinc µg/L <5 <5 <5 <5 30 - <5.0 <5.0 <5.0 <5.0 <5.0
Microbiological
Escherichia coli CFU/100mL <10 20 71 180 - 400 10 180 <10 140 20
Enterococci CFU/100mL 31 141 141 250 - 70 31 250 - - -
Genetic Markers
Average Human Marker Log copies/100 mL water <1.1 <1.1 <1.1 <1.1 - - <1.1 <1.1 <1.1 - <1.1
Average Avian Marker Log copies/100 mL water <1.1 1.86 1.61 2.19 - - 2.19 2.04 1.67 - <1.1
Average Dog Marker Log copies/100 mL water <1.1 <1.1 <1.1 2.33 - - <1.1 <1.1 <1.1 - 2.33
ResultsGCRWQParameter UnitsStatistics
CCME FAL
121415826Page 16 of 38

Table B.15 Surface Water Analytical Data - WATERCOURSE 4
Minimum Median Mean Maximum
Date Sampled: 27-Jun-18 19-Jul-18 14-Aug-18 12-Sep-18 26-Sep-18
Parameter
Calculated Parameters
Anion Sum meq/L 4.51 5.02 4.9 5.11 - - 5.02 5.10 5.11 4.51 4.76
Bicarbonate (as CaCO3) mg/L 37 42 42.6 47 - - 37 42 47 45 42
Total Dissolved Solids mg/L 260 280 276 290 - - 280 280 290 260 270
Carbonate (as CaCO3) mg/L <1 <1 <1 <1 - - <1.0 <1.0 <1.0 <1.0 <1.0
Cation Sum meq/L 4.31 4.63 4.56 4.76 - - 4.66 4.63 4.76 4.44 4.31
Hardness (as CaCO3) mg/L 47 49 49.8 54 - - 48 47 54 51 49
Ion Balance (% Difference) % 0.78 3.72 3.57 4.96 - - 3.72 4.83 3.55 0.780 4.96
Langelier Index (@ 20C) - -1.34 -1.07 -1.11 -0.925 - - -1.34 -1.23 -0.972 -1.07 -0.925
Langelier Index (@ 4C) - -1.59 -1.32 -1.36 -1.17 - - -1.59 -1.48 -1.22 -1.32 -1.17
Nitrate (as N) mg/L <0.05 <0.05 <0.05 0.097 13 - 0.097 <0.050 <0.050 <0.050 <0.050
Saturation pH (@ 20C) - 8.49 8.56 8.55 8.62 - - 8.62 8.59 8.49 8.51 8.56
Saturation pH (@ 4C) - 8.73 8.81 8.8 8.87 - - 8.87 8.84 8.73 8.76 8.81
Inorganics
Alkalinity (as CaCO3) mg/L 38 42 42.8 47 - - 38 42 47 45 42
Chloride mg/L 120 140 134 140 120 - 140 140 140 120 130
Colour TCU 17 26 24.2 31 - - 19 26 28 31 17
Nitrate + Nitrite (as N) mg/L <0.05 <0.05 <0.05 0.12 - - 0.12 <0.050 <0.050 <0.050 <0.050
Nitrite mg/L <0.01 <0.01 <0.01 0.022 0.06 - 0.022 <0.010 <0.010 <0.010 <0.010
Ammonia mg/L <0.05 0.061 0.152 0.54 20 - 0.54 0.11 <0.050 0.061 <0.050
Kjeldahl Nitrogen (TKN) mg/L 0.23 0.31 0.402 0.84 - - 0.84 0.35 0.31 0.28 0.23
TOC mg/L 4.7 5.2 5.18 5.7 - - 5.0 5.2 5.7 5.3 4.7
Ortho Phosphate (as P) mg/L 0.0011 <0.01 <0.01 0.011 - - <0.010 0.004 <0.010 0.011 0.0011
Low Level Orthophosphate mg/L 0.0023 <0.003 <0.003 <0.003 - - 0.0023 - <0.0030 - -
pH pH 7.28 7.44 7.45 7.64 6.5 to 9.0 5.0 to 9.0 7.28 7.36 7.51 7.44 7.64
Reactive Silica (as SiO2) mg/L 0.83 2.2 2.05 3.6 - - 0.83 1.0 2.2 2.6 3.6
Sulphate mg/L 6.3 8.5 8.84 13 - - 13 10 6.3 6.4 8.5
Turbidity NTU 0.98 1.9 1.82 2.8 - 50 1.9 1.5 1.9 2.8 0.98
Conductivity µS/cm 520 560 554 590 - - 580 590 560 520 520
Phosphorus mg/L 0.018 0.03 0.0286 0.035 - - 0.032 0.028 0.035 0.030 0.018
TSS mg/L 1.7 1.8 2.06 3 - - 1.8 1.8 2.0 3.0 1.7
Metals
Calcium µg/L 16000 17000 17000 18000 - - 17000 16000 18000 17000 17000
Copper µg/L <2 <2 <2 <2 2 - <2.0 <2.0 <2.0 <2.0 <2.0
Iron µg/L 570 720 788 1200 300 - 720 690 760 1200 570
Magnesium µg/L 1700 1800 1800 2000 - - 1700 1800 2000 1800 1700
Manganese µg/L 77 120 126 220 - - 120 220 83 130 77
Potassium µg/L 560 760 874 1500 - - 1500 930 620 560 760
Sodium µg/L 75000 83000 80400 84000 - - 83000 83000 84000 77000 75000
Zinc µg/L <5 <5 <5 <5 30 - <5.0 <5.0 <5.0 <5.0 <5.0
Microbiological
Escherichia coli CFU/100mL <10 20 29 70 - 400 20 <10 20 70 30
Enterococci CFU/100mL 33 36 36 39 - 70 39 33 - - -
Genetic Markers
Average Human Marker Log copies/100 mL water <1.1 <1.1 <1.1 <1.1 - - <1.1 <1.1 <1.1 <1.1 <1.1
Average Avian Marker Log copies/100 mL water 1.43 2.24 2.17 2.97 - - 2.27 2.24 1.43 2.97 1.93
Average Dog Marker Log copies/100 mL water <1.1 <1.1 1.16 3.58 - - <1.1 <1.1 <1.1 <1.1 3.58
Average Ruminant Marker Log copies/100 mL water <1.1 <1.1 1.72 6.38 - - <1.1 <1.1 <1.1 6.38 <1.1
ResultsGCRWQParameter UnitsStatistics
CCME FAL
121415826Page 17 of 38
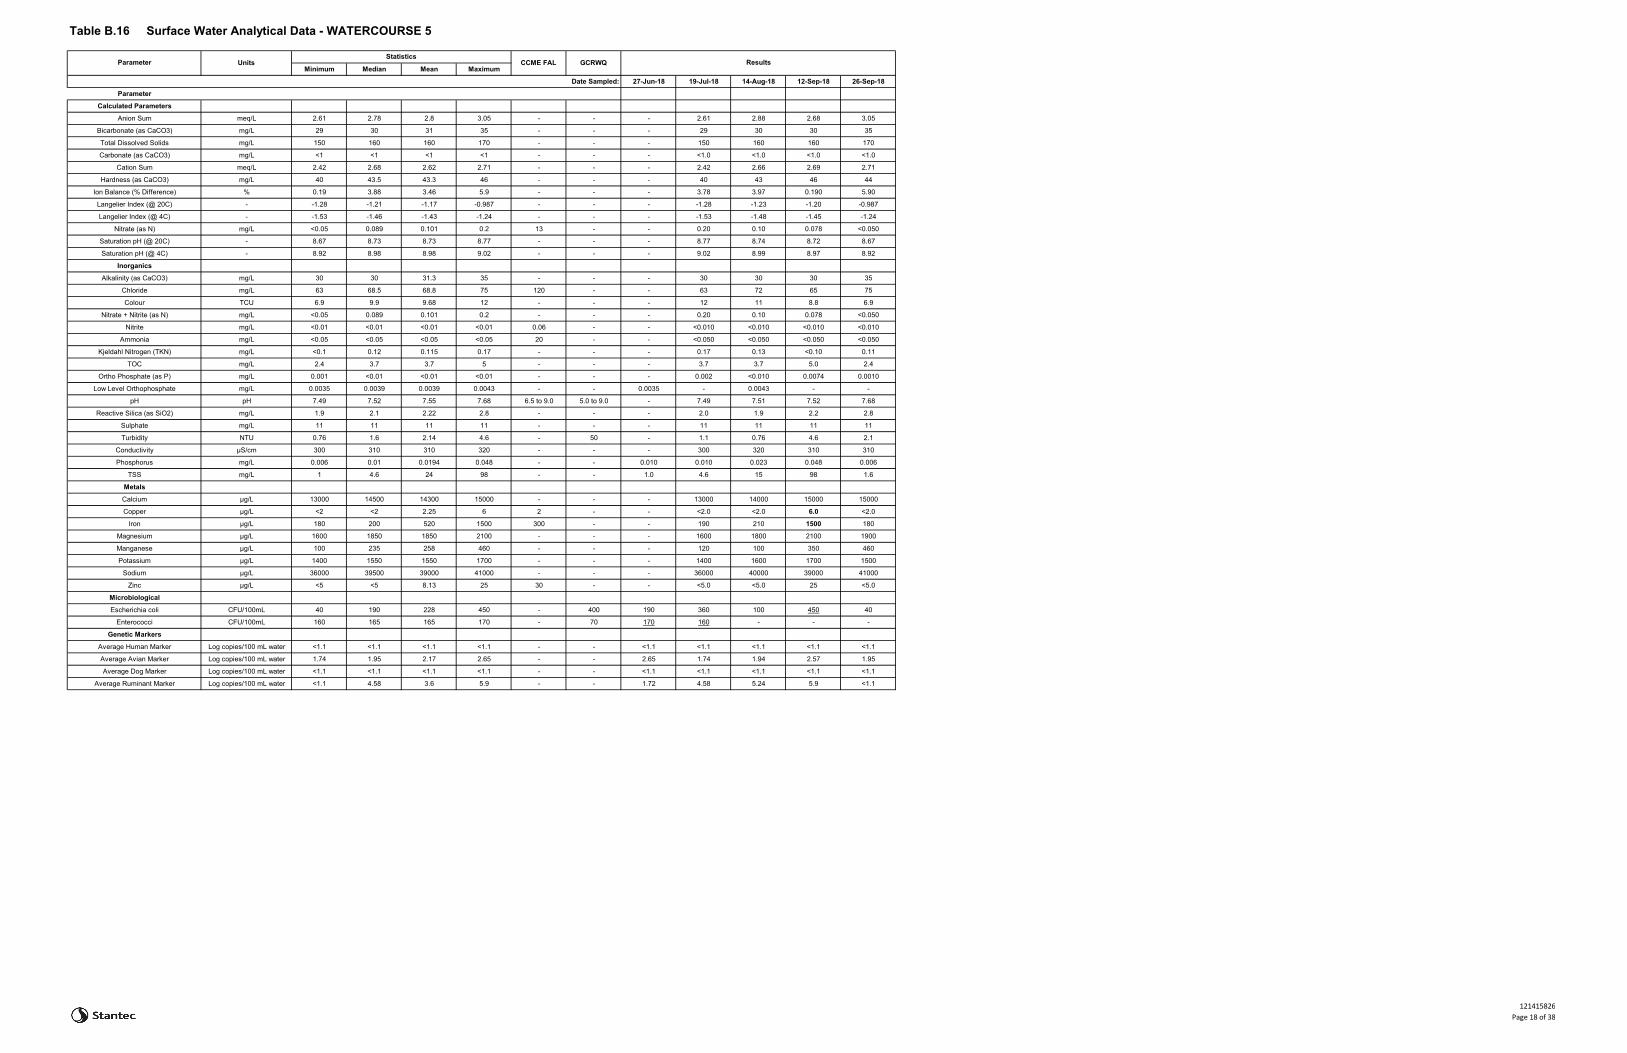
Table B.16 Surface Water Analytical Data - WATERCOURSE 5
Minimum Median Mean Maximum
Date Sampled: 27-Jun-18 19-Jul-18 14-Aug-18 12-Sep-18 26-Sep-18
Parameter
Calculated Parameters
Anion Sum meq/L 2.61 2.78 2.8 3.05 - - - 2.61 2.88 2.68 3.05
Bicarbonate (as CaCO3) mg/L 29 30 31 35 - - - 29 30 30 35
Total Dissolved Solids mg/L 150 160 160 170 - - - 150 160 160 170
Carbonate (as CaCO3) mg/L <1 <1 <1 <1 - - - <1.0 <1.0 <1.0 <1.0
Cation Sum meq/L 2.42 2.68 2.62 2.71 - - - 2.42 2.66 2.69 2.71
Hardness (as CaCO3) mg/L 40 43.5 43.3 46 - - - 40 43 46 44
Ion Balance (% Difference) % 0.19 3.88 3.46 5.9 - - - 3.78 3.97 0.190 5.90
Langelier Index (@ 20C) - -1.28 -1.21 -1.17 -0.987 - - - -1.28 -1.23 -1.20 -0.987
Langelier Index (@ 4C) - -1.53 -1.46 -1.43 -1.24 - - - -1.53 -1.48 -1.45 -1.24
Nitrate (as N) mg/L <0.05 0.089 0.101 0.2 13 - - 0.20 0.10 0.078 <0.050
Saturation pH (@ 20C) - 8.67 8.73 8.73 8.77 - - - 8.77 8.74 8.72 8.67
Saturation pH (@ 4C) - 8.92 8.98 8.98 9.02 - - - 9.02 8.99 8.97 8.92
Inorganics
Alkalinity (as CaCO3) mg/L 30 30 31.3 35 - - - 30 30 30 35
Chloride mg/L 63 68.5 68.8 75 120 - - 63 72 65 75
Colour TCU 6.9 9.9 9.68 12 - - - 12 11 8.8 6.9
Nitrate + Nitrite (as N) mg/L <0.05 0.089 0.101 0.2 - - - 0.20 0.10 0.078 <0.050
Nitrite mg/L <0.01 <0.01 <0.01 <0.01 0.06 - - <0.010 <0.010 <0.010 <0.010
Ammonia mg/L <0.05 <0.05 <0.05 <0.05 20 - - <0.050 <0.050 <0.050 <0.050
Kjeldahl Nitrogen (TKN) mg/L <0.1 0.12 0.115 0.17 - - - 0.17 0.13 <0.10 0.11
TOC mg/L 2.4 3.7 3.7 5 - - - 3.7 3.7 5.0 2.4
Ortho Phosphate (as P) mg/L 0.001 <0.01 <0.01 <0.01 - - - 0.002 <0.010 0.0074 0.0010
Low Level Orthophosphate mg/L 0.0035 0.0039 0.0039 0.0043 - - 0.0035 - 0.0043 - -
pH pH 7.49 7.52 7.55 7.68 6.5 to 9.0 5.0 to 9.0 - 7.49 7.51 7.52 7.68
Reactive Silica (as SiO2) mg/L 1.9 2.1 2.22 2.8 - - - 2.0 1.9 2.2 2.8
Sulphate mg/L 11 11 11 11 - - - 11 11 11 11
Turbidity NTU 0.76 1.6 2.14 4.6 - 50 - 1.1 0.76 4.6 2.1
Conductivity µS/cm 300 310 310 320 - - - 300 320 310 310
Phosphorus mg/L 0.006 0.01 0.0194 0.048 - - 0.010 0.010 0.023 0.048 0.006
TSS mg/L 1 4.6 24 98 - - 1.0 4.6 15 98 1.6
Metals
Calcium µg/L 13000 14500 14300 15000 - - - 13000 14000 15000 15000
Copper µg/L <2 <2 2.25 6 2 - - <2.0 <2.0 6.0 <2.0
Iron µg/L 180 200 520 1500 300 - - 190 210 1500 180
Magnesium µg/L 1600 1850 1850 2100 - - - 1600 1800 2100 1900
Manganese µg/L 100 235 258 460 - - - 120 100 350 460
Potassium µg/L 1400 1550 1550 1700 - - - 1400 1600 1700 1500
Sodium µg/L 36000 39500 39000 41000 - - - 36000 40000 39000 41000
Zinc µg/L <5 <5 8.13 25 30 - - <5.0 <5.0 25 <5.0
Microbiological
Escherichia coli CFU/100mL 40 190 228 450 - 400 190 360 100 450 40
Enterococci CFU/100mL 160 165 165 170 - 70 170 160 - - -
Genetic Markers
Average Human Marker Log copies/100 mL water <1.1 <1.1 <1.1 <1.1 - - <1.1 <1.1 <1.1 <1.1 <1.1
Average Avian Marker Log copies/100 mL water 1.74 1.95 2.17 2.65 - - 2.65 1.74 1.94 2.57 1.95
Average Dog Marker Log copies/100 mL water <1.1 <1.1 <1.1 <1.1 - - <1.1 <1.1 <1.1 <1.1 <1.1
Average Ruminant Marker Log copies/100 mL water <1.1 4.58 3.6 5.9 - - 1.72 4.58 5.24 5.9 <1.1
ResultsGCRWQParameter UnitsStatistics
CCME FAL
121415826Page 18 of 38

Table B.17 Surface Water Analytical Data - WATERCOURSE 6
Minimum Median Mean Maximum
Date Sampled: 27-Jun-18 19-Jul-18 14-Aug-18 12-Sep-18 26-Sep-18
Parameter
Calculated Parameters
Anion Sum meq/L 2.67 2.82 2.84 3.04 - - - 2.67 2.95 2.69 3.04
Bicarbonate (as CaCO3) mg/L 31 33.5 33.3 35 - - - 31 35 33 34
Total Dissolved Solids mg/L 150 160 160 170 - - - 150 160 160 170
Carbonate (as CaCO3) mg/L <1 <1 <1 <1 - - - <1.0 <1.0 <1.0 <1.0
Cation Sum meq/L 2.54 2.62 2.64 2.76 - - - 2.54 2.60 2.64 2.76
Hardness (as CaCO3) mg/L 42 43 43.5 46 - - - 42 43 43 46
Ion Balance (% Difference) % 0.94 3.67 3.64 6.31 - - - 2.50 6.31 0.940 4.83
Langelier Index (@ 20C) - -1.47 -1.37 -1.33 -1.14 - - - -1.47 -1.29 -1.44 -1.14
Langelier Index (@ 4C) - -1.72 -1.62 -1.58 -1.39 - - - -1.72 -1.54 -1.69 -1.39
Nitrate (as N) mg/L <0.05 <0.05 0.0592 0.13 13 - - 0.13 <0.050 <0.050 0.057
Saturation pH (@ 20C) - 8.66 8.68 8.69 8.74 - - - 8.74 8.67 8.70 8.66
Saturation pH (@ 4C) - 8.91 8.93 8.94 8.99 - - - 8.99 8.92 8.95 8.91
Inorganics
Alkalinity (as CaCO3) mg/L 31 33.5 33.5 36 - - - 31 36 33 34
Chloride mg/L 65 68.5 69.3 75 120 - - 65 72 65 75
Colour TCU 7.8 10.2 10 12 - - - 12 11 9.3 7.8
Nitrate + Nitrite (as N) mg/L <0.05 <0.05 0.0592 0.13 - - - 0.13 <0.050 <0.050 0.057
Nitrite mg/L <0.01 <0.01 <0.01 <0.01 0.06 - - <0.010 <0.010 <0.010 <0.010
Ammonia mg/L <0.05 <0.05 <0.05 <0.05 20 - - <0.050 <0.050 <0.050 <0.050
Kjeldahl Nitrogen (TKN) mg/L <0.1 0.1 0.103 0.16 - - - <0.10 0.16 <0.10 0.15
TOC mg/L 3 3.1 3.18 3.5 - - - 3.5 3.1 3.0 3.1
Ortho Phosphate (as P) mg/L 0.0013 0.0057 0.00668 0.014 - - - 0.004 0.014 0.0074 0.0013
Low Level Orthophosphate mg/L 0.0047 0.005 0.005 0.0053 - - 0.0047 - 0.0053 - -
pH pH 7.26 7.32 7.36 7.52 6.5 to 9.0 5.0 to 9.0 - 7.27 7.38 7.26 7.52
Reactive Silica (as SiO2) mg/L 2.1 2.55 2.55 3 - - - 2.2 2.9 3.0 2.1
Sulphate mg/L 9.5 9.85 10.6 13 - - - 10 9.7 9.5 13
Turbidity NTU 0.55 0.72 0.823 1.3 - 50 - 0.88 0.56 1.3 0.55
Conductivity µS/cm 310 315 315 320 - - - 310 320 310 320
Phosphorus mg/L 0.005 0.008 0.0106 0.024 - - 0.006 0.010 0.008 0.024 0.005
TSS mg/L <1 1.4 3.28 12 - - <1.0 12 1.4 2.0 <1.0
Metals
Calcium µg/L 14000 14000 14300 15000 - - - 14000 14000 14000 15000
Copper µg/L <2 <2 <2 <2 2 - - <2.0 <2.0 <2.0 <2.0
Iron µg/L 97 215 332 800 300 - - 150 280 800 97
Magnesium µg/L 1700 1800 1800 1900 - - - 1700 1800 1800 1900
Manganese µg/L 88 350 472 1100 - - - 130 570 1100 88
Potassium µg/L 1400 1550 1550 1700 - - - 1500 1400 1700 1600
Sodium µg/L 38000 39000 39300 41000 - - - 38000 39000 39000 41000
Zinc µg/L <5 <5 <5 <5 30 - - <5.0 <5.0 <5.0 <5.0
Microbiological
Escherichia coli CFU/100mL 90 695 895 2100 - 400 - 1300 90 2100 90
Enterococci CFU/100mL 190 190 190 190 - 70 - 190 - - -
Genetic Markers
Average Human Marker Log copies/100 mL water <1.1 <1.1 1.76 4.81 - - <1.1 2.35 <1.1 <1.1 4.81
Average Avian Marker Log copies/100 mL water 1.27 2.85 2.63 3.26 - - 2.68 2.85 3.1 3.26 1.27
Average Dog Marker Log copies/100 mL water <1.1 <1.1 1.11 3.34 - - <1.1 3.34 <1.1 <1.1 <1.1
ResultsGCRWQParameter UnitsStatistics
CCME FAL
121415826Page 19 of 38
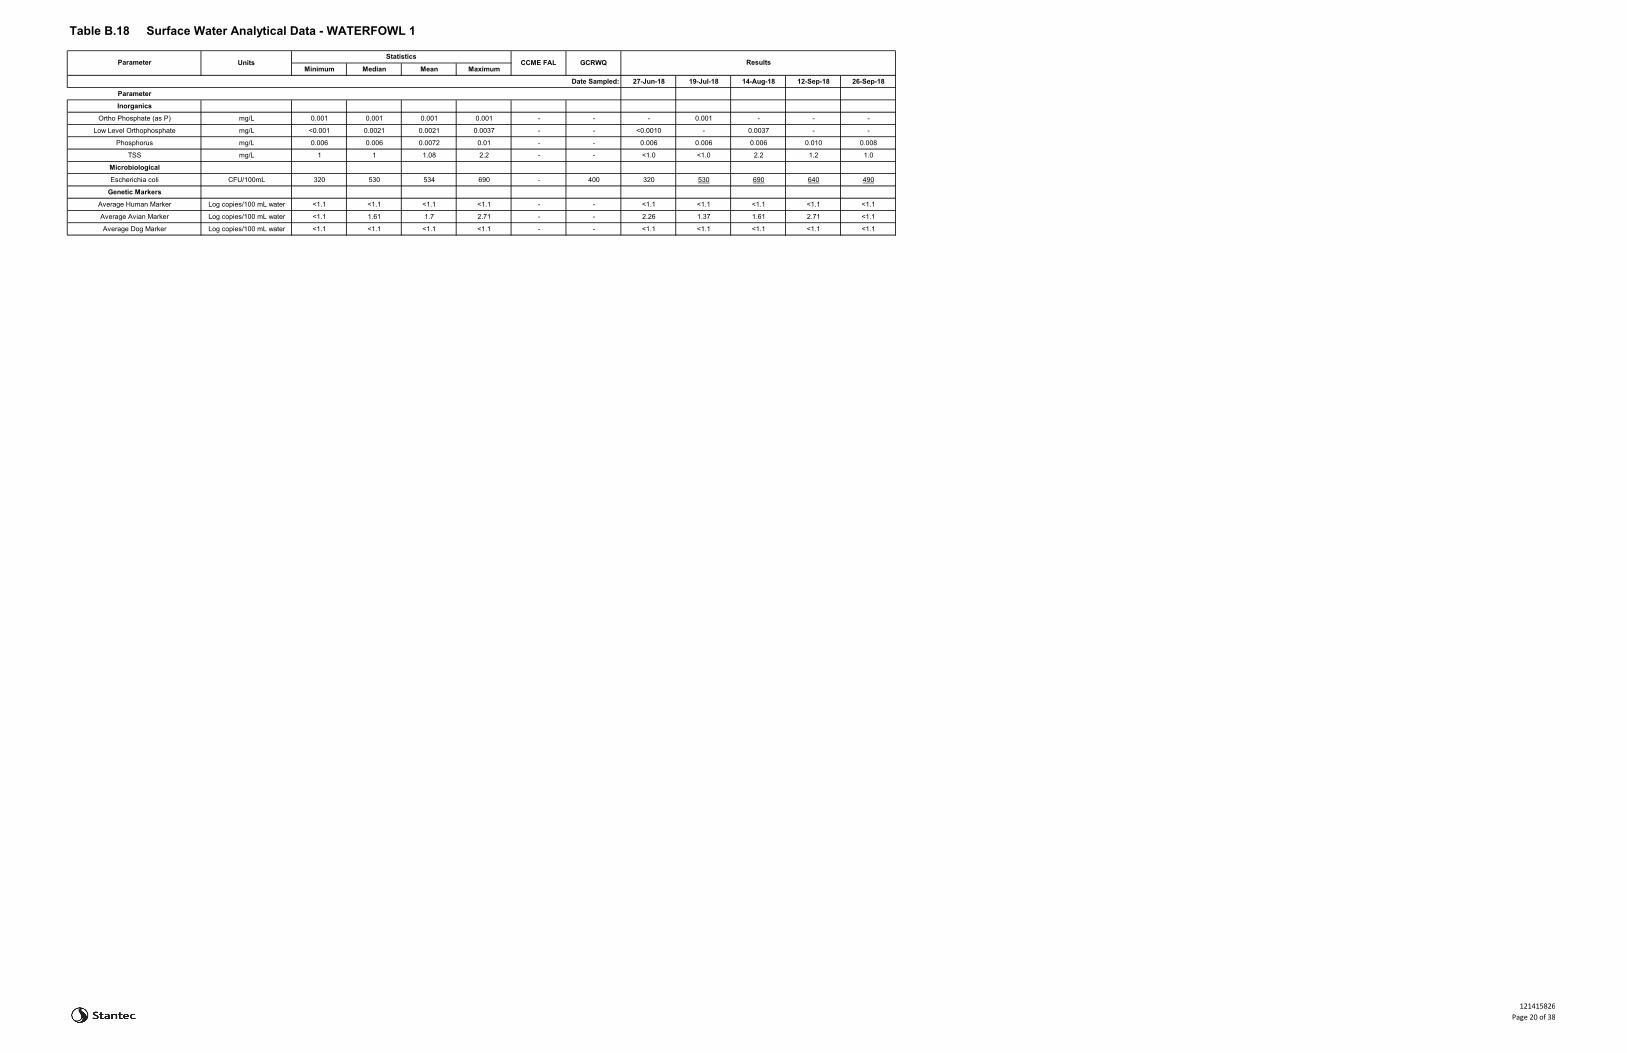
Table B.18 Surface Water Analytical Data - WATERFOWL 1
Minimum Median Mean Maximum
Date Sampled: 27-Jun-18 19-Jul-18 14-Aug-18 12-Sep-18 26-Sep-18
Parameter
Inorganics
Ortho Phosphate (as P) mg/L 0.001 0.001 0.001 0.001 - - - 0.001 - - -
Low Level Orthophosphate mg/L <0.001 0.0021 0.0021 0.0037 - - <0.0010 - 0.0037 - -
Phosphorus mg/L 0.006 0.006 0.0072 0.01 - - 0.006 0.006 0.006 0.010 0.008
TSS mg/L 1 1 1.08 2.2 - - <1.0 <1.0 2.2 1.2 1.0
Microbiological
Escherichia coli CFU/100mL 320 530 534 690 - 400 320 530 690 640 490
Genetic Markers
Average Human Marker Log copies/100 mL water <1.1 <1.1 <1.1 <1.1 - - <1.1 <1.1 <1.1 <1.1 <1.1
Average Avian Marker Log copies/100 mL water <1.1 1.61 1.7 2.71 - - 2.26 1.37 1.61 2.71 <1.1
Average Dog Marker Log copies/100 mL water <1.1 <1.1 <1.1 <1.1 - - <1.1 <1.1 <1.1 <1.1 <1.1
ResultsGCRWQParameter UnitsStatistics
CCME FAL
121415826Page 20 of 38

Table B.21 Surface Water Analytical Data - HDW8846
Minimum Median Mean Maximum
Date Sampled: 14-Aug-18 26-Sep-18
Parameter
Inorganics
Ortho Phosphate (as P) mg/L 0.019 0.019 0.019 0.019 - - - 0.019
Low Level Orthophosphate mg/L 0.018 0.018 0.018 0.018 - - 0.018 -
Phosphorus mg/L 0.17 0.335 0.335 0.5 - - 0.5 0.17
TSS mg/L 140 335 335 530 - - 530 140
Microbiological
Escherichia coli CFU/100mL 740 1220 1220 1700 - 400 1700 740
ResultsGCRWQParameter UnitsStatistics
CCME FAL
121415826Page 21 of 38

Table B.22 Surface Water Analytical Data - HDW8905
Minimum Median Mean Maximum
Date Sampled: 14-Aug-18 26-Sep-18
Parameter
Inorganics
Ortho Phosphate (as P) mg/L <0.001 <0.001 <0.001 <0.001 - - - <0.0010
Low Level Orthophosphate mg/L 0.0057 0.0057 0.0057 0.0057 - - 0.0057 -
Phosphorus mg/L 0.17 0.24 0.24 0.31 - - 0.31 0.17
TSS mg/L 180 235 235 290 - - 290 180
Microbiological
Escherichia coli CFU/100mL 790 945 945 1100 - 400 1100 790
ResultsGCRWQParameter UnitsStatistics
CCME FAL
121415826Page 22 of 38

Table B.23 Surface Water Analytical Data - HDW8989
Minimum Median Mean Maximum
Date Sampled: 14-Aug-18 26-Sep-18
Parameter
Inorganics
Ortho Phosphate (as P) mg/L 0.017 0.017 0.017 0.017 - - - 0.017
Low Level Orthophosphate mg/L 0.016 0.016 0.016 0.016 - - 0.016 -
Phosphorus mg/L 0.21 0.335 0.335 0.46 - - 0.21 0.46
TSS mg/L 170 205 205 240 - - 170 240
Microbiological
Escherichia coli CFU/100mL 550 610 610 670 - 400 550 670
ResultsGCRWQParameter UnitsStatistics
CCME FAL
121415826Page 23 of 38
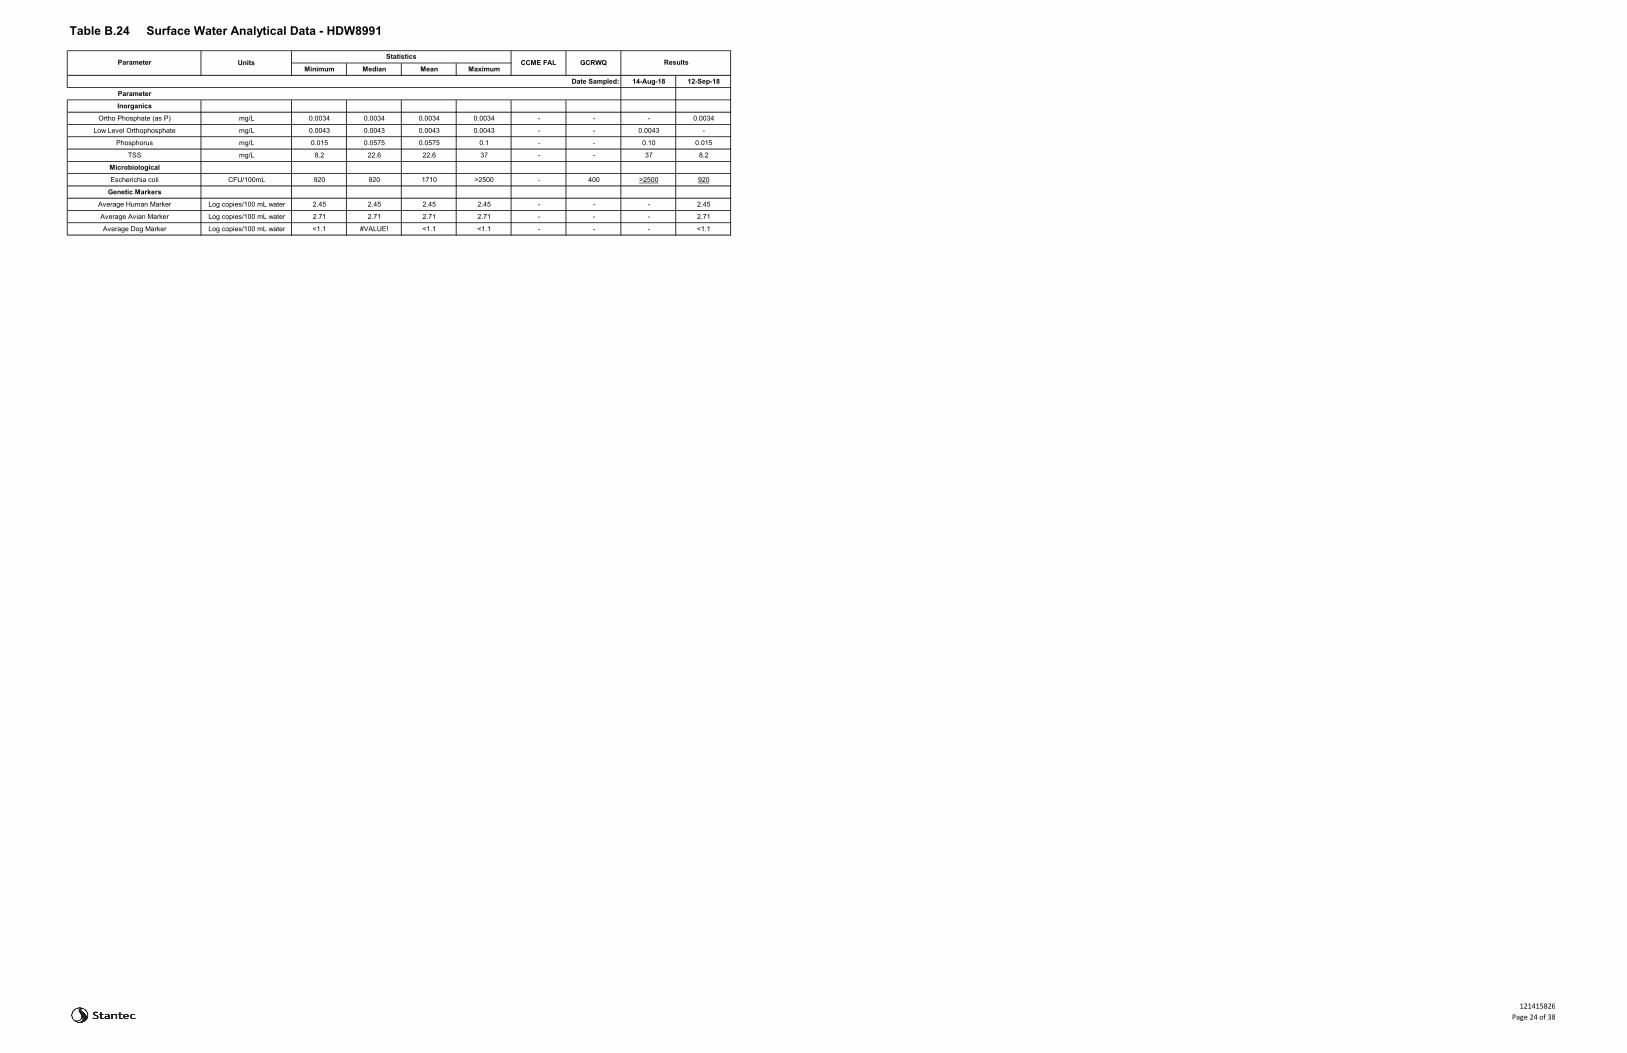
Table B.24 Surface Water Analytical Data - HDW8991
Minimum Median Mean Maximum
Date Sampled: 14-Aug-18 12-Sep-18
Parameter
Inorganics
Ortho Phosphate (as P) mg/L 0.0034 0.0034 0.0034 0.0034 - - - 0.0034
Low Level Orthophosphate mg/L 0.0043 0.0043 0.0043 0.0043 - - 0.0043 -
Phosphorus mg/L 0.015 0.0575 0.0575 0.1 - - 0.10 0.015
TSS mg/L 8.2 22.6 22.6 37 - - 37 8.2
Microbiological
Escherichia coli CFU/100mL 920 920 1710 >2500 - 400 >2500 920
Genetic Markers
Average Human Marker Log copies/100 mL water 2.45 2.45 2.45 2.45 - - - 2.45
Average Avian Marker Log copies/100 mL water 2.71 2.71 2.71 2.71 - - - 2.71
Average Dog Marker Log copies/100 mL water <1.1 #VALUE! <1.1 <1.1 - - - <1.1
ResultsGCRWQParameter UnitsStatistics
CCME FAL
121415826Page 24 of 38

Table B.25 Surface Water Analytical Data - HDW9308
Minimum Median Mean Maximum
Date Sampled: 14-Aug-18 26-Sep-18
Parameter
Inorganics
Ortho Phosphate (as P) mg/L 0.0026 0.0026 0.0026 0.0026 - - - 0.0026
Low Level Orthophosphate mg/L 0.0099 0.0099 0.0099 0.0099 - - 0.0099 -
Phosphorus mg/L 0.009 0.018 0.018 0.027 - - 0.027 0.009
TSS mg/L 3.2 3.5 3.5 3.8 - - 3.8 3.2
Microbiological
Escherichia coli CFU/100mL 130 915 915 1700 - 400 1700 130
ResultsGCRWQParameter UnitsStatistics
CCME FAL
121415826Page 25 of 38

Table B.26 Surface Water Analytical Data - HDW9311
Minimum Median Mean Maximum
Date Sampled: 14-Aug-18 26-Sep-18
Parameter
Inorganics
Ortho Phosphate (as P) mg/L 0.0077 0.0077 0.0077 0.0077 - - - 0.0077
Low Level Orthophosphate mg/L 0.029 0.029 0.029 0.029 - - 0.029 -
Phosphorus mg/L 0.66 1.48 1.48 2.3 - - 0.66 2.3
TSS mg/L 960 2780 2780 4600 - - 960 4600
Microbiological
Escherichia coli CFU/100mL >2500 5200 >2500 5200 - 400 >2500 5200
ResultsGCRWQParameter UnitsStatistics
CCME FAL
121415826Page 26 of 38

Table B.27 Surface Water Analytical Data - HDW9328
Minimum Median Mean Maximum
Date Sampled: 14-Aug-18 26-Sep-18
Parameter
Inorganics
Ortho Phosphate (as P) mg/L 0.0089 0.0089 0.0089 0.0089 - - - 0.0089
Low Level Orthophosphate mg/L 0.029 0.029 0.029 0.029 - - 0.029 -
Phosphorus mg/L 0.11 0.175 0.175 0.24 - - 0.11 0.24
TSS mg/L 120 190 190 260 - - 120 260
Microbiological
Escherichia coli CFU/100mL 280 325 325 370 - 400 370 280
ResultsGCRWQParameter UnitsStatistics
CCME FAL
121415826Page 27 of 38

Table B.28 Surface Water Analytical Data - HDW6453
Minimum Median Mean Maximum
Date Sampled: 26-Sep-18
Parameter
Inorganics
Ortho Phosphate (as P) mg/L 0.0011 0.0011 0.0011 0.0011 - - 0.0011
Phosphorus mg/L 0.039 0.039 0.039 0.039 - - 0.039
TSS mg/L 18 18 18 18 - - 18
Microbiological
Escherichia coli CFU/100mL 670 670 670 670 - 400 670
ResultsGCRWQParameter UnitsStatistics
CCME FAL
121415826Page 28 of 38
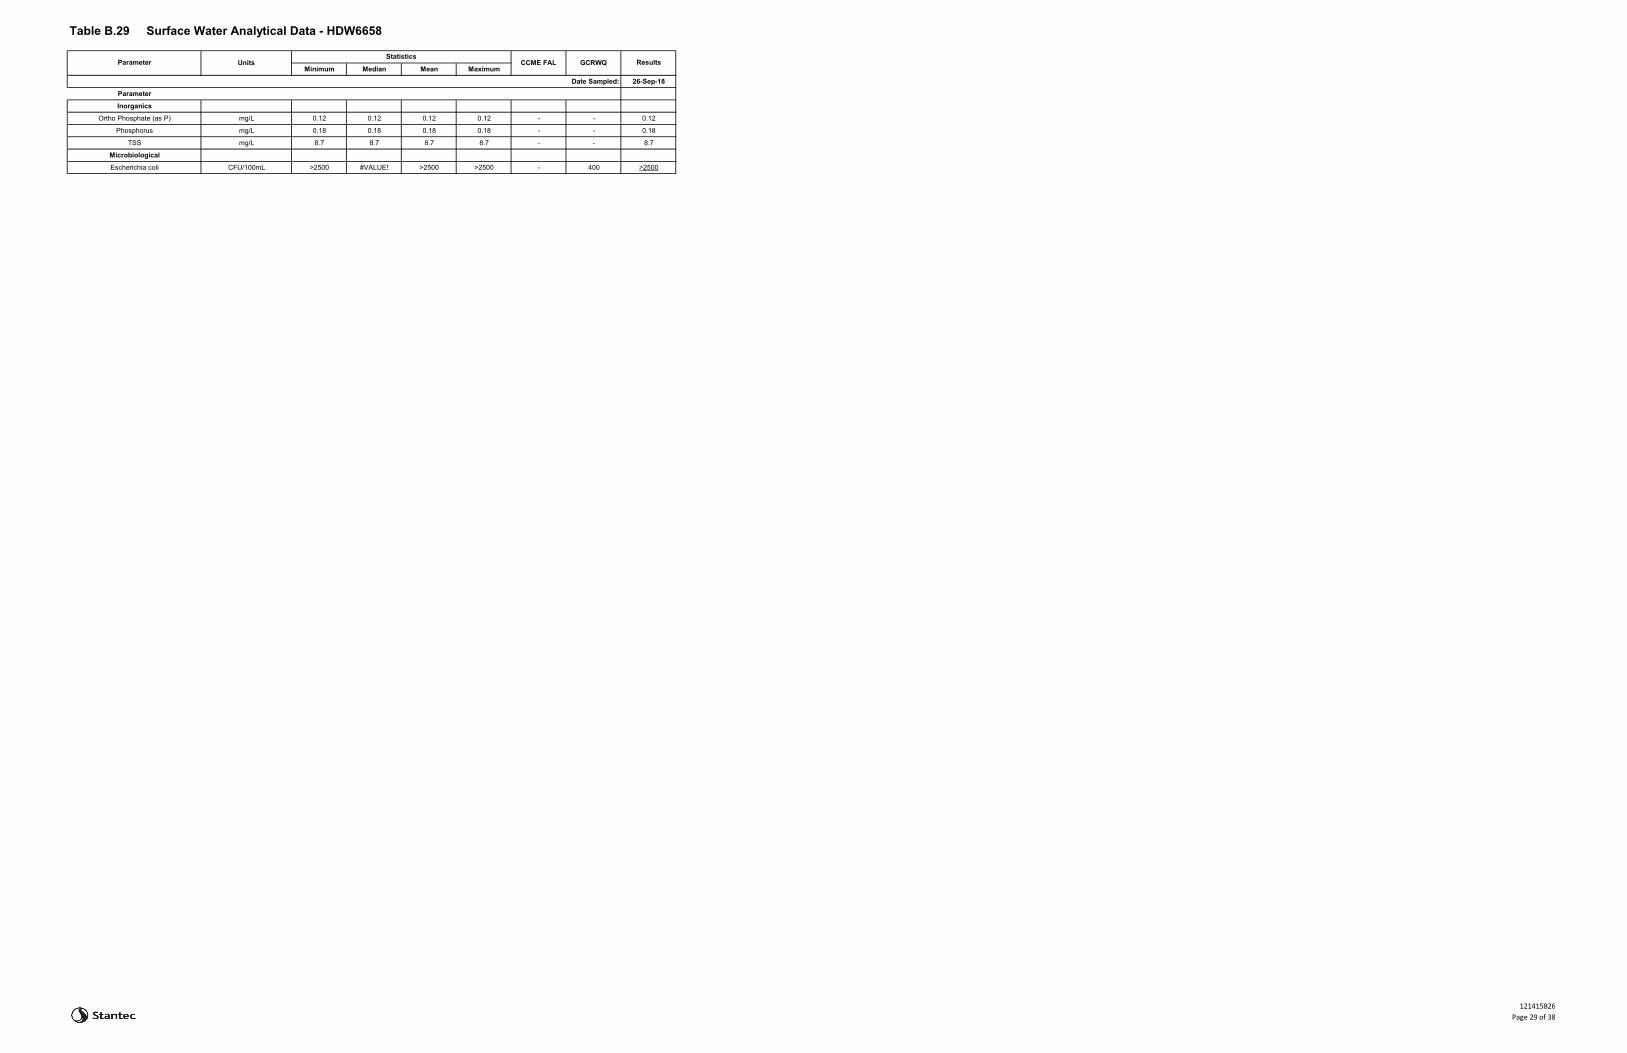
Table B.29 Surface Water Analytical Data - HDW6658
Minimum Median Mean Maximum
Date Sampled: 26-Sep-18
Parameter
Inorganics
Ortho Phosphate (as P) mg/L 0.12 0.12 0.12 0.12 - - 0.12
Phosphorus mg/L 0.18 0.18 0.18 0.18 - - 0.18
TSS mg/L 8.7 8.7 8.7 8.7 - - 8.7
Microbiological
Escherichia coli CFU/100mL >2500 #VALUE! >2500 >2500 - 400 >2500
ResultsGCRWQParameter UnitsStatistics
CCME FAL
121415826Page 29 of 38

Table B.30 Surface Water Analytical Data - HDW7052
Minimum Median Mean Maximum
Date Sampled: 26-Sep-18
Parameter
Inorganics
Ortho Phosphate (as P) mg/L 0.097 0.097 0.097 0.097 - - 0.097
Phosphorus mg/L 0.22 0.22 0.22 0.22 - - 0.22
TSS mg/L 33 33 33 33 - - 33
Microbiological
Escherichia coli CFU/100mL >2500 #VALUE! >2500 >2500 - 400 >2500
ResultsGCRWQParameter UnitsStatistics
CCME FAL
121415826Page 30 of 38
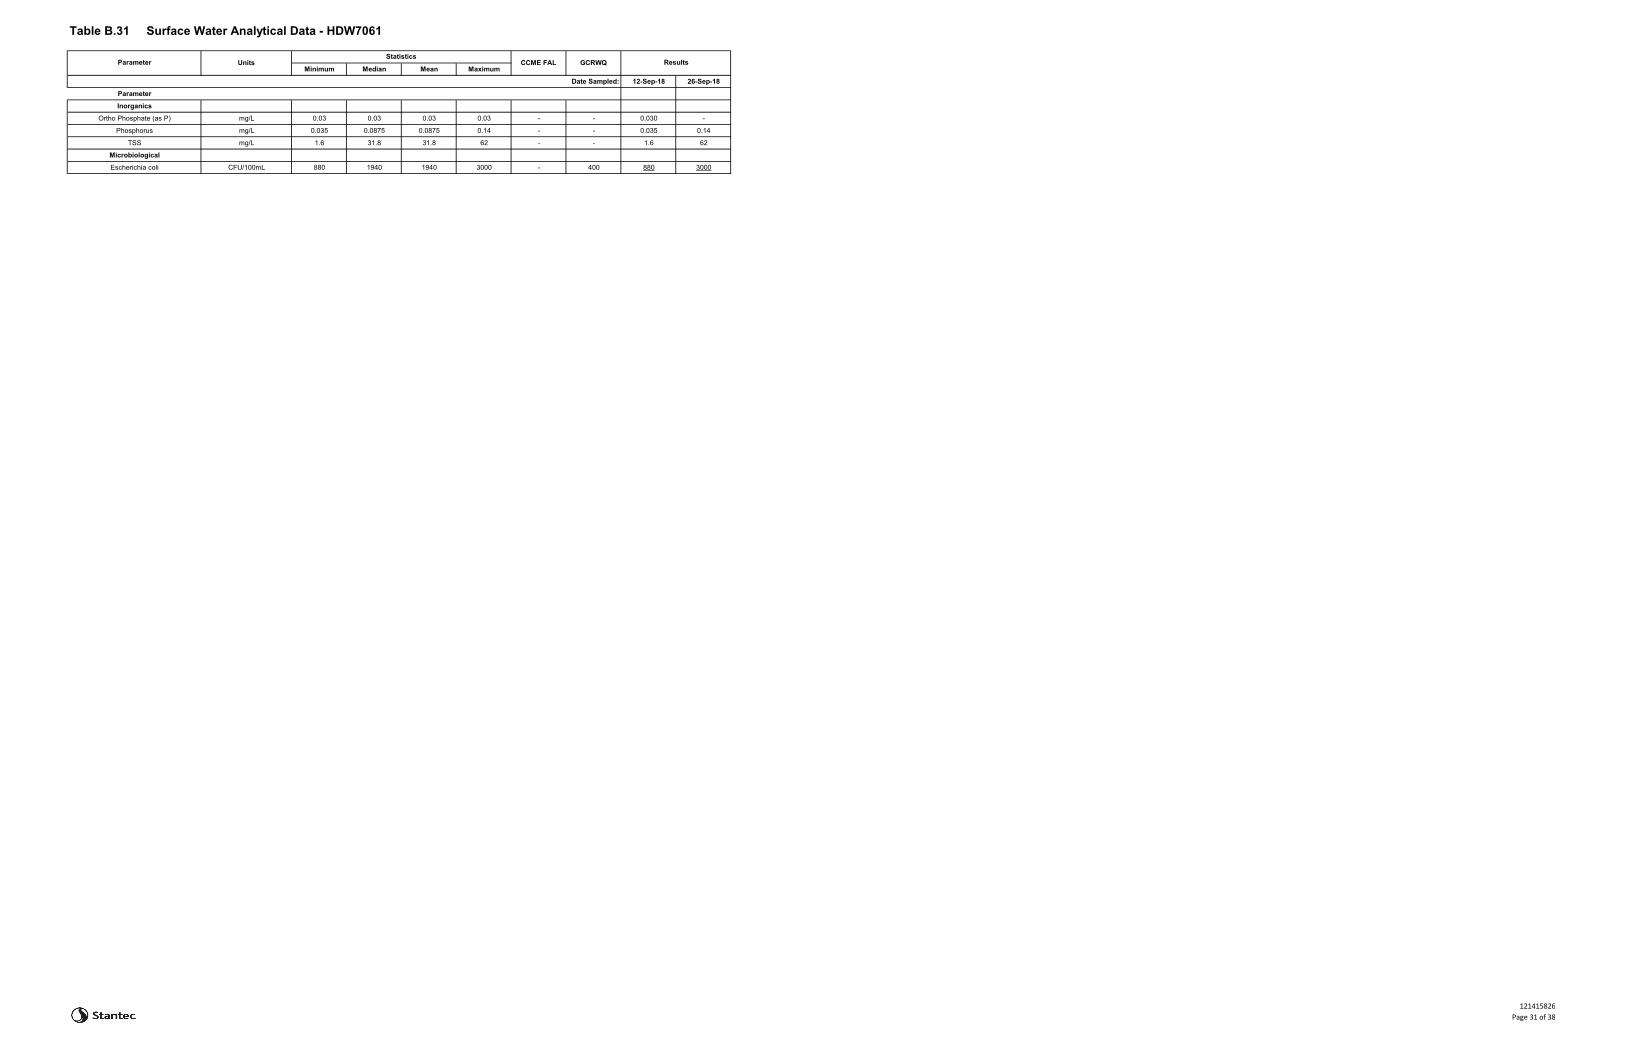
Table B.31 Surface Water Analytical Data - HDW7061
Minimum Median Mean Maximum
Date Sampled: 12-Sep-18 26-Sep-18
Parameter
Inorganics
Ortho Phosphate (as P) mg/L 0.03 0.03 0.03 0.03 - - 0.030 -
Phosphorus mg/L 0.035 0.0875 0.0875 0.14 - - 0.035 0.14
TSS mg/L 1.6 31.8 31.8 62 - - 1.6 62
Microbiological
Escherichia coli CFU/100mL 880 1940 1940 3000 - 400 880 3000
ResultsGCRWQParameter UnitsStatistics
CCME FAL
121415826Page 31 of 38
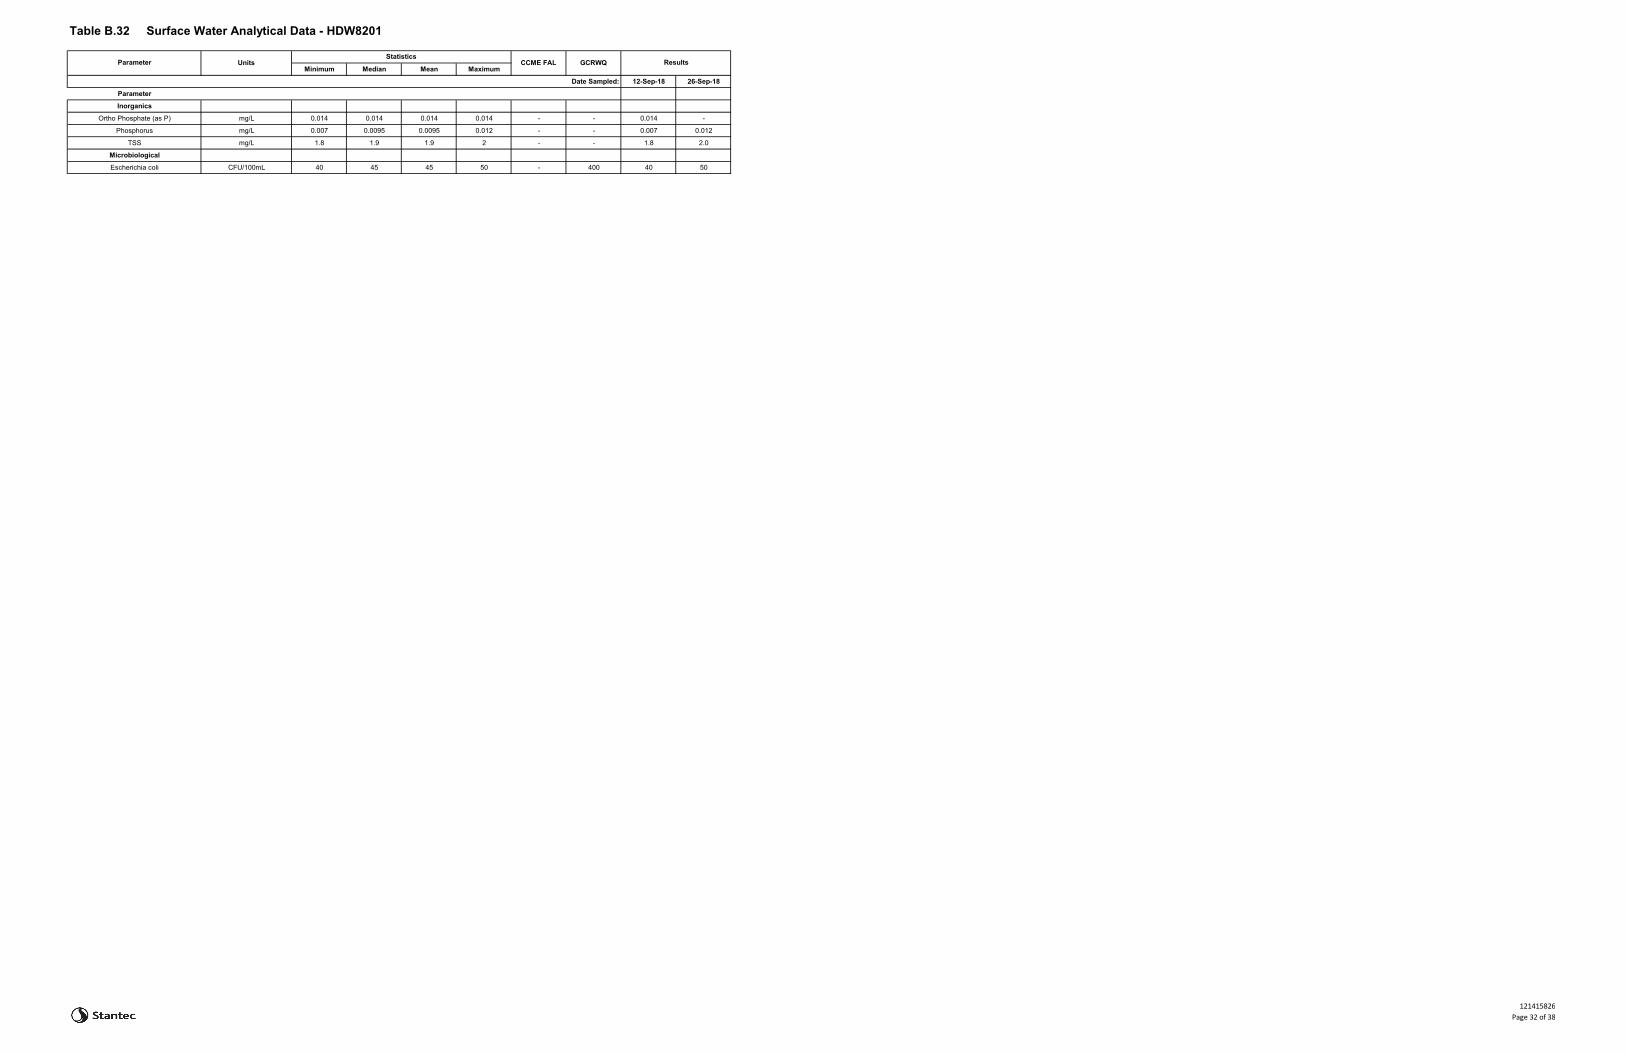
Table B.32 Surface Water Analytical Data - HDW8201
Minimum Median Mean Maximum
Date Sampled: 12-Sep-18 26-Sep-18
Parameter
Inorganics
Ortho Phosphate (as P) mg/L 0.014 0.014 0.014 0.014 - - 0.014 -
Phosphorus mg/L 0.007 0.0095 0.0095 0.012 - - 0.007 0.012
TSS mg/L 1.8 1.9 1.9 2 - - 1.8 2.0
Microbiological
Escherichia coli CFU/100mL 40 45 45 50 - 400 40 50
ResultsGCRWQParameter UnitsStatistics
CCME FAL
121415826Page 32 of 38
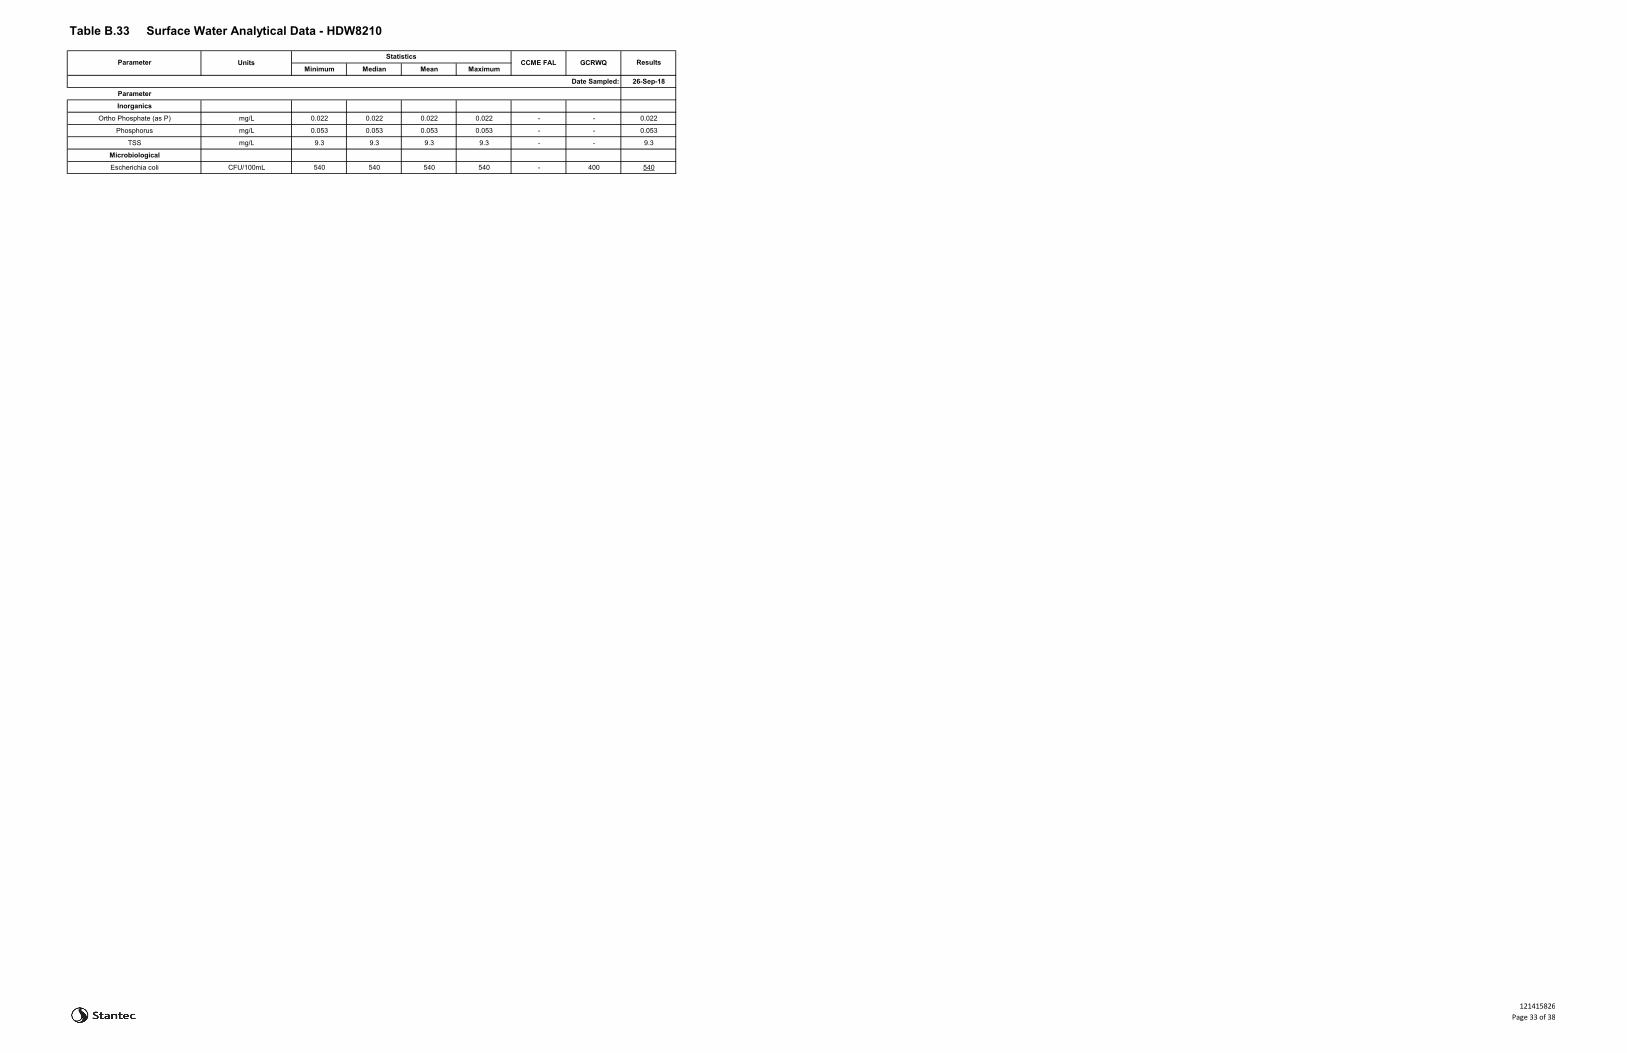
Table B.33 Surface Water Analytical Data - HDW8210
Minimum Median Mean Maximum
Date Sampled: 26-Sep-18
Parameter
Inorganics
Ortho Phosphate (as P) mg/L 0.022 0.022 0.022 0.022 - - 0.022
Phosphorus mg/L 0.053 0.053 0.053 0.053 - - 0.053
TSS mg/L 9.3 9.3 9.3 9.3 - - 9.3
Microbiological
Escherichia coli CFU/100mL 540 540 540 540 - 400 540
ResultsGCRWQParameter UnitsStatistics
CCME FAL
121415826Page 33 of 38

Table B.34 Surface Water Analytical Data - HDW8214
Minimum Median Mean Maximum
Date Sampled: 26-Sep-18
Parameter
Inorganics
Ortho Phosphate (as P) mg/L 0.0033 0.0033 0.0033 0.0033 - - 0.0033
Phosphorus mg/L 0.13 0.13 0.13 0.13 - - 0.13
TSS mg/L 49 49 49 49 - - 49
Microbiological
Escherichia coli CFU/100mL 150 150 150 150 - 400 150
ResultsGCRWQParameter UnitsStatistics
CCME FAL
121415826Page 34 of 38

Table B.35 Surface Water Analytical Data - HDW8713
Minimum Median Mean Maximum
Date Sampled: 12-Sep-18 26-Sep-18
Parameter
Inorganics
Ortho Phosphate (as P) mg/L 0.0014 0.0014 0.0014 0.0014 - - 0.0014 -
Phosphorus mg/L 0.071 0.155 0.156 0.24 - - 0.071 0.24
TSS mg/L 24 52 52 80 - - 24 80
Microbiological
Escherichia coli CFU/100mL 310 595 595 880 - 400 310 880
ResultsGCRWQParameter UnitsStatistics
CCME FAL
121415826Page 35 of 38

Table B.36 Surface Water Analytical Data - HDW8910
Minimum Median Mean Maximum
Date Sampled: 26-Sep-18
Parameter
Inorganics
Ortho Phosphate (as P) mg/L 0.056 0.056 0.056 0.056 - - 0.056
Phosphorus mg/L 0.091 0.091 0.091 0.091 - - 0.091
TSS mg/L 7.2 7.2 7.2 7.2 - - 7.2
Microbiological
Escherichia coli CFU/100mL 1700 1700 1700 1700 - 400 1700
ResultsGCRWQParameter UnitsStatistics
CCME FAL
121415826Page 36 of 38

Table B.37 Surface Water Analytical Data - OUTFALL 2
Minimum Median Mean Maximum
Date Sampled: 26-Sep-18
Parameter
Inorganics
Ortho Phosphate (as P) mg/L 0.0026 0.0026 0.0026 0.0026 - - 0.0026
Phosphorus mg/L 0.011 0.011 0.011 0.011 - - 0.011
TSS mg/L 8.2 8.2 8.2 8.2 - - 8.2
Microbiological
Escherichia coli CFU/100mL 10 10 10 10 - 400 10
ResultsGCRWQParameter UnitsStatistics
CCME FAL
121415826Page 37 of 38
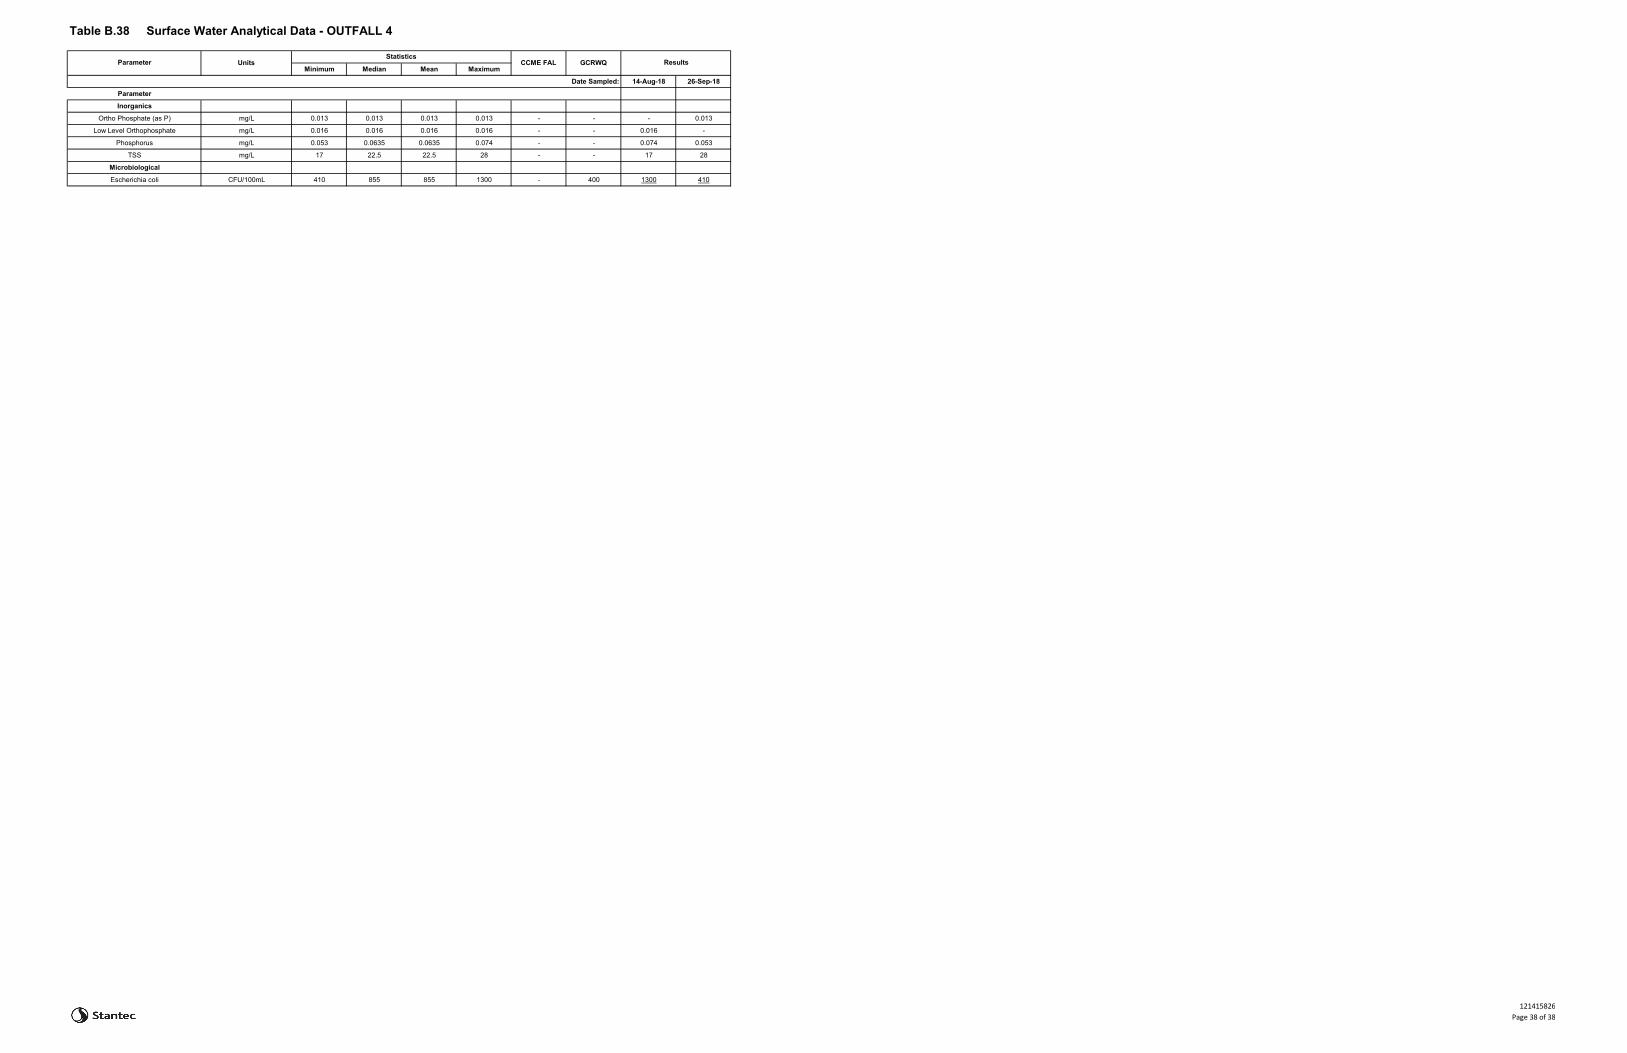
Table B.38 Surface Water Analytical Data - OUTFALL 4
Minimum Median Mean Maximum
Date Sampled: 14-Aug-18 26-Sep-18
Parameter
Inorganics
Ortho Phosphate (as P) mg/L 0.013 0.013 0.013 0.013 - - - 0.013
Low Level Orthophosphate mg/L 0.016 0.016 0.016 0.016 - - 0.016 -
Phosphorus mg/L 0.053 0.0635 0.0635 0.074 - - 0.074 0.053
TSS mg/L 17 22.5 22.5 28 - - 17 28
Microbiological
Escherichia coli CFU/100mL 410 855 855 1300 - 400 1300 410
ResultsGCRWQParameter UnitsStatistics
CCME FAL
121415826Page 38 of 38

B.5 – Microbial Source Tracking
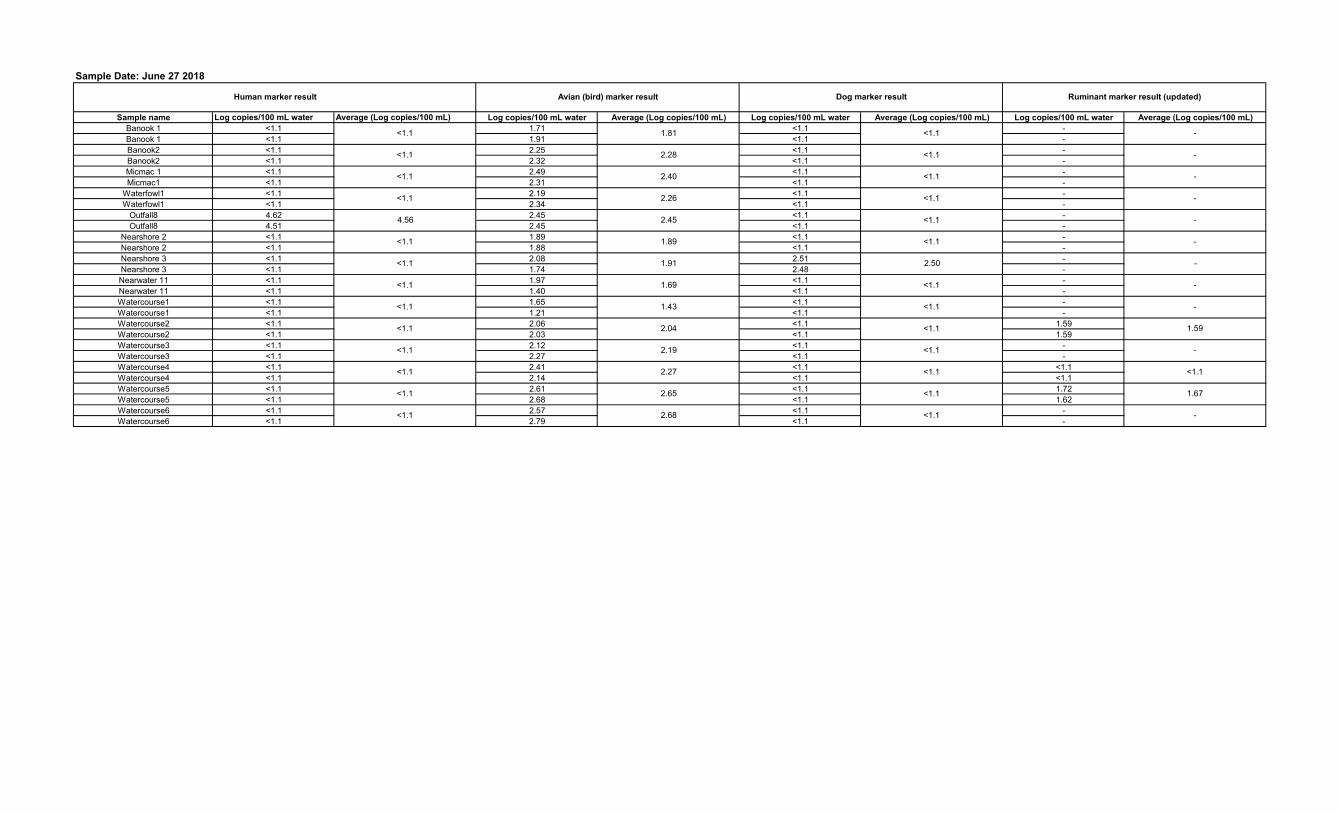
Sample Date: June 27 2018
Sample name Log copies/100 mL water Average (Log copies/100 mL) Log copies/100 mL water Average (Log copies/100 mL) Log copies/100 mL water Average (Log copies/100 mL) Log copies/100 mL water Average (Log copies/100 mL)Banook 1 <1.1 1.71 <1.1 -Banook 1 <1.1 1.91 <1.1 -Banook2 <1.1 2.25 <1.1 -Banook2 <1.1 2.32 <1.1 -Micmac 1 <1.1 2.49 <1.1 -Micmac1 <1.1 2.31 <1.1 -
Waterfowl1 <1.1 2.19 <1.1 -Waterfowl1 <1.1 2.34 <1.1 -
Outfall8 4.62 2.45 <1.1 -Outfall8 4.51 2.45 <1.1 -
Nearshore 2 <1.1 1.89 <1.1 -Nearshore 2 <1.1 1.88 <1.1 -Nearshore 3 <1.1 2.08 2.51 -Nearshore 3 <1.1 1.74 2.48 -Nearwater 11 <1.1 1.97 <1.1 -Nearwater 11 <1.1 1.40 <1.1 -Watercourse1 <1.1 1.65 <1.1 -Watercourse1 <1.1 1.21 <1.1 -Watercourse2 <1.1 2.06 <1.1 1.59Watercourse2 <1.1 2.03 <1.1 1.59Watercourse3 <1.1 2.12 <1.1 -Watercourse3 <1.1 2.27 <1.1 -Watercourse4 <1.1 2.41 <1.1 <1.1Watercourse4 <1.1 2.14 <1.1 <1.1Watercourse5 <1.1 2.61 <1.1 1.72Watercourse5 <1.1 2.68 <1.1 1.62Watercourse6 <1.1 2.57 <1.1 -Watercourse6 <1.1 2.79 <1.1 -
<1.1
<1.1
<1.1
<1.1
<1.1
<1.1
<1.1
<1.1
<1.1
<1.1
<1.1
<1.1
<1.1
<1.1
<1.1
<1.1
<1.1
<1.1
<1.1
<1.1
<1.1
4.56
Human marker result Avian (bird) marker result
1.81
2.28
2.40
2.26
2.45
<1.1
<1.1
<1.1
<1.1
1.89
1.91
1.69
1.43
2.04
-
-
-
-2.19
2.27
2.65
2.68 <1.1 -
Dog marker result
2.50
Ruminant marker result (updated)
1.59
1.67
<1.1
-
-
-
-
-
-
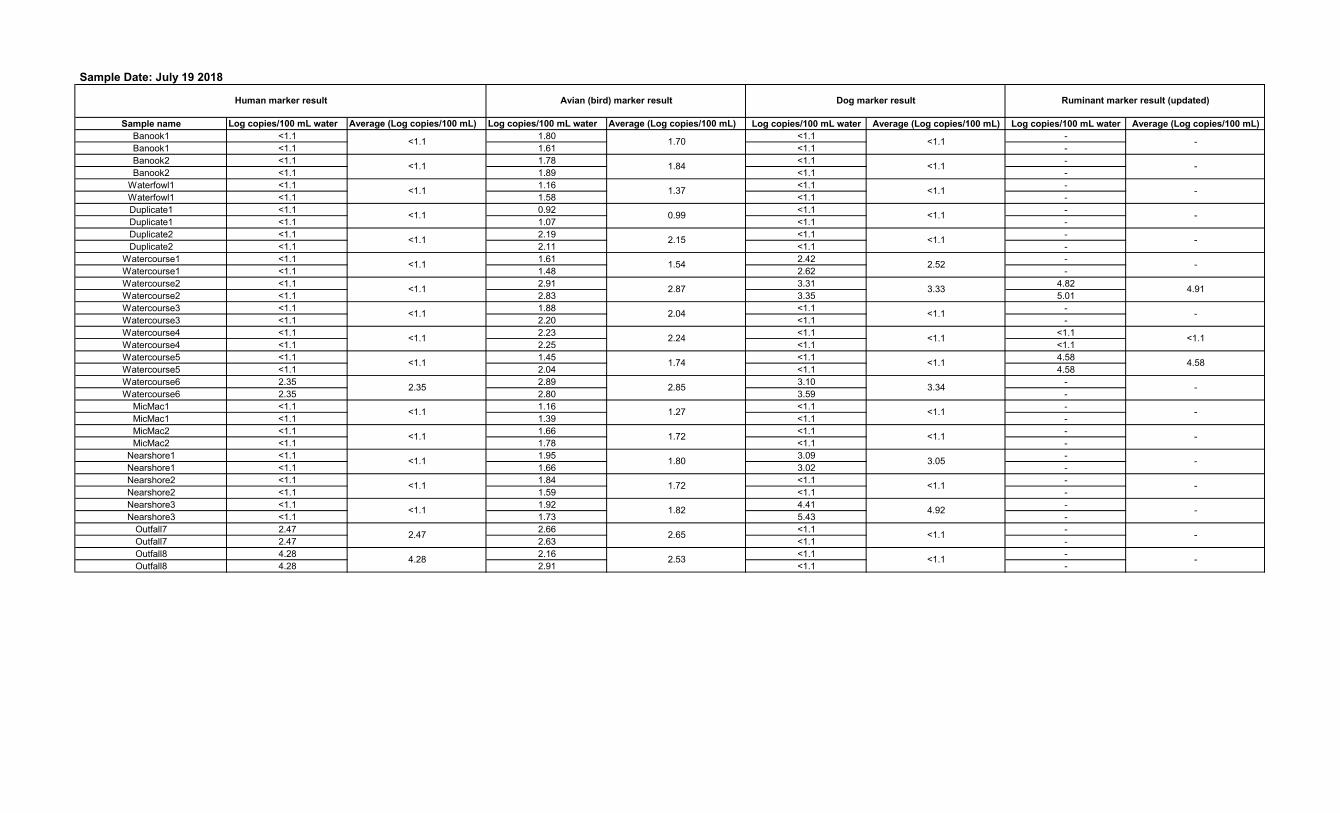
Sample Date: July 19 2018
Sample name Log copies/100 mL water Average (Log copies/100 mL) Log copies/100 mL water Average (Log copies/100 mL) Log copies/100 mL water Average (Log copies/100 mL) Log copies/100 mL water Average (Log copies/100 mL)Banook1 <1.1 1.80 <1.1 -Banook1 <1.1 1.61 <1.1 -Banook2 <1.1 1.78 <1.1 -Banook2 <1.1 1.89 <1.1 -
Waterfowl1 <1.1 1.16 <1.1 -Waterfowl1 <1.1 1.58 <1.1 -Duplicate1 <1.1 0.92 <1.1 -Duplicate1 <1.1 1.07 <1.1 -Duplicate2 <1.1 2.19 <1.1 -Duplicate2 <1.1 2.11 <1.1 -
Watercourse1 <1.1 1.61 2.42 -Watercourse1 <1.1 1.48 2.62 -Watercourse2 <1.1 2.91 3.31 4.82Watercourse2 <1.1 2.83 3.35 5.01Watercourse3 <1.1 1.88 <1.1 -Watercourse3 <1.1 2.20 <1.1 -Watercourse4 <1.1 2.23 <1.1 <1.1Watercourse4 <1.1 2.25 <1.1 <1.1Watercourse5 <1.1 1.45 <1.1 4.58Watercourse5 <1.1 2.04 <1.1 4.58Watercourse6 2.35 2.89 3.10 -Watercourse6 2.35 2.80 3.59 -
MicMac1 <1.1 1.16 <1.1 -MicMac1 <1.1 1.39 <1.1 -MicMac2 <1.1 1.66 <1.1 -MicMac2 <1.1 1.78 <1.1 -
Nearshore1 <1.1 1.95 3.09 -Nearshore1 <1.1 1.66 3.02 -Nearshore2 <1.1 1.84 <1.1 -Nearshore2 <1.1 1.59 <1.1 -Nearshore3 <1.1 1.92 4.41 -Nearshore3 <1.1 1.73 5.43 -
Outfall7 2.47 2.66 <1.1 -Outfall7 2.47 2.63 <1.1 -Outfall8 4.28 2.16 <1.1 -Outfall8 4.28 2.91 <1.1 -
<1.1
2.52
3.33
<1.1
<1.1
Dog marker result
<1.1
<1.1
<1.1
<1.1
Human marker result
2.35
<1.1
<1.1
<1.1
<1.1
<1.1
<1.1
<1.1
<1.1
4.28
<1.1
<1.1
Avian (bird) marker result
1.70
1.84
1.37
0.99
2.15
<1.1
<1.1
<1.1
<1.1
2.85
1.54 -
1.27
1.72
1.80
1.72
2.87
2.04
2.24
1.74 <1.1
3.34
<1.1
<1.1
3.05
Ruminant marker result (updated)
-
-
-
-
-
<1.1
2.47
4.91
-
<1.1
4.58
-
-
1.82
-
2.65
<1.1
4.92
<1.1
<1.12.53
-
-
-
-
-

Sample Date: August 14 2018
Sample name Log copies/100 mL water Average (Log copies/100 mL) Log copies/100 mL water Average (Log copies/100 mL) Log copies/100 mL water Average (Log copies/100 mL) Log copies/100 mL water Average (Log copies/100 mL)Banook 1 <1.1 1.22 <1.1 -Banook 1 <1.1 1.33 <1.1 -Micmac 1 <1.1 1.83 <1.1 -Micmac1 <1.1 1.62 <1.1 -
Watercourse1 <1.1 2.27 <1.1 -Watercourse1 <1.1 2.22 <1.1 -Watercourse2 <1.1 2.28 <1.1 5.22Watercourse2 <1.1 2.32 <1.1 5.72Watercourse3 <1.1 1.63 <1.1 -Watercourse3 <1.1 1.71 <1.1 -Watercourse4 <1.1 1.25 <1.1 <1.1Watercourse4 <1.1 1.61 <1.1 <1.1Watercourse5 <1.1 1.95 <1.1 5.20Watercourse5 <1.1 1.93 <1.1 5.29Watercourse6 <1.1 3.11 <1.1 -Watercourse6 <1.1 3.10 <1.1 -Nearshore1 <1.1 2.04 <1.1 -Nearshore1 <1.1 1.84 <1.1 -Nearshore2 <1.1 1.78 <1.1 -Nearshore2 <1.1 1.56 <1.1 -Nearshore3 <1.1 2.00 3.68 -Nearshore3 <1.1 1.88 3.86 -Waterfowl1 <1.1 1.72 <1.1 -Waterfowl1 <1.1 1.51 <1.1 -
Outfall8 4.01 1.96 <1.1 -Outfall8 4.10 1.85 <1.1 -Outfall8b 3.72 1.80 <1.1 -Outfall8b 3.79 1.64 <1.1 -
Ruminant marker result
1.28 <1.1
<1.1
1.91
1.72
1.67
1.94
1.61
<1.1
<1.1
<1.1
5.47
<1.1
<1.1
<1.1
Human marker result Avian (bird) marker result Dog marker result
3.10
1.94
2.24
2.30
1.67
1.43
1.94
<1.1
<1.1
<1.1
<1.1
<1.1
<1.1
<1.1
<1.1
5.24
3.77
<1.1
<1.1
<1.1
-
-
-
-
-
<1.1
4.05
3.75
<1.1
1.72
<1.1
<1.1
<1.1
<1.1
<1.1
-
-
-
-
-
-

Sample Date: September 12 2018
Sample name Log copies/100 mL water Average (Log copies/100 mL) Log copies/100 mL water Average (Log copies/100 mL) Log copies/100 mL water Average (Log copies/100 mL) Log copies/100 mL water Average (Log copies/100 mL)Waterfowl1 <1.1 2.71 <1.1 -Waterfowl1 <1.1 2.71 <1.1 -Banook1 <1.1 2.34 <1.1 -Banook1 <1.1 2.34 <1.1 -
Nearshore 3 <1.1 2.70 2.23 -Nearshore 3 <1.1 2.56 2.23 -
Watercourse 4 <1.1 2.92 <1.1 6.38Watercourse 4 <1.1 3.02 <1.1 6.38Watercourse 5 <1.1 2.56 <1.1 6.78Watercourse 5 <1.1 2.59 <1.1 5.02Watercourse 1 2.62 2.38 <1.1 -Watercourse 1 2.59 2.45 <1.1 -Watercourse 6 <1.1 3.25 <1.1 -Watercourse 6 <1.1 3.28 <1.1 -Watercourse 2 <1.1 3.62 2.68 6.82Watercourse 2 <1.1 3.55 2.68 7.04Nearshore 2 <1.1 3.28 <1.1 -Nearshore 2 <1.1 3.22 <1.1 -
Micmac 1 <1.1 2.80 <1.1 -Micmac 1 <1.1 2.72 <1.1 -Outfall 8b 4.63 2.64 <1.1 -Outfall 8b 2.77 2.70 <1.1 -Outfall 8 3.48 2.61 <1.1 -Outfall 8 2.97 2.65 <1.1 -
HDW 8991 2.69 2.72 <1.1 -HDW 8991 2.22 2.70 <1.1 -
Nearshore 1 2.96 2.67 2.42 -Nearshore 1 3.80 2.80 2.42 -
<1.1
<1.1
<1.1
2.42
2.23
<1.1
<1.1
<1.1
<1.1
2.68
<1.1
<1.1
2.74
2.63
2.97
2.57
2.42
3.26
3.58
3.25
2.76
2.67
2.63
2.71
3.70
3.23
2.45
3.38
<1.1
<1.1
<1.1
Human marker result Avian (bird) marker result Dog marker result Ruminant marker result
<1.1
<1.1
2.71
2.34
<1.1
<1.1
<1.1
<1.1
<1.1
2.61
<1.1
-
-
-
-
-
-
-
-
-
6.93
6.38
5.90
-
-
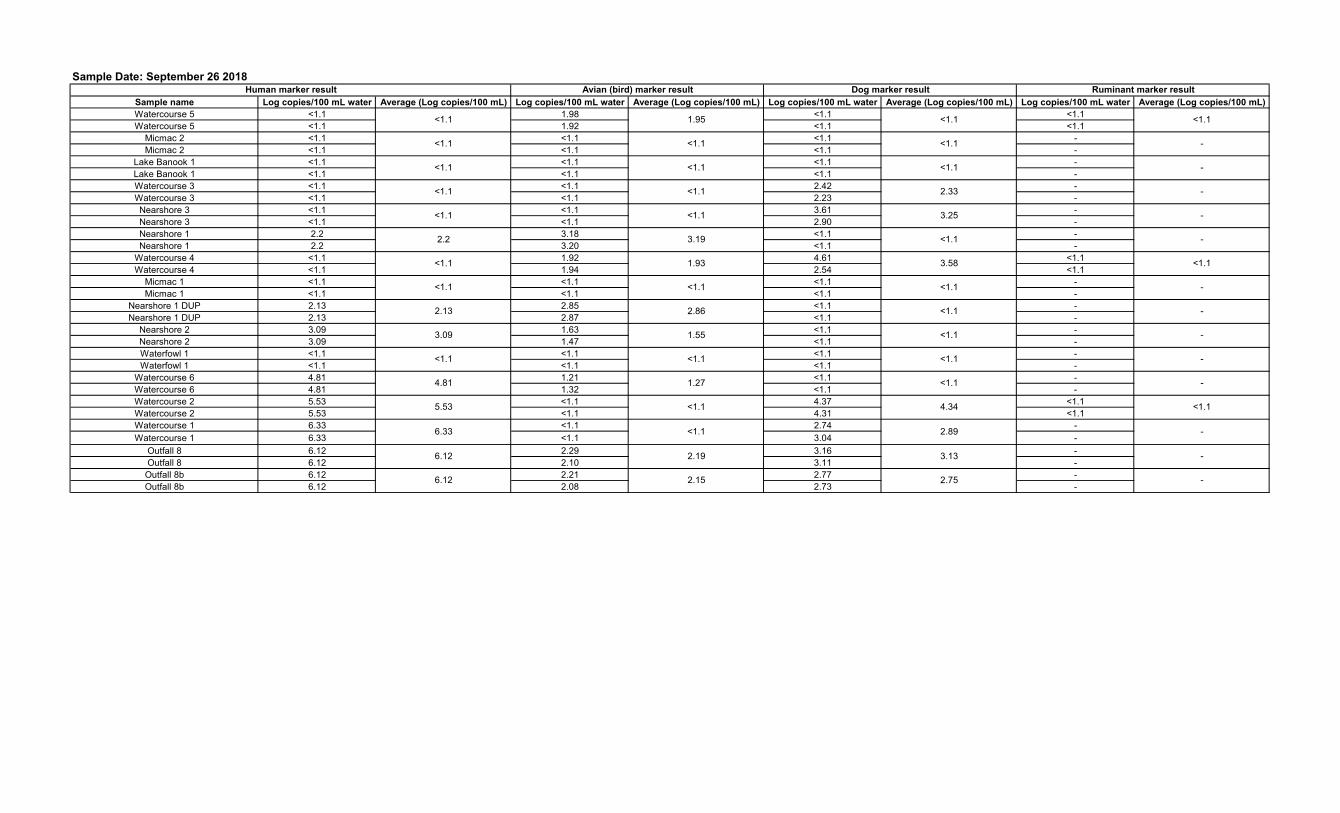
Sample Date: September 26 2018
Sample name Log copies/100 mL water Average (Log copies/100 mL) Log copies/100 mL water Average (Log copies/100 mL) Log copies/100 mL water Average (Log copies/100 mL) Log copies/100 mL water Average (Log copies/100 mL)Watercourse 5 <1.1 1.98 <1.1 <1.1Watercourse 5 <1.1 1.92 <1.1 <1.1
Micmac 2 <1.1 <1.1 <1.1 -Micmac 2 <1.1 <1.1 <1.1 -
Lake Banook 1 <1.1 <1.1 <1.1 -Lake Banook 1 <1.1 <1.1 <1.1 -Watercourse 3 <1.1 <1.1 2.42 -Watercourse 3 <1.1 <1.1 2.23 -Nearshore 3 <1.1 <1.1 3.61 -Nearshore 3 <1.1 <1.1 2.90 -Nearshore 1 2.2 3.18 <1.1 -Nearshore 1 2.2 3.20 <1.1 -
Watercourse 4 <1.1 1.92 4.61 <1.1Watercourse 4 <1.1 1.94 2.54 <1.1
Micmac 1 <1.1 <1.1 <1.1 -Micmac 1 <1.1 <1.1 <1.1 -
Nearshore 1 DUP 2.13 2.85 <1.1 -Nearshore 1 DUP 2.13 2.87 <1.1 -
Nearshore 2 3.09 1.63 <1.1 -Nearshore 2 3.09 1.47 <1.1 -Waterfowl 1 <1.1 <1.1 <1.1 -Waterfowl 1 <1.1 <1.1 <1.1 -
Watercourse 6 4.81 1.21 <1.1 -Watercourse 6 4.81 1.32 <1.1 -Watercourse 2 5.53 <1.1 4.37 <1.1Watercourse 2 5.53 <1.1 4.31 <1.1Watercourse 1 6.33 <1.1 2.74 -Watercourse 1 6.33 <1.1 3.04 -
Outfall 8 6.12 2.29 3.16 -Outfall 8 6.12 2.10 3.11 -
Outfall 8b 6.12 2.21 2.77 -Outfall 8b 6.12 2.08 2.73 -
<1.1
<1.1
<1.1
<1.1
<1.1
<1.1
<1.1
4.34
-
-
-
-
-
1.27
<1.1
<1.1
3.13
2.75
2.89
3.58
<1.1
2.86
1.55
<1.1
<1.1
-
-
-
-
<1.1
<1.1
<1.1
<1.1
3.19
1.93
<1.1
<1.1
2.33
3.25
<1.1
<1.1
<1.1
<1.1
<1.1
2.2
Human marker result Avian (bird) marker result Dog marker result Ruminant marker result
<1.1 1.95 <1.1
-
-
-
-
<1.1
6.12
6.33
<1.1
2.13
3.09
<1.1
4.81
5.53
6.12 2.19
2.15
APPENDIX D Modelling Outputs

D.1 – Rain-Event Based Model
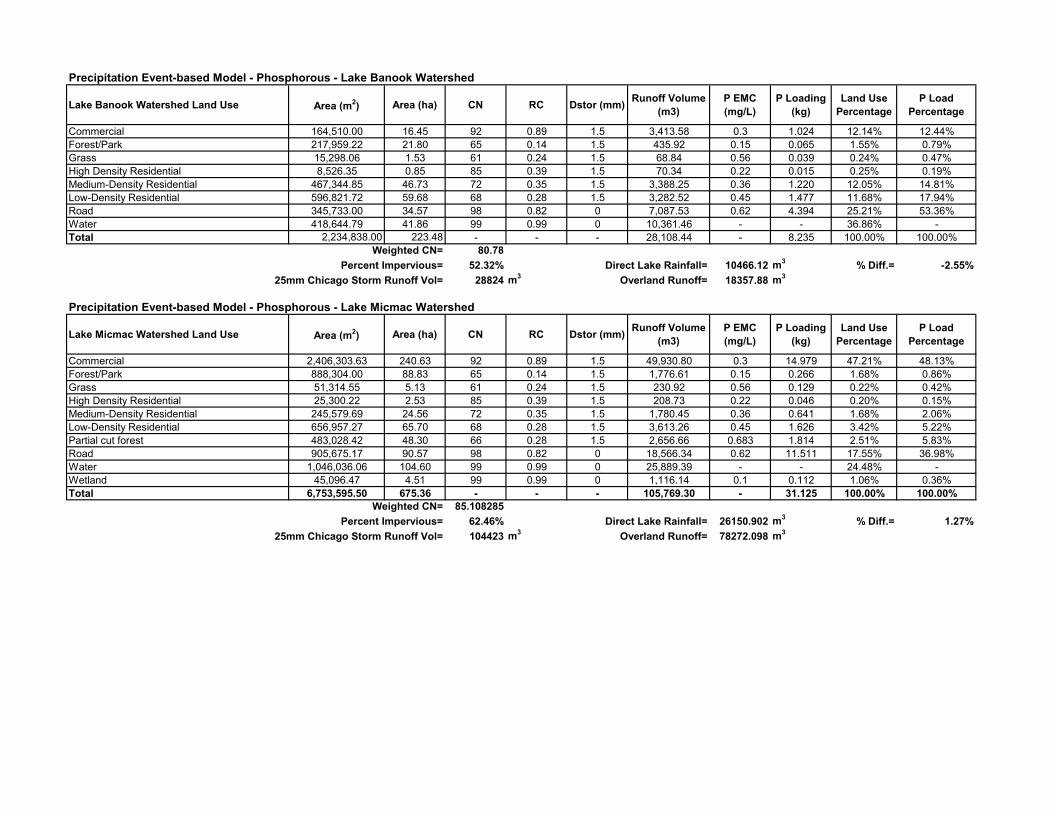
Precipitation Event-based Model - Phosphorous - Lake Banook Watershed
Lake Banook Watershed Land Use Area (m2) Area (ha) CN RC Dstor (mm) Runoff Volume (m3)
P EMC (mg/L)
P Loading (kg)
Land Use Percentage
P Load Percentage
Commercial 164,510.00 16.45 92 0.89 1.5 3,413.58 0.3 1.024 12.14% 12.44%Forest/Park 217,959.22 21.80 65 0.14 1.5 435.92 0.15 0.065 1.55% 0.79%Grass 15,298.06 1.53 61 0.24 1.5 68.84 0.56 0.039 0.24% 0.47%High Density Residential 8,526.35 0.85 85 0.39 1.5 70.34 0.22 0.015 0.25% 0.19%Medium-Density Residential 467,344.85 46.73 72 0.35 1.5 3,388.25 0.36 1.220 12.05% 14.81%Low-Density Residential 596,821.72 59.68 68 0.28 1.5 3,282.52 0.45 1.477 11.68% 17.94%Road 345,733.00 34.57 98 0.82 0 7,087.53 0.62 4.394 25.21% 53.36%Water 418,644.79 41.86 99 0.99 0 10,361.46 - - 36.86% -Total 2,234,838.00 223.48 - - - 28,108.44 - 8.235 100.00% 100.00%
Weighted CN= 80.78Percent Impervious= 52.32% Direct Lake Rainfall= 10466.12 m3 % Diff.= -2.55%
25mm Chicago Storm Runoff Vol= 28824 m3 Overland Runoff= 18357.88 m3
Precipitation Event-based Model - Phosphorous - Lake Micmac Watershed
Lake Micmac Watershed Land Use Area (m2) Area (ha) CN RC Dstor (mm) Runoff Volume (m3)
P EMC (mg/L)
P Loading (kg)
Land Use Percentage
P Load Percentage
Commercial 2,406,303.63 240.63 92 0.89 1.5 49,930.80 0.3 14.979 47.21% 48.13%Forest/Park 888,304.00 88.83 65 0.14 1.5 1,776.61 0.15 0.266 1.68% 0.86%Grass 51,314.55 5.13 61 0.24 1.5 230.92 0.56 0.129 0.22% 0.42%High Density Residential 25,300.22 2.53 85 0.39 1.5 208.73 0.22 0.046 0.20% 0.15%Medium-Density Residential 245,579.69 24.56 72 0.35 1.5 1,780.45 0.36 0.641 1.68% 2.06%Low-Density Residential 656,957.27 65.70 68 0.28 1.5 3,613.26 0.45 1.626 3.42% 5.22%Partial cut forest 483,028.42 48.30 66 0.28 1.5 2,656.66 0.683 1.814 2.51% 5.83%Road 905,675.17 90.57 98 0.82 0 18,566.34 0.62 11.511 17.55% 36.98%Water 1,046,036.06 104.60 99 0.99 0 25,889.39 - - 24.48% -Wetland 45,096.47 4.51 99 0.99 0 1,116.14 0.1 0.112 1.06% 0.36%Total 6,753,595.50 675.36 - - - 105,769.30 - 31.125 100.00% 100.00%
Weighted CN= 85.108285Percent Impervious= 62.46% Direct Lake Rainfall= 26150.902 m3 % Diff.= 1.27%
25mm Chicago Storm Runoff Vol= 104423 m3 Overland Runoff= 78272.098 m3
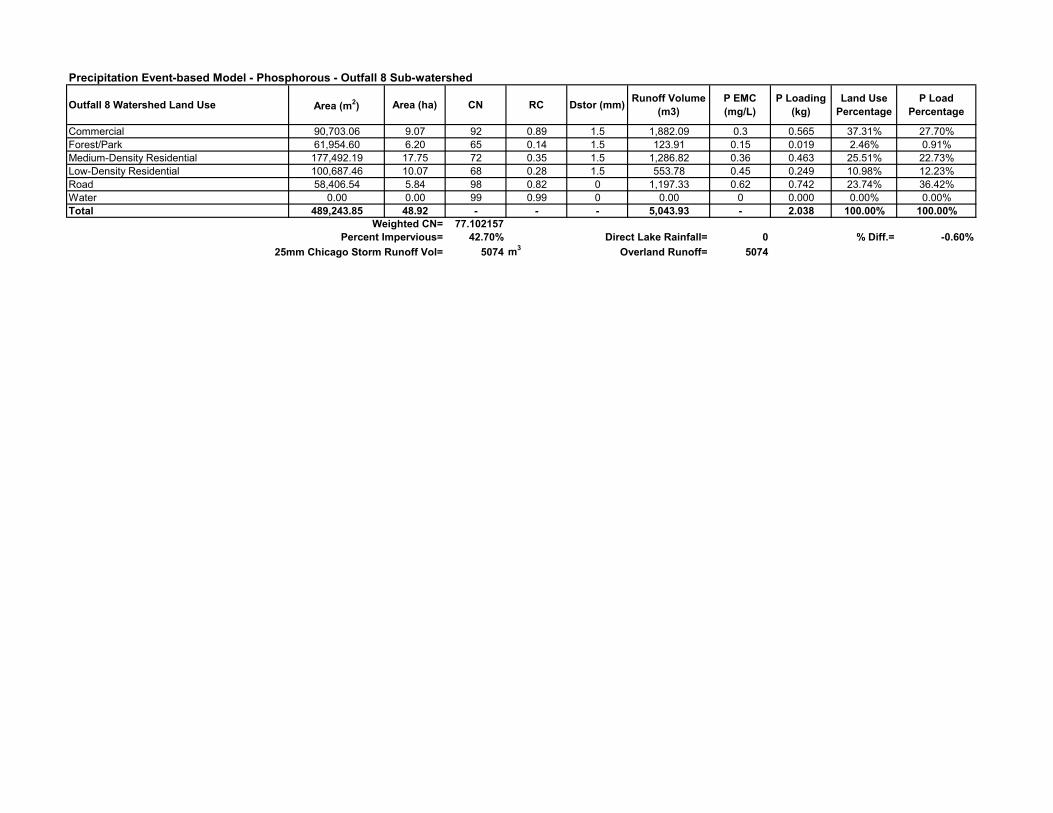
Precipitation Event-based Model - Phosphorous - Outfall 8 Sub-watershed
Outfall 8 Watershed Land Use Area (m2) Area (ha) CN RC Dstor (mm) Runoff Volume (m3)
P EMC (mg/L)
P Loading (kg)
Land Use Percentage
P Load Percentage
Commercial 90,703.06 9.07 92 0.89 1.5 1,882.09 0.3 0.565 37.31% 27.70%Forest/Park 61,954.60 6.20 65 0.14 1.5 123.91 0.15 0.019 2.46% 0.91%Medium-Density Residential 177,492.19 17.75 72 0.35 1.5 1,286.82 0.36 0.463 25.51% 22.73%Low-Density Residential 100,687.46 10.07 68 0.28 1.5 553.78 0.45 0.249 10.98% 12.23%Road 58,406.54 5.84 98 0.82 0 1,197.33 0.62 0.742 23.74% 36.42%Water 0.00 0.00 99 0.99 0 0.00 0 0.000 0.00% 0.00%Total 489,243.85 48.92 - - - 5,043.93 - 2.038 100.00% 100.00%
Weighted CN= 77.102157Percent Impervious= 42.70% Direct Lake Rainfall= 0 % Diff.= -0.60%
25mm Chicago Storm Runoff Vol= 5074 m3 Overland Runoff= 5074

Precipitation Event-based Model - Fecal Coliform - Lake Banook WatershedLake Banook Watershed Land Use Area (m2) Area (ha) CN RC Dstor (mm) Runoff Volume (m3) FC EMC
(CFU/100 mL)FC Loading
(CFU)Land Use
PercentageFC Load
PercentageCommercial 164,510.00 16.45 92 0.89 1.5 3,413.58 4500 1.54E+11 7.36% 19.58%Forest/Park 217,959.22 21.80 65 0.14 1.5 435.92 500 2.18E+09 9.75% 0.28%Grass 15,298.06 1.53 61 0.24 1.5 68.84 10365 7.14E+09 0.68% 0.91%High Density Residential 8,526.35 0.85 85 0.39 1.5 70.34 7750 5.45E+09 0.38% 0.69%Medium-Density Residential 467,344.85 46.73 72 0.35 1.5 3,388.25 7750 2.63E+11 20.91% 33.47%Low-Density Residential 596,821.72 59.68 68 0.28 1.5 3,282.52 7750 2.54E+11 26.71% 32.42%Road 345,733.00 34.57 98 0.82 0 7,087.53 1400 9.92E+10 15.47% 12.65%Water 418,644.79 41.86 99 0.99 0 10,361.46 0 0.00E+00 18.73% 0.00%Total 2,234,838.00 223.48 - - - 28,108.44 - 7.85E+11 100.00% 100.00%
Weighted CN= 80.78Percent Impervious= 52.32% Direct Lake Rainfall= 10466.12 m3 % Diff.= -2.55%
25mm Chicago Storm Runoff Vol= 28824 m3 Overland Runoff= 18357.88 m3
Precipitation Event-based Model - Fecal Coliform - Lake Micmac WatershedLake Micmac Watershed Land Use Area (m2) Area (ha) CN RC Dstor (mm) Runoff Volume (m3) FC EMC
(CFU/100 mL)FC Loading
(CFU)Land Use
PercentageFC Load
PercentageCommercial 2,406,303.63 240.63 92 0.89 1.5 49,930.80 4500 2.25E+12 35.63% 75.08%Forest/Park 888,304.00 88.83 65 0.14 1.5 1,776.61 500 8.88E+09 13.15% 0.30%Grass 51,314.55 5.13 61 0.24 1.5 230.92 10365 2.39E+10 0.76% 0.80%High Density Residential 25,300.22 2.53 85 0.39 1.5 208.73 7750 1.62E+10 0.37% 0.54%Medium-Density Residential 245,579.69 24.56 72 0.35 1.5 1,780.45 7750 1.38E+11 3.64% 4.61%Low-Density Residential 656,957.27 65.70 68 0.28 1.5 3,613.26 7750 2.80E+11 9.73% 9.36%Partial cut forest 483,028.42 48.30 66 0.28 1.5 2,656.66 500 1.33E+10 7.15% 0.44%Road 905,675.17 90.57 98 0.82 0 18,566.34 1400 2.60E+11 13.41% 8.69%Water 1,046,036.06 104.60 99 0.99 0 25,889.39 - - 15.49% -Wetland 45,096.47 4.51 99 0.99 0 1,116.14 500 5.58E+09 0.67% 0.19%
6,753,595.50 675.36 - - - 105,769.30 2.99E+12 100.00% 100.00%Weighted CN= 85.11
Percent Impervious= 62.46% Direct Lake Rainfall= 26150.90 m3 % Diff.= 1.27%25mm Chicago Storm Runoff Vol= 104423 m3 Overland Runoff= 78272.10 m3
Precipitation Event-based Model - Fecal Coliform - Outfall 8 Sub-watershedOutfall 8 Sub-watershed Land Use Area (m2) Area (ha) CN RC Dstor (mm) Runoff Volume (m3) FC EMC
(CFU/100 mL)FC Loading
(CFU)Land Use
PercentageFC Load
PercentageCommercial 90,703.06 9.07 92 0.89 1.5 1,882.09 4500 8.47E+10 18.54% 34.61%Forest/Park 61,954.60 6.20 65 0.14 1.5 123.91 500 6.20E+08 12.66% 0.25%Medium-Density Residential 177,492.19 17.75 72 0.35 1.5 1,286.82 7750 9.97E+10 36.28% 40.75%Low-Density Residential 100,687.46 10.07 68 0.28 1.5 553.78 7750 4.29E+10 20.58% 17.54%Road 58,406.54 5.84 98 0.82 0 1,197.33 1400 1.68E+10 11.94% 6.85%Water 83,242.70 0.00 99 0.99 0 2,060.26 0 0.00E+00 0.00% 0.00%
572,486.54 48.92 - - - 7,104.19 - 2.45E+11 100.00% 100.00%Weighted CN= 80.29
Percent Impervious= 51.03% Direct Lake Rainfall= 2081.07 % Diff.= 28.58%25mm Chicago Storm Runoff Vol= 5074 m3 Overland Runoff= 2992.93

D.2 – Annual Loading Model
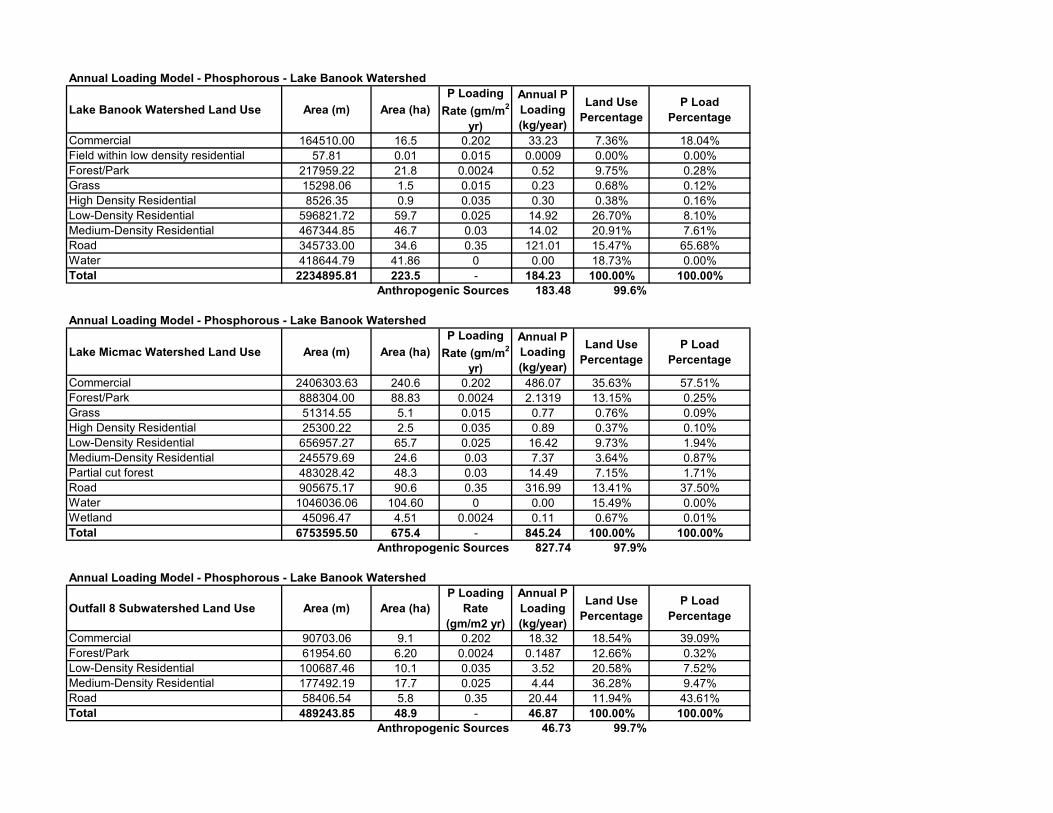
Annual Loading Model - Phosphorous - Lake Banook Watershed
Lake Banook Watershed Land Use Area (m) Area (ha)P Loading
Rate (gm/m2
yr)
Annual P Loading (kg/year)
Land Use Percentage
P Load Percentage
Commercial 164510.00 16.5 0.202 33.23 7.36% 18.04%Field within low density residential 57.81 0.01 0.015 0.0009 0.00% 0.00%Forest/Park 217959.22 21.8 0.0024 0.52 9.75% 0.28%Grass 15298.06 1.5 0.015 0.23 0.68% 0.12%High Density Residential 8526.35 0.9 0.035 0.30 0.38% 0.16%Low-Density Residential 596821.72 59.7 0.025 14.92 26.70% 8.10%Medium-Density Residential 467344.85 46.7 0.03 14.02 20.91% 7.61%Road 345733.00 34.6 0.35 121.01 15.47% 65.68%Water 418644.79 41.86 0 0.00 18.73% 0.00%Total 2234895.81 223.5 - 184.23 100.00% 100.00%
Anthropogenic Sources 183.48 99.6%
Annual Loading Model - Phosphorous - Lake Banook Watershed
Lake Micmac Watershed Land Use Area (m) Area (ha)P Loading
Rate (gm/m2
yr)
Annual P Loading (kg/year)
Land Use Percentage
P Load Percentage
Commercial 2406303.63 240.6 0.202 486.07 35.63% 57.51%Forest/Park 888304.00 88.83 0.0024 2.1319 13.15% 0.25%Grass 51314.55 5.1 0.015 0.77 0.76% 0.09%High Density Residential 25300.22 2.5 0.035 0.89 0.37% 0.10%Low-Density Residential 656957.27 65.7 0.025 16.42 9.73% 1.94%Medium-Density Residential 245579.69 24.6 0.03 7.37 3.64% 0.87%Partial cut forest 483028.42 48.3 0.03 14.49 7.15% 1.71%Road 905675.17 90.6 0.35 316.99 13.41% 37.50%Water 1046036.06 104.60 0 0.00 15.49% 0.00%Wetland 45096.47 4.51 0.0024 0.11 0.67% 0.01%Total 6753595.50 675.4 - 845.24 100.00% 100.00%
Anthropogenic Sources 827.74 97.9%
Annual Loading Model - Phosphorous - Lake Banook Watershed
Outfall 8 Subwatershed Land Use Area (m) Area (ha)P Loading
Rate (gm/m2 yr)
Annual P Loading (kg/year)
Land Use Percentage
P Load Percentage
Commercial 90703.06 9.1 0.202 18.32 18.54% 39.09%Forest/Park 61954.60 6.20 0.0024 0.1487 12.66% 0.32%Low-Density Residential 100687.46 10.1 0.035 3.52 20.58% 7.52%Medium-Density Residential 177492.19 17.7 0.025 4.44 36.28% 9.47%Road 58406.54 5.8 0.35 20.44 11.94% 43.61%Total 489243.85 48.9 - 46.87 100.00% 100.00%
Anthropogenic Sources 46.73 99.7%
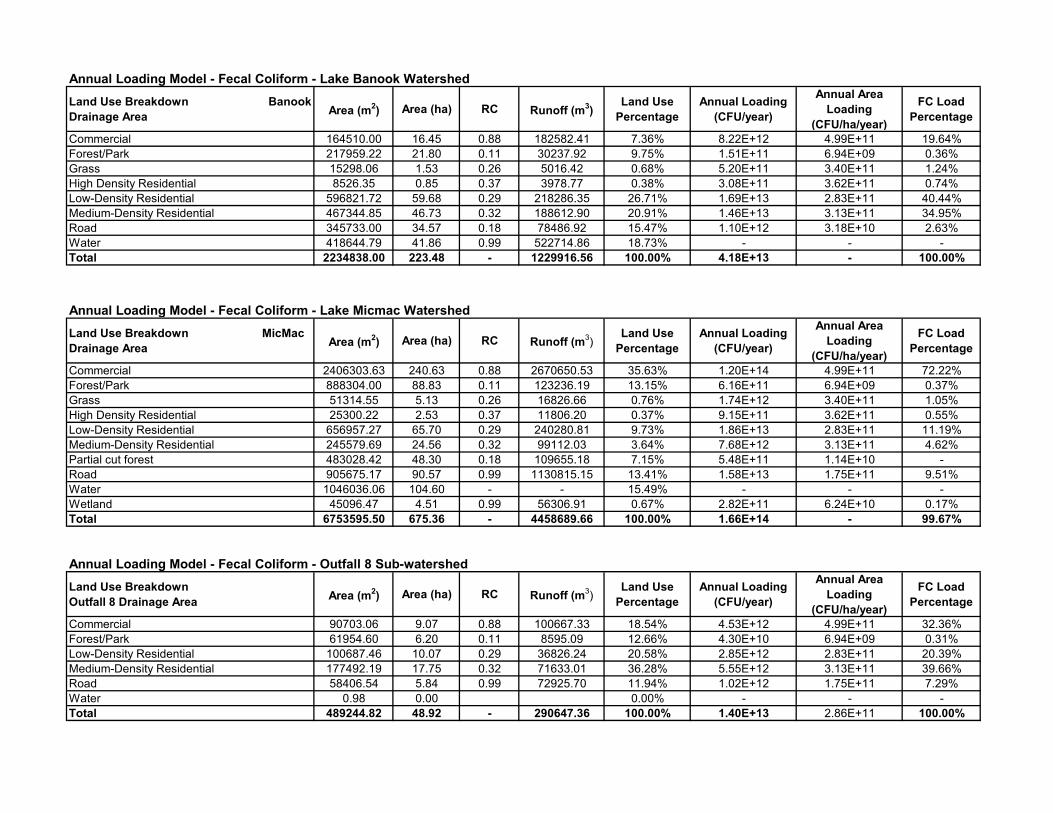
Annual Loading Model - Fecal Coliform - Lake Banook WatershedLand Use Breakdown Banook Drainage Area Area (m2) Area (ha) RC Runoff (m3)
Land Use Percentage
Annual Loading (CFU/year)
Annual Area Loading
(CFU/ha/year)
FC Load Percentage
Commercial 164510.00 16.45 0.88 182582.41 7.36% 8.22E+12 4.99E+11 19.64%Forest/Park 217959.22 21.80 0.11 30237.92 9.75% 1.51E+11 6.94E+09 0.36%Grass 15298.06 1.53 0.26 5016.42 0.68% 5.20E+11 3.40E+11 1.24%High Density Residential 8526.35 0.85 0.37 3978.77 0.38% 3.08E+11 3.62E+11 0.74%Low-Density Residential 596821.72 59.68 0.29 218286.35 26.71% 1.69E+13 2.83E+11 40.44%Medium-Density Residential 467344.85 46.73 0.32 188612.90 20.91% 1.46E+13 3.13E+11 34.95%Road 345733.00 34.57 0.18 78486.92 15.47% 1.10E+12 3.18E+10 2.63%Water 418644.79 41.86 0.99 522714.86 18.73% - - -Total 2234838.00 223.48 - 1229916.56 100.00% 4.18E+13 - 100.00%
Annual Loading Model - Fecal Coliform - Lake Micmac WatershedLand Use Breakdown MicMac Drainage Area Area (m2) Area (ha) RC Runoff (m3)
Land Use Percentage
Annual Loading (CFU/year)
Annual Area Loading
(CFU/ha/year)
FC Load Percentage
Commercial 2406303.63 240.63 0.88 2670650.53 35.63% 1.20E+14 4.99E+11 72.22%Forest/Park 888304.00 88.83 0.11 123236.19 13.15% 6.16E+11 6.94E+09 0.37%Grass 51314.55 5.13 0.26 16826.66 0.76% 1.74E+12 3.40E+11 1.05%High Density Residential 25300.22 2.53 0.37 11806.20 0.37% 9.15E+11 3.62E+11 0.55%Low-Density Residential 656957.27 65.70 0.29 240280.81 9.73% 1.86E+13 2.83E+11 11.19%Medium-Density Residential 245579.69 24.56 0.32 99112.03 3.64% 7.68E+12 3.13E+11 4.62%Partial cut forest 483028.42 48.30 0.18 109655.18 7.15% 5.48E+11 1.14E+10 -Road 905675.17 90.57 0.99 1130815.15 13.41% 1.58E+13 1.75E+11 9.51%Water 1046036.06 104.60 - - 15.49% - - -Wetland 45096.47 4.51 0.99 56306.91 0.67% 2.82E+11 6.24E+10 0.17%Total 6753595.50 675.36 - 4458689.66 100.00% 1.66E+14 - 99.67%
Annual Loading Model - Fecal Coliform - Outfall 8 Sub-watershedLand Use Breakdown Outfall 8 Drainage Area Area (m2) Area (ha) RC Runoff (m3)
Land Use Percentage
Annual Loading (CFU/year)
Annual Area Loading
(CFU/ha/year)
FC Load Percentage
Commercial 90703.06 9.07 0.88 100667.33 18.54% 4.53E+12 4.99E+11 32.36%Forest/Park 61954.60 6.20 0.11 8595.09 12.66% 4.30E+10 6.94E+09 0.31%Low-Density Residential 100687.46 10.07 0.29 36826.24 20.58% 2.85E+12 2.83E+11 20.39%Medium-Density Residential 177492.19 17.75 0.32 71633.01 36.28% 5.55E+12 3.13E+11 39.66%Road 58406.54 5.84 0.99 72925.70 11.94% 1.02E+12 1.75E+11 7.29%Water 0.98 0.00 0.00% - - -Total 489244.82 48.92 - 290647.36 100.00% 1.40E+13 2.86E+11 100.00%

D.3 – Lake System P Model
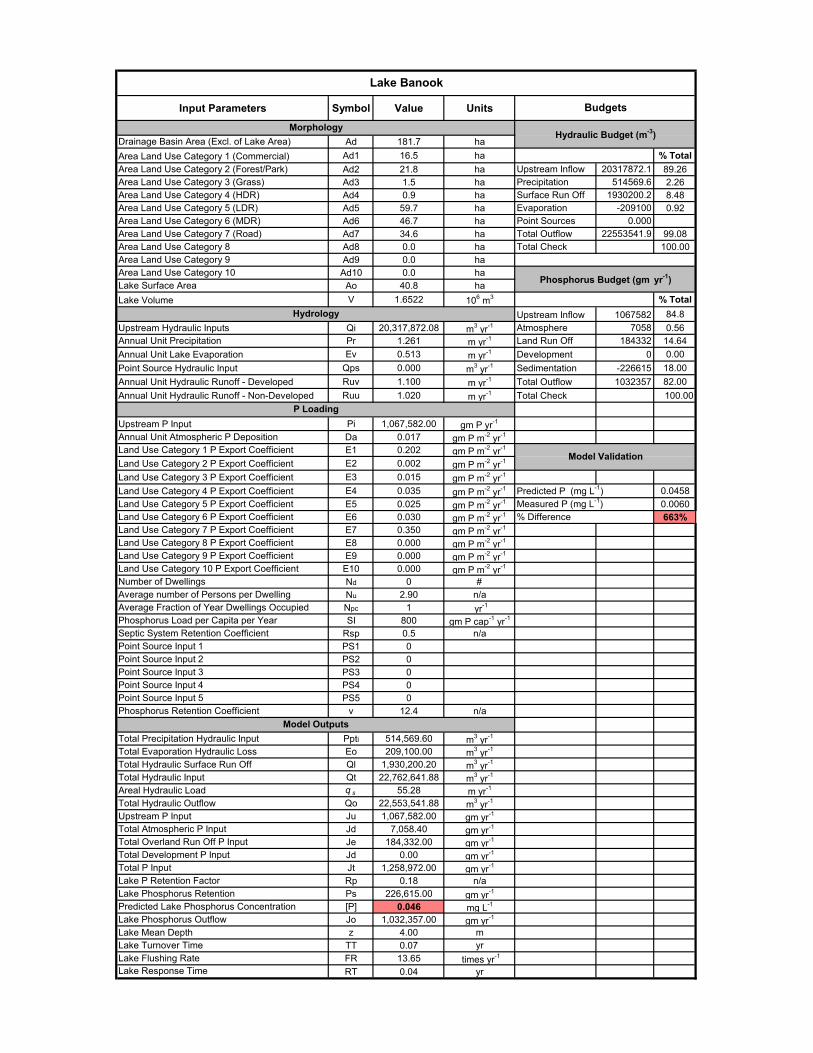
Input Parameters Symbol Value Units
Drainage Basin Area (Excl. of Lake Area) Ad 181.7 haArea Land Use Category 1 (Commercial) Ad1 16.5 ha % TotalArea Land Use Category 2 (Forest/Park) Ad2 21.8 ha Upstream Inflow 20317872.1 89.26Area Land Use Category 3 (Grass) Ad3 1.5 ha Precipitation 514569.6 2.26Area Land Use Category 4 (HDR) Ad4 0.9 ha Surface Run Off 1930200.2 8.48Area Land Use Category 5 (LDR) Ad5 59.7 ha Evaporation -209100 0.92Area Land Use Category 6 (MDR) Ad6 46.7 ha Point Sources 0.000Area Land Use Category 7 (Road) Ad7 34.6 ha Total Outflow 22553541.9 99.08Area Land Use Category 8 Ad8 0.0 ha Total Check 100.00Area Land Use Category 9 Ad9 0.0 haArea Land Use Category 10 Ad10 0.0 haLake Surface Area Ao 40.8 haLake Volume V 1.6522 106 m3 % Total
Upstream Inflow 1067582 84.8Upstream Hydraulic Inputs Qi 20,317,872.08 m3 yr-1 Atmosphere 7058 0.56Annual Unit Precipitation Pr 1.261 m yr-1 Land Run Off 184332 14.64Annual Unit Lake Evaporation Ev 0.513 m yr-1 Development 0 0.00Point Source Hydraulic Input Qps 0.000 m3 yr-1 Sedimentation -226615 18.00Annual Unit Hydraulic Runoff - Developed Ruv 1.100 m yr-1 Total Outflow 1032357 82.00Annual Unit Hydraulic Runoff - Non-Developed Ruu 1.020 m yr-1 Total Check 100.00
Upstream P Input Pi 1,067,582.00 gm P yr-1
Annual Unit Atmospheric P Deposition Da 0.017 gm P m-2 yr-1
Land Use Category 1 P Export Coefficient E1 0.202 gm P m-2 yr-1
Land Use Category 2 P Export Coefficient E2 0.002 gm P m-2 yr-1
Land Use Category 3 P Export Coefficient E3 0.015 gm P m-2 yr-1
Land Use Category 4 P Export Coefficient E4 0.035 gm P m-2 yr-1 0.0458Land Use Category 5 P Export Coefficient E5 0.025 gm P m-2 yr-1 0.0060Land Use Category 6 P Export Coefficient E6 0.030 gm P m-2 yr-1 663%Land Use Category 7 P Export Coefficient E7 0.350 gm P m-2 yr-1
Land Use Category 8 P Export Coefficient E8 0.000 gm P m-2 yr-1
Land Use Category 9 P Export Coefficient E9 0.000 gm P m-2 yr-1
Land Use Category 10 P Export Coefficient E10 0.000 gm P m-2 yr-1
Number of Dwellings Nd 0 #Average number of Persons per Dwelling Nu 2.90 n/aAverage Fraction of Year Dwellings Occupied Npc 1 yr-1
Phosphorus Load per Capita per Year SI 800 gm P cap-1 yr-1
Septic System Retention Coefficient Rsp 0.5 n/aPoint Source Input 1 PS1 0Point Source Input 2 PS2 0Point Source Input 3 PS3 0Point Source Input 4 PS4 0Point Source Input 5 PS5 0Phosphorus Retention Coefficient v 12.4 n/a
Total Precipitation Hydraulic Input Ppti 514,569.60 m3 yr-1
Total Evaporation Hydraulic Loss Eo 209,100.00 m3 yr-1
Total Hydraulic Surface Run Off Ql 1,930,200.20 m3 yr-1
Total Hydraulic Input Qt 22,762,641.88 m3 yr-1
Areal Hydraulic Load q s 55.28 m yr-1
Total Hydraulic Outflow Qo 22,553,541.88 m3 yr-1
Upstream P Input Ju 1,067,582.00 gm yr-1
Total Atmospheric P Input Jd 7,058.40 gm yr-1
Total Overland Run Off P Input Je 184,332.00 gm yr-1
Total Development P Input Jd 0.00 gm yr-1
Total P Input Jt 1,258,972.00 gm yr-1
Lake P Retention Factor Rp 0.18 n/aLake Phosphorus Retention Ps 226,615.00 gm yr-1
Predicted Lake Phosphorus Concentration [P] 0.046 mg L-1
Lake Phosphorus Outflow Jo 1,032,357.00 gm yr-1
Lake Mean Depth z 4.00 mLake Turnover Time TT 0.07 yrLake Flushing Rate FR 13.65 times yr-1
Lake Response Time RT 0.04 yr
Lake Banook
Budgets
MorphologyHydraulic Budget (m-3)
Measured P (mg L-1)% Difference
Model Outputs
Phosphorus Budget (gm yr-1)
Hydrology
P Loading
Model Validation
Predicted P (mg L-1)

Input Parameters Symbol Value Units
Drainage Basin Area (Excl. of Lake Area) Ad 570.8 haArea Land Use Category 1 (Commercial) Ad1 240.6 ha % TotalArea Land Use Category 2 (Forest/Park) Ad2 88.8 ha Upstream Inflow 14593923 70Area Land Use Category 3 (Grassed) Ad3 5.1 ha Precipitation 1305135 6.26Area Land Use Category 4 (HDR) Ad4 2.5 ha Surface Run Off 4949251.58 23.74Area Land Use Category 5 (LDR) Ad5 65.7 ha Evaporation -530437.5 2.54Area Land Use Category 6 (MDR) Ad6 24.6 ha Point Sources 0.000Area Land Use Category 7 (Partially-Cleared) Ad7 48.3 ha Total Outflow 20317872.1 97.46Area Land Use Category 8 (Road) Ad8 90.6 ha Total Check 100.00Area Land Use Category 9 (Wetland) Ad9 4.5 haArea Land Use Category 10 Ad10 0.0 haLake Surface Area Ao 103.5 haLake Volume V 3.4890 106 m3 % Total
Upstream Inflow 1032357 54.46Upstream Hydraulic Inputs Qi 14593923 m3 yr-1 Atmosphere 17906 0.94Annual Unit Precipitation Pr 1.261 m yr-1 Land Run Off 845237 44.59Annual Unit Lake Evaporation Ev 0.513 m yr-1 Development 0 0.00Point Source Hydraulic Input Qps 0.000 m3 yr-1 Sedimentation -739245 39.00Annual Unit Hydraulic Runoff - Developed Ruv 1.100 m yr-1 Total Outflow 1156255 61.00Annual Unit Hydraulic Runoff - Non-Developed Ruu 1.020 m yr-1 Total Check 99.99
Upstream P Input Pi 1,032,357.00 gm P yr-1
Annual Unit Atmospheric P Deposition Da 0.0173 gm P m-2 yr-1
Land Use Category 1 P Export Coefficient E1 0.2020 gm P m-2 yr-1
Land Use Category 2 P Export Coefficient E2 0.0024 gm P m-2 yr-1
Land Use Category 3 P Export Coefficient E3 0.0150 gm P m-2 yr-1
Land Use Category 4 P Export Coefficient E4 0.0350 gm P m-2 yr-1 0.0569Land Use Category 5 P Export Coefficient E5 0.0250 gm P m-2 yr-1 0.0060Land Use Category 6 P Export Coefficient E6 0.0300 gm P m-2 yr-1 848%Land Use Category 7 P Export Coefficient E7 0.0300 gm P m-2 yr-1
Land Use Category 8 P Export Coefficient E8 0.3500 gm P m-2 yr-1
Land Use Category 9 P Export Coefficient E9 0.0024 gm P m-2 yr-1
Land Use Category 10 P Export Coefficient E10 0.0000 gm P m-2 yr-1
Number of Dwellings Nd 0 #Average number of Persons per Dwelling Nu 2.90 n/aAverage Fraction of Year Dwellings Occupied Npc 1 yr-1
Phosphorus Load per Capita per Year SI 800 gm P cap-1 yr-1
Septic System Retention Coefficient Rsp 0.5 n/aPoint Source Input 1 PS1 0Point Source Input 2 PS2 0Point Source Input 3 PS3 0Point Source Input 4 PS4 0Point Source Input 5 PS5 0Phosphorus Retention Coefficient v 12.4 n/a
Total Precipitation Hydraulic Input Ppti 1,305,135.00 m3 yr-1
Total Evaporation Hydraulic Loss Eo 530,437.50 m3 yr-1
Total Hydraulic Surface Run Off Ql 4,949,251.58 m3 yr-1
Total Hydraulic Input Qt 20,848,309.58 m3 yr-1
Areal Hydraulic Load q s 19.63 m yr-1
Total Hydraulic Outflow Qo 20,317,872.08 m3 yr-1
Upstream P Input Ju 1,032,357.00 gm yr-1
Total Atmospheric P Input Jd 17,905.50 gm yr-1
Total Overland Run Off P Input Je 845,237.00 gm yr-1
Total Development P Input Jd 0.00 gm yr-1
Total P Input Jt 1,895,500.00 gm yr-1
Lake P Retention Factor Rp 0.39 n/aLake Phosphorus Retention Ps 739,245.00 gm yr-1
Predicted Lake Phosphorus Concentration [P] 0.057 mg L-1
Lake Phosphorus Outflow Jo 1,156,255.00 gm yr-1
Lake Mean Depth z 3.40 mLake Turnover Time TT 0.17 yrLake Flushing Rate FR 5.82 times yr-1
Lake Response Time RT 0.08 yr
Lake Micmac
Budgets
MorphologyHydraulic Budget (m-3)
Measured P (mg L-1)% Difference
Model Outputs
Phosphorus Budget (gm yr-1)
Hydrology
P Loading
Model Validation
Predicted P (mg L-1)
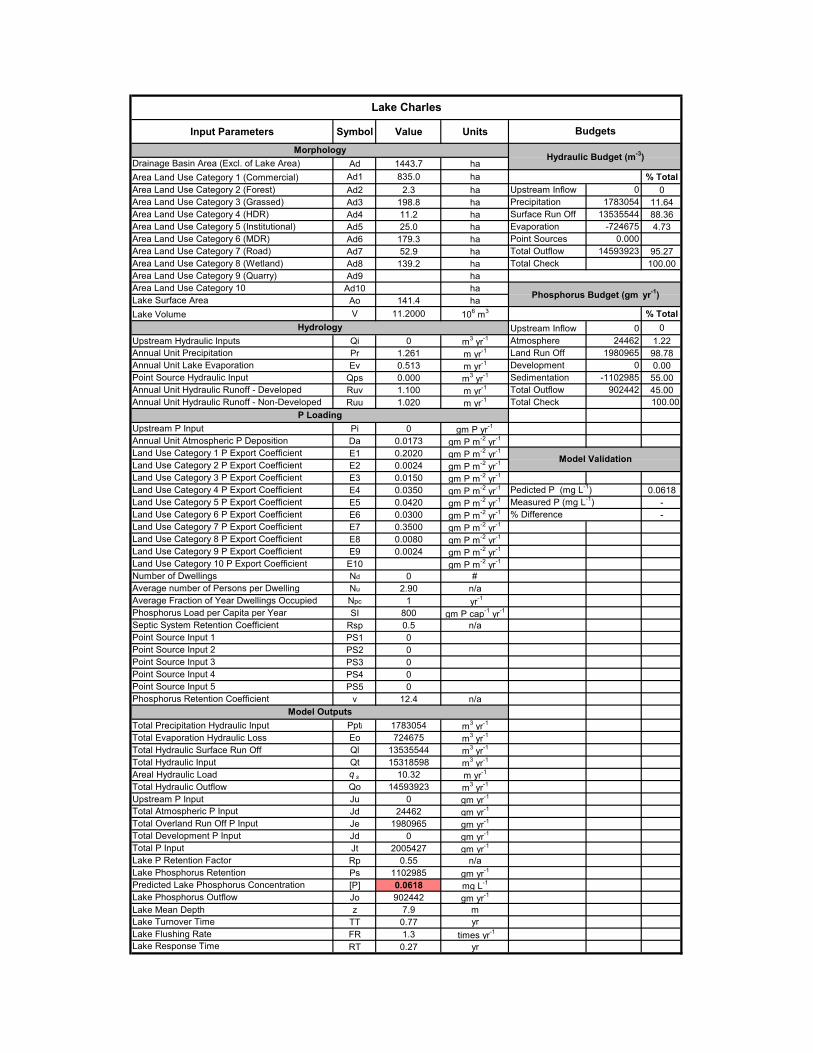
Input Parameters Symbol Value Units
Drainage Basin Area (Excl. of Lake Area) Ad 1443.7 haArea Land Use Category 1 (Commercial) Ad1 835.0 ha % TotalArea Land Use Category 2 (Forest) Ad2 2.3 ha Upstream Inflow 0 0Area Land Use Category 3 (Grassed) Ad3 198.8 ha Precipitation 1783054 11.64Area Land Use Category 4 (HDR) Ad4 11.2 ha Surface Run Off 13535544 88.36Area Land Use Category 5 (Institutional) Ad5 25.0 ha Evaporation -724675 4.73Area Land Use Category 6 (MDR) Ad6 179.3 ha Point Sources 0.000Area Land Use Category 7 (Road) Ad7 52.9 ha Total Outflow 14593923 95.27Area Land Use Category 8 (Wetland) Ad8 139.2 ha Total Check 100.00Area Land Use Category 9 (Quarry) Ad9 haArea Land Use Category 10 Ad10 haLake Surface Area Ao 141.4 haLake Volume V 11.2000 106 m3 % Total
Upstream Inflow 0 0Upstream Hydraulic Inputs Qi 0 m3 yr-1 Atmosphere 24462 1.22Annual Unit Precipitation Pr 1.261 m yr-1 Land Run Off 1980965 98.78Annual Unit Lake Evaporation Ev 0.513 m yr-1 Development 0 0.00Point Source Hydraulic Input Qps 0.000 m3 yr-1 Sedimentation -1102985 55.00Annual Unit Hydraulic Runoff - Developed Ruv 1.100 m yr-1 Total Outflow 902442 45.00Annual Unit Hydraulic Runoff - Non-Developed Ruu 1.020 m yr-1 Total Check 100.00
Upstream P Input Pi 0 gm P yr-1
Annual Unit Atmospheric P Deposition Da 0.0173 gm P m-2 yr-1
Land Use Category 1 P Export Coefficient E1 0.2020 gm P m-2 yr-1
Land Use Category 2 P Export Coefficient E2 0.0024 gm P m-2 yr-1
Land Use Category 3 P Export Coefficient E3 0.0150 gm P m-2 yr-1
Land Use Category 4 P Export Coefficient E4 0.0350 gm P m-2 yr-1 0.0618Land Use Category 5 P Export Coefficient E5 0.0420 gm P m-2 yr-1 -Land Use Category 6 P Export Coefficient E6 0.0300 gm P m-2 yr-1 -Land Use Category 7 P Export Coefficient E7 0.3500 gm P m-2 yr-1
Land Use Category 8 P Export Coefficient E8 0.0080 gm P m-2 yr-1
Land Use Category 9 P Export Coefficient E9 0.0024 gm P m-2 yr-1
Land Use Category 10 P Export Coefficient E10 gm P m-2 yr-1
Number of Dwellings Nd 0 #Average number of Persons per Dwelling Nu 2.90 n/aAverage Fraction of Year Dwellings Occupied Npc 1 yr-1
Phosphorus Load per Capita per Year SI 800 gm P cap-1 yr-1
Septic System Retention Coefficient Rsp 0.5 n/aPoint Source Input 1 PS1 0Point Source Input 2 PS2 0Point Source Input 3 PS3 0Point Source Input 4 PS4 0Point Source Input 5 PS5 0Phosphorus Retention Coefficient v 12.4 n/a
Total Precipitation Hydraulic Input Ppti 1783054 m3 yr-1
Total Evaporation Hydraulic Loss Eo 724675 m3 yr-1
Total Hydraulic Surface Run Off Ql 13535544 m3 yr-1
Total Hydraulic Input Qt 15318598 m3 yr-1
Areal Hydraulic Load q s 10.32 m yr-1
Total Hydraulic Outflow Qo 14593923 m3 yr-1
Upstream P Input Ju 0 gm yr-1
Total Atmospheric P Input Jd 24462 gm yr-1
Total Overland Run Off P Input Je 1980965 gm yr-1
Total Development P Input Jd 0 gm yr-1
Total P Input Jt 2005427 gm yr-1
Lake P Retention Factor Rp 0.55 n/aLake Phosphorus Retention Ps 1102985 gm yr-1
Predicted Lake Phosphorus Concentration [P] 0.0618 mg L-1
Lake Phosphorus Outflow Jo 902442 gm yr-1
Lake Mean Depth z 7.9 mLake Turnover Time TT 0.77 yrLake Flushing Rate FR 1.3 times yr-1
Lake Response Time RT 0.27 yr
Lake Charles
Budgets
MorphologyHydraulic Budget (m-3)
% DifferenceMeasured P (mg L-1)Pedicted P (mg L-1)
Hydrology
P Loading
Model Validation
Model Outputs
Phosphorus Budget (gm yr-1)

Input Parameters Symbol Value Units
Drainage Basin Area (Excl. of Lake Area) Ad 191.1 haArea Land Use Category 1 (Commercial) Ad1 21.5 ha % TotalArea Land Use Category 2 (Forest) Ad2 8.8 ha Upstream Inflow 0 0Area Land Use Category 3 (HDF) Ad3 1.0 ha Precipitation 98610.2 4.6Area Land Use Category 4 (LDR) Ad4 98.8 ha Surface Run Off 2043979.58 95.4Area Land Use Category 5 (MDR) Ad5 19.2 ha Evaporation -40077.5 1.87Area Land Use Category 6 (Road) Ad6 41.7 ha Point Sources 0.000Area Land Use Category 7 Ad7 ha Total Outflow 2102512.28 98.13Area Land Use Category 8 Ad8 ha Total Check 100.00Area Land Use Category 9 Ad9 haArea Land Use Category 10 Ad10 haLake Surface Area Ao 7.8 haLake Volume V 0.0300 106 m3 % Total
Upstream Inflow 0 0Upstream Hydraulic Inputs Qi 0 m3 yr-1 Atmosphere 1353 0.61Annual Unit Precipitation Pr 1.261 m yr-1 Land Run Off 220496 99.39Annual Unit Lake Evaporation Ev 0.513 m yr-1 Development 0 0.00Point Source Hydraulic Input Qps 0.000 m3 yr-1 Sedimentation -70992 32.00Annual Unit Hydraulic Runoff - Developed Ruv 1.100 m yr-1 Total Outflow 150857 68.00Annual Unit Hydraulic Runoff - Non-Developed Ruu 1.020 m yr-1 Total Check 100.00
Upstream P Input Pi 0 gm P yr-1
Annual Unit Atmospheric P Deposition Da 0.0173 gm P m-2 yr-1
Land Use Category 1 P Export Coefficient E1 0.2020 gm P m-2 yr-1
Land Use Category 2 P Export Coefficient E2 0.0024 gm P m-2 yr-1
Land Use Category 3 P Export Coefficient E3 0.0350 gm P m-2 yr-1
Land Use Category 4 P Export Coefficient E4 0.0250 gm P m-2 yr-1 0.0718Land Use Category 5 P Export Coefficient E5 0.0300 gm P m-2 yr-1 -Land Use Category 6 P Export Coefficient E6 0.3500 gm P m-2 yr-1 -Land Use Category 7 P Export Coefficient E7 gm P m-2 yr-1
Land Use Category 8 P Export Coefficient E8 gm P m-2 yr-1
Land Use Category 9 P Export Coefficient E9 gm P m-2 yr-1
Land Use Category 10 P Export Coefficient E10 gm P m-2 yr-1
Number of Dwellings Nd 0 #Average number of Persons per Dwelling Nu 2.90 n/aAverage Fraction of Year Dwellings Occupied Npc 1 yr-1
Phosphorus Load per Capita per Year SI 800 gm P cap-1 yr-1
Septic System Retention Coefficient Rsp 0.5 n/aPoint Source Input 1 PS1 0Point Source Input 2 PS2 0Point Source Input 3 PS3 0Point Source Input 4 PS4 0Point Source Input 5 PS5 0Phosphorus Retention Coefficient v 12.4 n/a
Total Precipitation Hydraulic Input Ppti 98610.2 m3 yr-1
Total Evaporation Hydraulic Loss Eo 40077.5 m3 yr-1
Total Hydraulic Surface Run Off Ql 2043979.581 m3 yr-1
Total Hydraulic Input Qt 2142590 m3 yr-1
Areal Hydraulic Load q s 26.89 m yr-1
Total Hydraulic Outflow Qo 2102512.281 m3 yr-1
Upstream P Input Ju 0 gm yr-1
Total Atmospheric P Input Jd 1353 gm yr-1
Total Overland Run Off P Input Je 220496 gm yr-1
Total Development P Input Jd 0 gm yr-1
Total P Input Jt 221849 gm yr-1
Lake P Retention Factor Rp 0.32 n/aLake Phosphorus Retention Ps 70992 gm yr-1
Predicted Lake Phosphorus Concentration [P] 0.0718 mg L-1
Lake Phosphorus Outflow Jo 150857 gm yr-1
Lake Mean Depth z 0.4 mLake Turnover Time TT 0.01 yrLake Flushing Rate FR 70.08 times yr-1
Lake Response Time RT 0.01 yr
Measured P (mg L-1)% Difference
Model Outputs
Phosphorus Budget (gm yr-1)
Hydrology
P Loading
Model Validation
Pedicted P (mg L-1)
Red Bridge Pond
Budgets
MorphologyHydraulic Budget (m-3)

Input Parameters Symbol Value Units
Drainage Basin Area (Excl. of Lake Area) Ad 35.1 haArea Land Use Category 1 (Commercial) Ad1 0.0 ha % TotalArea Land Use Category 2 (Forest) Ad2 4.8 ha Upstream Inflow 0 0Area Land Use Category 3 (HDF) Ad3 0.8 ha Precipitation 55484 12.87Area Land Use Category 4 (LDR) Ad4 21.0 ha Surface Run Off 375680.1 87.13Area Land Use Category 5 (MDR) Ad5 0.9 ha Evaporation -22550 5.23Area Land Use Category 6 (Road) Ad6 7.6 ha Point Sources 0.000Area Land Use Category 7 Ad7 ha Total Outflow 408614.1 94.77Area Land Use Category 8 Ad8 ha Total Check 100.00Area Land Use Category 9 Ad9 haArea Land Use Category 10 Ad10 haLake Surface Area Ao 4.4 haLake Volume V 0.2050 106 m3 % Total
Upstream Inflow 0 0Upstream Hydraulic Inputs Qi 0 m3 yr-1 Atmosphere 761 2.29Annual Unit Precipitation Pr 1.261 m yr-1 Land Run Off 32456 97.71Annual Unit Lake Evaporation Ev 0.513 m yr-1 Development 0 0.00Point Source Hydraulic Input Qps 0.000 m3 yr-1 Sedimentation -18934 57.00Annual Unit Hydraulic Runoff - Developed Ruv 1.100 m yr-1 Total Outflow 14283 43.00Annual Unit Hydraulic Runoff - Non-Developed Ruu 1.020 m yr-1 Total Check 100.00
Upstream P Input Pi 0 gm P yr-1
Annual Unit Atmospheric P Deposition Da 0.0173 gm P m-2 yr-1
Land Use Category 1 P Export Coefficient E1 0.2020 gm P m-2 yr-1
Land Use Category 2 P Export Coefficient E2 0.0024 gm P m-2 yr-1
Land Use Category 3 P Export Coefficient E3 0.0350 gm P m-2 yr-1
Land Use Category 4 P Export Coefficient E4 0.0250 gm P m-2 yr-1 0.0350Land Use Category 5 P Export Coefficient E5 0.0300 gm P m-2 yr-1 -Land Use Category 6 P Export Coefficient E6 0.3500 gm P m-2 yr-1 -Land Use Category 7 P Export Coefficient E7 gm P m-2 yr-1
Land Use Category 8 P Export Coefficient E8 gm P m-2 yr-1
Land Use Category 9 P Export Coefficient E9 gm P m-2 yr-1
Land Use Category 10 P Export Coefficient E10 gm P m-2 yr-1
Number of Dwellings Nd 0 #Average number of Persons per Dwelling Nu 2.90 n/aAverage Fraction of Year Dwellings Occupied Npc 1 yr-1
Phosphorus Load per Capita per Year SI 800 gm P cap-1 yr-1
Septic System Retention Coefficient Rsp 0.5 n/aPoint Source Input 1 PS1 0Point Source Input 2 PS2 0Point Source Input 3 PS3 0Point Source Input 4 PS4 0Point Source Input 5 PS5 0Phosphorus Retention Coefficient v 12.4 n/a
Total Precipitation Hydraulic Input Ppti 55484 m3 yr-1
Total Evaporation Hydraulic Loss Eo 22550 m3 yr-1
Total Hydraulic Surface Run Off Ql 375680.1 m3 yr-1
Total Hydraulic Input Qt 431164 m3 yr-1
Areal Hydraulic Load q s 9.29 m yr-1
Total Hydraulic Outflow Qo 408614.1 m3 yr-1
Upstream P Input Ju 0 gm yr-1
Total Atmospheric P Input Jd 761 gm yr-1
Total Overland Run Off P Input Je 32456 gm yr-1
Total Development P Input Jd 0 gm yr-1
Total P Input Jt 33217 gm yr-1
Lake P Retention Factor Rp 0.57 n/aLake Phosphorus Retention Ps 18934 gm yr-1
Predicted Lake Phosphorus Concentration [P] 0.035 mg L-1
Lake Phosphorus Outflow Jo 14283 gm yr-1
Lake Mean Depth z 4.7 mLake Turnover Time TT 0.5 yrLake Flushing Rate FR 1.99 times yr-1
Lake Response Time RT 0.17 yr
Oathill Lake
Budgets
MorphologyHydraulic Budget (m-3)
Measured P (mg L-1)% Difference
Model Outputs
Phosphorus Budget (gm yr-1)
Hydrology
P Loading
Model Validation
Pedicted P (mg L-1)

D.4 – PCSWMM Reports
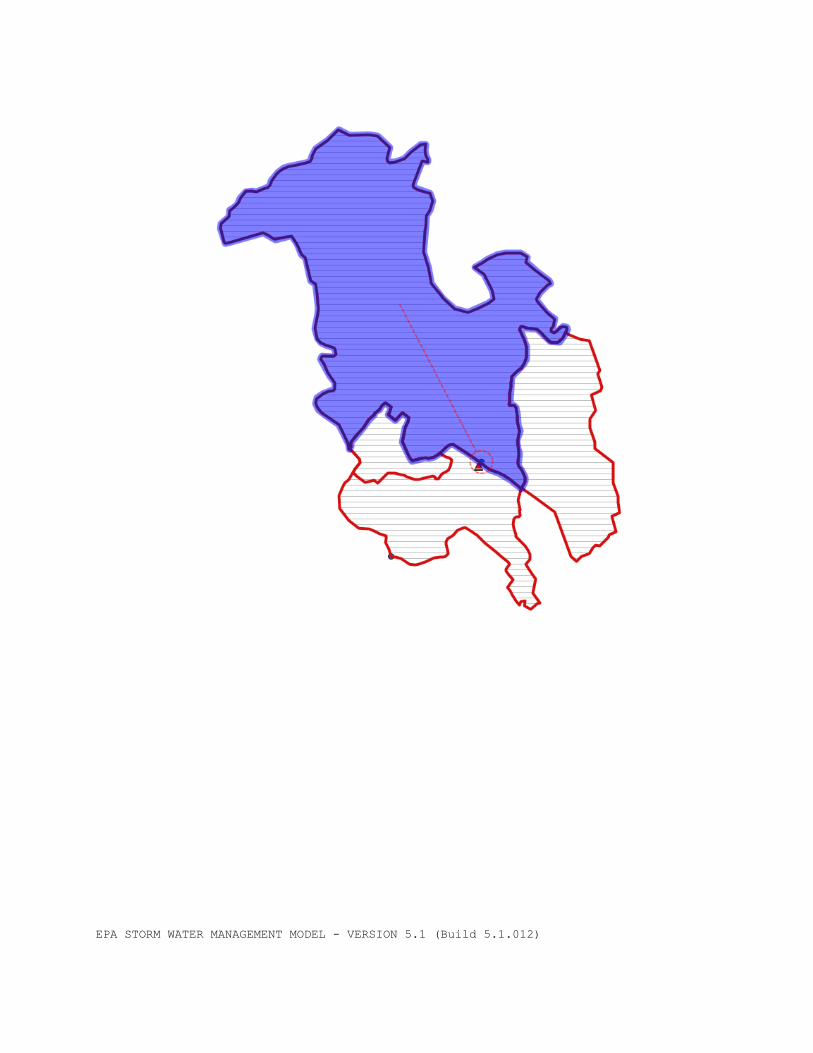
EPA STORM WATER MANAGEMENT MODEL - VERSION 5.1 (Build 5.1.012)
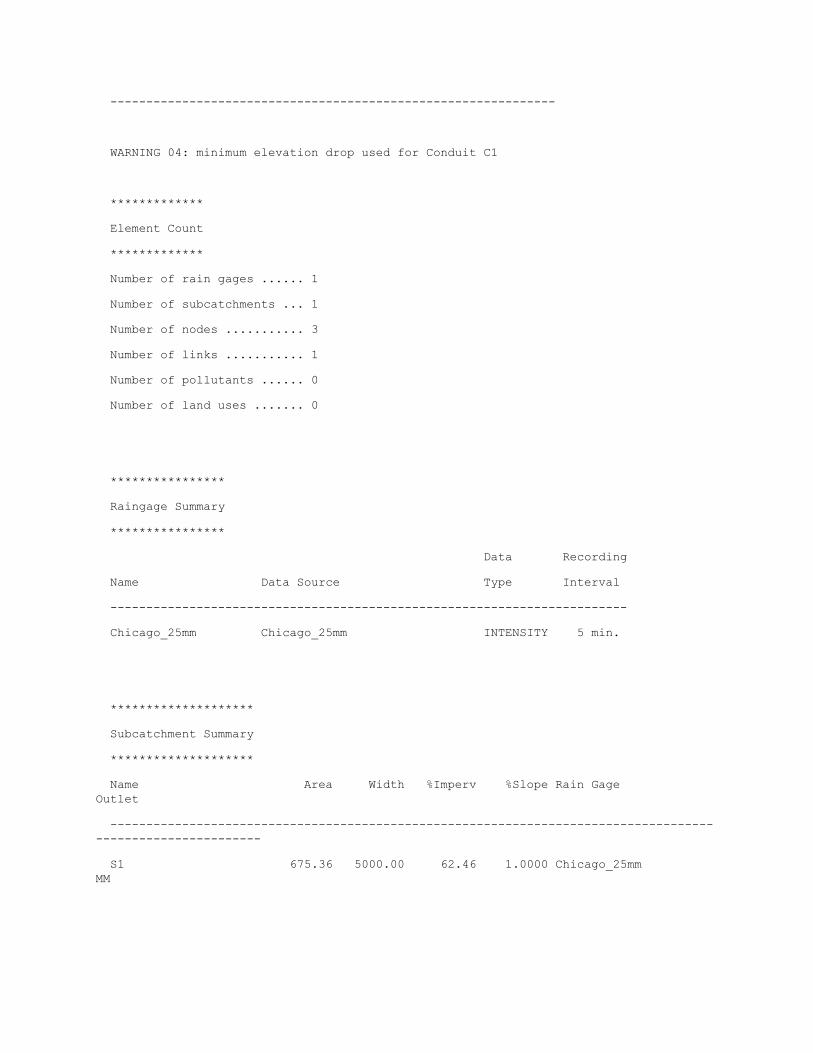
--------------------------------------------------------------
WARNING 04: minimum elevation drop used for Conduit C1
*************
Element Count
*************
Number of rain gages ...... 1
Number of subcatchments ... 1
Number of nodes ........... 3
Number of links ........... 1
Number of pollutants ...... 0
Number of land uses ....... 0
****************
Raingage Summary
****************
Data Recording
Name Data Source Type Interval
------------------------------------------------------------------------
Chicago_25mm Chicago_25mm INTENSITY 5 min.
********************
Subcatchment Summary
********************
Name Area Width %Imperv %Slope Rain Gage Outlet
-----------------------------------------------------------------------------------------------------------
S1 675.36 5000.00 62.46 1.0000 Chicago_25mm MM
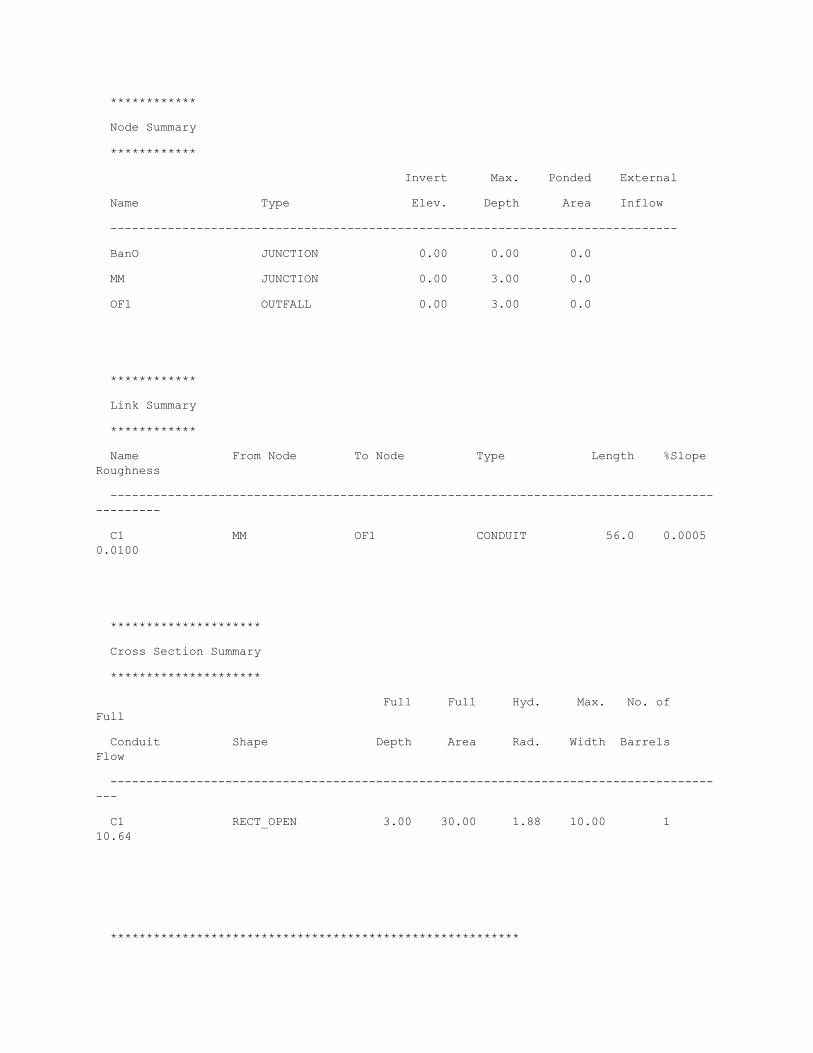
************
Node Summary
************
Invert Max. Ponded External
Name Type Elev. Depth Area Inflow
-------------------------------------------------------------------------------
BanO JUNCTION 0.00 0.00 0.0
MM JUNCTION 0.00 3.00 0.0
OF1 OUTFALL 0.00 3.00 0.0
************
Link Summary
************
Name From Node To Node Type Length %Slope Roughness
---------------------------------------------------------------------------------------------
C1 MM OF1 CONDUIT 56.0 0.0005 0.0100
*********************
Cross Section Summary
*********************
Full Full Hyd. Max. No. of Full
Conduit Shape Depth Area Rad. Width Barrels Flow
---------------------------------------------------------------------------------------
C1 RECT_OPEN 3.00 30.00 1.88 10.00 1 10.64
*********************************************************
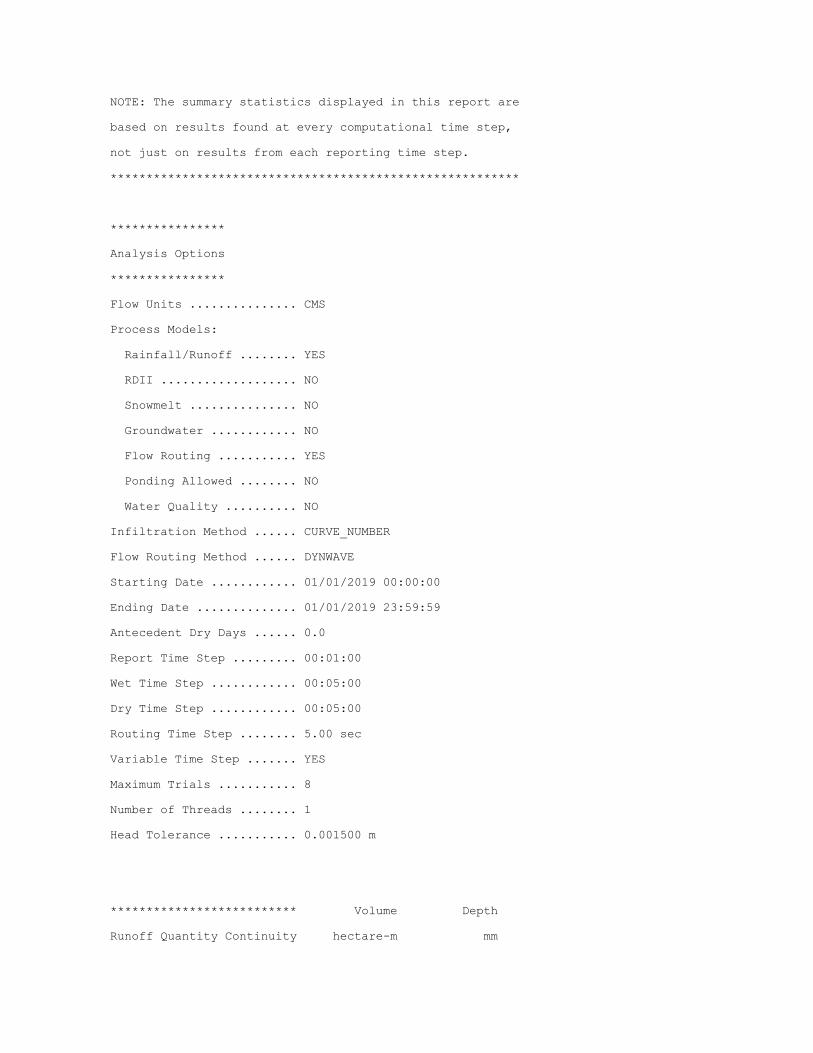
NOTE: The summary statistics displayed in this report are
based on results found at every computational time step,
not just on results from each reporting time step.
*********************************************************
****************
Analysis Options
****************
Flow Units ............... CMS
Process Models:
Rainfall/Runoff ........ YES
RDII ................... NO
Snowmelt ............... NO
Groundwater ............ NO
Flow Routing ........... YES
Ponding Allowed ........ NO
Water Quality .......... NO
Infiltration Method ...... CURVE_NUMBER
Flow Routing Method ...... DYNWAVE
Starting Date ............ 01/01/2019 00:00:00
Ending Date .............. 01/01/2019 23:59:59
Antecedent Dry Days ...... 0.0
Report Time Step ......... 00:01:00
Wet Time Step ............ 00:05:00
Dry Time Step ............ 00:05:00
Routing Time Step ........ 5.00 sec
Variable Time Step ....... YES
Maximum Trials ........... 8
Number of Threads ........ 1
Head Tolerance ........... 0.001500 m
************************** Volume Depth
Runoff Quantity Continuity hectare-m mm
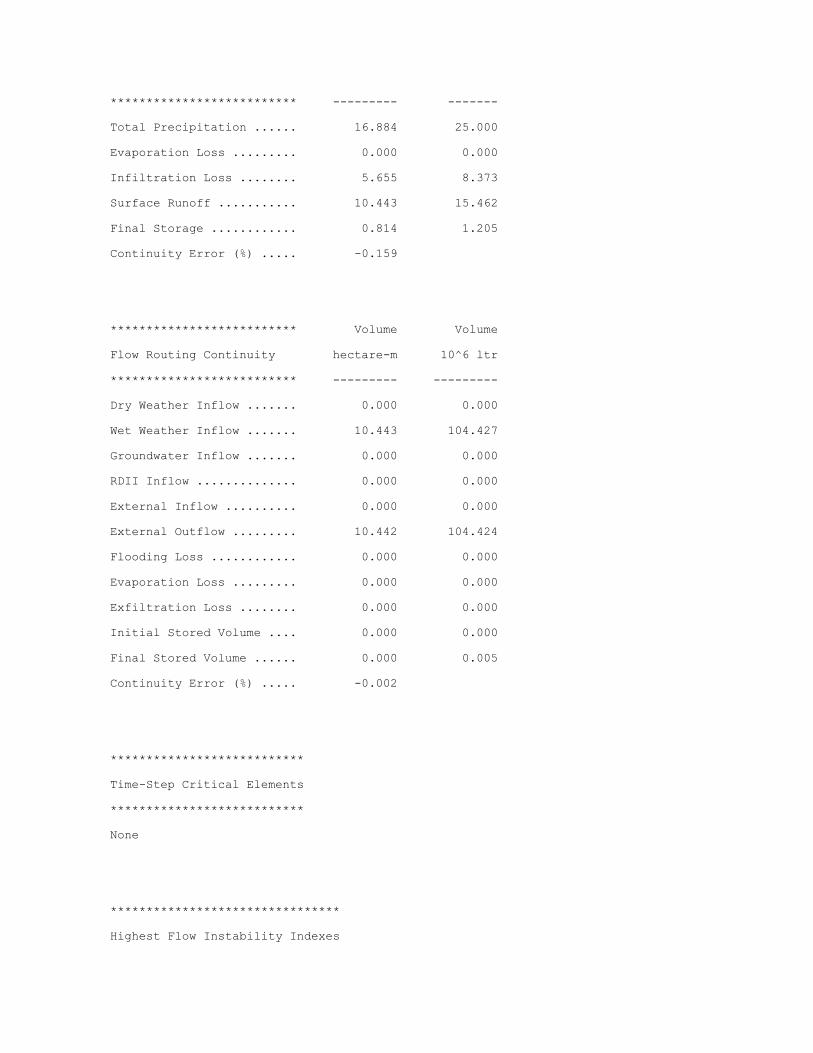
************************** --------- -------
Total Precipitation ...... 16.884 25.000
Evaporation Loss ......... 0.000 0.000
Infiltration Loss ........ 5.655 8.373
Surface Runoff ........... 10.443 15.462
Final Storage ............ 0.814 1.205
Continuity Error (%) ..... -0.159
************************** Volume Volume
Flow Routing Continuity hectare-m 10^6 ltr
************************** --------- ---------
Dry Weather Inflow ....... 0.000 0.000
Wet Weather Inflow ....... 10.443 104.427
Groundwater Inflow ....... 0.000 0.000
RDII Inflow .............. 0.000 0.000
External Inflow .......... 0.000 0.000
External Outflow ......... 10.442 104.424
Flooding Loss ............ 0.000 0.000
Evaporation Loss ......... 0.000 0.000
Exfiltration Loss ........ 0.000 0.000
Initial Stored Volume .... 0.000 0.000
Final Stored Volume ...... 0.000 0.005
Continuity Error (%) ..... -0.002
***************************
Time-Step Critical Elements
***************************
None
********************************
Highest Flow Instability Indexes

********************************
All links are stable.
*************************
Routing Time Step Summary
*************************
Minimum Time Step : 2.50 sec
Average Time Step : 5.00 sec
Maximum Time Step : 5.00 sec
Percent in Steady State : 0.00
Average Iterations per Step : 2.00
Percent Not Converging : 0.00
***************************
Subcatchment Runoff Summary
***************************
--------------------------------------------------------------------------------------------------------
Total Total Total Total Total Total Peak Runoff
Precip Runon Evap Infil Runoff Runoff Runoff Coeff
Subcatchment mm mm mm mm mm 10^6 ltr CMS
--------------------------------------------------------------------------------------------------------
S1 25.00 0.00 0.00 8.37 15.46 104.43 27.58 0.618
******************
Node Depth Summary
******************
---------------------------------------------------------------------------------
Average Maximum Maximum Time of Max Reported
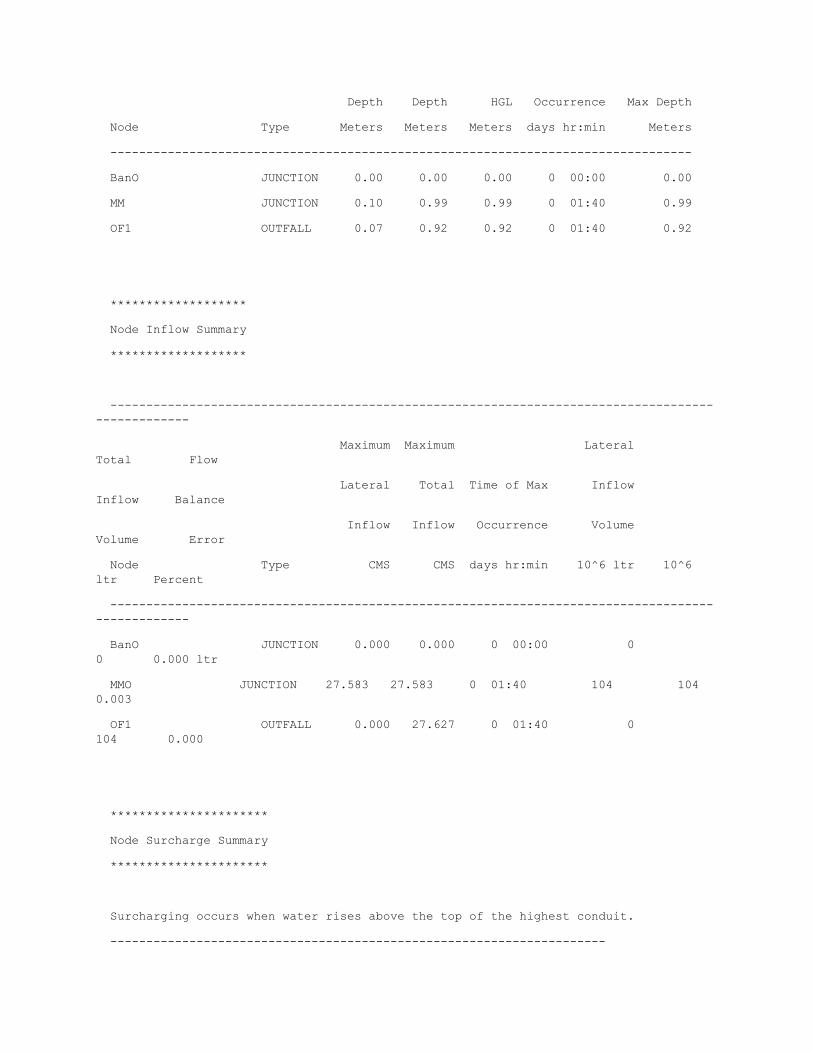
Depth Depth HGL Occurrence Max Depth
Node Type Meters Meters Meters days hr:min Meters
---------------------------------------------------------------------------------
BanO JUNCTION 0.00 0.00 0.00 0 00:00 0.00
MM JUNCTION 0.10 0.99 0.99 0 01:40 0.99
OF1 OUTFALL 0.07 0.92 0.92 0 01:40 0.92
*******************
Node Inflow Summary
*******************
-------------------------------------------------------------------------------------------------
Maximum Maximum Lateral Total Flow
Lateral Total Time of Max Inflow Inflow Balance
Inflow Inflow Occurrence Volume Volume Error
Node Type CMS CMS days hr:min 10^6 ltr 10^6 ltr Percent
-------------------------------------------------------------------------------------------------
BanO JUNCTION 0.000 0.000 0 00:00 0 0 0.000 ltr
MMO JUNCTION 27.583 27.583 0 01:40 104 104 0.003
OF1 OUTFALL 0.000 27.627 0 01:40 0 104 0.000
**********************
Node Surcharge Summary
**********************
Surcharging occurs when water rises above the top of the highest conduit.
---------------------------------------------------------------------

Max. Height Min. Depth
Hours Above Crown Below Rim
Node Type Surcharged Meters Meters
---------------------------------------------------------------------
BanO JUNCTION 24.00 0.000 0.000
*********************
Node Flooding Summary
*********************
No nodes were flooded.
***********************
Outfall Loading Summary
***********************
-----------------------------------------------------------
Flow Avg Max Total
Freq Flow Flow Volume
Outfall Node Pcnt CMS CMS 10^6 ltr
-----------------------------------------------------------
OF1 99.70 1.212 27.627 104.423
-----------------------------------------------------------
System 99.70 1.212 27.627 104.423
********************
Link Flow Summary
********************
-----------------------------------------------------------------------------
Maximum Time of Max Maximum Max/ Max/

|Flow| Occurrence |Veloc| Full Full
Link Type CMS days hr:min m/sec Flow Depth
-----------------------------------------------------------------------------
C1 CONDUIT 27.627 0 01:40 2.91 2.60 0.32
***************************
Flow Classification Summary
***************************
-------------------------------------------------------------------------------------
Adjusted ---------- Fraction of Time in Flow Class ----------
/Actual Up Down Sub Sup Up Down Norm Inlet
Conduit Length Dry Dry Dry Crit Crit Crit Crit Ltd Ctrl
-------------------------------------------------------------------------------------
C1 1.00 0.00 0.00 0.00 1.00 0.00 0.00 0.00 0.00 0.00
*************************
Conduit Surcharge Summary
*************************
----------------------------------------------------------------------------
Hours Hours
--------- Hours Full -------- Above Full Capacity
Conduit Both Ends Upstream Dnstream Normal Flow Limited
----------------------------------------------------------------------------
C1 0.01 0.01 0.01 0.81 0.01
Analysis begun on: Fri Nov 02 15:20:18 2018
Analysis ended on: Fri Nov 02 15:20:19 2018
Total elapsed time: 00:00:01
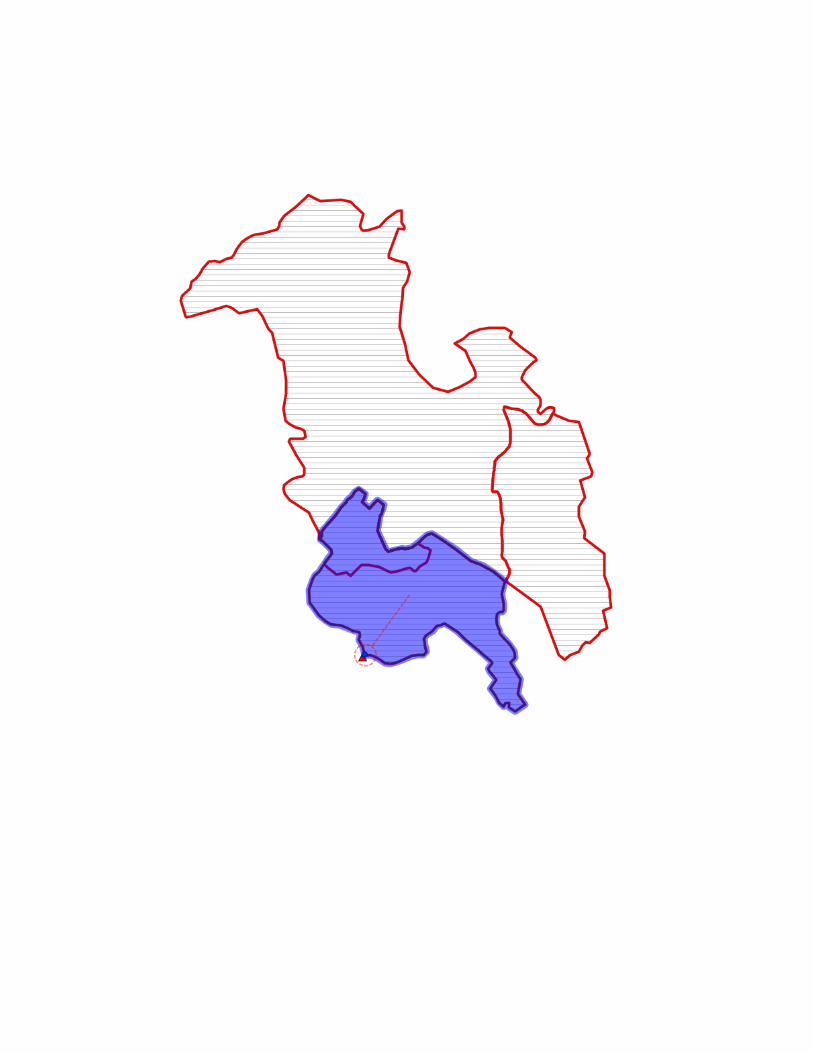
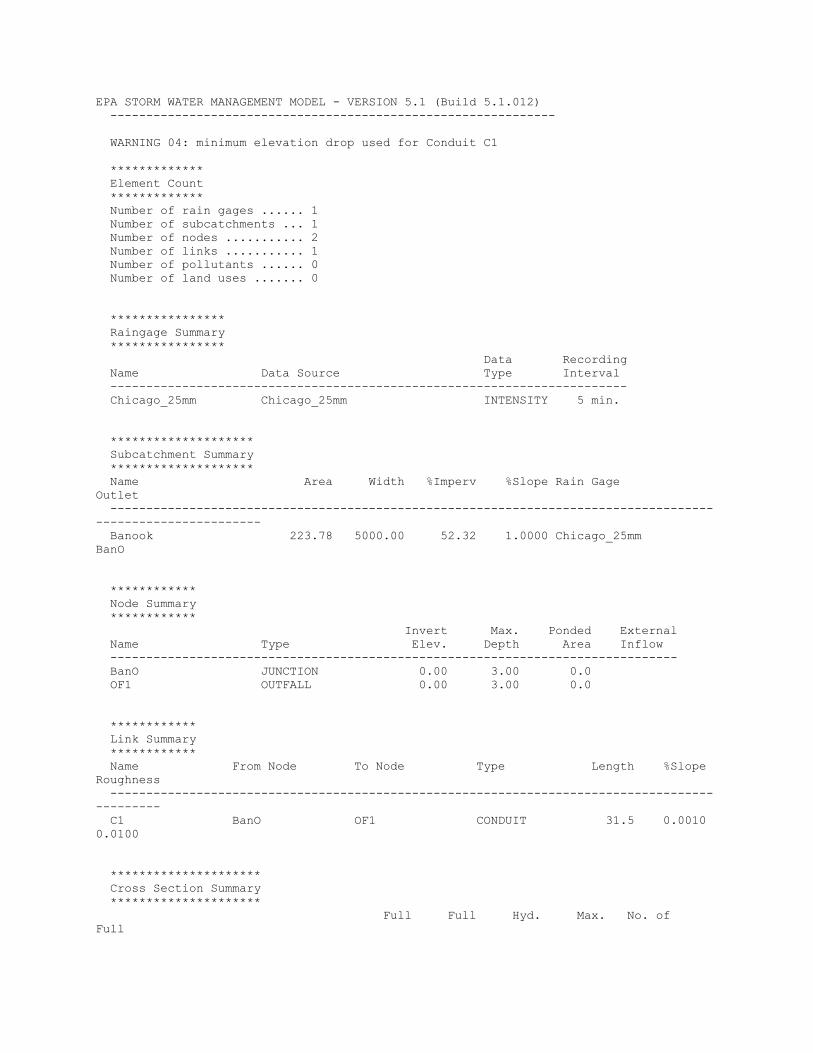
EPA STORM WATER MANAGEMENT MODEL - VERSION 5.1 (Build 5.1.012) -------------------------------------------------------------- WARNING 04: minimum elevation drop used for Conduit C1 ************* Element Count ************* Number of rain gages ...... 1 Number of subcatchments ... 1 Number of nodes ........... 2 Number of links ........... 1 Number of pollutants ...... 0 Number of land uses ....... 0 **************** Raingage Summary **************** Data Recording Name Data Source Type Interval ------------------------------------------------------------------------ Chicago_25mm Chicago_25mm INTENSITY 5 min. ******************** Subcatchment Summary ******************** Name Area Width %Imperv %Slope Rain Gage Outlet ----------------------------------------------------------------------------------------------------------- Banook 223.78 5000.00 52.32 1.0000 Chicago_25mm BanO ************ Node Summary ************ Invert Max. Ponded External Name Type Elev. Depth Area Inflow ------------------------------------------------------------------------------- BanO JUNCTION 0.00 3.00 0.0 OF1 OUTFALL 0.00 3.00 0.0 ************ Link Summary ************ Name From Node To Node Type Length %Slope Roughness --------------------------------------------------------------------------------------------- C1 BanO OF1 CONDUIT 31.5 0.0010 0.0100 ********************* Cross Section Summary ********************* Full Full Hyd. Max. No. of Full
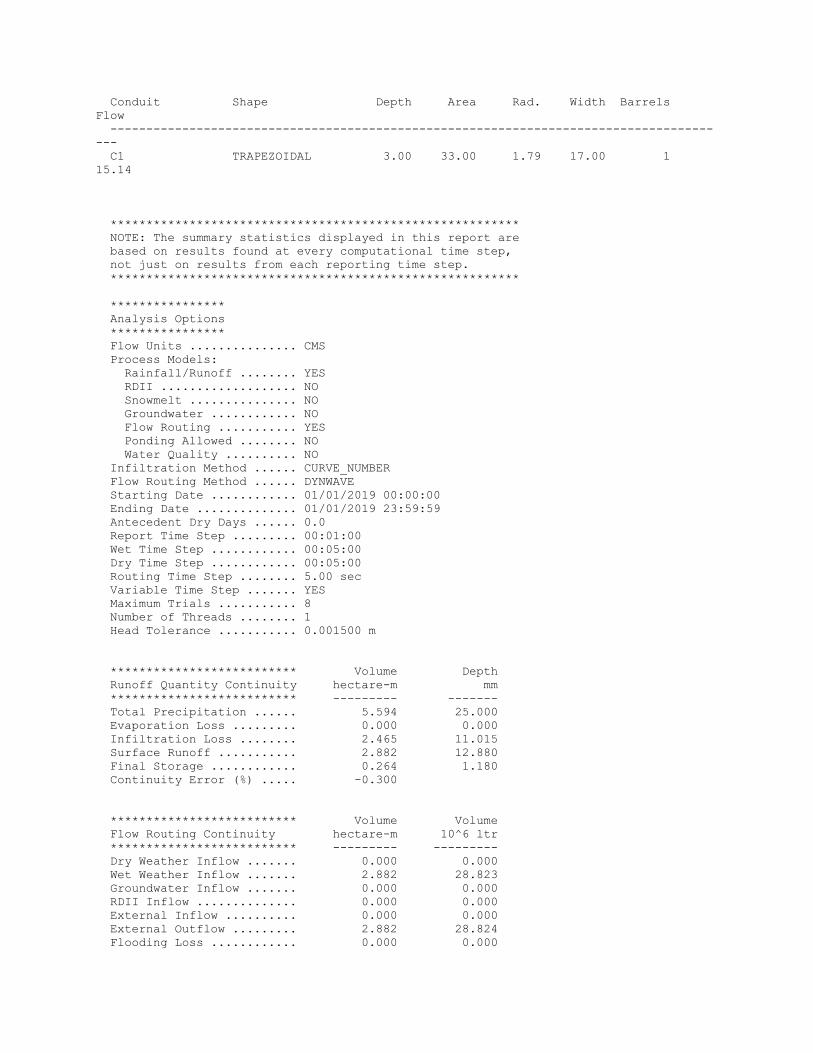
Conduit Shape Depth Area Rad. Width Barrels Flow --------------------------------------------------------------------------------------- C1 TRAPEZOIDAL 3.00 33.00 1.79 17.00 1 15.14 ********************************************************* NOTE: The summary statistics displayed in this report are based on results found at every computational time step, not just on results from each reporting time step. ********************************************************* **************** Analysis Options **************** Flow Units ............... CMS Process Models: Rainfall/Runoff ........ YES RDII ................... NO Snowmelt ............... NO Groundwater ............ NO Flow Routing ........... YES Ponding Allowed ........ NO Water Quality .......... NO Infiltration Method ...... CURVE_NUMBER Flow Routing Method ...... DYNWAVE Starting Date ............ 01/01/2019 00:00:00 Ending Date .............. 01/01/2019 23:59:59 Antecedent Dry Days ...... 0.0 Report Time Step ......... 00:01:00 Wet Time Step ............ 00:05:00 Dry Time Step ............ 00:05:00 Routing Time Step ........ 5.00 sec Variable Time Step ....... YES Maximum Trials ........... 8 Number of Threads ........ 1 Head Tolerance ........... 0.001500 m ************************** Volume Depth Runoff Quantity Continuity hectare-m mm ************************** --------- ------- Total Precipitation ...... 5.594 25.000 Evaporation Loss ......... 0.000 0.000 Infiltration Loss ........ 2.465 11.015 Surface Runoff ........... 2.882 12.880 Final Storage ............ 0.264 1.180 Continuity Error (%) ..... -0.300 ************************** Volume Volume Flow Routing Continuity hectare-m 10^6 ltr ************************** --------- --------- Dry Weather Inflow ....... 0.000 0.000 Wet Weather Inflow ....... 2.882 28.823 Groundwater Inflow ....... 0.000 0.000 RDII Inflow .............. 0.000 0.000 External Inflow .......... 0.000 0.000 External Outflow ......... 2.882 28.824 Flooding Loss ............ 0.000 0.000

Evaporation Loss ......... 0.000 0.000 Exfiltration Loss ........ 0.000 0.000 Initial Stored Volume .... 0.000 0.000 Final Stored Volume ...... 0.000 0.000 Continuity Error (%) ..... -0.004 *************************** Time-Step Critical Elements *************************** None ******************************** Highest Flow Instability Indexes ******************************** All links are stable. ************************* Routing Time Step Summary ************************* Minimum Time Step : 0.83 sec Average Time Step : 5.00 sec Maximum Time Step : 5.00 sec Percent in Steady State : 0.00 Average Iterations per Step : 2.00 Percent Not Converging : 0.00 *************************** Subcatchment Runoff Summary *************************** -------------------------------------------------------------------------------------------------------- Total Total Total Total Total Total Peak Runoff Precip Runon Evap Infil Runoff Runoff Runoff Coeff Subcatchment mm mm mm mm mm 10^6 ltr CMS -------------------------------------------------------------------------------------------------------- Banook 25.00 0.00 0.00 11.01 12.88 28.82 14.55 0.515 ****************** Node Depth Summary ****************** --------------------------------------------------------------------------------- Average Maximum Maximum Time of Max Reported Depth Depth HGL Occurrence Max Depth Node Type Meters Meters Meters days hr:min Meters --------------------------------------------------------------------------------- BanO JUNCTION 0.05 0.90 0.90 0 01:35 0.89 OF1 OUTFALL 0.04 0.85 0.85 0 01:35 0.83 ******************* Node Inflow Summary

******************* ------------------------------------------------------------------------------------------------- Maximum Maximum Lateral Total Flow Lateral Total Time of Max Inflow Inflow Balance Inflow Inflow Occurrence Volume Volume Error Node Type CMS CMS days hr:min 10^6 ltr 10^6 ltr Percent ------------------------------------------------------------------------------------------------- BanO JUNCTION 14.548 14.548 0 01:35 28.8 28.8 -0.002 OF1 OUTFALL 0.000 14.663 0 01:35 0 28.8 0.000 ********************** Node Surcharge Summary ********************** No nodes were surcharged. ********************* Node Flooding Summary ********************* No nodes were flooded. *********************** Outfall Loading Summary *********************** ----------------------------------------------------------- Flow Avg Max Total Freq Flow Flow Volume Outfall Node Pcnt CMS CMS 10^6 ltr ----------------------------------------------------------- OF1 99.82 0.338 14.663 28.824 ----------------------------------------------------------- System 99.82 0.338 14.663 28.824 ******************** Link Flow Summary ******************** ----------------------------------------------------------------------------- Maximum Time of Max Maximum Max/ Max/ |Flow| Occurrence |Veloc| Full Full Link Type CMS days hr:min m/sec Flow Depth ----------------------------------------------------------------------------- C1 CONDUIT 14.663 0 01:35 2.53 0.97 0.29 *************************** Flow Classification Summary ***************************
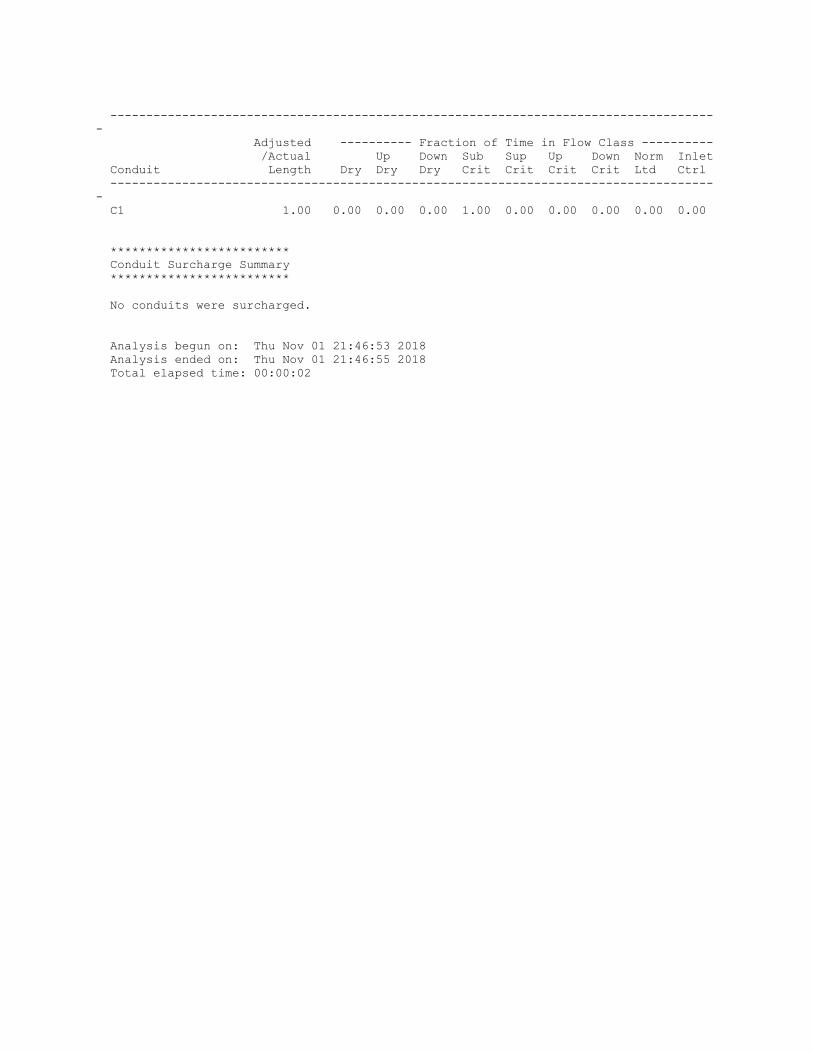
------------------------------------------------------------------------------------- Adjusted ---------- Fraction of Time in Flow Class ---------- /Actual Up Down Sub Sup Up Down Norm Inlet Conduit Length Dry Dry Dry Crit Crit Crit Crit Ltd Ctrl ------------------------------------------------------------------------------------- C1 1.00 0.00 0.00 0.00 1.00 0.00 0.00 0.00 0.00 0.00 ************************* Conduit Surcharge Summary ************************* No conduits were surcharged. Analysis begun on: Thu Nov 01 21:46:53 2018 Analysis ended on: Thu Nov 01 21:46:55 2018 Total elapsed time: 00:00:02

APPENDIX E Supporting Documentation
E.1 – Microbial Source Tracking Laboratory Methodology
Dalhousie University Centre for Water Resources Studies
Detection of Host Specific Microbial Source Tracking (MST) Markers by Quantitative Polymerase Chain Reaction (qPCR) Methods
Samples were collected in sterilized 1 L Nalgene collection bottles (Thermo Fisher Scientific, Waltham, MA, USA). Samples were kept on ice packs during transport to the laboratory at Dalhousie University in Halifax, NS, and stored in a refrigerator at 4°C until analysis. All samples were processed within 24 hours from receiving the samples. Water sample volumes of 500 mL were filtered through sterile filters (0.45 µM pore size, 47 mm diameter, Millipore, Inc., Bedford, MA, USA) using a vacuum filtration system with sterile sample cups (Millipore, Inc., Bedford, MA, USA). The filters were aseptically placed into the DNA extraction tubes provided by a Mo Bio Power Soil DNA extraction kit (VWR International, Ville Mont-Royal, QC, Canada) and manufacturers instructions were followed for extraction of genomic DNA. The genomic DNA was stored at -20°C until analysis. The concentration and purity of genomic DNA were measured by ultraviolet absorbance spectrophotometry at 260/280 nm and 260/230 nm (Implen NanoPhotometer™, Implen, München, Germany). Detection of host specific genetic markers was performed using quantitative polymerase chain reaction (qPCR) methods. More specifically, the Taqman qPCR methods were developed to analyse human-, ruminant-, and canine-specific markers (Haugland et al. 2010; Reischer et al. 2006; Caldwell and Levine 2009; Tambalo et al. 2012). The human-specific Bacteroidales genetic marker (HF183) was assessed and quantified to determine the sources of human fecal contamination (Haugland et al. 2010). Ruminant Bacteroidales genetic marker (BacR) was quantified to investigate the ruminant-associated contamination (Reischer et al. 2006). The canine-specific marker, referred as dogmt, from dog mitochondrial DNA was targeted to assess the canine-associated contamination (Caldwell and Levine 2009; Tambalo et al. 2012). The Sybr Green qPCR assay was used to detect the avian-specific marker (GFD) t (Green et al. 2012). References Caldwell, J.M., Levine, J.F. (2009). Domestic wastewater influent profiling using mitochondrial real-time PCR for source tracking animal contamination. Journal of Microbiological Methods, 77, 17-22. Green, H.C., Dick, L.K., Samadpour, M., Field, K.G. (2012). Genetic markers for rapid PCR-based identification of gull, Canada goose, duck, and chicken fecal contamination in water. Applied and Environmental Microbiology, 78(2), 503-510. Haugland, R.A., Varma, M., Sivaganesan, M., Kelty, C., Preed, L., Shanks, O.C. (2010). Evaluation of genetic markers from the 16S rRNA gene V2 region for use in quantitative detection of selected Bacteroidales species and human fecal waste by qPCR. Systematic and Applied Microbiology, 33, 348-357. Reischer, G.H., Kasper, D.C., Steinborn, R., Mach, R.L., Farnleitner, A.H., (2006) Quantitative PCR method for sensitive detection of ruminant fecal pollution in freshwater and evaluation of this method in alpine karstic regions. Applied and Environmental Microbiology, 72, 5610-5614. Tambalo, D.D., Boa, T., Liljebjelke K., Yost, C.K. (2012). Evaluation of two quantitative PCR assays using Bacteroidales and mitochondrial DNA for tracking dog fecal contamination in waterbodies. Journal of Microbiological Methods, 91, 459-467.

E.2 – User’s Manual for Prediction of Phosphorus Concentration In Nova Scotia Lakes: A Tool for Decision
Making
User’s Manual for Prediction of Phosphorus Concentration
In Nova Scotia Lakes: A Tool for Decision Making
Version 1.0
Prepared For
The Nova Scotia Water Quality Objectives and Model
Development Steering Committee
Nova Scotia Department of Environment and Labour
By
M. Brylinsky
Acadia Centre for Estuarine Research Acadia University
Wolfville, Nova Scotia B4P 2R6
January 2004
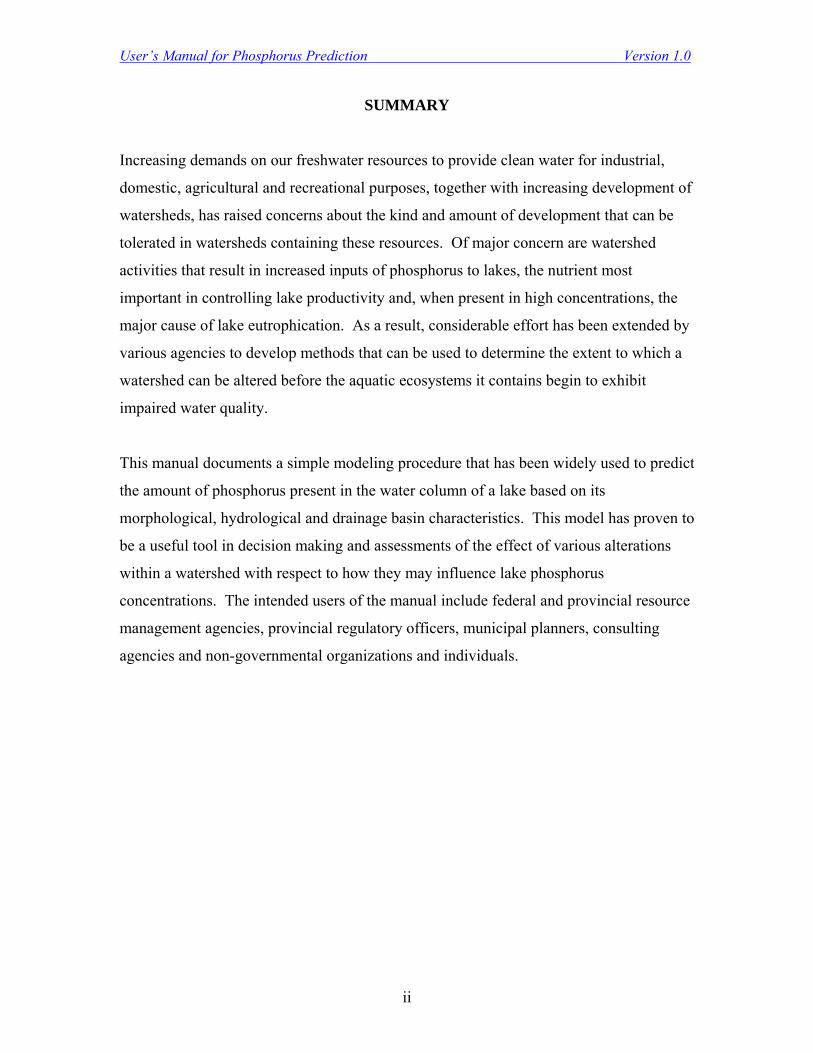
User’s Manual for Phosphorus Prediction Version 1.0
ii
SUMMARY
Increasing demands on our freshwater resources to provide clean water for industrial,
domestic, agricultural and recreational purposes, together with increasing development of
watersheds, has raised concerns about the kind and amount of development that can be
tolerated in watersheds containing these resources. Of major concern are watershed
activities that result in increased inputs of phosphorus to lakes, the nutrient most
important in controlling lake productivity and, when present in high concentrations, the
major cause of lake eutrophication. As a result, considerable effort has been extended by
various agencies to develop methods that can be used to determine the extent to which a
watershed can be altered before the aquatic ecosystems it contains begin to exhibit
impaired water quality.
This manual documents a simple modeling procedure that has been widely used to predict
the amount of phosphorus present in the water column of a lake based on its
morphological, hydrological and drainage basin characteristics. This model has proven to
be a useful tool in decision making and assessments of the effect of various alterations
within a watershed with respect to how they may influence lake phosphorus
concentrations. The intended users of the manual include federal and provincial resource
management agencies, provincial regulatory officers, municipal planners, consulting
agencies and non-governmental organizations and individuals.
User’s Manual for Phosphorus Prediction Version 1.0
iii
Table of Contents
Page
1. Introduction ………………………………………..………………………… 1
2. Some Basic Limnological Concepts ……………………………………..….. 4
2.1. Lake Stratification ……………………………………………………… 4
2.2. The Aquatic Phosphorus Cycle ………………………………………… 6
2.3. Factors Controlling Algal Growth ……………………………………… 8
3. Model Overview …………………………………………………………….. 9
4. Model Formulation ………………………………………………………….. 10
5. Model Format ……………………………………………………..………… 13
6. Modeling Procedure …………………………………..…………………….. 14
7. Model Construction …………………………………………………………. 15
7.1. Model Inputs ………………………………………………..………….. 15
7.1.1. Morphology ………………………………..…………………….. 16
7.1.1.1. Drainage Basin Area ………………………………………… 16
7.1.1.2. Surface Area of Each Land Use Category …………………… 17
7.1.1.3. Lake Surface Area …………………………………………… 17
7.1.1.4. Lake Volume ………………………………………………… 17
7.1.2. Hydrology …………………………………..……………..………. 18
7.1.2.1. Upstream Hydraulic Inputs ………………………………….. 18
7.1.2.2. Annual Unit Precipitation ………….………………………… 18
7.1.2.3. Annual Unit Lake Evaporation …….………………….…….. 18
7.1.2.4. Annual Unit Hydraulic Run Off ……………………………… 19
7.1.3. Phosphorus Inputs ………………………………………………… 19
7.1.3.1. Upstream Phosphorus Input ……………………………….. 19
7.1.3.2. Annual Unit Atmospheric Deposition ..................................... 20
7.1.3.3. Annual Unit Phosphorus Export from Land ………………… 20
7.1.3.4. Development Inputs ………….……………………………… 26
7.1.3.5. Point Source Inputs ………….……………………………… 27
7.1.3.6. Lake Phosphorus Retention Coefficient ……………………… 29
7.2. Model Outputs …………………………………………………………. 30
User’s Manual for Phosphorus Prediction Version 1.0
iv
7.2.1. Hydrology …………………………………………………………. 30
7.2.1.1. Total Precipitation Hydraulic Input …………………………. 30
7.2.1.2. Total Evaporation Hydraulic Loss ………….………………. 31
7.2.1.3. Total Hydraulic Surface Run Off …………………………… 31
7.2.1.4. Total Hydraulic Input ………….…………………….………. 31
7.2.1.5. Areal Hydraulic Load ………………………………………. 31
7.2.1.6. Total Hydraulic Outflow ………….………………………… 32
7.2.2. Phosphorus ………………………………………………………… 32
7.2.2.1. Atmospheric Phosphorus Input ………….………………… 32
7.2.2.2. Total Surface Run Off Phosphorus Input …………………… 32
7.2.2.3. Development Phosphorus Input ………………….………... 33
7.2.2.4. Total Phosphorus Input ……………………………………. 33
7.2.2.5. Lake Phosphorus Retention Factor …………….…….……… 33
7.2.2.6. Lake Phosphorus Retention ………………………………..... 34
7.2.2.7. Lake Phosphorus Concentration ……………………………… 34
7.2.2.8. Lake Phosphorus Outflow …………………………………… 34
7.2.3. Lake Characterization Parameters ………………………………… 35
7.2.3.1. Mean Depth …………….……………………………………. 35
7.2.3.2. Flushing Rate ………………………………………………… 35
7.2.3.3. Turnover Time ……………………………………………..... 35
7.2.3.4. Response Time ………………………………………………. 36
8. Entering Data ………………………………………………………………… 36
9. Model Validation ……………………………………………………………. 37
9.1. Protocol for Collection of Validation Data …………………………….. 37
10. Model Re-evaluation ……………………………………………………….. 38
11. Sensitivity Analysis ………………………………………………………… 38
12. Acknowledgements ………………………………………………..……….. 39
13. References ………………………………………………………………….. 41
14. Glossary ……………………………………………………………………. 47
15. Appendices …………………………………………………………………. 50
Appendix I. Sample Excel Worksheet …………………………..……… 51
User’s Manual for Phosphorus Prediction Version 1.0
v
Appendix II. Data Sources ……………………………………………… 53
Appendix III. Isorunoff Map for Estimating Surface Run Off …………. 54
Appendix IV. Literature References for Estimating Export Coefficients . 55
Appendix V. Example of Model Application …………………………… 56
V.1. Determination of Drainage Basin Area …………………………. 57
V.2. Determination of the Area of Each Land Use Category ………… 58
V.3. Determination of Hydrological Inputs/Outputs …………………. 59
V.4. Determination of Lake Surface Area and Volume ………………. 60
V.5. Estimate of Atmospheric Phosphorus Deposition Coefficient ..… 62
V.6. Estimates of Phosphorus Land Use Run Off Coefficients …........ 62
V.7. Determination of Development Input …………………………… 63
V.8. Determination of Phosphorus Retention Coefficient …………… 63
V.9. Model Prediction of Phosphorus Concentration ………………… 64
V.10. Model Validation ……………………………………………….. 66
V.11. Model Re-evaluation …………………………………………… 67
V.12. Examples of Model Application ………………………………. 69
Appendix VI. Supplementary Technical Manual - Assumptions and
Limitations of the Model ….………………..…………..…………. 70
VI.1. Introduction ……………………………………………………. 70
VI.2. Model Assumptions ……………………………………………. 71
VI.2.1. Phosphorus Transport ………………………………….… 71
VI.2.1.1. Drainage Basin Size and Juxtaposition of Land Use
Types ………………………………………………… 71
VI.2.1.2. Phosphorus Retention in Streams and Rivers .............. 73
VI.2.1.3. Proximity of Dwellings to Lake …………….……….. 73
VI.2.1.4. Wetlands ……………………………….…………….. 74
VI.2.1.5. Groundwater Inputs …………………………………. 75
VI.2.2. Lake Morphology ………………………………………… 75
VI.3. Model Limitations ………………………………………………… 76
VI.4. Application of Model to Establishing Phosphorus Water Quality
Objectives ………………………………………………………..... 77

User’s Manual for Phosphorus Prediction Version 1.0
vi
VI.5.References ………………………………………………………….. 80

User’s Manual for Phosphorus Prediction Version 1.0
1
User’s Manual for Prediction of Phosphorus Concentration
In Nova Scotia Lakes: A Tool for Decision Making
Version 1.0
1. Introduction
Increasing pressure on our freshwater resources to provide clean water for industrial,
domestic, agricultural and recreational purposes has raised concerns about the kind and
amount of development that can be tolerated in watersheds containing these resources. In
many areas of the world, freshwater systems have been severely degraded as a result of
poor watershed management and lack of land use planning. Although Nova Scotia
contains many relatively pristine watersheds, concern about threats to the quality of our
freshwater resources from increased development, and the land use changes that
accompany development, has been raised in the past (Waller 1971), and many believe
that it is now time to develop procedures for determining the kind and level of
development that can be endured within Nova Scotia watersheds before water quality
becomes impaired.
Over the last three decades, considerable effort has been extended by many agencies to
develop a simple procedure that can be used to determine the extent to which a watershed
can be altered before the aquatic ecosystems it contains begin to exhibit impaired water
quality as a result of excessive nutrient enrichment. In North America, many provinces
and states are in the process of developing nutrient criteria designed to protect freshwater
systems from nutrient overenrichment.
Of major concern is human activity that results in alterations of the tropic status of lakes.
The term trophic literally means ‘nourish’, and when applied to a water body it refers to
its level of biological productivity. Three commonly used terms to define the trophic
status of a water body are oligotrophic (little nourishment), mesotrophic (moderate
nourishment) and eutrophic (much nourishment). Oligotrophic systems are characterized
by relatively pristine conditions and low levels of production. Eutrophic systems are

User’s Manual for Phosphorus Prediction Version 1.0
2
characterized by a high biomass of plants, especially algae, and in many instances, low
levels of dissolved oxygen which can result in the build up of toxic products such as
methane, hydrogen sulphide and ammonia. Eutrophic conditions can lead to fish kills
and species shifts of both plants and animals. A fourth trophic term, dystrophic, literally
means abnormal nourishment, and is used to describe systems that do not fall into the
above categories. Dystrophic water bodies are characterized by colored water, mostly as
a result of receiving run off containing dissolved humic compounds that originate from
peatlands or leachates produced from the breakdown of coniferous vegetation within a
watershed.
Because lakes lie in depressions within the land, they are natural traps for particulate
materials containing nutrients that enter via their inflows. As a result, all lakes gradually
accumulate nutrients and at some point will become eutrophic. This natural
eutrophication is a slow process, on the order of tens of centuries in most cases, but it is
often accelerated by the activities of humans, a process referred to as cultural
eutrophication, through land use alterations within a lake’s drainage basin, or by the
direct discharge of sewage, or other effluents containing nutrients, into a lake.
Although freshwater algae require a number of nutrients in order to grow, the two that are
most commonly present in limiting amounts are phosphorus and nitrogen. Of these,
phosphorus is the nutrient that most often limits the growth of aquatic plants in
freshwater systems and, when present in high concentrations, is most often responsible
for lake eutrophication. A general rule of thumb used by limnologists is that phosphorus
is considered the limiting nutrient when the ratio of total nitrogen to total phosphorus
concentration (by weight) is greater than about 7. Although there is considerable
variation, on a global scale the concentration of phosphorus that results in oligotrophic,
mesotrophic, and eutrophic conditions is about <10, 10-35 and > 35 µg L-1, respectively.
Considerable effort has been devoted to developing quantitative empirical relationships
between the concentration of phosphorus in a lake and water quality parameters that
provide an indication of the trophic status of a lake. The two most commonly used
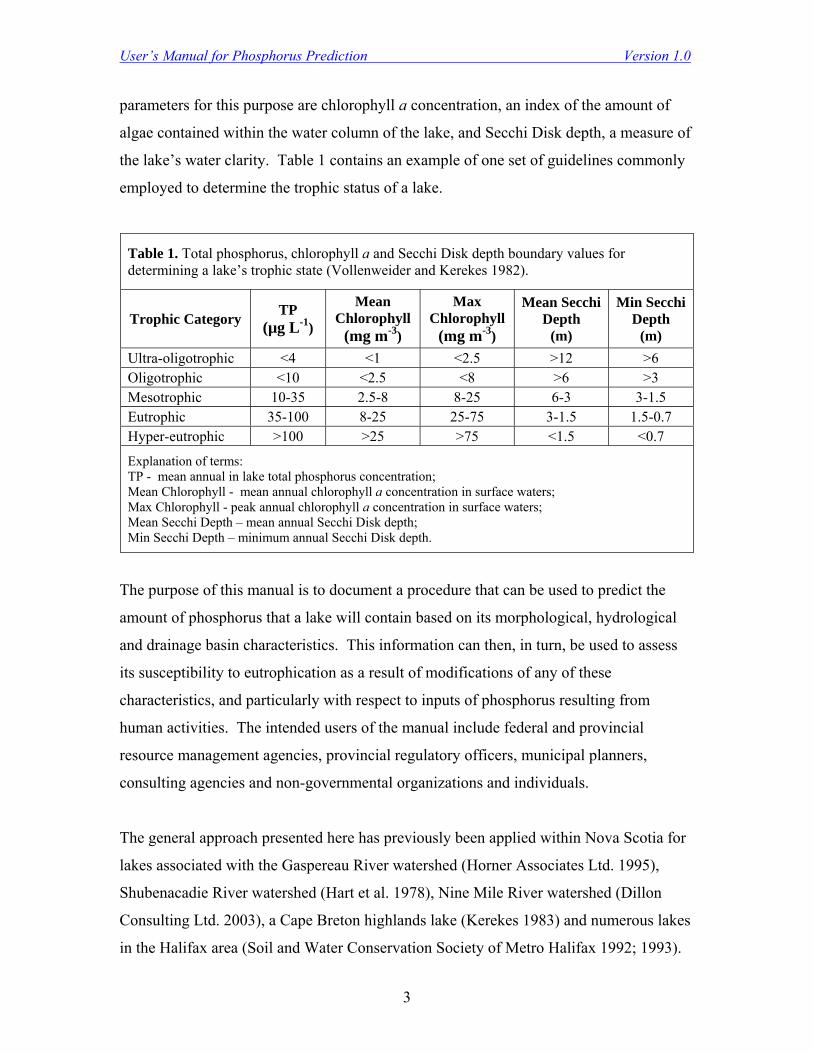
User’s Manual for Phosphorus Prediction Version 1.0
3
parameters for this purpose are chlorophyll a concentration, an index of the amount of
algae contained within the water column of the lake, and Secchi Disk depth, a measure of
the lake’s water clarity. Table 1 contains an example of one set of guidelines commonly
employed to determine the trophic status of a lake.
The purpose of this manual is to document a procedure that can be used to predict the
amount of phosphorus that a lake will contain based on its morphological, hydrological
and drainage basin characteristics. This information can then, in turn, be used to assess
its susceptibility to eutrophication as a result of modifications of any of these
characteristics, and particularly with respect to inputs of phosphorus resulting from
human activities. The intended users of the manual include federal and provincial
resource management agencies, provincial regulatory officers, municipal planners,
consulting agencies and non-governmental organizations and individuals.
The general approach presented here has previously been applied within Nova Scotia for
lakes associated with the Gaspereau River watershed (Horner Associates Ltd. 1995),
Shubenacadie River watershed (Hart et al. 1978), Nine Mile River watershed (Dillon
Consulting Ltd. 2003), a Cape Breton highlands lake (Kerekes 1983) and numerous lakes
in the Halifax area (Soil and Water Conservation Society of Metro Halifax 1992; 1993).
Table 1. Total phosphorus, chlorophyll a and Secchi Disk depth boundary values for determining a lake’s trophic state (Vollenweider and Kerekes 1982).
Trophic Category TP (µg L-1)
Mean Chlorophyll
(mg m-3)
Max Chlorophyll
(mg m-3)
Mean Secchi Depth
(m)
Min Secchi Depth
(m) Ultra-oligotrophic <4 <1 <2.5 >12 >6 Oligotrophic <10 <2.5 <8 >6 >3 Mesotrophic 10-35 2.5-8 8-25 6-3 3-1.5 Eutrophic 35-100 8-25 25-75 3-1.5 1.5-0.7 Hyper-eutrophic >100 >25 >75 <1.5 <0.7
Explanation of terms: TP - mean annual in lake total phosphorus concentration; Mean Chlorophyll - mean annual chlorophyll a concentration in surface waters; Max Chlorophyll - peak annual chlorophyll a concentration in surface waters; Mean Secchi Depth – mean annual Secchi Disk depth; Min Secchi Depth – minimum annual Secchi Disk depth.
User’s Manual for Phosphorus Prediction Version 1.0
4
Scott et al. (2003) carried out a study comparing these models and concluded that all of
the models were essentially the same in terms of their general formulations and
assumptions.
2. Some Basic Limnological Concepts
Anyone who attempts to use the model presented in this manual to predict the phosphorus
concentration of a lake, or to determine the permissible loading of phosphorus to a lake,
should have at least a general knowledge of the factors that cause eutrophication, as well
as of the processes that determine the degree to which a particular lake is subject to
becoming eutrophic. Of particular importance is an understanding of how phosphorus
cycles within a lake, and the way in which lake stratification and the mixing processes
occurring within the water column of a lake influence this cycle. It is also important to
know something of the relationship between light availability and lake stratification in
terms of how this also influences lake productivity. The discussion below provides a
general description of these factors.
2.1. Lake Stratification
Lake stratification refers to the condition in which the water column of a lake becomes
separated into layers of different densities as a result of differences in temperature. In
temperate climates, this stratification is typically most strongly developed during the late
summer and consists of three water layers (Figure 2.1).
The upper surface portion of the water column, the epilimnion, is the warmest layer, and
the lower bottom layer, the hypolimnion, is the coldest. Between the two is the
metalimnion, a layer of water in which a strong temperature gradient, called the
thermocline, exists.
In Nova Scotia, the depth of the thermocline during the summer is generally about six
metres, unless the lake is colored in which case the thermocline forms at about three

User’s Manual for Phosphorus Prediction Version 1.0
5
metres. Aside from color, the strength and depth of the thermocline, as well as the
temperature difference between the epilimnion and hypolimnion, depends on a number of
factors, of which exposure to winds is one of the most important.
Figure 2.1. Cross section through a stratified lake showing the three water layers and a temperature-depth profile.
Lake stratification typically begins during spring when daylength increases and the lake
begins to warm. It ends in the fall when daylength begins to decrease and the surface
water cools causing it to sink to the bottom of the lake. At this time the lake undergoes
the ‘fall overturn’ and the bottom waters rise to the surface having been displaced by the
sinking surface waters. This process results in bottom waters becoming re-oxygenated in
those instances when the lake has experienced a decrease in oxygen during the period of
summer stratification.
Temperate zone lakes may also undergo stratification during winter if covered by ice, and
this may also result in depletion of oxygen in the bottom waters. Figure 2.2 illustrates the
seasonal variation in thermal structure of a lake that undergoes stratification. One of the
most significant consequences of stratification is that it limits the degree to which oxygen
is mixed from the surface of the lake to the hypolimnion. As a result, if the lake has a
high level of algal production, the dead organic matter that eventually results settles to the
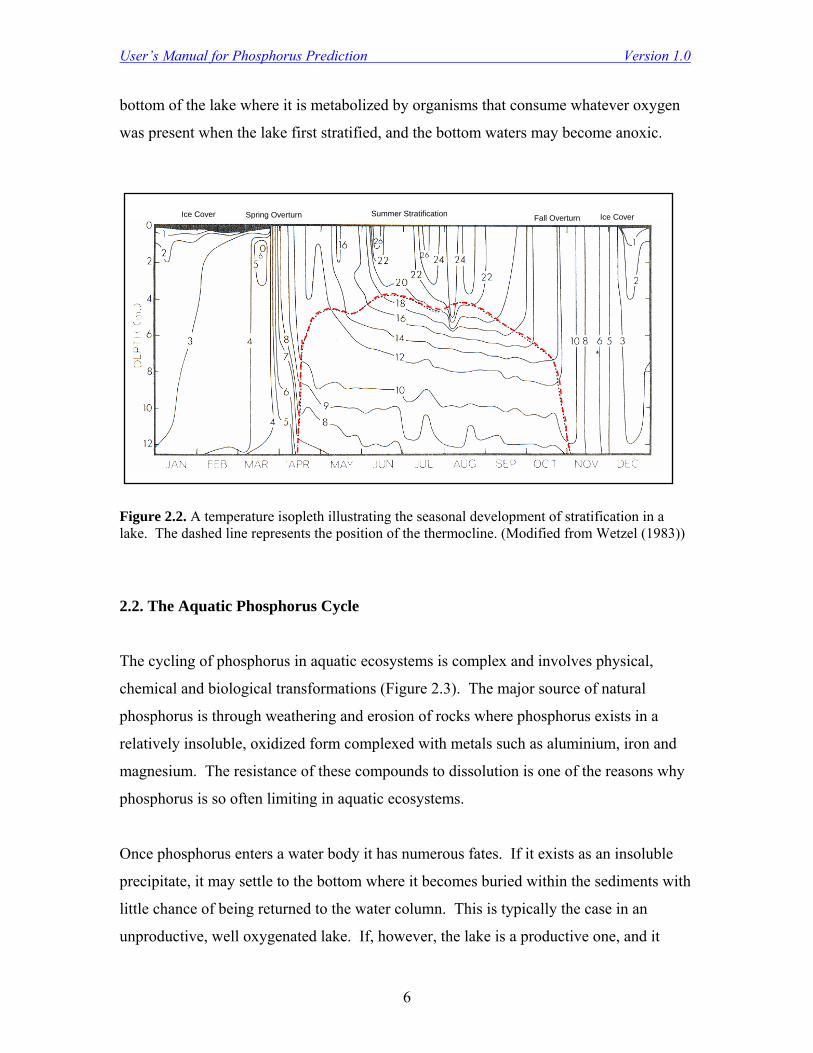
User’s Manual for Phosphorus Prediction Version 1.0
6
bottom of the lake where it is metabolized by organisms that consume whatever oxygen
was present when the lake first stratified, and the bottom waters may become anoxic.
Figure 2.2. A temperature isopleth illustrating the seasonal development of stratification in a lake. The dashed line represents the position of the thermocline. (Modified from Wetzel (1983))
2.2. The Aquatic Phosphorus Cycle
The cycling of phosphorus in aquatic ecosystems is complex and involves physical,
chemical and biological transformations (Figure 2.3). The major source of natural
phosphorus is through weathering and erosion of rocks where phosphorus exists in a
relatively insoluble, oxidized form complexed with metals such as aluminium, iron and
magnesium. The resistance of these compounds to dissolution is one of the reasons why
phosphorus is so often limiting in aquatic ecosystems.
Once phosphorus enters a water body it has numerous fates. If it exists as an insoluble
precipitate, it may settle to the bottom where it becomes buried within the sediments with
little chance of being returned to the water column. This is typically the case in an
unproductive, well oxygenated lake. If, however, the lake is a productive one, and it
Ice Cover Ice Cover Spring Overturn Fall Overturn Summer Stratification

User’s Manual for Phosphorus Prediction Version 1.0
7
contains an anoxic zone, either at the sediment surface or within the bottom water layer,
the precipitate may be chemically transformed to a reduced state which is soluble and
biologically available. In this case, the phosphorus may become resuspended into the
water column where it is available for uptake by plants. This chemical transformation of
insoluble phosphorus to a soluble form under anoxic conditions is one of the reasons why
a lake that has accumulated phosphorus in its sediments over a long period of time, and
that has an anoxic hypolimnion, may take considerable time, often on the order of
decades, to respond to a reduction in phosphorus loading.
Figure 2.3. The cycle of phosphorus in a lake (percentages represent the relative amounts of phosphorus typically found in each form within the water column of a lake). Modified from Horne and Goldman (1994).
Plants can only assimilate phosphorous in the dissolved inorganic form. This form is
referred to as orthophosphate and, because of the rapidity with which plants take it up, it
is usually present in very low amounts. Orthophosphate that has been taken up by plants
90%
0.04%Living
5%
INPUTS (P Loading)
0.2%
AlPO4 FePO4 MgPO4
Potential Sinks

User’s Manual for Phosphorus Prediction Version 1.0
8
becomes incorporated into the food web as living particulate phosphorus. This pool of
phosphorus is much larger than that present as orthophosphate. As organisms die and
decay, the phosphorus they contain can be transformed into forms that can be recycled if
they remain in the soluble form. By far the largest quantity of phosphorus present in
aquatic systems is that contained in the non-living organic particulate form. This is
commonly referred to as detrital phosphorus, and consists of dead aquatic organisms as
well as terrestrial plants and animals that have been washed into the system. As this pool
of organic matter is metabolized by bacteria and other detritus feeding organisms,
phosphorus is released and may once again become available to plants to complete the
cycle.
2.3. Factors Controlling Algal Growth
The two major factors that control algal growth in aquatic ecosystems are the availability
of light and the availability of nutrients, both of which are strongly influenced by the
amount of mixing of the water column. In stratified systems, the depth to which algae are
mixed is determined by the thermocline depth. If the thermocline depth is shallow, the
algae will spend most of the time within the upper portion of the water column where
there is usually sufficient light for photosynthesis and, if nutrients are plentiful, will grow
rapidly. If, however, the system is unstratified and relatively deep, the algae will be
mixed throughout the water column and may spend a significant portion of the time in
that part of the water column where light levels are too low to support photosynthesis. In
this case, algal growth will be limited, even though nutrients levels may be quite high.
Because of the dependency of algal growth on both light and nutrients, stratified systems
are more susceptible to becoming eutrophic than are unstratified systems, unless the lake
is relatively shallow and sufficient light is available throughout the water column.
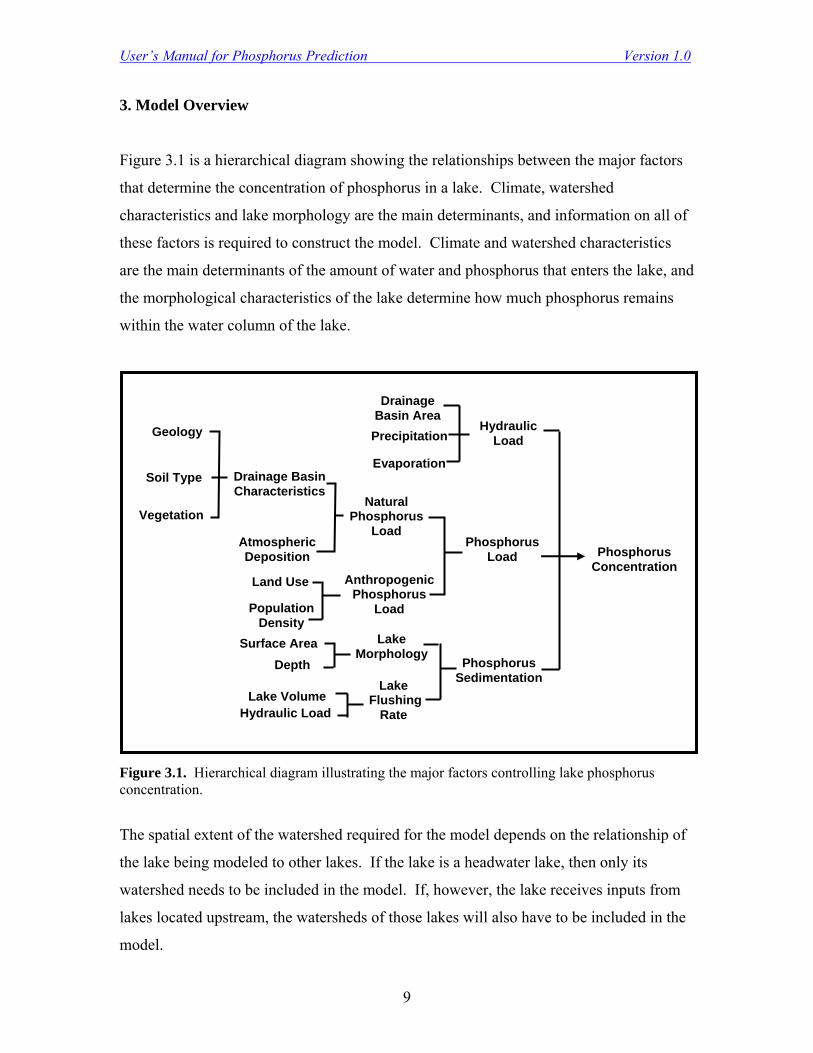
User’s Manual for Phosphorus Prediction Version 1.0
9
3. Model Overview
Figure 3.1 is a hierarchical diagram showing the relationships between the major factors
that determine the concentration of phosphorus in a lake. Climate, watershed
characteristics and lake morphology are the main determinants, and information on all of
these factors is required to construct the model. Climate and watershed characteristics
are the main determinants of the amount of water and phosphorus that enters the lake, and
the morphological characteristics of the lake determine how much phosphorus remains
within the water column of the lake.
Figure 3.1. Hierarchical diagram illustrating the major factors controlling lake phosphorus concentration.
The spatial extent of the watershed required for the model depends on the relationship of
the lake being modeled to other lakes. If the lake is a headwater lake, then only its
watershed needs to be included in the model. If, however, the lake receives inputs from
lakes located upstream, the watersheds of those lakes will also have to be included in the
model.
Phosphorus Concentration
HydraulicLoad
Drainage Basin Area
Precipitation
PhosphorusLoad
Natural Phosphorus
Load
AnthropogenicPhosphorus
Load
Geology
Soil Type
Land Use
Drainage Basin Characteristics
Evaporation
Population Density
Lake Morphology
Lake Volume
Surface Area
Atmospheric Deposition
Phosphorus Sedimentation
Vegetation
Lake Flushing
Rate Hydraulic Load
Depth
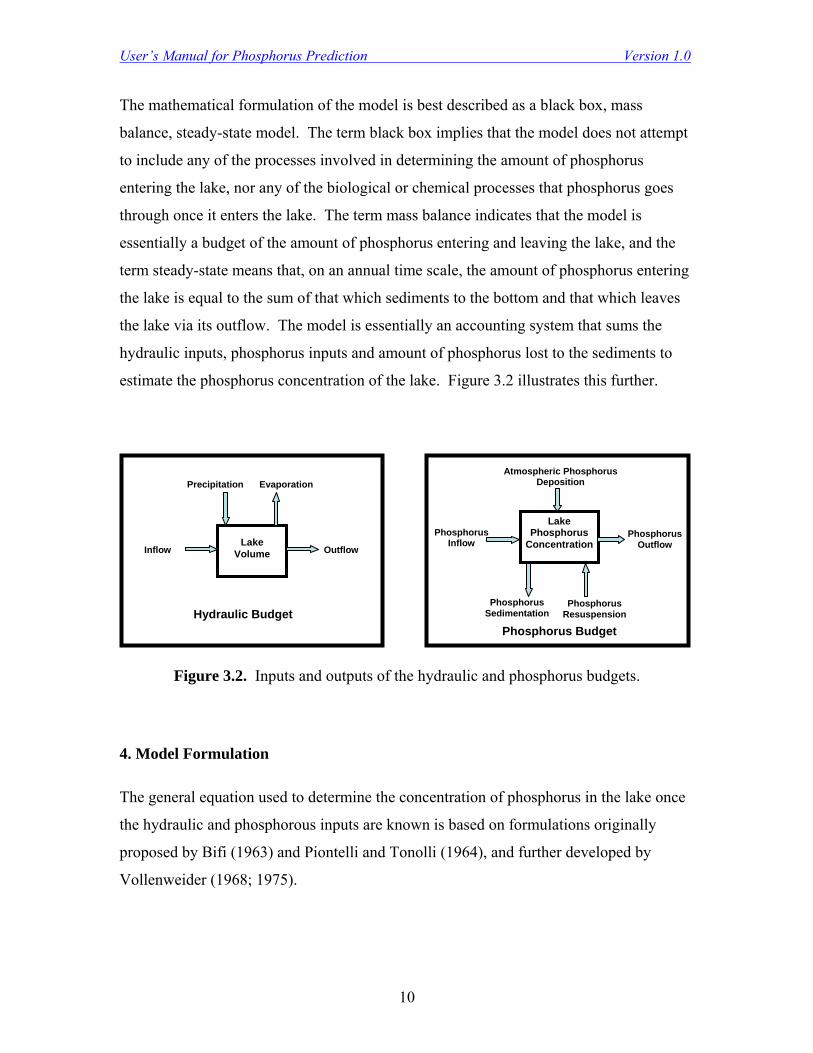
User’s Manual for Phosphorus Prediction Version 1.0
10
The mathematical formulation of the model is best described as a black box, mass
balance, steady-state model. The term black box implies that the model does not attempt
to include any of the processes involved in determining the amount of phosphorus
entering the lake, nor any of the biological or chemical processes that phosphorus goes
through once it enters the lake. The term mass balance indicates that the model is
essentially a budget of the amount of phosphorus entering and leaving the lake, and the
term steady-state means that, on an annual time scale, the amount of phosphorus entering
the lake is equal to the sum of that which sediments to the bottom and that which leaves
the lake via its outflow. The model is essentially an accounting system that sums the
hydraulic inputs, phosphorus inputs and amount of phosphorus lost to the sediments to
estimate the phosphorus concentration of the lake. Figure 3.2 illustrates this further.
Figure 3.2. Inputs and outputs of the hydraulic and phosphorus budgets.
4. Model Formulation
The general equation used to determine the concentration of phosphorus in the lake once
the hydraulic and phosphorous inputs are known is based on formulations originally
proposed by Bifi (1963) and Piontelli and Tonolli (1964), and further developed by
Vollenweider (1968; 1975).
Lake Phosphorus
Concentration
PhosphorusInflow
Phosphorus Outflow
Atmospheric Phosphorus Deposition
Phosphorus Budget
Phosphorus Sedimentation
Phosphorus Resuspension
Lake
Volume Inflow Outflow
Precipitation Evaporation
Hydraulic Budget

User’s Manual for Phosphorus Prediction Version 1.0
11
The Vollenweider model assumes that the change in the amount of phosphorus in the lake
over time is equal to the amount of phosphorus entering the lake minus the amount of
phosphorus lost to the sediments and the outflow:
(∆PV ⁄ ∆t) = M – (PV × Q ⁄ V) – (σ × P) where,
PV = Total mass of phosphorus in lake (gm)
P = Lake phosphorus concentration (gm m-3)
V = Lake volume (m3)
t = time
M = Annual mass of phosphorus input to lake (gm yr-1)
Q = Annual volume of water outflow from lake (m-3 yr-1)
σ = Sedimentation coefficient (yr-1)
The steady state solution (i.e., setting ∆PV ⁄ ∆t = 0) to this equation is:
M / V PV = ─────── (Q ⁄ V) + σ
The major assumptions of the model are:
• Phosphorus entering the lake is mixed throughout the lake,
• The concentration of phosphorus in the outflow is equal to the concentration in
the lake,
• The loss of phosphorus by settling to sediments is proportional to its
concentration in the lake,
• Seasonal fluctuations in hydraulic and phosphorus loading can be neglected.
A major difficulty encountered in using Vollenweider’s model is that it requires knowing
the net sedimentation rate of phosphorus once it enters the lake. This has proven to be a
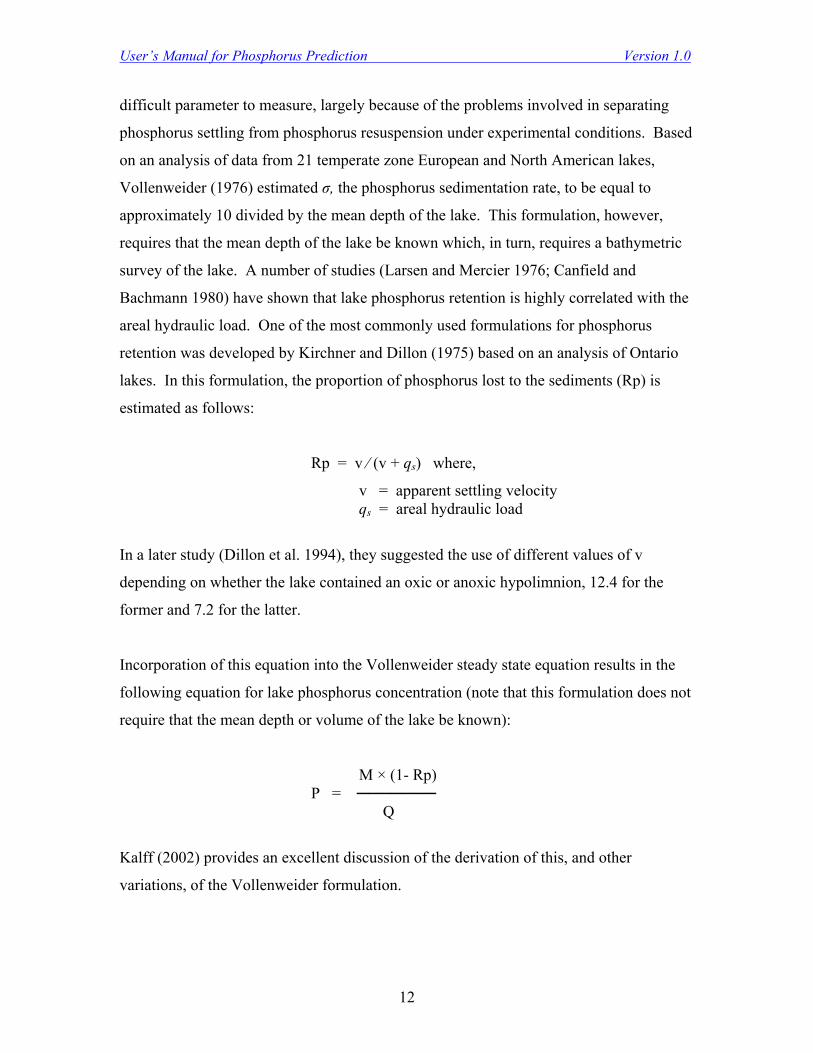
User’s Manual for Phosphorus Prediction Version 1.0
12
difficult parameter to measure, largely because of the problems involved in separating
phosphorus settling from phosphorus resuspension under experimental conditions. Based
on an analysis of data from 21 temperate zone European and North American lakes,
Vollenweider (1976) estimated σ, the phosphorus sedimentation rate, to be equal to
approximately 10 divided by the mean depth of the lake. This formulation, however,
requires that the mean depth of the lake be known which, in turn, requires a bathymetric
survey of the lake. A number of studies (Larsen and Mercier 1976; Canfield and
Bachmann 1980) have shown that lake phosphorus retention is highly correlated with the
areal hydraulic load. One of the most commonly used formulations for phosphorus
retention was developed by Kirchner and Dillon (1975) based on an analysis of Ontario
lakes. In this formulation, the proportion of phosphorus lost to the sediments (Rp) is
estimated as follows:
Rp = v ⁄ (v + qs) where,
v = apparent settling velocity qs = areal hydraulic load
In a later study (Dillon et al. 1994), they suggested the use of different values of v
depending on whether the lake contained an oxic or anoxic hypolimnion, 12.4 for the
former and 7.2 for the latter.
Incorporation of this equation into the Vollenweider steady state equation results in the
following equation for lake phosphorus concentration (note that this formulation does not
require that the mean depth or volume of the lake be known):
M × (1- Rp) P = ─────── Q
Kalff (2002) provides an excellent discussion of the derivation of this, and other
variations, of the Vollenweider formulation.

User’s Manual for Phosphorus Prediction Version 1.0
13
The general model formulations presented above have been widely used and applied
successfully to numerous lakes (Sas 1989). Dillon and Rigler (1975) were the first to
incorporate these formulations into what is commonly referred to as an export coefficient
model where the phosphorus loadings are estimated using phosphorus export coefficients
for the various land use characteristics of a lake’s drainage basin.
There are, however, certain types of lakes for which these formulations do not appear to
work well (Kalff 2002). These include: colored lakes having high concentrations of
humic substances; lakes that have a low nitrogen to phosphorous ratio and are more likely
to be limited by nitrogen rather than phosphorus; lakes that have high turbidity and are
more likely to be limited by light than nutrients; and lakes that are very shallow and have
short residence times (i.e. high flushing rates).
It should be noted that the time scale for models based on these formulations is one year
which means that the models can not be used to determine average lake phosphorus
concentrations for time periods shorter than this.
There are also numerous other assumptions and limitations associated with this model. In
some cases, modifications can be made to the model to deal with these. Some of these
limitations, and possible solutions for dealing with them, are discussed in the
Supplementary Technical Report contained in Appendix VI.
5. Model Format
The model is formatted as an Excel® workbook and has been designed so that all of the
data for a single lake is contained in a separate worksheet. Appendix I contains a sample
of the format. If the lake being modeled is a headwater lake, only one worksheet is
required. If the lake receives inputs from lakes located upstream, those lakes will also
have to be modeled, each as a separate worksheet.∗
* An exception to this would be if the upstream hydraulic and phosphorus loadings were already known.
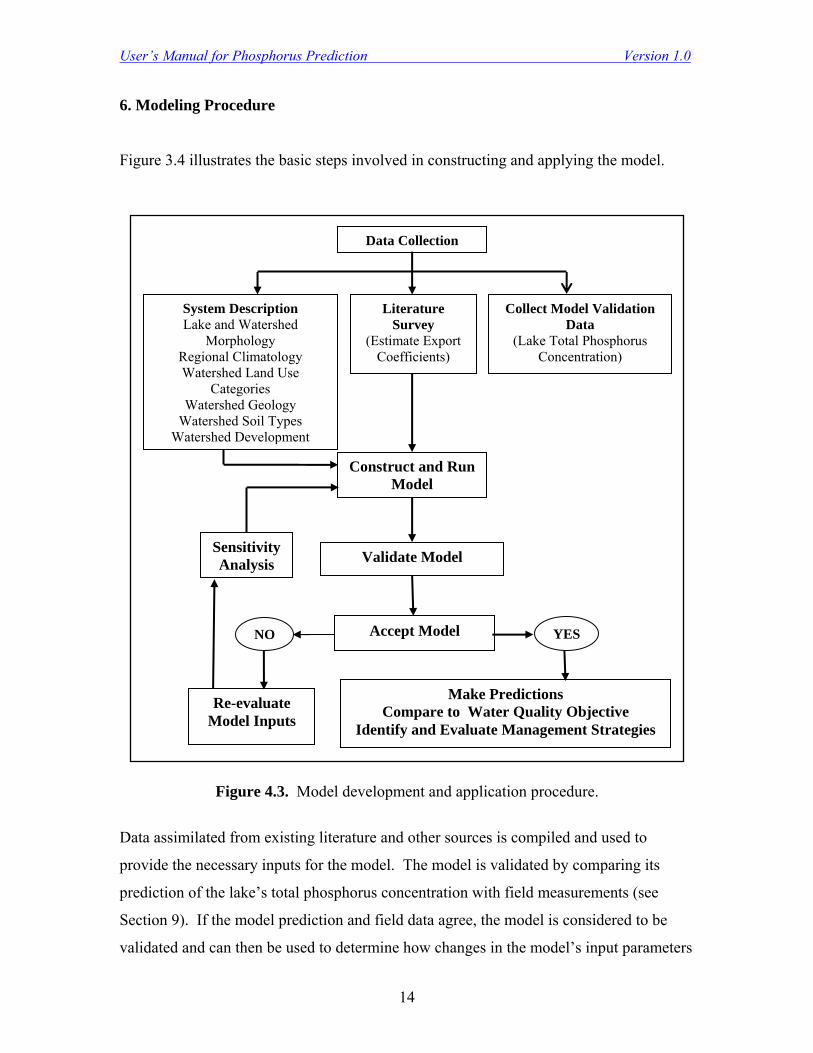
User’s Manual for Phosphorus Prediction Version 1.0
14
6. Modeling Procedure
Figure 3.4 illustrates the basic steps involved in constructing and applying the model.
Figure 4.3. Model development and application procedure.
Data assimilated from existing literature and other sources is compiled and used to
provide the necessary inputs for the model. The model is validated by comparing its
prediction of the lake’s total phosphorus concentration with field measurements (see
Section 9). If the model prediction and field data agree, the model is considered to be
validated and can then be used to determine how changes in the model’s input parameters
Data Collection
Literature Survey
(Estimate Export Coefficients)
Collect Model Validation Data
(Lake Total Phosphorus Concentration)
Construct and Run Model
Validate Model
Accept Model
Make Predictions Compare to Water Quality Objective
Identify and Evaluate Management Strategies
Re-evaluate Model Inputs
NO YES
Sensitivity Analysis
System Description Lake and Watershed
Morphology Regional Climatology Watershed Land Use
Categories Watershed Geology
Watershed Soil Types Watershed Development

User’s Manual for Phosphorus Prediction Version 1.0
15
will affect the lake’s total phosphorus concentration. If the model prediction and field
data do not agree, it will be necessary to review and re-evaluate the data used to estimate
the model inputs. In the latter case, it may prove useful to carry out a sensitivity analysis
of each model input (see Section 11).
7. Model Construction
7.1. Model Inputs
The information required to construct the model falls into three general categories: (1)
drainage basin and lake morphology characteristics; (2) hydraulic inputs; and (3)
phosphorous inputs. The specific parameters associated with each of these categories is
summarized in Table 7.1
A number of model inputs require estimation of surface areas. Examples include the
surface area of the lake, the surface area of the lake’s drainage basin and the surface areas
of soil, geology and land use types within the drainage basin. In the past, surface areas
have typically been measured using a planimeter. There are, however, other ways to
estimate surface areas. One of the best and often most precise are those that use
Geographic Information System (GIS) databases containing digital elevations and land
use characteristics. These are often available through Municipal and Provincial planning
agencies. If a GIS database is not available, it will be necessary to obtain maps
containing the necessary information and to estimate areas using planimetry.∗
There are also a number of image analysis programs that can be used to estimate surface
areas. They require a digital image of the area to be estimated, which may be available
from the same agencies that have GIS databases, or which can be obtained by digital
scanning of an aerial photographs or maps. One potential disadvantage is that the scale of
the image may be too small to obtain accurate results if the watershed or lake is large.
∗ Wetzel and Likens (1991) is an excellent source of information on planimetric procedures.

User’s Manual for Phosphorus Prediction Version 1.0
16
Appendix II contains a listing of agencies that can be contacted to obtain maps and other
data required to estimate model parameters.
Table 7.1. Model inputs.
Morphological Parameters Symbol Units Drainage Basin Area (exclusive of lake) Ad m2 Surface Area of Each Land Use Category Adi m2 Lake Surface Area Ao m2 Lake Volume V m3 Hydraulic Input Parameters Upstream Hydraulic Inputs Qi m3 yr-1 Annual Unit Precipitation Pr m yr-1 Annual Unit Lake Evaporation Ev m yr-1 Annual Unit Hydraulic Run Off Ru m yr-1 Phosphorus Input Parameters Upstream Phosphorus Input Ji gm yr-1 Annual Unit Atmospheric Phosphorus Deposition D gm m-2 yr-1 Annual Unit Phosphorus Export from Land* Ei gm m-2 yr-1 Number of Dwellings Nd # Average Number of Persons per Dwelling Nu # Average Fraction of Year Dwellings Occupied Npc yr-1 Phosphorus Input per Capita Year Si gm capita-1 yr-1 Septic System Retention Coefficient Rsp - Point Source Phosphorus Inputs PSi gm yr-1 Lake Phosphorus Retention Coefficient v -
*A separate estimate is required for each combination of geology, soil type and land use present in the drainage basin.
7.1.1. Morphology
7.1.1.1. Drainage Basin Area (Ad)
Estimation of the drainage basin area requires using a topographic map (typically at
scales of 1:10,000 or 1:50,000) to define the watershed boundary. The watershed
boundary is the area between the highest points of land and the outlet of the lake. This

User’s Manual for Phosphorus Prediction Version 1.0
17
area is outlined on the topographic map and then, by planimetry or some other available
method, the area of the drainage basin is estimated. Use of the largest scale map
available that includes the entire drainage basin will provide the most accurate estimates.
The surface area of the lake should not be included as part of the drainage basin area.
7.1.1.2. Surface Area of Each Land Use Category (Adi)
If the drainage basin of the lake contains more than one type of land use and/or varies in
geology and soil type, it will be necessary to estimate the surface area of each
combination of land use and soil type since these are likely to differ in their phosphorus
export coefficients.
7.1.1.3. Lake Surface Area (Ao)
The surface area of the lake is determined by planimetry using either aerial photographs,
topographic maps or GIS databases. In some cases this, and other lake morphological
characteristics, can be obtained from the Nova Scotia Department of Agriculture and
Fisheries Lake Survey database. The Province has surveyed almost 2000 lakes in Nova
Scotia and this information is readily available.
If the lake contains islands, the surface area of the islands should not be included as part
of the lake’s surface area, but should be included as part of the lake’s drainage basin.
7.1.1.4. Lake Volume (V)
Although the volume of the lake is not, in most cases, required to predict the lake’s
phosphorus concentration, it is required for calculation of the lake’s mean depth,
residence time, turnover rate and response time (see Section 7.2.3).
Determining the volume of the lake requires having a bathymetric map that shows the
area of the lake at each depth. This information is then used to construct a hypsographic
User’s Manual for Phosphorus Prediction Version 1.0
18
curve, which represents the change in surface area with depth. The area under the curve
is then integrated by planimetry to determine the volume of the lake. Alternatively, the
volume of the lake can be determined using the formula for either a truncated pyramid or
truncated cone (see Appendix V for an example).
7.1.2. Hydrology
7.1.2.1. Upstream Hydraulic Inputs (Qi)
If the lake being modeled is not a headwater lake, it will be necessary to determine the
hydraulic input from any upstream lakes that flow into the lake. Unless this is known
from field measurements of stream and river inflows into the lake, it will be necessary to
estimate the hydraulic input using the same procedures as for the lake being modeled.
7.1.2.2. Annual Unit Precipitation (Pr)
An estimate of the total annual precipitation, expressed on a square metre basis, is
required to account for the precipitation input that falls directly onto the lake. This
information can be obtained from the Canadian Climate Normals (see Appendix II).
Long-term averages (e.g., 20 year means) from the nearest weather station should be
used.
7.1.2.3. Annual Unit Lake Evaporation (Ev)
Evaporation from the surface of the lake is required to estimate the lake outflow. This
parameter is the evaporation rate per square metre per year. This information can be also
be obtained from the Canadian Climate Normals. As is the case for precipitation, long-
term averages should be used.
User’s Manual for Phosphorus Prediction Version 1.0
19
7.1.2.4. Annual Unit Hydraulic Run Off (Ru)
The average annual unit water run off is the amount of water, expressed as m yr-1, (this is
the same as m3 m-2 yr-1) that runs off the drainage basin and flows into the lake. It
represents net run off and is the difference between precipitation and evapotranspiration.
It should not include groundwater inputs to the lake.
Ideally, this should be estimated from direct measurements made at weirs located at the
inputs or outputs of the lake. This information, however, is seldom available and is
costly to obtain. In most cases, it will be necessary to estimate this parameter from other
studies. An isorunoff map for Nova Scotia is contained in Appendix III and can be used
to obtain a rough estimate when more precise data is unavailable.
7.1.3. Phosphorus Inputs
The most critical data input for the model is the phosphorus loading to the lake. This
includes both point source loadings, such as the effluent of sewage treatment plants and
storm sewers, and non-point inputs such as atmospheric deposition and surface run off
from forested and agricultural lands. Although direct measurement of phosphorus
loading to the lake would provide the most accurate data, this is often impractical to do
because of the effort and cost involved. In addition, if the model is to be used to predict
how the lake’s phosphorus concentration would change as a result of changes in land use,
it is essential that land use characteristics, and the amount of phosphorus run off
associated with each land use, be incorporated into the model.
7.1.3.1. Upstream Phosphorus Input (Ju)
If the lake being modeled is not a headwater lake, phosphorus inputs from streams and
rivers draining the watersheds and lakes located upstream must also be estimated (from
either field measurements or model estimates) in order to determine the total phosphorus
input to the lake.
User’s Manual for Phosphorus Prediction Version 1.0
20
7.1.3.2. Annual Unit Atmospheric Phosphorus Deposition (Da)
Atmospheric deposition includes dry deposition of particulate phosphorus transported by
wind to the lake, and wet deposition of phosphorus dissolved in the precipitation falling
directly onto the lake. Estimates of the dryfall portion are often 70 to 90 % of the total
deposition (Likens and Loucks 1978). Sources of phosphorus transported to a lake by
atmospheric deposition can originate outside of the lake’s watershed. Atmospheric
deposition tends to be highest in areas surrounding agricultural lands as a result of wind
erosion of fertilized soils, and within urban areas as a result of the fly ash produced by
burning of fossil fuels.
There have been very few measurements of atmospheric phosphorus deposition for Nova
Scotia. Studies by Hart (1977), Hart et al. (1978) and Thirumurthi and Hart (1985)
carried out in the Halifax area and the headwater region of the Shubenacadie River
watershed suggest that a value of 0.025 gm m-2 yr-1 is a reasonable estimate for Nova
Scotia. Lowe (2002) estimated a value of 0.014 gm m-2 yr-1 for the Wolfville area. The
lower value may be related to differences in the relative degree of urban development.
Measurements made by Underwood (1984) for various areas in Nova Scotia suggest an
average value of about 0.017 gm m-2 yr-1.
7.1.3.3. Annual Unit Phosphorus Export from Land (Ei)
The export of phosphorus from the land is expressed as an export coefficient which is the
amount of phosphorus carried into the lake by surface water run off, expressed as gm per
square metre per year. The value of export coefficients vary depending on geology, soil
type and land use and require analyzing the drainage basin of the lake to determine what
combination of these characteristics it possesses. Phosphorus export coefficients are
often the most difficult model parameter to estimate because of the diversity of climate,
geology, soil type and land use activity that can occur in a watershed.
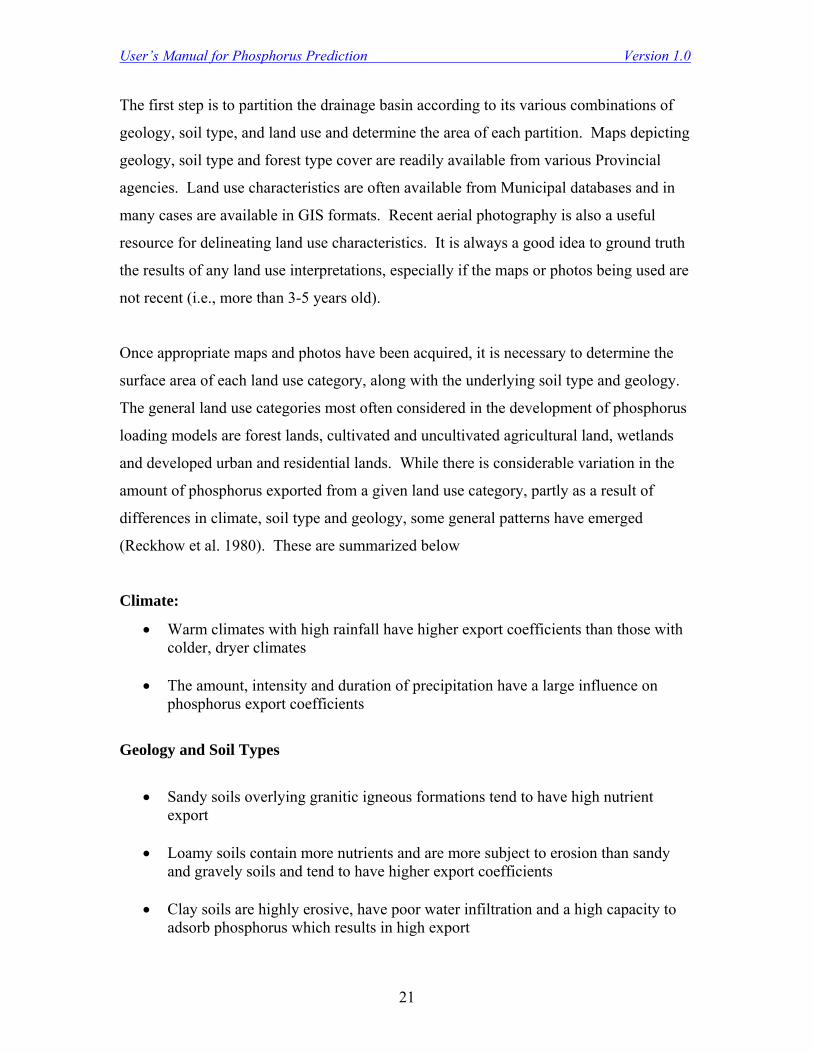
User’s Manual for Phosphorus Prediction Version 1.0
21
The first step is to partition the drainage basin according to its various combinations of
geology, soil type, and land use and determine the area of each partition. Maps depicting
geology, soil type and forest type cover are readily available from various Provincial
agencies. Land use characteristics are often available from Municipal databases and in
many cases are available in GIS formats. Recent aerial photography is also a useful
resource for delineating land use characteristics. It is always a good idea to ground truth
the results of any land use interpretations, especially if the maps or photos being used are
not recent (i.e., more than 3-5 years old).
Once appropriate maps and photos have been acquired, it is necessary to determine the
surface area of each land use category, along with the underlying soil type and geology.
The general land use categories most often considered in the development of phosphorus
loading models are forest lands, cultivated and uncultivated agricultural land, wetlands
and developed urban and residential lands. While there is considerable variation in the
amount of phosphorus exported from a given land use category, partly as a result of
differences in climate, soil type and geology, some general patterns have emerged
(Reckhow et al. 1980). These are summarized below
Climate:
• Warm climates with high rainfall have higher export coefficients than those with colder, dryer climates
• The amount, intensity and duration of precipitation have a large influence on
phosphorus export coefficients
Geology and Soil Types
• Sandy soils overlying granitic igneous formations tend to have high nutrient
export
• Loamy soils contain more nutrients and are more subject to erosion than sandy and gravely soils and tend to have higher export coefficients
• Clay soils are highly erosive, have poor water infiltration and a high capacity to
adsorb phosphorus which results in high export
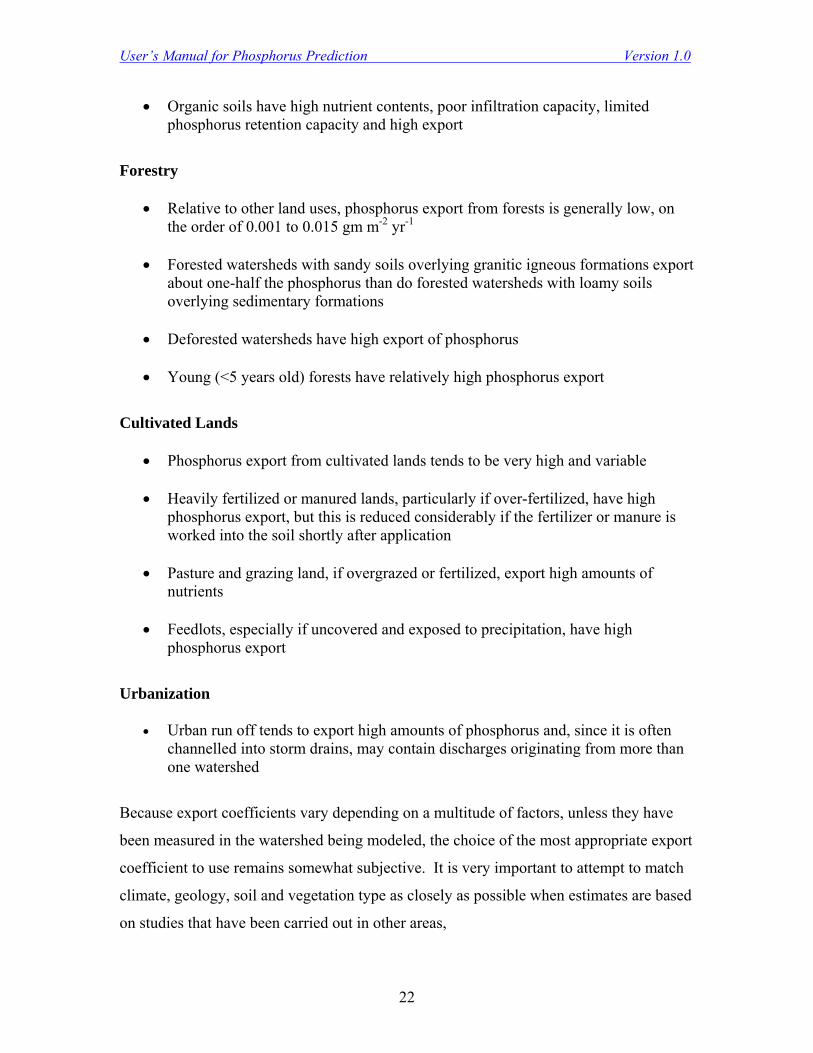
User’s Manual for Phosphorus Prediction Version 1.0
22
• Organic soils have high nutrient contents, poor infiltration capacity, limited phosphorus retention capacity and high export
Forestry
• Relative to other land uses, phosphorus export from forests is generally low, on the order of 0.001 to 0.015 gm m-2 yr-1
• Forested watersheds with sandy soils overlying granitic igneous formations export
about one-half the phosphorus than do forested watersheds with loamy soils overlying sedimentary formations
• Deforested watersheds have high export of phosphorus
• Young (<5 years old) forests have relatively high phosphorus export
Cultivated Lands
• Phosphorus export from cultivated lands tends to be very high and variable
• Heavily fertilized or manured lands, particularly if over-fertilized, have high phosphorus export, but this is reduced considerably if the fertilizer or manure is worked into the soil shortly after application
• Pasture and grazing land, if overgrazed or fertilized, export high amounts of
nutrients
• Feedlots, especially if uncovered and exposed to precipitation, have high phosphorus export
Urbanization
• Urban run off tends to export high amounts of phosphorus and, since it is often channelled into storm drains, may contain discharges originating from more than one watershed
Because export coefficients vary depending on a multitude of factors, unless they have
been measured in the watershed being modeled, the choice of the most appropriate export
coefficient to use remains somewhat subjective. It is very important to attempt to match
climate, geology, soil and vegetation type as closely as possible when estimates are based
on studies that have been carried out in other areas,
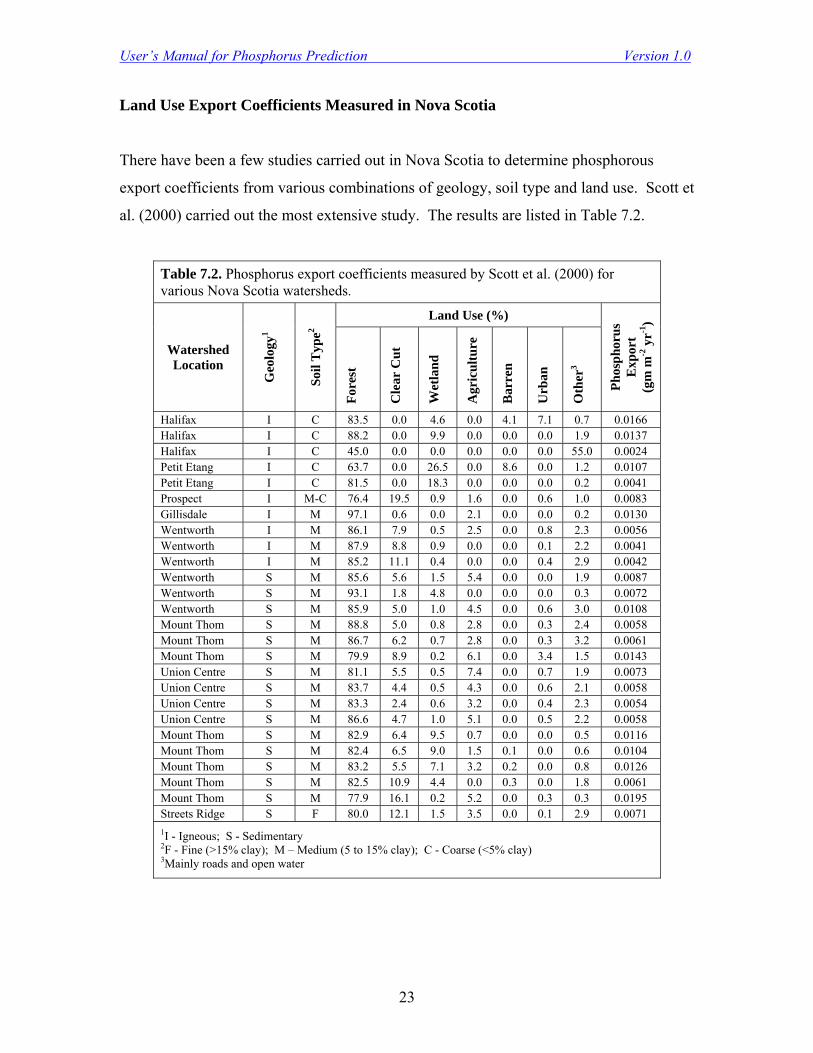
User’s Manual for Phosphorus Prediction Version 1.0
23
Land Use Export Coefficients Measured in Nova Scotia
There have been a few studies carried out in Nova Scotia to determine phosphorous
export coefficients from various combinations of geology, soil type and land use. Scott et
al. (2000) carried out the most extensive study. The results are listed in Table 7.2.
Table 7.2. Phosphorus export coefficients measured by Scott et al. (2000) for various Nova Scotia watersheds.
Land Use (%)
Watershed Location
Geo
logy
1
Soil
Typ
e2
Fore
st
Cle
ar C
ut
Wet
land
Agr
icul
ture
Bar
ren
Urb
an
Oth
er3
Phos
phor
us
Exp
ort
(gm
m-2
yr-1
)
Halifax I C 83.5 0.0 4.6 0.0 4.1 7.1 0.7 0.0166 Halifax I C 88.2 0.0 9.9 0.0 0.0 0.0 1.9 0.0137 Halifax I C 45.0 0.0 0.0 0.0 0.0 0.0 55.0 0.0024 Petit Etang I C 63.7 0.0 26.5 0.0 8.6 0.0 1.2 0.0107 Petit Etang I C 81.5 0.0 18.3 0.0 0.0 0.0 0.2 0.0041 Prospect I M-C 76.4 19.5 0.9 1.6 0.0 0.6 1.0 0.0083 Gillisdale I M 97.1 0.6 0.0 2.1 0.0 0.0 0.2 0.0130 Wentworth I M 86.1 7.9 0.5 2.5 0.0 0.8 2.3 0.0056 Wentworth I M 87.9 8.8 0.9 0.0 0.0 0.1 2.2 0.0041 Wentworth I M 85.2 11.1 0.4 0.0 0.0 0.4 2.9 0.0042 Wentworth S M 85.6 5.6 1.5 5.4 0.0 0.0 1.9 0.0087 Wentworth S M 93.1 1.8 4.8 0.0 0.0 0.0 0.3 0.0072 Wentworth S M 85.9 5.0 1.0 4.5 0.0 0.6 3.0 0.0108 Mount Thom S M 88.8 5.0 0.8 2.8 0.0 0.3 2.4 0.0058 Mount Thom S M 86.7 6.2 0.7 2.8 0.0 0.3 3.2 0.0061 Mount Thom S M 79.9 8.9 0.2 6.1 0.0 3.4 1.5 0.0143 Union Centre S M 81.1 5.5 0.5 7.4 0.0 0.7 1.9 0.0073 Union Centre S M 83.7 4.4 0.5 4.3 0.0 0.6 2.1 0.0058 Union Centre S M 83.3 2.4 0.6 3.2 0.0 0.4 2.3 0.0054 Union Centre S M 86.6 4.7 1.0 5.1 0.0 0.5 2.2 0.0058 Mount Thom S M 82.9 6.4 9.5 0.7 0.0 0.0 0.5 0.0116 Mount Thom S M 82.4 6.5 9.0 1.5 0.1 0.0 0.6 0.0104 Mount Thom S M 83.2 5.5 7.1 3.2 0.2 0.0 0.8 0.0126 Mount Thom S M 82.5 10.9 4.4 0.0 0.3 0.0 1.8 0.0061 Mount Thom S M 77.9 16.1 0.2 5.2 0.0 0.3 0.3 0.0195 Streets Ridge S F 80.0 12.1 1.5 3.5 0.0 0.1 2.9 0.0071 1I - Igneous; S - Sedimentary 2F - Fine (>15% clay); M – Medium (5 to 15% clay); C - Coarse (<5% clay) 3Mainly roads and open water

User’s Manual for Phosphorus Prediction Version 1.0
24
In a summary of their results, Scott et al. (2000) suggest the following general export
values:
• Igneous Forested Watersheds – 0.0069 gm m-2 yr-1
• Igneous Forested Watersheds with >15% cleared/wetland – 0.0083 gm m-2 yr-1
• Sedimentary Forested Watersheds – 0.0088 gm m-2 yr-1
• Sedimentary Forested Watersheds with >5% cleared/wetland – 0.0115 gm m-2 yr-1
Lowe (2002) carried out a similar study for a number of stream catchments located in the
Gaspereau River watershed. The estimated phosphorus export coefficients (Table 7.3)
are considerably higher than those reported by Scott et al. (2000). The difference may be
related to the highly colored waters typical of the lower reaches of the Gaspereau
watershed where the study was carried out.
Table 7.3. Phosphorus export coefficients measured by Lowe (2002) for watersheds located in the Gaspereau River system, Kings County, Nova Scotia.
Land Use (%) Geology Soil Type
Forest Clearcut Wetland Agriculture
Phosphorus
Export (gm m-2 yr-1)
Igneous Coarse 99 0 1 0 0.0327 Igneous Coarse 85 15 0 0 0.0634 Igneous Medium Coarse 80 14 0 6 0.0304 Sedimentary Medium Fine 79 3 0 18 0.0354 Sedimentary Medium Fine 80 4 0 16 0.0408 Sedimentary Medium Fine 89 4 3 4 0.0213 Sedimentary Fine/Coarse 98 1 0 1 0.0191 Sedimentary Medium Fine 74 4 0 22 0.0311 Sedimentary Medium Fine 72 8 0 20 0.0321 Igneous Fine/Coarse 69 6 2 23 0.0624
Some phosphorus export coefficient estimates are also available for Maine which has
similar climate, geological and soil characteristics to Nova Scotia. The following export
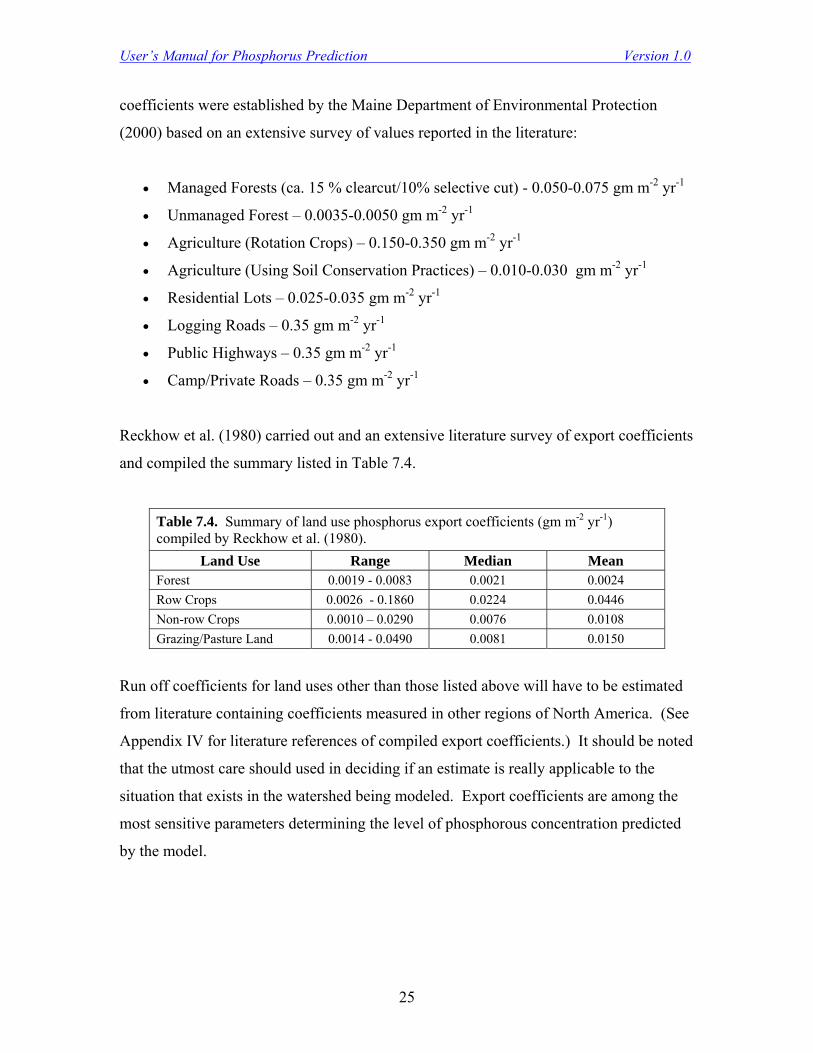
User’s Manual for Phosphorus Prediction Version 1.0
25
coefficients were established by the Maine Department of Environmental Protection
(2000) based on an extensive survey of values reported in the literature:
• Managed Forests (ca. 15 % clearcut/10% selective cut) - 0.050-0.075 gm m-2 yr-1
• Unmanaged Forest – 0.0035-0.0050 gm m-2 yr-1
• Agriculture (Rotation Crops) – 0.150-0.350 gm m-2 yr-1
• Agriculture (Using Soil Conservation Practices) – 0.010-0.030 gm m-2 yr-1
• Residential Lots – 0.025-0.035 gm m-2 yr-1
• Logging Roads – 0.35 gm m-2 yr-1
• Public Highways – 0.35 gm m-2 yr-1
• Camp/Private Roads – 0.35 gm m-2 yr-1
Reckhow et al. (1980) carried out and an extensive literature survey of export coefficients
and compiled the summary listed in Table 7.4.
Table 7.4. Summary of land use phosphorus export coefficients (gm m-2 yr-1) compiled by Reckhow et al. (1980).
Land Use Range Median Mean Forest 0.0019 - 0.0083 0.0021 0.0024 Row Crops 0.0026 - 0.1860 0.0224 0.0446 Non-row Crops 0.0010 – 0.0290 0.0076 0.0108 Grazing/Pasture Land 0.0014 - 0.0490 0.0081 0.0150
Run off coefficients for land uses other than those listed above will have to be estimated
from literature containing coefficients measured in other regions of North America. (See
Appendix IV for literature references of compiled export coefficients.) It should be noted
that the utmost care should used in deciding if an estimate is really applicable to the
situation that exists in the watershed being modeled. Export coefficients are among the
most sensitive parameters determining the level of phosphorous concentration predicted
by the model.
User’s Manual for Phosphorus Prediction Version 1.0
26
Urban Run Off
Urban areas typically have a high run off of phosphorus. Sources include run off from
pavement (roads, parking lots and driveways) and lawns and leaf fall.
Reckhow et al. (1980) list a wide variety of export coefficients for urban areas, ranging
from 0.0019 to 0.0623 gm m-2 yr-1. The lowest values were for areas of low density
housing and the highest for high density housing areas.
Waller and Hart (1986) estimated surface run off from urban areas in Ontario to be about
0.11 gm m-2 yr-1. They also presented the following estimates for impervious urban areas
in Halifax:
Residential/Vegetation/Low Traffic 0.186 gm m-2 yr-1
Commercial/No Vegetation/High Traffic 0.202 gm m-2 yr-1
Commercial/Vegetation/Moderately High Traffic 0.398 gm m-2 yr-1
Institutional/No Vegetation/Low Traffic 0.042 gm m-2 yr-1
7.1.3.4. Development Inputs (Nd, Nu, Npc, Si, Rsp)
Development input is the amount of phosphorus supplied to the lake from the human
population present in the watershed. It is based on a determination of the number of
capita-years in the watershed, the amount of phosphorus produced per capita and the
proportion of the phosphorus produced that enters the lake. It also includes point source
inputs of phosphorus. Although some of this information may be available from local
planning offices, it will most likely have to be gathered from surveys. The information
required to estimate the number of capita-years is as follows:
• Nd - the number of dwelling units within 300 m of the shoreline of
the lake and any tributaries that enter into the lake
• Nu - the average number of people occupying the dwellings
• Npc - the average fraction of the year each dwelling is occupied

User’s Manual for Phosphorus Prediction Version 1.0
27
The amount of phosphorus produced per capita (Si) depends on the nature of the activities
of the population residing in the watershed, and whether the residences are simple
recreational cottages or full time residences. Factors such as the use of fertilizer for
gardening and lawn maintenance, use of phosphate based detergents and prevalence of
garbage grinders are some of the factors that should be considered. Estimates of the
amount of phosphorus inputs to septic systems range from as low as 300 to as high as
1800 gm P capita-1 year-1 (Uttormark 19 74; Reckhow et al.1980), the higher values being
for areas where phosphate detergents are used. A commonly used estimate in many
models is 800 gm P capita-1 yr-1 (Dillon et al. 1986).
The final parameter required to estimate phosphorus input from residential development
is a measure of the adsorption capacity (Rsp) of the soils in which the septic systems are
located. This depends on factors such as the age of the septic system, the frequency of
maintenance, the physical and chemical characteristics of the soil surrounding the system,
and the degree to which the system interacts with the water table. Hart et al. (1978)
estimated that septic systems on Halifax and Wolfville soils retained about 50% of the
phosphorus input to septic systems. In instances where the model is being used to make
conservative predictions of the potential long-term consequences of residential
development, the septic system retention coefficient is often assumed to equal zero (see
e.g., Horner Associates Ltd. 1995).
7.1.3.5. Point Source Inputs (PSi)
The previous discussion of phosphorus loading has dealt with non-point sources of
phosphorus. There are a number of potential point sources of phosphorus that also need
to be considered. Examples include inputs from sewage treatment plants, livestock
feedlots and aquaculture operations.
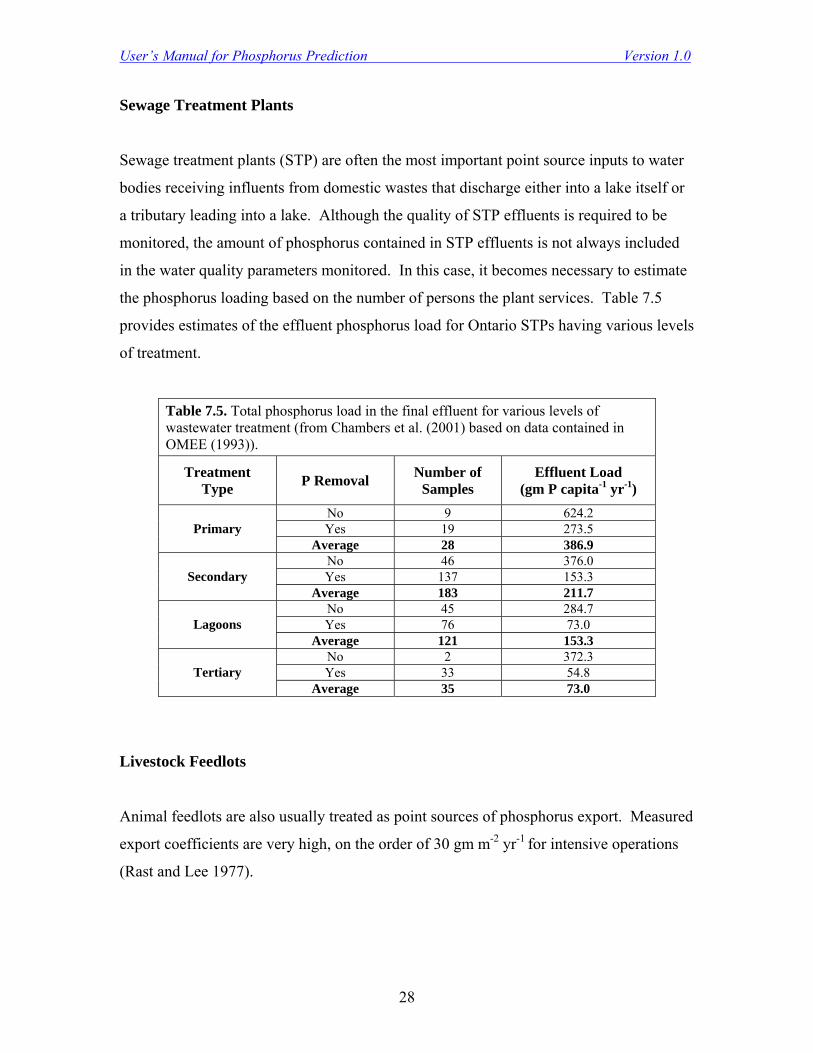
User’s Manual for Phosphorus Prediction Version 1.0
28
Sewage Treatment Plants
Sewage treatment plants (STP) are often the most important point source inputs to water
bodies receiving influents from domestic wastes that discharge either into a lake itself or
a tributary leading into a lake. Although the quality of STP effluents is required to be
monitored, the amount of phosphorus contained in STP effluents is not always included
in the water quality parameters monitored. In this case, it becomes necessary to estimate
the phosphorus loading based on the number of persons the plant services. Table 7.5
provides estimates of the effluent phosphorus load for Ontario STPs having various levels
of treatment.
Table 7.5. Total phosphorus load in the final effluent for various levels of wastewater treatment (from Chambers et al. (2001) based on data contained in OMEE (1993)).
Treatment Type P Removal Number of
Samples Effluent Load
(gm P capita-1 yr-1) No 9 624.2 Yes 19 273.5 Primary
Average 28 386.9 No 46 376.0 Yes 137 153.3 Secondary
Average 183 211.7 No 45 284.7 Yes 76 73.0 Lagoons
Average 121 153.3 No 2 372.3 Yes 33 54.8 Tertiary
Average 35 73.0
Livestock Feedlots
Animal feedlots are also usually treated as point sources of phosphorus export. Measured
export coefficients are very high, on the order of 30 gm m-2 yr-1 for intensive operations
(Rast and Lee 1977).
User’s Manual for Phosphorus Prediction Version 1.0
29
Aquaculture Operations
Inland aquaculture operations are also potential point sources of phosphorus. Within
Nova Scotia, salmonid aquaculture is most common. The amount of phosphorus
exported depends mainly on the type and amount of food used. For salmonids, current
operations use high nutrient dense feeds which contain about 1% phosphorus by weight,
of which approximately one-third is assimilated by the fish and two-thirds is exported in
the effluent (personal communication; J. Blanchard, Nova Scotia Department of
Agriculture and Fisheries). It is therefore possible to estimate the total amount of
phosphorus exported based on the amount of food used.
7.1.3.6. Lake Phosphorus Retention Coefficient (v)
The amount of phosphorus retained within the lake as a result of phosphorus settling to
the sediments requires an estimate of the phosphorus retention coefficient (see Section 4
for the coefficients developed by Dillon et al (1986).

User’s Manual for Phosphorus Prediction Version 1.0
30
7.2. Model Outputs
The outputs of the model are listed in Table 7.6.
Table 7.6. Model outputs. Parameter Symbol Units
Total Precipitation Hydraulic Input Ppti m3 yr-1 Total Evaporation Hydraulic Loss Eo m3 yr-1 Total Hydraulic Surface Run Off Ql m3 yr-1 Total Hydraulic Input Qt m3 yr-1 Areal Hydraulic Load qs m yr-1 Total Hydraulic Outflow Qo m3 yr-1 Atmospheric Phosphorus Input Jd gm yr-1 Surface Run Off Phosphorus Input Je gm yr-1 Development Phosphorus Input Jr gm yr-1 Total Phosphorus Input Jt gm yr-1 Lake Phosphorus Retention Factor Rp - Lake Phosphorus Retention Ps gm yr-1 Lake Phosphorus Concentration [P] mg L-1 Total Phosphorus Outflow Jo gm yr-1 Lake Mean Depth z m Lake Flushing Rate FR times yr-1 Lake Turnover Time TT yr Lake Response Time RT(1/2) yr
7.2.1. Hydrology
7.2.1.1. Total Precipitation Hydraulic Input (Ppti)
The total amount of precipitation input to the lake is calculated as follows:
Ppti = Ao × Pr where,
Ao = Lake Surface Area Pr = Annual Unit Precipitation
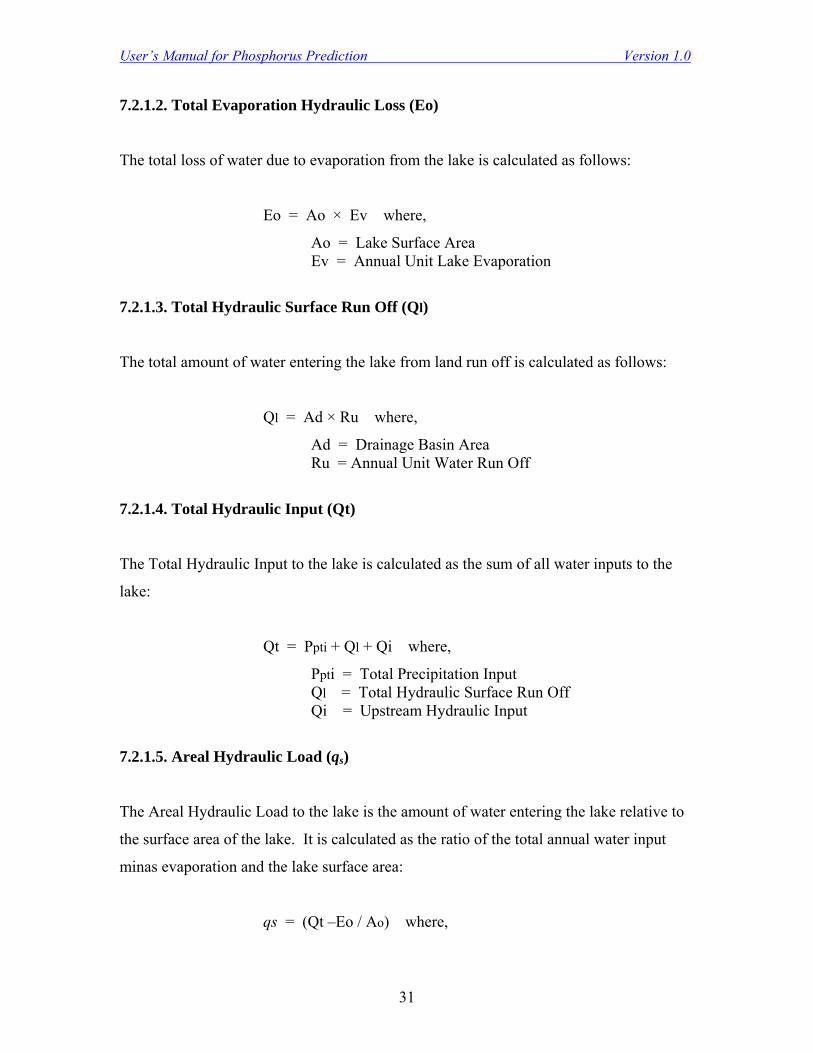
User’s Manual for Phosphorus Prediction Version 1.0
31
7.2.1.2. Total Evaporation Hydraulic Loss (Eo)
The total loss of water due to evaporation from the lake is calculated as follows:
Eo = Ao × Ev where,
Ao = Lake Surface Area Ev = Annual Unit Lake Evaporation
7.2.1.3. Total Hydraulic Surface Run Off (Ql)
The total amount of water entering the lake from land run off is calculated as follows:
Ql = Ad × Ru where,
Ad = Drainage Basin Area Ru = Annual Unit Water Run Off
7.2.1.4. Total Hydraulic Input (Qt)
The Total Hydraulic Input to the lake is calculated as the sum of all water inputs to the
lake:
Qt = Ppti + Ql + Qi where,
Ppti = Total Precipitation Input Ql = Total Hydraulic Surface Run Off Qi = Upstream Hydraulic Input
7.2.1.5. Areal Hydraulic Load (qs)
The Areal Hydraulic Load to the lake is the amount of water entering the lake relative to
the surface area of the lake. It is calculated as the ratio of the total annual water input
minas evaporation and the lake surface area:
qs = (Qt –Eo / Ao) where,
User’s Manual for Phosphorus Prediction Version 1.0
32
Qt = Total Hydraulic Input Eo = Evaporation Hydraulic Loss Ao = Lake Surface Area
7.2.1.6. Total Hydraulic Outflow (Qo)
The Total Annual Hydraulic Outflow is calculated as the Total Hydraulic Input minus
Evaporation for the lake surface:
Qo = Qt – Eo where,
Qt = Total Hydraulic Input Eo = Evaporation Loss
7.2.2. Phosphorus
7.2.2.1. Atmospheric Phosphorus Input (Jd)
The Atmospheric Phosphorus Input is calculated as the product of the Annual Unit
Atmospheric Deposition and the Lake Surface Area:
Jd = D × Ao where,
D = Annual Unit Atmospheric Deposition Ao = Lake Surface Area
7.2.2.2. Total Surface Run Off Phosphorus Input (Je)
The Total Surface Run Off Phosphorus Input is the sum of all the phosphorus export from
each land use class:
Je = Adi × Ei where,
Adi = Area of land use i Ei = Annual unit phosphorous export from land use i
User’s Manual for Phosphorus Prediction Version 1.0
33
7.2.2.3. Development Phosphorus Input (Jr)
The Development Phosphorus Input is the sum of phosphorus inputs from all point
sources and dwellings within the lake’s drainage basin:
Jr = Σ PSi + (Nd × Nu × Npc × Si × (1 – Rsp)) where,
PSi = Total phosphorus input from Point Source i Nd = Number of dwellings in the drainage basin Nu = Average number of persons occupying each dwelling Npc = Average fraction of the year dwelling are occupied Si = Phosphorus load per capita year Rsp = Septic system retention coefficient
7.2.2.4. Total Phosphorus Input (Jt)
The Total Phosphorus Input is the sum of all phosphorus inputs to the lake. These
include upstream phosphorus input, atmospheric phosphorus deposition, phosphorus
surface run off, and phosphorus inputs due to development:
Jt = Ji + Jd + Je + Jr where,
Ji = Upstream Phosphorus Input Jd = Atmospheric Phosphorus Input Je = Surface Run Off Phosphorus Input Jr = Development Phosphorus Input
7.2.2.5. Lake Phosphorus Retention Factor (Rp)
The Lake Phosphorus Retention Factor is the fraction of phosphorus entering the lake that
is lost by settling to the sediments:
Rp = v ⁄ (v + qs) where,
v = Phosphorus Retention Coefficient1 qs = Areal Hydraulic Load
1 12.4 for lakes with an oxic hypolimnion and 7.2 for lakes with an anoxic hypolimnion
User’s Manual for Phosphorus Prediction Version 1.0
34
7.2.2.6. Lake Phosphorus Retention (Ps)
The amount of phosphorus that is retained in the lake as a result of being lost to the
sediments is calculated from the Total Phosphorus Input and the Phosphorus Retention
Factor:
Ps = Jt × Rp where,
Jt = Total Phosphorus Input Rp = Phosphorus Retention Factor
7.2.2.7. Lake Phosphorus Concentration ([P])
The Lake Phosphorus Concentration is calculated as the Total Phosphorus Input minus
the amount lost to sedimentation divided by the Total Hydraulic Outflow:
[P] = (Jt - Ps) ⁄ Qo) where,
Jt = Total Phosphorus Input Ps = Phosphorus Retention Qo = Total Hydraulic Outflow
7.2.2.8. Lake Phosphorus Outflow (Jo)
The amount of phosphorus that flows out of the lake is the difference between the total
phosphorus input and the amount of phosphorus retained by the lake as a result of settling
to the sediments:
Jo = Jt – Ps where,
Jt = Total Phosphorus Input Ps = Lake Phosphorus Retention
User’s Manual for Phosphorus Prediction Version 1.0
35
7.2.3. Lake Characterization Parameters
The following parameters essentially characterize the lake’s hydraulic characteristics and
can be important in determining the choice of formulations to use for calculation of
phosphorus retention. They all require that the volume of the lake be known.
7.2.3.1. Mean Depth (z)
The Mean Depth of the lake is calculated as the ratio of the surface area and volume of
the lake:
z = Ao ⁄ V where,
Ao = Lake Surface Area V = Lake Volume
7.2.3.2. Flushing Rate (FR)
The Flushing Rate is the number of times a volume of water equal to the volume of the
lake flows through the lake per year. It is calculated as:
FR = Qo ⁄ V where,
Qo = Total Hydraulic Outflow V = Lake Volume
7.2.3.3. Turnover Time (TT)
The Turnover (or residence) Time of a lake is the average amount of time that water
remains in the lake. It is the reciprocal of the lake’s flushing rate and is calculated as
follows:
TT = V ⁄ Qo where,
V = Lake Volume Qo = Total Hydraulic Outflow

User’s Manual for Phosphorus Prediction Version 1.0
36
The longer the residence time, the greater the amount of phosphorus that will be subject
to sedimentation and lost to the sediments.
7.2.3.4. Response Time (RT(1/2))
The Response Time of a lake is a measure of the time it would take for the lake to
respond to a change in its phosphorus loading. Response time is a function of the lake’s
flushing rate and is independent of either the lake’s phosphorus load or content. Because
the rate at which a substance is accumulated or removed from a lake is a logarithmetic
function, response time is usually expressed as the time it would take to increase or
reduce the concentration of a substance by one-half and can be estimated by the
following equation (Dillon and Rigler 1975):
RT(1/2) = 0.69 / (FR + 10 ⁄ z) where,
FR = Flushing Rate of the lake z = Mean Depth of the lake
It should be noted that this formulation does not consider the case where a significant
portion of the phosphorus within the water column of the lake is a result of internal
loading (i.e., the resuspension of phosphorus that has been accumulated within the
sediments of the lake).
8. Entering Data
Entering the data into the Excel spreadsheets is quite straight forward for most of the
input parameters. The only potential difficulty that may be encountered is in the case
where more than one upstream input enters the lake. In this instance, it will be necessary
to develop a customized formula for the Excel cells to sum all of the upstream water and
phosphorus inputs. It is also important to zero out any inputs listed on the spreadsheet
that may not be applicable for the lake being modeled.
User’s Manual for Phosphorus Prediction Version 1.0
37
9. Model Validation
Validation of the model is necessary before it can be used with confidence for prediction
and as a basis for making policy decisions. Model validation simply involves comparing
the model’s prediction with data collected in the field. As a general rule, the model can
be considered valid if the model prediction and field measurements of phosphorus
concentration do not differ by more than about 20%, a value that is considered to reflect
the confidence limits of most field and laboratory measurements2. It is important to
realize that the model is likely to have been constructed using parameter estimates that
are averages of many years, and that the validation data should also be representative of
an average year. Mean annual lake phosphorus concentrations can vary considerably
from year to year and it is necessary to collect the validation data over a number of years
to determine a reasonable average. Although the number of years required is debatable,
most believe that it should be somewhere between five and ten years. Hutchinson (2002)
provides a number of suggestions for the design of monitoring programs in instances
when limited resources are available. He suggests that, at minimum, the following data
should be collected:
• An annual spring overturn measurement of total phosphorus,
• Biweekly measurements of Secchi Disk depth during the summer,
• An annual determination of a dissolved oxygen profile at the end of the
summer and prior to fall turnover.
It would also be wise to collect water samples for determination of chlorophyll a
concentrations on at least a bimonthly basis.
9.1 Protocol for Collection of Validation Data
The Nova Scotia Department of Environment and Labour (1999) has produced a manual
that provides details of the protocols for collecting water samples for validation data.
2 This criteria, however, may be difficult to meet for lakes having phosphorus concentrations near to the limit of analytical detection.
User’s Manual for Phosphorus Prediction Version 1.0
38
Although the manual was specifically developed for a volunteer water quality monitoring
program carried out in Kings County of the Annapolis Valley, the protocols described are
generic and applicable to any water quality monitoring program. This manual should be
consulted in designing the validation data sampling program.
The manual assumes that the analysis of field samples will be done at an accredited
laboratory having the capability of processing samples for water quality, and especially
for carrying out total phosphorus analyses at a detection limit of 0.001 mg L-1.
10. Model Re-evaluation
If the model does not predict well when compared to the validation data, it must be re-
evaluated. Re-evaluation involves assessing each input parameter in terms of its
accuracy. It may also require that the processes incorporated into the model be re-
evaluated. For example, if the lake is stratified it may be necessary to alter the way in
which sedimentation rate is modeled.
11. Sensitivity Analysis
Carrying out a sensitivity analysis can be quite insightful in terms of understanding which
factors exert the most influence in determining the level of phosphorus predicted by the
model. It is also useful in determining where the greatest effort should be placed in
refining the model if it does not meet the validation criteria. As an example, a sensitivity
analysis of the Gaspereau River watershed model indicated that the prediction of
phosphorus concentration was most sensitive to the phosphorus land run off coefficients
and the lake phosphorus retention coefficient.
The general procedure for carrying out a sensitivity analysis is to alter the value of each
model input parameter by a constant percentage while holding all other parameters

User’s Manual for Phosphorus Prediction Version 1.0
39
constant, and then determining the percent change in the model’s predictions. A factor of
ten percent is typically used and, because there is some non-linearity in the model, it is
always a good idea to both increase and decrease the input. In some cases, such as
inputs related to precipitation, it may be instructive to alter the input parameter by a
factor that corresponds to how much the parameter is known to vary on an annual basis.
12. Acknowledgements
Funding to develop this User’s Manual was provided by the Nova Scotia Department of
Environment and Labour, the Nova Scotia Department of Natural Resources, the Nova
Scotia Department of Transportation and Public Works, and Environment Canada. The
manual was developed under the direction of the following members of the Nova Scotia
Water Quality Objectives and Model Development Steering Committee:
Darrell Taylor Environmental Analyst, Committee Chair Nova Scotia Department of Environment and Labour Andrew Bagnall Supervisor of Extension Services Nova Scotia Department of Agriculture and Fisheries Anthony Blouin Manager, Environmental Policy Environmental Management Services Halifax Regional Municipality David Briggins Manager, Water and Wastewater Branch Nova Scotia Department of Environment and Labour Graham Fisher Watershed Planner Nova Scotia Department of Environment and Labour John Gibb Regional Hydrogeologist Integration and Interpretation Section Environment Canada Robert Gordon Associate Professor, Resource Stewardship Department of Agriculture Engineering Nova Scotia Agricultural College William Hart Director Centre for Water Resources Studies, Dalhousie University

User’s Manual for Phosphorus Prediction Version 1.0
40
Joseph Kerekes Scientist Emeritus, Conservation and Protection Branch Environment Canada Scott Lister Watershed Planner Nova Scotia Department of Environment and Labour Jonathan Lowe Fisheries Representative Nova Scotia Department of Agriculture and Fisheries Michael MacIntyre Senior Planner, Community Planning Department Municipality of Kings County John MacMillan Fisheries Biologist Recreational Fisheries Nova Scotia Department of Agriculture and Fisheries Alan McNeill Aquaculture Coordinator Nova Scotia Department of Agriculture and Fisheries Vincent Mercier Environmental Indicator and Reporting Specialist Environment Canada Randy Milton Manager, Wildlife Resources Nova Scotia Department of Natural Resources Jordan Mooers Hydrogeologist Nova Scotia Department of Transportation and Public Works Richard Scott Senior Research Associate Centre for Water Resources Studies, Dalhousie University Wesley White Biologist (retired), Science Branch Department of Fisheries and Oceans David Wigmore Senior Manager Nova Scotia Department of Environment and Labour
Special thanks are due Michael MacIntyre and David Poole of the Kings County Planning
Office, who provided much of the information required for the example of the application
of the model to Lake George, and to Rick Scott and Jonathan Lowe for providing reports
and data on phosphorus export coefficients measured in Nova Scotia.
User’s Manual for Phosphorus Prediction Version 1.0
41
13. References
Biffi, F. 1963. Determining the time factor as a characteristic trait in the self-purifying
power of Lago d’Orta in relation to a continual pollution. Atti. Ist. Ven. Sci. Lettl.
Atri. 121: 131-136.
Brimley, W.A., D.C. Ambler, R.J. Porter, H.T., Doane and C.L. Lin. 1985. Hydrologic
Network Review, Nova Scotia. Joint Report by Environment Canada and the Nova
Scotia Department of the Environment.
Canfield, D.E. and R.W. Bachmann. 1980. Prediction of total phosphorus concentrations,
chlorophyll a, and secchi depths in natural and artificial lakes. Can. J. Fish. Aquat.
Sci. 38:414-423.
Chambers, P.A., M. Guy, E.S. Roberts, M.N. Charlton, R. Kent, C. Gagnon, G. Grove
and N. Foster. 2001. Nutrients and their impact on the Canadian environment.
Agriculture and Agri-Food Canada, Environment Canada, Fisheries and Oceans
Canada, Health Canada and Natural Resources Canada. 241 p.
Dillon Consulting Limited. 2003. Halifax Regional Municipality Nine Mile River
Assimilation Study. Final Report. Dillon Consulting Limited, Halifax, Nova Scotia.
66 p.
Dillon, P.J and L.A. Molot. 1997. Effect of landscape form on export of dissolved
organic carbon, iron and phosphorus from forested stream catchments. Water Resour.
Res. 33:2591-2600.
Dillon, P.J., K.H. Nicholls, W.A. Scheider, N.D. Yan and D.S. Jefferies. 1986. Lakeshore
capacity study - trophic status. Ontario Min. Municip. Affairs, Res. and Spec. Proj.
Branch. 89 p.
User’s Manual for Phosphorus Prediction Version 1.0
42
Dillon, P.J. and F.H. Rigler. 1974. A test of a nutrient budget model predicting the
phosphorus concentration in lake water. J. Fish. Res. Board Can. 31:1771-1778.
Dillon, P.J. and F.H. Rigler. 1975. A simple method for predicting the capacity of a lake
for development based on lake trophic status. J. Fish. Res. Bd. Canada. 31(11):1711-
1778.
Dillon, P.J., W.A. Scheider, R.A. reid and D.S. Jeffries. 1994. Lakeshore capacity study:
Part I – Test of effects of shoreline development on the trophic status of lakes. Lake
and Reserv. Manage. 8(2):121-129.
Hart, W.C. 1978. Major ions in Nova Scotia precipitation. Ph.D. Thesis. Dalhousie
University, Halifax, Nova Scotia.
Hart, W.C., R.S. Scott and J.G. Ogden III. 1978. A phosphorus loading model for lakes in
the Shubenacadie headwaters. Technical Report No. 2., Prepared for the
Shubenacadie-Stewiacke River Basin Board. Dalhousie University, Halifax, Nova
Scotia. 34 p.
Horne, A.J. and C.R. Goldman. 1994. Limnology. 2nd ed. McGraw-Hill., New York.
Horner Associates Ltd. 1995. Lake carrying capacities and proposed shoreline
development policies. Report Prepared for the Municipality of the County of Kings,
Kings County, Nova Scotia.100 p.
Hutchinson, N.J. 2002. Limnology, plumbing and planning: Evaluation of nutrient-based
limits to shoreline development in Precambrian Shield watersheds, p. 647-680. In
R.L. France [ed.], Handbook of water sensitive planning and design. Lewis
Publishers, Boca Raton.
Kalff, J.K. 2002. Limnology. Prentice Hall, New Jersey.
User’s Manual for Phosphorus Prediction Version 1.0
43
Kerekes, J. 1983. Predicting tropic response to phosphorus in a Cape Breton Island lake.
Proc. N.S. Inst. Sci. 33:7-18.
Kerekes, J. 1982. The application of phosphorus load-trophic response relationships to
reservoirs. Canadian Water Resources Journal. 7(1):349-354.
Kirchner, W.B. and P.J. Dillon. 1975. An empirical model for estimating retention of
phosphorus in lakes. Water Resour. Res. 2:182-183.
Larsen, DP. and H.T. Mercier. 1976. Phosphorus retention capacity of lakes. J. Fish. Res.
Bd. Can. 33:1742-1750.
Likens, G.E. and O.L. Loucks. 1978. Analysis of five North American Lake Ecosystems.
III. Sources, loading and fate of nitrogen and phosphorus. Verh. Internat. Verein.
Limnol. 20:568-573.
Lowe, J.S. 2001. Revision of the Kings County lake capacity model: validation and
implications. Report prepared for the Municipality of Kings. 21p.
Lowe, J.S. 2002. Overland phosphorus export in the Gaspereau River watershed:
application to a lake capacity model. MSc Thesis. Acadia University, Wolfville, Nova
Scotia. 139p.
Maine Department of Environmental Protection. 2000. Report No. DEPLW-112, Final
Lakes TDML Report. Maine Department of Environmental Protection, Lakes
Assessment Division, Augusta, Maine.
Nova Scotia Department of Environment and Labour. 1999. Kings County, Nova Scotia
Volunteer Lake Water Quality Monitoring Program. NSDEL, Halifax, Nova Scotia.
User’s Manual for Phosphorus Prediction Version 1.0
44
OMEE 1993. Report on the 1991 discharge from municipal sewage treatment plants in
Ontario. Vol. 1. Summary of performance and compliance. Ontario Ministry of
Environment and Energy, Toronto, Ontario.
Piontelli, R. and V. Tonolli. 1964. The time of retention of lacustrine waters in relation to
the phenomena of enrichment in introduced substances, with particular reference to
Lago Maggiore. Mem. Ist. Ital. Idrobiol. 17:247-266.
Rast, W. and G.F. Lee. 1977. Summary analysis of North American (U.S. Portion) OECD
Eutrophication Project: Nutrient loading-lake response relationship and trophic status
indices. Report No. EPA-600/3-78-008. Ecological Research Series. United States
Environmental Protection Agency, Corvallis, Oregon.
Reckhow, K.H. 1979. Empirical lake models for phosphorus: Development, applications,
limitations and uncertainty, p. 193-221. In D. Scavia and A. Robertson [eds.],
Perspectives in lake ecosystem modeling. Ann Arbor Science Publishers, Michigan.
Reckhow, K.H. and S.C. Chapra. 1979. A note on error analysis for a phosphorus
retention model. Water. Resour. Res. 15:1643-1646.
Reckhow, K.H., M.W. Beaulac and J.T. Simpson. 1980. Modeling phosphorus loading
and lake response under uncertainty: A manual and compilation of export
coefficients. U.S. Environmental. Protection Agency, EPA 440/5-80-011.
Sas, H. 1989. Lake restoration by reduction of nutrient loading: Expectations, experiences
and extrapolations. Academia-Verl. St. Augustin.
Scott, R.S., W.C. Hart and G. Patterson. 2000. Phosphorus export from stream
catchments in Nova Scotia. Internal Report No. 93-3, DalTech, Dalhousie University,
Halifax, Nova Scotia. 102 p.
User’s Manual for Phosphorus Prediction Version 1.0
45
Scott, R.S., J. Lowe and S. Mandaville. 2003. Selection of phosphorus loading model for
Nova Scotia: Phase I. Report prepared for the Nova Scotia Department of
Environment and Labour. 74 p.
Soil and Water Conservation Society of Metro Halifax. 1992. Theoretical phosphorus
loading in 27 Halifax County lakes. Soil and Water Conservation Society of Metro
Halifax, Dartmouth, Nova Scotia.
Soil and Water Conservation Society of Metro Halifax. 1993. Theoretical phosphorus
loading to 25 Halifax County lakes: Phase-B2 limnology project, September 1993.
Soil and Water Conservation Society of Metro Halifax, Dartmouth, Nova Scotia.
Thirumurthi, R.D. and W.C. Hart.1985 Chemistry of bulk deposition in Halifax and its
effects on Chain and Chocolate lakes. Water Poll. Res. J. Can. 20(1):89-105.
Underwood, J.K. 1984. An analysis of the chemistry of precipitation in Nova Scotia
1977-1980. Ph.D. Thesis. Technical University of Nova Scotia, Halifax, Nova Scotia.
264 p.
Uttomark, P.D., J.D. Chapin and K.M. Green. 1974. Estimating nutrient loading of lakes
from non-point sources. Report No. 660/13-74-020, Ecological Research Series,
United States Environmental Protection Agency, Corvallis, Oregon.
Vollenweider, R.A. 1968. The scientific basis of lake and stream eutrophication, with
particular reference to phosphorus and nitrogen as eutrophication factors. OECD
Tech. Report DAS/CSI/68.21. Paris.
Vollenweider, R.A. 1975. Input-output models with special reference to the phosphorus
loading concept in limnology. Schweiz. Z. Hydrol. 37:53-84.

User’s Manual for Phosphorus Prediction Version 1.0
46
Vollenweider, R.A. 1976. Advances in defining critical loading levels for phosphorus in
lake eutrophication. Mem. Ist. Ital. Idrobiol. 33:53-83.
Vollenweider, R.A. and J.J. Kerekes. 1980. Background and summary results of the
OECD cooperative program on eutrophication. Restoration of lakes and inland
waters. United States Environmental Protection Agency Report EPA 440/5-81-010.
Washington, D.C.
Vollenweider, R.A. and J.J. Kerekes. 1982. Eutrophication of waters: Monitoring,
assessment and control. Organization for Economic Co-operation and Development,
Paris. 156 p.
Waller, D.H. 1971. Cultural eutrophication in the Maritime Provinces. Wat. Poll. Cont.
September. 99-100.
Waller, D.H and W.C. Hart. 1986. Solids, nutrients and chlorides in urban run off, p. 59-
85. In, H.C. Torno, J. Marsalek and M. Desbordes [eds.], Urban run off pollution.
Springer-Verlag. Berlin.
Wetzel, R.G. 1983. Limnology. 2nd ed. Saunders.
Wetzel, R.G. and G.E. Likens. 1991. Limnological analyses. 2nd ed. Springer-Verlag,
New York.
User’s Manual for Phosphorus Prediction Version 1.0
47
14. Glossary
Algae - A general term applied to aquatic photosynthetic organisms.
Anaerobic – life without oxygen
Anoxic - having no oxygen
Catchment Area - See watershed.
Chlorophyll a - The major photosynthetic pigment present in algae and other plants.
Measurement of its concentration in a water body is used as an indication of algal
biomass.
Drainage Basin - The land area from which water runs off to drain into a stream, river,
lake or estuary.
Epilimnion – The upper, warmer surface layer of a stratified lake.
Export coefficient - A measure of the amount of a substance exported from a system,
usually expressed as mass area-1 time-1.
Export Coefficient Model - A model for calculating nutrient loads to an aquatic
ecosystem based on knowledge of land use and other drainage basin characteristics.
Eutrophic - A measure of a lake’s trophic status. Literally means ‘well nourished’ and
applied to aquatic ecosystems exhibiting a high level of productivity (see Table 1).
Flushing Rate - The number of times a volume of water equal to the volume of the lake
flows out of the lake. It is calculated as the ratio of the volume of water leaving the
lake to the volume of the lake, usually on an annual basis.
User’s Manual for Phosphorus Prediction Version 1.0
48
Hypolimnion - The lower, colder water later of a stratified lake.
Hypoxia – having low (generally < 2-3 mg L-1) dissolved oxygen
Internal Nutrient Loading - The release of nutrients from sediments into the water
column.
Mesotrophic – A measure of a lake’s trophic status. Literally means moderately
nourished and applied to lakes exhibiting a moderate level of productivity (see Table
1).
Metalimnion – The middle layer of a stratified lake containing an area of rapid
temperature change (the thermocline).
Non-point Pollution Source – A nutrient, or other pollutant, source that originates from
a diffuse area of the watershed as opposed to a clearly identified single source.
Oligotrophic - A measure of a lake’s trophic status. Literally means ‘poorly nourished’
and applied to lakes exhibiting a low level of productivity (see Table 1).
Oxic - having oxygen
Point Source Pollutant - A pollutant that originates from a single, easily identified
location such as a sewage treatment plant.
Residence Time - See Turnover Time
Response Time - The time it would take for the lake to respond to a change in its loading
of a substance. Because this is a logarithmetic function, response time is usually
expressed as the time for half the change to take place.
User’s Manual for Phosphorus Prediction Version 1.0
49
Secchi Disk - A circular disk, typically 20 cm in diameter and divided into white and
black quadrants, used to measure the transparency of a water body.
Thermocline – The area of a stratified lake in which a strong gradient in temperature
exists. It is often further defined as the area of the lake having a change in
temperature of at least 1 ºC per metre of depth.
Trophic State - An indication of the relative productivity of an ecosystem. For
freshwater systems it is typically evaluated in terms of the chlorophyll a
concentration (a measure of algal biomass), and the Secchi Disk depth (a measure of
water transparency).
Turnover Time - The average amount of time that water remains in a lake. It is
calculated as the ratio of the volume of the lake to the volume of water leaving the
lake, usually on an annual basis.
Watershed - See Drainage Basin.
Zooplankton - Animals, usually microscopic, that live suspended within the water
column.

User’s Manual for Phosphorus Prediction Version 1.0
50
15. APPENDICES
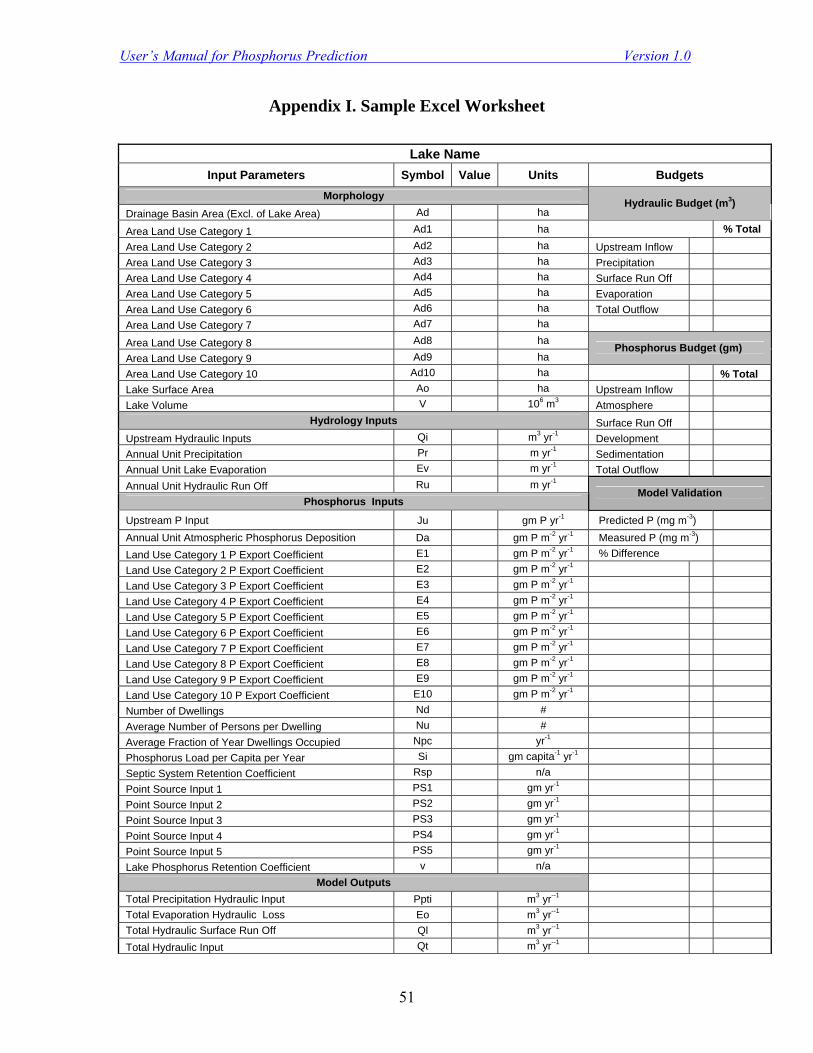
User’s Manual for Phosphorus Prediction Version 1.0
51
Appendix I. Sample Excel Worksheet
Lake Name
Input Parameters Symbol Value Units Budgets
Morphology
Drainage Basin Area (Excl. of Lake Area) Ad ha Hydraulic Budget (m3)
Area Land Use Category 1 Ad1 ha % Total
Area Land Use Category 2 Ad2 ha Upstream Inflow Area Land Use Category 3 Ad3 ha Precipitation Area Land Use Category 4 Ad4 ha Surface Run Off Area Land Use Category 5 Ad5 ha Evaporation Area Land Use Category 6 Ad6 ha Total Outflow Area Land Use Category 7 Ad7 ha Area Land Use Category 8 Ad8 ha Area Land Use Category 9 Ad9 ha Phosphorus Budget (gm)
Area Land Use Category 10 Ad10 ha % Total Lake Surface Area Ao ha Upstream Inflow Lake Volume V 106 m3 Atmosphere
Hydrology Inputs Surface Run Off Upstream Hydraulic Inputs Qi m3 yr-1 Development Annual Unit Precipitation Pr m yr-1 Sedimentation Annual Unit Lake Evaporation Ev m yr-1 Total Outflow Annual Unit Hydraulic Run Off Ru m yr-1
Phosphorus Inputs Model Validation
Upstream P Input Ju gm P yr-1 Predicted P (mg m-3) Annual Unit Atmospheric Phosphorus Deposition Da gm P m-2 yr-1 Measured P (mg m-3) Land Use Category 1 P Export Coefficient E1 gm P m-2 yr-1 % Difference Land Use Category 2 P Export Coefficient E2 gm P m-2 yr-1 Land Use Category 3 P Export Coefficient E3 gm P m-2 yr-1 Land Use Category 4 P Export Coefficient E4 gm P m-2 yr-1 Land Use Category 5 P Export Coefficient E5 gm P m-2 yr-1 Land Use Category 6 P Export Coefficient E6 gm P m-2 yr-1 Land Use Category 7 P Export Coefficient E7 gm P m-2 yr-1 Land Use Category 8 P Export Coefficient E8 gm P m-2 yr-1 Land Use Category 9 P Export Coefficient E9 gm P m-2 yr-1 Land Use Category 10 P Export Coefficient E10 gm P m-2 yr-1 Number of Dwellings Nd # Average Number of Persons per Dwelling Nu # Average Fraction of Year Dwellings Occupied Npc yr-1 Phosphorus Load per Capita per Year Si gm capita-1 yr-1 Septic System Retention Coefficient Rsp n/a Point Source Input 1 PS1 gm yr-1 Point Source Input 2 PS2 gm yr-1 Point Source Input 3 PS3 gm yr-1 Point Source Input 4 PS4 gm yr-1 Point Source Input 5 PS5 gm yr-1 Lake Phosphorus Retention Coefficient v n/a
Model Outputs Total Precipitation Hydraulic Input Ppti m3 yr--1 Total Evaporation Hydraulic Loss Eo m3 yr--1 Total Hydraulic Surface Run Off Ql m3 yr--1 Total Hydraulic Input Qt m3 yr--1

User’s Manual for Phosphorus Prediction Version 1.0
52
Areal Hydraulic Input qs m yr--1 Total Hydraulic Outflow Qo m3 yr--1 Total Atmospheric P Input Jd gm yr-1 Total Surface Run Off P Input Je gm yr-1 Total Development P Input Jr gm yr-1 Total P Input Jt gm yr-1 Lake P Retention Factor Rp - Lake P Retention Ps gm yr-1 Predicted Lake P Concentration [P] mg L-1 Lake P Outflow Jo gm yr-1 Lake Mean Depth z m Lake Flushing Rate FR times yr-1 Lake Turnover Time TT yr Lake Response Time RT(1/2) yr

User’s Manual for Phosphorus Prediction Version 1.0
53
Appendix II. Data Sources Lake Morphology:
Information Officer Nova Scotia Department of Agriculture and Fisheries P.O. Box 700 Pictou, N.S. B0K 1H0 Tel: (902) 485-5056 (http://www.gov.ns.ca/nsaf/sportfishing/lakesurvey/)
Drainage Basin Topographic Maps:
Nova Scotia Geomatics Centre Service Nova Scotia and Municipal Relations 160 Willow Street 5151 Terminal Road Amherst, N.S. P.O. Box 2205 B4H 3W5 Halifax, N.S Tel: 902-667-721 B3J 3C4 Fax: 902-667-6299 Tel: 902-424-2735 (http://www.gov.ns.ca/snsmr/land/) Fax: 902-424-5747 email: [email protected]
Climate/Meteorology:
Environment Canada - Canadian Climate Normals (http://www.climate.weatheroffice.ec.gc.ca/climate_normals/index_e.html)
Geology:
Nova Scotia Department of Natural Resources Mineral Resources Branch 1701 Hollis Street Founders Square, 3rd. Floor Halifax, N. S. B3J 3M8 Tel: 902 424-2035 Fax: 902 424-7735 (http://www.gov.ns.ca/natr/meb/pubs/pubshome.htm)
Soil Characteristics: Nova Scotia Department of Agriculture and Marketing Soils Survey Reports
Agriculture and Agri-Food Canada. 1999. Canadian Soil Information Systems. National Soil Database. (http://sis.agr.gc.ca/cansis/)
Land Use and Population Statistics: Local Municipal Planning Offices
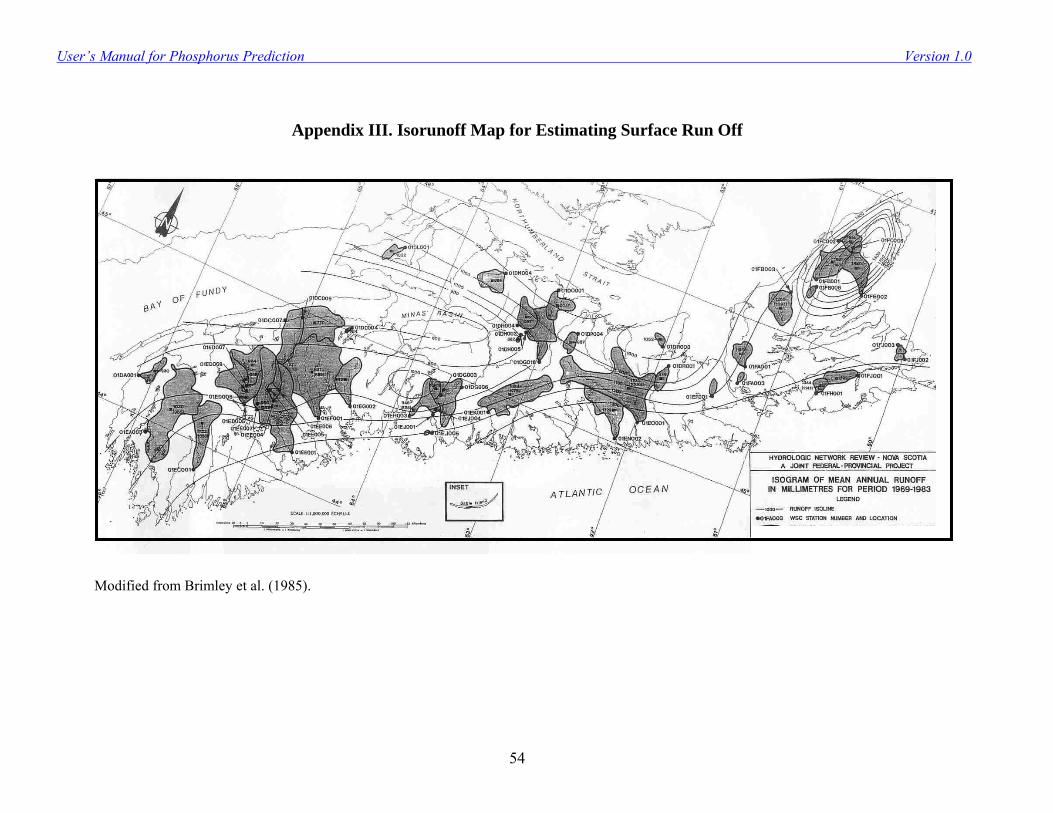
User’s Manual for Phosphorus Prediction Version 1.0
54
Appendix III. Isorunoff Map for Estimating Surface Run Off
Modified from Brimley et al. (1985).

User’s Manual for Phosphorus Prediction Version 1.0
55
Appendix IV – Literature References for Estimating Export Coefficients
Dillon, P.J. and W.B. Kirchner. 1974. The effects of geology and land use on the export
of phosphorus from watersheds. Water Research. 9:135-148.
Lowe, J.S. 2001. Revision of the Kings County lake capacity model: validation and
implications. Report prepared for the Municipality of Kings. 21p.
Rast, W. and G.F. Lee. 1977. Summary analysis of North American (U.S. Portion) OECD
Eutrophication Project: Nutrient loading-lake response relationship and trophic status
indices. Report No. EPA-600/3-78-008. Ecological Research Series. United States
Environmental Protection Agency, Corvallis, Oregon.
Reckhow, K.H., M.N. Beaulac and J.T. Simpson. 1980. Modeling phosphorus loading
and lake response under uncertainty: A manual and compilation of export
coefficients. Report No. EPA-440/5-80-011. Office of Water Regulations, Criteria
and Standards Division, United States Environmental Protection Agency,
Washington, D.C.
Reckhow, K.H. and S.C. Chapra. 1983. Engineering approaches for lake management,
Volume I: Data analysis and empirical modeling. Butterworth, Boston.
Scott, R.S., W.C. Hart and G. Patterson. 2000. Phosphorus export from stream
catchments in Nova Scotia. Internal Report No. 93-3, DalTech, Dalhousie University,
Halifax, Nova Scotia. 102 p.
Uttomark, P.D., J.D. Chapin and K.M. Green. 1974. Estimating nutrient loading of lakes
from non-point sources. Report No. 660/13-74-020, Ecological Research Series,
United States Environmental Protection Agency, Corvallis, Oregon.

User’s Manual for Phosphorus Prediction Version 1.0
56
Appendix V
Example of Model Application
This appendix contains an example of the application of the model to Lake George, a
headwater lake located in the Gaspereau River watershed in Kings County, Nova Scotia.
Development of each model input is explained according to the order in which they are
presented in the manual and listed in the Excel worksheet.
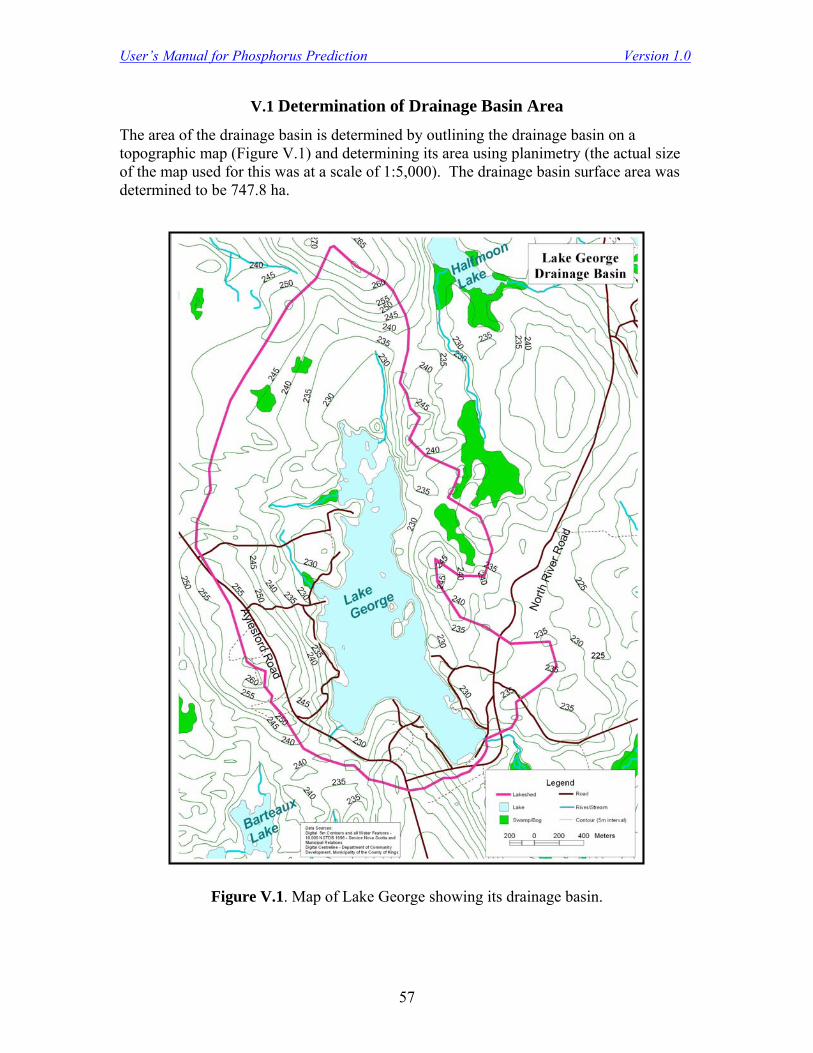
User’s Manual for Phosphorus Prediction Version 1.0
57
V.1 Determination of Drainage Basin Area
The area of the drainage basin is determined by outlining the drainage basin on a topographic map (Figure V.1) and determining its area using planimetry (the actual size of the map used for this was at a scale of 1:5,000). The drainage basin surface area was determined to be 747.8 ha.
Figure V.1. Map of Lake George showing its drainage basin.
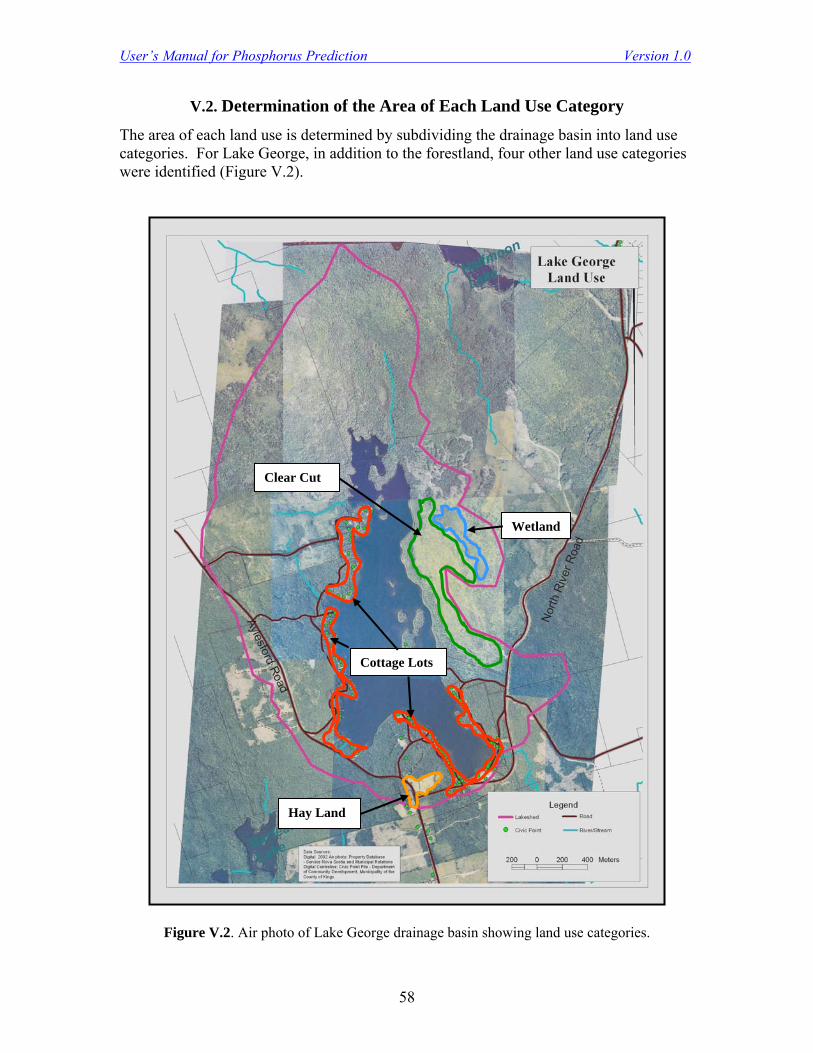
User’s Manual for Phosphorus Prediction Version 1.0
58
V.2. Determination of the Area of Each Land Use Category
The area of each land use is determined by subdividing the drainage basin into land use categories. For Lake George, in addition to the forestland, four other land use categories were identified (Figure V.2).
Figure V.2. Air photo of Lake George drainage basin showing land use categories.
Hay Land
Cottage Lots
Wetland
Clear Cut
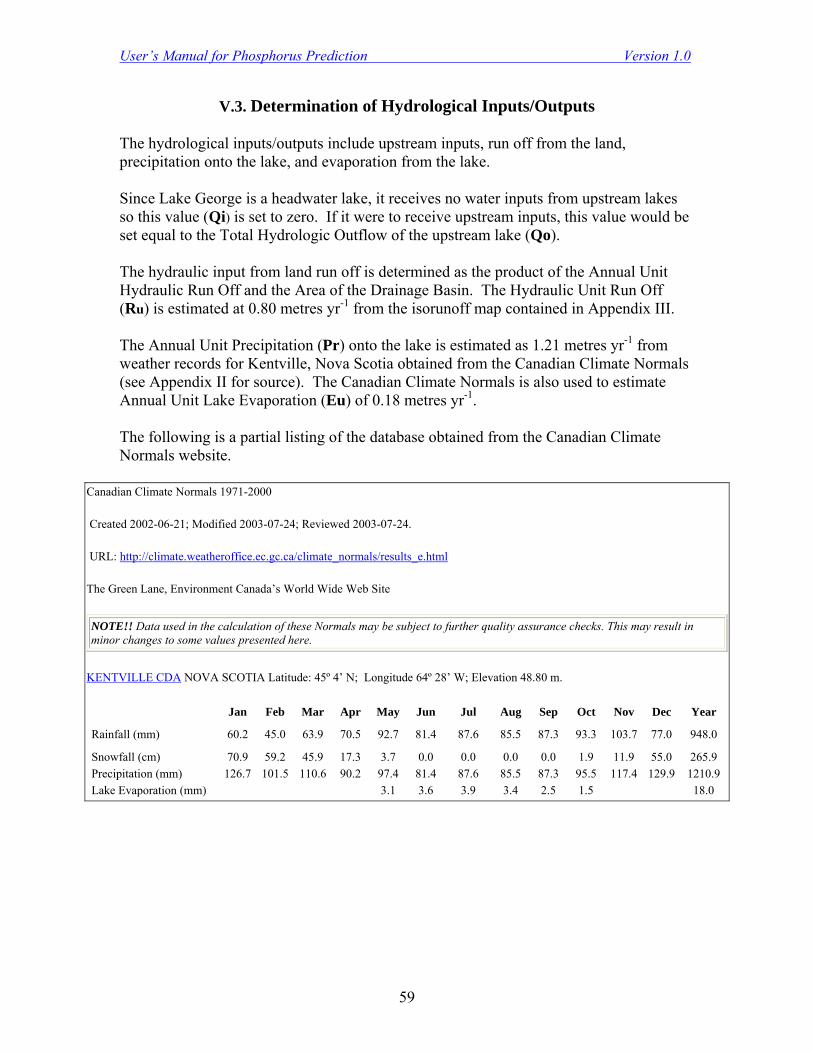
User’s Manual for Phosphorus Prediction Version 1.0
59
V.3. Determination of Hydrological Inputs/Outputs The hydrological inputs/outputs include upstream inputs, run off from the land, precipitation onto the lake, and evaporation from the lake. Since Lake George is a headwater lake, it receives no water inputs from upstream lakes so this value (Qi) is set to zero. If it were to receive upstream inputs, this value would be set equal to the Total Hydrologic Outflow of the upstream lake (Qo). The hydraulic input from land run off is determined as the product of the Annual Unit Hydraulic Run Off and the Area of the Drainage Basin. The Hydraulic Unit Run Off (Ru) is estimated at 0.80 metres yr-1 from the isorunoff map contained in Appendix III. The Annual Unit Precipitation (Pr) onto the lake is estimated as 1.21 metres yr-1 from weather records for Kentville, Nova Scotia obtained from the Canadian Climate Normals (see Appendix II for source). The Canadian Climate Normals is also used to estimate Annual Unit Lake Evaporation (Eu) of 0.18 metres yr-1. The following is a partial listing of the database obtained from the Canadian Climate Normals website.
Canadian Climate Normals 1971-2000
Created 2002-06-21; Modified 2003-07-24; Reviewed 2003-07-24.
URL: http://climate.weatheroffice.ec.gc.ca/climate_normals/results_e.html
The Green Lane, Environment Canada’s World Wide Web Site
NOTE!! Data used in the calculation of these Normals may be subject to further quality assurance checks. This may result in minor changes to some values presented here.
KENTVILLE CDA NOVA SCOTIA Latitude: 45º 4’ N; Longitude 64º 28’ W; Elevation 48.80 m.
Jan Feb Mar Apr May Jun Jul Aug Sep Oct Nov Dec Year
Rainfall (mm) 60.2 45.0 63.9 70.5 92.7 81.4 87.6 85.5 87.3 93.3 103.7 77.0 948.0
Snowfall (cm) 70.9 59.2 45.9 17.3 3.7 0.0 0.0 0.0 0.0 1.9 11.9 55.0 265.9 Precipitation (mm) 126.7 101.5 110.6 90.2 97.4 81.4 87.6 85.5 87.3 95.5 117.4 129.9 1210.9 Lake Evaporation (mm) 3.1 3.6 3.9 3.4 2.5 1.5 18.0
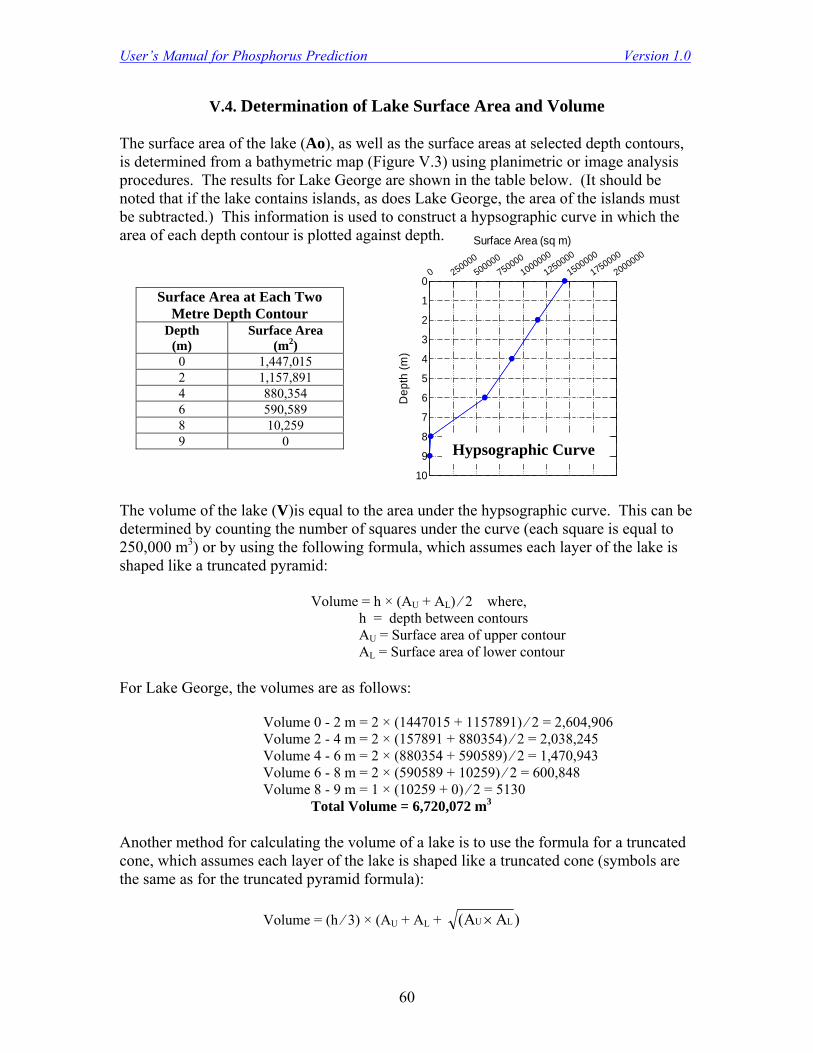
User’s Manual for Phosphorus Prediction Version 1.0
60
0 250000500000
7500001000000
12500001500000
17500002000000
Surface Area (sq m)
0123456789
10
Depth
(m)
V.4. Determination of Lake Surface Area and Volume The surface area of the lake (Ao), as well as the surface areas at selected depth contours, is determined from a bathymetric map (Figure V.3) using planimetric or image analysis procedures. The results for Lake George are shown in the table below. (It should be noted that if the lake contains islands, as does Lake George, the area of the islands must be subtracted.) This information is used to construct a hypsographic curve in which the area of each depth contour is plotted against depth.
The volume of the lake (V)is equal to the area under the hypsographic curve. This can be determined by counting the number of squares under the curve (each square is equal to 250,000 m3) or by using the following formula, which assumes each layer of the lake is shaped like a truncated pyramid: Volume = h × (AU + AL) ⁄ 2 where, h = depth between contours AU = Surface area of upper contour AL = Surface area of lower contour For Lake George, the volumes are as follows: Volume 0 - 2 m = 2 × (1447015 + 1157891) ⁄ 2 = 2,604,906 Volume 2 - 4 m = 2 × (157891 + 880354) ⁄ 2 = 2,038,245 Volume 4 - 6 m = 2 × (880354 + 590589) ⁄ 2 = 1,470,943 Volume 6 - 8 m = 2 × (590589 + 10259) ⁄ 2 = 600,848 Volume 8 - 9 m = 1 × (10259 + 0) ⁄ 2 = 5130 Total Volume = 6,720,072 m3 Another method for calculating the volume of a lake is to use the formula for a truncated cone, which assumes each layer of the lake is shaped like a truncated cone (symbols are the same as for the truncated pyramid formula): Volume = (h ⁄ 3) × (AU + AL + )AA( LU×
Surface Area at Each Two Metre Depth Contour
Depth (m)
Surface Area (m2)
0 1,447,015 2 1,157,891 4 880,354 6 590,589 8 10,259 9 0 Hypsographic Curve
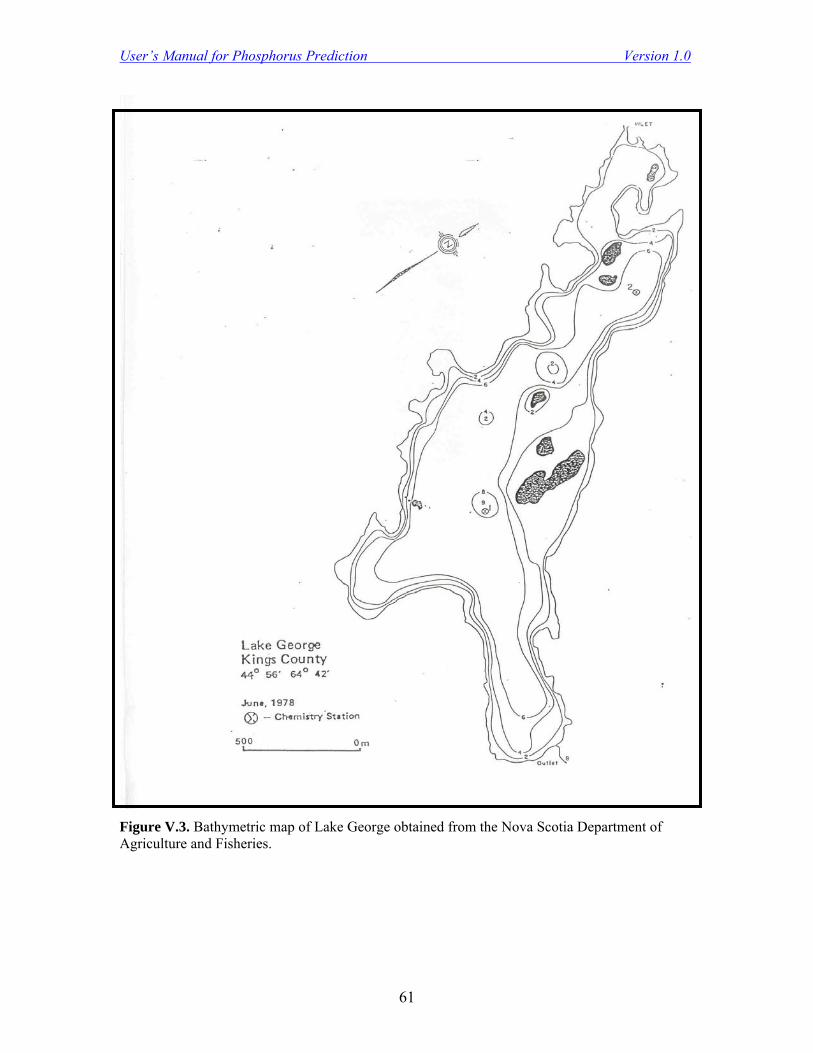
User’s Manual for Phosphorus Prediction Version 1.0
61
Figure V.3. Bathymetric map of Lake George obtained from the Nova Scotia Department of Agriculture and Fisheries.

User’s Manual for Phosphorus Prediction Version 1.0
62
V.5. Estimate of Atmospheric Phosphorus Deposition Coefficient
Atmospheric phosphorus unit deposition (Da) was assumed to be 0.020 mg gm m-2 yr-1, the average of the values reported for Nova Scotia (see Section 7.1.3.2).
V.6. Estimates of Phosphorus Surface Run Off Coefficients
Estimates of phosphorus surface run off coefficients were made based on the geology, soil types and land use characteristics of the drainage basin. Information on bedrock geology was obtained from Donohoe and Grantham (1989)3 and Finck et al. (1994)4 and soil characteristics were obtained from Cann et al. (1965)5 The bedrock geology is primarily intrusive granite coved by a shallow layer of glacial drift. The major soil type in the drainage basin belongs to the Gibraltar series which consists of coarse till. There is little evidence that either geology or soil type vary significantly within the drainage basin of Lake George. Land use categories include forest (640.4 ha), clear cut forest land (52.3 ha), wetland (8.3 ha), agriculture (mainly hay land – 3.2 ha), and cottage lots (43.6 ha). The area of each was estimated using an image analysis program.. The following phosphorus export coefficients were estimated from the export coefficients tabulated in Section 7.1.3.3 of the User’s Manual.
• Igneous Forested - 0.0069 gm m-2 yr-1 (from Scott et al. (2000) summary)
• Managed Forest -0.0625 gm m-2 yr-1 (from Maine Department of Environmental
Protection (2000) summary)
• Wetlands – 0.0000 gm m-2 yr-1 (see discussion in Section 2.1.4 of Supplementary
Technical Report)
• Agriculture (mainly hay land) – 0.0081 gm m-2 yr-1 (mean value for
grazing/pasture from Reckhow et al. (1980) in Table 7.4)
• Cottage Lots – 0.0300 gm m-2 yr-1 (from Maine Department of Environmental
Protection (2000) summary)
3 Donohoe, H.V. and R.G. Grantham. 1989. Geological highway map of Nova Scotia. Department of Mines
and Energy. 4 Finck, P.W., R.M. Graves, F.J. Bonner and H.B. Bent. 1994. Glacial and till clast geology of Gaspereau
Lake, Nova Scotia – South Mountain Batholith Project. Map 94-14. Nova Scotia Department of Natural Resources.
5 Cann, D.B., J.L. MacDougall and J.D. Hilchey. 1965. Soil survey of Kings County, Nova Scotia. Canadian Department of Agriculture and Nova Scotia Department of Agriculture and Marketing.

User’s Manual for Phosphorus Prediction Version 1.0
63
V.7. Determination of Development Input
Development input of phosphorus is determined according to the following equation: Pd = Σ PSi + (Nd × Nu × Npc × Si × (1 – Rsp)) where, PSi = Total phosphorus input from Point Source i Nd = Number of dwellings in the drainage basin Nu = Average number of persons occupying each dwelling Npc = Average fraction of the year dwelling are occupied Si = Phosphorus load per capita year Rsp = Septic system retention coefficient Development on Lake George is due to residential use, most of which is summer cottages. The number of cottages and permanent residences located within 300 metres of the shoreline of the lake was determined from statistics compiled by the Municipality of Kings County. Information on the frequency of occupancy and number of persons using each residence was obtained through a mail-out survey. The number of dwellings (Nd) was determined to be 110. Of these, 104 are seasonal and 6 are permanent. Results of the survey indicated that the average number of persons occupying each dwelling was 2.73 for the seasonal dwellings and 3.20 for the permanent dwellings. The average fraction of the year each dwelling was occupied was 0.19 for the seasonal dwellings and 0.82 for the permanent dwellings. Based on this information, the average number of occupants (Nu) and the average fraction of the year occupied for seasonal and permanent dwellings (Npc) combined were calculated to be 2.73 and 0.22. The phosphorus load per capita (Si) was considered to be 800 gm P yr-1, and the septic system retention coefficient (Rsp) was assumed to be 0.5. There are no point source inputs to Lake George, so PSi is set to zero on the worksheet.
V. 8. Determination of Phosphorus Retention Coefficient
The Phosphorus Retention Coefficient (v) is an empirically derived constant (see Section 7.2.2.5). Since there is some evidence, based on monitoring of surface and bottom water temperatures, that Lake George experiences stratification, and possibly anoxic conditions, the value of v is chosen to be 7.2 according to the relationships developed by Kichner and Dillon (1975).

User’s Manual for Phosphorus Prediction Version 1.0
64
V.9. Model Prediction of Phosphorus Concentration The following table is an illustration of the Excel spreadsheet containing all of the data entries for Lake George. The model prediction of phosphorus concentration is 0.0082 mg L-1. The phosphorus budget indicates that 19.88 % of the total phosphorus input is due to atmospheric deposition, 61.97 % is due to surface run off, and 18.15 % is due to development6. Of the total phosphorus outputs, 58.00 % is lost to the sediments and 42.00 % is lost via the outflow.
Lake George (Initial Model)
Input Parameters Symbol Value Units Budgets
Morphology
Drainage Basin Area (Excl. of Lake Area) Ad 747.8 ha Hydraulic Budget (m-3
)
Area Land Use Category 1 (Forest) Ad1 640.4 ha % Total
Area Land Use Category 2 (Clear Cut) Ad2 52.3 ha Upstream Inflow 0 0 Area Land Use Category 3 (Wetland) Ad3 8.3 ha Precipitation 1750991 22.64 Area Land Use Category 4 ( Hay Land) Ad4 3.2 ha Surface Run Off 6066090 77.36 Area Land Use Category 5 (Cottage Lots) Ad5 43.6 ha Evaporation -260478 3.37 Area Land Use Category 6 Ad6 0.0 ha Total Outflow 7556603 96.63 Area Land Use Category 7 Ad7 0.0 ha Total Check 100.00 Area Land Use Category 8 Ad8 0.0 ha Area Land Use Category 9 Ad9 0.0 ha Area Land Use Category 10 Ad10 0.0 ha Phosphorus Budget (gm
yr
-1)
Lake Surface Area Ao 144.7 ha % Total
Lake Volume V 6.72 106 m3 Upstream Inflow 0 0 Hydrology Atmosphere 28942 19.88
Upstream Hydraulic Inputs Qi 0 m3 yr-1 Surface Run Off 90214 61.97 Annual Unit Precipitation Pr 1.21 m yr-1 Development 26426 18.15 Annual Unit Lake Evaporation Ev 0.18 m yr-1 Sedimentation -84438 58.00 Annual Unit Hydraulic Run Off Ru 0.80 m yr-1 Total Outflow 61144 42.00
Phosphorus Inputs Total Check 100.00 Upstream P Input Ju 0 gm P yr-1 Annual Unit Atmospheric P Deposition Da 0.0200 gm P m-2 yr-1 Land Use Category 1 P Export Coefficient E1 0.0069 gm P m-2 yr-1 Land Use Category 2 P Export Coefficient E2 0.0625 gm P m-2 yr-1 Model Validation
Land Use Category 3 P Export Coefficient E3 0.0000 gm P m-2 yr-1 Land Use Category 4 P Export Coefficient E4 0.0081 gm P m-2 yr-1 Predicted P (mg L-1) 0.0082 Land Use Category 5 P Export Coefficient E5 0.0300 gm P m-2 yr-1 Measured P (mg L-1) 0.0105 Land Use Category 6 P Export Coefficient E6 0.0000 gm P m-2 yr-1 % Difference -21.9 Land Use Category 7 P Export Coefficient E7 0.0000 gm P m-2 yr-1 Land Use Category 8 P Export Coefficient E8 0.0000 gm P m-2 yr-1 Land Use Category 9 P Export Coefficient E9 0.0000 gm P m-2 yr-1 Land Use Category 10 P Export Coefficient E10 0.0000 gm P m-2 yr-1 Number of Dwellings Nd 110 # Average number of Persons per Dwelling Nu 2.73 # Average Fraction of Yr Dwellings Occupied Npc 0.22 yr-1
6 This includes only the input from septic systems. It could also, and probably should, include the increase in run off of phosphorus from dwelling lots above that which would occur if the lots were left as forest land.
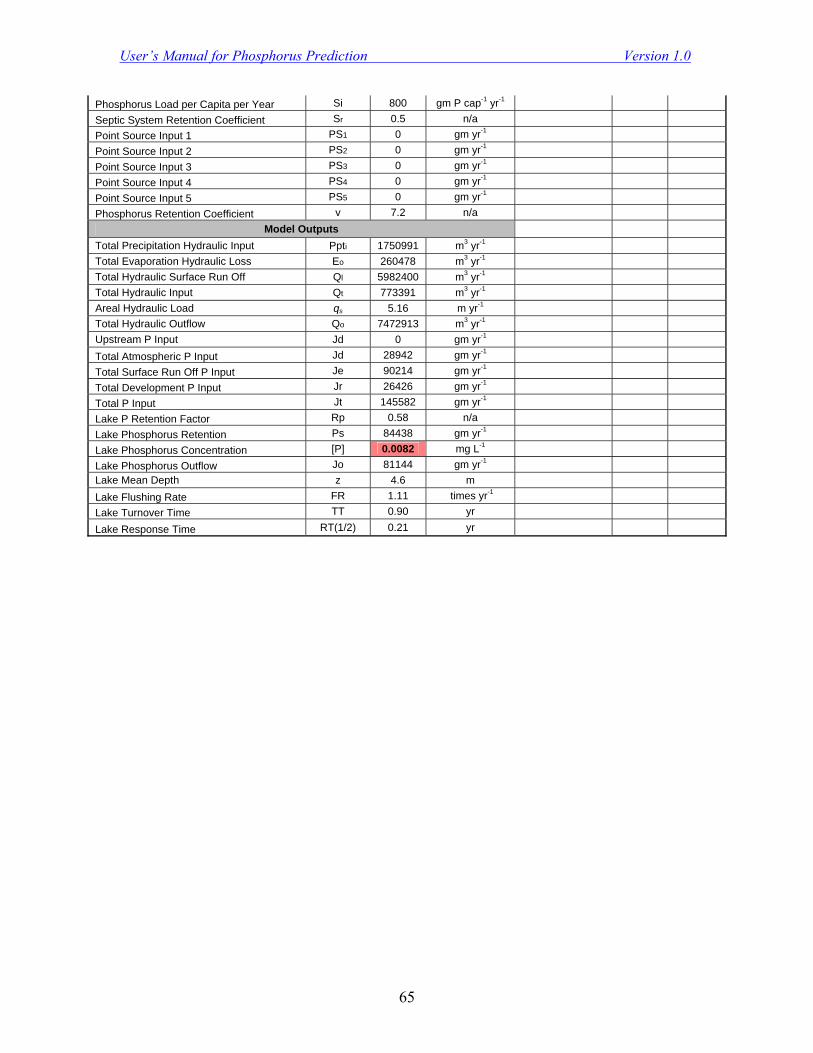
User’s Manual for Phosphorus Prediction Version 1.0
65
Phosphorus Load per Capita per Year Si 800 gm P cap-1 yr-1 Septic System Retention Coefficient Sr 0.5 n/a Point Source Input 1 PS1 0 gm yr-1 Point Source Input 2 PS2 0 gm yr-1 Point Source Input 3 PS3 0 gm yr-1 Point Source Input 4 PS4 0 gm yr-1 Point Source Input 5 PS5 0 gm yr-1 Phosphorus Retention Coefficient v 7.2 n/a
Model Outputs Total Precipitation Hydraulic Input Ppti 1750991 m3 yr-1 Total Evaporation Hydraulic Loss Eo 260478 m3 yr-1 Total Hydraulic Surface Run Off Ql 5982400 m3 yr-1 Total Hydraulic Input Qt 773391 m3 yr-1 Areal Hydraulic Load qs 5.16 m yr-1 Total Hydraulic Outflow Qo 7472913 m3 yr-1 Upstream P Input Jd 0 gm yr-1 Total Atmospheric P Input Jd 28942 gm yr-1 Total Surface Run Off P Input Je 90214 gm yr-1 Total Development P Input Jr 26426 gm yr-1 Total P Input Jt 145582 gm yr-1 Lake P Retention Factor Rp 0.58 n/a Lake Phosphorus Retention Ps 84438 gm yr-1 Lake Phosphorus Concentration [P] 0.0082 mg L-1 Lake Phosphorus Outflow Jo 81144 gm yr-1 Lake Mean Depth z 4.6 m Lake Flushing Rate FR 1.11 times yr-1 Lake Turnover Time TT 0.90 yr Lake Response Time RT(1/2) 0.21 yr
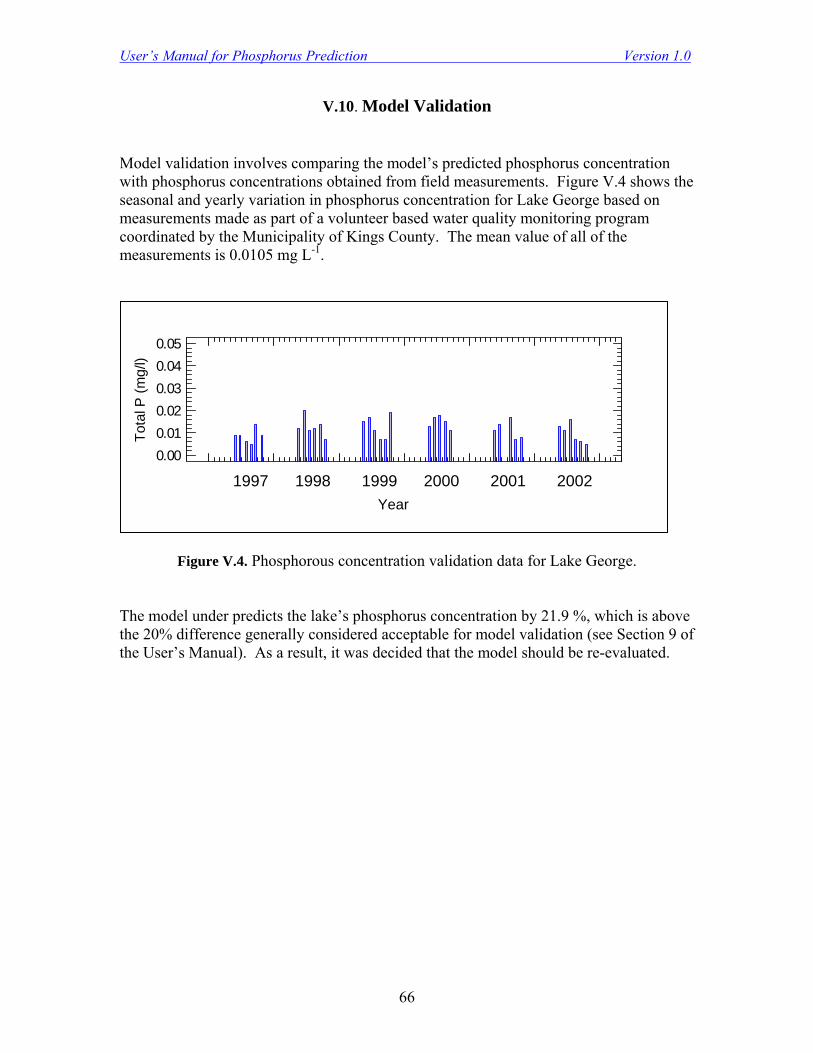
User’s Manual for Phosphorus Prediction Version 1.0
66
V.10. Model Validation
Model validation involves comparing the model’s predicted phosphorus concentration with phosphorus concentrations obtained from field measurements. Figure V.4 shows the seasonal and yearly variation in phosphorus concentration for Lake George based on measurements made as part of a volunteer based water quality monitoring program coordinated by the Municipality of Kings County. The mean value of all of the measurements is 0.0105 mg L-1.
Figure V.4. Phosphorous concentration validation data for Lake George. The model under predicts the lake’s phosphorus concentration by 21.9 %, which is above the 20% difference generally considered acceptable for model validation (see Section 9 of the User’s Manual). As a result, it was decided that the model should be re-evaluated.
0.000.010.020.030.040.05
Total
P (m
g/l)
1997 1998 1999 2000 2001 2002 Year

User’s Manual for Phosphorus Prediction Version 1.0
67
V.11. Model Re-evaluation In re-evaluation of the model, it was discovered that Lake George has a summer camp located on its north shore. The camp accommodates 34 persons per day for a period of 14 days, which is equivalent to 476 user days per year or 1.30 capita per year. Assuming a septic input of 800 gm P per capita per year and a septic retention coefficient of 0.5, this would result in an input of 520 gm P per year. The area of land used for the camp should also be considered, and it was assumed that it occupied an area of five ha and had a phosphorus export coefficient of 0.0300 gm m-2 yr-1 (equal to that of the cottage lots). Further re-evaluation indicated that Lake George also contains a public beach. Data on the per capita use of the public beach is not available, but if it is conservatively assumed that phosphorus inputs from this source are equal to about four times that of the summer camp, this addition results in a difference of 20.0%, which is on the borderline of the of the 20% guideline. Other factors that could also be re-evaluated include inputs from roadways along the lake’s shoreline and the assumption that there is no phosphorus export from the wetland present in the drainage basin. The validated model is illustrated below (the input values that were changed or added in the re-evaluation process are in bold print).
Lake George (Validated Model)
Input Parameters Symbol Value Units Budgets
Morphology
Drainage Basin Area (Excl. of Lake Area) Ad 747.8 ha Hydraulic Budget (m-3
)
Area Land Use Category 1 (Forest) Ad1 635.4 ha % Total
Area Land Use Category 2 (Clear Cut) Ad2 52.3 ha Upstream Inflow 0 0 Area Land Use Category 3 (Wetland) Ad3 8.3 ha Precipitation 1750991 22.64 Area Land Use Category 4 ( Hay Land) Ad4 3.2 ha Land Run Off 5982400 77.36 Area Land Use Category 5 (Cottage Lots) Ad5 43.6 ha Evaporation -260478 3.37 Area Land Use Category 6 (Campground) Ad6 5.0 ha Total Outflow 7472913 96.63 Area Land Use Category 7 Ad7 0.0 ha Total Check 100.00 Area Land Use Category 8 Ad8 0.0 ha Area Land Use Category 9 Ad9 0.0 ha Area Land Use Category 10 Ad10 0.0 ha Phosphorus Budget (gm
yr
-1)
Lake Surface Area Ao 144.7 ha % Total
Lake Volume V 6.72 106 m3 Upstream Inflow 0 0 Hydrology Atmosphere 28942 19.38
Upstream Hydraulic Inputs Qi 0 m3 yr-1 Surface Run Off 91369 61.18 Annual Unit Precipitation Pu 1.21 m yr-1 Development 29026 19.44 Annual Unit Lake Evaporation Eu 0.18 m yr-1 Sedimentation -86615 58.00 Annual Unit Hydraulic Run Off Ru 0.80 m yr-1 Total Outflow 62722 42.00
Phosphorus Inputs Total Check 100.00 Upstream P Input Ju 0 gm P yr-1 Annual Unit Atmospheric P Deposition Da 0.0200 gm P m-2 yr-1
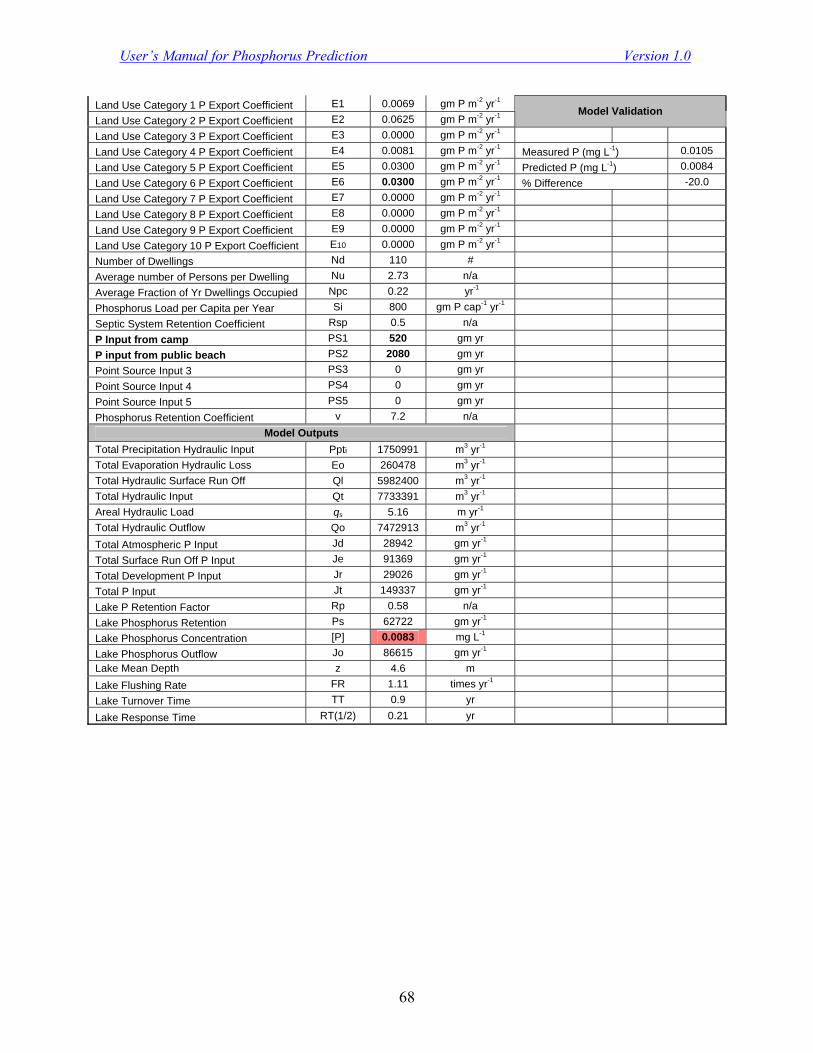
User’s Manual for Phosphorus Prediction Version 1.0
68
Land Use Category 1 P Export Coefficient E1 0.0069 gm P m-2 yr-1 Land Use Category 2 P Export Coefficient E2 0.0625 gm P m-2 yr-1 Model Validation
Land Use Category 3 P Export Coefficient E3 0.0000 gm P m-2 yr-1 Land Use Category 4 P Export Coefficient E4 0.0081 gm P m-2 yr-1 Measured P (mg L-1) 0.0105 Land Use Category 5 P Export Coefficient E5 0.0300 gm P m-2 yr-1 Predicted P (mg L-1) 0.0084 Land Use Category 6 P Export Coefficient E6 0.0300 gm P m-2 yr-1 % Difference -20.0 Land Use Category 7 P Export Coefficient E7 0.0000 gm P m-2 yr-1 Land Use Category 8 P Export Coefficient E8 0.0000 gm P m-2 yr-1 Land Use Category 9 P Export Coefficient E9 0.0000 gm P m-2 yr-1 Land Use Category 10 P Export Coefficient E10 0.0000 gm P m-2 yr-1 Number of Dwellings Nd 110 # Average number of Persons per Dwelling Nu 2.73 n/a Average Fraction of Yr Dwellings Occupied Npc 0.22 yr-1 Phosphorus Load per Capita per Year Si 800 gm P cap-1 yr-1 Septic System Retention Coefficient Rsp 0.5 n/a P Input from camp PS1 520 gm yr P input from public beach PS2 2080 gm yr Point Source Input 3 PS3 0 gm yr Point Source Input 4 PS4 0 gm yr Point Source Input 5 PS5 0 gm yr Phosphorus Retention Coefficient v 7.2 n/a
Model Outputs Total Precipitation Hydraulic Input Ppti 1750991 m3 yr-1 Total Evaporation Hydraulic Loss Eo 260478 m3 yr-1 Total Hydraulic Surface Run Off Ql 5982400 m3 yr-1 Total Hydraulic Input Qt 7733391 m3 yr-1 Areal Hydraulic Load qs 5.16 m yr-1 Total Hydraulic Outflow Qo 7472913 m3 yr-1 Total Atmospheric P Input Jd 28942 gm yr-1 Total Surface Run Off P Input Je 91369 gm yr-1 Total Development P Input Jr 29026 gm yr-1 Total P Input Jt 149337 gm yr-1 Lake P Retention Factor Rp 0.58 n/a Lake Phosphorus Retention Ps 62722 gm yr-1 Lake Phosphorus Concentration [P] 0.0083 mg L-1 Lake Phosphorus Outflow Jo 86615 gm yr-1 Lake Mean Depth z 4.6 m Lake Flushing Rate FR 1.11 times yr-1 Lake Turnover Time TT 0.9 yr Lake Response Time RT(1/2) 0.21 yr
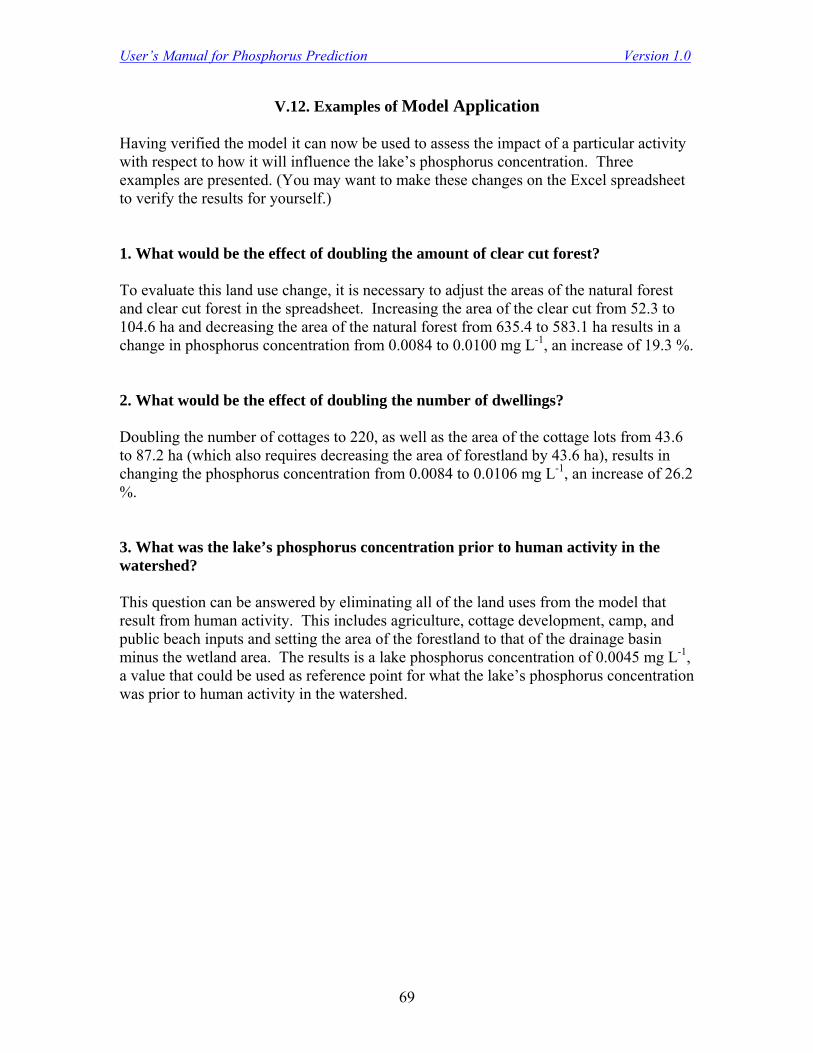
User’s Manual for Phosphorus Prediction Version 1.0
69
V.12. Examples of Model Application Having verified the model it can now be used to assess the impact of a particular activity with respect to how it will influence the lake’s phosphorus concentration. Three examples are presented. (You may want to make these changes on the Excel spreadsheet to verify the results for yourself.) 1. What would be the effect of doubling the amount of clear cut forest? To evaluate this land use change, it is necessary to adjust the areas of the natural forest and clear cut forest in the spreadsheet. Increasing the area of the clear cut from 52.3 to 104.6 ha and decreasing the area of the natural forest from 635.4 to 583.1 ha results in a change in phosphorus concentration from 0.0084 to 0.0100 mg L-1, an increase of 19.3 %. 2. What would be the effect of doubling the number of dwellings? Doubling the number of cottages to 220, as well as the area of the cottage lots from 43.6 to 87.2 ha (which also requires decreasing the area of forestland by 43.6 ha), results in changing the phosphorus concentration from 0.0084 to 0.0106 mg L-1, an increase of 26.2 %. 3. What was the lake’s phosphorus concentration prior to human activity in the watershed? This question can be answered by eliminating all of the land uses from the model that result from human activity. This includes agriculture, cottage development, camp, and public beach inputs and setting the area of the forestland to that of the drainage basin minus the wetland area. The results is a lake phosphorus concentration of 0.0045 mg L-1, a value that could be used as reference point for what the lake’s phosphorus concentration was prior to human activity in the watershed.

User’s Manual for Phosphorus Prediction Version 1.0
70
APPENDIX VI
Supplementary Technical Report
Assumptions and Limitations of the Model
VI.1. Introduction
Over the last several decades, the use of mathematical models for predictive purposes has
become well established in many areas of ecology. This is especially true in aquatic
ecology, and particularly with regard to their use for the prediction of water quality. A
large number of water quality models, varying greatly in sophistication and level of
complexity currently exist (see e.g., Jorgenson 1995; Chapra 1997).
The major advantage to the use of mathematical models for predictive purposes is that
they represent simplifications of natural systems that are difficult or impossible to
duplicate experimentally, and provide a means whereby ‘experiments’ can be performed
by altering components of the model and observing the resulting changes. They also
provide an important means of evaluating how well we understand a system by
comparing model predictions to what occurs in nature. If the model replicates what
occurs in nature, we can have some confidence in believing that it contains all the
important elements that control a particular process. If, however, the model behaves
differently from what we observe in nature, this is an indication that the model lacks
important qualitative elements, or is not correct in its quantitative formulations. If the
model does appear to work well in terms of its predictive ability, we then have a tool that
we can use to make management decisions.
The phosphorus run off coefficient modeling approach is one of the simplest approaches
available to evaluate potential changes in phosphorus concentration resulting from
changes in land use activities. This simplification has both its advantages and
disadvantages. Its main advantage is that it is relatively easy to apply, does not require a
great deal of costly field work for estimation of parameters and, most importantly, it
provides for a relatively standardized procedure for making the ‘best guess’ when a
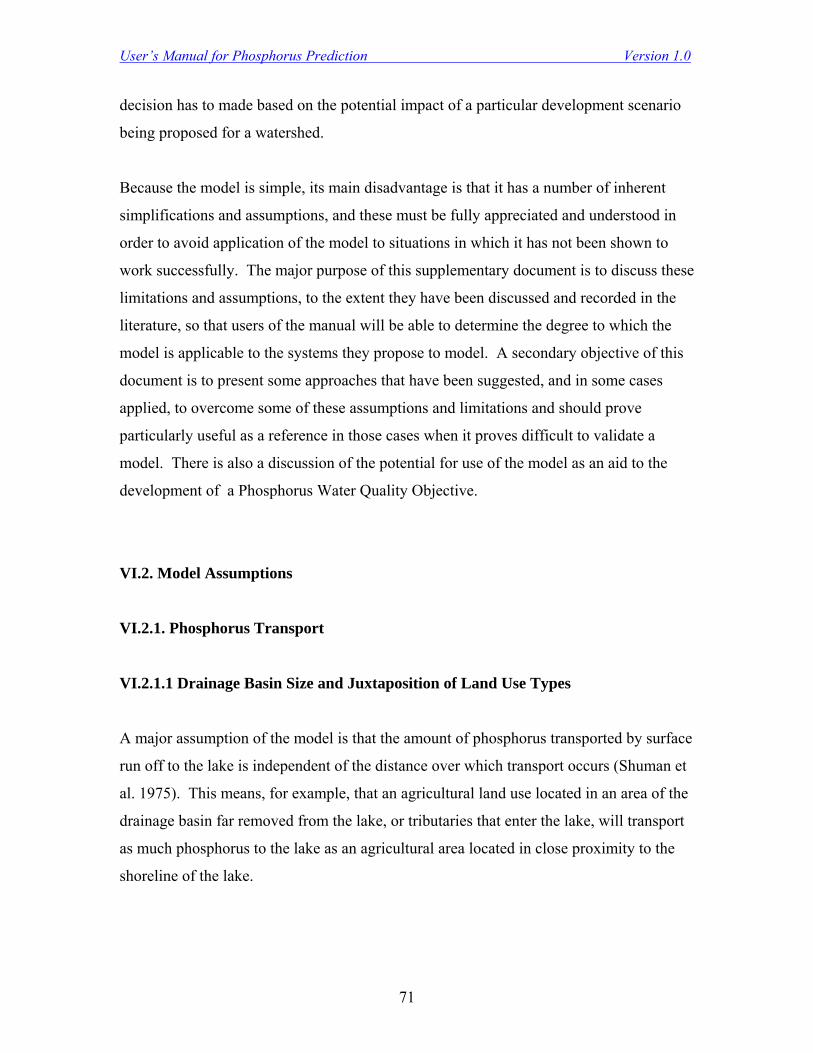
User’s Manual for Phosphorus Prediction Version 1.0
71
decision has to made based on the potential impact of a particular development scenario
being proposed for a watershed.
Because the model is simple, its main disadvantage is that it has a number of inherent
simplifications and assumptions, and these must be fully appreciated and understood in
order to avoid application of the model to situations in which it has not been shown to
work successfully. The major purpose of this supplementary document is to discuss these
limitations and assumptions, to the extent they have been discussed and recorded in the
literature, so that users of the manual will be able to determine the degree to which the
model is applicable to the systems they propose to model. A secondary objective of this
document is to present some approaches that have been suggested, and in some cases
applied, to overcome some of these assumptions and limitations and should prove
particularly useful as a reference in those cases when it proves difficult to validate a
model. There is also a discussion of the potential for use of the model as an aid to the
development of a Phosphorus Water Quality Objective.
VI.2. Model Assumptions
VI.2.1. Phosphorus Transport
VI.2.1.1 Drainage Basin Size and Juxtaposition of Land Use Types
A major assumption of the model is that the amount of phosphorus transported by surface
run off to the lake is independent of the distance over which transport occurs (Shuman et
al. 1975). This means, for example, that an agricultural land use located in an area of the
drainage basin far removed from the lake, or tributaries that enter the lake, will transport
as much phosphorus to the lake as an agricultural area located in close proximity to the
shoreline of the lake.
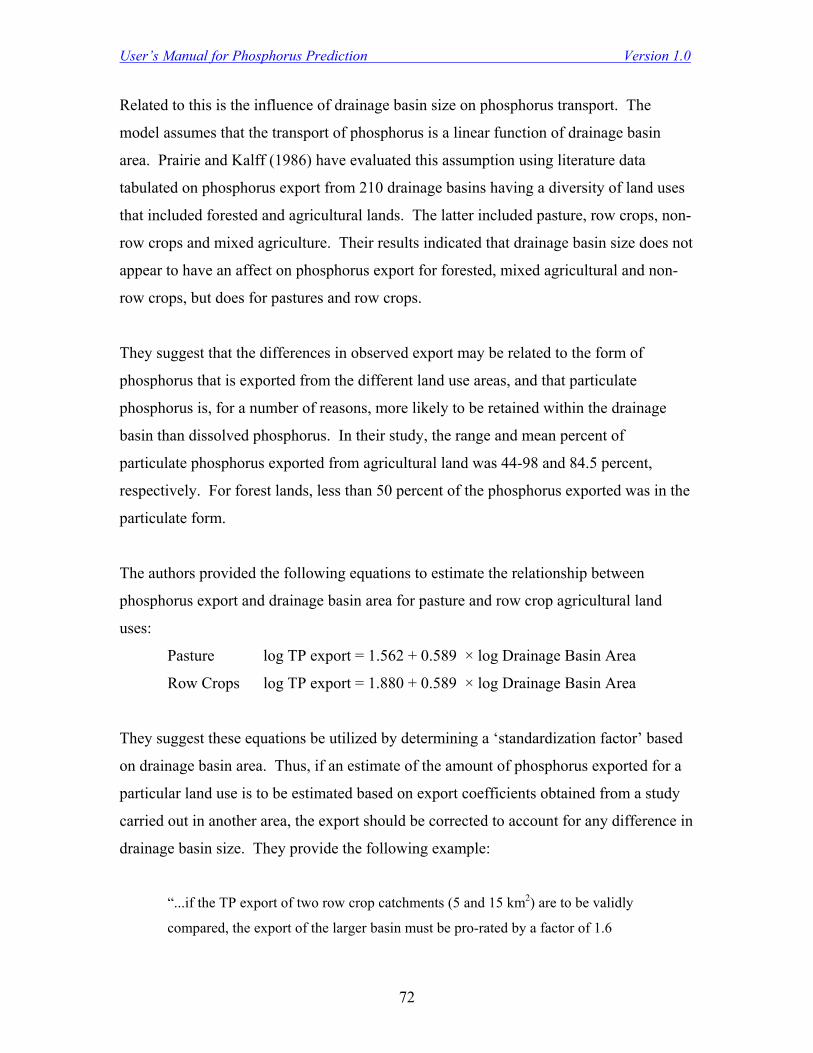
User’s Manual for Phosphorus Prediction Version 1.0
72
Related to this is the influence of drainage basin size on phosphorus transport. The
model assumes that the transport of phosphorus is a linear function of drainage basin
area. Prairie and Kalff (1986) have evaluated this assumption using literature data
tabulated on phosphorus export from 210 drainage basins having a diversity of land uses
that included forested and agricultural lands. The latter included pasture, row crops, non-
row crops and mixed agriculture. Their results indicated that drainage basin size does not
appear to have an affect on phosphorus export for forested, mixed agricultural and non-
row crops, but does for pastures and row crops.
They suggest that the differences in observed export may be related to the form of
phosphorus that is exported from the different land use areas, and that particulate
phosphorus is, for a number of reasons, more likely to be retained within the drainage
basin than dissolved phosphorus. In their study, the range and mean percent of
particulate phosphorus exported from agricultural land was 44-98 and 84.5 percent,
respectively. For forest lands, less than 50 percent of the phosphorus exported was in the
particulate form.
The authors provided the following equations to estimate the relationship between
phosphorus export and drainage basin area for pasture and row crop agricultural land
uses:
Pasture log TP export = 1.562 + 0.589 × log Drainage Basin Area
Row Crops log TP export = 1.880 + 0.589 × log Drainage Basin Area
They suggest these equations be utilized by determining a ‘standardization factor’ based
on drainage basin area. Thus, if an estimate of the amount of phosphorus exported for a
particular land use is to be estimated based on export coefficients obtained from a study
carried out in another area, the export should be corrected to account for any difference in
drainage basin size. They provide the following example:
“...if the TP export of two row crop catchments (5 and 15 km2) are to be validly
compared, the export of the larger basin must be pro-rated by a factor of 1.6
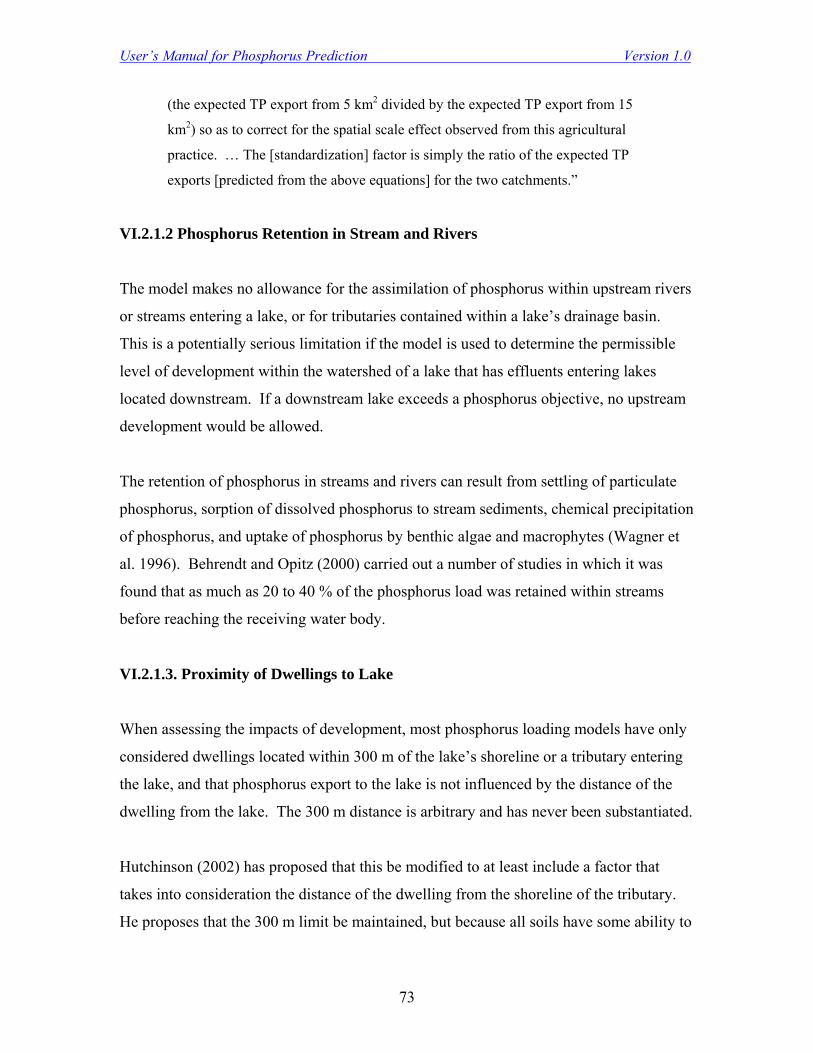
User’s Manual for Phosphorus Prediction Version 1.0
73
(the expected TP export from 5 km2 divided by the expected TP export from 15
km2) so as to correct for the spatial scale effect observed from this agricultural
practice. … The [standardization] factor is simply the ratio of the expected TP
exports [predicted from the above equations] for the two catchments.”
VI.2.1.2 Phosphorus Retention in Stream and Rivers
The model makes no allowance for the assimilation of phosphorus within upstream rivers
or streams entering a lake, or for tributaries contained within a lake’s drainage basin.
This is a potentially serious limitation if the model is used to determine the permissible
level of development within the watershed of a lake that has effluents entering lakes
located downstream. If a downstream lake exceeds a phosphorus objective, no upstream
development would be allowed.
The retention of phosphorus in streams and rivers can result from settling of particulate
phosphorus, sorption of dissolved phosphorus to stream sediments, chemical precipitation
of phosphorus, and uptake of phosphorus by benthic algae and macrophytes (Wagner et
al. 1996). Behrendt and Opitz (2000) carried out a number of studies in which it was
found that as much as 20 to 40 % of the phosphorus load was retained within streams
before reaching the receiving water body.
VI.2.1.3. Proximity of Dwellings to Lake
When assessing the impacts of development, most phosphorus loading models have only
considered dwellings located within 300 m of the lake’s shoreline or a tributary entering
the lake, and that phosphorus export to the lake is not influenced by the distance of the
dwelling from the lake. The 300 m distance is arbitrary and has never been substantiated.
Hutchinson (2002) has proposed that this be modified to at least include a factor that
takes into consideration the distance of the dwelling from the shoreline of the tributary.
He proposes that the 300 m limit be maintained, but because all soils have some ability to
User’s Manual for Phosphorus Prediction Version 1.0
74
retain phosphorus, the amount of phosphorus export to the lake or tributary be reduced as
follows:
• Development between 100 and 200 m be reduced by one third
• Development between 200 and 300 m be reduced by two thirds
• Development beyond 300 m considered to have no input
VI.2.1.4. Wetlands
There are conflicting reports of the amount of phosphorus contributed by wetlands. At
one extreme, some report that wetlands act neither as sources or sinks of phosphorus and
that, on an annual basis, do not have a net export of phosphorus (Uttomark et al. 1974;
Lee et al. 1980). Scott et al. (2002) on the other hand, suggest that wetlands export high
amounts of organic rich phosphates. Rast and Lee (1980), however, suggest that much of
the phosphorus exported from wetlands may not be in a form available to algae. The
results of other studies indicate that wetlands have variable export or retention of
phosphorus depending on their flushing rates and the sorptive capacity of the soils
contained in the wetland, which decreases with time as wetlands age (Faulkner and
Richardson 1989). Knight et al. (1987) advocate that retention is minimal if the residence
time of water in the wetland is less than 10 to 15 days. Soil sorptive capacity is much
more variable and requires empirical data to estimate.
Dillon and Molot (1997) made estimates of phosphorus loadings for wetlands located in
south-central Ontario and presented the following relationship:
Pw = Ad × (3.05 + (0.54 × % wetland) where,
Pw = Wetland Phosphorus Load (kg yr-1)
Ad = Drainage Basin Area (km2)
% Wetland = Percentage Wetland in the Drainage Basin

User’s Manual for Phosphorus Prediction Version 1.0
75
VI.2.1.5. Groundwater Inputs
The model does not address either the loss of phosphorus to groundwater, or the potential
for phosphorus input by way of groundwater flows into a lake. It is often assumed that
groundwater is relatively depleted of phosphorus because of the immobility of
phosphorus in soils. Although this may be true generally, a recent review of phosphorus
loss in agricultural drainage (Sims et al. 1998) indicates that considerable phosphorus can
leach into groundwater systems under conditions of deep sandy soils and soils with high
phosphorus concentrations resulting from over-fertilization or excessive use of organic
fertilizers. There is also the possibility of groundwater transport to surface run off in
agricultural fields that are tile drained. This should be considered in model applications
where a significant proportion of the lake’s drainage basin contains agricultural land use,
especially if the crops grown receive high levels of fertilization.
VI.2.2. Lake Morphology
Aside from the surface area and, indirectly, volume of the lake, the model does not take
into account differences in lake morphology or the position of water inputs to the lake.
A lake having a complex shoreline with bays and arms may have considerable spatial
variation in such things as residence times, which in turn could result in considerable
variation in phosphorus retention. Long, narrow water bodies, of the type commonly
associated with river impoundments for example, may have a horizontal gradient in
hydrological characteristics resulting in a greater amount of phosphorus retention in the
upper portion where influents enter.
Some lakes also contain more than one basin and these may behave differently from each
other. In this case, it may become necessary to treat each basin as a separate lake,
especially if there are major differences in the number and characteristics of any
tributaries that may enter each basin.
User’s Manual for Phosphorus Prediction Version 1.0
76
VI.3 Model Limitations
The model does not appear to work well for lakes that are very shallow. Shallow lakes
are often characterized by high flushing rates and a limited ability to retain phosphorus.
Any phosphorus that does settle appears to be easily resuspended as a result of the lake’s
water column being mixed to depths at or near the sediment surface (Welch and Cooke
1995). As a result, the model tends to overestimate the retention of phosphorus in
shallow lakes (Hutchinson 2002). The presence of macrophytes, which are often well
developed in shallow lakes, is also thought to influence the cycling of phosphorus since
they can act as pumps bringing nutrients that have been deposited into the sediments back
up into the water column.
Colored lakes are those lakes characterized by high levels of naturally occurring organic
acids. The organic acids are largely in the form of humic and fulvic acids that arise from
run off originating in wetlands and forested landscapes dominated by coniferous
vegetation. Application of nutrient loading models to colored lakes has not been very
successful as model predictions of phosphorus concentration are generally much lower
than measured lake phosphorus concentrations (Kerekes 1981). In addition, the
relationship between phosphorus concentration, phytoplankton production, phytoplankton
biomass, chlorophyll a concentration and Secchi Disk depth appears to be different for
colored lakes (Jackson and Hecky 1980; Chow-Fraser and Duthie 1987; Nurnberg 1996).
At present, it does not appear that phosphorus loading models, as they are presently
developed, can be as easily applied to reservoirs as they can to natural lakes (Kerekes
1982; Kennedy 1998). The major reasons for this are as follows:
• The depth and volume of reservoirs typically undergo changes over a relatively
short term depending on the need for the water they contain. As a result, the
flushing rate and, in turn, the sedimentation rate of phosphorus, varies greatly
over the same time period
User’s Manual for Phosphorus Prediction Version 1.0
77
• Reservoirs used for power generation have their outflows located at the bottom
which depletes the hypolimnion and the phosphorus that has settled into it
• Reservoirs are often constructed in drowned river valleys and tend to be
morphologically more like rivers than lakes
• The watersheds of reservoirs are generally much larger than those of lakes and
tend to have more surface run off relative to the volume of the reservoir
• Because of their larger watersheds, reservoirs tend to have higher sediment loads
and a greater proportion of their phosphorus input in particulate form.
Kennedy (1998) makes the following recommendations for anyone attempting to develop
phosphorus loading models for reservoirs:
• Because reservoirs tend to have short hydraulic residence times, it may be
necessary to formulate nutrient and water balances on a seasonal, as opposed to
annual, basis
• If the sediment load is high, the phosphorus sedimentation factor should be
adjusted
• Because of the river-like morphology of reservoirs, and the tendency for
phosphorus to settle near inlets, it may be necessary to model reservoirs as a series
of longitudinal segments. (Kerekes (1982) provides an example of how this
approach can be applied.)
VI.4. Application of Model to Establishing Phosphorus Water Quality Objectives
The trophic response of a lake to inputs of phosphorus depends on many factors and it is
unlikely that a single phosphorus water quality objective can be established that would be
applicable to all Nova Scotia lakes. This makes it necessary to either develop objectives
on an individual lake basis, or develop objectives for lakes that behave similarly in terms
of their trophic response to phosphorus. The former is unlikely to be practical because of
the effort and cost that would be involved. The latter approach requires the development
User’s Manual for Phosphorus Prediction Version 1.0
78
of some sort of lake classification system based on how a lake responds to additions of
phosphorus. This approach, often referred to as the ‘ecoregional’ or ‘reference condition’
approach, is currently being taken by many federal and state agencies in the United States
(USEPA 2000) and has been suggested as a potential approach for setting phosphorus
objectives in Canada. (Environment Canada 2003).
Determining exactly which factors should be considered in classifying lakes for this
purpose is still a subject of debate. In general, they are those factors that determine the
degree to which a lake will respond to an increase in phosphorus concentration, and
particularly those factors that determine the biomass of algae under conditions when
nutrients are not limiting. These include those factors that determine the potential level
of algal production, especially the relationship of lake mixing depth to euphotic zone
depth (both of which are closely related to the lake’s morphology), and those factors that
determine the loss of algal biomass. The later include grazing by zooplankton and
flushing from the lake.
The establishment of phosphorus water quality objectives also requires a somewhat
subjective assessment of how much of a change in water quality is considered acceptable.
The two most commonly used characteristics used to assess water quality with respect to
trophic status are water clarity and, in a stratified lake, the degree to which dissolved
oxygen levels become depleted in the hypolimnion. If these two criteria are to be used in
determining the amount of acceptable change in the water quality of a lake, then
quantitative relationships between these factors and the biomass of algae, and between
phosphorus concentration and algal biomass, must be developed. The latter will differ
depending on the particular characteristics of the lake and is further argument of the need
for a lake classification system.
In establishing phosphorus objectives, it is also important to consider the range in levels
of phosphorus that are characteristic of natural lakes not impacted by human activities.
This also requires that an extensive database be developed, using both existing
information and by acquiring new information for those lake types that have not been
User’s Manual for Phosphorus Prediction Version 1.0
79
well studied. This approach also requires that data be available on phosphorus
concentration for lakes not impacted by human activity. Hutchinson (2002) presents a
means whereby a phosphorus water quality objective can be set for a lake that has already
been subjected to development. The approach involves using a validated phosphorus
model based on export coefficients, and simply removing the development contribution
of phosphorus to determine the pre-development lake phosphorus concentration. He
stresses, however, that the model must be well developed and validated, if the results are
to be of any significance.
User’s Manual for Phosphorus Prediction Version 1.0
80
VI.5. References
Behrendt, H. and D. Opitz. 2000. Retention of nutrients in river systems: dependence on
specific runoff and hydraulic load. Hydrobiologia. 410:111-122.
Chapra, S.C. 1975. Comment on ‘An empirical method of estimating the retention of
phosphorus in lakes’ by W.B. Kirchner and P.J. Dillon. Wat. Resourc. Res.
11(8):1033-1034.
Chapra, S.C. 1997. Surface water quality modeling. McGraw Hill. New York.
Chow-Fraser, P. and H.C. Duthie. 1987. Response of the phytoplankton community to
weekly additions of ammonium phosphate in a dystrophic lake. Archiv fur
Hydrobiologia. 110:67-82.
Dillon, P.J. and L.A. Molot. 1997. Effect of landscape form on export of dissolved
organic carbon, iron and phosphorus from forested stream catchments. Water Resour.
Res. 33:2591-2600.
Environment Canada. 2003. Canadian guidance framework for the management of
phosphorus in freshwater systems. National Guidelines and Standards Office, Water
Policy and Coordination Directorate, Gatineau, Quebec. 116 p.
Faulkner, S.P. and C.J. Richardson. 1989. Physical and chemical characteristics of
freshwater wetland soils, p.41-72. In D.A. Hammer [ed.], Constructed wetlands for
wastewater treatment: Municipal, industrial and agricultural. Lewis Publishing.
Hutchinson, N.J. 2002. Limnology, plumbing and planning: Evaluation of nutrient-based
limits to shoreline development in Precambrian Shield watersheds, p.647-680. In R.L.
France, [ed.], Handbook of water sensitive planning and design, Lewis Publishing.
User’s Manual for Phosphorus Prediction Version 1.0
81
Jackson, T.A. and R.E. Hecky. 1980. Depression of primary productivity by humic matter
in lake and reservoir waters of the boreal forest zone. Can. J. Fish. Aquat. Sci.
37:2300-2317.
Jorgenson, 1995. State of the art of ecological modeling in limnology. Ecol. Mod.
78:101-115.
Kennedy, R.H. 1998. Basinwide considerations for water quality management:
Importance of phosphorus retention by reservoirs. Water Quality Technical Note MS-
03. United States Army Corps of Engineers, Vicksberg, MS.
Kerekes, J. 1981. Atlantic Region , p.1-13. In Janus, L.L. and R.A. Vollenweider [eds.],
Summary Report of the OECD Cooperative Programme on Eutrophication. Canadian
Contribution. Scientific Series No. 131, National Water Research Institute, Inland
Water Directorate, Canadian Centre for Inland Waters, Burlington, Ontario.
Knight, R.L., T.W. McKim and H.R. Kohl. 1987. Performance of a natural wetland
treatment system for wastewater management. J. Wat. Poll. Control Fed. 59(8):746-
754.
Lee, G.F., R.A. Jones and W. Rast. 1980. Availability of phosphorus to phytoplankton
and its implications for phosphorus management strategies, p. 250-308. In R. Loehr,
C. Martin and W. Rast [eds.], Phosphorus management strategies for lakes. Ann
Arbor Science, Ann Arbor, Michigan.
Nurnberg, G.K. 1996. Trophic state of clear and colored, soft- and hardwater lakes with
special consideration of nutrients, anoxia, phytoplankton and fish. J. Lake. Reserv.
Mgmt. 12(4):432-447.
Prairie, Y.T. and J. Kalff. 1986. Effect of catchment size on phosphorus export. Wat Res.
Bull. 22(3):465-470.

User’s Manual for Phosphorus Prediction Version 1.0
82
Scott, R.S., W.C. Hart and G. Patterson. 2000. Phosphorus export from stream
catchments in Nova Scotia. Internal Report No. 93-3, DalTech, Dalhousie University,
Halifax, Nova Scotia. 102 p.
Schuman, G.E., R.G. Sponer and R.F. Piest. 1973 Phosphorus losses from four
agricultural watersheds on Missouri Valley Loess. Soil. Sci. Soc. Amer. Proc. 37:424-
427.
Sims, J.T., R.R. Simard and B.C. Joern. 1998. Phosphorus loss in agricultural drainage:
Historical perspective and current research. J. Environ. Qual. 27:277-293.
Uttomark, P.D., J.D. Chapin and K.M. Green. 1974. Estimating nutrient loading of lakes
from non-point sources. Report No. 660/13-74-020, Ecological Research Series,
United States Environmental Protection Agency, Corvallis, Oregon.
USEPA 2000. Nutrient criteria technical guidance manual. 1st ed. United States
Environmental Protection Agency, Washington, D.C. EPA-822B00-001.
Wagner, R.A., T.S. Tisdale and J. Zhang. 1996. A framework for phosphorus transport
modeling in the Lake Okeechobee watershed. Wat. Res. Bull. 31(1):57-73.
Welch, E.B. and G.D. Cooke. 1995. Internal phosphorus loading in shallow lakes:
importance and control. Lake and Reserv. Manage. 11(3):273-281.