Polling the Leadership Debates The role of the instant polls Andrew Hawkins & Caroline Lawes
19
Polling the Leadership Debates The role of the instant polls Andrew Hawkins & Caroline Lawes 22 nd November 2010
-
Upload
claudia-mullen -
Category
Documents
-
view
18 -
download
0
description
Polling the Leadership Debates The role of the instant polls Andrew Hawkins & Caroline Lawes. 22 nd November 2010. Overview. The players Methodology & sampling Challenges Results Impact Lessons learnt. The players. Angus Reid ComRes/ ITV News ICM/ Guardian Populus/ The Times - PowerPoint PPT Presentation
Transcript of Polling the Leadership Debates The role of the instant polls Andrew Hawkins & Caroline Lawes
Polling the Leadership Debates
The role of the instant polls
Andrew Hawkins & Caroline Lawes
22nd November 2010
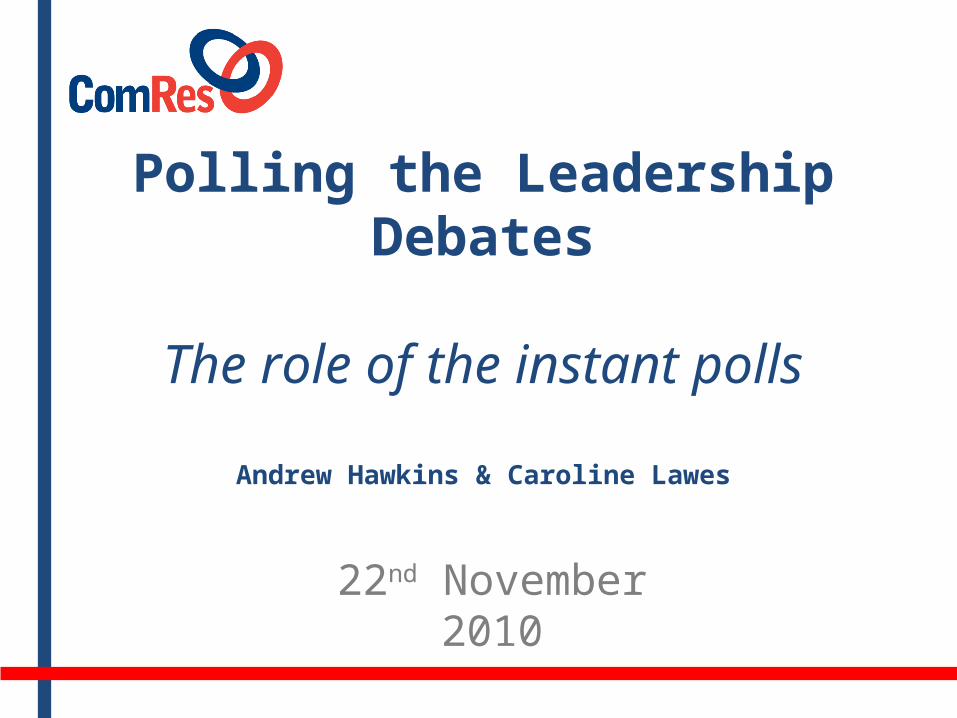
Overview
• The players
• Methodology & sampling
• Challenges
• Results
• Impact
• Lessons learnt

The players
• Angus Reid
• ComRes/ ITV News
• ICM/ Guardian
• Populus/ The Times
• YouGov/ The Sun

The methodologies
Across the different companies, three methodologies were used and three types of weightings.
• Automated telephone• Online• Telephone
• Nationally representative weighting• Viewer profile weighting• No weighting

Telephone
ComRes: Automated Telephone
• Pre-recruited panel of 10,000 people, demographics collected in advance• Programmed key touch survey using James Mates’s voice • Quotaed sample to send out• Automatic sample weighting – nationally representative• Sample size of 4032, 2691, 2372• Six minutes fieldwork time
ICM: CATI methodology
• Random sample of omnibus for recruitment.• Recontacted sample of people who said they would be watching.• Sample of 500 on the evening after the debate.• Weighted to the profile of all people selected at random who previously stated they would be watching the debate.

OnlinePopulus: Online• Recruited through a nat rep online panel. • Reminders the day before and again on the morning of the debate. • Data were not weighted, but was sub sample of nat rep base.• Sample of 1000
YouGov: Online• Sample of people who said they would definitely or probably watch the debate, from large screener• Weighted to be representative of debate viewers.• Reminder emails before the debates• Sample of 1000
Angus Reid: Online• Sample: panelists from Springboard UK panel who watched debate• Fieldwork on evening and next day • Weighted to be nationally representative• Sample of 1000-1500
Audience profile
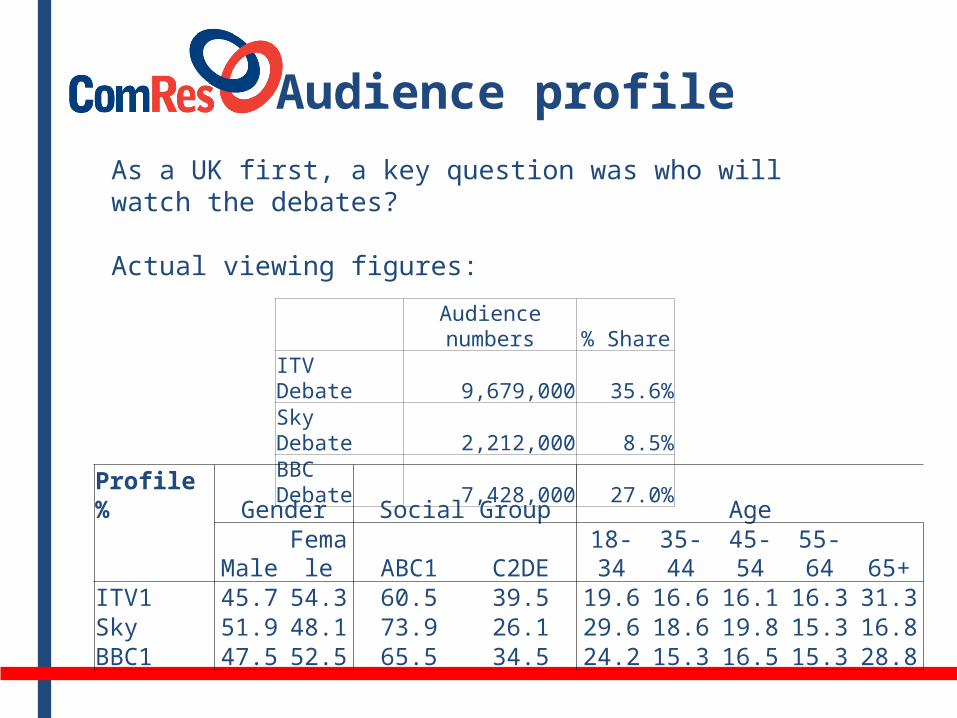
Audience numbers % ShareITV Debate 9,679,000 35.6%Sky Debate 2,212,000 8.5%BBC Debate 7,428,000 27.0%
As a UK first, a key question was who will watch the debates?
Actual viewing figures:
Profile % Gender Social Group Age Male Female ABC1 C2DE 18-34 35-44 45-54 55-64 65+ITV1 45.7 54.3 60.5 39.5 19.6 16.6 16.1 16.3 31.3Sky 51.9 48.1 73.9 26.1 29.6 18.6 19.8 15.3 16.8BBC1 47.5 52.5 65.5 34.5 24.2 15.3 16.5 15.3 28.8

Weighting
In hindsight we know what the audience looked like, but each instant poll had to make a choice of whether to and how to weight.
Debate 1 Male Female 18-34 35-44 45-54 55-64 65+ ABC1 C2DEViewing Figures 45.7% 54.3% 19.6% 16.6% 16.1% 16.3% 31.3% 60.5% 39.5%ICM Viewer weighting 48.9% 51.1% 20.2% 54.6% 25.2% 60.0% 40.0%Nationally Representative 48.0% 52.0% 27.7% 19.8% 16.8% 14.9% 20.8% 55.0% 45.0%
Debate 2 Male Female 18-34 35-44 45-54 55-64 65+ ABC1 C2DEViewing Figures 51.9% 48.1% 29.6% 18.6% 19.8% 15.3% 16.8% 73.9% 26.1%ICM Viewer weighting 49.0% 51.0% 20.2% 54.6% 25.2% 60.0% 40.0%Nationally Representative 48.0% 52.0% 27.7% 19.8% 16.8% 14.9% 20.8% 55.0% 45.0%
Debate 3 Male Female 18-34 35-44 45-54 55-64 65+ ABC1 C2DEViewing Figures 47.5% 52.5% 24.2% 15.3% 16.5% 15.3% 28.8% 65.5% 35.5%ICM Viewer weighting 49.0% 51.0% 20.2% 54.6% 25.2% 60.0% 40.0%Nationally Representative 48.0% 52.0% 27.7% 19.8% 16.8% 14.9% 20.8% 55.0% 45.0%
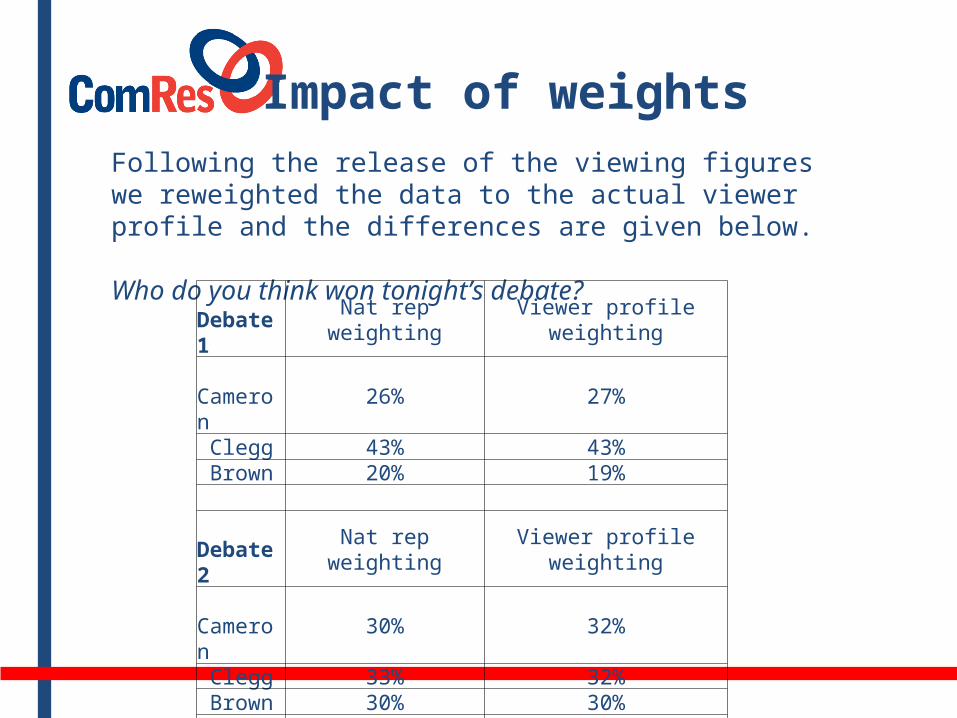
Impact of weightsFollowing the release of the viewing figures we reweighted the data to the actual viewer profile and the differences are given below.
Who do you think won tonight’s debate? Debate 1 Nat rep weighting Viewer profile weighting Cameron 26% 27% Clegg 43% 43% Brown 20% 19% Debate 2 Nat rep weighting Viewer profile weighting Cameron 30% 32% Clegg 33% 32% Brown 30% 30% Debate 3 Nat rep weighting Viewer profile weighting Cameron 35% 38% Clegg 33% 30% Brown 26% 27%

The Worm• 20 participants across the two marginal constituencies of Bolton West and Bolton North East
• Respondents were definitely going to vote, but were undecided who for.
• There was a good spread of men and women, different ages and ethnic groups and different past voting intentions. • Participants use an electronic keypad where they could let us know when they liked something, when they didn’t like something, or when they were neutral to what was being said.
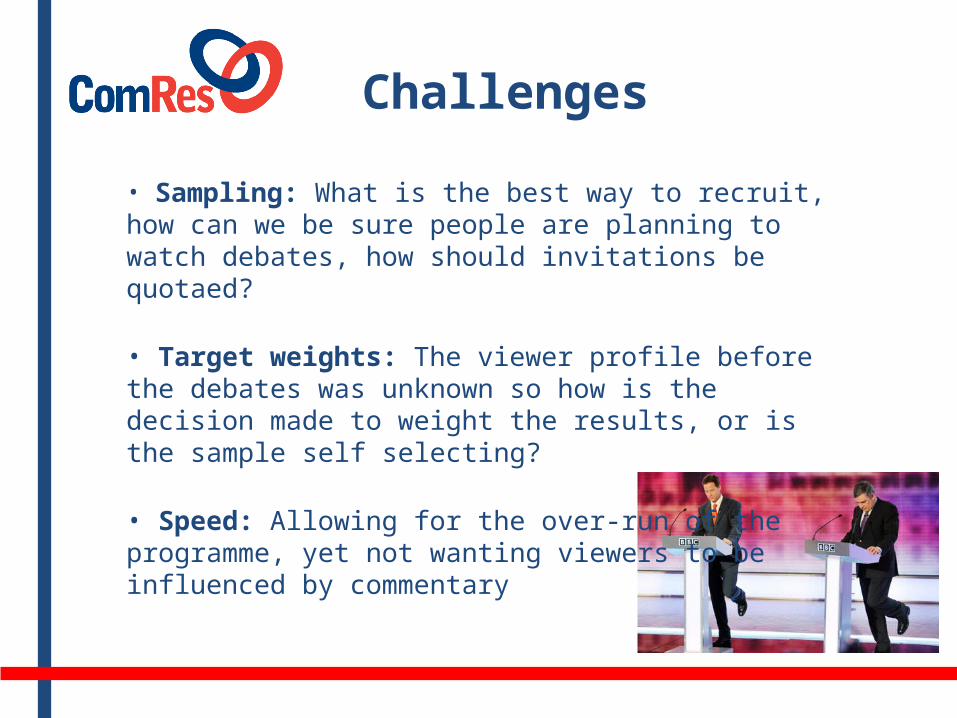
Challenges
• Sampling: What is the best way to recruit, how can we be sure people are planning to watch debates, how should invitations be quotaed?
• Target weights: The viewer profile before the debates was unknown so how is the decision made to weight the results, or is the sample self selecting?
• Speed: Allowing for the over-run of the programme, yet not wanting viewers to be influenced by commentary

Results
Debate 1 Angus Reid ComRes ICM Populus YouGovCameron 20% 26% 20% 23% 29%Clegg 49% 43% 51% 61% 51%Brown 19% 20% 19% 17% 19%None/ DK 13% 11% 11% - 2%
Debate 2 Angus Reid ComRes ICM Populus YouGovCameron 32% 30% 29% 37% 36%Clegg 33% 33% 33% 36% 32%Brown 23% 30% 29% 27% 29%None/ DK 12% 7% 8% - 3%
Debate 3 Angus Reid ComRes ICM Populus YouGovCameron 36% 35% 35% 38% 41%Clegg 30% 33% 27% 38% 32%Brown 23% 26% 29% 25% 25%None/ DK 11% 6% 9% - 2%

Additional questions• After first debate, Conservatives, closely followed by Lib Dems, had best policies on immigration and this topic became increasingly important during the campaign. • In debate two, expectations had been set. Indeed 47% of viewers thought that Brown performed better than expected in this debate, compared to just 21% of people for Clegg.
• 43% of viewers thought Clegg gave the most honest answers – compared to 29% for Cameron and 23% for Brown.
• After debate three, viewers were still split on who would be best to make spending cuts with about a third of people choosing each party.
Source: ComRes
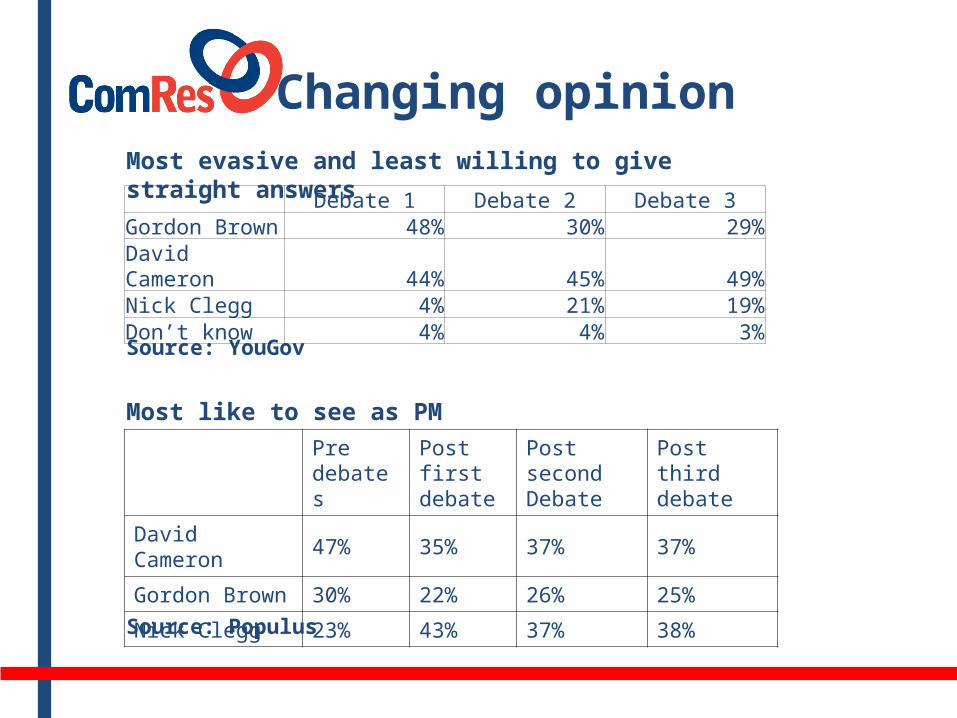
Changing opinion
Pre debates
Post first debate
Post second Debate
Post third debate
David Cameron 47% 35% 37% 37%
Gordon Brown 30% 22% 26% 25%
Nick Clegg 23% 43% 37% 38%
Source: YouGov
Debate 1 Debate 2 Debate 3Gordon Brown 48% 30% 29%David Cameron 44% 45% 49%Nick Clegg 4% 21% 19%Don’t know 4% 4% 3%
Source: Populus
Most evasive and least willing to give straight answers
Most like to see as PM

The impact
• Debates became the defining feature of the campaign
• Liberal Democrat surge
• Financial markets quivering at prospect of hung parliament

Impact on the polls
Average daily voting intention figures from all polls released

Financial markets
• The prospect of a hung parliament caused the value of the pound to drop.
• 16th April intra-day figures show the impact of the instant polls from debate one.
GB Pound v. US Dollar on 16th April 2010
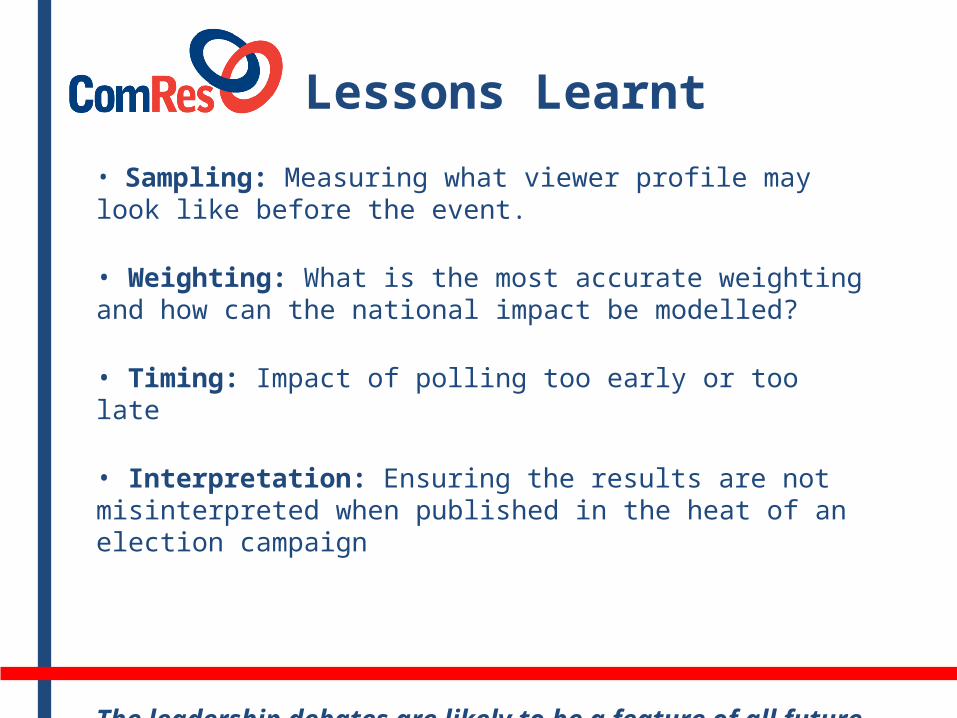
Lessons Learnt
• Sampling: Measuring what viewer profile may look like before the event.
• Weighting: What is the most accurate weighting and how can the national impact be modelled?
• Timing: Impact of polling too early or too late
• Interpretation: Ensuring the results are not misinterpreted when published in the heat of an election campaign
The leadership debates are likely to be a feature of all future General Elections and the polls have a vital role to play
For further information please contact:
Caroline Lawes
ComRes, Four Millbank, London SW1P 3JA
020 7340 9637