Political strikes and its impact on trade
35
Working paper Political strikes and its impact on trade Evidence from Bangladeshi transaction-level export data Reshad N Ahsan Kazi Iqbal May 2015
Transcript of Political strikes and its impact on trade

Working paper
Political strikes and its impact on trade
Evidence from Bangladeshi transaction-level export data
Reshad N Ahsan Kazi IqbalMay 2015

1
Political Strikes and its Impact on Trade:
Evidence from Bangladeshi Transaction-Level Export Data*
Reshad N Ahsan† Kazi Iqbal‡ University of Melbourne Bangladesh Institute of Development
Studies
May 2015
Abstract
In this paper we estimate the impact of violent political strikes on firm exports using daily, firm-level exports data from Bangladesh. These strikes, locally known as hartals, are organized by opposition political parties and interest groups in Bangladesh as a form of protest against the government. These strikes are especially costly because they are used to coercively shut down factories, roads, ports, as well as all private and public institutions. Our results suggest that hartals have an adverse effect on firm exports that is both statistically and economically significant. In particular, we find that the cumulative effect of a hartal over a seven-day period results in a reduction in firm exports of 4.5 percent. Our results also indicate that hartals have stronger effects on smaller exporters as well as exporters producing lower-priced, generic products. Finally, we find that the cumulative effect of a hartal over a seven-day period results in an increase in a firm’s use of air shipment by 2.1 percentage points.
* The authors are grateful for the generous funding provided for this project by the International Growth Centre. † Reshad N Ahsan, Department of Economics, University of Melbourne, Parkville, Melbourne, Australia. Email: [email protected]. ‡ Kazi Iqbal, Bangladesh Institute of Development Studies, Dhaka, Bangladesh. Email: [email protected].
2
1. Introduction
Delays are an important barrier to international trade. Djankov, Freund, and Pham
(2010) estimate that an additional day spent prior to shipment reduces trade by more than 1
percent.4 Similarly, Hummels and Schaur (2012) estimate that each day spent in transit costs a
firm 0.6–2.1 percent of its shipment’s value. Such delays are extremely costly for several reasons.
First, delays impose significant inventory-holding costs. Second, delays are costly for firms that
export or import perishable goods as well as goods that have seasonal demand. The existing
literature has focused on two key sources of these delays: (a) weak domestic infrastructure and
procedural barriers at ports (Djankov et al. 2010) and (b) the mode of transport used (Hummels
2007; Hummels and Schaur 2010, 2013). In this paper we examine a third source of delays for
exporting firms: political violence. In particular, we examine how violence due to political
strikes impact exports in Bangladesh during the period 2005−2013.
These strikes, locally known as hartals, are organized by opposition political parties and
interest groups in Bangladesh as a form of protest against the government. These strikes
typically last an entire working day although the duration could either be shorter or longer.
While hartals trace their roots to earlier episodes of civil disobedience against colonialism in
South Asia, their prevalence in Bangladesh has increased dramatically in recent years.5 Hartals
are especially costly because they are used to coercively shut down factories, roads, ports, as well
as all private and public institutions. The requirement that such activities/institutions be halted
is enforced by the threat of violence. For example, during a recent hartal on December 11, 2012,
pro-hartal ‘activists’ set several vehicles on fire in the capital Dhaka. Such acts of violence
4 This includes the time spent transporting a product from the factory to the port along with the time required to complete the procedures needed to export. 5 UNDP (2005) reports that there were a total of 1,072 hartals in Bangladesh between 1987 and 2002. In other words, on average, there was a hartal every 5.4 days in Bangladesh over this period. This report also estimates that the cost of hartals during the 1990s was 3–4 percent of Bangladesh’s GDP.
3
provide a strong incentive for local businesses to keep factories closed and to not use the roads to
transport products.
In this paper we estimate the impact of these hartals on firm exports using daily, firm-
level exports data from Bangladesh. In addition to quantifying the magnitude of this effect, we
exploit the richness of our data to examine how firms cope with the disruption caused by hartals.
That is, we examine how firms attenuate the adverse effect of hartals. In particular, we focus on
two coping strategies: (a) the shifting of export shipments to several days following a hartal and
(b) switching to the far costlier air shipment to meet shipment deadlines.
We examine these issues using two sets of data: (a) data on hartals and (b) daily, firm-
level data on exports. The data on hartals were collected from two daily newspapers in
Bangladesh for the period 2005−2013. We collected information on the date and duration (half
day, full day, etc.) of each hartal. We also collected information on when a hartal was announced
to capture the amount of time that firms had to adjust their shipment plans. In addition, we also
collected information on the following characteristics of hartals: (i) the extent of violence during a
hartal, (ii) the stated reason for calling a hartal, and (iii) the party or organization that called the
hartal (e.g. the main opposition party, bus-truck owners’ association, etc.). To our knowledge,
such comprehensive data on hartals in Bangladesh during this time period are not available
elsewhere.
We then combine our hartal data with firm-level, administrative trade data for
Bangladesh. These data, which are collected by the National Bureau of Revenue (NBR), include
the universe of export transactions for Bangladesh and also cover the period 2004 – 2013. We use
these data to construct a firm and day panel. This is important as it allows us to include firm and
various time fixed effects to control for confounding factors. The NBR also collects information
on the port of export for each transaction. This allows us to distinguish between shipments
made by sea and by air for all exports. As mentioned before, hartals may force exporters to

4
transport their products by costlier means (e.g. by air) to meet their deadlines. We can use our
data to examine the extent to which this occurs.
Our results suggest that hartals have an adverse effect on firm exports that is both
statistically and economically significant. In particular, we find that on the day of a hartal, firm
exports decline by 6.6%. However, we also find that firms cope with the disruption caused by
hartals by delaying their exports by several days. As a result of this coping strategy, the
contemporaneous effect mentioned above represents the upper bound (in terms of magnitude) of
the effect of hartals on firm exports. When we consider firm exports over a seven-day period that
starts with the day before a hartal and extends to five days after a hartal, we find that the
cumulative effect of a hartal is a reduction in firm exports of 4.5%. We interpret this as evidence
that firms attenuate the effect of a hartal by increasing their shipments several days after the
hartal itself. Our results also suggest that hartals have stronger effects on smaller exporters as
well as exporters producing lower-priced, generic products.
Another coping strategy that we identify in the data is the increased use of air shipment
in response to a hartal. In particular, we find that on the day of a hartal, firm exports by air
increase by 3 percentage points. In our data, 19.8% of shipments are made by air. Thus, this
estimated impact represents a significant increase in the likelihood of air shipment. Once again,
we find that firms attenuate the adverse effects of a hartal by lowering air shipments several days
after a hartal itself. When we consider the use of air shipment over a seven-day period that starts
with the day before a hartal and extends to five days after a hartal, we find that the cumulative
effect of a hartal is an increase in the likelihood of air shipment of 2.1 percentage points. In other
words, in response to a hartal, firms increase the use of air shipment on the day of the hartal itself
but reduce it several days after the hartal.

5
This paper is related to a literature that uses the gravity model to examine the impact of
conflict on trade. For instance, Blomberg and Hess (2006) examine how various types of conflict
affect bilateral trade between countries. Their estimates suggest that violent conflict is a greater
barrier to trade than traditional tariff barriers. This result is supported by Glick and Taylor
(2010), who use historical data spanning the period 1870−1997 to estimate the effect of conflict on
bilateral trade. Their results suggest that conflict has large and persistent adverse effects on
trade. Lastly, Martin, Thoenig and Mayer (2008) also use a gravity equation to examine the
impact of civil conflict on bilateral trade between countries. Their findings suggest that, a year
after a conflict, a country's trade is reduced by 25 percent relative to its trade in the absence of a
conflict.
This paper is also related to a nascent literature examining the impact of natural disasters
on trade. A recent contribution to this literature is Besedes and Murshid (2014). They examine
how the eruption of the Icelandic volcano, Eyjafjallajökull, impacted exports from the affected
countries to the U.S. and Japan. Similarly, Volpe Martincus, and Blyde (2013) study the effect of
a Chilean earthquake in 2010 on export volumes. Lastly, this paper is related to an extensive
literature on the impact of conflict on firm performance.6In particular, our paper is most closely
related to Ksoll, Macchiavello, and Morjaria (2010), who examine the impact of the 2007 post-
election violence in Kenya on the export of flower producers there. Because flowers are highly
perishable, any delays due to conflict are expected to have a strong adverse effects on flower
exports. Ksoll et al. (2010) confirm that this is the case. They find that the post-election violence
increased worker absenteeism by 50 percent and reduced flower exports by 38 percent. The
sudden and unanticipated nature of the violence allows the authors to identify the causal effects
of the violence on exports. However, given the unique nature of the floriculture industry, it is
6 See Blattman and Miguel (2010) for a comprehensive review of the literature on the economic impacts of conflict.

6
unclear whether their results speak to the general impact of conflict on firm exports. Further,
given that the post-election violence was short lived and unexpected, it cannot be used to
examine if and how firms cope with the adverse impact of the violence. On the other hand, our
setting does allow us to examine such coping behavior.
The rest of the paper is structured as follows. In section 2 we discuss the method we
followed to construct our hartal database. In this section we also describe our firm-level export
data. In section 3 we discuss the econometric method we use to identify the effect of hartals on
firm-level exports. In section 4 we discuss our results.
2. Data
As mentioned above, the data on hartals are not readily available. Hence, we collected
and compiled information on hartals from the two most popular Bengali and English language
daily newspapers in Bangladesh–. These are The Daily Ittefaq and The Daily Star respectively.
Our research assistants went through the archives of these newspapers for each day of our
sample period to collect the information on hartal. In order to avoid data collection errors, we
had two research assistants independently collect this information. We then compared the
entries and corrected any discrepancies.
Apart from collecting the date when the hartal occurred, we also collected the
announcement date. Other information about hartal that we collected include the length of a
hartal, extent of violence, the political party(s) calling the hartal and reasons for calling the hartal.
The extent of violence is captured by the number of people injured and killed. We take simple
arithmetic mean of the reported numbers of the two newspapers. That is why the average
number of people killed and injured may be reported as a fraction (Table 1). In general,
demonstrations and other political activities also take place one day before the hartal in support

7
for the hartal of the following day(s). These activities also involve violence. We categorize such
violence as being related to a hartal.
The most difficult part of compiling the data was to collect the data on the number of
persons injured and killed. In some cases, the exact number is not reported. For instance, the
newspaper may state that “dozens of people were injured” or “more than a hundred people
were injured”. In such cases, if one newspaper reports the number, we use that one only. If both
the newspapers are vague about the number, we used a third newspaper, The Prothom Alo,
which is another popular Bangla daily newspaper.
Figure 1 illustrates the annual trend in hartals during the period 2005−2013. In the first
half of this time period, the prevalence of hartals was increasing immediately before the general
elections that were scheduled for 22nd January, 2007. These hartals in the 2005−2006 period were
mainly called by the then opposition party, the Awami League, and its coalition partners to
protest the legitimacy of the elections to be held in early 2007. In the face of increasingly violent
unrest, the Bangladeshi military intervened on 11th January, 2007 and installed a military-backed
caretaker government. This government remained in power until the general elections held on
29th December, 2008. As Figure 1 illustrates, this period of military-backed rule was relatively
free from hartals. However, the prevalence of hartals again increased during the year preceding
the general elections that were held on 5th January, 2014. These hartals were called by the
Bangladesh Nationalist Party and its coalition partners, which were in the opposition at the time
to protest the 2014 elections that were to be held under a partisan government for the first time
since the restoration of democracy in 1991.
Next, as Table 1 demonstrates, not only did hartals become more frequent during the
second half of our sample period, the hartals themselves become more intense. The first row
confirms the trend depicted in Figure 1. It shows that, of the 152 hartals called during our sample

8
period, 99 were called during the second half of our sample period (2010−2013). Further, the
hartals during this second half were much more likely to be strikes rather than blockades. The
former is a nationwide, forced shutdown of factories, roads, and other methods of transportation
while the latter is a blockade of all roads and railways into and out of major cities, primarily the
capital Dhaka.
Further, the hartals in the second half of our sample period were also called with less
notice provided to firms. For instance, during the period 2005−2009, hartals were announced
about 7 days before the hartal itself. However, during the period 2010−2013, hartals were
announced about 4.5 days before the hartal itself. Lastly, during first half of our sample period,
there were about 0.5 deaths per hartal whereas in the second half, there were about 2 deaths per
hartal. However, the number of injuries did decrease from about 133 per hartal in the first half to
102 per hartal in second half. Thus, Figure 1 and Table 1 indicate that not only have hartals
become more prevalent in Bangladesh in recent years, they have also become more violent and
intense.
The data on daily exports are from the National Board of Revenue (NBR), which
administers daily custom information using ASYCUDA++. This Automated System for Customs
Data is a computerized system designed by the United Nations Conference on Trade and
Development (UNCTAD). Our transaction level data on export comes from this ASYCUDA
system. While this system compiles a wide range of information regarding a particular
transaction, we use only a few of them which have direct bearing on our study. This includes
date of export, exporters’ unique identification number, total volume of export, HS codes of the
product and ports of export. Table 2 provides descriptive statistics of these trade data. All
monetary values reported in the paper are in constant 2010 Bangladesh Taka. This table

9
indicates that the average firm in our data exports 2.4 million Taka worth of goods each day. Of
these shipments 20.4 percent are through air transport.
3. Econometric Method
To examine the relationship between hartals and exports, we follow the approach used by
earlier papers that examine the effect of a transportation shock on export volume. For example,
Besedes and Murshid (2014) use monthly import data to examine the effect of the eruption of
Iceland’s Eyjafjallajökull volcano in 2010 on exports of affected countries to the U.S. and Japan.
Similarly, Volpe Martincus and Blyde (2013) study the effect of a Chilean earthquake in 2010 on
export volumes. Finally, Ksoll et al. (2010) examine the effect of election-related violence on
flower exporters in Kenya.7 Implementing such an approach involves estimating the following
econometric specification:
ln(𝑋𝑖𝑡) = 𝛼1 + 𝛽𝐻𝑡 + 𝛾𝜑𝑑𝑦 + 𝜃𝑖 + 𝜃𝑑𝑤 + 𝜃𝑚 + 𝜃𝑦 + 𝜖𝑖𝑡 (1)
where 𝑋𝑖𝑡 is the value of firm 𝑖’s total exports on day 𝑡.8 We also use as a dependent variable an
indicator for whether a firm uses air shipment to export their goods. Here our aim is to capture
whether a firm switches to the far costlier air shipment to ensure that their goods reach their
buyers on time.
𝐻𝑡is an indicator variable that is one if there was a hartal on day 𝑡 and zero otherwise.
Thus, 𝛽 captures the contemporaneous effect of a hartal on firm exports. 𝜃𝑖are firm fixed-effects
that control for unobserved, time-invariant firm characteristics that are correlated with both
exports and hartals. We also include a day-of-year trend (𝜑𝑑𝑦) in our econometric specification.
7 While they do not examine the effect of a transportation shock, Chor and Manova (2013) use a similar approach to estimate the effect of the Global Financial Crisis on international trade flows. 8 Some firms in our sample make multiple export shipments during a particular day. In such cases, we add together all shipments for such firms during that day. In other words, we have one observation per firm during its export days.

10
This controls for any seasonal factors that might be correlated with exports. For instance, exports
for particular products might exhibit strong seasonal patterns (e.g. summer or winter clothing).
Thus, by not including a day-of-year trend, our regression estimates might be picking up
spurious changes in the data. We also include day-of-week fixed effects (𝜃𝑑𝑤), which will capture
any secular variation in exports during the week. Further, we include month fixed effects (𝜃𝑚) to
further control for seasonal patterns in exports and year fixed effects (𝜃𝑦) to capture macro-level
factors that are correlated with hartals as well as a firm’s export decision. Lastly, 𝜖𝑖𝑡 is a classical
error term.
A limitation of the above approach is the implicit restriction that hartals only affect
exports on the day on which it is organized. While this is perhaps appropriate for a sudden, one-
time shock such as a volcanic eruption or an earthquake or for a perishable product such as
flowers, it is an important shortcoming in our context for the following reason. Unlike a natural
disaster or sudden outbreak of post-election violence, hartals are not completely unexpected.
While some hartals are announced with less than twenty-four hours’ notice, most are announced
a few days before the hartal itself.9 This means that firms have the opportunity to change their
shipment dates to ensure that all of its intended export goods are shipped to the buyer. The
econometric specification in equation (1) will not be able to capture this coping strategy. To
examine whether there is evidence of such shipment reallocations, we estimate the following
econometric specification:
ln(𝑋𝑖𝑡) = 𝛼2 + � 𝛽𝑠𝐻𝑡−𝑠5
𝑠=−1+ 𝛾𝜑𝑑
𝑦 + 𝜃𝑖 + 𝜃𝑑𝑤 + 𝜃𝑚 + 𝜃𝑦 + 𝜀𝑖𝑡 (2)
Here 𝐻𝑡−𝑠 is an indicator variable for whether there was a hartal on day 𝑡 − 𝑠. Thus, each
coefficient 𝛽𝑠 captures the impact of a hartal that occurred 𝑠 days ago on today’s exports. The use
9 As Figure A1 illustrates, 16.5% of hartals are announced the day before the hartal and 56.6% of hartals are announced with three or fewer days’ notice.
11
of lagged hartal indicators allows us to capture the extent to which firm’s reallocate their
shipment away from hartal days and towards days immediately following a hartal. Thus, if such
reallocation is not prevalent then we would expect 𝛽𝑠 to equal zero for all 𝑠 ≠ 0. The remaining
control variables in equation (2) are as defined before while 𝜀𝑖𝑡 is a classical error term. To
ensure that our inference is correct, we report heteroskedasticity robust standard errors that are
clustered at the exporter level.
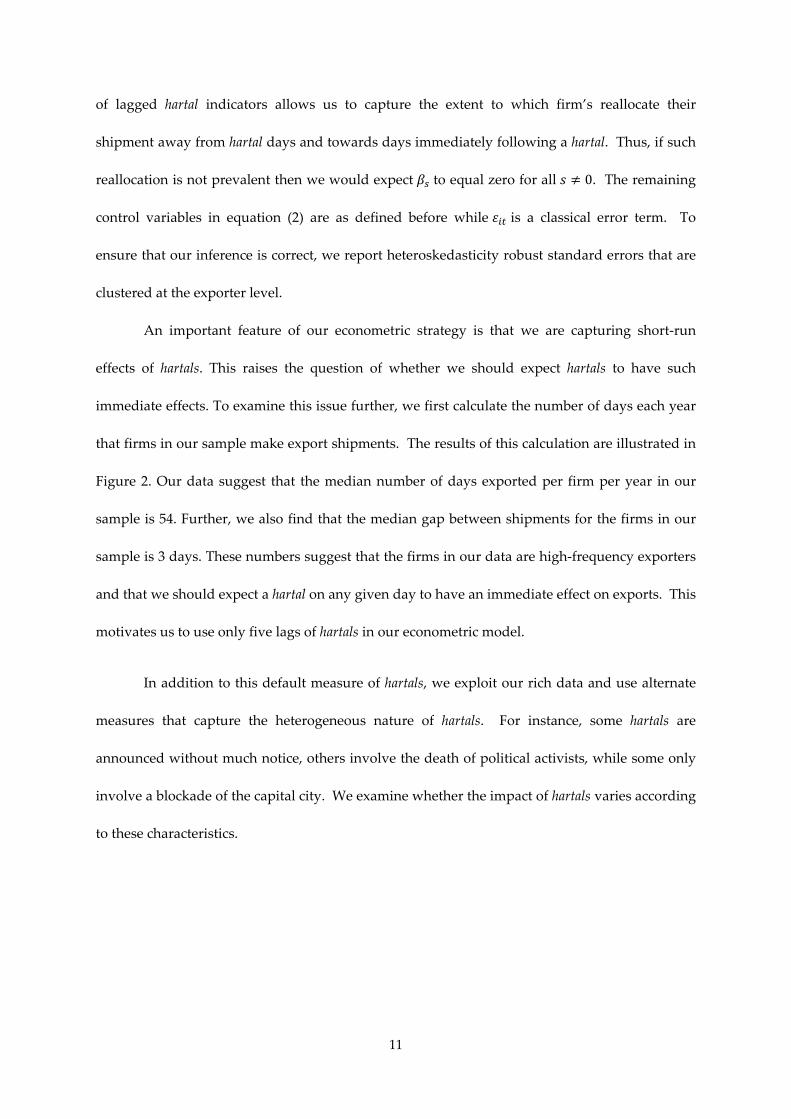
An important feature of our econometric strategy is that we are capturing short-run
effects of hartals. This raises the question of whether we should expect hartals to have such
immediate effects. To examine this issue further, we first calculate the number of days each year
that firms in our sample make export shipments. The results of this calculation are illustrated in
Figure 2. Our data suggest that the median number of days exported per firm per year in our
sample is 54. Further, we also find that the median gap between shipments for the firms in our
sample is 3 days. These numbers suggest that the firms in our data are high-frequency exporters
and that we should expect a hartal on any given day to have an immediate effect on exports. This
motivates us to use only five lags of hartals in our econometric model.
In addition to this default measure of hartals, we exploit our rich data and use alternate
measures that capture the heterogeneous nature of hartals. For instance, some hartals are
announced without much notice, others involve the death of political activists, while some only
involve a blockade of the capital city. We examine whether the impact of hartals varies according
to these characteristics.

12
4. Results
4.1 Hartals and Export Value
Table 3 reports the results from estimation equations (1) and (2). In column (1) we
estimate the contemporaneous effect of a hartal (equation (1)), i.e. the effect of a hartal on firm
exports on that day. The coefficient of the hartal indicator confirms that hartals have a statistically
significant, negative effect on firm exports. This effect is also economically significant. The
coefficient of the hartal indicator indicates that a hartal lowers the exports of the average firm in
the sample by 6.6% on that day.
As discussed above, estimating only this contemporaneous effect ignores the possibility
that firms can reallocate their export shipments away from the day of the hartal and towards
other days. To the extent that such reallocation is prevalent, it will attenuate the effect of hartals
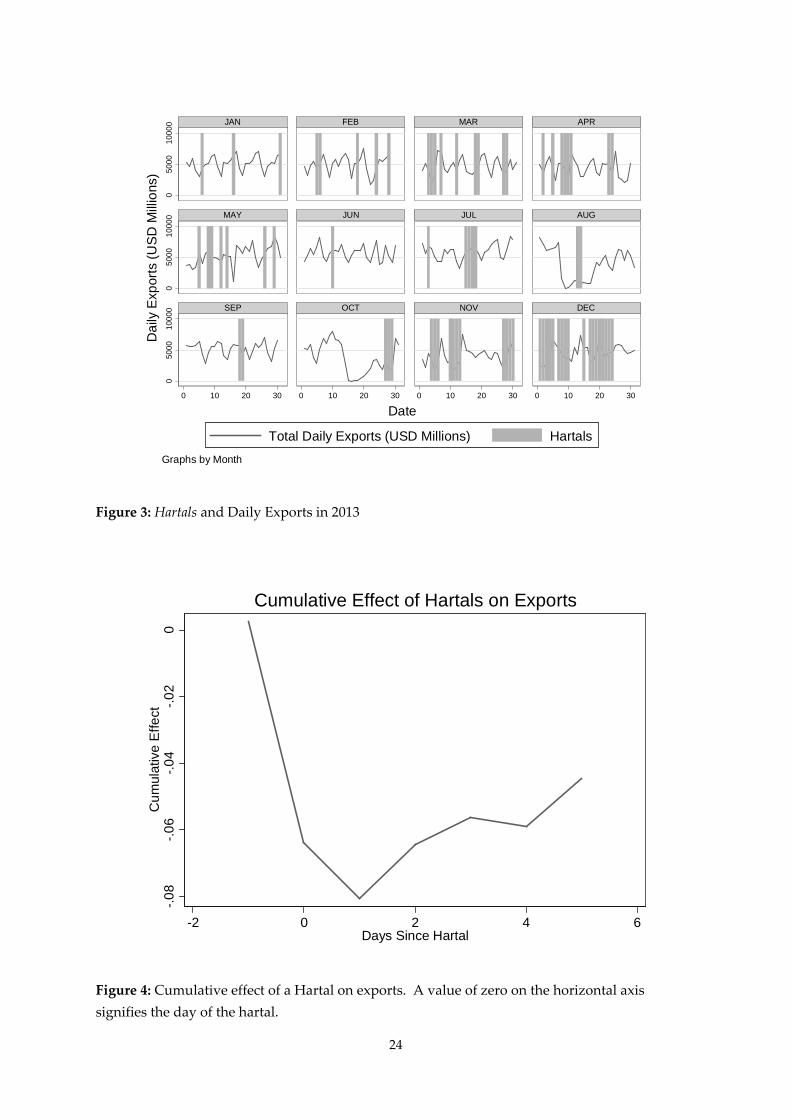
on firm exports. The extent of reallocation is highlighted by Figure 3, where we plot daily
exports by month along with indicators for hartal days during 2013. This figure illustrates the
tremendous volatility in exports immediately preceding and following the day of a hartal. In
fact, in many cases, the increase in exports immediately after a hartal is evident in the raw data.
We examine this adjustment behavior further by estimating equation (2). In column (2)
of Table 3 we include two additional hartal indicators. The first is an indicator that is one if there
will be a hartal tomorrow and is zero otherwise (𝐻𝑡+1). This indicator measures whether firms
change their shipments the day before a hartal takes place. The second hartal indicator is one if
there was a hartal yesterday and zero otherwise (𝐻𝑡−1). This indicator measures whether firms
change their shipments the day after a hartal takes place.
13
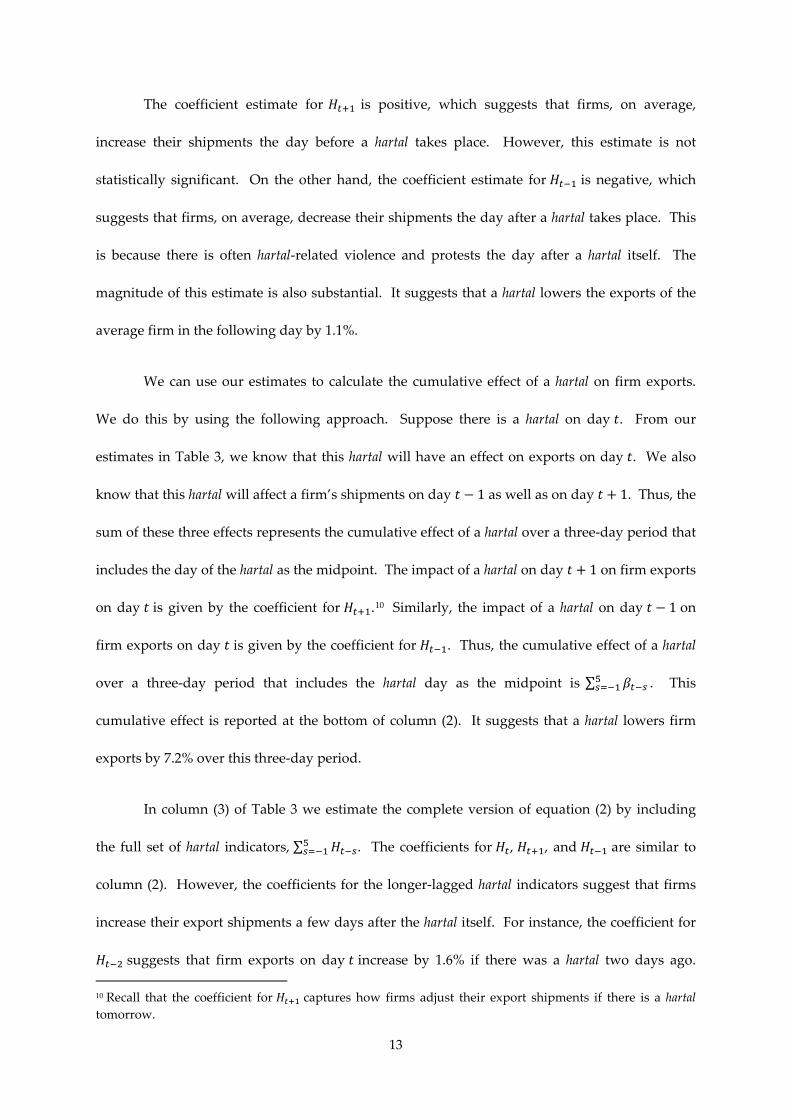
The coefficient estimate for 𝐻𝑡+1 is positive, which suggests that firms, on average,
increase their shipments the day before a hartal takes place. However, this estimate is not
statistically significant. On the other hand, the coefficient estimate for 𝐻𝑡−1 is negative, which
suggests that firms, on average, decrease their shipments the day after a hartal takes place. This
is because there is often hartal-related violence and protests the day after a hartal itself. The
magnitude of this estimate is also substantial. It suggests that a hartal lowers the exports of the
average firm in the following day by 1.1%.
We can use our estimates to calculate the cumulative effect of a hartal on firm exports.
We do this by using the following approach. Suppose there is a hartal on day 𝑡. From our
estimates in Table 3, we know that this hartal will have an effect on exports on day 𝑡. We also
know that this hartal will affect a firm’s shipments on day 𝑡 − 1 as well as on day 𝑡 + 1. Thus, the
sum of these three effects represents the cumulative effect of a hartal over a three-day period that
includes the day of the hartal as the midpoint. The impact of a hartal on day 𝑡 + 1 on firm exports
on day 𝑡 is given by the coefficient for 𝐻𝑡+1.10 Similarly, the impact of a hartal on day 𝑡 − 1 on
firm exports on day 𝑡 is given by the coefficient for 𝐻𝑡−1. Thus, the cumulative effect of a hartal
over a three-day period that includes the hartal day as the midpoint is ∑ 𝛽𝑡−𝑠5𝑠=−1 . This
cumulative effect is reported at the bottom of column (2). It suggests that a hartal lowers firm
exports by 7.2% over this three-day period.
In column (3) of Table 3 we estimate the complete version of equation (2) by including
the full set of hartal indicators, ∑ 𝐻𝑡−𝑠5𝑠=−1 . The coefficients for 𝐻𝑡, 𝐻𝑡+1, and 𝐻𝑡−1 are similar to
column (2). However, the coefficients for the longer-lagged hartal indicators suggest that firms
increase their export shipments a few days after the hartal itself. For instance, the coefficient for
𝐻𝑡−2 suggests that firm exports on day 𝑡 increase by 1.6% if there was a hartal two days ago. 10 Recall that the coefficient for 𝐻𝑡+1 captures how firms adjust their export shipments if there is a hartal tomorrow.
14
Similarly, firm exports on day 𝑡 increase by 0.8% and 1.5% if there was a hartal three and five
days ago respectively.
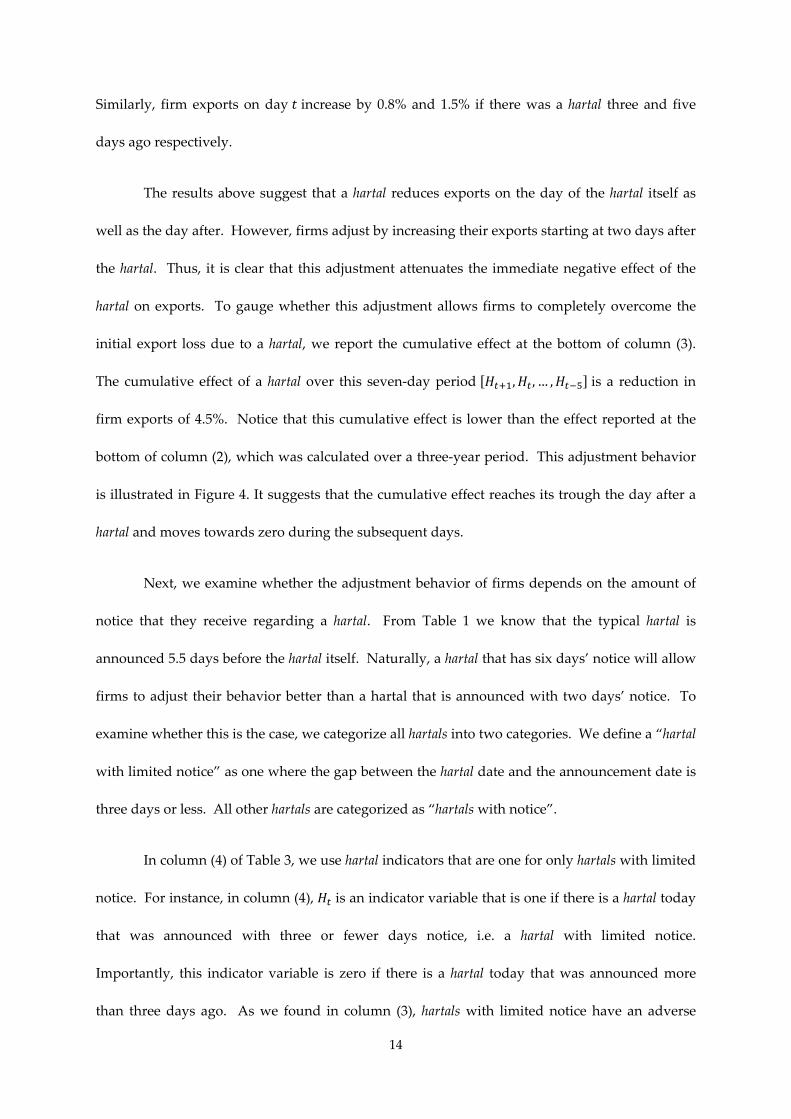
The results above suggest that a hartal reduces exports on the day of the hartal itself as
well as the day after. However, firms adjust by increasing their exports starting at two days after
the hartal. Thus, it is clear that this adjustment attenuates the immediate negative effect of the
hartal on exports. To gauge whether this adjustment allows firms to completely overcome the
initial export loss due to a hartal, we report the cumulative effect at the bottom of column (3).
The cumulative effect of a hartal over this seven-day period [𝐻𝑡+1,𝐻𝑡 , … ,𝐻𝑡−5] is a reduction in
firm exports of 4.5%. Notice that this cumulative effect is lower than the effect reported at the
bottom of column (2), which was calculated over a three-year period. This adjustment behavior
is illustrated in Figure 4. It suggests that the cumulative effect reaches its trough the day after a
hartal and moves towards zero during the subsequent days.
Next, we examine whether the adjustment behavior of firms depends on the amount of
notice that they receive regarding a hartal. From Table 1 we know that the typical hartal is
announced 5.5 days before the hartal itself. Naturally, a hartal that has six days’ notice will allow
firms to adjust their behavior better than a hartal that is announced with two days’ notice. To
examine whether this is the case, we categorize all hartals into two categories. We define a “hartal
with limited notice” as one where the gap between the hartal date and the announcement date is
three days or less. All other hartals are categorized as “hartals with notice”.
In column (4) of Table 3, we use hartal indicators that are one for only hartals with limited
notice. For instance, in column (4), 𝐻𝑡 is an indicator variable that is one if there is a hartal today
that was announced with three or fewer days notice, i.e. a hartal with limited notice.
Importantly, this indicator variable is zero if there is a hartal today that was announced more
than three days ago. As we found in column (3), hartals with limited notice have an adverse
15
effect on firm exports on the day of the hartal as well as the day after a hartal. However, firms
increase their exports starting at two days after the hartal. In column (5) we use hartal indicators
that are one for only hartals with notice. For instance, in column (5), 𝐻𝑡 is an indicator variable
that is one if there is a hartal today that was announced with more than three days notice. This
indicator is zero for a hartal today that was announced three or fewer days ago. The estimates in
column (5) also support the adjustment behavior found in the earlier columns.
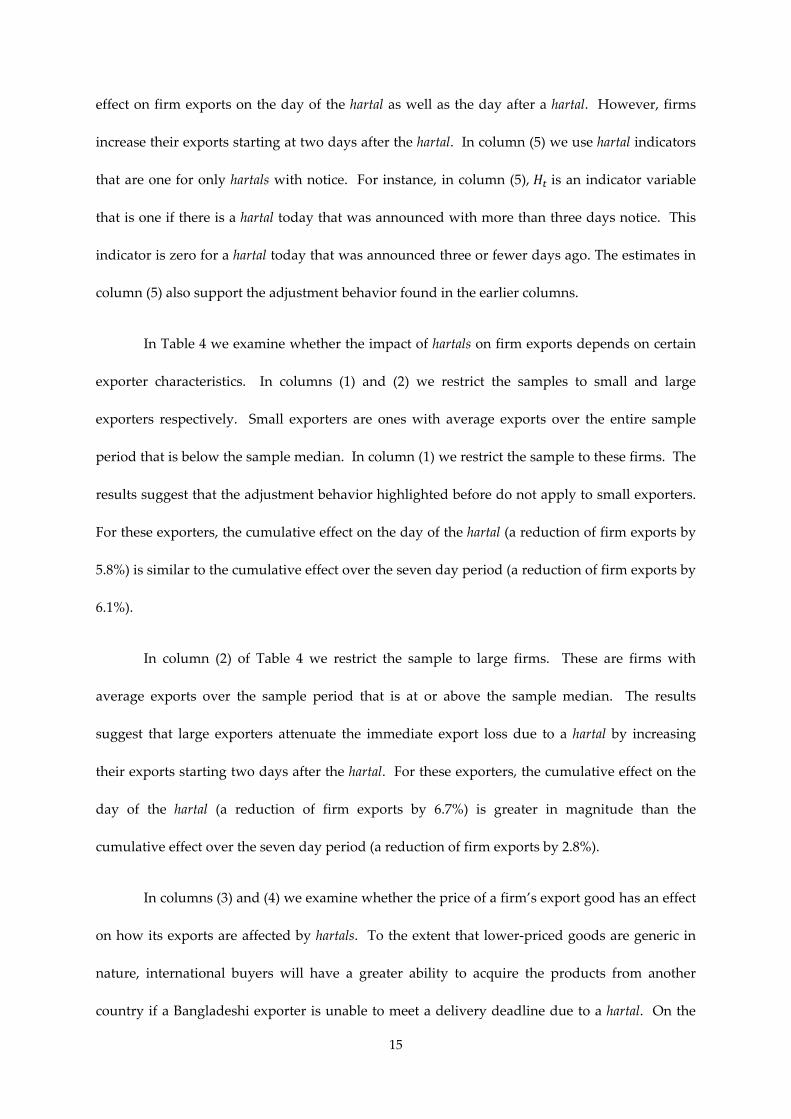
In Table 4 we examine whether the impact of hartals on firm exports depends on certain
exporter characteristics. In columns (1) and (2) we restrict the samples to small and large
exporters respectively. Small exporters are ones with average exports over the entire sample
period that is below the sample median. In column (1) we restrict the sample to these firms. The
results suggest that the adjustment behavior highlighted before do not apply to small exporters.
For these exporters, the cumulative effect on the day of the hartal (a reduction of firm exports by
5.8%) is similar to the cumulative effect over the seven day period (a reduction of firm exports by
6.1%).
In column (2) of Table 4 we restrict the sample to large firms. These are firms with
average exports over the sample period that is at or above the sample median. The results
suggest that large exporters attenuate the immediate export loss due to a hartal by increasing
their exports starting two days after the hartal. For these exporters, the cumulative effect on the
day of the hartal (a reduction of firm exports by 6.7%) is greater in magnitude than the
cumulative effect over the seven day period (a reduction of firm exports by 2.8%).
In columns (3) and (4) we examine whether the price of a firm’s export good has an effect
on how its exports are affected by hartals. To the extent that lower-priced goods are generic in
nature, international buyers will have a greater ability to acquire the products from another
country if a Bangladeshi exporter is unable to meet a delivery deadline due to a hartal. On the

16
other hand, if higher-priced goods are more customized, then buyers may not be able to switch
to another supplier if a Bangladeshi exporter is unable to meet a delivery deadline. This suggests
that hartals will have a more adverse effect on the exports of firms that produce lower-priced,
generic goods.
To examine the above hypothesis, we restrict the sample to high-priced exporters in
column (3). We define high-priced exporters as those with an average price over the entire
sample period that is above the sample median. The results in column (3) suggest that the
cumulative effect of hartals for these firms is a reduction in export value of 2.8%. In column (4)
we restrict the sample to low-priced exports, i.e. exporters with an average price over the entire
sample period that is at or below the sample median. The results in column (4) suggest that the
cumulative effect of hartals for these firms is a reduction in export value of 6%. Thus, these
results confirm that firms producing lower priced, generic products are more adversely affected
by hartals.
4.2 Hartals and the Mode of Transportation
One of the ways in which the exporters in our sample may cope with the delays and
disruptions caused by hartals is to export their goods through air rather than through the sea.
The use of air shipments allows these exporters to potentially overcome the delays caused by
hartals. To examine whether firms actually use this strategy, we estimate a version of equations
(1) and (2) with a dependent variable that is one for air shipments and zero otherwise. The
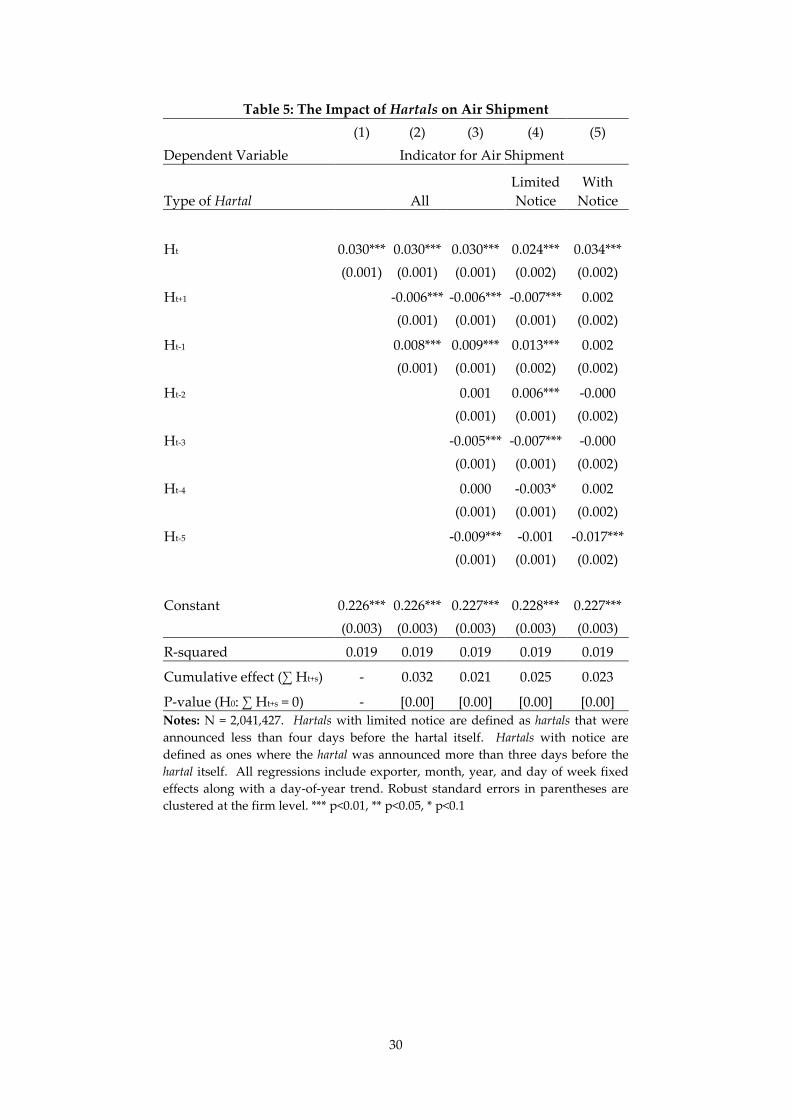
results are reported in Table 5. In column (1) we estimate the contemporaneous effect of hartals
on the probability of air shipment. The results suggest that a hartal increases the probability of
air shipment on the day of the hartal by 3 percentage points. In our data, 19.8% of shipments are

17
made by air. Thus, the impact estimated in column (1) represents a significant increase in the
likelihood of air shipment.
In column (2) we examine the cumulative effect of hartals on air shipment over a three-
day period with the hartal as the midpoint. The results suggest that firms decrease their use of
air shipment the day before a hartal and increase their use of air shipment on the day of a hartal
as well as on the day after. The cumulative effect over this three-day period, as reported at the
bottom of column (2), is a 3.2 percentage point increase in the probability of air shipment due to
a hartal. In column (3) we estimate a version of equation (2) with an indicator for air shipment as
the dependent variable. Once again we observe firms altering their shipment mode to attenuate
the adverse effect of hartals. For instance, the results suggest that firms decrease air shipments
the day before the hartal, increase air shipments on the day of the hartal as well as the day after,
and then reduce air shipments a few days after the hartal. This is illustrated in Figure 5. The
cumulative effect over a seven-day period is a 2.1 percentage point increase in the probability of
air shipment due to a hartal. This is considerably lower than the contemporaneous effect of 3
percentage points.
In columns (4) and (5) of Table 5 we examine whether the impact of hartals on air
shipment depends on the notice that firms receive regarding the hartal date. In column (4) we
define our hartal indicators as one if there is a hartal on that day that was announced three or
fewer days ago (i.e. “hartals with limited notice”). In column (5) we define our hartal indicators
as one if there is a hartal on that day that was announced more than three days ago (i.e. “hartals
with notice”). In both cases, the cumulative effect over a seven-day period is similar in
magnitude.

18
4.3 Hartal Heterogeneity
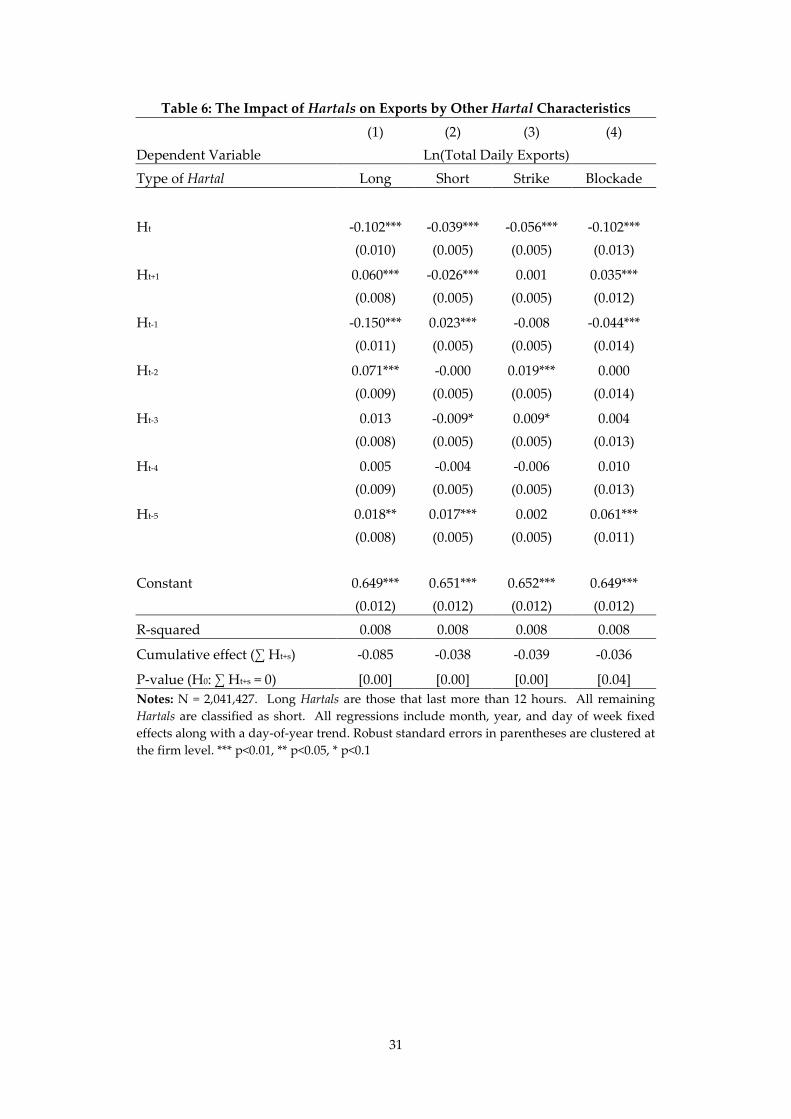
In Table 6 we examine if our baseline results change if we focus on particular type of
hartals. In columns (1) and (2) we focus on long vs. short hartals. Long hartals are those that are
called for more than 12 hours whereas short-hartals are those that are called for less than 12 hours
(“half-day hartal”). In both cases, we observe an adjustment pattern that is similar to our
previous results. That is, hartals reduce exports on the day of the hartal as well as the day after
the hartal is called. However, firms increase their exports starting at several days after the hartal
itself. In the case of longer hartals, the cumulative effect of a hartal over a seven-day period is a
reduction in export value of 8.5%. On the other hand, for short hartals, the cumulative effect of a
hartal over a seven-day period is a reduction in export value of 3.8%.
In columns (5) and (6) we distinguish between the two types of hartals in our data: (a)
strike and (b) blockade. The former involves a countrywide shutdown of major roads and
highways while the latter is a blockade of all roads into and out of major cities (typically the
capital, Dhaka). Our baseline measure of hartal does not distinguish between these two. We
examine whether they have different effects on firm exports in columns (5) and (6) of Table 6. In
column (5) our hartal indicator as one if there was a strike on a given day and zero otherwise.
The cumulative effect of such hartals over a seven-day period is a reduction of firm exports of
3.9%. In column (6) our hartal indicator as one if there was a blockade on a given day and zero
otherwise. In this case, the cumulative effect of such hartals over a seven-day period is a
reduction of firm exports of 3.6%. Thus, these two types of disruptions have very similar
cumulative effects on firm export values.
19
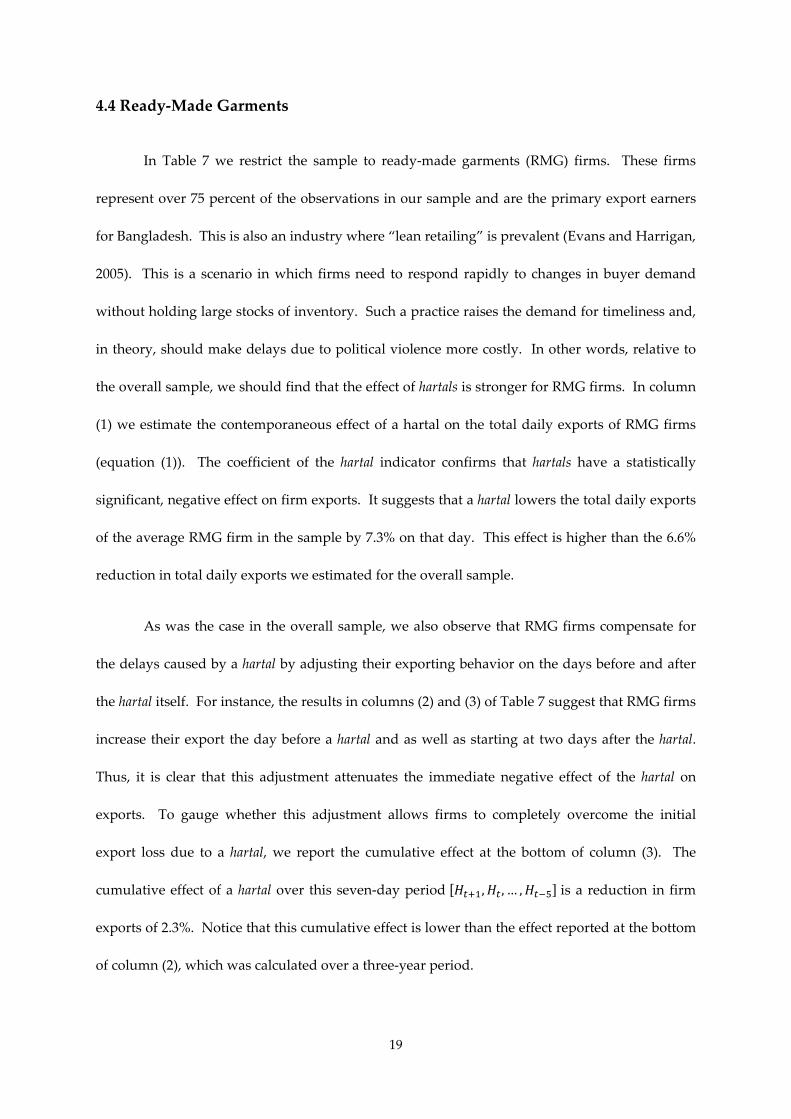
4.4 Ready-Made Garments
In Table 7 we restrict the sample to ready-made garments (RMG) firms. These firms
represent over 75 percent of the observations in our sample and are the primary export earners
for Bangladesh. This is also an industry where “lean retailing” is prevalent (Evans and Harrigan,
2005). This is a scenario in which firms need to respond rapidly to changes in buyer demand
without holding large stocks of inventory. Such a practice raises the demand for timeliness and,
in theory, should make delays due to political violence more costly. In other words, relative to
the overall sample, we should find that the effect of hartals is stronger for RMG firms. In column
(1) we estimate the contemporaneous effect of a hartal on the total daily exports of RMG firms
(equation (1)). The coefficient of the hartal indicator confirms that hartals have a statistically
significant, negative effect on firm exports. It suggests that a hartal lowers the total daily exports
of the average RMG firm in the sample by 7.3% on that day. This effect is higher than the 6.6%
reduction in total daily exports we estimated for the overall sample.
As was the case in the overall sample, we also observe that RMG firms compensate for
the delays caused by a hartal by adjusting their exporting behavior on the days before and after
the hartal itself. For instance, the results in columns (2) and (3) of Table 7 suggest that RMG firms
increase their export the day before a hartal and as well as starting at two days after the hartal.
Thus, it is clear that this adjustment attenuates the immediate negative effect of the hartal on
exports. To gauge whether this adjustment allows firms to completely overcome the initial
export loss due to a hartal, we report the cumulative effect at the bottom of column (3). The
cumulative effect of a hartal over this seven-day period [𝐻𝑡+1,𝐻𝑡 , … ,𝐻𝑡−5] is a reduction in firm
exports of 2.3%. Notice that this cumulative effect is lower than the effect reported at the bottom
of column (2), which was calculated over a three-year period.
20
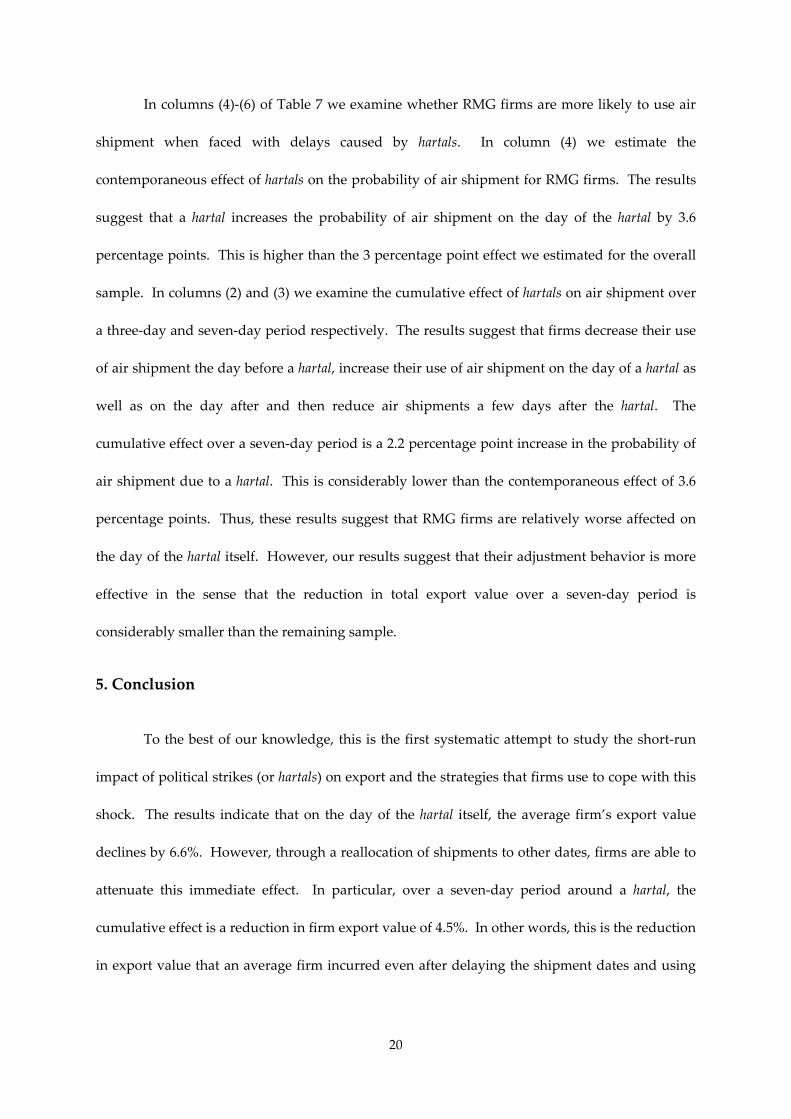
In columns (4)-(6) of Table 7 we examine whether RMG firms are more likely to use air
shipment when faced with delays caused by hartals. In column (4) we estimate the
contemporaneous effect of hartals on the probability of air shipment for RMG firms. The results
suggest that a hartal increases the probability of air shipment on the day of the hartal by 3.6
percentage points. This is higher than the 3 percentage point effect we estimated for the overall
sample. In columns (2) and (3) we examine the cumulative effect of hartals on air shipment over
a three-day and seven-day period respectively. The results suggest that firms decrease their use
of air shipment the day before a hartal, increase their use of air shipment on the day of a hartal as
well as on the day after and then reduce air shipments a few days after the hartal. The
cumulative effect over a seven-day period is a 2.2 percentage point increase in the probability of
air shipment due to a hartal. This is considerably lower than the contemporaneous effect of 3.6
percentage points. Thus, these results suggest that RMG firms are relatively worse affected on
the day of the hartal itself. However, our results suggest that their adjustment behavior is more
effective in the sense that the reduction in total export value over a seven-day period is
considerably smaller than the remaining sample.
5. Conclusion
To the best of our knowledge, this is the first systematic attempt to study the short-run
impact of political strikes (or hartals) on export and the strategies that firms use to cope with this
shock. The results indicate that on the day of the hartal itself, the average firm’s export value
declines by 6.6%. However, through a reallocation of shipments to other dates, firms are able to
attenuate this immediate effect. In particular, over a seven-day period around a hartal, the
cumulative effect is a reduction in firm export value of 4.5%. In other words, this is the reduction
in export value that an average firm incurred even after delaying the shipment dates and using

21
costlier air shipments. In absolute terms, the value of cumulative exports lost to the average firm
over a seven-day period is Tk. 1,814,400.11
The discourse on the impact of hartals on the Bangladeshi economy is fraught with
imprecise estimates based on rudimentary data. While these estimates are useful in highlighting
the negative impacts of such political strikes, crafting policy based on these estimates could be
counter-productive. Our study, on the other hand, provides a robust estimate of the impact of
hartals on firm exports using the universe of export transactions for Bangladesh. It informs us
about what the maximum size of a bail-out package could be if the government were to
compensate firms for the loss of exports due to a hartal.
Our study also highlights the heterogeneous impact of hartals on exports. We find that
smaller exporters producing lower-priced products are disproportionately affected. This result
indicates that if the government were to offer compensation packages to affected firms it should
prioritize smaller firms producing lower-priced products. We also perform a separate analysis
for RMG firms and the results indicate that firms in this sector are better able to make up the loss
of exports due to a hartal by delaying shipments or using air-cargo.
11 The average firm in the sample exports goods worth Tk. 40.32 million over a seven-day period. Therefore, a cumulative loss of 4.5% translates to a monetary loss of approximately Tk. 1.81 million.

22
Reference
Besedes, T., Murshid, A.P., 2014. “The Effects of Airspace Closures on Trade in the Aftermath of Eyjafjallajökull.” Georgia Institute of Technology, mimeograph. Blattman, C., Miguel, E., 2010. “Civil War.” Journal of Economic Literature, 48(1): 3-57. Blomberg, S.B., Hess, G.D., 2006. “How Much Does Violence Tax Trade?” The Review of Economics and Statistics, 88(4): 599-612. Chor, D., Manova, K., 2013. “Off the cliff and back? Credit conditions and international trade during the global financial crisis.” Journal of International Economics, 87(1): 117-133. Djankov, S., Freund, C., and Pham, C., 2010. “Trading on Time.” The Review of Economics and Statistics, 92(1): 166-173. Evans, C., and Harrigan, J., 2005. “Distance, Time, and Specialization: Lean Retailing in General Equilibrium.” American Economic Review, 95(1): 292-313. Glick, R., Taylor, A.M., 2010. “Collateral Damage: Trade Disruption and the Economic Impact of War.”The Review of Economics and Statistics, 92(1): 102-127. Hummels, D., 2007. “Calculating Tariff Equivalent for Time in Trade.” Nathan Associates report for US Agency for International Development. Hummels, D., Schaur, G., 2010. “Hedging Price Volatility using Fast Transport.” Journal of International Economics, 82(1): 15-25. Hummels, D.,Schaur, G., 2013. “Time as a Trade Barrier.” American Economic Review, 103(7): 2935-59. Ksoll, C., Macchiavello, R., Morjaria, A., 2010. “The Effect of Ethnic Violence on an Export-Oriented Industry.” Mimeograph. Martin, P., Mayer, T.,Thoenig, M., 2008.“Civil Wars and International Trade.” Journal of the European Economic Association, 6(2-3): 541-550. UNDP, 2005. “Beyond Hartals. Towards Democratic Dialogue in Bangladesh.” Dhaka, Bangladesh.
Volpe Martincus, C.,Blyde, J., 2013. “Shaky roads and trembling exports: Assessing the trade effects of domestic infrastructure using a natural experiment.” Journal of International Economics, 90(1): 148-161.

23
Figure 1: Annual Trend in Hartals
Figure 2: Frequency of Shipments
020
4060
80To
tal H
arta
ls in
Yea
r
2005 2006 2007 2008 2009 2010 2011 2012 2013Year
0.0
05.0
1.0
15D
ensi
ty
0 100 200 300Average Number of Days Shipped per Year
24
Figure 3: Hartals and Daily Exports in 2013
Figure 4: Cumulative effect of a Hartal on exports. A value of zero on the horizontal axis signifies the day of the hartal.
050
0010
000
050
0010
000
050
0010
000
0 10 20 30 0 10 20 30 0 10 20 30 0 10 20 30
JAN FEB MAR APR
MAY JUN JUL AUG
SEP OCT NOV DEC
Total Daily Exports (USD Millions) Hartals
Dai
ly E
xpor
ts (U
SD
Mill
ions
)
Date
Graphs by Month
-.08
-.06
-.04
-.02
0C
umul
ativ
e E
ffect
-2 0 2 4 6Days Since Hartal
Cumulative Effect of Hartals on Exports

25
Figure 5: Cumulative effect of a Hartal on the probability of air shipment. A value of zero on the horizontal axis signifies the day of the hartal.
-.01
0.0
1.0
2.0
3.0
4C
umul
ativ
e E
ffect
-2 0 2 4 6Days Since Hartal
Cumulative Effect of Hartals on Air Shipment

26
Table 1: Hartals in Bangladesh (1) (2) (3)
Years Included 2005-2013 2005-2009
2010-2013
Total Hartals 152 53 99
Fraction of Hartals that were: Strikes 0.74 0.66 0.78
Blockades 0.26 0.34 0.22 Spanned multiple days 0.49 0.51 0.48
Average Notice Provided 5.55 7.28 4.62 (in days)
Average Number of Deaths 1.49 0.52 2.01 Average Number of Injuries 112.68 132.92 101.84

27
Table 2: Descriptive Statistics of Trade Data
(1)
(2)
Obs.
Ln(Total Daily Exports) 2,043,514 0.876
[1.473]
Ln(Price of Exported Goods) 1,746,663 6.496
[1.079]
Indicator for Air Shipment 2,043,514 0.204
[0.387]
Notes: Column (2) reports the mean and standard deviation (in brackets). The export values are in millions of constant 2010 Bangladesh Taka. The price values are in constant 2010 Bangladesh Taka.

28
Table 3: The Impact of Hartals on Daily Exports (1) (2) (3) (4) (5) Dependent Variable Ln(Total Daily Exports)
Type of Hartal All Limited Notice
With Notice
Ht -0.066*** -0.064*** -0.066*** -0.051*** -0.034***
(0.005) (0.005) (0.005) (0.006) (0.007)
Ht+1
0.004 0.003 0.018*** -0.074***
(0.005) (0.005) (0.006) (0.008)
Ht-1
-0.011** -0.017*** -0.011* -0.021***
(0.005) (0.005) (0.006) (0.007)
Ht-2
0.016*** 0.010 0.010
(0.005) (0.006) (0.007)
Ht-3
0.008* 0.016*** -0.002
(0.005) (0.006) (0.007)
Ht-4
-0.003 -0.005 0.006
(0.005) (0.006) (0.007)
Ht-5
0.015*** -0.007 0.038***
(0.005) (0.006) (0.007)
Constant 0.653*** 0.652*** 0.652*** 0.650*** 0.652*** (0.012) (0.012) (0.012) (0.012) (0.012) R-squared 0.008 0.008 0.008 0.008 0.008
Cumulative effect (∑ Ht+s) - -0.072 -0.045 -0.031 -0.077
P-value (H0: ∑ Ht+s = 0) - [0.00] [0.00] [0.01] [0.00] Notes: N = 2,041,427. Hartals with limited notice are defined as hartals that were announced less than four days before the hartal itself. Hartals with notice are defined as ones where the hartal was announced more than three days before the hartal itself. All regressions include exporter, month, year, and day of week fixed effects along with a day-of-year trend. Robust standard errors in parentheses are clustered at the firm level. *** p<0.01, ** p<0.05, * p<0.1

29
Table 4: The Role of Exporter Characteristics (1) (2) (3) (4) Dependent Variable Ln(Total Daily Exports)
Exporter Characteristic Small Large High-Price
Low-Price
Ht 0.001 0.006 0.011 -0.005
(0.006) (0.007) (0.007) (0.006)
Ht+1 -0.059*** -0.073*** -0.087*** -0.045***
(0.006) (0.008) (0.008) (0.006)
Ht-1 -0.005 -0.029*** -0.020*** -0.014**
(0.006) (0.007) (0.007) (0.006)
Ht-2 0.000 0.031*** 0.020*** 0.012*
(0.006) (0.007) (0.007) (0.007)
Ht-3 -0.001 0.018** 0.024*** -0.008
(0.006) (0.007) (0.007) (0.006)
Ht-4 -0.008 0.002 0.001 -0.007
(0.006) (0.007) (0.007) (0.006)
Ht-5 0.011* 0.018** 0.021*** 0.007
(0.006) (0.007) (0.007) (0.006)
Constant 0.161*** 1.148*** 0.746*** 0.556*** (0.013) (0.020) (0.019) (0.015)
R-squared 0.010 0.008 0.009 0.008
Cumulative effect (∑ Ht+s) -0.061 -0.028 -0.028 -0.060
P-value (H0: ∑ Ht+s = 0) [0.00] [0.06] [0.05] [0.00] Notes: N = 1,021,628. Small exporters are ones with average exports over the entire sample period that is below the sample median. The remaining firms are classified as large exporters. High-price exporters are ones with average price over the entire sample period that is above the sample median. The remaining firms are classified as low-price exporters. All regressions include exporter, month, year, and day of week fixed effects along with a day-of-year trend. Robust standard errors in parentheses are clustered at the firm level. *** p<0.01, ** p<0.05, * p<0.1
30
Table 5: The Impact of Hartals on Air Shipment (1) (2) (3) (4) (5) Dependent Variable Indicator for Air Shipment
Type of Hartal All Limited Notice
With Notice
Ht 0.030*** 0.030*** 0.030*** 0.024*** 0.034***
(0.001) (0.001) (0.001) (0.002) (0.002)
Ht+1
-0.006*** -0.006*** -0.007*** 0.002
(0.001) (0.001) (0.001) (0.002)
Ht-1
0.008*** 0.009*** 0.013*** 0.002
(0.001) (0.001) (0.002) (0.002)
Ht-2
0.001 0.006*** -0.000
(0.001) (0.001) (0.002)
Ht-3
-0.005*** -0.007*** -0.000
(0.001) (0.001) (0.002)
Ht-4
0.000 -0.003* 0.002
(0.001) (0.001) (0.002)
Ht-5
-0.009*** -0.001 -0.017***
(0.001) (0.001) (0.002)
Constant 0.226*** 0.226*** 0.227*** 0.228*** 0.227*** (0.003) (0.003) (0.003) (0.003) (0.003)
R-squared 0.019 0.019 0.019 0.019 0.019
Cumulative effect (∑ Ht+s) - 0.032 0.021 0.025 0.023
P-value (H0: ∑ Ht+s = 0) - [0.00] [0.00] [0.00] [0.00] Notes: N = 2,041,427. Hartals with limited notice are defined as hartals that were announced less than four days before the hartal itself. Hartals with notice are defined as ones where the hartal was announced more than three days before the hartal itself. All regressions include exporter, month, year, and day of week fixed effects along with a day-of-year trend. Robust standard errors in parentheses are clustered at the firm level. *** p<0.01, ** p<0.05, * p<0.1
31
Table 6: The Impact of Hartals on Exports by Other Hartal Characteristics
(1) (2) (3) (4) Dependent Variable Ln(Total Daily Exports)
Type of Hartal Long Short Strike Blockade
Ht -0.102*** -0.039*** -0.056*** -0.102***
(0.010) (0.005) (0.005) (0.013)
Ht+1 0.060*** -0.026*** 0.001 0.035***
(0.008) (0.005) (0.005) (0.012)
Ht-1 -0.150*** 0.023*** -0.008 -0.044***
(0.011) (0.005) (0.005) (0.014)
Ht-2 0.071*** -0.000 0.019*** 0.000
(0.009) (0.005) (0.005) (0.014)
Ht-3 0.013 -0.009* 0.009* 0.004
(0.008) (0.005) (0.005) (0.013)
Ht-4 0.005 -0.004 -0.006 0.010
(0.009) (0.005) (0.005) (0.013)
Ht-5 0.018** 0.017*** 0.002 0.061***
(0.008) (0.005) (0.005) (0.011)
Constant 0.649*** 0.651*** 0.652*** 0.649*** (0.012) (0.012) (0.012) (0.012)
R-squared 0.008 0.008 0.008 0.008
Cumulative effect (∑ Ht+s) -0.085 -0.038 -0.039 -0.036
P-value (H0: ∑ Ht+s = 0) [0.00] [0.00] [0.00] [0.04] Notes: N = 2,041,427. Long Hartals are those that last more than 12 hours. All remaining Hartals are classified as short. All regressions include month, year, and day of week fixed effects along with a day-of-year trend. Robust standard errors in parentheses are clustered at the firm level. *** p<0.01, ** p<0.05, * p<0.1

32
Table 7: The Impact of Hartals on Daily Exports and Air Shipment – RMG Only
(1) (2) (3) (4) (5) (6) Dependent Variable Ln(Total Daily Exports) Indicator for Air Shipment
Ht -0.073*** -0.074*** -0.077*** 0.036*** 0.036*** 0.036***
(0.006) (0.006) (0.006) (0.002) (0.002) (0.002)
Ht+1 0.017*** 0.015*** -0.009*** -0.008***
(0.005) (0.005) (0.001) (0.001)
Ht-1 -0.013** -0.022*** 0.010*** 0.012***
(0.006) (0.006) (0.001) (0.001)
Ht-2 0.021*** -0.000
(0.005) (0.001)
Ht-3 0.013** -0.006***
(0.005) (0.001)
Ht-4 0.000 -0.000
(0.005) (0.001)
Ht-5 0.026*** -0.011***
(0.005) (0.001)
Constant 0.767*** 0.766*** 0.764*** 0.210*** 0.211*** 0.211*** (0.014) (0.014) (0.014) (0.004) (0.004) (0.004) R-squared 0.009 0.009 0.009 0.022 0.022 0.023
Cumulative effect (∑ Ht+s) - -0.070 -0.023 - 0.037 0.022
P-value (H0: ∑ Ht+s = 0) - [0.00] [0.04] - [0.00] [0.00] Notes: N = 1,539,776. These regressions use a sample of firms in the ready-made garments industry. All regressions include exporter, month, year, and day of week fixed effects along with a day-of-year trend. Robust standard errors in parentheses are clustered at the firm level. *** p<0.01, ** p<0.05, * p<0.1

33
Appendix
Figure A1: Distribution of the gap between a hartal date and the announcement date.
0.0
5.1
.15
.2D
ensi
ty
0 10 20 30 40Number of Days

Designed by soapbox.
The International Growth Centre (IGC) aims to promote sustainable growth in developing countries by providing demand-led policy advice based on frontier research.
Find out more about our work on our website www.theigc.org
For media or communications enquiries, please contact [email protected]
Subscribe to our newsletter and topic updates www.theigc.org/newsletter
Follow us on Twitter @the_igc
Contact us International Growth Centre, London School of Economic and Political Science, Houghton Street, London WC2A 2AE