Political Risk Map Brochure 2016
24
Risk. Reinsurance. Human Resources. 2016 Political Risk Map Aon Risk Solutions Global Broking Centre | Crisis Management
-
Upload
graeme-cross -
Category
News & Politics
-
view
661 -
download
3
Transcript of Political Risk Map Brochure 2016
Risk. Reinsurance. Human Resources.
2016 Political Risk Map
Aon Risk SolutionsGlobal Broking Centre | Crisis Management
2 2016 Political Risk Map
Aon’s Political Risk Map . . . . . . . . . . . . . . . . . . . . . . . . . . . . . . . . . . . . . . . 3
2016 Political Risk Map Portal . . . . . . . . . . . . . . . . . . . . . . . . . . . . . . . . . 4
Country Risk Rating changes in 2016 . . . . . . . . . . . . . . . . . . . . . . . . . . . 6
What happened in 2015 . . . . . . . . . . . . . . . . . . . . . . . . . . . . . . . . . . . . . . 8
What to watch out for in 2016 . . . . . . . . . . . . . . . . . . . . . . . . . . . . . . . . . 9
CIS/Caucasus . . . . . . . . . . . . . . . . . . . . . . . . . . . . . . . . . . . . . . . . . . . . . . 10
Middle East and North Africa . . . . . . . . . . . . . . . . . . . . . . . . . . . . . . . . . 12
Sub-Saharan Africa . . . . . . . . . . . . . . . . . . . . . . . . . . . . . . . . . . . . . . . . . 14
Asia Pacific . . . . . . . . . . . . . . . . . . . . . . . . . . . . . . . . . . . . . . . . . . . . . . . . 16
Latin America and Caribbean . . . . . . . . . . . . . . . . . . . . . . . . . . . . . . . . . 17 Map methodology . . . . . . . . . . . . . . . . . . . . . . . . . . . . . . . . . . . . . . . . . 18
Risk icon descriptions . . . . . . . . . . . . . . . . . . . . . . . . . . . . . . . . . . . . . . . 19
Measuring Political Risk in a world of rapid change . . . . . . . . . . . . . . . 20
Contacts . . . . . . . . . . . . . . . . . . . . . . . . . . . . . . . . . . . . . . . . . . . . . . . . . 23
Table of Contents
Aon Risk Solutions 3
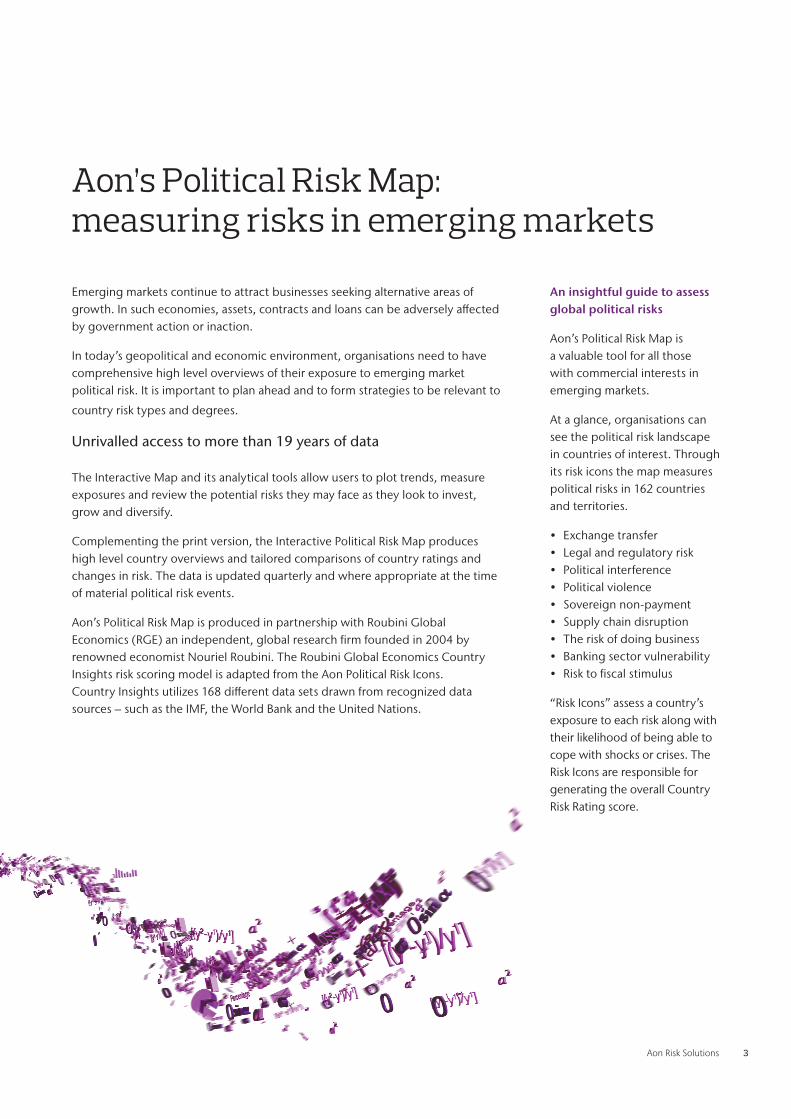
Aon’s Political Risk Map: measuring risks in emerging markets
Emerging markets continue to attract businesses seeking alternative areas of growth. In such economies, assets, contracts and loans can be adversely affected by government action or inaction.
In today’s geopolitical and economic environment, organisations need to have comprehensive high level overviews of their exposure to emerging market political risk. It is important to plan ahead and to form strategies to be relevant to
country risk types and degrees.
Unrivalled access to more than 19 years of data
The Interactive Map and its analytical tools allow users to plot trends, measure exposures and review the potential risks they may face as they look to invest, grow and diversify.
Complementing the print version, the Interactive Political Risk Map produces high level country overviews and tailored comparisons of country ratings and changes in risk. The data is updated quarterly and where appropriate at the time of material political risk events.
Aon’s Political Risk Map is produced in partnership with Roubini Global Economics (RGE) an independent, global research firm founded in 2004 by renowned economist Nouriel Roubini. The Roubini Global Economics Country Insights risk scoring model is adapted from the Aon Political Risk Icons. Country Insights utilizes 168 different data sets drawn from recognized data sources – such as the IMF, the World Bank and the United Nations.
An insightful guide to assess global political risks
Aon’s Political Risk Map is a valuable tool for all those with commercial interests in emerging markets.
At a glance, organisations can see the political risk landscape in countries of interest. Through its risk icons the map measures political risks in 162 countries and territories.
• Exchange transfer • Legal and regulatory risk • Political interference • Political violence • Sovereign non-payment • Supply chain disruption • The risk of doing business • Banking sector vulnerability • Risk to fiscal stimulus
“Risk Icons” assess a country’s exposure to each risk along with their likelihood of being able to cope with shocks or crises. The Risk Icons are responsible for generating the overall Country Risk Rating score.
4 2016 Political Risk Map
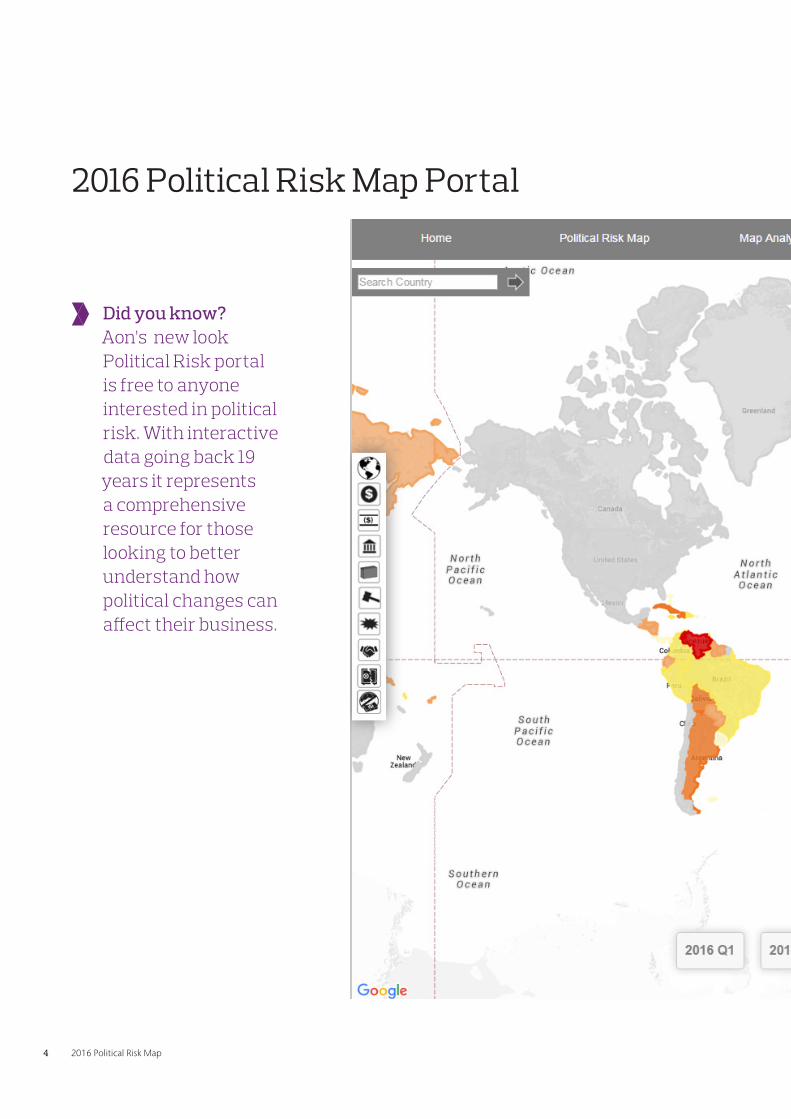
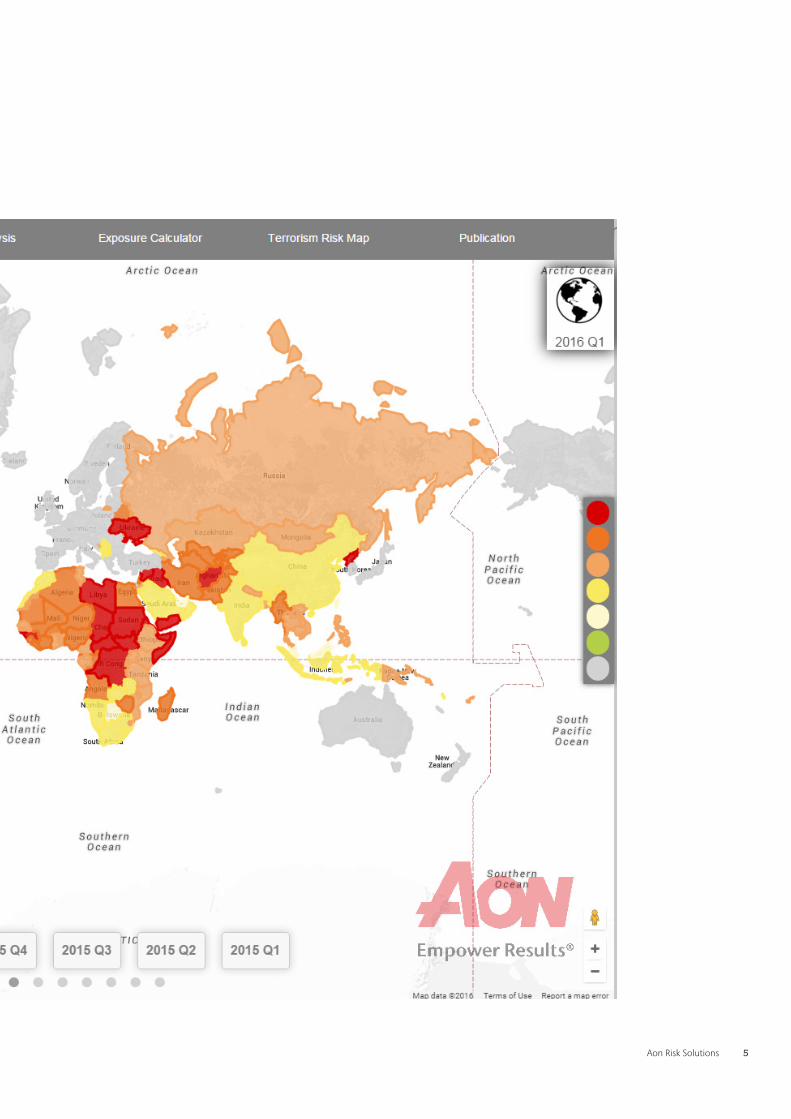
2016 Political Risk Map Portal
Did you know?Aon’s new look Political Risk portal is free to anyone interested in political risk. With interactive data going back 19 years it represents a comprehensive resource for those looking to better understand how political changes can affect their business.
Aon Risk Solutions 5
6 2016 Political Risk Map
Country Risk Rating changes in 2016: upgrades dominate
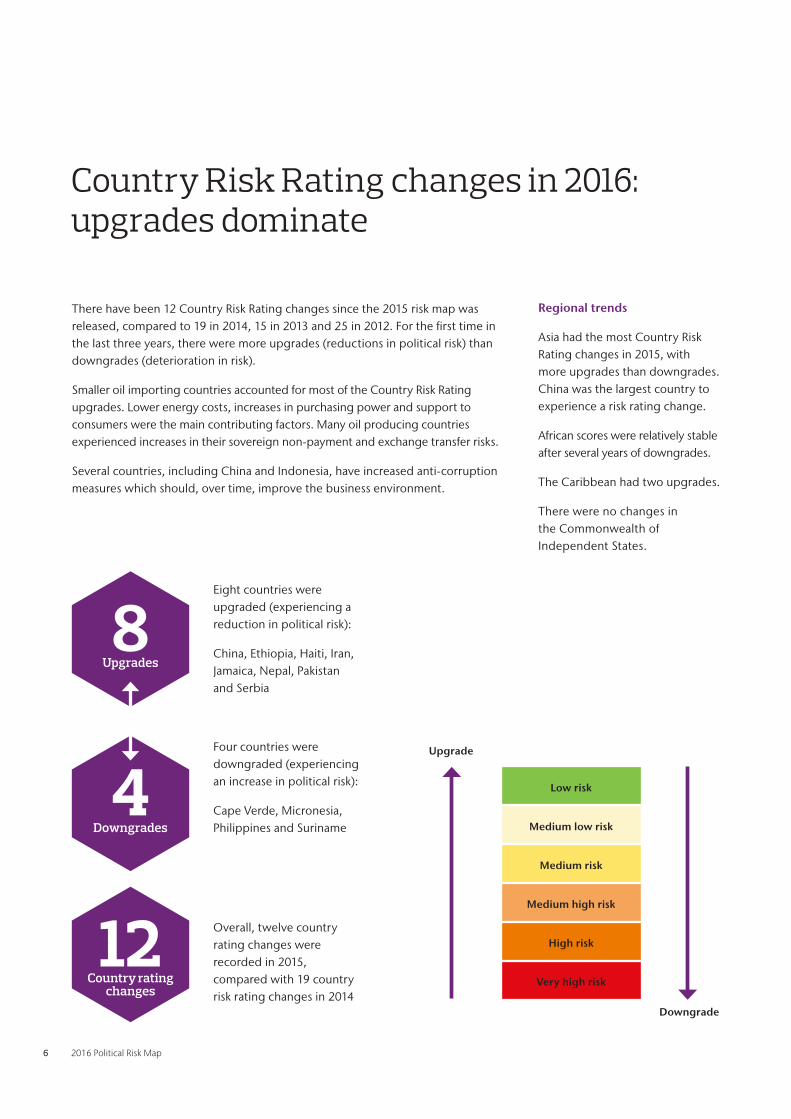
There have been 12 Country Risk Rating changes since the 2015 risk map was released, compared to 19 in 2014, 15 in 2013 and 25 in 2012. For the first time in the last three years, there were more upgrades (reductions in political risk) than downgrades (deterioration in risk).
Smaller oil importing countries accounted for most of the Country Risk Rating upgrades. Lower energy costs, increases in purchasing power and support to consumers were the main contributing factors. Many oil producing countries experienced increases in their sovereign non-payment and exchange transfer risks.
Several countries, including China and Indonesia, have increased anti-corruption measures which should, over time, improve the business environment.
Regional trends
Asia had the most Country Risk Rating changes in 2015, with more upgrades than downgrades. China was the largest country to experience a risk rating change.
African scores were relatively stable after several years of downgrades.
The Caribbean had two upgrades.
There were no changes in the Commonwealth of Independent States.
Eight countries were upgraded (experiencing a reduction in political risk):
China, Ethiopia, Haiti, Iran, Jamaica, Nepal, Pakistan and Serbia
Four countries were downgraded (experiencing an increase in political risk):
Cape Verde, Micronesia, Philippines and Suriname
Overall, twelve country rating changes were recorded in 2015, compared with 19 country risk rating changes in 2014
8Upgrades
4Downgrades
12Country rating
changes
Low risk
Upgrade
Downgrade
Medium low risk
Medium risk
Medium high risk
High risk
Very high risk
Aon Risk Solutions 7
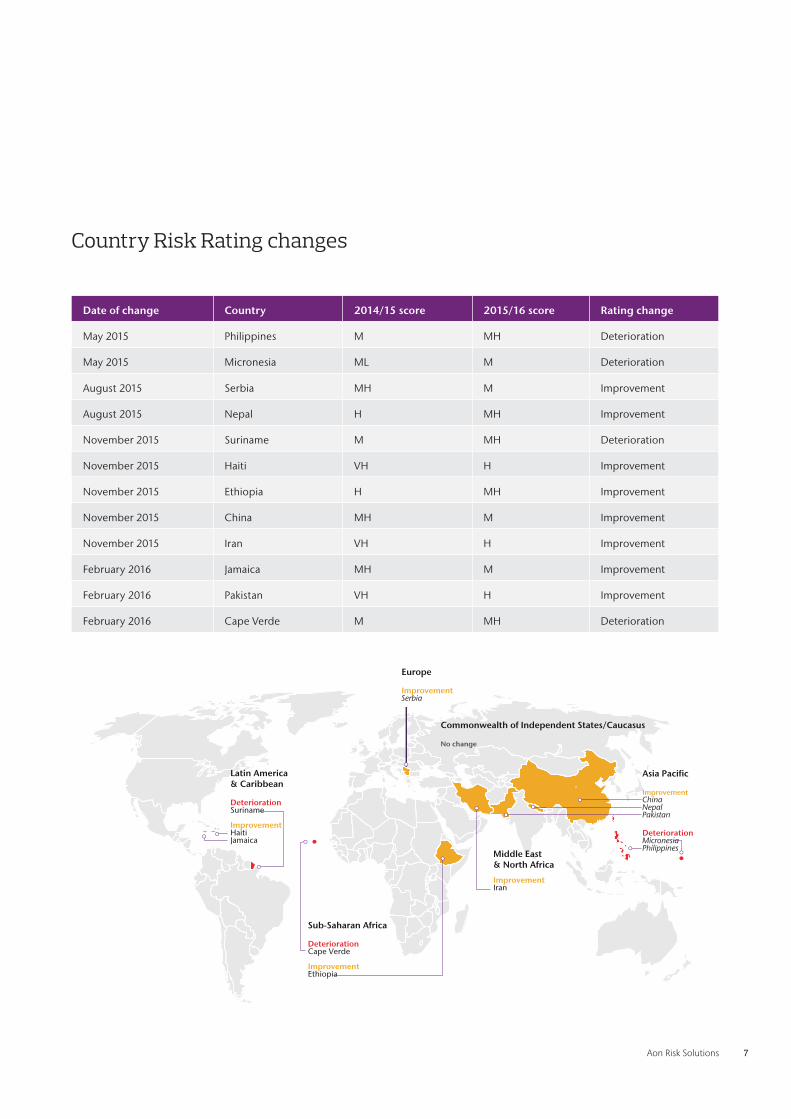
Date of change Country 2014/15 score 2015/16 score Rating change
May 2015 Philippines M MH Deterioration
May 2015 Micronesia ML M Deterioration
August 2015 Serbia MH M Improvement
August 2015 Nepal H MH Improvement
November 2015 Suriname M MH Deterioration
November 2015 Haiti VH H Improvement
November 2015 Ethiopia H MH Improvement
November 2015 China MH M Improvement
November 2015 Iran VH H Improvement
February 2016 Jamaica MH M Improvement
February 2016 Pakistan VH H Improvement
February 2016 Cape Verde M MH Deterioration
Country Risk Rating changes
:PDG 51025%+
Asia Pacific
ImprovementChinaNepalPakistan
DeteriorationMicronesiaPhilippines
Europe
ImprovementSerbia
Latin America & Caribbean
DeteriorationSuriname
ImprovementHaitiJamaica
Sub-Saharan Africa
DeteriorationCape Verde
ImprovementEthiopia
Middle East & North Africa
ImprovementIran
Commonwealth of Independent States/Caucasus
No change
8 2016 Political Risk Map
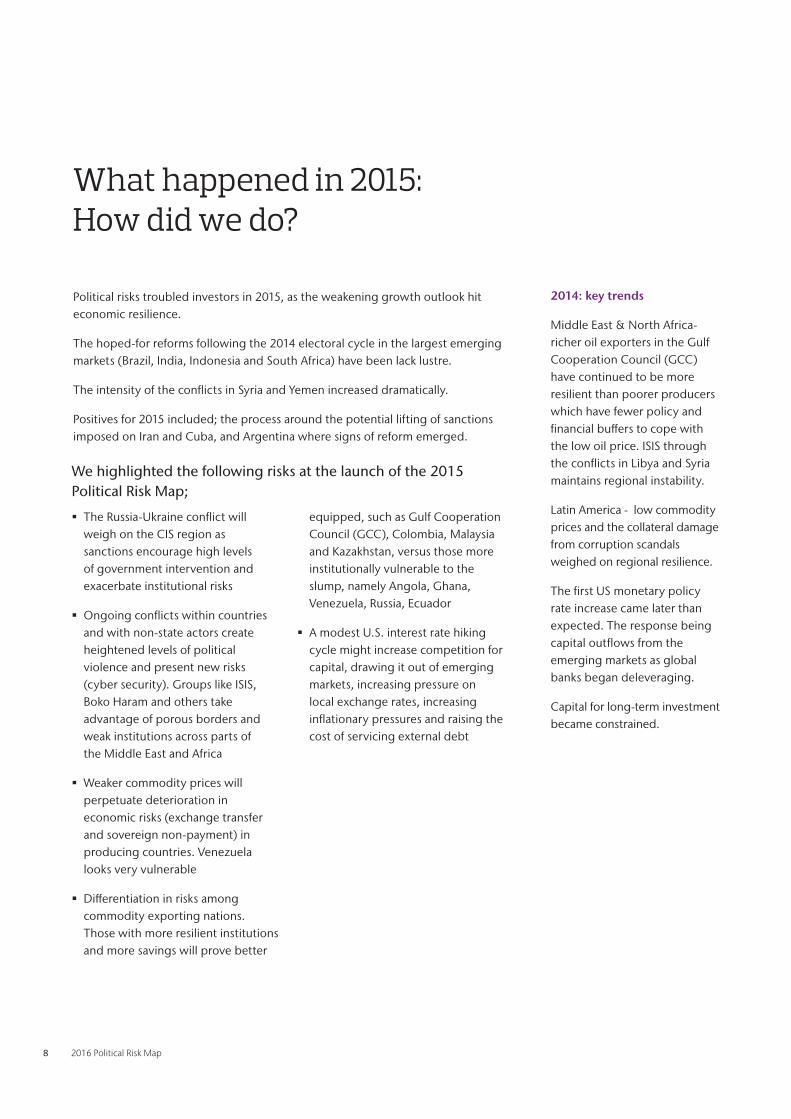
What happened in 2015: How did we do?
Political risks troubled investors in 2015, as the weakening growth outlook hit economic resilience.
The hoped-for reforms following the 2014 electoral cycle in the largest emerging markets (Brazil, India, Indonesia and South Africa) have been lack lustre.
The intensity of the conflicts in Syria and Yemen increased dramatically.
Positives for 2015 included; the process around the potential lifting of sanctions imposed on Iran and Cuba, and Argentina where signs of reform emerged.
We highlighted the following risks at the launch of the 2015 Political Risk Map;
� The Russia-Ukraine conflict will weigh on the CIS region as sanctions encourage high levels of government intervention and exacerbate institutional risks
� Ongoing conflicts within countries and with non-state actors create heightened levels of political violence and present new risks (cyber security). Groups like ISIS, Boko Haram and others take advantage of porous borders and weak institutions across parts of the Middle East and Africa
� Weaker commodity prices will perpetuate deterioration in economic risks (exchange transfer and sovereign non-payment) in producing countries. Venezuela looks very vulnerable
� Differentiation in risks among commodity exporting nations. Those with more resilient institutions and more savings will prove better
equipped, such as Gulf Cooperation Council (GCC), Colombia, Malaysia and Kazakhstan, versus those more institutionally vulnerable to the slump, namely Angola, Ghana, Venezuela, Russia, Ecuador
� A modest U.S. interest rate hiking cycle might increase competition for capital, drawing it out of emerging markets, increasing pressure on local exchange rates, increasing inflationary pressures and raising the cost of servicing external debt
2014: key trends
Middle East & North Africa- richer oil exporters in the Gulf Cooperation Council (GCC) have continued to be more resilient than poorer producers which have fewer policy and financial buffers to cope with the low oil price. ISIS through the conflicts in Libya and Syria maintains regional instability.
Latin America - low commodity prices and the collateral damage from corruption scandals weighed on regional resilience.
The first US monetary policy rate increase came later than expected. The response being capital outflows from the emerging markets as global banks began deleveraging.
Capital for long-term investment became constrained.
Aon Risk Solutions 9
What to watch out for in 2016
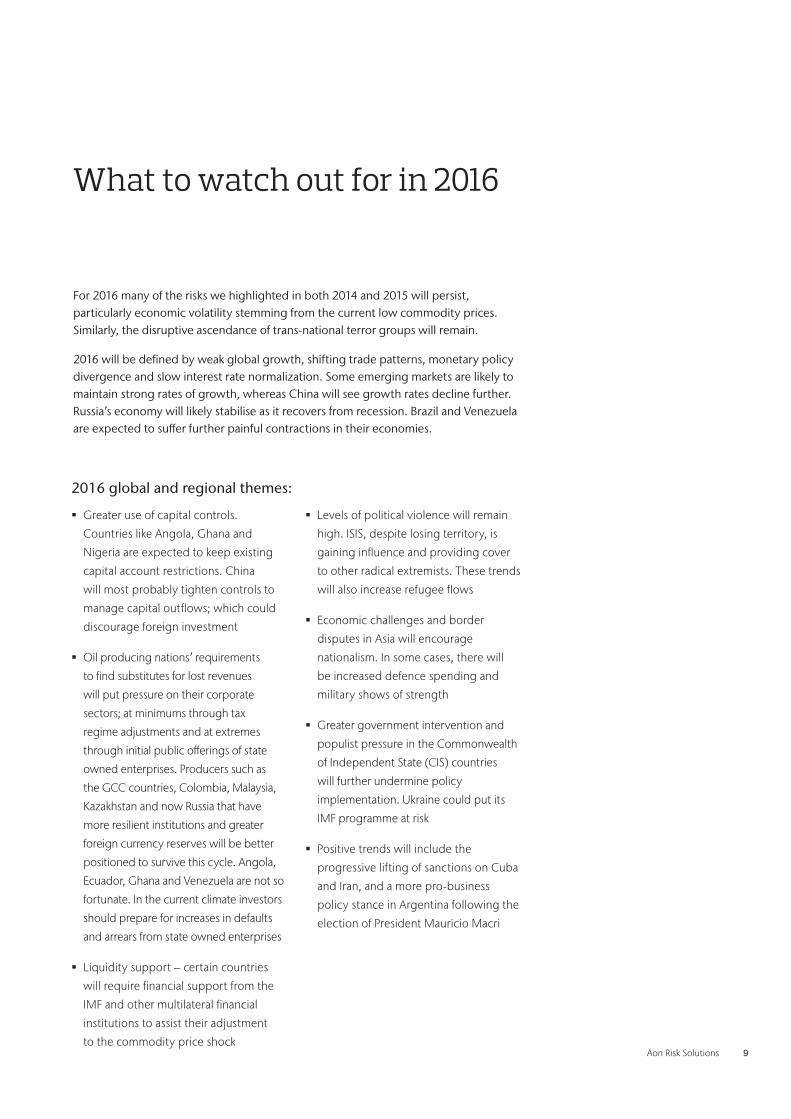
For 2016 many of the risks we highlighted in both 2014 and 2015 will persist, particularly economic volatility stemming from the current low commodity prices. Similarly, the disruptive ascendance of trans-national terror groups will remain.
2016 will be defined by weak global growth, shifting trade patterns, monetary policy divergence and slow interest rate normalization. Some emerging markets are likely to maintain strong rates of growth, whereas China will see growth rates decline further. Russia’s economy will likely stabilise as it recovers from recession. Brazil and Venezuela are expected to suffer further painful contractions in their economies.
2016 global and regional themes:
� Greater use of capital controls.
Countries like Angola, Ghana and
Nigeria are expected to keep existing
capital account restrictions. China
will most probably tighten controls to
manage capital outflows; which could
discourage foreign investment
� Oil producing nations’ requirements
to find substitutes for lost revenues
will put pressure on their corporate
sectors; at minimums through tax
regime adjustments and at extremes
through initial public offerings of state
owned enterprises. Producers such as
the GCC countries, Colombia, Malaysia,
Kazakhstan and now Russia that have
more resilient institutions and greater
foreign currency reserves will be better
positioned to survive this cycle. Angola,
Ecuador, Ghana and Venezuela are not so
fortunate. In the current climate investors
should prepare for increases in defaults
and arrears from state owned enterprises
� Liquidity support – certain countries
will require financial support from the
IMF and other multilateral financial
institutions to assist their adjustment
to the commodity price shock
� Levels of political violence will remain
high. ISIS, despite losing territory, is
gaining influence and providing cover
to other radical extremists. These trends
will also increase refugee flows
� Economic challenges and border
disputes in Asia will encourage
nationalism. In some cases, there will
be increased defence spending and
military shows of strength
� Greater government intervention and
populist pressure in the Commonwealth
of Independent State (CIS) countries
will further undermine policy
implementation. Ukraine could put its
IMF programme at risk
� Positive trends will include the
progressive lifting of sanctions on Cuba
and Iran, and a more pro-business
policy stance in Argentina following the
election of President Mauricio Macri
10 2016 Political Risk Map
Commonwealth of Independent States/Caucasus: Commodity woes and weak growth add to Political RiskRussia’s weak growth will continue to reduce the value of remittances flowing to the region; Tajikistan and Kyrgyzstan being particularly vulnerable. There are hopes that sanctions imposed on Russia from Europe and the U.S. may be eased later in 2016.
The conflict in eastern Ukraine, particularly in the Donbass, offers no signs of abating.
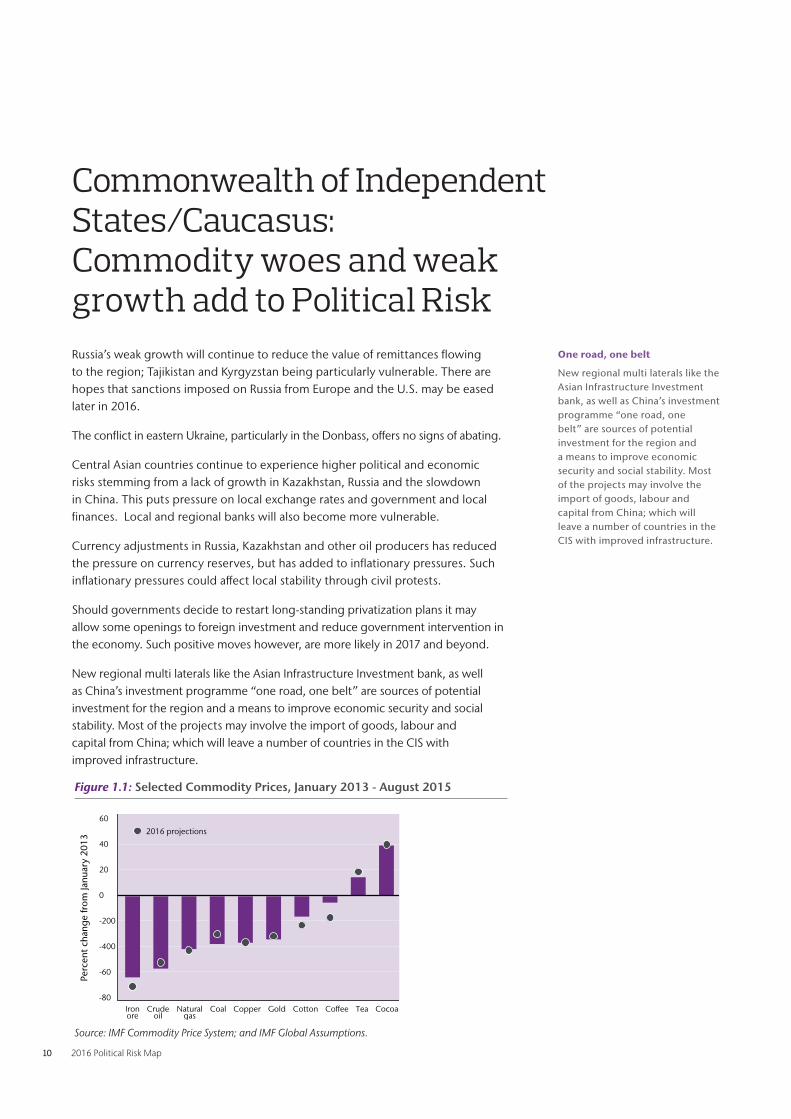
Central Asian countries continue to experience higher political and economic risks stemming from a lack of growth in Kazakhstan, Russia and the slowdown in China. This puts pressure on local exchange rates and government and local finances. Local and regional banks will also become more vulnerable.
Currency adjustments in Russia, Kazakhstan and other oil producers has reduced the pressure on currency reserves, but has added to inflationary pressures. Such inflationary pressures could affect local stability through civil protests.
Should governments decide to restart long-standing privatization plans it may allow some openings to foreign investment and reduce government intervention in the economy. Such positive moves however, are more likely in 2017 and beyond.
New regional multi laterals like the Asian Infrastructure Investment bank, as well as China’s investment programme “one road, one belt” are sources of potential investment for the region and a means to improve economic security and social stability. Most of the projects may involve the import of goods, labour and capital from China; which will leave a number of countries in the CIS with improved infrastructure.
One road, one belt
New regional multi laterals like the Asian Infrastructure Investment bank, as well as China’s investment programme “one road, one belt” are sources of potential investment for the region and a means to improve economic security and social stability . Most of the projects may involve the import of goods, labour and capital from China; which will leave a number of countries in the CIS with improved infrastructure .
Figure 1.1: Selected Commodity Prices, January 2013 - August 2015
Source: IMF Commodity Price System; and IMF Global Assumptions.
60
40
20
0
-200
-400
-60
Ironore
Crudeoil
Naturalgas
Perc
ent
chan
ge fr
om Ja
nuar
y 20
13
Coal Copper Gold Cotton Coee Tea Cocoa-80
2016 projections
Aon Risk Solutions 11
“Central Asian countries continue to experience higher political and economic risks stemming from a lack of growth in Kazakhstan, Russia and the slowdown in China”
12 2016 Political Risk Map
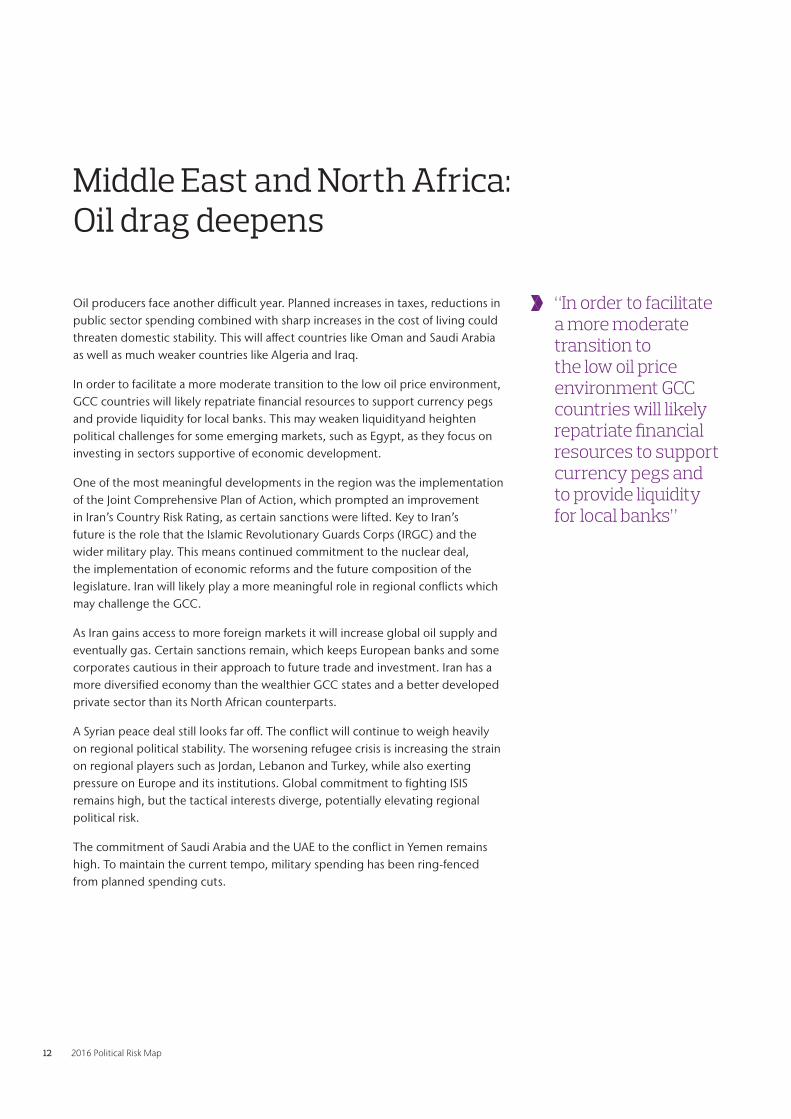
Oil producers face another difficult year. Planned increases in taxes, reductions in public sector spending combined with sharp increases in the cost of living could threaten domestic stability. This will affect countries like Oman and Saudi Arabia as well as much weaker countries like Algeria and Iraq.
In order to facilitate a more moderate transition to the low oil price environment, GCC countries will likely repatriate financial resources to support currency pegs and provide liquidity for local banks. This may weaken liquidityand heighten political challenges for some emerging markets, such as Egypt, as they focus on investing in sectors supportive of economic development.
One of the most meaningful developments in the region was the implementation of the Joint Comprehensive Plan of Action, which prompted an improvement in Iran’s Country Risk Rating, as certain sanctions were lifted. Key to Iran’s future is the role that the Islamic Revolutionary Guards Corps (IRGC) and the wider military play. This means continued commitment to the nuclear deal, the implementation of economic reforms and the future composition of the legislature. Iran will likely play a more meaningful role in regional conflicts which may challenge the GCC.
As Iran gains access to more foreign markets it will increase global oil supply and eventually gas. Certain sanctions remain, which keeps European banks and some corporates cautious in their approach to future trade and investment. Iran has a more diversified economy than the wealthier GCC states and a better developed private sector than its North African counterparts.
A Syrian peace deal still looks far off. The conflict will continue to weigh heavily on regional political stability. The worsening refugee crisis is increasing the strain on regional players such as Jordan, Lebanon and Turkey, while also exerting pressure on Europe and its institutions. Global commitment to fighting ISIS remains high, but the tactical interests diverge, potentially elevating regional political risk.
The commitment of Saudi Arabia and the UAE to the conflict in Yemen remains high. To maintain the current tempo, military spending has been ring-fenced from planned spending cuts.
“In order to facilitate a more moderate transition to the low oil price environment GCC countries will likely repatriate financial resources to support currency pegs and to provide liquidity for local banks”
Middle East and North Africa: Oil drag deepens
Aon Risk Solutions 13
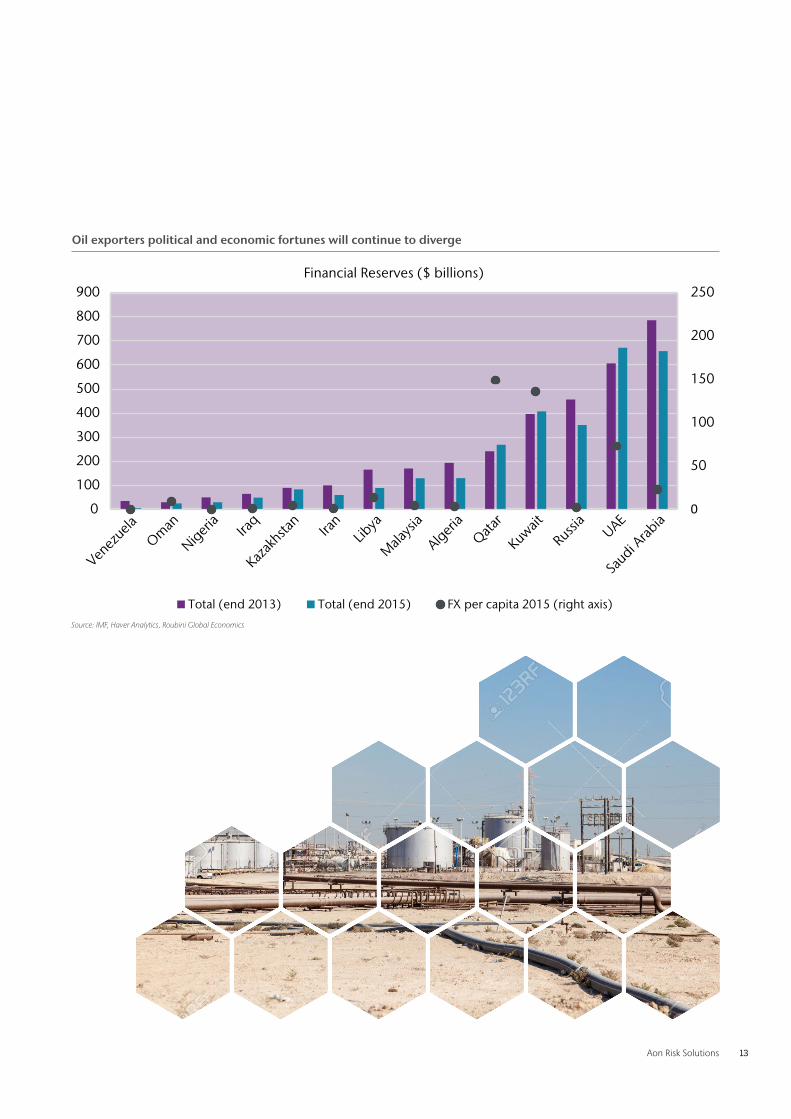
Oil exporters political and economic fortunes will continue to diverge
0
50
100
150
200
250
0
100
200
300
400
500
600
700
800
900
Total (end 2013) Total (end 2015) FX per capita 2015 (right axis)
Venez
uelaOm
an
Nigeria
Iraq
Kazak
hstan
Iran
Libya
Mala
ysia
Algeria
Qatar
Kuwait
Russia
UAE
Saudi A
rabia
Financial Reserves ($ billions)
Source: IMF, Haver Analytics, Roubini Global Economics
14 2016 Political Risk Map
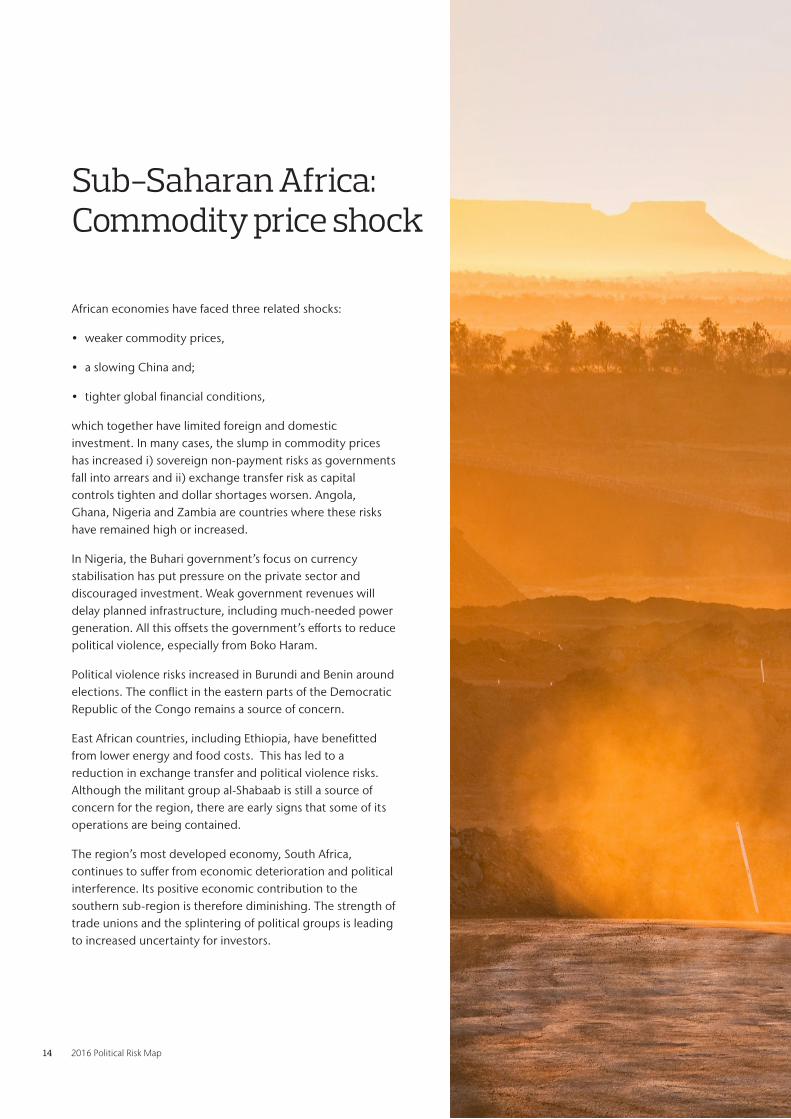
Sub-Saharan Africa: Commodity price shock
African economies have faced three related shocks:
• weaker commodity prices,
• a slowing China and;
• tighter global financial conditions,
which together have limited foreign and domestic investment. In many cases, the slump in commodity prices has increased i) sovereign non-payment risks as governments fall into arrears and ii) exchange transfer risk as capital controls tighten and dollar shortages worsen. Angola, Ghana, Nigeria and Zambia are countries where these risks have remained high or increased.
In Nigeria, the Buhari government’s focus on currency stabilisation has put pressure on the private sector and discouraged investment. Weak government revenues will delay planned infrastructure, including much-needed power generation. All this offsets the government’s efforts to reduce political violence, especially from Boko Haram.
Political violence risks increased in Burundi and Benin around elections. The conflict in the eastern parts of the Democratic Republic of the Congo remains a source of concern.
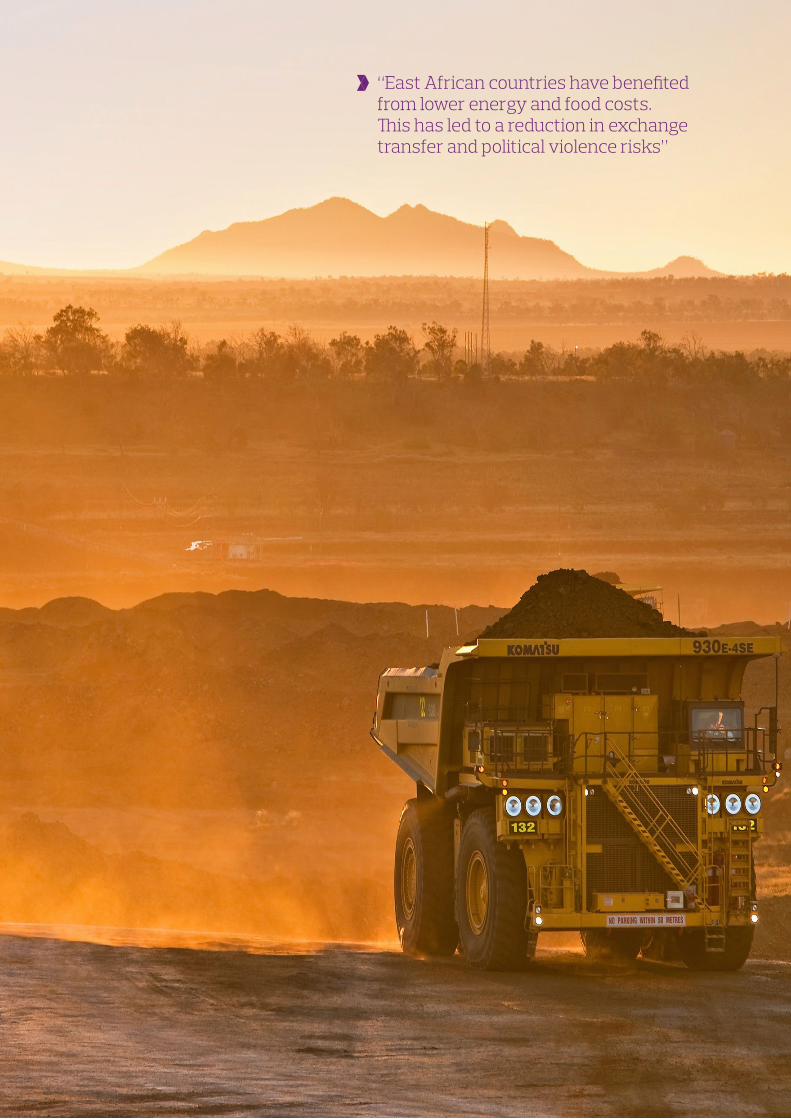
East African countries, including Ethiopia, have benefitted from lower energy and food costs. This has led to a reduction in exchange transfer and political violence risks. Although the militant group al-Shabaab is still a source of concern for the region, there are early signs that some of its operations are being contained.
The region’s most developed economy, South Africa, continues to suffer from economic deterioration and political interference. Its positive economic contribution to the southern sub-region is therefore diminishing. The strength of trade unions and the splintering of political groups is leading to increased uncertainty for investors.
Aon Risk Solutions 15
“East African countries have benefited from lower energy and food costs. This has led to a reduction in exchange transfer and political violence risks”
16 2016 Political Risk Map
The Asia region as a whole has experienced a reduction in political risk. Oil importing countries have benefited from lower oil prices while private consumption, a key contributor to growth, has increased. Real Gross Domestic Product (RGDP) growth in Emerging Asia (the 10 ASEAN members plus China and India) is expected to outpace other regions in the medium term. The main risks to growth are the continued slowdown in China, potential interest rate rises in the US and the slowing of productivity. Structural policies in the region are diverse, but there is a clear focus on the need for more inclusive sustainable development, as well as reducing the impact of economic activity on the environment.
China’s growth is projected to weaken further. The country’s economic policies have become more uncertain as the government tries to strike a balance between implementing reform and managing growth. Excess capacity continues; firms, including many SOEs, continue to drive down prices to secure market share at home and abroad. Additional stimulus may be needed if growth slows more than expected. Policy makers will need to address China’s excessive debt burden before the shift to a consumption-driven economy can properly progress. This could lead to divisions between heavily indebted local governments and the national administration. President Xi Jinping continues to consolidate power and remove his political enemies through his anti-corruption campaign.
Less exposed to the region’s dominant economy, the Philippines and Vietnam should be strong performers given their improved macroeconomic fundamentals and better implementation of infrastructure plans. Recovery in agriculture and expansions in tourism and industrial output will boost Cambodia’s and Lao PDR’s economies. Myanmar is also expected to benefit from rising investment and economic reforms.
Reform efforts in Malaysia, Indonesia and India have been delayed, although measures to counter corruption are expected to improve their political and economic resilience. In Malaysia, power struggles within the ruling UNMO party have increased the possibility of sociopolitical change and deferred investment. Government infrastructure investment and plans to open up sectors that have been off-limits to foreign investment are positives for Indonesia.
The weakening economic growth across the Asia-Pacific region seems to be encouraging nationalist sentiment, which in turn has led to increased security and defence spending in countries such as China, India, the Philippines and Vietnam. The effect of this trend is seen through the minor escalations in the long-standing territorial disputes in the East and South China Seas.
North Korea’s recent missile tests have reinforced its reputation as a rogue state, prompting a more coordinated approach from China’s and South Korea’s political leaders. Political violence risks are a concern for both Indonesia and Malaysia as local groups become more linked with ISIS and other global militant groups.
Asia Pacific: Resilient, but some new pressures
China stalls
China’s growth is projected to weaken further . The country’s economic policies have become more uncertain as the government tries to strike a balance between implementing reform and managing growth .
Aon Risk Solutions 17
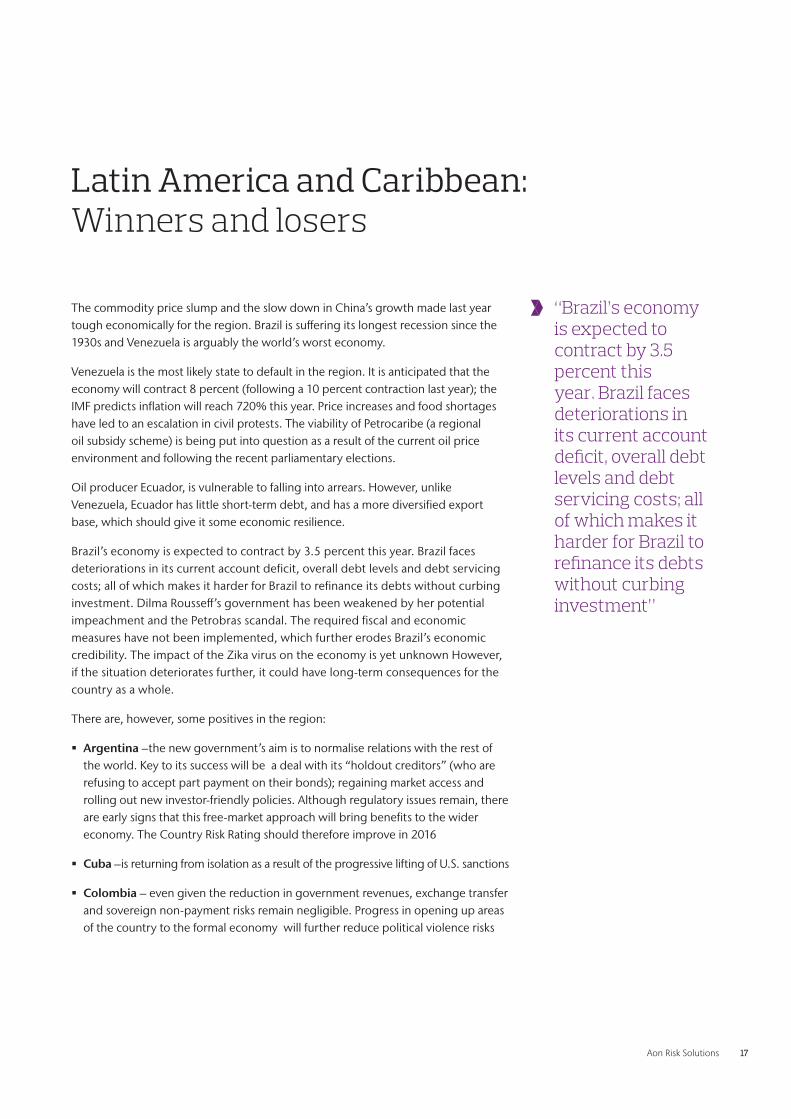
The commodity price slump and the slow down in China’s growth made last year tough economically for the region. Brazil is suffering its longest recession since the 1930s and Venezuela is arguably the world’s worst economy.
Venezuela is the most likely state to default in the region. It is anticipated that the economy will contract 8 percent (following a 10 percent contraction last year); the IMF predicts inflation will reach 720% this year. Price increases and food shortages have led to an escalation in civil protests. The viability of Petrocaribe (a regional oil subsidy scheme) is being put into question as a result of the current oil price environment and following the recent parliamentary elections.
Oil producer Ecuador, is vulnerable to falling into arrears. However, unlike Venezuela, Ecuador has little short-term debt, and has a more diversified export base, which should give it some economic resilience.
Brazil’s economy is expected to contract by 3.5 percent this year. Brazil faces deteriorations in its current account deficit, overall debt levels and debt servicing costs; all of which makes it harder for Brazil to refinance its debts without curbing investment. Dilma Rousseff’s government has been weakened by her potential impeachment and the Petrobras scandal. The required fiscal and economic measures have not been implemented, which further erodes Brazil’s economic credibility. The impact of the Zika virus on the economy is yet unknown However, if the situation deteriorates further, it could have long-term consequences for the country as a whole.
There are, however, some positives in the region:
� Argentina –the new government’s aim is to normalise relations with the rest of the world. Key to its success will be a deal with its “holdout creditors” (who are refusing to accept part payment on their bonds); regaining market access and rolling out new investor-friendly policies. Although regulatory issues remain, there are early signs that this free-market approach will bring benefits to the wider economy. The Country Risk Rating should therefore improve in 2016
� Cuba –is returning from isolation as a result of the progressive lifting of U.S. sanctions
� Colombia – even given the reduction in government revenues, exchange transfer and sovereign non-payment risks remain negligible. Progress in opening up areas of the country to the formal economy will further reduce political violence risks
Latin America and Caribbean: Winners and losers
“Brazil’s economy is expected to contract by 3.5 percent this year. Brazil faces deteriorations in its current account deficit, overall debt levels and debt servicing costs; all of which makes it harder for Brazil to refinance its debts without curbing investment”
18 2016 Political Risk Map
Map Methodology
Analysis and findings
Aon partnered with Roubini Global Economics (RGE), an independent, global research firm founded in 2004 by renowned economist Nouriel Roubini, to produce the Political Risk Map in order to take advantage of RGE’s unique methodology, Country Insights, for systematically analysing political risk around the world.
The Aon Political Risk Map follows a 3-layered approach in analysing political risk in emerging market countries (excluding EU and OECD countries).
Country ratings reflect a combination of:
� Analysis by Aon Risk Solutions
� Analysis by Roubini Global Economics
� The opinions of Lloyd’s syndicates and corporate insurers actively writing political risk insurance
Country insights as applied to the map allows clients:
� To systematically track changes in country risk
� To obtain more meaningful country comparisons
� To break down each risk to show the various elements that drive that risk
For further information, please visit Roubini’s website: www .roubini .com
Perils analysed
Each country is assigned a rating starting at Low, Medium Low, Medium,Medium High, High, Very High. The scores reflect the severity of risk in each state against nine core risk perils.
The map depicts 9 individual Risk Icons. Country Rating for the map includes input from the six core risk icons (Exchange Transfer, Legal and Regulatory, Political Interference, Political Violence, Sovereign Non-payment and Supply Chain Disruption) but three separate icons are also provided (Risks to Doing Business, Banking Sector Vulnerability and Risks to Fiscal Stimulus).
They are not intended to predict global events or future threats. The scores are weighted to accommodate a wide range of political risk variables.
Aon Risk Solutions 19
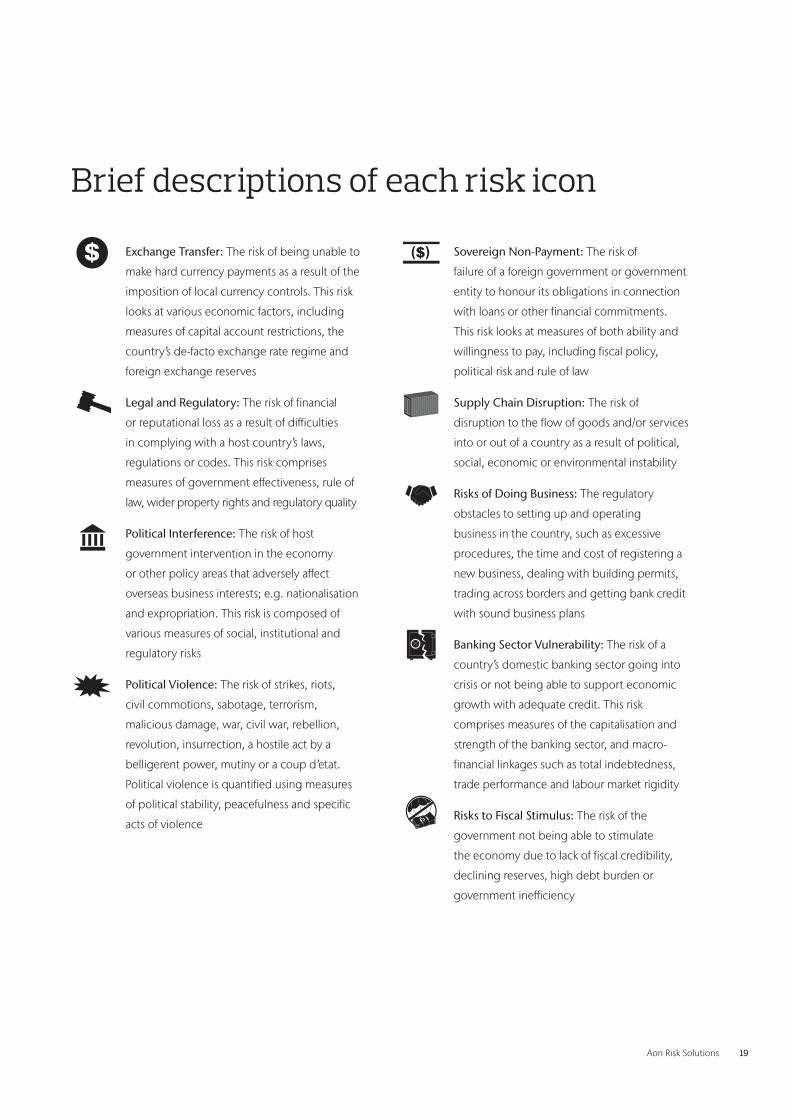
Exchange Transfer: The risk of being unable to
make hard currency payments as a result of the
imposition of local currency controls. This risk
looks at various economic factors, including
measures of capital account restrictions, the
country’s de-facto exchange rate regime and
foreign exchange reserves
Legal and Regulatory: The risk of financial
or reputational loss as a result of difficulties
in complying with a host country’s laws,
regulations or codes. This risk comprises
measures of government effectiveness, rule of
law, wider property rights and regulatory quality
Political Interference: The risk of host
government intervention in the economy
or other policy areas that adversely affect
overseas business interests; e.g. nationalisation
and expropriation. This risk is composed of
various measures of social, institutional and
regulatory risks
Political Violence: The risk of strikes, riots,
civil commotions, sabotage, terrorism,
malicious damage, war, civil war, rebellion,
revolution, insurrection, a hostile act by a
belligerent power, mutiny or a coup d’etat.
Political violence is quantified using measures
of political stability, peacefulness and specific
acts of violence
Sovereign Non-Payment: The risk of
failure of a foreign government or government
entity to honour its obligations in connection
with loans or other financial commitments.
This risk looks at measures of both ability and
willingness to pay, including fiscal policy,
political risk and rule of law
Supply Chain Disruption: The risk of
disruption to the flow of goods and/or services
into or out of a country as a result of political,
social, economic or environmental instability
Risks of Doing Business: The regulatory
obstacles to setting up and operating
business in the country, such as excessive
procedures, the time and cost of registering a
new business, dealing with building permits,
trading across borders and getting bank credit
with sound business plans
Banking Sector Vulnerability: The risk of a
country’s domestic banking sector going into
crisis or not being able to support economic
growth with adequate credit. This risk
comprises measures of the capitalisation and
strength of the banking sector, and macro-
financial linkages such as total indebtedness,
trade performance and labour market rigidity
Risks to Fiscal Stimulus: The risk of the
government not being able to stimulate
the economy due to lack of fiscal credibility,
declining reserves, high debt burden or
government inefficiency
Brief descriptions of each risk icon
20 2016 Political Risk Map
Measuring Political Risk in a world of rapid change
Political risk scoring tools highlight differences between countries.
The Arab Spring, sparked by events in Tunisia and the 2008 financial crisis, synonymous with the collapse of Lehman Brothers, show the speed at which geopolitical and financial shocks can occur and escalate.
Tracking risk changes over time provides valuable insight into how a country may perform if hit by a major economic shock or unexpected event. Seemingly stable countries can deteriorate while others prove resilient.
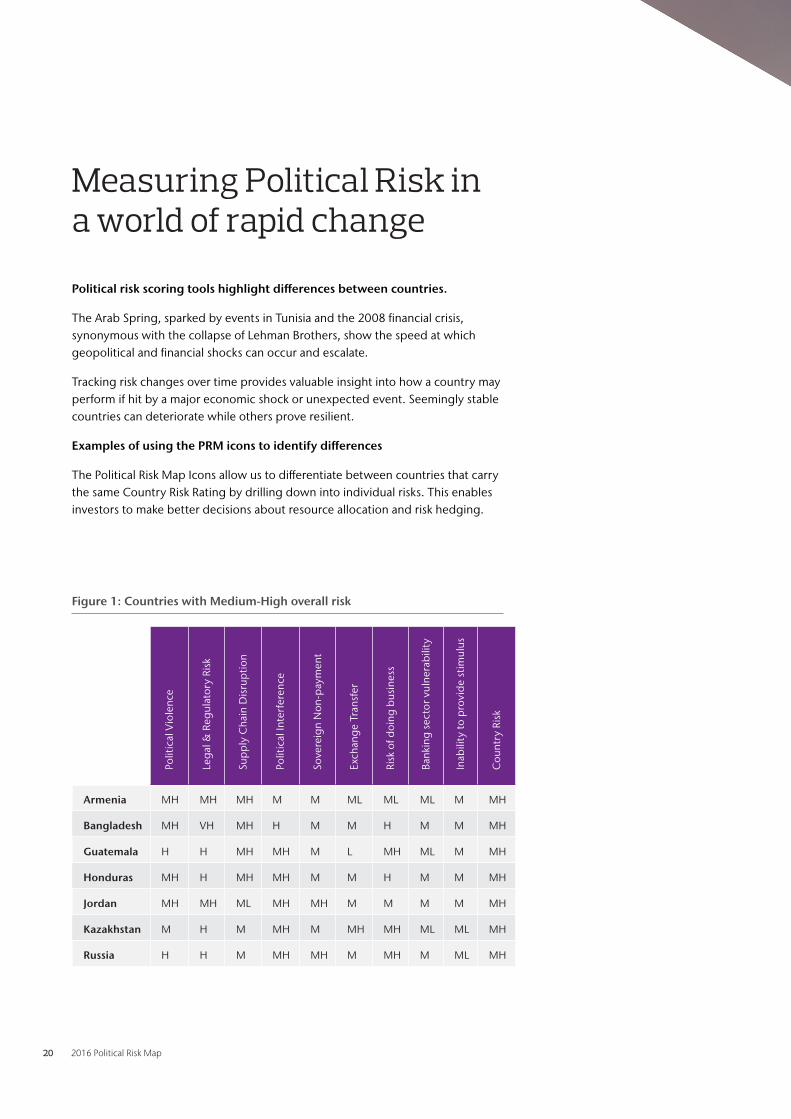
Examples of using the PRM icons to identify differences
The Political Risk Map Icons allow us to differentiate between countries that carry the same Country Risk Rating by drilling down into individual risks. This enables investors to make better decisions about resource allocation and risk hedging.
Polit
ical
Vio
lenc
e
Leg
al &
Reg
ulat
ory
Risk
Sup
ply
Cha
in D
isru
pti
on
Polit
ical
Inte
rfer
ence
Sove
reig
n N
on-p
aym
ent
Exch
ang
e Tr
ansf
er
Risk
of d
oing
bus
ines
s
Bank
ing
sect
or v
ulne
rab
ility
Inab
ility
to p
rovi
de
stim
ulus
Cou
ntry
Ris
k
Armenia MH MH MH M M ML ML ML M MH
Bangladesh MH VH MH H M M H M M MH
Guatemala H H MH MH M L MH ML M MH
Honduras MH H MH MH M M H M M MH
Jordan MH MH ML MH MH M M M M MH
Kazakhstan M H M MH M MH MH ML ML MH
Russia H H M MH MH M MH M ML MH
Figure 1: Countries with Medium-High overall risk
Aon Risk Solutions 21
Roubini Shadow Credit RatingsThe 2016 interactive Political Risk Map incorporates Roubini’s Shadow Credit Rating for 121 countries.
The Roubini Shadow Credit Rating was created to address perceived weaknesses in the existing over-reliance on the three main credit rating agencies (Fitch, Moody’s and S&P). The ratings are often i) slow to pick up changes in the underlying drivers of sovereign credit risk and ii) lag behind financial markets’ re-pricing of the true creditworthiness of a country.
The ratings are generated by applying the Roubini Country Strength Index against the sovereign credit ratings issued by the top three credit rating agencies. The results follow the S&P scaling system, with AAA a rating of the highest quality.
The Shadow Credit Rating, which is an assessment of a government’s ability to repay its sovereign debt, takes into consideration a broader set of variables including;
� sovereign non-payment risk
� institutional robustness
� economic growth potential and social risks
The Roubini Shadow Credit Ratings reveal strengths and weaknesses that may have been overlooked by the current rating agencies, and are therefore a proactive means of assessing the potential for future credit rating upgrades or downgrades.
For more on the Roubini Shadow Credit rating methodology, click here. (https://www.roubini.com/analysis/introducing-rges-shadow-credit-ratings)
22 2016 Political Risk Map
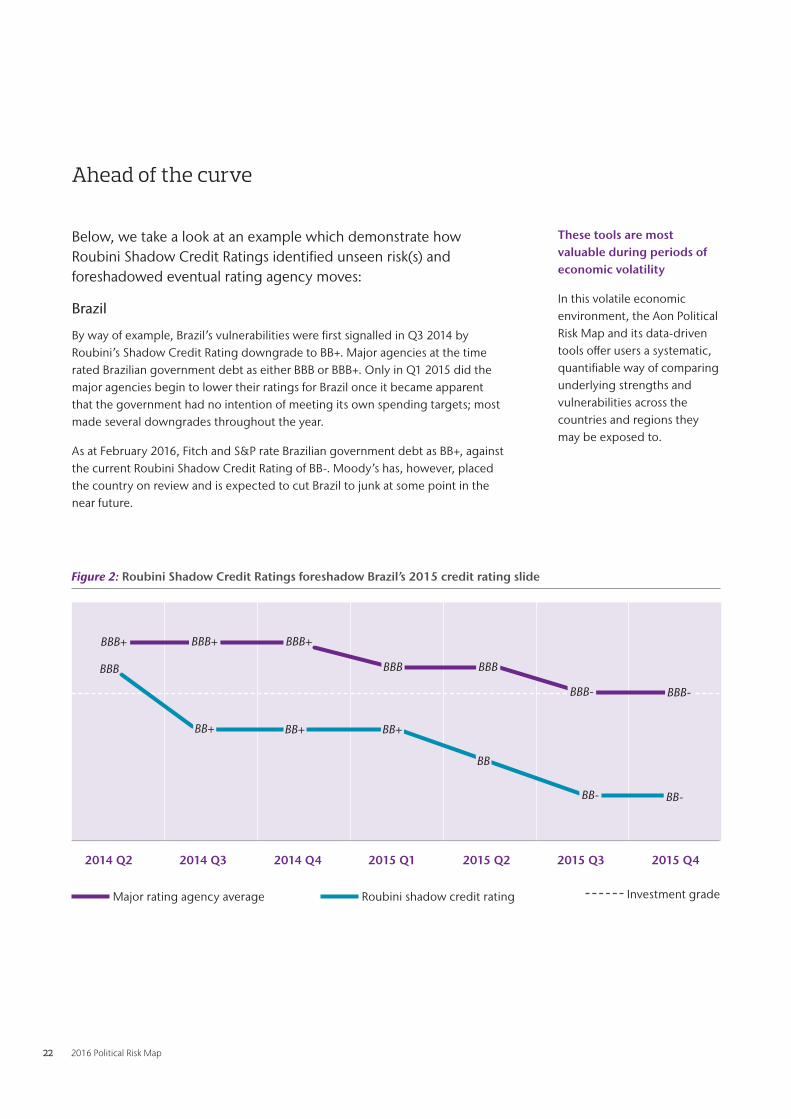
Below, we take a look at an example which demonstrate how Roubini Shadow Credit Ratings identified unseen risk(s) and foreshadowed eventual rating agency moves:
Brazil
By way of example, Brazil’s vulnerabilities were first signalled in Q3 2014 by Roubini’s Shadow Credit Rating downgrade to BB+. Major agencies at the time rated Brazilian government debt as either BBB or BBB+. Only in Q1 2015 did the major agencies begin to lower their ratings for Brazil once it became apparent that the government had no intention of meeting its own spending targets; most made several downgrades throughout the year.
As at February 2016, Fitch and S&P rate Brazilian government debt as BB+, against the current Roubini Shadow Credit Rating of BB-. Moody’s has, however, placed the country on review and is expected to cut Brazil to junk at some point in the near future.
Ahead of the curve
These tools are most valuable during periods of economic volatility
In this volatile economic environment, the Aon Political Risk Map and its data-driven tools offer users a systematic, quantifiable way of comparing underlying strengths and vulnerabilities across the countries and regions they may be exposed to.
Figure 2: Roubini Shadow Credit Ratings foreshadow Brazil’s 2015 credit rating slide
2014 Q2 2014 Q3 2014 Q4 2015 Q1 2015 Q2 2015 Q3 2015 Q4
BBB+ BBB+ BBB+
BBB BBB
BBB- BBB-
BBB
BB+ BB+ BB+
BB
BB- BB-
Major rating agency average Roubini shadow credit rating Investment grade
Aon Risk Solutions 23
ContactsVlad Bobko Head of Crisis Management [email protected] +44 (0)20 7086 4834
Matthew Shires [email protected] +44 (0)20 7086 4373
Prateek Singh [email protected] +91 988 629 0780
About Aon Aon plc (NYSE:AON) is a leading global provider of
risk management, insurance brokerage and reinsur-
ance brokerage, and human resources solutions and
outsourcing services. Through its more than 72,000
colleagues worldwide, Aon unites to empower results
for clients in over 120 countries via innovative risk
and people solutions. For further information on our
capabilities and to learn how we empower results for
clients, please visit: http://aon.mediaroom.com/
Aon UK Limited is authorised and regulated by the
Financial Conduct Authority
© Aon plc 2016. All rights reserved.The information contained herein and the statements expressed are of
a general nature and are not intended to address the circumstances of
any particular individual or entity. Although we endeavor to provide
accurate and timely information and use sources we consider reliable,
there can be no guarantee that such information is accurate as of the
date it is received or that it will continue to be accurate in the future.
No one should act on such information without appropriate profes-
sional advice after a thorough examination of the particular situation.
aon.com
Risk. Reinsurance. Human Resources.