POLITECNICO)DI)MILANO) · 2016-01-20 · POLITECNICO)DI)MILANO) FACOLTÀ(DI ... Lo studio eseguito...
110
POLITECNICO DI MILANO FACOLTÀ DI INGEGNERIA CIVILE E AMBIENTALE Corso di Laurea Magistrale in Ingegneria per l'Ambiente e il Territorio BIOCHAR FROM GRAPEVINE CANES: STUDY UPON PHOSPHATE SORPTION AND WATER RETENTION Relatore: Prof. SABRINA SAPONARO Tesi di laurea di: STEFANO VENTILII Matr. 819699 Anno Accademico 2015 2016
Transcript of POLITECNICO)DI)MILANO) · 2016-01-20 · POLITECNICO)DI)MILANO) FACOLTÀ(DI ... Lo studio eseguito...

POLITECNICO DI MILANO FACOLTÀ DI INGEGNERIA CIVILE E AMBIENTALE
Corso di Laurea Magistrale in Ingegneria per l'Ambiente e il Territorio
BIOCHAR FROM GRAPEVINE CANES: STUDY UPON PHOSPHATE SORPTION AND WATER RETENTION
Relatore: Prof. SABRINA SAPONARO
Tesi di laurea di: STEFANO VENTILII
Matr. 819699
Anno Accademico 2015 -‐ 2016


Ho il piacere di dedicare
questo traguardo
alla mia famiglia,
eterno punto di riferimento,
in segno di gratitudine e affetto.


Acknowledgements
This thesis is based on a part of the research carried out at the University of Ade-
laide, under the supervision of Dr. Philip Kwong, who is gratefully appreciated
for the opportunity of join in this project.
The author of this thesis gratefully acknowledges the wonderful person of Mr.
Jon Marshall, main developer of the research, for the supervision, the patience
and the help given under many aspects.
The author also thanks all those who helped for the realization of this work.


Abstract
Biochar is a carbon solid product by the pyrolysis process of organic matter. It
is structurally similar to charcoal, but differ for the purpose: biochar, produced
from organic matter, is used as soil improver, waste management strategy and
tool for the mitigation of climate change [Read, 2009].
In this work, two promising aspects of biochar produced from grapevine were
studied: phosphate sorption and Water Holding Capacity (WHC).
Grapevine cane is an abundant and underutilized biomass that could be py-
rolysised for environmental and economic benefits. Based on an industry typical
ratio of fruit yield to pruning weight of 1:5-10 [Smart et al., 1991] and the 2015
winegrape yield in Australia of 1.67 million tonnes [Winemakers Federation of
Australia, 2015], between 8 and 16 million tonnes of grapevine cane that are
pruned in Australian vineyards per annum at present largely go un-utilised. As
only 2% of the world’s surface area under vine is located in Australia [Interna-
tional Organization of Vine and Wine, 2015], grapevine cane could be 50 times
greater. The production of biochar from the cane could form an environmentally
sustainable secondary revenue stream for vineyards [Roberts et al., 2009].
Biochars containing calcite produced from grapevine cane were found to be
effective low-cost absorbents of phosphate, with a maximum adsorption capacity
of 32.9 mg g-1, an order of magnitude higher than unmodified biochars from
raw feedstocks. Increasing the pyrolysis temperature increased the adsorption
effectiveness at lower phosphate concentrations.

6
With a calcite adsorption mechanism, the pH may provide a method for the
release of phosphate from the spent biochar via application to acidic soil. Surface
area had no effect on adsorption capacity due to the narrow size of the pores.
This biochar has potential applications in both wastewater treatment and tile
drainage systems as a low-cost high-capacity phosphate absorbent.
The second study focuses on bulk density and WHC of biochar produced
from grapevine stalks and pruning. Bulk density was found to reach 0.20 g cm-1,
much lower than other biochars and common soils, indicating a high porosity.
Application of this biochar into soil could strongly improve the texture resulting
in a better soil-plant-atmosphere system.
Studying of contact angle proved that biochar produced at 400oC has a low
wettability due to the possible content of oil that remains at this temperature
[Kinney et al., 2012].
WHC results range within 0.47 and 0.79%, reaching the maximum at 700oC.
These values are higher that some other agricultural soils, so these biochars could
be mixed into soil in order to reduce water demand and irrigation needed.

Estratto
Il biochar è il prodotto carbonaceo derivante da un processo di pirolisi o di gas-
sificazione della materia organica, per cui è chimicamente simile al più ben noto
carbone. Il biochar, così come il processo di produzione, non è una tecnologia
nuova, ma antica ed abbondantemente utilizzata nel passato. La necessità di
coniare un nuovo termine per un materiale così antico deriva dal suo uso e dalla
volontà di sottolineare l’origine rigorosamente vegetale (mentre il carbone può
avere origine fossile).
Il biochar è un prodotto di particolare interesse perchè è in grado di affrontare
alcune tra le problematiche più critiche della società contemporanea: mitigazione
dei cambiamenti climatici, gestione dei rifiuti, economia circolare, bonifica dei
terreni, trattamento delle acque, etc. L’interesse verso questo prodotto si è svilup-
pato negli ultimi decenni e la ricerca lo testimonia: nel 2014 ci sono state più di
900 pubblicazioni riguardanti il biochar, il doppio rispetto il 2013 e 9 volte in più
rispetto al 2008.
L’applicazione del biochar in campo agricolo apporta dei benefici in termini di
resa agricola e riduzione del fabbisogno idrico e di fertilizzanti. Questi vantaggi
sono dovuti alla struttura altamente porosa che trattiene nutrienti, acqua e micro-
organismi e al miglioramento delle proprietà fisico-chimiche del terreno.
Lo studio eseguito per questa tesi intende fornire nuove conoscenze per val-
utare la fattibilità di queste ed altre applicazioni. Il lavoro svolto è parte di una
ricerca più ampia condotta presso la University of Adelaide che vuole affrontare

8
alcune tra le principali sfide del South Australia: aumentare la produzione di
cibo e di energia con un impatto minimo sull’ambiente e ridurre l’uso di acqua
nell’industria vinicola.
Le potature e i raspi dell’industra vinicola sono le materie prime utilizzate per
la produzione del biochar oggetto di studio. In questo lavoro sono stati studiati
due aspetti promettenti del biochar prodotta da vite: assorbimento di fosfato e
la capacità di ritenzione idrica (WHC).
Il potere assorbente del biochar lo rende interessante per l’estrazione di preziosi
nutrienti, come i fosfati, dalle soluzioni acquose. Il biochar può quindi essere uti-
lizzato per un circolo virtuoso per il recupero di fosforo: assorbe i fosfati dalle
acque reflue e le rilascia nei terreni agricoli come fertilizzante. I benefici che
se ne ricaverebbero sono riciclo del fosforo per ridurre la dipendenza dal fosforo
minerale (risorsa non rinnovabile), minore fabbisogno di fertilizzante e minore eu-
trofizzazione delle acque di scarico. Per poter dar credito a questa applicazione,
è necessario studiare i meccanismi di adsorbimento e desorbimento del fosforo.
Nel primo lavoro, è stato studiato il potere assorbente del biochar prodotto.
La massima capacità di assorbimento del biochar è di 32.9 mg/g, un ordine di
grandezza maggiore rispetto al biochar prodotto da altro materiale non trattato.
Questo risultato non inaspettato è dovuto all’elevata concentrazione di calcite
nelle potature di vite (e quindi nel biochar risultante), sul quale viene assorbito
il fosforo secondo il meccanismo ipotizzato da Karageorgiou et al (2007). Questo
meccanismo è governato dal pH della soluzione acquosa, quindi può essere sfrut-
tato anche per il rilascio di fosforo in ambienti acidi e neutri (come alcuni suoli
agricoli), ma questo aspetto richiede ulteriori studi.
Il rateo di rimozione del fosforo è superiore al 99.5% per concentrazioni iniziali
fino a 120 mgPO4/L. Il biochar prodotto da potature vinicole è quindi un possibile
strumento efficace ed economico (non richiede pretrattamenti) per il recupero di
fosforo dalle acque. Questa considerazione richiede ulteriori studi e analisi di
fattibilità per poter essere confermata.

9
Il biochar post adsorbimento è ricco di fosforo e potrebbe essere utilizzato
come fertilizzante agricolo. E’ necessario approfondire il meccanismo di rilascio
di fosforo nel suolo e i possibili effetti collaterali.
Nel secondo lavoro, è stata indagata la ritenzione idrica del biochar prodotto
dalle potature e dai raspi di vite a diverse temperature.
Si stima che in tutto il mondo solo il 56% dell’acqua d’irrigazione sia effetti-
vamente utilizzata dalle colture, il resto è perso per evaporazione o percolazione.
Inoltre nel prossimo futuro aumenterà il fabbisogno idrico in agricoltura a causa
dell’aumento demografico, delle variazioni nella dieta e dei cambiamenti climatici.
L’alta porosità del biochar permette di trattenere l’acqua nel suolo più a lungo,
riducendone le perdite.
Il WHC (Water Holding Capacity) del biochar prodotto tra 500oC e 700oC
varia tra 0.47% e 0.79% in funzione della temperatura. In base agli studi dell’angolo
di contatto, il biochar prodotto a 400oC si rivela idrofobico. La densità apparente
minima è di 0.20 g/cm che indica una elevata porosità.
Questo tipo di biochar, avendo elevata ritenzione idrica e bassa densità appar-
ente, può essere utilizzato per migliorare le qualità fisiche dei terreni, in quanto
ne migliora la tessitura del suolo e il sistema suolo-pianta-atmosfera.


Contents
List of Figures 16
List of Tables 17
1 What is Biochar 19
1.1 Origin of the Name . . . . . . . . . . . . . . . . . . . . . . . . . . 19
1.2 Terra Preta de Indio . . . . . . . . . . . . . . . . . . . . . . . . . 20
1.3 Production Process . . . . . . . . . . . . . . . . . . . . . . . . . . 22
1.3.1 Fast and Slow Pyrolysis . . . . . . . . . . . . . . . . . . . 24
1.4 Feedstock . . . . . . . . . . . . . . . . . . . . . . . . . . . . . . . 25
1.5 Characterization . . . . . . . . . . . . . . . . . . . . . . . . . . . 26
1.6 Stability . . . . . . . . . . . . . . . . . . . . . . . . . . . . . . . . 29
2 Applications 31
2.1 Mitigation of Climate Change . . . . . . . . . . . . . . . . . . . . 32
2.2 Soil Improver . . . . . . . . . . . . . . . . . . . . . . . . . . . . . 34
2.3 Soil Remediation . . . . . . . . . . . . . . . . . . . . . . . . . . . 35
2.4 Organic Waste Management . . . . . . . . . . . . . . . . . . . . . 36
3 Phosphate Crisis 37
3.1 Phosphorus Bottleneck . . . . . . . . . . . . . . . . . . . . . . . . 37

12 CONTENTS
4 Phosphate Sorption 43
4.1 Introduction . . . . . . . . . . . . . . . . . . . . . . . . . . . . . . 43
4.2 Material and Method . . . . . . . . . . . . . . . . . . . . . . . . . 45
4.2.1 Biochar Preparation . . . . . . . . . . . . . . . . . . . . . 45
4.2.2 Characterization . . . . . . . . . . . . . . . . . . . . . . . 45
4.2.3 Phosphate Sorption Procedure . . . . . . . . . . . . . . . . 47
4.2.4 Contact Time . . . . . . . . . . . . . . . . . . . . . . . . . 47
4.3 Biochar Properties . . . . . . . . . . . . . . . . . . . . . . . . . . 48
4.3.1 Elemental Analysis . . . . . . . . . . . . . . . . . . . . . . 48
4.3.2 ICP Results . . . . . . . . . . . . . . . . . . . . . . . . . . 49
4.3.3 Zeta Potential . . . . . . . . . . . . . . . . . . . . . . . . . 50
4.3.4 pH Values . . . . . . . . . . . . . . . . . . . . . . . . . . . 51
4.3.5 Surface Area . . . . . . . . . . . . . . . . . . . . . . . . . . 51
4.4 Removal Rate . . . . . . . . . . . . . . . . . . . . . . . . . . . . . 53
4.5 Adsorption Isotherms . . . . . . . . . . . . . . . . . . . . . . . . . 55
4.5.1 Langmuir Model . . . . . . . . . . . . . . . . . . . . . . . 59
4.5.2 Freundlich Model . . . . . . . . . . . . . . . . . . . . . . . 60
4.5.3 Langmuir-Freundlich Model . . . . . . . . . . . . . . . . . 61
4.5.4 Statistics . . . . . . . . . . . . . . . . . . . . . . . . . . . . 63
4.6 Possible Sorption Mechanism . . . . . . . . . . . . . . . . . . . . 64
4.6.1 Comparison with Other Studies . . . . . . . . . . . . . . . 66
4.7 Conclusion . . . . . . . . . . . . . . . . . . . . . . . . . . . . . . . 67
5 Water retention 69
5.1 Introduction . . . . . . . . . . . . . . . . . . . . . . . . . . . . . . 69
5.2 Material and Method . . . . . . . . . . . . . . . . . . . . . . . . . 70
5.2.1 Biochar Preparation . . . . . . . . . . . . . . . . . . . . . 70
5.2.2 Characterization . . . . . . . . . . . . . . . . . . . . . . . 71
5.2.3 Bulk Density . . . . . . . . . . . . . . . . . . . . . . . . . 71

CONTENTS 13
5.2.4 WHC measurements . . . . . . . . . . . . . . . . . . . . . 72
5.3 Results and Discussion . . . . . . . . . . . . . . . . . . . . . . . . 73
5.3.1 Chemical Properties . . . . . . . . . . . . . . . . . . . . . 73
5.3.2 Physical properties . . . . . . . . . . . . . . . . . . . . . . 74
5.3.3 Contact Angle . . . . . . . . . . . . . . . . . . . . . . . . . 74
5.3.4 Water Retention Curve . . . . . . . . . . . . . . . . . . . . 77
5.3.5 Comparison with soils . . . . . . . . . . . . . . . . . . . . 79
5.4 Conclusion . . . . . . . . . . . . . . . . . . . . . . . . . . . . . . . 81
6 Quo Vadis 83
6.1 Other studies needed . . . . . . . . . . . . . . . . . . . . . . . . . 83
6.2 Socio-Economic Prospectives . . . . . . . . . . . . . . . . . . . . . 84
6.3 Biochar in Italy . . . . . . . . . . . . . . . . . . . . . . . . . . . . 87
7 Appendix A 89
Bibliography 93


List of Figures
1.1 Example of Biochar . . . . . . . . . . . . . . . . . . . . . . . . . . 19
1.2 Map of Orellana’s route . . . . . . . . . . . . . . . . . . . . . . . 20
1.3 Terra Preta de Indio . . . . . . . . . . . . . . . . . . . . . . . . . 21
1.4 Production yields . . . . . . . . . . . . . . . . . . . . . . . . . . . 23
1.5 Typical production yields . . . . . . . . . . . . . . . . . . . . . . . 25
1.6 Comparison of different feedstocks . . . . . . . . . . . . . . . . . . 26
1.7 Graphite structure . . . . . . . . . . . . . . . . . . . . . . . . . . 27
1.8 SEM image of a grapevine cane derived biochar . . . . . . . . . . 28
1.9 Biochar production and application to soil . . . . . . . . . . . . . 30
2.1 Main goals of biochar . . . . . . . . . . . . . . . . . . . . . . . . . 32
2.2 Carbon cycle . . . . . . . . . . . . . . . . . . . . . . . . . . . . . 33
3.1 Phosphate rock depletion . . . . . . . . . . . . . . . . . . . . . . . 38
3.2 Peak Phosphorus curve . . . . . . . . . . . . . . . . . . . . . . . . 39
4.1 Grapevine pruning used in the study. . . . . . . . . . . . . . . . . 45
4.2 P sorption kinetic . . . . . . . . . . . . . . . . . . . . . . . . . . . 48
4.3 Elemental analysis . . . . . . . . . . . . . . . . . . . . . . . . . . 49
4.4 Zeta Potential . . . . . . . . . . . . . . . . . . . . . . . . . . . . . 50
4.5 pH . . . . . . . . . . . . . . . . . . . . . . . . . . . . . . . . . . . 51
4.6 Surface measurements . . . . . . . . . . . . . . . . . . . . . . . . 52

16 LIST OF FIGURES
4.7 Pore Diameter distribution . . . . . . . . . . . . . . . . . . . . . . 53
4.8 Removal rate . . . . . . . . . . . . . . . . . . . . . . . . . . . . . 54
4.9 Removal rates compared with other papers . . . . . . . . . . . . . 54
4.10 Phosphate adsorption data . . . . . . . . . . . . . . . . . . . . . . 55
4.11 Phosphate adsorption isotherms . . . . . . . . . . . . . . . . . . . 57
4.12 Langmuir-Freundlich curves . . . . . . . . . . . . . . . . . . . . . 59
4.13 Parameters of the Langmuir model . . . . . . . . . . . . . . . . . 60
4.14 Parameters of the Freundlich model . . . . . . . . . . . . . . . . . 61
4.15 Parameters of the Langmuir-Freundlich model . . . . . . . . . . . 62
4.16 Regression coefficients . . . . . . . . . . . . . . . . . . . . . . . . 63
4.17 XRD . . . . . . . . . . . . . . . . . . . . . . . . . . . . . . . . . . 64
4.18 Phosphate protonated species as a function of pH . . . . . . . . . 65
4.19 SEM . . . . . . . . . . . . . . . . . . . . . . . . . . . . . . . . . . 66
4.20 Langmuir maximum capacity compared with other papers . . . . 67
5.1 Elemental analysis . . . . . . . . . . . . . . . . . . . . . . . . . . 73
5.2 Bulk Density . . . . . . . . . . . . . . . . . . . . . . . . . . . . . 74
5.3 Water drops on the 4-Pa-Pr . . . . . . . . . . . . . . . . . . . . . 75
5.4 Optical pictures of contact angles . . . . . . . . . . . . . . . . . . 75
5.5 Trend of contact angle . . . . . . . . . . . . . . . . . . . . . . . . 76
5.6 Water retention curve . . . . . . . . . . . . . . . . . . . . . . . . . 78
5.7 Biochars’ WHC . . . . . . . . . . . . . . . . . . . . . . . . . . . . 79
5.8 Biochar’s water retention compared to other soils . . . . . . . . . 80
6.1 Companies in the biochar industry . . . . . . . . . . . . . . . . . 86
6.2 Geographic location of biochar businesses . . . . . . . . . . . . . . 87
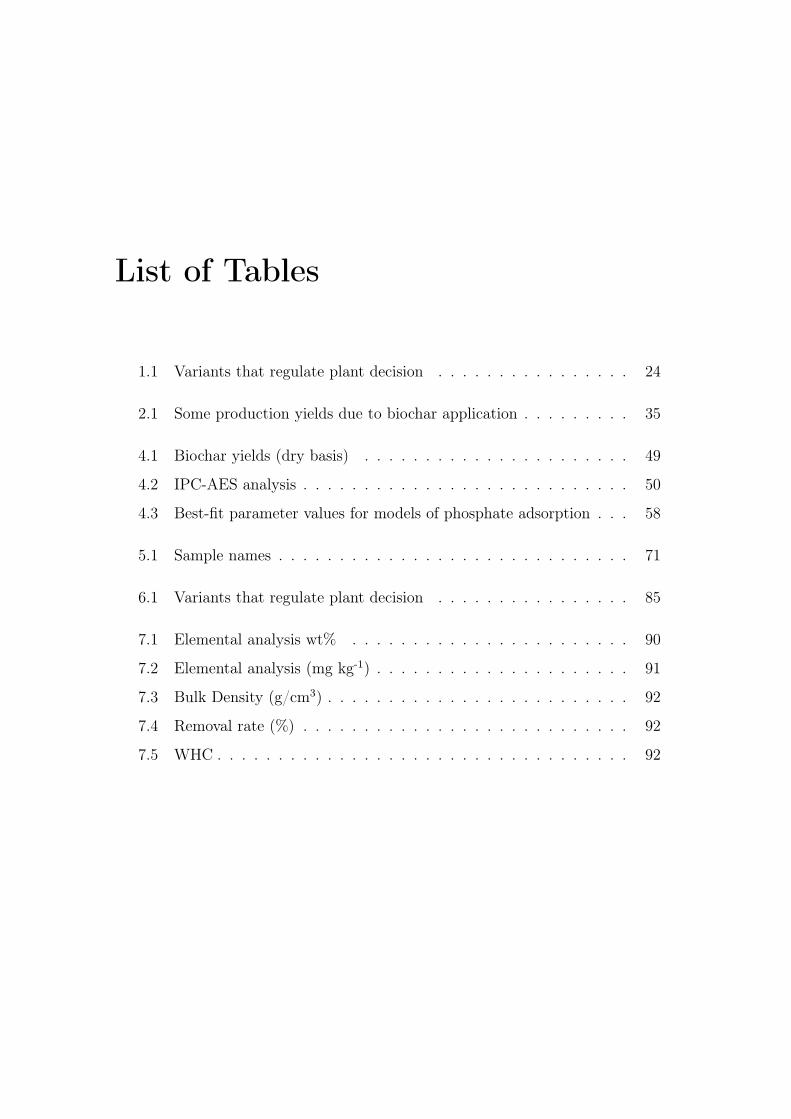
List of Tables
1.1 Variants that regulate plant decision . . . . . . . . . . . . . . . . 24
2.1 Some production yields due to biochar application . . . . . . . . . 35
4.1 Biochar yields (dry basis) . . . . . . . . . . . . . . . . . . . . . . 49
4.2 IPC-AES analysis . . . . . . . . . . . . . . . . . . . . . . . . . . . 50
4.3 Best-fit parameter values for models of phosphate adsorption . . . 58
5.1 Sample names . . . . . . . . . . . . . . . . . . . . . . . . . . . . . 71
6.1 Variants that regulate plant decision . . . . . . . . . . . . . . . . 85
7.1 Elemental analysis wt% . . . . . . . . . . . . . . . . . . . . . . . 90
7.2 Elemental analysis (mg kg-1) . . . . . . . . . . . . . . . . . . . . . 91
7.3 Bulk Density (g/cm3) . . . . . . . . . . . . . . . . . . . . . . . . . 92
7.4 Removal rate (%) . . . . . . . . . . . . . . . . . . . . . . . . . . . 92
7.5 WHC . . . . . . . . . . . . . . . . . . . . . . . . . . . . . . . . . . 92


Chapter 1
What is Biochar
"Despite their artistic pretensions,
sophistication, and many accomplishments,
humans owe their existence to a six-inch layer
of topsoil and the fact that it rains."
Anonymous
1.1 Origin of the Name
Biochar is a solid carbonauceus, fine-grained and porous material obtained from
the pyrolysis of wood or other organic material. Aesthetically and in the elemental
composition, biochar is similar to charcoal, which is perhaps the most ancient
industrial technology developed by humankind, used more than thirty thousand
years ago [Harris, 1999].
Figure 1.1: Example of Biochar
20 What is Biochar
The necessity of define a new name to distinguish biochar to charcoal is due to
the different functions: while charcoal is used as fuel, biochar is produced to store
carbon (C) to mitigate climate change, to improve the soil and crop productivity,
soil remediation, wastewater treatment, air filtration, as well as other uses. The
term ’Bio’ emphasizes the biological origin, distinguishing it from charred plastics
or other non-biological material. A precise definition has been expressed by the
International Biochar Initiative (IBI):
Biochar is a solid material obtained from the carbonization thermochem-
ical conversion of biomass in an oxygen-limited environments.
1.2 Terra Preta de Indio
Biochar was widely used for agricultural purposes in the past by ancient civiliza-
tions. Maybe the most well known case is the one of Terra Preta, the Portuguese
name used to identify the biochar used by Amazon tribes centuries ago. The
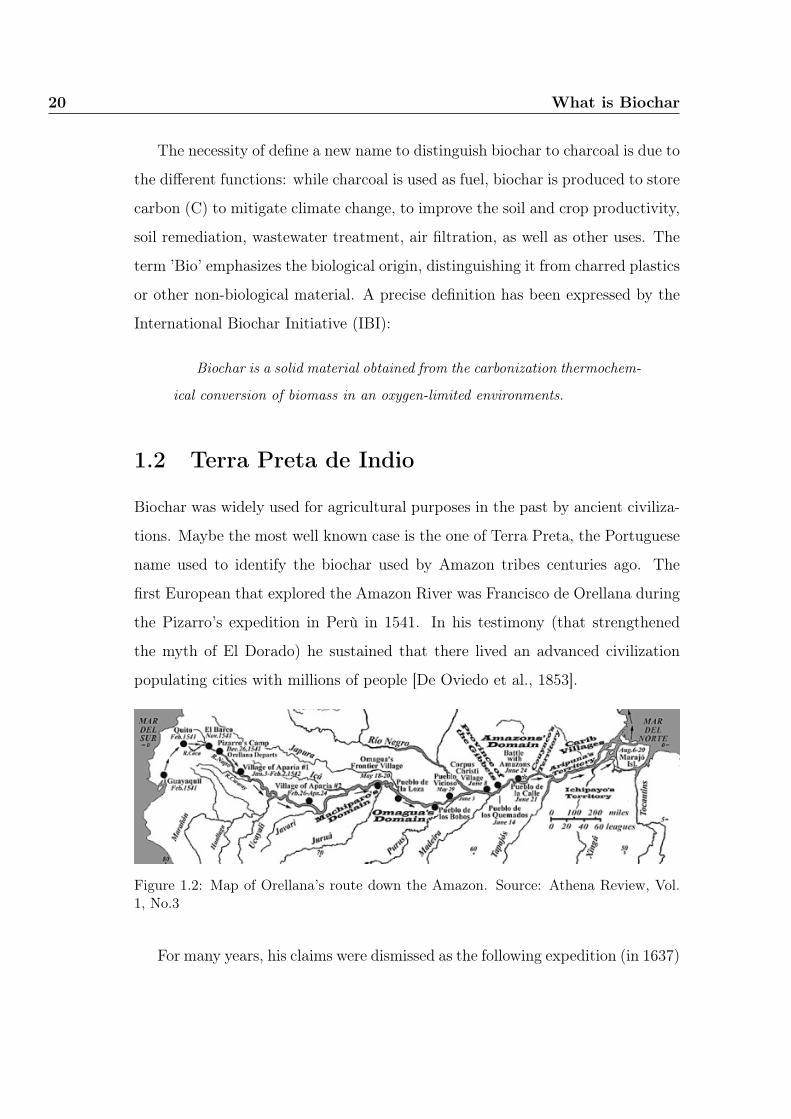
first European that explored the Amazon River was Francisco de Orellana during
the Pizarro’s expedition in Perù in 1541. In his testimony (that strengthened
the myth of El Dorado) he sustained that there lived an advanced civilization
populating cities with millions of people [De Oviedo et al., 1853].
Figure 1.2: Map of Orellana’s route down the Amazon. Source: Athena Review, Vol.1, No.3
For many years, his claims were dismissed as the following expedition (in 1637)
1.2 Terra Preta de Indio 21
led by Captain Pedro de Teixeira found no trace of what Orellana had reported
[de Acuña et al., 1641]. It is also reasonable that an advanced civilization cannot
develop in the middle of the Amazon rainforest, because the typical Amazon soil
is not adequately fertile for crops.
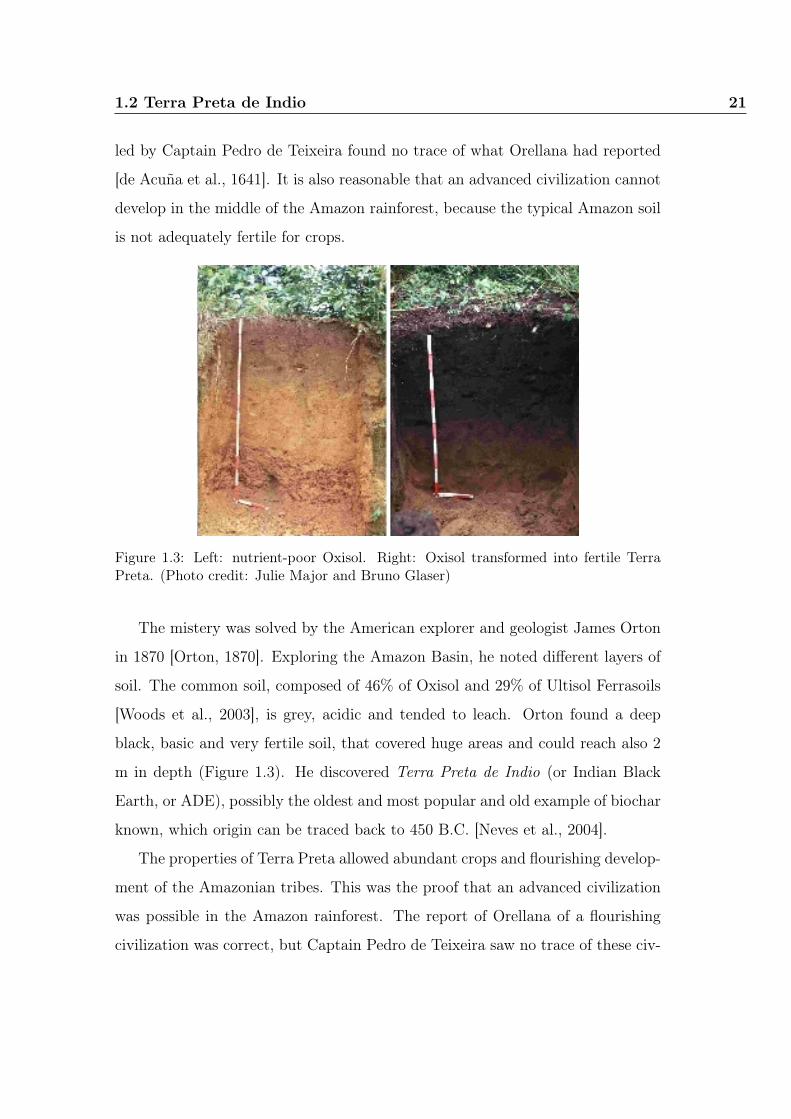
Figure 1.3: Left: nutrient-poor Oxisol. Right: Oxisol transformed into fertile TerraPreta. (Photo credit: Julie Major and Bruno Glaser)
The mistery was solved by the American explorer and geologist James Orton
in 1870 [Orton, 1870]. Exploring the Amazon Basin, he noted different layers of
soil. The common soil, composed of 46% of Oxisol and 29% of Ultisol Ferrasoils
[Woods et al., 2003], is grey, acidic and tended to leach. Orton found a deep
black, basic and very fertile soil, that covered huge areas and could reach also 2
m in depth (Figure 1.3). He discovered Terra Preta de Indio (or Indian Black
Earth, or ADE), possibly the oldest and most popular and old example of biochar
known, which origin can be traced back to 450 B.C. [Neves et al., 2004].
The properties of Terra Preta allowed abundant crops and flourishing develop-
ment of the Amazonian tribes. This was the proof that an advanced civilization
was possible in the Amazon rainforest. The report of Orellana of a flourishing
civilization was correct, but Captain Pedro de Teixeira saw no trace of these civ-

22 What is Biochar
ilizations because his voyage was quite one century later and the population was
already decimated by European diseases [Mann, 2005].
1.3 Production Process
Biochar can be produced from any kind of organic matter through several ther-
mal degradation processes: hydrothermal conversion, torrefaction, slow pyrolysis,
fast pyrolysis, gasification and various permutation [Lehmann and Joseph, 2012].
If biochar is the main product target, the choice falls on pyrolysis due to its
conversion rate of around 35% [Kammen and Lew, 2005].
Pyrolysis is a chemical decomposition process (thermolysis) driven at relative
low temperature (around 400-700oC) in absolute absence of oxygen. If the tem-
perature is higher than 700-800oC and a non-null amount of amount of oxygen
is present, the result is a process of gasification. The presence of oxygen affects
the amount of char produced: the more oxygen a production unit can exclude,
the more biochar it can produce [Lehmann and Joseph, 2012].
Co-products of pyrolysis are gaseous (syngas) and liquid (bio-oil), both which
possess good energetic and economic potential. Syngas is typically used to gen-
erate electricity after suitable treatments, and bio-oil can be converted into green
gasoline and green diesel [Elliott, 2007]. Product yield is strongly affected by
feedstock and operation conditions such as pressure, heat rate and temperature
(Figure 1.4).

1.3 Production Process 23
350 400 450 500 550
10
20
30
40
Temperature (oC)
Yield
(%) Biochar
Bio−OilGas
10oC/min
10
20
30
40
BiocharBio−OilGas
50oC/min
Figure 1.4: Yield of production at various temperature from pyrolysis of olive bagassewith a heating rate of 10oC/min and 50oC/min. Redrawn from [Şensöz et al., 2006]
During pyrolysis, the first reaction to occur is the dehydration of biomass with
the loss of large amounts of Hydrogen and Oxygen. Above 120oC the degradation
of lignocellulose starts through depolymerization which is completed between
250-350oC with a significant mass loss. The outcome is the production of an
amorphous Carbon matrix which is converted into polyaromatic graphene sheets
at 350oC.
During the process, a certain amount of Carbon is lost by volatilization, howe-
vere there is a relative concentration increase of Carbon with the process temper-
ature. If in the feedstock the Carbon content is 40-50%, it can reach 70-80% by
weight in the biochar after pyrolysis between 250oC and 600oC, and it can reach
over 90% through carbonization [Antal and Grønli, 2003]. The mineral content
of the feedstock usually remains the same in the biochar due to the difficulty for
the elements to volatilize [Laird et al., 2011].
The feedstock composition and process conditions are crucial aspects for the
characteristics of the final biochar. The diversity of feedstocks which can be
processed by pyrolysis and the large number of design variables make it difficult
to identify the optimum pyrolysis technology for a given situation. On the other
hand, the large amount of combinations make it possible to obtain the most
suitable products (Table 6.1).

24 What is Biochar
Table 1.1: Variants that regulate plant decision
Target Particle size Reactor type Heating rate Operation mode
Bio-oil Fixed bed Slow Batch
Syngas Chips Moving bed Fast Continuous
Biochar Fine particles Fluidized bed Intermittent
Heat
1.3.1 Fast and Slow Pyrolysis
Slow pyrolysis, or conventional carbonization, is the oldest industrial technology
developed by humankind [Harris, 1999]. It is based on a low heating rate (2-10oC/min) and high residence time (30 min) that lead to high char yields. The slow
heating induces the thermal decomposition of lignocellulosic biomass producing
approximately equal masses of syngas, bio-oil and biochar.
Fast pyrolysis, on the other hand, is the first choice if the final target is bio-
oil. The production can reach a 75% yield, which, after refinement, at least 40%
could be converted into green gasoline and green diesel [Jones et al., 2009].
Biochar is also produced through gasification, but in really low amount be-
cause the primary product is syngas (up to 85% of yield), a mixture primarily
composed by CO, H2 and CO2 [Laird et al., 2011]. The process generates con-
siderable heat that can be used to support the process. Gasification is mainly
designed to optimize syngas production, so it is rarely take into account as a
source of biochar.

1.4 Feedstock 25
0 10 20 30 40 50 60 70 80 90 100
Fast Pyrolysis
Slow Pyrolysis
Gasification
Liquid Char Gas
Figure 1.5: Typical production yield (dry basis) for different modes of pyrolysis. Theliquid component decreases with temperature with an increase of gas due to the
volatilization. Source: [Lehmann and Joseph, 2012]Fast Pyrolysis: temperature = 500oC, vapor residence time = 1 sec
Slow Pyrolysis: temperature = 500oC, vapor residence time = 5-30 secGasification: temperature > 750oC, vapor residence time = 10-20 sec
1.4 Feedstock
Biochar can theoretically be made from any feedstock with carbon content. Lig-
nocellulosic biomass is an obvious choice because it is the most abundant biolog-
ical material produced. However it is preferible to use biomass residues (agricul-
tural waste, manures, municipal organic waste, etc.) to solve also the challenge
of the waste management.
Not all organic matter is good feedstock: some organic matter can contain
undesirable contaminants, and low-quality physical and chemical properties in
some feedstocks could lead to low-quality biochars.

26 What is Biochar
219 438 657 876C (mg/g)
611
1723
N (mg/g)
6
12
18
24
P (mg/g)
78156
233311
Ca (mg/g)
1530
4459
Ash (%)
3
6
8
11
pH
159318
476635
SA (m2/g)
Corn
Hazelnut
Oak
Dairy Manure
Food Waste
Paper Waste
Poultry
Figure 1.6: Physical properties and elemental components of biochars made from differ-ent feedstocks. It is noticeable how different feedstock define greatly the characteristicof the final biochar. SA = Surface Area measured with CO2. Data source: [Rajkovichet al., 2012]
The choice of the feedstock depends on the desired biochar, due to physical
and chemical properties are reflected into the product after the process (Figure
1.6). While a certain percentage of Carbon, Oxygen and Hydrogen is lost in
the thermal process, much of the mineral content in the feedstock is retained
in the biochar where it is more concentrated. For example, biochar produced
from animal litter has higher Phoshprus (P) and Potassium (K) content than the
biochar from wood, which as an higher level of Carbon (C). The feedstock can
be also treated in order to increase the quality of the final biochar.
1.5 Characterization
Due to high variety of the physical properties and chemical composition of the
biochar, it is difficult to identify an elementary characteristic shared by all biochars.

1.5 Characterization 27
The main component is obviously Carbon, followed by Hydrogen, Oxugen and
Nitrogen, but their content range is very wide. In hardwood biochar, the C-
content can reach over 90% [Cheng et al., 2008], while it can be lower than 50%
in biochars made from rice straw, pea straw or ryegrass [Fernandes and Brooks,
2003, Tsai et al., 2007]. The range is even wider for total Phosphorus (2.7 g kg-1
to 480 g kg-1) or total Nitrogen (1.8 g kg-1 to 56.4 g kg-1), all with a coefficient
variation higher that 100% [Chan et al., 2007, Topoliantz et al., 2005, Lehmann
and Joseph, 2012].
Carbon is usually organized in aromatic rings (rings of six C atoms linked
together without O or H) arranged in a graphitic structure (stacked and aligned
sheets, Figure 1.7).
6.708Å
b
3.354Å
a
1.421Å
Figure 1.7: Graphite structure
The presence of other elements is strongly dependent on the feedstock, gen-
erally the main elemental constituents of biomass minerals are Si, Ca, K, Na and
Mg, with smaller amounts of S, P, Fe, Mn and Al [Raveendran et al., 1995] and

28 What is Biochar
some of those remain in the final biochar. For example in the biochar produced
from coir pith the K concentration is 10 times than that of the bagasse biochar,
while the rice husk biochar has 1000 times the Si concentration of the coconut
shell biochar [Raveendran et al., 1995].
Process conditions are another factor that influences the composition, for
example elements such as K, Na and Cl, that are present in form on high mobility
ions, can start to vaporize at relatively low temperatures [Yu et al., 2005]. Also
the amount of ash is controlled by feedstock and process conditions. In woody
feedstocks it is lower than 1% by weight, while in grass, straw and grain husks
contain up to 25% by weight [Raveendran et al., 1995].
The quality of biochars can be quantified from elemental ratios such as H/C
and O/C, that are good indicators to measure the degree of aromatic and mat-
uration of biochar [Baldock and Smernik, 2002]. pH is another highly variable
parameter, ranging within 4 and 12 [Lehmann and Joseph, 2012]. This is actually
positive, because it allows for a suitable biochar for each application.
Figure 1.8: SEM image of a grapevine cane derived biochar produced in batch by slowpyrolysis at 400oC. The high porosity is evident.
A feature shared by all biochars is the porous structure with a high internal
surface area. Typically sand has a specific surface area of 0.01-0.1 m2 g-1, clay
of 5-750 m2 g-1 and biochar of 750-1360 m2 g-1, with an average pore volume of

1.6 Stability 29
0.2-0.5 m3 g-1 [Laine et al., 1991]. The presence and size distribution of pores
provides a suitable habitat for many microorganisms by protecting them from
predation and desiccation [Saito and Marumoto, 2002, Warnock et al., 2007]
1.6 Stability
Thanks to its graphitic structure, biochar is the most stable form of organic mat-
ter [Krull et al., 2006], and because of this, it is a great tool for the mitigation of
climate change (Section 2.1). While a fraction of C is labile and easily microbially
degraded within short periods of time, a larger amount is stable and can remain
in the soil for centuries of even millennia.
The range of possible ages is huge, at least for one order of magnitude due
to differences in the decomposition processes. Lehmann calculated that the most
likely and conservative scenarios under the dry land conditions of Northern Aus-
tralia had a residence time between 1300 and 2600 years [Lehmann et al., 2008].
Measurements of biochar from coastal temperate rainforest of western Vancou-
ver suggest an averange half-life of more than 6000 years [Preston and Schmidt,
2006].

30 What is Biochar
Figure 1.9: Schematic representation of the factors that can influence stability, decayand transportation of biochar, and their proposed importance over time (indicated bythe thickness of the bars). Source: [Lehmann and Joseph, 2012]
Factors that affect biochar stability are sundries and their influence varies in
time (Figure 1.9). The main processes are the biotic activity and the mineral-
ization, however their contribution is difficult to measure. Biochar decay is a
process that is still not thoroughly understood, but there are different studies fo-
cused upon it and theere is the real possibility to increase the stability of biochar
[Lehmann and Joseph, 2012].

Chapter 2
Applications
"Anche in un fazzoletto da naso può esserci un firmamento,
basta sapercelo vedere."
"Even in a handkerchief can be a firmament,
you have just to know how to see it."
Scherzi di gioventù, Aldo Palazzeschi, 1956
The interest in biochar in the last decades has been driven by its physical
and chemical properties, thanks to it is a good tool for solve some of the most
important challenges of our time. From soil remediation to the building sector,
farming and water treatment, biochar has more than 55 uses [Schmidt, 2012] and
the number can only increase in the future.
The most interesting use of biochar is by far the mitigation of climate change,
because the graphitic structure stores carbon into soil for centuries. In farming,
biochar increases crop production and the fertilty of soil and reduces soil degra-
dation due to its high porosity. Biochar is also a good tool for the water and
emission gasses treatment. If biochar is activated, its characteristics improve,
increasing the efficiency in the use.

32 Applications
Waste Management
Soil Remediation
Climate Mitigation
Soil Enhancement
BIOCHAR
Figure 2.1: Main goals of biochar
2.1 Mitigation of Climate Change
Biochar is mostly composed of stable Carbon (C), organized in graphitic struc-
ture. It represent a good strategy to sequestrate C into soil for centuries or even
millenia. Storage of C through biochar is an efficient and long-term method to
remove Greenhouse Gases (GHGs) from the atmosphere, and then mitigating the
climate change [Woolf et al., 2010].
Photosynthesis of plants captures 120 Gt C from atmosphere annually, most
of which is emitted into the atmosphere through plant and soil respiration, while
the rest is stored as biomass [Lal, 2008]. Under BAU1 scenarios, this C stored
in biomass is released back into the atmosphere as CO2 or other GHGs through
decomposition or burning.
When biomass dies or is slashed, it is easily decomposed by microorganisms
releasing carbon back in atmosphere mainly as CO2 in few years, depending on
the composition [Jenkinson and Ayanaba, 1977]. Composting can increase the
stability of biomass, but there are evidences that the turnover of C is similar to
the un-composted organic matter (within 10 and 20 years [Lynch et al., 2005]).
The most efficient solution is converting biomass in biochar through pyrolysis1Business As Usual

2.1 Mitigation of Climate Change 33
in order to obtain the most stable organic structure: graphite. Lehmann (2007)
estimates that annually 160Mt C (600Mt CO2) can be stabilizedby converting
the current ’slash-and-burn’ practices to ’slash-and-char’.
Figure 2.2: Comparision of the carbon cycle between BAU (left) and biochar (right)scenarios. Source: biochar-international.org
Current management practices are said to be carbon neutral because they
release in atmosphere the same C taken through photosynthesis, without any
addition into the C cycle. Biochar, on the other hand, stores C in the soil for a
long time, removing matter from C cycle. For this reason biochar is one of the
few carbon negative technologies.
Incorporating biochar into soil increases the uptake of methane (CH4) and
reduces the release of nitrous oxide (NO2), two powerful GHGs with a GWP2
of 34 and 298 respectively [IPCC, 2013], but the mechamism is still not well
understood.2Global Warming Potential. 1 GWP is equal to the effect of 1 ton of CO2 in 100 years.

34 Applications
The difficult in defining a biochar carbon offset methodology is the reason
why carbon stored into biochar still cannot be trade in the Carbon Market.
2.2 Soil Improver
The application of biochar in soil leads to various benefits by changing soil prop-
erties. Crop production is widely proved to increase incorporating biochar into
soil [Lehmann and Joseph, 2012] and in some cases biomass production increase
can reach up to 300%3 (Table 2.1). The main effects of biochar incorporation in
soil are:
• increased water holding capacity;
• increased nutrient retention and cation exchange capacity (CEC);
• increased crop nutrient bioavailability;
• increased microbial activity;
• increased aeration, structure, porosity, and tilth;
• pH amelioration;
• reduced nutrient leaching.
The high reproduction rate of microorganisms [Steiner et al., 2004] explains
why biochar accelerates composting and deodorize manure when applied to or-
ganic waste [Yoshizawa et al., 2007, Ogawa, 1994]. Biochar reduces the leakage
of nutrients and pesticides, saving fertilizers and chemicals with a greater envi-
ronmental benefit.3Location: Tropical forest, Brazil. Soil: Oxisol. Crop: Rice. Biochar type: Wood biochar
from local kilns. Quantity of biochar: 7.9 tC ha-1 [Nehls, 2002]

2.3 Soil Remediation 35
Table 2.1: Production yields above baseline due to the application of biochar to differentcrops and soils and in different percentage.
Type ofcrop Reference Location Type of
soilTreatment(t ha-1) Yield
Rice Lugato etal. 2013
NorthernItaly
aguichapludalf 40 +36%a
Maize Uzoma etal. 2011
Tottori,Japan sandy soil 15 +150%b
Maize Oguntundeet al. 2004
Ejura,Ghana - N/A +91%a
Soyabean Tagoe et al.2008 Gifu, Japan - 3,8 +43%a
Bean Rondon etal. 2007
Cali,Colombia
clay–loamoxisol 9% +46%a
Wheat Vaccari etal. 2011
Pistoia,Italy silty loam 30 +33%a
Radish Chan et al.2008
NSW,Australia
chro-mosol 10 +42%a
Cabbage Carter etal. 2013
Siam Reap,Cambodia
sandyacidic 100 +750%a
a compared to unamended soilb compared to using fertilizer alone
The absorbency of biochar can also be used to recover nutrients such a Phos-
phate, Ammonium and pesticides from wastewater, reducing eutrophication and
pollution [Lehmann and Joseph, 2012, Takagi and Yoshida, 2003].
2.3 Soil Remediation
Due to its large surface area and high cation exchange capacity, biochar is able
to absorb organic and inorganic contaminants to its surface, reducing pollutant
mobility, when amending contaminated soils [Beesley et al., 2011].
Like activated carbons, biochars seems to be able to reduce organic contam-
inant bioavailability in soils [Zhang et al., 2010, Gomez-Eyles et al., 2011, Yu
et al., 2006, Wang et al., 2010]. Some studies are developed to evaluate how

36 Applications
biochar influence polluted water and soil. Beesley et al (2010) reported a PAHs
reduction fo 40%, while Rhodes et al (2010) reached a reduction of Phenanthrene
of 99% [Rhodes et al., 2010].
In terms of heavy metal remediation, biochar has been considered to be po-
tentially effective [Tang et al., 2013, Fellet et al., 2011, Beesley and Marmiroli,
2011, Hartley et al., 2009, Beesley et al., 2010]. The effect of the incorpora-
tion of biochar produced from rice straw on the mobility and bioavailability of
Cu(II), Pb(II) and Cd(II) in an Ultisol was investigated by Jiang et al. [Jiang
et al., 2012]. The acid extractable Cu(II) and Pb(II) decreased by 19.7–100%
and 18.8–77.0%, respectively with the increase of the biochar amendment dose
[Jiang et al., 2012].
The application of biochar for soil remediation is still poorly developed and
mechanisms involved are unclear. The interaction biochar-contaminant depends
on many factors (related to contaminant, soil and biochar), so more studies are
required to quantify the effects and to figure out which mechanisms are involved.
2.4 Organic Waste Management
Waste management is one of the contemporary challenges, the zero-waste pro-
duction (or circular production) is the key for a sustainable civilization and a
heavy goal to reach.
In agriculture and in some industrial production, organic waste represents a
environmental and economic cost due to its management and the disposal. In a
circular production, these by-products can be used as the raw material for the
production of biochar, with an obvious economic benefit. In this case, the price
of feedstock is negative, without the circular production the biomass would incur
a waste disposal fee. The environmental benefits are remarkable: there is less
waste in landfills, less energy demand and new material from waste.

Chapter 3
Phosphate Crisis
"We may be able to substitute nuclear power for coal,
and plastics for wood, and yeast for meat, and friendliness for isolation;
but for Phosphorus there is neither substitute nor replacement"
Life’s Bottleneck, Isaac Asimov, 1959
3.1 Phosphorus Bottleneck
Phosphorus (P) is an essential nutrient for all life forms, an irreplaceable element
for flora and fauna cellular growth. Plants take it up in the form of Phosphates
through the soil and animals through food consumption. Phosphorus compounds
are usually mobility limited, so the global Phosphorus cycle is dominated mainly
by river P transport [Oelkers et al., 2008]. This results in the decrease of P
amount in cropland because there isn’t a natural flux that offsets the loss. The
only way to keep crops flourishing is the artificially introduction of Phosphates
with fertilizers that permit the continuation of global food production [Driessens
and Verbeeck, 1990, Cordell et al., 2009]. Clearly, human livelihood is dependent
on the P availability.
The world demand of Phosphate fertilizer is steadily increasing. In 2014, it

38 Phosphate Crisis
was of 42.7 Mt1 P2O5, with a growth rate of 2.4% from 2013. There is expected
to be an overall increase of 3.9 Mt P2O5 by 2018 [FAO, 2015b]. This increase is
driven by food production, and, by extension, by world population growth and
the changing of the world’s eating habits [Metson et al., 2012]. Other elements
like Nitrogen and Potassium are important for the growth of plants, but Nitrogen
can be take up from air and Potassium reserves are adeguate for several centuries.
On the other hand, Phosphorus has to be mined and the available global supplies
are running out which could lead to a serious food production crisis worldwide
[Vaccari, 2009].
0 20 40 60 80 100 120 140
AustraliaBrasil
CanadaChinaEgyptIsrael
Jordan
Morocco andWest Sahara
RussiaSenegal
South AfricaSyriaTogo
TunisiaUnited States
Other
2735
2281
2638
6685
1424
1262119
928
64
Depletion time (years)
Figure 3.1: Phosphate rock: years of extraction remaining based on current reservesfrom 2006 using a 2% yearly increase. Source: USGS
Today, Phosphorus is mostly obtained from mined Phosphate rock which is
a non-renewable resource. Reserves2 are limited (Figure 3.1) and the fertilizer11 Mt = 1.000.000 tons2That part of an identified resource which could be economically extracted or produced at
the time of determination. The term reserves need not signify that extraction facilities are in

3.1 Phosphorus Bottleneck 39
industry recognises that the quality of reserves is declining and the cost of extrac-
tion, processing and shipping is increasing [Smil, 2000, EcoSanRes, 2003]. Global
commercial Phosphate reserves are running out. China is drastically reducing
exports to secure domestic supply, US has less than 30 years left of supplies and
Western Europe and India are totally dependent on imports [Rosemarin, 2004].
The world mine capacity is difficult to evaluate. According to U.S. Geological
Survey it is 67 Gt PR3 in 2014, while FAO registred 12 Gt PR in 2001 [FAO,
2004]. This difference is due to several factors. First, technological progress
and market price makes this value variable. In addiction, there isn’t a common
definition of "reserves" and "resources" [Edixhoven et al., 2014]. Moreover, most
of the data is third-hand because Phosphate mines are predominantly private, so
they are difficult to verify and in some cases they are affected by the will to make
public the real capacity [Gilbert, 2009].
Figure 3.2: Cordell et al (2009) suggests that the peak of Phosphorus production wilbe reached before 2040. [Cordell et al., 2009]
The volatility of the size of reserves affects the estimation of depletion and
peak Phosphorus4 prediction: some researchers estimate the depletion within
place and operative. Reserves include only recoverable materials [Jasinski, 2002].31 Gt PR = 1 Giga tons of Phosphate Rock4Peak Phosphorus is a concept to describe the point in time at which the maximum global
40 Phosphate Crisis
80-90 years [Vaccari, 2009, Smil, 2000] while other more optimistic researchers
suggest up to 100-130 years [Steen, 1998, Smit et al., 2009]. In any case the
majority of experts agree that while high-grade reserves range from 50-100 years
(Figure 3.2), the critical point could indeed occur decades before these depletion
estimates [Cordell et al., 2009].
Upstream of the agricultural chain there is a serious problem with the lack
of Phosphorus, downstream of the chain there is the opposite problem. A great
amount of the P supplied to soil will be lost into the environment due to rain or
other water flows, causing eutrophication in natural waters and environmental
degradation. A good way to solve both the issues is to recover the P excess before
it is released into the environment.
Phosphorus production rate is reached. Source: Wikipedia http://en.wikipedia.org/wiki/Peak_phosphorus

Aim of the Project
In South Australia, agriculture (viticulture in particular) is threatened by climate
change [IPCC, 2013, p. 7]. Biochar is a powerful tool to solve problems related
to soil and agriculture.
The aim of this project is to give a contribution to the solution of these
problems, facing also with two of the seven strategic priorities of South Australia5:
premium food and wine from our clean environment, unlocking the full potential
of South Australia’s resources, energy and renewable assets.
This part of the project is divided in two studies:
• The first study is to determine if an unmodified waste feedstock naturally
high in calcium as grapevine canes could be used to produce biochar for
phosphate adsorption. Following this, the study will identify possible mech-
anisms and determine if the production temperature of biochar has an effect
on phosphate adsorption capacity.
• The second study is to investigate the bulk density and Water Holding Ca-
pacity (WHC) of biochar produced at different temperatures using grapevine
stalks and prunings. High values of WHC and low of bulk density are de-
sired, so that biochar can be applied to sandy soils to improve physical
properties and reduce water demand and effects of droughts.
5http://economic.priorities.sa.gov.au/


Chapter 4
Phosphate Sorption
4.1 Introduction
In literature is widely demonstrated the good adsorbance capacity of biochar for
contaminants ranging from heavy metals to organic compounds. Some studies
are now focused on the possibility to use biochar for the absorption of Phosphorus
(P) from aqueous solutions in order to reduce eutrophication in wastewater and
the dependency from P mining, recycling this nonrenewable nutrient.
Biochar can usually adsorb the ammonium cation due to carboxyl groups on
the surface of the carbon that carry a negative charge. As the maximum tem-
perature of pyrolysis is increased in the production of biochar, the net charge is
reduced because carboxyl groups are removed and positive charges are introduced
to the surface of the biochar [Cheng et al., 2008].
Given that P is usually in the form of phosphate that is an anion, most
biochars’ ability to adsorb P is quite low. This is clearly supported when 13
biochars were produced and tested for phosphate, nitrate and ammonium sorption
capacity by Yao et al (2012). Nine showed the ability to adsorb ammonium but
none showed significant sorption capacity of nitrate or phosphate, with 8 of the
13 biochars releasing P into solution instead [Yao et al., 2012].

44 Phosphate Sorption
As the properties of the biochar are highly dependant on the feedstock [Sun
et al., 2014] a number of studies have looked at modifying the feedstock to in-
crease phosphate adsorption. Iron-treated orange peel powders are used to pro-
duce magnetic biochar with a phosphate adsorption capacity of 1.2 mg g-1 [Chen
et al., 2011]. Biochar produced from anaerobically digesting sugar beet tailings
produced a phosphate adsorption capacity of 133 mg g-1 compared to a negligible
capacity in biochar from the raw feedstock [Yao et al., 2011, Yao et al., 2012].
The biochar produced from the modified feedstock had a lower, but still neg-
ative zeta potential, likely reducing the electrostatic repulsion between the char
surface and the phosphate cation [Yao et al., 2011]. In addition, the biochar had
a higher surface area and significantly higher calcium and magnesium present
when compared to raw sugar beet tailings[Yao et al., 2011]. Yao et al (2013) also
correlated the level of magnesium to the removal rate of phosphate from solution
and suggested that the mechanism involved precipitation of Mg-P salts followed
by hydrogen bonding of phosphate to the salts [Yao et al., 2013b].
Jung et al (2015) studied phosphate removal from aqueous solution using 5
types of biochar (oak wood, soybean stover, bamboo wood, maize residue and
peanut shell). Peanut shell had the best result with a phosphate capacity of 6.79
mg g-1 [Jung et al., 2015]. The biochar had high calcium and showed calcite
(CaCO3) present in X-ray diffraction (XRD) spectra. Importantly, as the pH
was increased the adsorption capacity increased [Jung et al., 2015] suggesting
that the mechanism of phosphate adsorption may be a reaction with calcite on
the biochar surface.
According to Karegeorgiu et al (2007) P adsoption could be driven by a mech-
anism that works at high pH and high calcite content. With this study it is
expected to satisfy both the conditions, in order to have a high P adsorbent non
engineered biochar. Furthermore, by reversing the equilibrium of the reaction
the phosphate may be exchangeable when applied to acidic soils [Karageorgiou
et al., 2007].

4.2 Material and Method 45
4.2 Material and Method
4.2.1 Biochar Preparation
The feedstock used was grapevine canes sourced from the Limestone Coast, an
Australian Geographical Indication (GI) associated with calcium-rich soils in
limestone terrain.
Biochar was prepared by oven drying the feedstock at 105oC for 16 hours prior
to pyrolysis. The dried feedstock is heated at 10oC/min in an Argon environment
with a flow rate of 1 L/min using a three-zone tubular furnace (Lindberg Blue
M, STF 55346C-1).
Feedstock was pyrolyzed at the target temperature of 400, 500, 600 and 700oC,
and labelled BC400, BC500, BC600 and BC700 respectively. Once the goal
temperature was reached, it was held for 1 hour before cooling overnight in an
Argon atmosphere. The resulting biochar was then crushed to 90-500 microns
and stored in sealed containers prior to use.
Figure 4.1: Grapevine pruning used in the study.
4.2.2 Characterization
To determine the composition of the feedstock and resulting biochars the Car-
bon (C), Hydrogen (H) and Nitrogen (N) contents of the samples were analysed
in a CHN Elemental Analyzer (Perkin Elmer, 2400 Series II). Oxygen (O) was
calculated by difference. Trace elements, including Zinc (Zn), Calcium (Ca),
46 Phosphate Sorption
Magnesium (Mg), Sodium (Na), Potassium (K), Phosphorus (P) and Sulfur (S)
were analysed by the Inductively Coupled Plasma Array Optical Emission Spec-
troscopy (Spectro, CIROS CDD Radial ICP-OES) with nitric/perchloric acid
digestion according to the method of Wheal et al (2011).
A Scanning Electron Microscope (Philips, XL-30) was used to determine the
morphology and surface compositions of the biochars. Compositional analysis of
the surface was conducted concurrently by Energy Dispersive X-ray spectroscopy
(EDX).
Surface area was determined with CO2 adsorption at 273K on the BELSORP-
max (Bel Japan, BELSORP-max) using Density Functional Theory (DFT) method.
The pore size distribution was also determined using DFT on the CO2 adsorp-
tion/desorption isotherms for biochar.
Zeta potential was determined by a Zetasizer (Malvern Instruments, Nano ZS)
with deionized water as the carrier fluid. An average of 20 runs were undertaken
for each sample. The sample material used in calculations was carbon (lamp
black, graphite) with refractive index of 2.420 and absorption of 0.9000.
The pH was measured by mixing 1 gram of biochar with 25 mL of deionized
water. The solution mixture was shaken in an end-over-end shaker for 24h and
the solution pH was used as the pH of biochar.
XRD patterns were recorded on the each biochar pre and post adsorption
to identify crystalline compounds present before and after the sorption of phos-
phate using a Multi-purpose Diffractometer (PANalytical, X’Pert Pro) with Fe
filtered Co Kα 45kV, 55mA and λ of 0.17021 nm radiation, automatic diver-
gence slit, 2◦ anti-scatter slit and fast X’Celerator Si strip detector. The diffrac-
tion patterns were recorded in steps of 0.017◦ 2θ with 0.5 seconds per step over
the range of 3.975 to 80.01◦. Phase identification was performed on the XRD
data using CSIRO in-house software (XPLOT) and HighScore Plus (PANalyti-
cal) search/match software.

4.2 Material and Method 47
4.2.3 Phosphate Sorption Procedure
Phosphate solutions were prepared with potassium phosphate monobasic (KH2PO4)
dissolved in DI water with 0.01 M calcium chloride (CaCl2) as an electrolyte and
1 g/L sodium azide (NaN3) to inhibit microbial growth.
Based on procedure of Nair et al (1984), 1 gram of biochar was mixed in 50
mL centrifuge tubes with 25 mL of phosphate solutions at concentrations of 120,
245, 370, 490, 735, 860, 980, 1230 and 1470 mg PO4/L. Phosphate is supplied
through the addition of potassium dihydrogen phosphate (KH2PO4). The tubes
were shaken for 24 h (see Section 4.2.4) at 50 rpm on an end-oven-end shaker at
room temperature. Samples were centrifuged at 4000 rpm for 5 minutes before
being filtrated with a 0.45 micron nylon filter (membrane solutions).
The ascorbic acid method1 was used to determinate the phosphate concen-
trations of the solutions with a UV-Visible Sectrophotometer (Schmadzu UV-vis
1601) at a wavelength of 660 nm. The amount of phosphate sorption was calcu-
lated based on the difference between the initial and final solution concentrations.
All tests were performed in triplicate, and the average experimental data are re-
ported (Figure 4.10).
4.2.4 Contact Time
In literature, sorption data is often measured after 24 h of mixage because it is
known to have reached equilibrium. The following kinetic study was developed
to strengthen this thesis.
The kinetic was analyzed for BC600 in a solution of 1470 mg PO4/L following
the same procedure described in section 4.2.3. Measurements were taken after 6,
18, 24, 96 and 168 hours in order to analyze the sorption in the shortest period
but also after a long-term period, to avert the possible release. All tests were1Applied following the method 365.3 approved by National Pollutant Discharge Elimination
System (NPDES). http://water.epa.gov/scitech/methods/cwa/bioindicators/upload/2007_07_10_methods_method_365_3.pdf

48 Phosphate Sorption
performed in triplicate, and the average experimental data are reported (Figure
4.2).
0 20 40 60 80 100 120 140 160 1800
10
20
30
Time (h)
Sorbed(mg/g)
Figure 4.2: Kinetic was measured after 6, 18, 24, 96, 168 h showing that the plateau isquickly reached and held for long time.
The figure 4.2 shows that after 6 h the plateau is already reached. This
analysis confirms that 24 h is enough to reach the equilibrium, and that there is
no release after this point.
4.3 Biochar Properties
4.3.1 Elemental Analysis
Elemental composition analysis (Figure 4.3) shows that all biochars are carbon-
rich which is typical of pyrolyzed biomass [Lehmann and Joseph, 2012], with C
content that increases with temperature, ranging between 72 wt% and 80 wt%.
The O and H contents of all the samples ranged 17-21 wt% and 2-5 wt%, respec-
tively. These values decrease with temperature increase due to volatilization,
resulting in an decreasing H/C ratio, that indicate a better carbon stability. N
content is roughly costant around 1.5 wt%, doubling the concentration in the
feedstock. Values for each biochar are collected in Table 7.1.

4.3 Biochar Properties 49
Table 4.1: Biochar yields (dry basis) decrease in relation to temperature.
Sample BC400 BC500 BC600 BC700
Yield (%) 38.6 32.5 30.2 30.0
FS 400 500 600 7000
50
100
CarbonHydrogenNitrogenOxygen
Figure 4.3: Elemental analysis (wt%) of feedstocks and biochars. FS: feedstock. Valuesare collected in Appendix (Table 7.1).
4.3.2 ICP Results
ICP results show that mineral concentration in biochars is higher than in feed-
stock because minerals are not apt to volatilization.
The feedstock used was rich in Calcium (0.82 wt%), higher than feedstocks
used in other studies [Sun et al., 2014] and this is reflected in the Calcium content
of the biochar (up to 2.60 wt%). Table 4.2 summarizes the main elements present.

50 Phosphate Sorption
Table 4.2: IPC-AES analysis wt%
Zn Ca Mg Na K P S
Feedstock 0.01 0.82 0.14 0.08 0.35 0.11 0.07
BC400 0.01 1.99 0.31 0.29 0.96 0.24 0.09
BC500 0.02 2.40 0.40 0.21 1.15 0.43 0.15
BC600 0.02 2.60 0.46 0.19 1.14 0.36 0.11
BC700 0.01 2.60 0.45 0.17 1.12 0.37 0.11
aCo, Mo, Cd, Pb, As and Se all below detection limits that
are respectively 1, 1, 0.3, 3 4 and 8 mg/kgb Fe, Mn, Cu, Ni and Al all below 0.01%
4.3.3 Zeta Potential
Zeta Potentials are all negative and increase as the production temperature in-
creases (Figure 4.4). Given phosphate ion’s negative charge, a negative charge
on the biochar is likely to hinder adsorption. Zeta Potential increases in relation
to temperature (p = 0.028), due to the remotion of carboxyl groups, as shown
by Chen et al (2008).
400 500 600 700
−32
−30
−28
−26
−32.7−31.3 −31.0
−29.4
Figure 4.4: Zeta Potential (mV). It increases with temperature thanks to the remotionof carboxyl groups.
4.3 Biochar Properties 51
4.3.4 pH Values
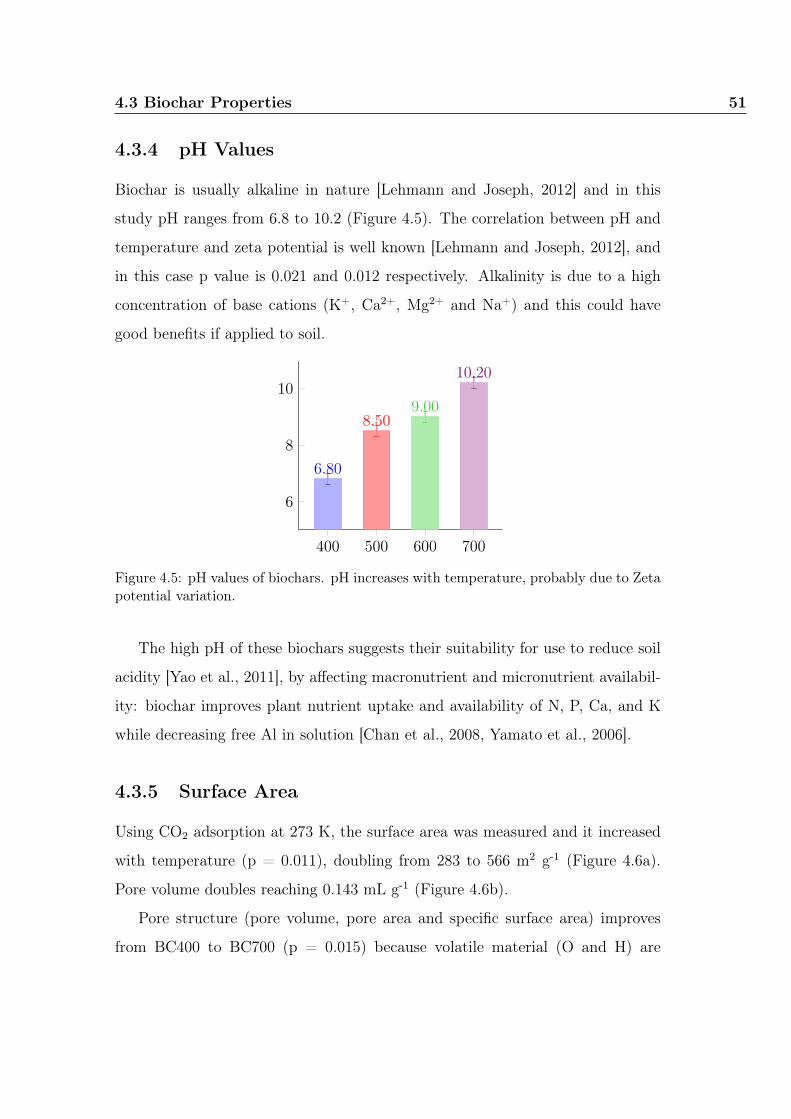
Biochar is usually alkaline in nature [Lehmann and Joseph, 2012] and in this
study pH ranges from 6.8 to 10.2 (Figure 4.5). The correlation between pH and
temperature and zeta potential is well known [Lehmann and Joseph, 2012], and
in this case p value is 0.021 and 0.012 respectively. Alkalinity is due to a high
concentration of base cations (K+, Ca2+, Mg2+ and Na+) and this could have
good benefits if applied to soil.
400 500 600 700
6
8
10
6.80
8.509.00
10.20
Figure 4.5: pH values of biochars. pH increases with temperature, probably due to Zetapotential variation.
The high pH of these biochars suggests their suitability for use to reduce soil
acidity [Yao et al., 2011], by affecting macronutrient and micronutrient availabil-
ity: biochar improves plant nutrient uptake and availability of N, P, Ca, and K
while decreasing free Al in solution [Chan et al., 2008, Yamato et al., 2006].
4.3.5 Surface Area
Using CO2 adsorption at 273 K, the surface area was measured and it increased
with temperature (p = 0.011), doubling from 283 to 566 m2 g-1 (Figure 4.6a).
Pore volume doubles reaching 0.143 mL g-1 (Figure 4.6b).
Pore structure (pore volume, pore area and specific surface area) improves
from BC400 to BC700 (p = 0.015) because volatile material (O and H) are

52 Phosphate Sorption
removed at high temperatures [Ahmad et al., 2012]. These structural analysis
results could account for the higher uptake of phosphate due to a high surface
area and well-developed mesoporous pores.
400 500 600 7000
200
400
600
283
413
495566
(a) CO2 surface area (m2 g-1)
400 500 600 7000
5 · 10−2
0.1
0.15
0.080
0.1110.126
0.143
(b) CO2 pore volume (mL g-1)
Figure 4.6: Surface measurements
Attempting to measure the surface area with N2 at 77 K resulted in diffusion
difficulties preventing equilibrium and an accurate isotherm. This indicated that
the pore size of the biochar is too small for nitrogen (and potentially phosphate
ions) to access the internal surface area as most of the pores for all the chars
produced are smaller than 0.6 nm (Figure 4.7).

4.4 Removal Rate 53
0.4 0.6 0.8 1 1.2 1.4
0
0.1
0.2
0.3
0.4
0.5
0.6
0.7
Pore Diameter (nm)
Cumulative(mL/nm/g)
BC400BC500BC600BC700
Figure 4.7: Pore Diameter distribution
4.4 Removal Rate
All the biochars produced reveal an high phosphate removal rate, ranging between
75.9% and 99.8% when applied to the solution at 123 mgPO4/L. Removal rates
decrease slowly and it is still higher than 10% at 1’230 mgPO4/L (Figure 4.8).
The removal rate of the BC700 remains highest up over the range of typical
discharge limits, removing 99.87% of P from a 490 mg/L solution compared to
the other biochars removal rates between 97.0-98.4%.

54 Phosphate Sorption
0 200 400 600 800 1,000 1,200 1,400 1,6000
0.2
0.4
0.6
0.8
1
Solution Concentration (mg/L)
Sorbed(%
)BC400BC500BC600BC700
Figure 4.8: Removal rate at different concentrations increases with temperature. Dataare collected in Appendix (Table 7.4).
Comparing these results with some similar studies found in literature is evi-
dent that grapevine cane biochar is one of the best non-engineered biochars for
phosphate removal (Figure 4.9).
PSBMRB
BC700BC600BC500BC400BG450BB450TC600PC700SBT
61.3% [Jung et al., 2015]−170% [Jung et al., 2015]
99.8% [This work]90.3% [This work]89.1% [This work]
75.9% [This work]3% [Yao et al., 2012]−5% [Yao et al., 2012]
38.1% [Zeng et al., 2013]1.8% [Zeng et al., 2013]
66.7% [Zhang et al., 2012]
61.3% [Jung et al., 2015]−170% [Jung et al., 2015]
3% [Yao et al., 2012]−5% [Yao et al., 2012]
38.1% [Zeng et al., 2013]1.8% [Zeng et al., 2013]
66.7% [Zhang et al., 2012]
99.8% [This work]90.3% [This work]89.1% [This work]
75.9% [This work]
Figure 4.9: Removal rates obtained in this work compared to the best and the worstremoval rate of other similar papers. Labels reported are the ones used by their au-thors to indicate the type of feedstock referenced. SBT: sugar beet tailings; PC700:Phragmites sp. 700oC; TC600: T. dealbata 600oC; BB450: bamboo 450oC; BG450:sugarcane bagasse 450oC; MRB: maize residue; PSB: peanut shell.

4.5 Adsorption Isotherms 55
4.5 Adsorption Isotherms
All the biochars prepared have phosphate adsorption capacity greater than 27
mg g-1, suggesting potential as a phosphate adsorbent (Figure 4.10). The most
notable difference between each biochar produced at different temperatures was
not the maximum adsorption capacity, which appears to be only weakly related
to temperature, but rather the increasing steepness of the slope, which increases
as temperature increases (Figure 4.11).
0 50 100 150 200 250 300 350 400
0
5
10
15
20
25
30
Equilibrium (mg/L)
Sorbed(mg/g)
BC400BC500BC600BC700
Figure 4.10: Phosphate adsorption data for biochar produced at diffferent temperatures.
The amount of P sorbed is calculated by the difference between the initial and
final concentration of P dissolved in the solution. Three commonly used isotherm
equations were used to simulate the experimental isotherms.
56 Phosphate Sorption
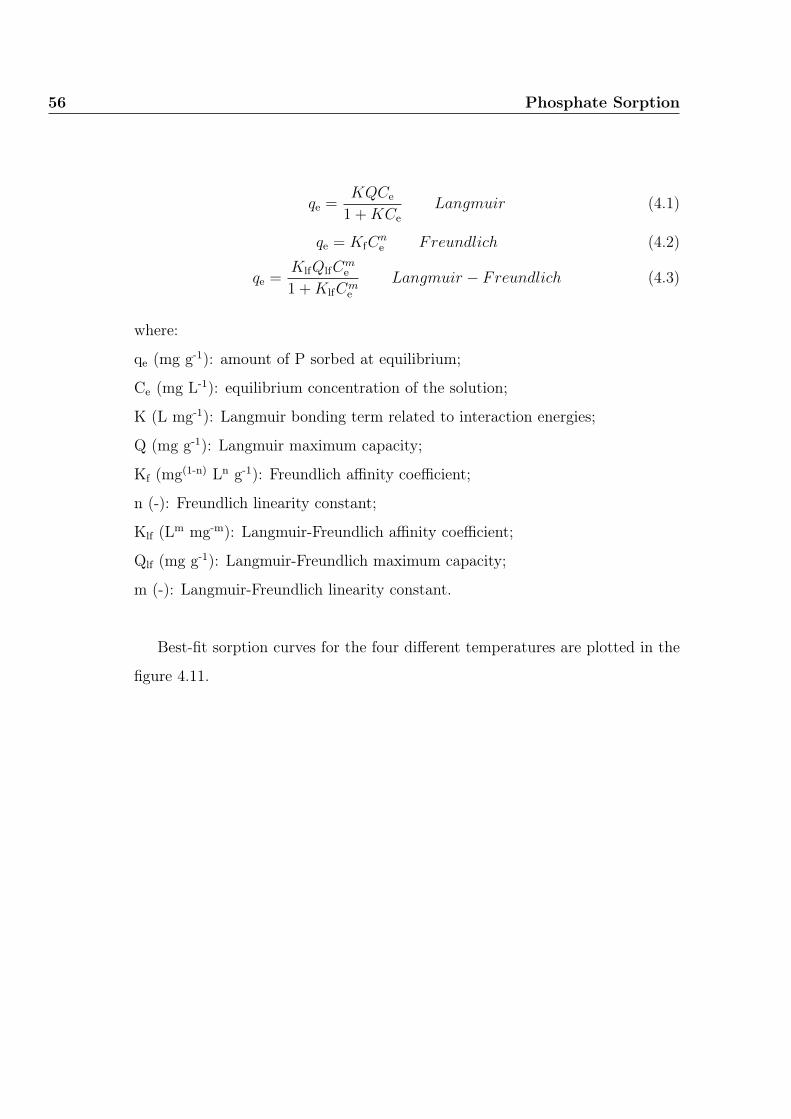
qe =KQCe
1 +KCe
Langmuir (4.1)
qe = KfCne Freundlich (4.2)
qe =KlfQlfC
me
1 +KlfCme
Langmuir − Freundlich (4.3)
where:
qe (mg g-1): amount of P sorbed at equilibrium;
Ce (mg L-1): equilibrium concentration of the solution;
K (L mg-1): Langmuir bonding term related to interaction energies;
Q (mg g-1): Langmuir maximum capacity;
Kf (mg(1-n) Ln g-1): Freundlich affinity coefficient;
n (-): Freundlich linearity constant;
Klf (Lm mg-m): Langmuir-Freundlich affinity coefficient;
Qlf (mg g-1): Langmuir-Freundlich maximum capacity;
m (-): Langmuir-Freundlich linearity constant.
Best-fit sorption curves for the four different temperatures are plotted in the
figure 4.11.

4.5 Adsorption Isotherms 57
0 50 100 150 200 250
0
10
20
30
BC400
Equilibrium (mg/L)
Sorbed(mg/g)
0 100 200 300
0
10
20
30
BC500
Equilibrium (mg/L)
Sorbed(mg/g)
0 100 200 300
0
10
20
30
BC600
Equilibrium (mg/L)
Sorbed(mg/g)
0 100 200 300 400
0
10
20
30
BC700
Equilibrium (mg/L)
Sorbed(mg/g)
Data set Langmuir Freundlich Langmuir-Freundlich
Figure 4.11: Phosphate adsorption isotherm data (dots) and models (lines) for biocharproduced at diffferent temperatures.
Best-fit parameters for each model are listed in Table 4.3 and discussed later,
with no model correlation less than an R2 of 0.917. Unsurprisingly, the three pa-
rameter Langmuir-Freundlich model consistently fitted each isotherm best, with
regression coefficient (R2) values ranging from 0.972 to 0.997.

58 Phosphate Sorption
Table 4.3: Best-fit parameter values for models of phosphate adsorption
Sample Parameter 1 Parameter 2 Parameter 3 R2
Langmuir
400oC K=0.046 Q=32.9 - 0.952
500oC K=0.103 Q=26.3 - 0.969
600oC K=0.115 Q=24.6 - 0.969
700oC K=1.690 Q=24.2 - 0.917
Freunlich
400oC Kf=5.78 n=0.321 - 0.932
500oC Kf=6.33 n=0.281 - 0.987
600oC Kf=6.30 n=0.261 - 0.997
700oC Kf=12.04 n=0.154 - 0.950
Langmuir-Freunlich
400oC Klf=0.084 Qlf=40.7 m=0.675 0.972
500oC Klf=0.072 Qlf=86.9 m=0.354 0.988
600oC Klf=0.021 Qlf=297 m=0.277 0.997
700oC Klf=0.673 Qlf=31.5 m=0.388 0.976
While the difference in maximum adsorption capacity is negligible between
each biochar, it can be visible at low concentration. Figure 4.12 show Langmuir-
Freundlich curves in the range 0-5 mg/L, encompassing typical discharge limits.
In this range BC700 has the highest adsorption capacity that is the double of
the other biochars. It is evident by comparing the Freundlich parameter Kf
that is the double (Table 4.3). Using the Freundlich-Langmuir model at 1 mg/L
equilibrium concentration, the resulting adsorption capacity is 12.7 mg/g using
BC700, 6.2 mg/g using BC600 and a mere 3.2 mg/g with BC400.

4.5 Adsorption Isotherms 59
0 1 2 3 4 5
0
5
10
15
20
Equilibrium (mg/L)
Sorbed(mg/g)
BC400BC500BC600BC700
Figure 4.12: Langmuir-Freundlich curves over a equilibrium range of 0-5 mg/L.
4.5.1 Langmuir Model
The Langmuir equation assumes monolayer adsorption with a finite number of
identical and equivalent adsorption sites with no steric hindrance or lateral inter-
action [Foo and Hameed, 2010], while the other models, empirical or semiempiri-
cal equations as well, are often used to describe heterogeneous sorption processes
[Yao et al., 2013a].
60 Phosphate Sorption
400 500 600 7000
1
2
0.05 0.10 0.12
1.69
(a) Parameter K (L mg-1)
400 500 600 7000
10
20
30
32.90
26.33 24.60 24.24
(b) Parameter Q (mg g-1)
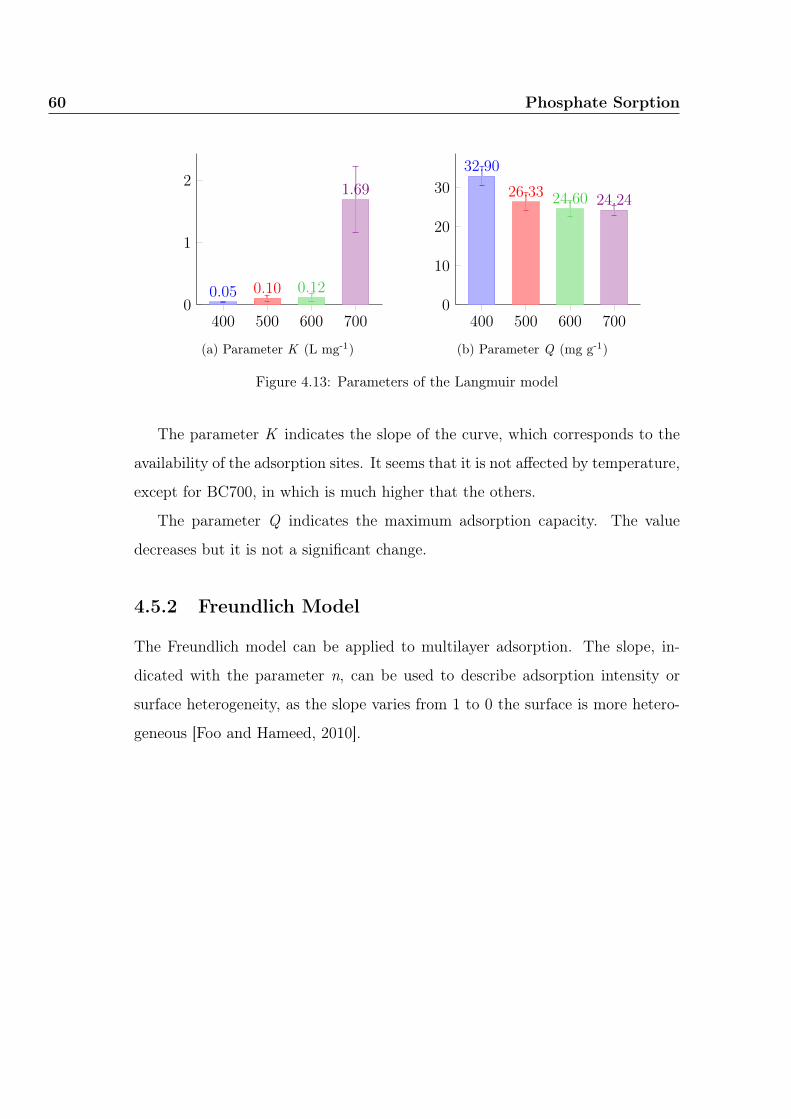
Figure 4.13: Parameters of the Langmuir model
The parameter K indicates the slope of the curve, which corresponds to the
availability of the adsorption sites. It seems that it is not affected by temperature,
except for BC700, in which is much higher that the others.
The parameter Q indicates the maximum adsorption capacity. The value
decreases but it is not a significant change.
4.5.2 Freundlich Model
The Freundlich model can be applied to multilayer adsorption. The slope, in-
dicated with the parameter n, can be used to describe adsorption intensity or
surface heterogeneity, as the slope varies from 1 to 0 the surface is more hetero-
geneous [Foo and Hameed, 2010].

4.5 Adsorption Isotherms 61
400 500 600 7000
5
10
5.78 6.33 6.30
12.04
(a) Parameter Kf (mg(1-n) Ln g-1)
400 500 600 7000
0.1
0.2
0.30.32
0.28 0.26
0.15
(b) Parameter n (-)
Figure 4.14: Parameters of the Freundlich model
The parameter Kf represents the affinity of the surface. It doubles in BC700,
indicating a higher affinity to surface, probably due to the higher zeta potential
that reduces sorption inhibition.
The parameter n is well lower than 1, so the distribution is heterogeneous
and the phosphate removal is a chemical process, as it might be supposed. The
parameter decreases with the temperature, halving from BC400 to BC700.
4.5.3 Langmuir-Freundlich Model
The three parameter Langmuir-Freundlich model is based on both the two-
parameter models and often it results in a better fit [Yao et al., 2013a]. As
in the Freundlich model, it is used to describe chemisorptions onto heterogeneous
surface [Yao et al., 2011].

62 Phosphate Sorption
400 500 600 7000
0.2
0.4
0.6
0.8
0.08 0.070.02
0.67
(a) Parameter Klf (Lm mg-m)
400 500 600 7000
200
400
600
40.7186.96
297.53
31.49
(b) Parameter Qlf (mg g-1)
400 500 600 7000
0.2
0.4
0.6
0.80.68
0.350.28
0.39
(c) Parameter m (-)
Figure 4.15: Parameters of the Langmuir-Freundlich model

4.5 Adsorption Isotherms 63
4.5.4 Statistics
0.860
0.880
0.900
0.920
0.940
0.960
0.980
1.000
Langmuir Freundlich Langmuir-
Freundlich
BC400 0.952 0.932 0.972
BC500 0.969 0.987 0.988
BC600 0.969 0.997 0.997
BC700 0.917 0.950 0.976
Figure 4.16: Regression coefficients (R2) for different models. LF model fits more thanothers, and for all of them the fitting is lower for BC400 and BC700.
After comparing regression coefficients, it is clear that Langmuir-Freundlich model
fits the best, suggesting that the interaction between phosphate and the biochar
could be affected by both the Langmuir and the Freundlich processes, as hypoth-
esized by Yao et al (2013). Fittings of the Freundlich and Langmuir–Freundlich
matched the experimental data better than those of the Langmuir model, sug-
gesting the adsorption of phosphate is probably more controlled by heterogeneous
processes.
64 Phosphate Sorption
4.6 Possible Sorption Mechanism
Surface characterization (Figure 4.6a) showed that biochars had a relatively high
surface area measured with CO2 ranging from 283 to 566 m2 g−1, which is gen-
erally desirable for phosphate adsorption.
The increasing surface area appears to have no significant effect on adsorption
capacity. This is likely due to the size of the pores, with the most of pores for all
the chars smaller than 0.6 nm in diameter, blocking phosphate ions from accessing
the internal surface area.
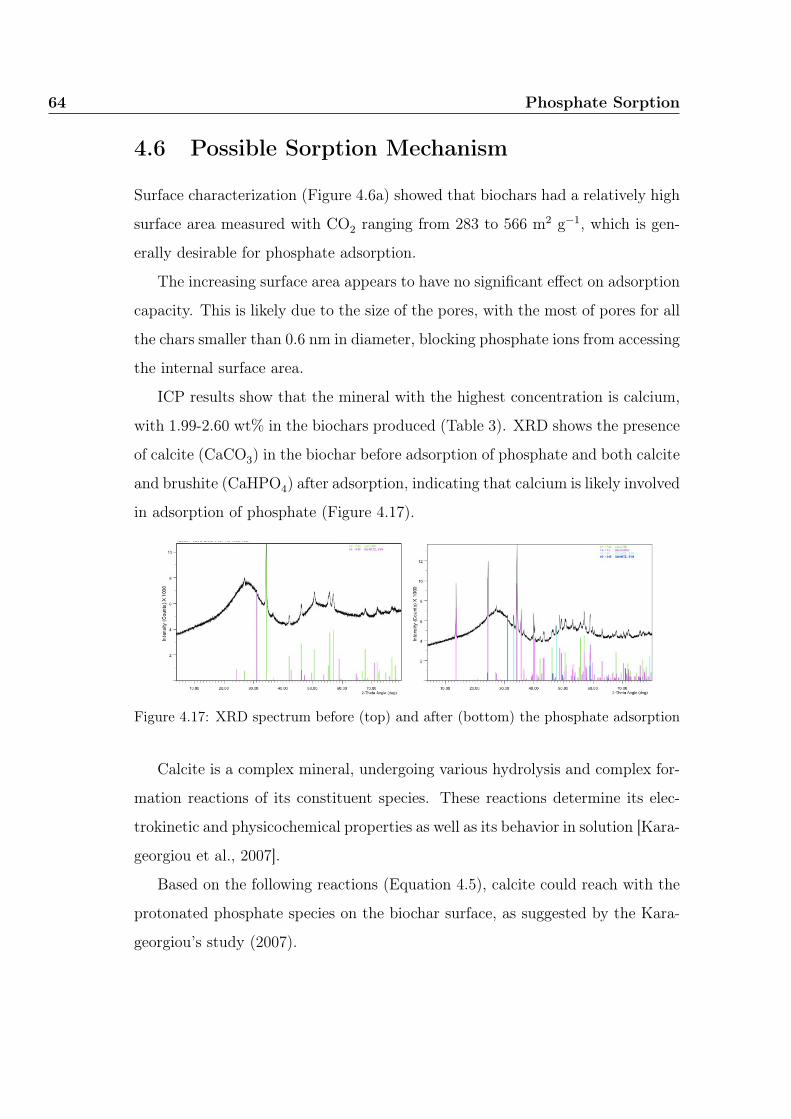
ICP results show that the mineral with the highest concentration is calcium,
with 1.99-2.60 wt% in the biochars produced (Table 3). XRD shows the presence
of calcite (CaCO3) in the biochar before adsorption of phosphate and both calcite
and brushite (CaHPO4) after adsorption, indicating that calcium is likely involved
in adsorption of phosphate (Figure 4.17).
Figure 4.17: XRD spectrum before (top) and after (bottom) the phosphate adsorption
Calcite is a complex mineral, undergoing various hydrolysis and complex for-
mation reactions of its constituent species. These reactions determine its elec-
trokinetic and physicochemical properties as well as its behavior in solution [Kara-
georgiou et al., 2007].
Based on the following reactions (Equation 4.5), calcite could reach with the
protonated phosphate species on the biochar surface, as suggested by the Kara-
georgiou’s study (2007).

4.6 Possible Sorption Mechanism 65
CaCO3 −−→ Ca2+ + CO32− pK = 3.25 (4.4)
Ca2+ +HPO42− −−→ CaHPO4 pK = −7.0 (4.5)
At a pH of 10 almost all phosphate are present as HPO42–. As the pH becomes
more acid, is present a second species of phosphate H2PO4–. If the adsorption
occurs according to equation 4.5, the pH increase would increase the concentration
of HPO42– available to be adsorbed into calcite and increase adsorption intensity
(Figure 4.18).
Figure 4.18: Distribution diagram for phosphate present as different protonated speciesas a function of pH [Karageorgiou et al., 2007].
SEM images of pre-sorption biochar also show calcite followed by both calcite
and a calcium phosphate compound on the post-sorption biochar (Figure 4.19).
These clearly show that phosphate species have been adsorbed on the calcite
surface. This proves that the supposed mechanism could have a relevant role
in phosphate sorption into grapevine cane biochar, but it remains unknown the
relation with other possible mechanisms.

66 Phosphate Sorption
Figure 4.19: SEM before (top) and after (bottom) the phosphate adsorption. Calciteparticles as revealed by EDAX are clearly plentiful in the char prior to adsorption ofphosphate. Following adsorption of phosphate, however, EDAX indicates the presenceof brushite in addition to calcite, additional confirmation that calcium on the biocharsurface reacts with the phosphate ion to adsorb P.
Furthermore, pH may be used as a driver for the release of phosphate. When
this biochar is applied to acidic or neutral soils, pH drops and phosphate are
released, working as fertilizer and soil conditioner [Karageorgiou et al., 2007].
4.6.1 Comparison with Other Studies
With a phosphate sorption higher than 24 mg g-1, biochars used in this work reveal
to be very efficient comparing with other no-engineered biochars. In figure 4.20
Langmuir maximum capacity of the biochar produced in this work is compared
with the same parameter calculated by other authors. In comparison with other
no-engineered biochars, biochar produced from grapevine cane ranks among the
most efficient.
Phosphate sorption can also be highly improved by engineering the feedstock
(e.g. carbon activation, Mg- or Ca-enrichment) as Yao et al (2013) did with
tomato leaves.

4.7 Conclusion 67
MT600BC400BC500BC600BC700TC700
PSBSC600PC700VC700
116.6 mg/g [Yao et al., 2013a]32.9 mg/g [This work]
26.3 mg/g [This work]24.6 mg/g [This work]24.2 mg/g [This work]
17.6 mg/g [Zeng et al., 2013]6.79 mg/g [Jung et al., 2015]7.43 mg/g [Zeng et al., 2013]5.43 mg/g [Zeng et al., 2013]4.36 mg/g [Zeng et al., 2013]
116.6 mg/g [Yao et al., 2013a]
17.6 mg/g [Zeng et al., 2013]6.79 mg/g [Jung et al., 2015]7.43 mg/g [Zeng et al., 2013]5.43 mg/g [Zeng et al., 2013]4.36 mg/g [Zeng et al., 2013]
32.9 mg/g [This work]26.3 mg/g [This work]24.6 mg/g [This work]24.2 mg/g [This work]
Figure 4.20: Langmuir maximum capacity Q (mg g-1) of the biochar produced in thiswork compared with the same parameter calculated by other authors. The methodthey used is very similar, so the comparison is consistent. MT600 is the only engineeredbiochar reported. Labels reported are the ones used by their authors to indicate the typeof feedstock referenced. MT600: Mg-enriched tomato leaves 600oC; TC700: T. dealbata700oC; PSB: peanut shell; SC600: S. rosthornii Seemen 600oC; PC700: Phragmites sp.700oC; VC700: V. zizanioidees 700oC.
4.7 Conclusion
The hypothesis that unmodified waste feedstock naturally high in calcium could
have good results for phosphate adsorption, is verified.
Biochar from grapevine cane is an effective low-cost absorbent of phosphate
with a maximum adsorption capacity of 32.9 mg g-1, an order of magnitude
higher than unmodified biochars. Increasing the pyrolysis temperature increased
the adsorption effectiveness at lower concentrations, with an adsorption capacity
of 12.7 mg g-1 using biochar pyrolysised at BC700 at an equilibrium concentration
of 1 mg g-1 compared to just 3.2 mg g-1 with BC400.
Given the low-cost of unmodified biochar compared to other adsorbents such
as activated carbon, biochar produced from grapevine cane has a potential as an
adsorbent for phosphate. The mechanism previously described can be exploited
for a virtuous production cycle. Biochar is used to treat wastewater by reducing
phosphate and the resultant P-enriched biochar is incorporated into agricultural

68 Phosphate Sorption
tile drainage systems as fertilizer.
This cycle could be applied to avoid problems, such as eutrophication, its
concomitant effects on living organisms and environment and the needed of a
green fertilizer.
Other studies are required to verify the technical and economic feasibility, as
well as the possible presence of pollutants that may jeopardize the applicability
to soils.
Chapter 5
Water retention
5.1 Introduction
Water has always been the main factor limiting crop production in much of the
world where rainfall is insufficient to meet crop demand [FAO, 2012].
Although only the 20% of the world’s cropland is irrigated, agriculture uses
approximately 70% of globally available fresh water [Brown, 2012, p. 22]. The
need to increase crop production, due to the growing food demand, will require
higher irrigation water withdrawal up to 14% [Bruinsma, 2003, p. 15]. The
effort is hard to bear and increase the irrigation water use efficiency is crucial
(only around 56% of the irrigated water is used by the crops, the rest is lost
by evaporation and percolation) [FAO, 2015a]. These considerations, plus the
threat of climate changes, are challenging agriculture and water availability, new
strategies must be applied.
In literature is widely demonstrated the potential of biochar to hold high
amount of water [Karhu et al., 2011, Basso et al., 2013, Dugan et al., 2010],
that is in some cases higher than perlite, up to 1.3 - 1.6 times according to
Zwart [Kor Zwart, 2014]. Pietikäinen et al (2000) reported that two biochars,
one prepared from humus and one from wood, had a WHC of 2.9 mL g-1, while

70 Water retention
pomice’s WHC is 1.0 mL g-1 [Pietikäinen et al., 2000].
Biochar is also proved to have low bulk density comparing to soil, indicating
high porosity and aeration [Oguntunde et al., 2008, Laird et al., 2010]. This may
have a positive effect on root and microbial respiration if applied to soil, with
a better soil-plant-atmosphere system. Pastor-Villegas et al (2006) found that
the bulk densities of biochars made from different types of woods processed in
different types of kilns ranged from 0.30 g cm-3 to 0.43 g cm-3 [Pastor-Villegas
et al., 2006].
Biochar produced from grapevine canes is expected to have low bulk density
and high WHC. If this is verified, it could be applied into soil to retain water
from rainfall into cropland, which should increase crop production in non-irrigated
dryland regions [Jeffery et al., 2011], and reduce the amount of irrigation water
needed to grow crops in irrigated regions. In this case, new studies are required
to quantify these benefits.
5.2 Material and Method
5.2.1 Biochar Preparation
The feedstock used was grapevine stalks and pruning from Padthaway Region in
South Australia, characterized by a Mediterranean climate.
Biochar was prepared by oven drying grapevine canes at 100oC for 16 hours
prior to pyrolysis. The dried feedstock is heated at 10oC/min in an Argon envi-
ronment during pyrolysis in a three-zone tubular furnace (Lindberg Blue) to the
goal temperature, then held for 60 min. The resulting biochar was then crushed
to 90-500 micron and stored in sealed containers prior to use. Feedstock is py-
rolized at 400, 500, 600 and 700oC. Each kind of biochar is label as reported in
Table 5.1.

5.2 Material and Method 71
Table 5.1: Sample names
Type Feestock 400oC 500oC 600oC 700oC
Pruning F-Pa-Pr 4-Pa-Pr 5-Pa-Pr 6-Pa-Pr 7-Pa-Pr
Stalks F-Pa-S 4-Pa-S 5-Pa-S 6-Pa-S 7-Pa-S
5.2.2 Characterization
To determine the composition of the feedstock and resulting biochars the Car-
bon (C), Hydrogen (H) and Nitrogen (N) contents of the samples were analysed
in a CHN Elemental Analyzer (Perkin Elmer, 2400 Series II). Oxygen (O) was
calculated by difference. Trace elements, including Zinc (Zn), Calcium (Ca),
Magnesium (Mg), sodium (Na), Potassium (K), Phosphorus (P) and Sulfur (S)
were analysed by the Inductively Coupled Plasma Array Optical Emission Spec-
troscopy (Spectro, CIROS CDD Radial ICP-OES) with nitric/perchloric acid
digestion according to the method of Wheal et al (2011).
A Scanning Electron Microscope (Philips, XL-30) was used to determine the
morphology and surface compositions of the biochars. Compositional analysis of
the surface was conducted concurrently by Energy Dispersive X-ray spectroscopy
(EDX).
Zeta potential was determined by a Zetasizer (Malvern Instruments, Nano ZS)
with deionized water as the carrier fluid. An average of 20 runs were undertaken
for each sample. Sample material used in calculations was carbon (lamp black,
graphite) with refractive index of 2.420 and absorption of 0.9000.
5.2.3 Bulk Density
Bulk density is the ratio of oven-dry mass (at 105oC) to bulk volume [McKenzie
et al., 2002, 38]. This property is dependant on the material and on how it
is handled. Bulk density, as well as porosity, gives a good indication of the

72 Water retention
suitability for root growth and soil permeability which are important for the soil-
plant-atmosphere system [McKenzie et al., 2002, pp. 224-239]. Decreasing soil
bulk density increases soil porosity and soil aeration, and may have a positive
effect on root and microbial respiration.
In the case of biochar, the density depends upon the nature of the starting
material and the pyrolysis process [Pandolfo et al., 1994].
Bulk density is calculated by weighting biochar content in a 24.63 mL plastic
tube. Biochar was sifted at 90-500 µm and wasn’t compressed or solicited. The
exact volume of the plastic tube is measured weighing the water needed to fill it up
(ρw=1.00 g/mL) using equation 5.2. Bulk density of biochars, ρb, was calculated
by divinding the mass of biochar by the plastic tube volume, according following
equations.
V =Mw/ρw ρw = 1.00 g/mL (5.1)
ρb =Mb/V (5.2)
In the 6-C-Pr test, a 6.94 mL plastic tube was used, and the same method
was applied. All measured were triplicated and the average experimental data is
reported and used for the analysis.
5.2.4 WHC measurements
Water retention is measured as the amount of water held at a certain pressure
applied to the material. The pressure is expressed as head of water (m) and the
water retention as volumetric content (v/v). Based on other studies [Grant et al.,
2010], it can be expected that at 0 m and 150 m of pressure, saturation and the
permanent wilting point are reached respectively. In this range, water retention
was measured under 0, 1, 3, 10, 50 and 150 meters of water of pressure. Each
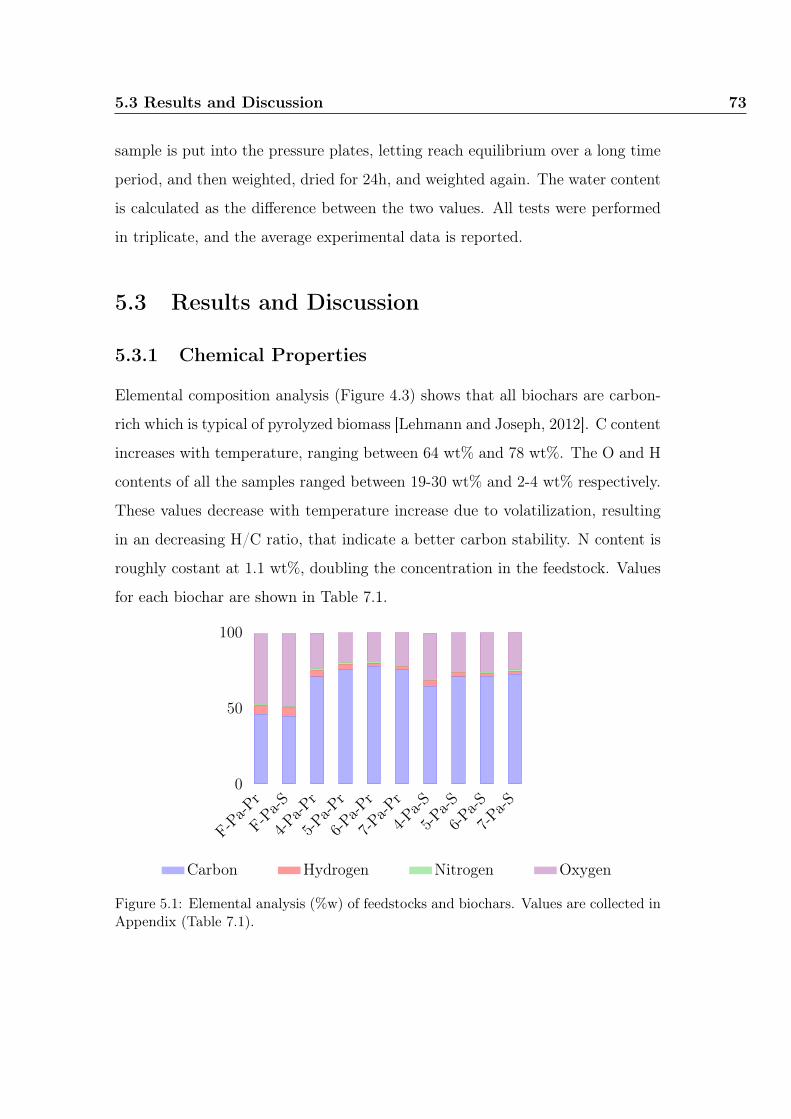
5.3 Results and Discussion 73
sample is put into the pressure plates, letting reach equilibrium over a long time
period, and then weighted, dried for 24h, and weighted again. The water content
is calculated as the difference between the two values. All tests were performed
in triplicate, and the average experimental data is reported.
5.3 Results and Discussion
5.3.1 Chemical Properties
Elemental composition analysis (Figure 4.3) shows that all biochars are carbon-
rich which is typical of pyrolyzed biomass [Lehmann and Joseph, 2012]. C content
increases with temperature, ranging between 64 wt% and 78 wt%. The O and H
contents of all the samples ranged between 19-30 wt% and 2-4 wt% respectively.
These values decrease with temperature increase due to volatilization, resulting
in an decreasing H/C ratio, that indicate a better carbon stability. N content is
roughly costant at 1.1 wt%, doubling the concentration in the feedstock. Values
for each biochar are shown in Table 7.1.
F-Pa-Pr
F-Pa-S
4-Pa-P
r
5-Pa-P
r
6-Pa-P
r
7-Pa-P
r
4-Pa-S
5-Pa-S
6-Pa-S
7-Pa-S
0
50
100
Carbon Hydrogen Nitrogen Oxygen
Figure 5.1: Elemental analysis (%w) of feedstocks and biochars. Values are collected inAppendix (Table 7.1).

74 Water retention
5.3.2 Physical properties
Bulk density lies within the range of 0.18–0.36 g cm-3 collected in two clouds de-
pending on the feedstock (Figure 5.2). Biochar from stalks and pruning have bulk
density of 0.332±0.024 g cm-3 and 0.201±0.015 g cm-3 respectively. Temperature
affects bulk density slightly, without a strong trende (p > 0.2).
4-Pa-P
r
5-Pa-P
r
6-Pa-P
r
7-Pa-P
r
4-Pa-S
5-Pa-S
6-Pa-S
7-Pa-S
0
5 · 10−2
0.1
0.15
0.2
0.25
0.3
0.35
BulkDensity
(g/cm
3)
Figure 5.2: Bulk densities are significantly different between pruning and stalks, butthey are not affeted by temperature (p > 0.3). Values are collected in Appendix (Table??).
Comparing to literature [Rodríguez-Reinoso, 1997, Pastor-Villegas et al., 2006],
these values are lower than most of other biochars, indicating high porosity and
a good WHC. If this is the case, it could be used as soil texture improver, but
more studies are required to quantify the benefits.
5.3.3 Contact Angle
The study of contact angle was conducted to determine the wettability of samples.
Contact angle is the average angle measured between a liquid interface (water)

5.3 Results and Discussion 75
and a solid surface (biochar). Hydrophobic samples will not be considered for
the WHC study because they aren’t able to hold water.
Figure 5.3: Water drops on the 4-Pa-Pr sample reveal its possible hydrophobicity.
Biochar was produced in a powdered form, so it must be compressed to obtain
a solid surface for the test. Samples are compressed in tablets with a pressure
of 15,000 kPa (1,530 ton m-2). Tests are performed with an optical tensiometer
with water drops of 3 µL and recorded every 83.2 ms for 10 sec in total.
Figure 5.4: Optical pictures of drops on 4-Pa-Pr and 4-Pa-S show high contact anglessuggesting hydrophobicity of the samples.
On all the samples, drops are absorbed in less than 0.25 sec, too quickly
to measure a significant contact angle (less than 4 frames), and enough to be
considered good water adsorbents. On the other hand, there is no sorption in 4-
Pa-Pr and 4-Pa-S samples revealing a possible hydrophobicity (Figure 5.3). The
average contact angles of 4-Pa-Pr and 4-Pa-S are 94.09o and 56.59o respectively

76 Water retention
(Figure 5.4). In the first case, the value was quite constant through time, while
in the second it slightly decreased (Figure 5.5). 4-Pa-Pr and 4-Pa-S tend to
hydrophobicity, so they will not be considered for the WHC study.
0 1 2 3 4 5 6 7 8 9 10
20
40
60
80
100
Time (sec)
Contactangle
(o)
4-Pa-Pr
3 4 5 6 7 8 9 10
40
60
80
100
120
Time (sec)
Contactangle
(o)
4-Pa-S
Figure 5.5: Trend of contact angle of 4-Pa-Pr and 4-Pa-S through time.
The low wettability is due to changes in the proportions of hydrophobic and
hydrophilic functional groups [Kinney et al., 2012, Novak et al., 2012].

5.3 Results and Discussion 77
5.3.4 Water Retention Curve
The water retention curve is the relationship between the water content and the
soil water potential. It is used to predict the soil water storage, water supply to
the plants (field capacity) and soil aggregate stability. At potentials close to zero,
a soil is close to saturation, and water is held in the soil primarily by capillary
forces.
The Groenevelt-Grant model was used to explain experimental data [Grant
et al., 2010] in which water retention function is expressed in terms of the water
content as a function of the matric head, h, plotted on a linear scale (Equation
5.3).
θ(h) = θa + k1
{exp
[−(k0ha
)n]− exp
[−(k0h
)n]}(5.3)
where k0, k1, and n are freely adjustable fitting parameters. These values are
obtained from the water retention data by curve-fitting, which must pass through
an ‘anchor’ point (ha, θa). The anchor point chosen is the saturation point (0,
θs), which gives the equation 5.4.
θ(h) = θs − k1{exp
[−(k0h
)n]}(5.4)
Resulting curves are plotted in figure 5.6. It is noticeable that biochars pro-
duced from stalks can hold the double of water of the biochar produced from
pruning. Water retention also increase with temperature.

78 Water retention
0 20 40 60 80 100 120 140 1600
0.1
0.2
0.3
0.4
0.5
0.6
0.7
0.8
Pressure (m water)
Watercontent(v/v)
5-Pa-Pr6-Pa-Pr7-Pa-Pr5-Pa-S6-Pa-S7-Pa-S
Figure 5.6: Water retention curve according to the best-fit Groenevelt-Grant modelcurve. Water content is higher in stalks than in pruning, in both cases it increases withtemperature. Values are collected in Appendix (Table 7.5).
At pressure of 0 kbar, WHC ranges between 0.47 and 0.79%, reaching the
maximum in the case of 7-Pa-Pr and 7-Pa-S. There is no evident trend depending
on temperature but it can be supposed that WHC increases with temperature (p
= 0.018 for 7-Pa-Pr; p = 0.056 for 7-Pa-S) due to the higher porosity and the
lower content of hydrophobic substances.

5.3 Results and Discussion 79
Fine SandaClaybSilty loama
5-Pa-P
r
6-Pa-P
r
7-Pa-P
r
5-Pa-S
6-Pa-S
7-Pa-S
0
0.2
0.4
0.6
0.8
1
1.2
WHC
(v/v)
aMichigan State University1 b Plant & Soil Sciences eLibrary2
Figure 5.7: WHC at pressure of 0 kbar. Values are collected in Appendix (Table 7.5).The maximum WHC is reach at 700oC.
5.3.5 Comparison with soils
Comparing experimantal data with water retention curve of some soils, it can be
inferred that biochars’ water retention is comparable with the one of clay loamy
soils, so it can be useful to improve WHC of sandy soils (Figure 5.8).

80 Water retention
0 20 40 60 80 100 120 140 160
0
0.2
0.4
0.6
0.8
Soil Matric Potential (m water)
WaterContent(v/v)
5-Pa-Pr 6-Pa-Pr7-Pa-Pr 5-Pa-S6-Pa-S 7-Pa-S
Sandy loam
Clay loam
Silty clay
Figure 5.8: Biochar’s water retention compared to other soils. Biochars have a waterretention similar to loamy soils. Soil areas are drawn by using data from Grant et al.(2010).
In Figure 5.7 the WHC of biochars measured at pressure of 0 bar are shown.
In the background are plotted the WHC of some other soils.
Biochar addition to soil could significantly increase WHC. Based on an un-
amended sandy loam soil with an average WHC of 0.16% [Yu et al., 2013], the
addition of a layer of 10 cm of 7-Pa-Pr biochar (WHC = 0.75%) into a root zone
of 100 cm depth, represents an increase of 3.7% in equivalent depth of water
in the 100 cm soil depth. This 3.7% is the extra amount of water that will be
available in the root zone for crops by adding biochar, and could represent the
amount of irrigation water that a producer will save.

5.4 Conclusion 81
5.4 Conclusion
Biochars produced at 400oC are hardly wettable. Biochars produced at temper-
atures higher than 400oC have a good WHC, higher that some agricultural soils.
They could be mixed in order to reduce water demand and irrigation needed.
Further studies are needed to clarify, whether adding biochar into soil will lead
to enhanced plant available water content, and could thus be used to mitigate
fluctuating water availability.

Chapter 6
Quo Vadis
"The greatest enemy of knowledge
is not ignorance,
it is the illusion of knowledge."
Daniel J. Boorstin, 1983
6.1 Other studies needed
Although much has been discovered about biochar in the last years, the knowledge
is still poor. A lot of mechanisms are unclear and more should be investigated
before its application.
The enthusiasm of the benefits of biochar are inhibited by the need to analyze
and study in deep some critical aspects that can compromise its use, especially if
applied to crops [Quilliam et al., 2013b]. Biochar is found to have high amount
of dioxins and PAHs, dangerous for the environment and human health.
Dioxins (PCDD), Furans (PCDF) and Polycyclic Aromatic Hydrocarbons
(PAH) are Persistent Organic Pollutants (POPs), chemicals able to persist in
the environment for years because they are difficult to be degraded. They can
result from natural processes (e.g. volcanic eruptions), but also by unintentional

84 Quo Vadis
reactions of high-temperature processes (e.g. incomplete combustion, pesticide
production).
POPs generate alert because some compounds have been identified as carcino-
genic, mutagenic and teratogenic [IARC, 2015]. They are considered to be one
of the most difficult organic contaminants to treat [Zheng et al., 2007, Cerniglia,
1993, Weissenfels et al., 1992, Edwards, 1983], and for this reason current efforts
are focused on banning their use and production.
Biochar, that is produced through thermal processes, contains varying levels
of these organic pollutants [Gar, 2008, Hale et al., 2012b], often overcoming the
limits imposed by Italian law (D.Lgs. 152/06) also if mixed in low amount into
soil.
On the other hand, biochar can stimulate microbial activity in soil [Kolb
et al., 2008, Steinbeiss et al., 2009, Quilliam et al., 2013a] and its addition could
facilitate the degradation of naturally occurring PAHs [Quilliam et al., 2013b].
At the same time, the strong sorbing capacity of biochar could limit the leaching
of PAHs from soils and could prove a significant management strategy for the
reduction of PAH contamination of groundwater [Khan et al., 2013, Beesley et al.,
2010, Hale et al., 2012a]. In both cases, the effects are still unclear, and possible
mechanisms are greatly unknown.
The amount and kind of POPs into biochar varies widely, depending mainly
on process conditions but also on the feedstock. Their values are dangerously
close to the law limits and for this reason more studies are required to avoid the
contamination of soils and the risk for human health.
6.2 Socio-Economic Prospectives
Biochar is an opportunity for a new market, but it is important to evaluate the
economic feasibility and market potential. Lehmann et al (2009) developed a
cost-benefit analysis for large- and short-scale pyrolysis plants for the production

6.2 Socio-Economic Prospectives 85
of biochar as primary product.
The large-scale plant’s products are devoted to industrial use for the profit,
so the analysis is only economic. The short-scale pyrolysis is developed for
household, farm and village level, so for the sustainability of small community
which interest is not only financial but also social end environmental. The socio-
economical aspects considered are collected in table 6.1.
Table 6.1: Variants that regulate plant decision
Cost Benefit
Economic
Plant
Pyrolysis process
Feedstock supply
Biochar value
Energy produced
GHG market effect
Social
Possible land competition
Possible increase of
extraction of wood from
forest
Less air pollution
Less medical expenses
More labour available
To ensure profitability of exclusively biochar-focused enterprises, the revenues
generated from biochar sales need to support all expenses associated with oper-
ations including equipment, labor, and capital costs for feedstock procurement
and preparation; biochar production, post-processing, packaging and distribu-
tion; marketing activities; and others [Jirka and Tomlinson, 2014]. The profit
margins on exclusively biochar sales may be slim or negative, but the business
can be profitable if all products are considered (heat, syngas, energetic oil, trad-
ability of CO2 stored).

86 Quo Vadis
Figure 6.1: Companies in the biochar industry by sector in 2014 (n=200) compared to2013 (n=175). Source: IBI, 2014
For these reasons the production of biochar is a fruitful market: in 2014 there
were registered more than 200 companies (Figure 6.1) in which biochar represents
primary or secondary product, an increase of 14% from 2013 [Jirka and Tomlin-
son, 2014]. Businesses are mainly located in developed countries (Figure 6.2)
where the sell price range is wide, depending on the selling condition (wholesale
or retail, pure or blend). The average price of wholesale pure biochar was roughly
2 USD kg-1 in 2014, but the dataset is not long enough to define a trend along
the time [Jirka and Tomlinson, 2014].

6.3 Biochar in Italy 87
Figure 6.2: Geographic location of biochar businesses (n=200). Source: IBI, 2014
6.3 Biochar in Italy
In the Mediterranean area, water scarcity is the major limiting factor for agricul-
ture, that is predicted to become more vulnerabile in the near future. The larger
interannual rainfall variability and higher frequency and intensity of extreme
events, such as droughts and heat waves, will seriously threaten agroecosystems
[IPCC, 2013, p. 7]. The identification and implementation of adaptive measures
aimed at enhancing the resilience of the agroecosystems to water scarcity is a key
priority, in order to maintain both the quality and quantity of crop productions
and protect water resources.
In Italy, biochar could become a powerful tool for the adaptation to climate
change. The Italian Biochar Association (ICHAR), established in 2009, is the
main promoter of biochar research and production in Italy. Thanks to an its
instance, biochar was introduced in June 2015 in Italian law as a possible soil

88 Quo Vadis
improver1. In Italy, as in the rest of the Mediterranean area, biochar is a great
opportunity to face with some of the major problems of the next future (water
scarcity, climate change mitigation, green energy, circular economy). This new
law is expected to be the starting point for opening the market for this technology.
1Decreto 22/06/15. Aggiornamento degli allegati 2, 6 e 7 al decreto legislativo n. 75 del 29aprile 2010 «Riordino e revisione della disciplina in materia di fertilizzanti, a norma dell’articolo13 della legge 7 luglio 2009, n. 88». (GU Serie Generale n.186 del 12-8-2015)

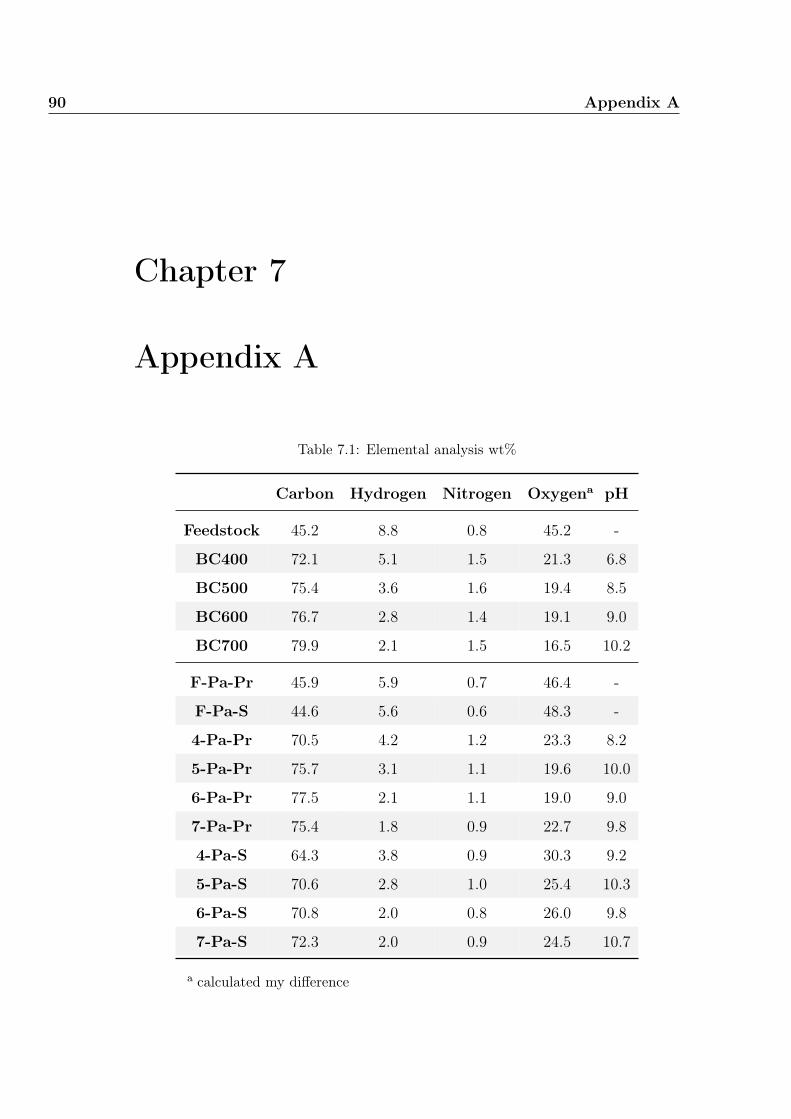
90 Appendix A
Chapter 7
Appendix A
Table 7.1: Elemental analysis wt%
Carbon Hydrogen Nitrogen Oxygena pH
Feedstock 45.2 8.8 0.8 45.2 -
BC400 72.1 5.1 1.5 21.3 6.8
BC500 75.4 3.6 1.6 19.4 8.5
BC600 76.7 2.8 1.4 19.1 9.0
BC700 79.9 2.1 1.5 16.5 10.2
F-Pa-Pr 45.9 5.9 0.7 46.4 -
F-Pa-S 44.6 5.6 0.6 48.3 -
4-Pa-Pr 70.5 4.2 1.2 23.3 8.2
5-Pa-Pr 75.7 3.1 1.1 19.6 10.0
6-Pa-Pr 77.5 2.1 1.1 19.0 9.0
7-Pa-Pr 75.4 1.8 0.9 22.7 9.8
4-Pa-S 64.3 3.8 0.9 30.3 9.2
5-Pa-S 70.6 2.8 1.0 25.4 10.3
6-Pa-S 70.8 2.0 0.8 26.0 9.8
7-Pa-S 72.3 2.0 0.9 24.5 10.7
a calculated my difference

91Table 7.2: Elemental analysis (mg kg-1)
Sample Fe Mn B Cu Mo Co Ni Zn Ca Mg Na K P S Al Ti Cr Cd Pb As Se
F-Pa-Pr 26 16 17 36 <1 <0.9 <1 40 7,600 1,690 970 8,000 940 620 20 0.84 <0.4 <0.3 <3 <4 <7
F-Pa-S 20 21 29 19 <1 <1 <1 14 5,400 1,740 9,600 19,300 540 800 6.6 0.61 <0.4 <0.3 <3 <4 <8
4-Pa-Pr 89 47 43 74 1.2 <1 3.1 89 19,800 4,400 2,600 18,900 2,800 480 50 1.8 5.3 <0.3 <3 <4 <8
5-Pa-Pr 98 38 36 77 <1 <0.9 6 121 18,300 4,300 2,100 18,300 3,200 620 31 1.3 11 <0.3 <3 <4 <8
6-Pa-Pr 177 49 45 93 1 <0.9 14 123 21,000 4,900 2,100 21,000 3,500 780 38 2.2 27 <0.2 <2 <4 <7
7-Pa-Pr 149 56 60 133 <0.9 <0.9 7 124 26,000 6,000 2,900 26,000 3,700 1,220 58 3.7 13 <0.2 4.5 <3 <7
4-Pa-S 79 46 58 50 <1 <0.9 1.7 34 12,400 3,000 14,500 42,000 1,410 710 31 1.4 2.4 <0.2 <2 <4 <7
5-Pa-S 96 57 69 65 <1 <1 2.5 47 14,700 3,800 17,200 48,000 1,670 980 50 2.5 4.1 <0.3 <3 <4 <8
6-Pa-S 81 54 72 59 <1 <0.9 7.4 42 15,100 3,800 18,200 51,000 1,670 1,060 38 3.4 1.4 <0.3 <3 <4 <7
7-Pa-S 141 68 81 65 <1 <1 2.9 46 16,600 4,600 19,500 58,000 1,880 1,330 45 3.9 4 <0.3 <3 <4 <8

92 Appendix A
Table 7.3: Bulk Density (g/cm3)
Sample Mean St dev
4-Pa-Pr 0.2 6 · 10−4
5-Pa-Pr 0.22 6 · 10−4
6-Pa-Pr 0.19 3.7 · 10−3
7-Pa-Pr 0.22 1.9 · 10−3
4-Pa-S 0.31 2.4 · 10−3
5-Pa-S 0.3 1.4 · 10−3
6-Pa-S 0.33 5.3 · 10−3
7-Pa-S 0.33 1.1 · 10−3
Table 7.4: Removal rate (%)
Concentration (mg/L) 400 500 600 700
120 75.9 89.1 90.3 99.8
245 71.7 90.3 86.6 98.6
370 65.4 70.7 82.4 96.2
490 44.3 60 50.1 95.3
735 35.1 21.8 29.5 79.3
860 29.7 24.3 16.8 44.1
980 35.6 24 15.4 32
1,230 23.1 18.6 12.4 15.4
1,470 11 9.2 7.8 6.7
Table 7.5: WHC (v/v) of biochar under different pressure.
Pressure (m water) 5-Pa-Pr 6-Pa-Pr 7-Pa-Pr 5-Pa-S 6-Pa-S 7-Pa-S
0 0.52 0.465 0.768 0.517 0.56 0.79
1 0.211 0.244 0.276 0.309 0.34 0.51
3 0.204 0.234 0.327 0.281 0.34 0.34
10 0.131 0.133 0.151 0.217 0.26 0.28
50 8.4 · 10−2 0.101 0.13 0.218 0.22 0.25
150 7.3 · 10−2 9.6 · 10−2 0.127 0.217 0.23 0.21

Bibliography
[Gar, 2008] (2008). The formation of polyaromatic hydrocarbons and dioxins dur-
ing pyrolysis: A review of the literature with descriptions of biomass composition,
fast pyrolysis technologies and thermochemical reactions. Garcia-Perez, Manuel
and Metcalf, Judy.
[Ahmad et al., 2012] Ahmad, M., Lee, S. S., Dou, X., Mohan, D., Sung, J.-K.,
Yang, J. E., and Ok, Y. S. (2012). Effects of pyrolysis temperature on soybean
stover-and peanut shell-derived biochar properties and tce adsorption in water.
Bioresource technology, 118.
[Antal and Grønli, 2003] Antal, M. J. and Grønli, M. (2003). The art, science,
and technology of charcoal production. Industrial & Engineering Chemistry
Research, 42(8):1619–1640.
[Baldock and Smernik, 2002] Baldock, J. A. and Smernik, R. J. (2002). Chemical
composition and bioavailability of thermally altered pinus resinosa (red pine)
wood. Organic Geochemistry, 33(9):1093–1109.
[Basso et al., 2013] Basso, A. S., Miguez, F. E., Laird, D. A., Horton, R., and
Westgate, M. (2013). Assessing potential of biochar for increasing water-holding
capacity of sandy soils. GCB Bioenergy, 5(2):132–143.

94 BIBLIOGRAPHY
[Beesley and Marmiroli, 2011] Beesley, L. and Marmiroli, M. (2011). The im-
mobilisation and retention of soluble arsenic, cadmium and zinc by biochar.
Environmental Pollution, 159(2):474–480.
[Beesley et al., 2010] Beesley, L., Moreno-Jiménez, E., and Gomez-Eyles, J. L.
(2010). Effects of biochar and greenwaste compost amendments on mobility,
bioavailability and toxicity of inorganic and organic contaminants in a multi-
element polluted soil. Environmental pollution, 158(6):2282–2287.
[Beesley et al., 2011] Beesley, L., Moreno-Jiménez, E., Gomez-Eyles, J. L., Har-
ris, E., Robinson, B., and Sizmur, T. (2011). A review of biochars’ potential
role in the remediation, revegetation and restoration of contaminated soils. En-
vironmental pollution, 159(12):3269–3282.
[Brown, 2012] Brown, L. (2012). World on the edge: how to prevent environmen-
tal and economic collapse. Routledge.
[Bruinsma, 2003] Bruinsma, J. (2003). World agriculture: towards 2015/2030:
an FAO perspective. Earthscan.
[Cerniglia, 1993] Cerniglia, C. E. (1993). Biodegradation of polycyclic aromatic
hydrocarbons. Microorganisms to combat pollution, pages 227–244.
[Chan et al., 2007] Chan, K., Van Zwieten, L., Meszaros, I., Downie, A., and
Joseph, S. (2007). Assessing the agronomic values of contrasting char materials
on australian hardsetting soil. In Proceedings of the Conference of the Interna-
tional Agrichar Initiative, volume 30.
[Chan et al., 2008] Chan, K., Van Zwieten, L., Meszaros, I., Downie, A., and
Joseph, S. (2008). Agronomic values of greenwaste biochar as a soil amendment.
Soil Research, 45(8):629–634.

BIBLIOGRAPHY 95
[Chen et al., 2011] Chen, B., Chen, Z., and Lv, S. (2011). A novel magnetic
biochar efficiently sorbs organic pollutants and phosphate. Bioresource technol-
ogy, 102(2):716–723.
[Cheng et al., 2008] Cheng, C.-H., Lehmann, J., and Engelhard, M. H. (2008).
Natural oxidation of black carbon in soils: Changes in molecular form and
surface charge along a climosequence. Geochimica et Cosmochimica Acta,
72(6):1598–1610.
[Cordell et al., 2009] Cordell, D., Drangert, J.-O., and White, S. (2009). The
story of phosphorus: Global food security and food for thought. Global Envi-
ronmental Change, 19(2):292–305.
[de Acuña et al., 1641] de Acuña, C., Arellano, I., Borque, J. M. D., and San-
tonja, G. (1641). Nuevo descubrimiento del Gran Rio de Las Amazonas. Madrid:
Imprenta del Reyno.
[De Oviedo et al., 1853] De Oviedo, G. F., de los Ríos, A., et al. (1853). His-
toria general y natural de las Indias: Islas y tierrafirme del mar oceano. Real
Academia de la Historia.
[Driessens and Verbeeck, 1990] Driessens, F. and Verbeeck, R. (1990). Biomin-
erals. CRC Press.
[Dugan et al., 2010] Dugan, E., Verhoef, A., Robinson, S., and Sohi, S. (2010).
Biochar from sawdust, maize stover and charcoal: Impact on water holding
capacities (whc) of three soils from ghana. In 19th World Congress of Soil
Science, Symposium, volume 4, pages 9–12.
[EcoSanRes, 2003] EcoSanRes (2003). Closing the loop on phosphorus. Stock-
holm Environment Institute (SEI).

96 BIBLIOGRAPHY
[Edixhoven et al., 2014] Edixhoven, J. D., Gupta, J., and Savenije, H. H. G.
(2014). Recent revisions of phosphate rock reserves and resources: a critique.
Earth System Dynamics, 5(2):491–507.
[Edwards, 1983] Edwards, N. T. (1983). Polycyclic aromatic hydrocarbons
(pah’s) in the terrestrial environment—a review. Journal of Environmental
Quality, 12(4):427–441.
[Elliott, 2007] Elliott, D. C. (2007). Historical developments in hydroprocessing
bio-oils. Energy & Fuels, 21(3):1792–1815.
[FAO, 2004] FAO (2004). Use of phosphate rocks for sustainable agriculture.
Food and Agriculture Organization of the United Nations (FAO).
[FAO, 2012] FAO (2012). Crop yield response to water. Food and Agriculture
Organization of the United Nations (FAO).
[FAO, 2015a] FAO (2015a). Aquastat website.
[FAO, 2015b] FAO (2015b). World fertilizer trends and outlook to 2018. Food
and Agriculture Organization of the United Nations (FAO).
[Fellet et al., 2011] Fellet, G., Marchiol, L., Delle Vedove, G., and Peressotti, A.
(2011). Application of biochar on mine tailings: effects and perspectives for land
reclamation. Chemosphere, 83(9):1262–1267.
[Fernandes and Brooks, 2003] Fernandes, M. B. and Brooks, P. (2003). Char-
acterization of carbonaceous combustion residues: Ii. nonpolar organic com-
pounds. Chemosphere, 53(5):447–458.
[Foo and Hameed, 2010] Foo, K. and Hameed, B. (2010). Insights into the model-
ing of adsorption isotherm systems. Chemical Engineering Journal, 156(1):2–10.
[Gilbert, 2009] Gilbert, N. (2009). The disappearing nutrient. Nature, (461):716–
718.

BIBLIOGRAPHY 97
[Gomez-Eyles et al., 2011] Gomez-Eyles, J. L., Sizmur, T., Collins, C. D., and
Hodson, M. E. (2011). Effects of biochar and the earthworm eisenia fetida on
the bioavailability of polycyclic aromatic hydrocarbons and potentially toxic
elements. Environmental Pollution, 159(2):616–622.
[Grant et al., 2010] Grant, C., Groenevelt, P., and Robinson, N. (2010). Applica-
tion of the groenevelt–grant soil water retention model to predict the hydraulic
conductivity. Soil Research, 48(5):447–458.
[Hale et al., 2012a] Hale, S. E., Elmquist, M., Brändli, R., Hartnik, T., Jakob,
L., Henriksen, T., Werner, D., and Cornelissen, G. (2012a). Activated car-
bon amendment to sequester pahs in contaminated soil: A lysimeter field trial.
Chemosphere, 87(2):177–184.
[Hale et al., 2012b] Hale, S. E., Lehmann, J., Rutherford, D., Zimmerman, A. R.,
Bachmann, R. T., Shitumbanuma, V., O’Toole, A., Sundqvist, K. L., Arp, H.
P. H., and Cornelissen, G. (2012b). Quantifying the total and bioavailable poly-
cyclic aromatic hydrocarbons and dioxins in biochars. Environmental science &
technology, 46(5):2830–2838.
[Harris, 1999] Harris, P. (1999). On charcoal. Interdisciplinary Science Reviews,
24(4):301–306.
[Hartley et al., 2009] Hartley, W., Dickinson, N. M., Riby, P., and Lepp, N. W.
(2009). Arsenic mobility in brownfield soils amended with green waste com-
post or biochar and planted with miscanthus. Environmental Pollution,
157(10):2654–2662.
[IARC, 2015] IARC (2015). Agents classified by the iarc monographs. Interna-
tional Agency for Research on Cancer.

98 BIBLIOGRAPHY
[International Organization of Vine and Wine, 2015] International Organization
of Vine and Wine (2015). World vitiviniculture situation. Technical report,
International Organisation of Vine and Wine.
[IPCC, 2013] IPCC (2013). Climate change 2013: The physical science basis.
contribution of working group i to the fifth assessment report of the intergov-
ernmental panel on climate change. Technical report.
[Jasinski, 2002] Jasinski, S. M. (2002). Phosphate rock.
[Jeffery et al., 2011] Jeffery, S., Verheijen, F., Van Der Velde, M., and Bastos, A.
(2011). A quantitative review of the effects of biochar application to soils on
crop productivity using meta-analysis. Agriculture, ecosystems & environment,
144(1):175–187.
[Jenkinson and Ayanaba, 1977] Jenkinson, D. and Ayanaba, A. (1977). Decom-
position of carbon-14 labeled plant material under tropical conditions. Soil
Science Society of America Journal, 41(5):912–915.
[Jiang et al., 2012] Jiang, J., Xu, R.-k., Jiang, T.-y., and Li, Z. (2012). Immobi-
lization of cu (ii), pb (ii) and cd (ii) by the addition of rice straw derived biochar
to a simulated polluted ultisol. Journal of hazardous materials, 229:145–150.
[Jirka and Tomlinson, 2014] Jirka, S. and Tomlinson, T. (2014). State of the
biochar industry 2014. Technical report, International Biochar Initiative (IBI).
[Jones et al., 2009] Jones, S. B., Valkenburg, C., Walton, C. W., Elliott, D. C.,
Holladay, J. E., Stevens, D. J., Kinchin, C., and Czernik, S. (2009). Produc-
tion of gasoline and diesel from biomass via fast pyrolysis, hydrotreating and
hydrocracking: a design case. Pacific Northwest National Laboratory Richland,
WA.
[Jung et al., 2015] Jung, K.-W., Hwang, M.-J., Ahn, K.-H., and Ok, Y.-S. (2015).
Kinetic study on phosphate removal from aqueous solution by biochar derived

BIBLIOGRAPHY 99
from peanut shell as renewable adsorptive media. International Journal of En-
vironmental Science and Technology, 12(10):3363–3372.
[Kammen and Lew, 2005] Kammen, D. M. and Lew, D. J. (2005). Review of
technologies for the production and use of charcoal. Renewable and appropriate
energy laboratory report, 1.
[Karageorgiou et al., 2007] Karageorgiou, K., Paschalis, M., and Anastassakis,
G. N. (2007). Removal of phosphate species from solution by adsorption onto
calcite used as natural adsorbent. Journal of Hazardous Materials, 139(3):447–
452.
[Karhu et al., 2011] Karhu, K., Mattila, T., Bergström, I., and Regina, K. (2011).
Biochar addition to agricultural soil increased ch4 uptake and water holding
capacity–results from a short-term pilot field study. Agriculture, Ecosystems &
Environment, 140(1):309–313.
[Khan et al., 2013] Khan, S., Wang, N., Reid, B. J., Freddo, A., and Cai, C.
(2013). Reduced bioaccumulation of pahs by lactuca satuva l. grown in con-
taminated soil amended with sewage sludge and sewage sludge derived biochar.
Environmental Pollution, 175:64–68.
[Kinney et al., 2012] Kinney, T., Masiello, C., Dugan, B., Hockaday, W., Dean,
M., Zygourakis, K., and Barnes, R. (2012). Hydrologic properties of biochars
produced at different temperatures. Biomass and Bioenergy, 41:34–43.
[Kolb et al., 2008] Kolb, S. E., Fermanich, K. J., and Dornbush, M. E. (2008).
Effect of charcoal quantity on microbial biomass and activity in temperate soils.
Soil Science Society of America Journal, 73(4):1173–1181.
[Kor Zwart, 2014] Kor Zwart, E. H. (2014). Effects of biochar on water retention
in the interreg biochar: climate saving soils field trials. Interreg IVB project
Biochar.

100 BIBLIOGRAPHY
[Krull et al., 2006] Krull, E. S., Swanston, C. W., Skjemstad, J. O., and Mc-
Gowan, J. A. (2006). Importance of charcoal in determining the age and chem-
istry of organic carbon in surface soils. Journal of Geophysical Research: Bio-
geosciences (2005–2012), 111(G4).
[Laine et al., 1991] Laine, J., Simoni, S., and Calles, R. (1991). Preparation of
activated carbon from coconut shell in a small scale cocurrent flow rotary kiln.
Chemical engineering communications, 99(1):15–23.
[Laird et al., 2011] Laird, D., Rogovska, N., Garcia-Perez, M., Collins, H.,
Streubel, J., and Smith, M. (2011). Pyrolysis and biochar: opportunities for
distributed production and soil quality enhancement. In Sustainable alternative
fuel feedstock opportunities, challenges and roadmaps for six US regions. Pro-
ceedings of the Sustainable Feedstocks for Advanced Biofuels Workshop, pages
257–281.
[Laird et al., 2010] Laird, D. A., Fleming, P., Davis, D. D., Horton, R., Wang,
B., and Karlen, D. L. (2010). Impact of biochar amendments on the quality of
a typical midwestern agricultural soil. Geoderma, 158(3):443–449.
[Lal, 2008] Lal, R. (2008). Carbon sequestration. Philosophical Transactions of
the Royal Society of London B: Biological Sciences, 363(1492):815–830.
[Lehmann and Joseph, 2012] Lehmann, J. and Joseph, S. (2012). Biochar for
environmental management: science and technology. Routledge.
[Lehmann et al., 2008] Lehmann, J., Skjemstad, J., Sohi, S., Carter, J., Barson,
M., Falloon, P., Coleman, K., Woodbury, P., and Krull, E. (2008). Australian
climate–carbon cycle feedback reduced by soil black carbon. Nature Geoscience,
1(12):832–835.

BIBLIOGRAPHY 101
[Lynch et al., 2005] Lynch, D., Voroney, R., and Warman, P. (2005). Soil phys-
ical properties and organic matter fractions under forages receiving composts,
manure or fertilizer. Compost science & utilization, 13(4):252–261.
[Mann, 2005] Mann, C. C. (2005). 1491: New revelations of the Americas before
Columbus. Alfred a Knopf Incorporated.
[McKenzie et al., 2002] McKenzie, N., Coughlan, K., and Cresswell, H. (2002).
Soil physical measurement and interpretation for land evaluation, volume 5.
CSIRO PUBLISHING.
[Metson et al., 2012] Metson, G. S., Bennett, E. M., and Elser, J. J. (2012). The
role of diet in phosphorus demand. Environmental Research Letters, 7(4).
[Nehls, 2002] Nehls, T. (2002). Fertility improvement of a terra firme oxisol in
central amazonia by charcoal applications. Final thesis in Geoecology, University
of Bayreuth, Institute of Soil Science and Soil Geography, 81.
[Neves et al., 2004] Neves, E. G., Petersen, J. B., Bartone, R. N., and Hecken-
berger, M. J. (2004). The timing of terra preta formation in the central amazon:
archaeological data from three sites. In Amazonian dark earths: Explorations in
space and time, pages 125–134. Springer.
[Novak et al., 2012] Novak, J. M., Busscher, W. J., Watts, D. W., Amonette,
J. E., Ippolito, J. A., Lima, I. M., Gaskin, J., Das, K., Steiner, C., Ahmedna,
M., et al. (2012). Biochars impact on soil-moisture storage in an ultisol and two
aridisols. Soil Science, 177(5):310–320.
[Oelkers et al., 2008] Oelkers, E. H., Valsami-Jones, E., and Roncal-Herrero, T.
(2008). Phosphate mineral reactivity: from global cycles to sustainable devel-
opment. Mineralogical Magazine, 72(1):337–340.
[Ogawa, 1994] Ogawa, M. (1994). Symbiosis of people and nature in the tropics.
Farming Japan, 28(5):10–34.

102 BIBLIOGRAPHY
[Oguntunde et al., 2008] Oguntunde, P. G., Abiodun, B. J., Ajayi, A. E., and
van de Giesen, N. (2008). Effects of charcoal production on soil physical prop-
erties in ghana. Journal of Plant Nutrition and Soil Science, 171(4):591–596.
[Orton, 1870] Orton, J. (1870). The Andes and the Amazon. Harper and brothers.
[Pandolfo et al., 1994] Pandolfo, A., Amini-Amoli, M., and Killingley, J. (1994).
Activated carbons prepared from shells of different coconut varieties. Carbon,
32(5):1015–1019.
[Pastor-Villegas et al., 2006] Pastor-Villegas, J., Valenzuela-Calahorro, C.,
Bernalte-Garcia, A., and Gomez-Serrano, V. (2006). Characterization study of
char and activated carbon prepared from raw and extracted rockrose. Carbon,
31(7):1061–1069.
[Pietikäinen et al., 2000] Pietikäinen, J., Kiikkilä, O., and Fritze, H. (2000).
Charcoal as a habitat for microbes and its effect on the microbial community of
the underlying humus. Oikos, 89(2):231–242.
[Preston and Schmidt, 2006] Preston, C. and Schmidt, M. (2006). Black (pyro-
genic) carbon in boreal forests: a synthesis of current knowledge and uncertain-
ties. Biogeosciences Discussions, 3(1):211–271.
[Quilliam et al., 2013a] Quilliam, R. S., DeLuca, T. H., and Jones, D. L. (2013a).
Biochar application reduces nodulation but increases nitrogenase activity in
clover. Plant and soil, 366(1-2):83–92.
[Quilliam et al., 2013b] Quilliam, R. S., Rangecroft, S., Emmett, B. A., Deluca,
T. H., and Jones, D. L. (2013b). Is biochar a source or sink for polycyclic
aromatic hydrocarbon (pah) compounds in agricultural soils? GCB Bioenergy,
5(2):96–103.
[Rajkovich et al., 2012] Rajkovich, S., Enders, A., Hanley, K., Hyland, C., Zim-
merman, A. R., and Lehmann, J. (2012). Corn growth and nitrogen nutrition

BIBLIOGRAPHY 103
after additions of biochars with varying properties to a temperate soil. Biology
and Fertility of Soils, 48(3):271–284.
[Raveendran et al., 1995] Raveendran, K., Ganesh, A., and Khilar, K. C.
(1995). Influence of mineral matter on biomass pyrolysis characteristics. Fuel,
74(12):1812–1822.
[Read, 2009] Read, P. (2009). This gift of nature is the best way to save us from
climate catastrophe. The Guardian, 27.
[Rhodes et al., 2010] Rhodes, A. H., McAllister, L. E., Chen, R., and Semple,
K. T. (2010). Impact of activated charcoal on the mineralisation of 14 c-
phenanthrene in soils. Chemosphere, 79(4):463–469.
[Roberts et al., 2009] Roberts, K. G., Gloy, B. A., Joseph, S., Scott, N. R., and
Lehmann, J. (2009). Life cycle assessment of biochar systems: Estimating the
energetic, economic, and climate change potential. Environmental science &
technology, 44(2):827–833.
[Rodríguez-Reinoso, 1997] Rodríguez-Reinoso, F. (1997). Activated carbon:
structure, characterization, preparation and applications. Introduction to carbon
technologies, page 60.
[Rosemarin, 2004] Rosemarin, A. (2004). The precarious geopolitics of phospho-
rous. Down to Earth, 30:27–34.
[Saito and Marumoto, 2002] Saito, M. and Marumoto, T. (2002). Inoculation
with arbuscular mycorrhizal fungi: the status quo in japan and the future
prospects. In Diversity and Integration in Mycorrhizas, pages 273–279. Springer.
[Schmidt, 2012] Schmidt, H.-P. (2012). 55 uses of biochar. Journal for ecology,
winegrowing and climate farming, posted on December, 29.

104 BIBLIOGRAPHY
[Şensöz et al., 2006] Şensöz, S., Demiral, İ., and Gerçel, H. F. (2006). Olive
bagasse (olea europea l.) pyrolysis. Bioresource technology, 97(3):429–436.
[Smart et al., 1991] Smart, R., Robinson, M., et al. (1991). Sunlight into wine:
a handbook for winegrape canopy management. Winetitles.
[Smil, 2000] Smil, V. (2000). Phosphorus in the environment: natural flows and
human interferences. Annual review of energy and the environment, 25(1):53–88.
[Smit et al., 2009] Smit, A. L., Bindraban, P. S., Schröder, J., Conijn, J., and
Van der Meer, H. (2009). Phosphorus in agriculture: global resources, trends
and developments. Report to the Steering Committee Technology Assessment of
the Ministry of Agriculture, The Neetherlands, Wageningen.
[Steen, 1998] Steen, I. (1998). Phosphorus availability in the 21st century: man-
agement of a non-renewable resource. Phosphorus and Potassium, (217):25–31.
[Steinbeiss et al., 2009] Steinbeiss, S., Gleixner, G., and Antonietti, M. (2009).
Effect of biochar amendment on soil carbon balance and soil microbial activity.
Soil Biology and Biochemistry, 41(6):1301–1310.
[Steiner et al., 2004] Steiner, C., Teixeira, W. G., Lehmann, J., and Zech, W.
(2004). Microbial response to charcoal amendments of highly weathered soils and
amazonian dark earths in central amazonia—preliminary results. In Amazonian
Dark Earths: Explorations in space and time, pages 195–212. Springer.
[Sun et al., 2014] Sun, Y., Gao, B., Yao, Y., Fang, J., Zhang, M., Zhou, Y., Chen,
H., and Yang, L. (2014). Effects of feedstock type, production method, and py-
rolysis temperature on biochar and hydrochar properties. Chemical Engineering
Journal, 240:574–578.
[Takagi and Yoshida, 2003] Takagi, K. and Yoshida, Y. (2003). In situ biore-
mediation of herbicides simazine-polluted soils in a golf course using degrading

BIBLIOGRAPHY 105
bacteria enriched charcoal. In roceedings International Workshop on Material
Circulation through Agro Ecosystems in East Asia and Assessment of its Envi-
ronmental Impact’. Tsukuba, Japan, pages 58–60.
[Tang et al., 2013] Tang, J., Zhu, W., Kookana, R., and Katayama, A. (2013).
Characteristics of biochar and its application in remediation of contaminated
soil. Journal of bioscience and bioengineering, 116(6):653–659.
[Topoliantz et al., 2005] Topoliantz, S., Ponge, J.-F., and Ballof, S. (2005). Man-
ioc peel and charcoal: a potential organic amendment for sustainable soil fertility
in the tropics. Biology and Fertility of Soils, 41(1):15–21.
[Tsai et al., 2007] Tsai, W., Lee, M., and Chang, Y. (2007). Fast pyrolysis of rice
husk: Product yields and compositions. Bioresource Technology, 98(1):22 – 28.
[Vaccari, 2009] Vaccari, D. A. (2009). Phosphorus: a looming crisis. Scientific
American, 300(6):54–59.
[Wang et al., 2010] Wang, H., Lin, K., Hou, Z., Richardson, B., and Gan, J.
(2010). Sorption of the herbicide terbuthylazine in two new zealand forest soils
amended with biosolids and biochars. Journal of Soils and Sediments, 10(2):283–
289.
[Warnock et al., 2007] Warnock, D. D., Lehmann, J., Kuyper, T. W., and Rillig,
M. C. (2007). Mycorrhizal responses to biochar in soil–concepts and mechanisms.
Plant and Soil, 300(1-2):9–20.
[Weissenfels et al., 1992] Weissenfels, W. D., Klewer, H.-J., and Langhoff, J.
(1992). Adsorption of polycyclic aromatic hydrocarbons (pahs) by soil parti-
cles: influence on biodegradability and biotoxicity. Applied Microbiology and
Biotechnology, 36(5):689–696.

106 BIBLIOGRAPHY
[Winemakers Federation of Australia, 2015] Winemakers Federation of Australia
(2015). Vintage report: Wfa winegrape crush and 2016 outlook. Technical
report, Winemakers Federation of Australia, WFA, Adelaide, Australia.
[Woods et al., 2003] Woods, W. I., Teixeira, W. G., Lehmann, J., Steiner, C.,
WinklerPrins, A., Rebellato, L., et al. (2003). Amazonian Dark Earths: Wim
Sombroek’s Vision. Springer.
[Woolf et al., 2010] Woolf, D., Amonette, J. E., Street-Perrott, F. A., Lehmann,
J., and Joseph, S. (2010). Sustainable biochar to mitigate global climate change.
Nature communications, 1:56.
[Yamato et al., 2006] Yamato, M., Okimori, Y., Wibowo, I. F., Anshori, S., and
Ogawa, M. (2006). Effects of the application of charred bark of acacia mangium
on the yield of maize, cowpea and peanut, and soil chemical properties in south
sumatra, indonesia. Soil Science and Plant Nutrition, 52(4):489–495.
[Yao et al., 2013a] Yao, Y., Gao, B., Chen, J., and Yang, L. (2013a). Engineered
biochar reclaiming phosphate from aqueous solutions: mechanisms and potential
application as a slow-release fertilizer. Environmental science & technology,
47(15):8700–8708.
[Yao et al., 2013b] Yao, Y., Gao, B., Chen, J., Zhang, M., Inyang, M., Li, Y.,
Alva, A., and Yang, L. (2013b). Engineered carbon (biochar) prepared by direct
pyrolysis of mg-accumulated tomato tissues: characterization and phosphate
removal potential. Bioresource technology, 138:8–13.
[Yao et al., 2011] Yao, Y., Gao, B., Inyang, M., Zimmerman, A. R., Cao, X.,
Pullammanappallil, P., and Yang, L. (2011). Removal of phosphate from aque-
ous solution by biochar derived from anaerobically digested sugar beet tailings.
Journal of hazardous materials, 190(1):501–507.

BIBLIOGRAPHY 107
[Yao et al., 2012] Yao, Y., Gao, B., Zhang, M., Inyang, M., and Zimmerman,
A. R. (2012). Effect of biochar amendment on sorption and leaching of nitrate,
ammonium, and phosphate in a sandy soil. Chemosphere, 89(11):1467–1471.
[Yoshizawa et al., 2007] Yoshizawa, S., Tanaka, S., and Ohata, M. (2007). Pro-
liferation effect of aerobic micro-organisms during composting of rice bran by
addition of biomass charcoal. In Proceedings of the International Agrichar Con-
ference.
[Yu et al., 2005] Yu, C., Tang, Y.-l., Fang, M.-x., Luo, Z.-y., and Ceng, K. (2005).
Experimental study on alkali emission during rice straw pyrolysis. Journal-
Zhejiang University Engineering Science, 39(9):1435.
[Yu et al., 2013] Yu, O.-Y., Raichle, B., and Sink, S. (2013). Impact of biochar on
the water holding capacity of loamy sand soil. International Journal of Energy
and Environmental Engineering, 4(1):1–9.
[Yu et al., 2006] Yu, X.-Y., Ying, G.-G., and Kookana, R. S. (2006). Sorption
and desorption behaviors of diuron in soils amended with charcoal. Journal of
Agricultural and Food Chemistry, 54(22):8545–8550.
[Zeng et al., 2013] Zeng, Z., Li, T.-q., Zhao, F.-l., He, Z.-l., Zhao, H.-p., Yang,
X.-e., Wang, H.-l., Zhao, J., Rafiq, M. T., et al. (2013). Sorption of ammonium
and phosphate from aqueous solution by biochar derived from phytoremediation
plants. Journal of Zhejiang University Science B, 14(12):1152–1161.
[Zhang et al., 2010] Zhang, H., Lin, K., Wang, H., and Gan, J. (2010). Effect of
pinus radiata derived biochars on soil sorption and desorption of phenanthrene.
Environmental Pollution, 158(9):2821–2825.
[Zhang et al., 2012] Zhang, M., Gao, B., Yao, Y., Xue, Y., and Inyang, M. (2012).
Synthesis of porous mgo-biochar nanocomposites for removal of phosphate and
nitrate from aqueous solutions. Chemical Engineering Journal, 210:26–32.

108 BIBLIOGRAPHY
[Zheng et al., 2007] Zheng, X.-J., Blais, J.-F., Mercier, G., Bergeron, M., and
Drogui, P. (2007). Pah removal from spiked municipal wastewater sewage
sludge using biological, chemical and electrochemical treatments. Chemosphere,
68(6):1143–1152.