POLITECNICO DI MILANO 4-16: schematization of the dye penetrant inspection procedure in 6 steps:...
123
POLITECNICO DI MILANO Faculty of Engineering of Industrial Processes Department for Chemistry, Materials and Chemical Engineering “Giulio Natta” Course of Materials and Nanotechnology Engineering Hydrogel Network in a Porous Resin Matrix: a study for chromatographic applications Supervisors: Prof. Dr. Massimo Morbidelli Prof. Dr. Giuseppe Storti Dr. Bastian Brand Author: Francesco Calandrino Matr. 779753 Academic year 2013 - 2014
Transcript of POLITECNICO DI MILANO 4-16: schematization of the dye penetrant inspection procedure in 6 steps:...

POLITECNICO DI MILANO
Faculty of Engineering of Industrial Processes
Department for Chemistry, Materials and Chemical Engineering “Giulio Natta”
Course of Materials and Nanotechnology Engineering
Hydrogel Network in a Porous Resin Matrix:
a study for chromatographic applications
Supervisors:
Prof. Dr. Massimo Morbidelli
Prof. Dr. Giuseppe Storti
Dr. Bastian Brand
Author:
Francesco Calandrino
Matr. 779753
Academic year 2013 - 2014

II
III
Abstract
In this work the possibility of filling porous poly(styrene-divinylbenzene) resin particles
with hydrogel has been investigated, and the viability of such a composite material for
chromatographic purposes has been assessed. The main focus was put on the loading
capacity of the material with respect to proteins, but ion capacity and swelling
properties were measured as well. Both resin and hydrogel were expressly produced for
this study: porosity and particle size distribution of the resin were accurately controlled.
Moreover, several compositions of the hydrogel were tested, changing both nature and
quantities of the various components. Different processes for combining the two
materials were developed, in order to achieve optimal chromatographic properties of
the final composite. All materials produced were packed into a chromatography column
and tested inside a suitable high performance liquid chromatography cycle and with
respect to an appropriate protein, so as to verify their viability for biochromatography.
The obtained results proved that a few improvements are required in order to make the
material suitable for industrial applications.
Key words: Porous poly(styrene-divinylbenzene) resin particles, Hydrogel, Protein
loading capacity, Biochromatography, Industrial applications.

IV
Sommario
In questo lavoro è stata esplorata la possibilità di riempire particelle porose di
poli(stirene-divinilbenzene) con un idrogel, e l'attitudine di un simile materiale composito
a scopi cromatografici è stata valutata. L'attenzione è stata rivolta principalmente alla
capacità di carico del materiale verso le proteine, ma anche le proprietà di swelling e di
capacità ionica sono state misurate. sia la resina che l'idrogel sono stati appositamente
prodotti per questo studio: la porosità e la distribuzione della dimensione delle particelle
sono state attentamente controllate. Inoltre, varie composizioni sono state sperimentate
per l'idrogel, cambiando sia la natura che le quantità dei diversi componenti. Diversi
processi atti a combinare i due materiali sono stati sviluppati, in modo da ottenere
proprietà cromatografiche ottimali del composito finale. I materiali prodotti sono stati
impaccati in colonne cromatografiche e testati in un opportuno ciclo di cromatografia
liquida ad alta resa e con una proteina adatta, così da verificarne le potenzialità per
applicazioni in biocromatografia. I risultati ottenuti hanno dimostrato che con gli
opportuni miglioramenti il materiale potrebbe prestarsi ad applicazioni su scala
industriale.
Parole chiave: Particelle di resina di poli(stirene-divinilbenzene), Idrogel, Capacità di
carico verso le proteine, Biocromatografia, Applicazioni industriali.
V
Contents
Abstract ................................................................................................................................ III
Sommario ............................................................................................................................. IV
Contents ................................................................................................................................ V
List of abbreviations ............................................................................................................. VII
List of figures ........................................................................................................................ IX
List of tables ........................................................................................................................ XII
1 Introduction .................................................................................................................... 1
1.1 Excerpt on column chromatography .......................................................................... 2
1.2 History of HPLC materials .......................................................................................... 5
1.3 Purpose of the research ............................................................................................ 9
2 Theory .......................................................................................................................... 13
2.1 Poly(styrene-divinylbenzene) resins ........................................................................ 14
2.2 Titration method .................................................................................................... 15
2.3 Polymer hydrogels .................................................................................................. 17
2.4 Hydrogel swelling ................................................................................................... 24
2.5 Column kinetics ...................................................................................................... 26
3 Experimental ................................................................................................................. 29
3.1 Materials ................................................................................................................ 30
3.1.1 Chemicals ........................................................................................................ 30
3.1.2 Equipment ....................................................................................................... 30
3.1.3 Column Geometry ............................................................................................ 31
3.2 Preparation and preliminary experiments ................................................................ 33
3.2.1 Resin preparation ............................................................................................ 33
3.2.2 Bulk hydrogel composition ............................................................................... 35
3.2.3 Titration of the resin ........................................................................................ 40
3.2.4 Functionalization of the resin ........................................................................... 42
3.2.5 Swelling Tests .................................................................................................. 42
3.3 Solution soaking ..................................................................................................... 44
VI
3.4 Oil dispersion ......................................................................................................... 47
3.5 Liquid penetrant ..................................................................................................... 49
3.6 Solution flow-through ............................................................................................. 51
4 Results .......................................................................................................................... 59
4.1 Preliminary tests ..................................................................................................... 60
4.1.1 Resin preparation ............................................................................................. 60
4.1.2 Bulk hydrogel composition ................................................................................ 66
4.1.3 Titration of the resin......................................................................................... 67
4.1.4 Functionalization of the resin ............................................................................ 70
4.1.5 Swelling tests ................................................................................................... 72
4.2 Solution soaking ...................................................................................................... 75
4.3 Oil dispersion .......................................................................................................... 79
4.4 Liquid penetrant ..................................................................................................... 83
4.5 Solution flow-through ............................................................................................. 87
5 Conclusions and outlook ................................................................................................. 99
6 Bibliography ................................................................................................................. 105
7 Acknowledgements ....................................................................................................... 110

VII
List of abbreviations
AA………………………………………………………… Acrylamide
AIBN…………………………………………………….. Azobisisobutyronitrile
AMPS……………………………………………………. 2-Acrylamido-2-methylpropane sulfonic acid
APS………………………………………………………. Ammonium persulfate
AETAC…………………………………………………… [2-(Acryloyloxy)ethyl] trimethylammonium
chloride
AU………………………………………………………… Absorbance units
DVB………………………………………………………. Divinylbenzene
EC…………………………………………………………. Electrical conductivity
EtOH…………………………………………………….. Ethanol
h…………………………………………………………… hour(s)
H2SO4……………………………………………………. Sulphoric acid
HCl……………………………………………………….. Hydrochloric acid
HETP…………………………………………………….. Height equivalent to a theoretical plate
HNO3……………………………………………………. Nitric acid
HPLC…………………………………………………….. High-Performance Liquid Chromatography
KNO3…………………………………………………….. Potassium nitride
KPS……………………………………………………….. Potassium persulfate
mBAM…………………………………………………… N,N’-methylenebisacrylamide
MgCl2……………………………………………………. Magnesium chloride
VIII
N2…………………………………………………………. Nitrogen (gas)
Na2HPO4………………………………………………. Sodium phosphate dibasic
NaCl……………………………………………………… Sodium chloride
NaH2PO4………………………………………………. Sodium phosphate monobasic
NaHCO3………………………………………………… Sodium carbonate
NaOH……………………………………………………. Sodium hydroxide
PEEK…………………………………………………….. Polyether ether keton
PS-DVB…………………………………………………. Poly(styrene-divinylbenzene)
SDS………………………………………………………. Sodium dodecyl solphate
SEM……………………………………………………… Scanning electron microscopy
SPAN 20……………………………………………….. Sorbitan monolaurate
SPAN 40……………………………………………….. Sorbitan monopalmitate
Sty………………………………………………………… Styrene
TEMED……………………………………………………Tetramethylethylenediamine
UV-Vis…………………………………………………… Ultraviolet-visible spectrophotometry
IX
List of figures
Figure 1-1: separation of vegetal pigments by means of chromatography, as intended by
Mikhail Tsvet [2]............................................................................................................... 2
Figure 1-2: components of a typical HPLC system [2] ........................................................ 4
Figure 1-3: TEM photograph of a 2.7 µm core-shell Halo particle by Advanced Materials
Technology (picture reproduced from [9]) ....................................................................... 8
Figure 1-4: representation of a pore in a particle of Fractogel resin .................................. 9
Figure 1-5: representation of a pore in a resin particle of the target material ................. 10
Figure 2-1: reaction of DVB and Sty to form a PS-DVB copolymer .................................. 14
Figure 2-2: uncoiling of a polymer chain due to repulsion of unbalanced charges ......... 17
Figure 2-3: water adsorbing on a hydrogel network ....................................................... 18
Figure 2-4: initiators used in this work: APS (left) and AIBN (right) ................................ 19
Figure 2-5: dissociation reaction of APS ......................................................................... 20
Figure 2-6: propagation of a polyacrylamide chain ........................................................ 21
Figure 2-7: chain transfer reaction during the free-radical polymerization of LDPE ....... 22
Figure 2-8: chain transfer reaction induced by a generic transfer agent, R-SH ............... 23
Figure 2-9: bimolecular termination reactions in polymerization of a polyacrylamide
chain: combination (above) and disproportionation (below) ......................................... 23
Figure 3-1: 50 x 5 mm Tricorn glass column, complete with all its parts (from the left: end
cap, glass tube, 2 o-rings, adapter unit and filter holder) [30] ......................................... 32
Figure 3-2: 50 x 4 mm Metrohm Metrosep PEEK column, with end caps and stoppers at
both ends [31] ................................................................................................................ 33
Figure 3-3: temperature resistant sealing of a PEEK column ............................................ 53
Figure 4-1: Particle size distribution of the original PS-DVB resin .................................... 62

X
Figure 4-2: particle size distributions of the original PS-DVB resin (light blue), the 45-63
µm fraction (purple), the 63-100 µm fraction (orange), the 100-125 µm fraction (red) and
the mixed fraction (green) .............................................................................................. 63
Figure 4-3: SEM picture of a resin particle produced for this study .................................. 64
Figure 4-4: schematic representation of a core-shell PS-DVB resin particle ..................... 65
Figure 4-5: pH measurements obtained by titration of plain PS-DVB sample ................... 69
Figure 4-6: pH measurements obtained by titration of a sulfonated PS-DVB sample ........ 71
Figure 4-7: effect of monomer concentration on swelling behaviour ............................. 73
Figure 4-8: effect of cross-linker concentration on swelling behaviour .......................... 74
Figure 4-9: graphic interpretation of the 3 steps involved in the solution soaking
technique: soaking in monomer solution (1), removal of excess solution (2) and heating at
60 °C for 5 hours (3) ....................................................................................................... 75
Figure 4-10: pH measurements obtained by titration of a resin sample subjected to
solution soaking technique with AMPS gel ...................................................................... 77
Figure 4-11: pH measurements obtained by titration of a resin sample subjected to
solution soaking technique with AETAC gel (dried on paper filter)................................... 78
Figure 4-12: pH measurements obtained by titration of a resin sample subjected to
solution soaking technique with AETAC gel (dried on polymer mesh) .............................. 78
Figure 4-13: graphic interpretation of the 4 steps involved in the oil dispersion technique:
soaking in monomer solution (1), dispersion in hydrophobic medium (2), heating at 60 °C
for 5 hours (3) and cleaning of the resin (4) .................................................................... 80
Figure 4-14: PSD plot of a sample treated with the oil dispersion technique ................... 81
Figure 4-15: pH measurements obtained by titration of a resin sample subjected to oil
dispersion technique with an AMPS gel .......................................................................... 82
Figure 4-16: schematization of the dye penetrant inspection procedure in 6 steps: crack
concealed by dirt (a), precleaning (b), application of the dye (c), intermediate cleaning (d),
application of the developer (e), crack revelation (f) ....................................................... 83
Figure 4-17: graphic interpretation of the 5 steps involved in the liquid penetrant
technique: soaking in solution containing monomer, cross-linker and TEMED (1), thorough
XI
removal of excess solution (2), re-dispersion of the resin in salt solution containing APS
(3), stirring of the suspension (4), drying of the resin (5) ................................................. 84
Figure 4-18: pH measurements obtained by titration of a resin sample subjected to liquid
penetrant technique with AMPS gel ............................................................................... 86
Figure 4-19: graphic interpretation of the 4 steps involved in the solution flow-through
technique: column-packing of the resin (1), injection of monomer solution into the column
(2), removal of excess solution (3) and heating of the column at 60 °C for 5 hours (4) .... 88
Figure 4-20: pH measurements obtained by titration of a resin sample subjected to
solution flow-through technique with AMPS gel ............................................................. 90
Figure 4-21: chromatogram for a 20 µL injection of lysozyme on the sample of Figure
4-20 ............................................................................................................................... 91
Figure 4-22: graphical representation of the data presented in Table 4-2 ...................... 92
Figure 4-23: gelled resin “plug” found in specimen HG 3 ............................................... 93
Figure 4-24: pH measurements obtained by titration of a resin sample subjected to
solution flow-through technique with AETAC gel ............................................................ 94
Figure 4-25: plot of the data reported in Table 4-3 ......................................................... 96
Figure 5-1: effect of broad (red) and narrow (blue) pore size distribution on volume of
retained liquid .............................................................................................................. 103
XII
List of tables
Table 3-1: compositions of AMPS bulk hydrogels produced with TEMED ......................... 36
Table 3-2: composition of AMPS bulk hydrogels produced without TEMED ..................... 37
Table 3-3: composition of AETAC bulk hydrogels produced with salt ............................... 39
Table 3-4: compositions of AA/AETAC bulk hydrogels ..................................................... 40
Table 3-5: compositions of hydrogels with increasing monomer content ....................... 43
Table 3-6: compositions of hydrogels with increasing cross-linker content .................... 43
Table 3-7: monomer solution compositions for solution flow-through technique .......... 54
Table 3-8: composition of AETAC monomer solutions used for flow through technique ... 55
Table 3-9: composition of reference samples for UV-Vis analysis .................................... 56
Table 4-1: equilibrium volumes (mL) of AMPS hydrogels of various compositions ......... 72
Table 4-2: collected volume of excess solution as a function of the inlet pressure of the
nitrogen flow ................................................................................................................. 92
Table 4-3: results of UV-Vis analysis for all reference samples ........................................ 95
Table 5-1: summary of results and comments about each of the four proposed techniques
.................................................................................................................................... 100

1 Introduction
In this chapter both the concept and the history of column chromatography are
presented; then, the reasons for which this research was carried out are explained, after
a brief presentation of the various materials that have already been developed for the
same purpose.

POLITECNICO DI MILANOPOLITECNICO DI MILANOPOLITECNICO DI MILANOPOLITECNICO DI MILANO
Faculty of Engineering of Industrial Processes Course of Materials and Nanotechnology Engineering
2
1.1 Excerpt on column chromatography
The word “chromatography” comes from Greek (chroma "color" and graphein "to
write"), and was first used by Mikhail Tsvet in 1900 to describe the process he invented
to reveal, separate and study pigments found in plants [1]. All these natural pigments
have a particular colour, different from those of the other ones, so Tsvet decided to
name the process chromatography, because the technique revealed each pigment by its
colour, as can be seen in Figure 1-1 below.
Figure 1-1: separation of vegetal pigments by means of chromatography, as intended by Mikhail Tsvet [2]
The technique was later further developed and applied to other purposes, but the name
has so far been kept, even though the color of the substances subjected to this process
is not of any importance anymore.
The term chromatography indicates a series of different techniques the purpose of
which is to separate the components of a homogenous mixture. The basic idea is to have
the homogenous mixture (generally a fluid phase with dissolved substances in it, usually
referred to as the “mobile phase”) flowing in contact with a second phase (in most cases
a solid, called “stationary phase”); due to thermodynamic imbalance between the two
Hydrogel Network in a Porous Resin MatrixHydrogel Network in a Porous Resin MatrixHydrogel Network in a Porous Resin MatrixHydrogel Network in a Porous Resin Matrix a study for chromatographic applications
1 INTRODUCTION
3
phases, there is a material transport of species from the mobile phase to the surface of
the stationary phase, where adsorption is taking place. The extent of this adsorption is
different for the different species, depending upon their affinity for the solid surface.
After establishing equilibrium conditions, i.e. long enough contact between the two
phases, a properly selected solvent, capable of displacing the adsorbed molecules, is let
through the stationary phase and collected, so that only the previously adsorbed
molecules will be found in it. Such solvent is called eluent.
The effectiveness of the process is determined by the characteristics of all the chemical
species involved, which means mobile phase, stationary phase and eluent. This implies
that both stationary phase and eluent must be properly selected according to the kind
of substance that is going to be extracted from a solution.
Chromatography can be used both for preparation and for analysis purposes. The
purpose of preparative chromatography is to separate the different substances present
in a solution so that they can later be used for further applications, and is therefore a
form of purification; analytical chromatography is done normally with significantly
smaller amounts of material and is applied for measuring the relative proportions of
chemical species present in a mixture. It is important to note that none of the two
exclude the other: it is possible to cover both aspects of the process with the same
procedure. The distinction is mainly about the amount of the mixture subjected to the
process.
The most widespread chromatographic technique for preparation purposes is the so-
called column chromatography, in which the adsorbent is filling a cylinder that is usually
made of glass, polymer or stainless steel and is named “column”. In the specific case of
ion exchange chromatography for separation of bio-macromolecules (such as proteins),
which is the main focus of this work, the procedure of interest is the one called High-
Performance Liquid Chromatography (HPLC), which is known for its high value of
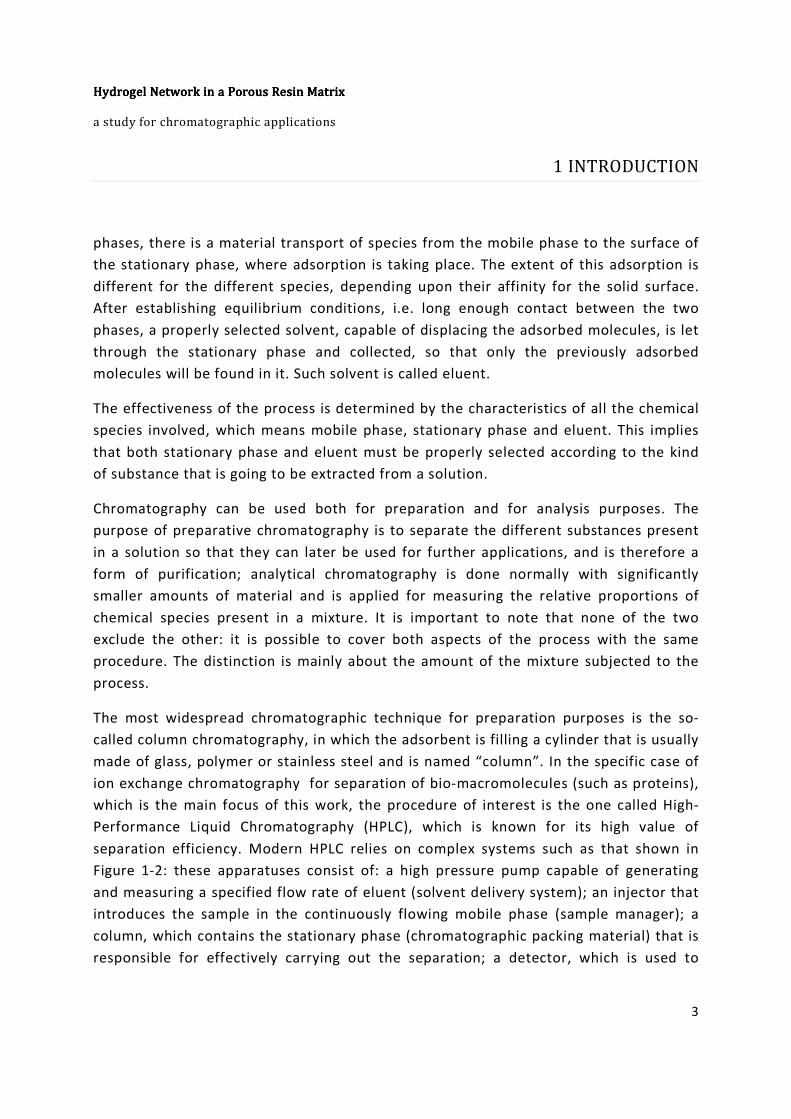
separation efficiency. Modern HPLC relies on complex systems such as that shown in
Figure 1-2: these apparatuses consist of: a high pressure pump capable of generating
and measuring a specified flow rate of eluent (solvent delivery system); an injector that
introduces the sample in the continuously flowing mobile phase (sample manager); a
column, which contains the stationary phase (chromatographic packing material) that is
responsible for effectively carrying out the separation; a detector, which is used to

POLITECNICO DI MILANOPOLITECNICO DI MILANOPOLITECNICO DI MILANOPOLITECNICO DI MILANO
Faculty of Engineering of Industrial Processes Course of Materials and Nanotechnology Engineering
4
observe the separated compounds coming out of the column; a computer data station,
that collects the detected data and plots them on a diagram called “chromatogram”.
Figure 1-2: components of a typical HPLC system [2]
The improved performance of HPLC is due to the particular structure of the stationary
phase, that consists of small particles tightly packed together thus making the mass
transport through the particles quicker, which allows to optimize process times.
Furthermore, being that the substance to be separated from the mobile phase is
adsorbed on the surface of the stationary phase, a greater surface to volume ratio
increases the amount of such substance that can be adsorbed and separated by a
column. This quantity can be measured (by static binding capacity measurements, for
example) and is actually one of the most important characteristics in a column for HPLC:
it is referred to as the capacity of the column.
Adsorption is due to binding forces, which can be very different in nature and in
strength. This also means that the adsorption equilibria vary a lot in strength. It is
possible to distinguish two main forms of interaction: physisorption, which happens
through weak interactions (van der Waals forces), and chemisorption, that involves
Hydrogel Network in a Porous Resin MatrixHydrogel Network in a Porous Resin MatrixHydrogel Network in a Porous Resin MatrixHydrogel Network in a Porous Resin Matrix a study for chromatographic applications
1 INTRODUCTION
5
much stronger interactions (valence forces or chemical bonds) [3]. For ion exchange
chromatography, the subject of the present study, valence forces are the ones involved
in the binding of proteins to the stationary phase: therefore, in order to grant total
reversibility of the adsorption, a proper desorption step must be designed.
The capacity of a column is particularly important for preparative chromatography: in
this case, using columns with a greater capacity increases the amount of solution that
can be processed in one cycle. In an industrial process, this means minimizing process
times (as long as the flow rate can be kept constant), which ultimately increases the
income for that process. It is then rather obvious that maximizing column capacity is a
problem of great relevance for pharmaceutical industries, as well as for all those
industries that use HPLC in their productive chain. Monoclonal antibodies, which are of
critical importance for pharmaceutical industries nowadays, accounting for roughly 35%
of all biologics in clinical development, make a good example for portraying the
relevance of this topic: the downstream processing is responsible for up to 80% of the
total production costs of such antibodies [4]. Therefore, a significant reduction in the
costs for purification of the product will cause a consistent drop in the cost of the good.
1.2 History of HPLC materials
When HPLC was first introduced, many different materials meant to be used as
stationary phases of the columns were developed to optimize the process. After the first
decade, there was a commonly accepted standard that dominated the market from 1975
until 2000: a stainless steel tube with an internal diameter of 4.6 mm, packed with
particles having a 5 to 10 µm diameter [5]. These particles were macroporous: since
they are packed as tightly as possible in the column, the mobile phase has to go through
the network of pores, so that adsorptive substances can be adsorbed; moreover, this
adsorption is usually enhanced by proper functionalization of the surfaces of the pores.
This standard remained unaltered for about 25 years, except for a progressive reduction
in the length of the column, which went from 300 to 150 mm. Although finer particles
were produced and tested by several research groups, they did not make it to the

POLITECNICO DI MILANOPOLITECNICO DI MILANOPOLITECNICO DI MILANOPOLITECNICO DI MILANO
Faculty of Engineering of Industrial Processes Course of Materials and Nanotechnology Engineering
6
market [5]. This was due to the higher pressure requirements that would have
noticeably increased the capital expense, and to a significant issue with local
temperature maxima due to friction around the particles that would cause changes in
viscosity and, consequently, peak broadening (a process called viscous fingering).
The first alternative to these stationary phases was commercialized by Merck in 1999: it
was called Chromolith, and consisted of a large (100 mm x 4.6 mm) silica monolith
instead of packed microscopic particles. While the monolith was basically a single block
of material, it consisted of two regions characterized by different pore sizes,
distinguishable in macropores (2 µm) and mesopores (10-15 nm).
A common approach for comparing chromatographic performances of different
stationary phases is to plot their normalized efficiency (i.e. HETP, cfr. section 2.5) as a
function of the flow rate of the mobile phase [6]. This method is quick and useful in a lot
of cases, but it does have the notable limitation of not taking into account kinetic
parameters such as analysis times or pressure restrictions. To evaluate performances of
a column material without neglecting relevant variable, an alternative term is required:
one such parameter is called “impedance”, which represents the resistance encountered
by the mobile phase as it moves down the column. This parameter is defined as:
' = ∆* + ƞ -./ (1)
Where ∆P is the pressure drop, t is the dead time of the chromatographic system, ƞ is the
dynamic viscosity of the mobile phase and N is the number of theoretical plates [6]. This
separation impedance can be seen as the difficulty to achieve a certain performance and
should be minimized to optimize a column material.
Another useful parameter for comparing performances of column materials is the so-
called “resolution”, which is the ability to separate two different signals, as the general
meaning of the word would suggest; in the specific case of column chromatography,
resolution is defined as the ratio between the time interval between maxima of two peaks
and their average width at base:
01 = .∆2 (456 + 45.)/ (2)

Hydrogel Network in a Porous Resin MatrixHydrogel Network in a Porous Resin MatrixHydrogel Network in a Porous Resin MatrixHydrogel Network in a Porous Resin Matrix a study for chromatographic applications
1 INTRODUCTION
7
This term should be maximized in order to optimize column performance. Several models
that relate resolution to adjustable column parameters (such as efficiency and retention
times) exist, each based on more or less restrictive hypotheses; on the other hand, all
these model agree that column resolution grows linearly with the square root of N (which
is once again the number of theoretical plates in the column) [6]:
01 ∝ √- (3)
The first silica monoliths that were developed made it possible to prepare columns with
impedance around 50% of what could be obtained at the time with 5 µm particles. On
the other hand, this new technology had the drawback of inducing largely turbulent
flows, which lead to band broadening [5]. This meant that process times were reduced,
but the quality of the analysis or separation was decreased as well.
The introduction of silica-based monolithic stationary phases renewed the interest
around column technology: the threat of competition posed by this new monolithic
stationary phases incited a rapid development of the previously existing technology of
macroporous particles. In a few years fully porous particles were reduced from 5 to 1.5
µm in diameter, as columns became shorter (from 150 to 50 mm in length) while still
maintaining their efficiency: this means that capital expense is reduced because less
material is needed to pack the column.
The impedance of columns packed with particles having such a small diameter was only
slightly larger than that of monolithic columns [5]. These columns have to operate at
high pressure to overcome the high pressure drops associated with the reduced particle
size (1000 bar or more), but they have the advantage of having a resolution more than 4
times higher than their monolithic counterpart [5]. This is due to the low efficiency of
monolithic silica rods, given by radial heterogeneity of the monoliths and poorly
designed sample distributors [5]; a second generation of monolithic stationary phases
free from such issues is to be hoped for.
In parallel to these finer particles, new brands of core-shell particles, with a slightly
larger diameter (2-3 µm) were also developed.
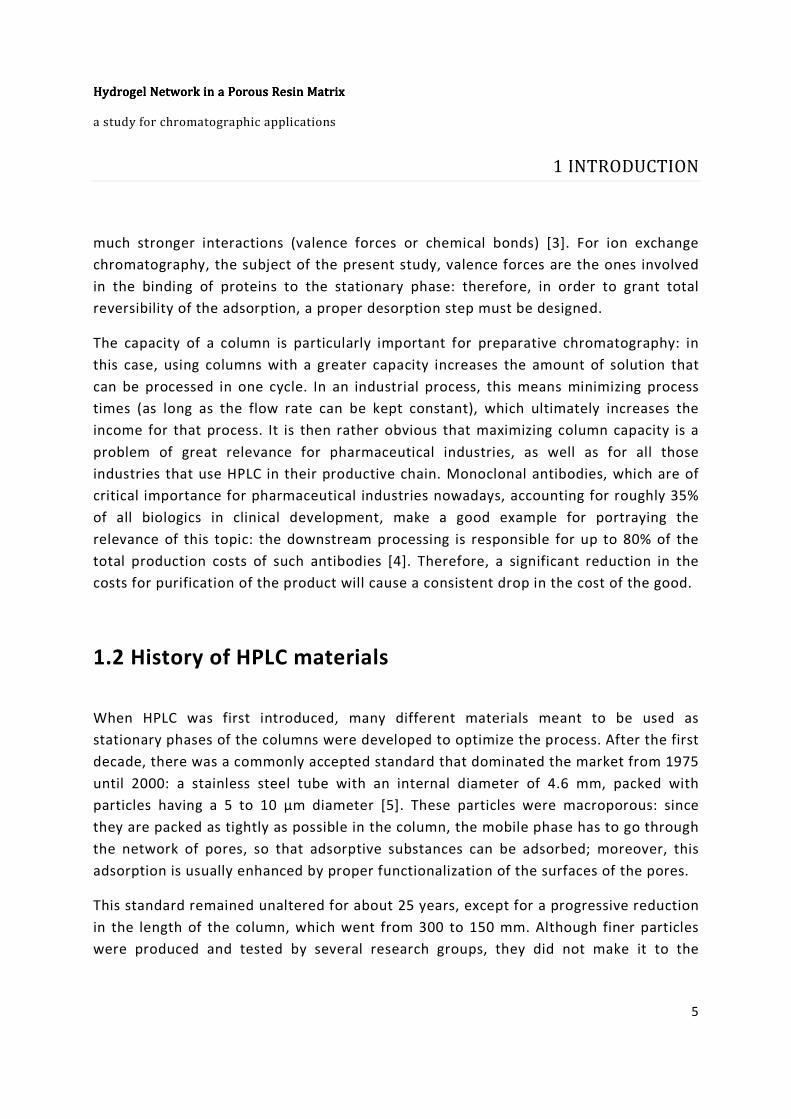
Core-shell particles such as that of Figure 1-3 consist of a highly cross-linked, rigid full
core, and a lightly cross-linked, soft porous shell. This means that only the shell volume
POLITECNICO DI MILANOPOLITECNICO DI MILANOPOLITECNICO DI MILANOPOLITECNICO DI MILANO
Faculty of Engineering of Industrial Processes Course of Materials and Nanotechnology Engineering
8
is accessible to the mobile phase, which limits the overall surface area of the material;
on the other hand, the rigid core is capable of bearing relatively high compression
stresses, showing elastic behavior up to 60 MPa [7], which makes the material suitable
for HPLC applications. Furthermore, since the mobile phase is not able to penetrate the
core of the particles, diffusion distances are reduced and there can be no band
broadening due to stagnant mobile phase mass transfer [8], which improves efficiency
and resolution of columns packed with this kind of particles.
Figure 1-3: TEM photograph of a 2.7 µm core-shell Halo particle by Advanced Materials Technology
(picture reproduced from [9])
First, Advanced Materials Technology patented Halo particles in 2006, then Kinetex was
commercialized in 2009 and Poroshell 120 followed in 2010: columns packed with these
materials have an impedance around 1000, which is one third of what the finest
particles can have, and they also have an improved resolution (up to 50% higher) [5].
Meanwhile, EMD Millipore introduced Fractogel, which consists of much larger particles
(20-150 µm in diameter) with very large porosity (60-70% of the particle volume)
Hydrogel Network in a Porous Resin MatrixHydrogel Network in a Porous Resin MatrixHydrogel Network in a Porous Resin MatrixHydrogel Network in a Porous Resin Matrix a study for chromatographic applications
1 INTRODUCTION
9
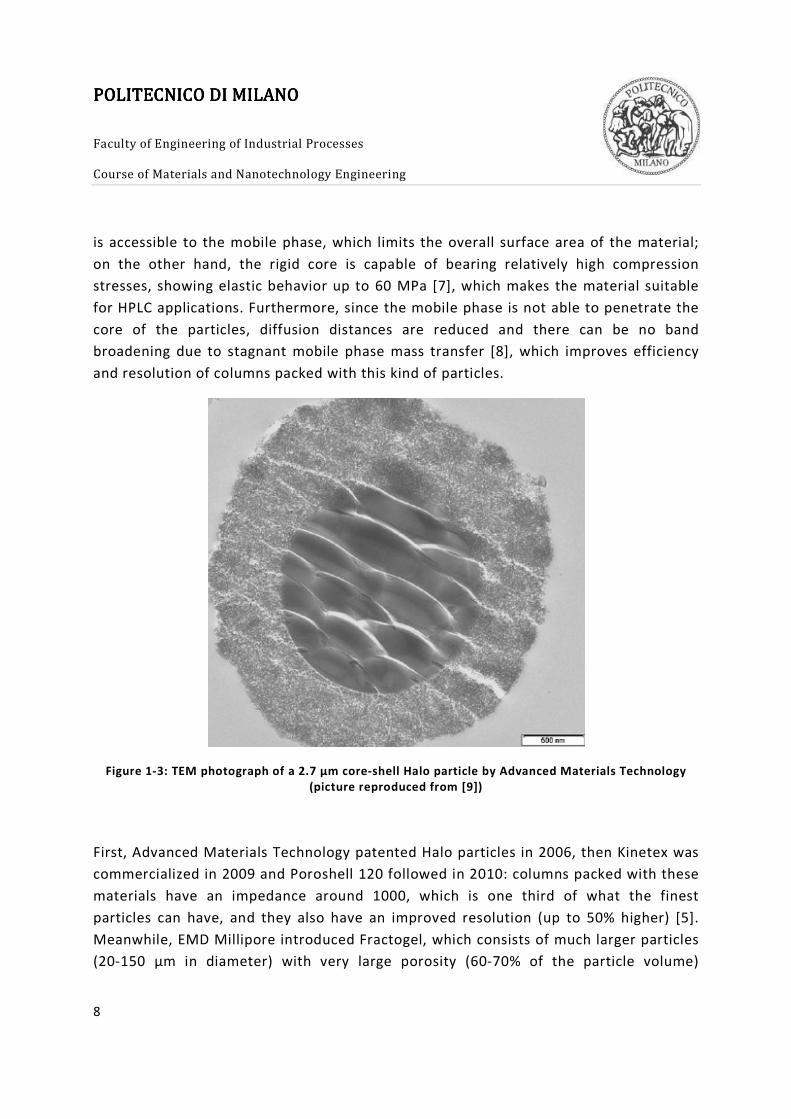
functionalized with polymeric tendrils occupying part of the volume of the pores, as can
be seen in Figure 1-4.
These tendrils are made of a copolymer with repeated units having a sulfonic group,
they can adsorb molecules such as proteins and they can rearrange so that efficiency of
adsorption is maximized. This can be considered the current state of the art of
stationary phase materials for HPLC.
Figure 1-4: representation of a pore in a particle of Fractogel resin
1.3 Purpose of the research
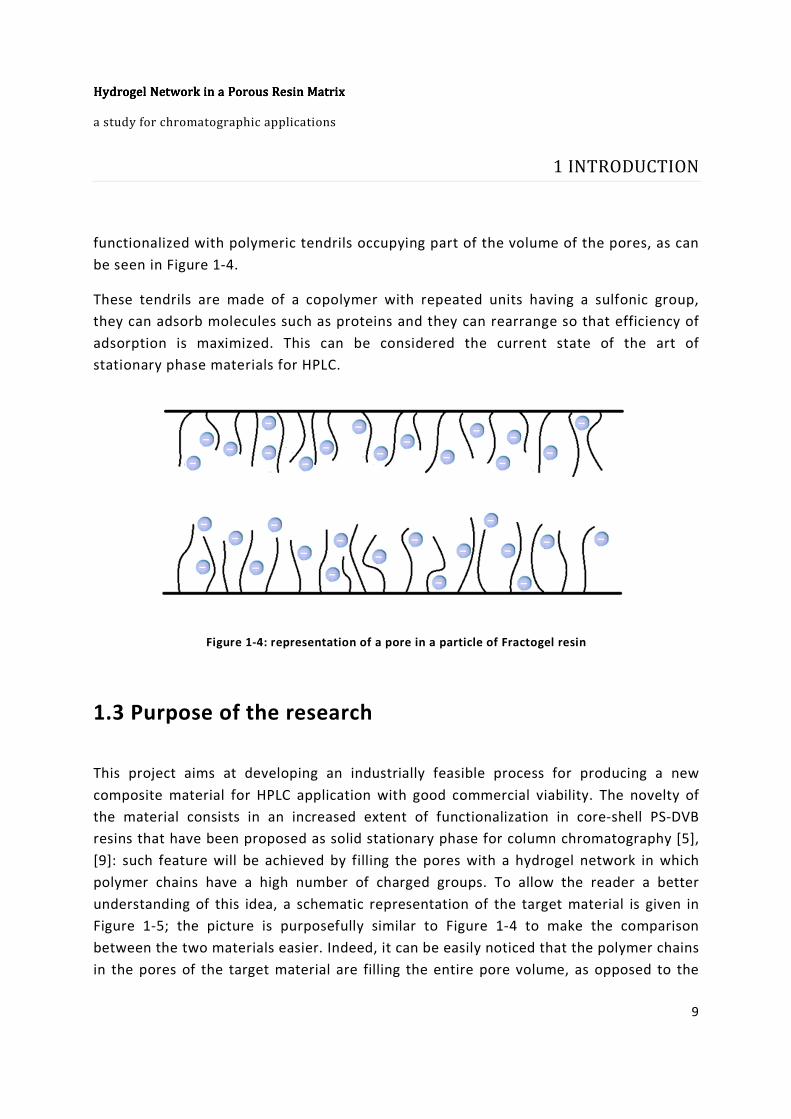
This project aims at developing an industrially feasible process for producing a new
composite material for HPLC application with good commercial viability. The novelty of
the material consists in an increased extent of functionalization in core-shell PS-DVB
resins that have been proposed as solid stationary phase for column chromatography [5],
[9]: such feature will be achieved by filling the pores with a hydrogel network in which
polymer chains have a high number of charged groups. To allow the reader a better
understanding of this idea, a schematic representation of the target material is given in
Figure 1-5; the picture is purposefully similar to Figure 1-4 to make the comparison
between the two materials easier. Indeed, it can be easily noticed that the polymer chains
in the pores of the target material are filling the entire pore volume, as opposed to the

POLITECNICO DI MILANOPOLITECNICO DI MILANOPOLITECNICO DI MILANOPOLITECNICO DI MILANO
Faculty of Engineering of Industrial Processes Course of Materials and Nanotechnology Engineering
10
chains in Fractogel that fill the pores only partially. Also, the chains are highly cross-
linked, resulting in a continuous hydrogel.
Figure 1-5: representation of a pore in a resin particle of the target material
The reason for filling the pores with a hydrogel is that gels have a peculiar structure,
which grants that some proprieties typical of solid state materials, and some proprieties
typical of the liquid state. Specifically, hydrogels consist of a complex network made of
cross-linked polymer chains in which the monomer unit is a hydrophilic molecule [10]:
this makes absorption of water very favorable, so that in practice hydrogels left in
contact with a watery phase become water constrained by a polymer network [11]. In
the particular case in which the monomer unit is ionic, the hydrogel will resemble a
volume filled with immobile charges suspended in water [12]: this is an ideal medium for
separation of charged species, because it can have a high density of charges while still
allowing fluid-state diffusion [13]. Of course, diffusion through a hydrogel is not as fast
as diffusion through pure water because the hydrogel network hinders diffusion of
solutes, but it is definitely faster than diffusion in solid matter [13].
Given these premises, it is expected that hydrogels could be used to further increase the
capacity of HPLC columns having a stationary phase consisting of resin particles.
Although a hydrogel network may also suppress convective flow inside the pore volume,
access to the functionalized volume should still be granted by means of diffusion;
furthermore, since diffusion is a phenomenon driven by concentration gradient, as

Hydrogel Network in a Porous Resin MatrixHydrogel Network in a Porous Resin MatrixHydrogel Network in a Porous Resin MatrixHydrogel Network in a Porous Resin Matrix a study for chromatographic applications
1 INTRODUCTION
11
expressed by Fick’s first law:
; = −= >?@ (4)
diffusion from a fluid phase into a hydrogel is expected to be rather quick [14], meaning
that no major reduction of flow rate is required. It will be necessary to develop a
procedure capable of producing hydrogel inside the volume of the pores of the resin
particles without filling the interstitial spaces between particles, because that would
prevent flow of the mobile phase through the column in which the material is packed.

POLITECNICO DI MILANOPOLITECNICO DI MILANOPOLITECNICO DI MILANOPOLITECNICO DI MILANO
Faculty of Engineering of Industrial Processes Course of Materials and Nanotechnology Engineering
12

2 Theory
In this chapter, all the knowledge needed beforehand for understanding the procedure
that was followed to produce the desired material is given. Since this material is a
composite, based on PS-DVB resin as the matrix for a hydrogel, both these classes of
materials are presented in the chapter. A few elements of column kinetics are given to
the reader, to allow for a better understanding of the issues that are being addressed.
Finally, an introduction to titration is given to explain its relevance to this study.

POLITECNICO DI MILANOPOLITECNICO DI MILANOPOLITECNICO DI MILANOPOLITECNICO DI MILANO
Faculty of Engineering of Industrial Processes Course of Materials and Nanotechnology Engineering
14
2.1 Poly(styrene-divinylbenzene) resins
In recent times, PS-DVB resins have been widely used in chemical industries for many
different purposes, including chromatography, because of their high chemical and
mechanical stability in most environments and their ability to be made into several
different conformations including gel-type, macroporous and core-shell resin particles
[15], [9]. In addition to this, the productive process for these particles is relatively cheap
and simple to carry out [15], making PS-DVB resins a good choice as basic study material
for chromatographic applications. The polymerization reaction depicted in Figure 2-1 is
usually carried out in well-stirred reactors, at 70 °C for 24 hours, using AIBN as initiator:
such a reaction will follow the free-radical mechanism.
Figure 2-1: reaction of DVB and Sty to form a PS-DVB copolymer
Due to the presence of a difunctional monomer (DVB), the final polymer is cross-linked,
thus exhibiting the attractive properties mentioned above. In order for PS-DVB resin
particles to be useful for chromatography, they must be made so that their volume is at
least partially accessible to a liquid phase (either for functionalization of the material or
to increase the contact area for the mobile phase). This effect can be achieved in two
ways:
Hydrogel Network in a Porous Resin MatrixHydrogel Network in a Porous Resin MatrixHydrogel Network in a Porous Resin MatrixHydrogel Network in a Porous Resin Matrix a study for chromatographic applications
2 THEORY
15
• By swelling the resin through a thermodynamically good solvent: such a swollen
resin will be soft, easily compressible and rather fragile in shear. This type of
materials are produced keeping the concentration of DVB in the copolymer low
(0,5-2,0% mol), so that the obtained resin is only lightly cross-linked [15].
• By employing a proper porogen (usually an organic solvent non compatible with
the polymer) during the polymerization: this generates a complex network of
permanent pores that run across the volume of each particle. A higher
concentration of DVB is needed for these particles to be made, resulting in harder
and more rigid material. Pores found in such particles are easier to access for
thermodynamically poor solvents [15].
2.2 Titration method
Titration is an effective technique to assess the amount of charged groups present on
the surface of a material. In order to do this as precisely as possible, the method
described by Stone and Carta [16] was selected as a suitable option for this study: the
main focus of this research is to maximize protein capacity of a stationary phase for
column chromatography; in the case of ion affinity chromatography, this can be simply
evaluated as the number of charged groups present and accessible on the surface of the
stationary phase. By means of titration, one can find the exact number of charged
groups present in a column, which can be a useful indicator; nevertheless, the effective
capacity can only be measured by an actual chromatography run with proteins on a
HPLC machine. As a matter of fact, what is being measured by titration is actually the
ionic capacity, which can differ from the protein capacity.
The titration method proposed by Stone and Carta describes a 3 steps preparation:
1. Bathe the material in a large volume of concentrated (1M) HCl solution: this will
protonate all negatively charged groups. When titrating sulfonic groups, the
reaction is:
RSO3-
+ HCl → R SO3-
H+ + Cl
-

POLITECNICO DI MILANOPOLITECNICO DI MILANOPOLITECNICO DI MILANOPOLITECNICO DI MILANO
Faculty of Engineering of Industrial Processes Course of Materials and Nanotechnology Engineering
16
2. Wash with a large volume of pure water: this will clean the residual acid left
among the resin particles during step 1, without desorbing any proton, so that
electroneutrality is preserved.
3. Bathe in 25 mL of a 0.5M/0.05M NaCl/NaOH aqueous solution: this will substitute
the protons with Na, consuming hydroxides to form water, as per the reaction:
R SO3-
H+ + NaOH -> R SO
3-Na
+ + H2O
4. Collect and titrate 15 mL of the solution described in step 3 with an appropriate
volume of HCl.
What is actually being titrated with this method is the NaOH molecules that did not
react with the material during step 3; by subtracting such amount from the number of
molecules of NaOH that were used to bathe the sample, the amount of reacted
molecules is evaluated and, given the experimental conditions, it is safe to assume that
all charged groups reacted with NaOH. Indeed, the high concentration of NaCl in the
solution is meant to grant that all protons that reacted with sulfonic groups are replaced
by Na+ ions; then, those Na
+ coming from dissociation of NaCl will react with the less
stable NaOH, regenerating the salt and releasing OH-, which should then react with the
protons released in the solution with the first reaction, giving water. Therefore, the
overall reaction is:
R SO3-
H+ + NaOH → R SO
3-Na
+ + H2O
This way, it becomes possible to reckon the number of accessible charged groups on the
surface of the resin. If the number of moles of generic negatively charged groups X
- is
N1, the number of moles of NaOH revealed by titration is N2 and the total number of
moles of NaOH that went through the column as per step 3 is N3, then it can be written:
N1 = N3 – N2 (5)
The resulting value for N1 must then be normalized by the volume of the column.
This method is supposed to provide a very precise evaluation for the ionic capacity of a
material. Since this characteristic is usually expressed in µmol/mL of column volume, the

Hydrogel Network in a Porous Resin MatrixHydrogel Network in a Porous Resin MatrixHydrogel Network in a Porous Resin MatrixHydrogel Network in a Porous Resin Matrix a study for chromatographic applications
2 THEORY
17
total amount of charged groups measured by titration has to be divided by the total
volume of the column.
2.3 Polymer hydrogels
Polymer hydrogels are polymer networks that, due to cross-linking of the polymer
chains, remain insoluble in water, while still being able to adsorb large quantities of
water thanks to the physical and chemical nature of polymers [10]: to be a good
candidate for preparing hydrogels, a monomer must possess a hydrophilic group, such
as the carboxylic acid group. Molecules having this characteristic need to be stabilized
by coordination with a proper counterion [17]. Neglecting the effect of this counterion,
the unbalanced charges in the chain would repel each other, leading to uncoiling of the
polymer chains, as shown in Figure 2-2.
Figure 2-2: uncoiling of a polymer chain due to repulsion of unbalanced charges

POLITECNICO DI MILANOPOLITECNICO DI MILANOPOLITECNICO DI MILANOPOLITECNICO DI MILANO
Faculty of Engineering of Industrial Processes Course of Materials and Nanotechnology Engineering
18
However, polar molecules (such as water) will be attracted by these unbalanced charges,
forming hydrogen bonds with them when possible, as depicted in Figure 2-3: in this
state, hydrogels can adsorb hundreds of times their own weight in water [18], [19]. This
phenomenon, called swelling, is what qualifies hydrogels [19] and will be discussed in
section 2.4.
Figure 2-3: water adsorbing on a hydrogel network
Hydrogels can be produced either by free radical polymerization of monomer with an
appropriate bifunctional cross-linker or by polymerization of large bifunctional
macromers [11]. In this work, the first approach was followed, as discussed more
specifically in the following.

Hydrogel Network in a Porous Resin MatrixHydrogel Network in a Porous Resin MatrixHydrogel Network in a Porous Resin MatrixHydrogel Network in a Porous Resin Matrix a study for chromatographic applications
2 THEORY
19
The overall polymerization process in the case of free radical polymerization involves
four different reaction steps:
1. Initiation
2. Propagation
3. Chain transfer
4. Termination
The initiation reaction produces free radicals: this can happen by thermal degradation of
the monomer, which can be induced by temperature (but may cause unwanted reactions
on rare occasions), or by addition of a suitable initiator. It is common practice to use this
second method to avoid undesired reactions that could reduce the purity of the final
product. Radical initiators are characterized by a bond that can be cleaved
homolytically, splitting the molecule in two, often identical, radicals. For most initiators,
this reaction can be started by either an increase in temperature or UV irradiation,
depending on the nature of the initiator.
Thermally activated initiators are generally either peroxides (such as APS or KPS) or
diazocompounds (such as AIBN): the molecular structure of the initiators used in this
work is shown in Figure 2-4
Figure 2-4: initiators used in this work: APS (left) and AIBN (right)
For an initiator to be considered suitable for a particular polymerization reaction, two
conditions must be met:
1. The dissociation temperature of the initiator must be lower than that at which
the monomer degrades.

POLITECNICO DI MILANOPOLITECNICO DI MILANOPOLITECNICO DI MILANOPOLITECNICO DI MILANO
Faculty of Engineering of Industrial Processes Course of Materials and Nanotechnology Engineering
20
2. The free radicals released by dissociation of the initiator must react with the
desired monomer.
3. The characteristic time of initiator dissociation has to be much longer than the
reaction duration, in order to ensure a quite constant radical production all along
the reaction.
As a relevant example, the decomposition of APS is portrayed in Figure 2-5 below
Figure 2-5: dissociation reaction of APS
This reaction can happen either at 60 °C over a few hours or in less than one minute at
room temperature in presence of a promoter such as TEMED [20].
In presence of free radicals, the propagation step can happen, leading to formation of
polymer chains. Most free radical polymerizations are polyaddition reactions, usually
characterized by fast chain kinetics [21]. When the polymerizing monomer is a vinylic
one, such as acrylamide, partial constitutive control is granted by steric hindrance;
however, in absence of external factors, configurational control can only be very limited,
because reactivity of a growing molecule with an active centre is very high [21]:
polymers produced by these reactions will then usually be atactic. As an example, the
propagation reaction of a polyacrylamide chain is portrayed in Figure 2-6

Hydrogel Network in a Porous Resin MatrixHydrogel Network in a Porous Resin MatrixHydrogel Network in a Porous Resin MatrixHydrogel Network in a Porous Resin Matrix a study for chromatographic applications
2 THEORY
21
Figure 2-6: propagation of a polyacrylamide chain
When a bifunctional unit is present in solution with the monofunctional monomer, a
growing chain will also react with such cross-linker molecule, leading to the
incorporation of a pendant double bond along the chain backbone. Such double bond
will react with another active chain, thus forming a bridge between the two chains, i.e. a
cross-linking. By repetition of this event, highly branched chains and eventually
networked macromolecules are formed and these highly interconnected chains are
called cross-linked polymer. When the reactivity of bifunctional and monofunctional
monomer is similar, the spacing between each crosslinking point (i.e. the number of
monomer units between two bifunctional units) will approximately be equal to the
molar ratio between monomer and cross-linker [21]; this approximation is more
accurate when the concentration of cross-linker relative to the monomer content is low,
resulting in a high cross-linking efficiency (cfr. section 2.4).
In chain transfer reactions the active centre of a growing polymer chain is moved to a
different molecule. As a result, the original macroradical stops growing, but a new
radical species is formed, possibly resulting in a new kinetic chain. From a chemical
point of view, chain transfer reactions consist of an hydrogen atom being transferred to
the macroradical from a different molecule, which may be solvent, initiator, monomer
or already formed polymer, as shown in Figure 2-7 which depicts a chain transfer
reaction that characterizes polymerization of LDPE.
POLITECNICO DI MILANOPOLITECNICO DI MILANOPOLITECNICO DI MILANOPOLITECNICO DI MILANO
Faculty of Engineering of Industrial Processes Course of Materials and Nanotechnology Engineering
22
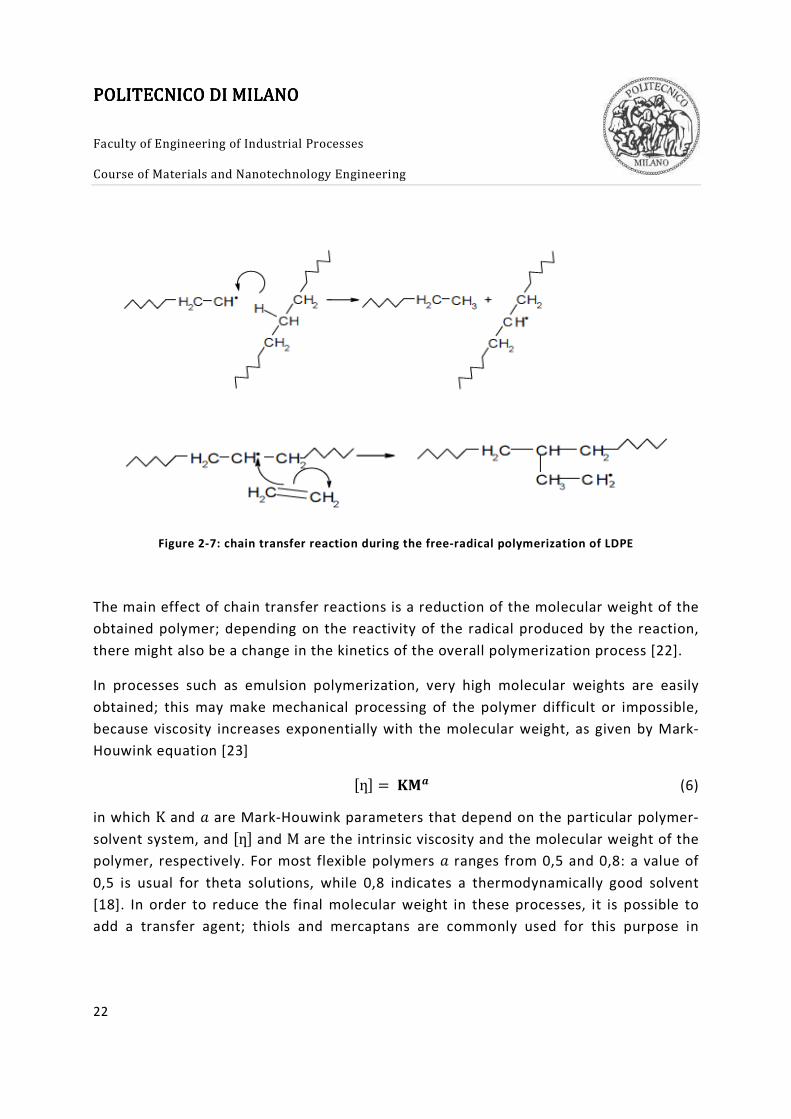
Figure 2-7: chain transfer reaction during the free-radical polymerization of LDPE
The main effect of chain transfer reactions is a reduction of the molecular weight of the
obtained polymer; depending on the reactivity of the radical produced by the reaction,
there might also be a change in the kinetics of the overall polymerization process [22].
In processes such as emulsion polymerization, very high molecular weights are easily
obtained; this may make mechanical processing of the polymer difficult or impossible,
because viscosity increases exponentially with the molecular weight, as given by Mark-
Houwink equation [23]
CƞD = EFG (6)
in which K and I are Mark-Houwink parameters that depend on the particular polymer-
solvent system, and CƞD and M are the intrinsic viscosity and the molecular weight of the
polymer, respectively. For most flexible polymers I ranges from 0,5 and 0,8: a value of
0,5 is usual for theta solutions, while 0,8 indicates a thermodynamically good solvent
[18]. In order to reduce the final molecular weight in these processes, it is possible to
add a transfer agent; thiols and mercaptans are commonly used for this purpose in

Hydrogel Network in a Porous Resin MatrixHydrogel Network in a Porous Resin MatrixHydrogel Network in a Porous Resin MatrixHydrogel Network in a Porous Resin Matrix a study for chromatographic applications
2 THEORY
23
industrial processes [24]. The reaction induced by these compounds is generically
represented by Figure 2-8:
Figure 2-8: chain transfer reaction induced by a generic transfer agent, R-SH
Finally, growth of a polymeric chain ends by a bimolecular termination reaction. Such a
reaction can occur according to two mechanisms: combination, represented in Figure
2-9(top) or disproportionation, described by the lower part of Figure 2-9.
Figure 2-9: bimolecular termination reactions in polymerization of a polyacrylamide chain:
combination (above) and disproportionation (below)
POLITECNICO DI MILANOPOLITECNICO DI MILANOPOLITECNICO DI MILANOPOLITECNICO DI MILANO
Faculty of Engineering of Industrial Processes Course of Materials and Nanotechnology Engineering
24
The two mechanisms are usually coexisting and competitive in a polymerization process,
depending on the process variables [23]. In a combination reaction two unpaired
electrons from two different macroradicals combine to form a single macromolecule
having a molecular weight equal to the sum of the two macroradicals. In a
disproportionation reaction a hydrogen atom is transferred from a macroradical to
another: a terminal double bond forms on the macroradical that lost the hydrogen and
the chain lengths of the two molecules remain unaltered.
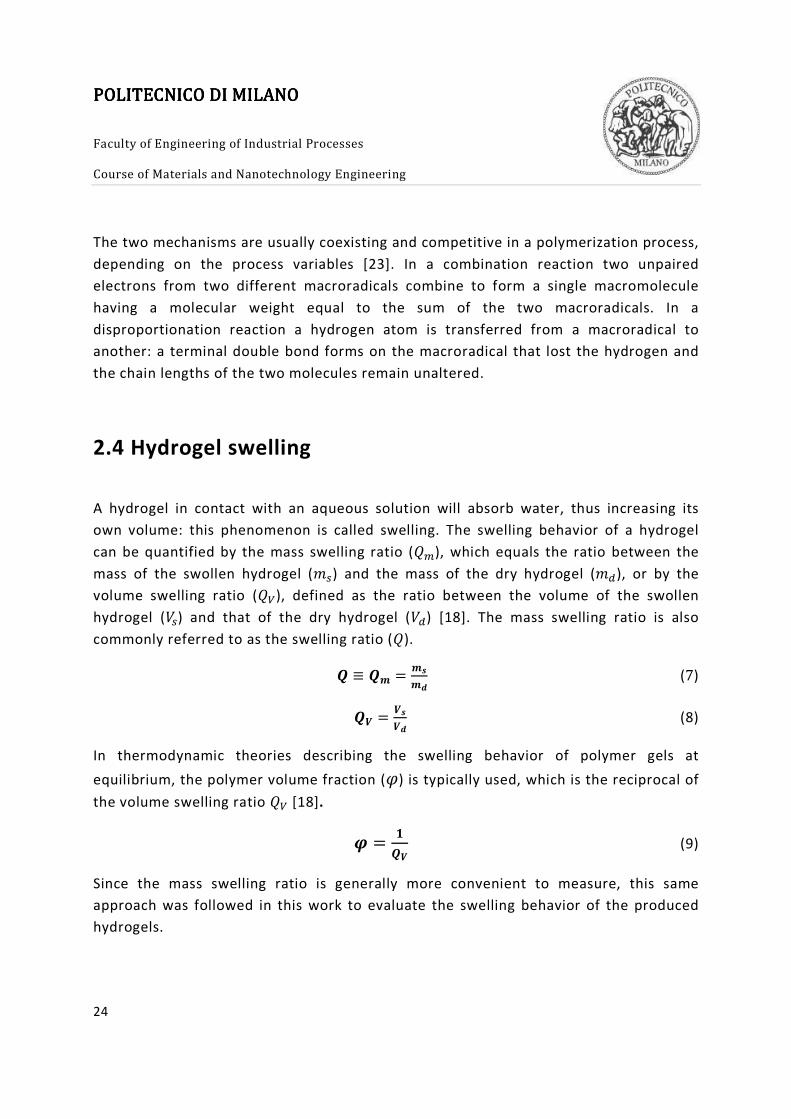
2.4 Hydrogel swelling
A hydrogel in contact with an aqueous solution will absorb water, thus increasing its
own volume: this phenomenon is called swelling. The swelling behavior of a hydrogel
can be quantified by the mass swelling ratio (JK), which equals the ratio between the
mass of the swollen hydrogel (LM) and the mass of the dry hydrogel (LN), or by the
volume swelling ratio (JO), defined as the ratio between the volume of the swollen
hydrogel (PM) and that of the dry hydrogel (PN) [18]. The mass swelling ratio is also
commonly referred to as the swelling ratio (J).
Q ≡ QS = S1ST
(7)
QV = V1VT
(8)
In thermodynamic theories describing the swelling behavior of polymer gels at
equilibrium, the polymer volume fraction (W) is typically used, which is the reciprocal of
the volume swelling ratio JO [18].
X = 6QV
(9)
Since the mass swelling ratio is generally more convenient to measure, this same
approach was followed in this work to evaluate the swelling behavior of the produced
hydrogels.

Hydrogel Network in a Porous Resin MatrixHydrogel Network in a Porous Resin MatrixHydrogel Network in a Porous Resin MatrixHydrogel Network in a Porous Resin Matrix a study for chromatographic applications
2 THEORY
25
If the absorption of water into the hydrogel network is thermodynamically favored, as
discussed in the previous chapter, it must cause an increase of the entropy of the
system; at the same time, there will be an elastic contribution to the chemical potential
caused by the resistance of the polymer chains to uncoiling, which will reduce the
entropy of the system: accordingly, the change in chemical potential of the solvent ∆Y is
given by the difference between the chemical potential of water absorbed into the
hydrogel, Y Z[\, and that of water in the external solvent, YM]\^[_`. More specifically, such
difference of chemical potential is expressed as the sum of mixing (∆YKab) and elastic
contribution (∆Y[\cM`ad) [23] [19], as expressed by the following equation:
∆Y = YZ[\ − YM]\^[_` = ∆YKab + ∆Y[\cM`ad (10)
According to this equation, an equilibrium swelling ratio will be established when the
elastic contribution is balancing the mixing contribution, thus inhibiting further water
absorption.
The swelling behavior of non-ionic polymer networks is fully described by the Flory-
Rehner theory [25]; for ionic polymer networks, such as those of hydrogels under
examination in this work, more complex models exist [26] [27]. These models require
assessment of parameters that need expensive and time consuming experiments to be
measured. On the other hand, they provide useful information such as the cross-linking
efficiency, which is the ratio of molecules of cross-linker actually forming bridges among
macromolecules over the total number of cross-linker molecules reacted in the system
[25]. If this ratio is low, the network has a high number of narrow twists, due to the fact
that many polymer chains are linked to themselves [19]: this renders part of the charges
found on their monomer unit inaccessible to large molecules such as proteins, making
the material less interesting for chromatographic purposes.
In the frame of this research, swelling tests were carried out in order to determine the
equilibrium swelling ratio: these tests consist of letting a hydrogel swell in an aqueous
medium until it reaches an equilibrium volume, which can be measured; furthermore,
they can give qualitative information about the mechanical properties of a hydrogel left
in contact with an aqueous medium for extended periods of time. These data are of
critical importance for the present study, since significant changes in the volume of the
gel can induce severe stresses; depending on the mechanical behavior of both resin and
POLITECNICO DI MILANOPOLITECNICO DI MILANOPOLITECNICO DI MILANOPOLITECNICO DI MILANO
Faculty of Engineering of Industrial Processes Course of Materials and Nanotechnology Engineering
26
gel, this can lead to formation of fragments that could block an HPLC column during
service.
2.5 Column kinetics
Mass transfer kinetics is a determining factor for the performance of columns used in
gas, liquid and supercritical chromatography [14]. Most currently accepted
mathematical models describing mass transfer kinetics inside a HPLC column rely on the
concept of height equivalent to a theoretical plate (HETP). This empirical concept
represents the length of a hypothetical zone in which a phase featuring a nonzero
chemical potential gradient reaches equilibrium with its surroundings: this leads to
models consisting of “equilibrium stages”, or layers, characterized by a certain height.
The HETP can then be defined as the thickness of the layer in which a solution is
equilibrated with the mean concentration of solute contained in the stationary phase
throughout the layer [28].
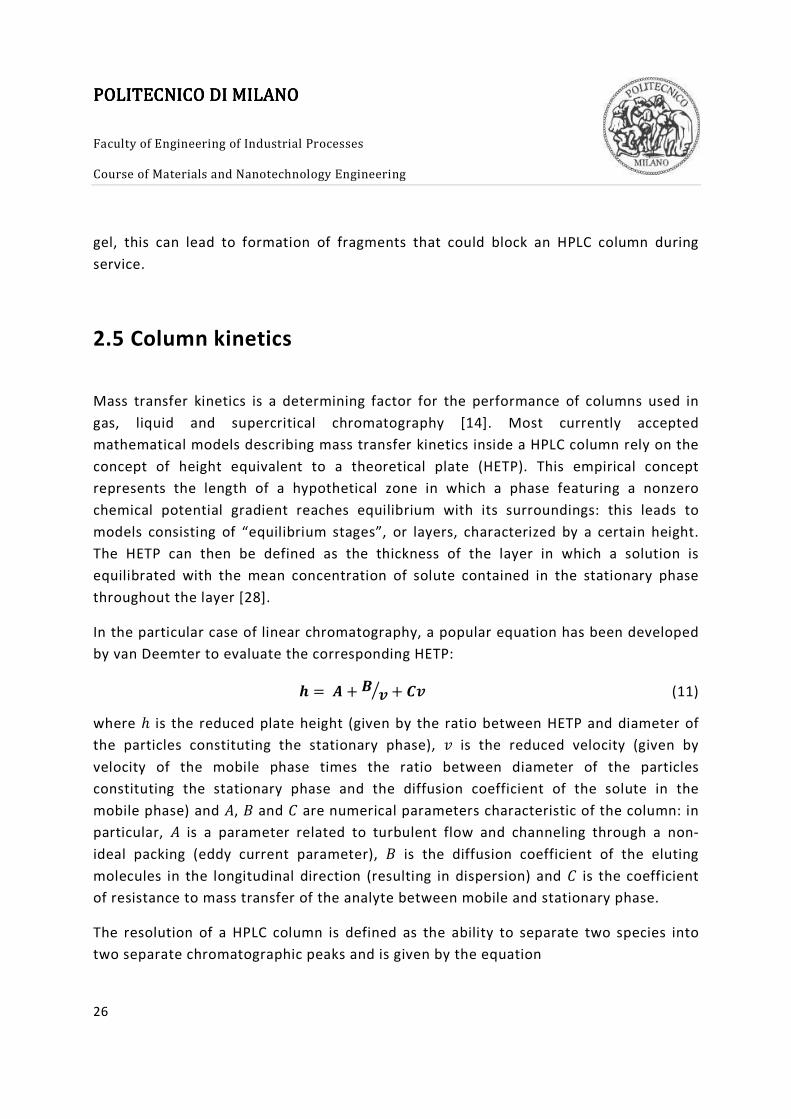
In the particular case of linear chromatography, a popular equation has been developed
by van Deemter to evaluate the corresponding HETP:
e = f + g h/ + ?h (11)
where ℎ is the reduced plate height (given by the ratio between HETP and diameter of
the particles constituting the stationary phase), j is the reduced velocity (given by
velocity of the mobile phase times the ratio between diameter of the particles
constituting the stationary phase and the diffusion coefficient of the solute in the
mobile phase) and k, l and m are numerical parameters characteristic of the column: in
particular, k is a parameter related to turbulent flow and channeling through a non-
ideal packing (eddy current parameter), l is the diffusion coefficient of the eluting
molecules in the longitudinal direction (resulting in dispersion) and m is the coefficient
of resistance to mass transfer of the analyte between mobile and stationary phase.
The resolution of a HPLC column is defined as the ability to separate two species into
two separate chromatographic peaks and is given by the equation

Hydrogel Network in a Porous Resin MatrixHydrogel Network in a Porous Resin MatrixHydrogel Network in a Porous Resin MatrixHydrogel Network in a Porous Resin Matrix a study for chromatographic applications
2 THEORY
27
0 = (2n.o 2n6)6 .(46p4.)⁄ (12)
where rst and rsu and vt and vu are elution times and widths, respectively, of the two
peaks. Resolution is related to HETP, because each plate adds to the precision of the
measurement, so that the number of plates in a column is directly proportional to the
second power of the resolution of a column [29], as expressed by:
w = √xy z{ot
{ | z }~}~pt| (13)
where � is the number of plates (given by the ratio between the length of the column
and HETP), �� is the retention factor (given by the ratio of the time spent by the analyte
and the time spent by a non-adsorbing species inside the column) and � is the selectivity
factor (given by the ratio ��/��).
According to van Deemter equation, an optimal fluid velocity exists at which HETP is
minimized. By differentiating the equation for the velocity and setting the result to zero,
the optimal velocity is found to be:
� = �g ?/ (14)
This optimal velocity is generally rather low, so it is impractical to run a chromatography
cycle at that rate due to low productivities or long analysis times.

POLITECNICO DI MILANOPOLITECNICO DI MILANOPOLITECNICO DI MILANOPOLITECNICO DI MILANO
Faculty of Engineering of Industrial Processes Course of Materials and Nanotechnology Engineering
28

3 Experimental
In this chapter, after a list of all chemicals and instruments involved, a detailed
description of all the experiments carried out in this work is given. Each of the
techniques that were devised and tested is fully illustrated in its own paragraph.

POLITECNICO DI MILANOPOLITECNICO DI MILANOPOLITECNICO DI MILANOPOLITECNICO DI MILANO
Faculty of Engineering of Industrial Processes Course of Materials and Nanotechnology Engineering
30
3.1 Materials
3.1.1 Chemicals
Ammonium persulfate (APS), N,N’-methylenebisacrylamide (MBAA), 2-Acrylamido-2-
methylpropane sulfonic acid (AMPS), N,N,N′,N′-tetramethylethylenediamine (TEMED),
[2-(Acryloyloxy)ethyl] trimethylammonium chloride (ATAC, 80 wt. % in H2O, with 600
ppm of monomethyl ether hydroquinone as inhibitor), Acrylamide (AA), Divinylbenzene
(DVB), Potassium persulfate (KPS), Styrene (Sty), Sulfuric acid (H2SO4), Sodium hydroxide
(NaOH), Sodium chloride (NaCl), Magnesium chloride (MgCl2), Hydrochloric acid (HCl),
Safranin O, Ethanol (EtOH), Sorbitan monolaurate (SPAN 20), Sorbitan monopalmitate
(SPAN 40), Sodium phosfate monobasic (NaH2PO4), Sodium phosfate dibasic (Na2HPO4),
Sodium dodecyl sulphate (SDS), Sodium bicarbonate (NaHCO3), Nitric acid (HNO3), and
Potassium nitrate (KNO3) were purchased from Sigma-Aldrich; Silicone oil 350 from
SILITECH SA; EXXSOL D100S from EXXONMobil Chemical; Titrisol 0.1 M hydrocloric acid
(titrisol HCl), and Titrisol 0.1 M Sodium hydroxide (titrisol NaOH) from Merck.
All water used in any process was deionized, unless otherwise specified. Water used for
polymerization reaction was also stripped of oxygen with nitrogen jet for 30 minutes.
3.1.2 Equipment
• Mettler Toledo LabMax 4 liters jacket laboratory automatic reactor
• Mettler Toledo AT250 balance
• Mettler Toledo PM4000 balance
• Metrohm 665 Dosimat (titrator)
• Vacuum drying oven Heraeus Vacutherm serie VT 6060 M
• Microfluidics Corporation HC5000 Homogenizer (microchannel)

Hydrogel Network in a Porous Resin MatrixHydrogel Network in a Porous Resin MatrixHydrogel Network in a Porous Resin MatrixHydrogel Network in a Porous Resin Matrix a study for chromatographic applications
3 EXPERIMENTAL
31
• Bischoff HPLC compact pump (offline pump)
• Agilent 1100 Series HPLC equipped with G1322A Degasser, G1311A Quat Pump,
G1313A Autosampler, G1316A Thremostatted Column Compartment and
G1314A Variable Wavelength Detector (HPLC)
• Varian Cary 4000 UV-Vis spectrophotometer
• GE Healthcare Tricorn HPLC columns 50 x 5.0 mm, glass
• GE Healthcare Tricorn HPLC columns 100 x 5.0 mm, glass
• Metrohm Metrosep RP Trap 1 HPLC columns 50 x 4.0 mm, PEEK
3.1.3 Column Geometry
All columns used in this research were made out of PEEK or of glass. PEEK columns were
used whenever the packed material needed to stay at high temperature for a long
period of time; otherwise glass columns were preferred because they allowed for visual
inspection of the packed material.
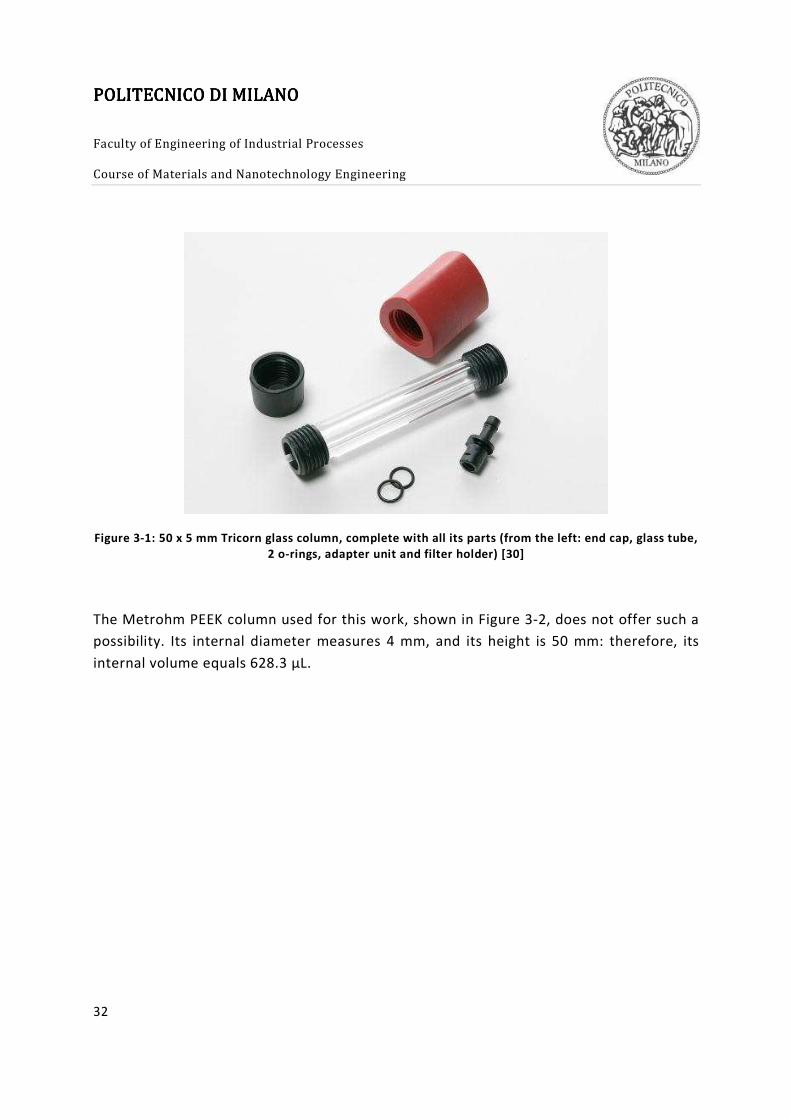
An example of a Tricorn glass column is shown in Figure 3-1. Along with the column
itself, the necessary parts for its use are displayed as well. Tricorn columns are available
in many sizes, although they all have an internal diameter of 5 mm; in this thesis, only
columns measuring either 50 or 100 mm in height were used. However, it is important
to note that Tricorn columns have a very long end cap: this can be used to reduce the
actual height of the column when needed, by screwing the filter holder in for up to 15
mm.
POLITECNICO DI MILANOPOLITECNICO DI MILANOPOLITECNICO DI MILANOPOLITECNICO DI MILANO
Faculty of Engineering of Industrial Processes Course of Materials and Nanotechnology Engineering
32
Figure 3-1: 50 x 5 mm Tricorn glass column, complete with all its parts (from the left: end cap, glass tube,
2 o-rings, adapter unit and filter holder) [30]
The Metrohm PEEK column used for this work, shown in Figure 3-2, does not offer such a
possibility. Its internal diameter measures 4 mm, and its height is 50 mm: therefore, its
internal volume equals 628.3 µL.

Hydrogel Network in a Porous Resin MatrixHydrogel Network in a Porous Resin MatrixHydrogel Network in a Porous Resin MatrixHydrogel Network in a Porous Resin Matrix a study for chromatographic applications
3 EXPERIMENTAL
33
Figure 3-2: 50 x 4 mm Metrohm Metrosep PEEK column, with end caps and stoppers at both ends [31]
As an alternative to the external stoppers shown in Figure 3-2, it is possible to use internal
PEEK plugs to seal the column: this is useful when the column needs to be closed while
staying at high temperatures for a long period of time, because the external stoppers are
not made of PEEK and cannot bear such conditions.
3.2 Preparation and preliminary experiments
3.2.1 Resin preparation
600mL of PS-DVB resin were produced with a 5 steps process:

POLITECNICO DI MILANOPOLITECNICO DI MILANOPOLITECNICO DI MILANOPOLITECNICO DI MILANO
Faculty of Engineering of Industrial Processes Course of Materials and Nanotechnology Engineering
34
1. Core particle production: 1250 mL of 0.2% weight solution of sodium dodecyl
sulfate were charged in the Labmax reactor, trying to avoid foaming as much as
possible. The solution was then heated up to 70 °C, after which 10 mL of a 2% KPS
aqueous solution were added. After this, the feed started: through the Labmax
membrane pump, 625 mL of a 80% styrene in divinylbenzene concentrated
solution mixed with 550 mL of a 0.2% sodium dodecyl sulfate aqueous solution
were fed to the reactor, while 100 mL of a 2% KPS aqueous solution were fed
through a VitFit syringe pump over 14 hours.
2. Shell production: the “core particle” latex solution was diluted in 1336 mL of
water and then charged into the Labmax reactor. Again, the solution was heated
up to 70 °C, then 50 mL of a 6.5% KPS solution were added. Afterwards, 277.4 g
of a 99% concentrated solution of styrene in divinylbenzene were fed through the
Labmax membrane pump over 11 hours, while 100 mL of a 3.5% KPS aqueous
solution were added through the VitFit syringe pump at 10 mL/h.
3. Swelling: 2 L of the latex were then collected in a suitable container and left
under gentle stirring (45 rpm) while 60 mL of a solution consisting of 48 mL of
styrene, 12 mL of divinylbenzene and 0.6 g AIBN were dripping into the latex
solution.
4. Aggregation: the latex was then aggregated with a high-shear microchannel
device operating at an overpressure of 168 bar. The latex was first diluted with
4135 mL of a 1.3 mM MgCl2 solution and then carefully dripped at the inlet of
said pump, so that the channel would not run empty at any given time, and the
aggregated resin was collected as a slurry at the other end of the pump. The
process lasted only a few minutes.
5. Post-polymerization: finally the slurry was left under gentle stirring in a heated
tank at 70 °C for 5 hours. More than 13 L of such mixture were collected; the final
volume was reduced to approximately 3.6 L of resin at 18.6% of dry content by
decantation.
All particles with a diameter larger than 200 µm or smaller than 45 µm were removed by
multiple sieving cycles. Light scattering analysis and mercury intrusion were run on the
resin to measure particle size distribution and porosity of the final material. Also, a few
Hydrogel Network in a Porous Resin MatrixHydrogel Network in a Porous Resin MatrixHydrogel Network in a Porous Resin MatrixHydrogel Network in a Porous Resin Matrix a study for chromatographic applications
3 EXPERIMENTAL
35
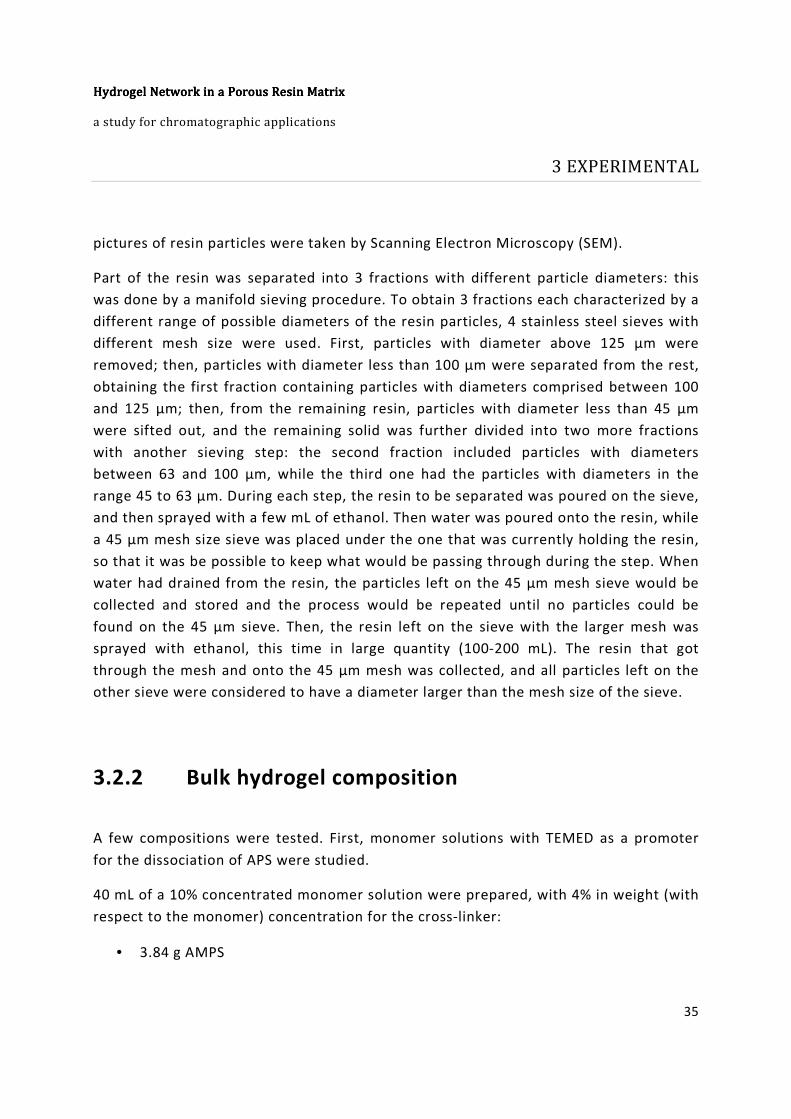
pictures of resin particles were taken by Scanning Electron Microscopy (SEM).
Part of the resin was separated into 3 fractions with different particle diameters: this
was done by a manifold sieving procedure. To obtain 3 fractions each characterized by a
different range of possible diameters of the resin particles, 4 stainless steel sieves with
different mesh size were used. First, particles with diameter above 125 µm were
removed; then, particles with diameter less than 100 µm were separated from the rest,
obtaining the first fraction containing particles with diameters comprised between 100
and 125 µm; then, from the remaining resin, particles with diameter less than 45 µm
were sifted out, and the remaining solid was further divided into two more fractions
with another sieving step: the second fraction included particles with diameters
between 63 and 100 µm, while the third one had the particles with diameters in the
range 45 to 63 µm. During each step, the resin to be separated was poured on the sieve,
and then sprayed with a few mL of ethanol. Then water was poured onto the resin, while
a 45 µm mesh size sieve was placed under the one that was currently holding the resin,
so that it was be possible to keep what would be passing through during the step. When
water had drained from the resin, the particles left on the 45 µm mesh sieve would be
collected and stored and the process would be repeated until no particles could be
found on the 45 µm sieve. Then, the resin left on the sieve with the larger mesh was
sprayed with ethanol, this time in large quantity (100-200 mL). The resin that got
through the mesh and onto the 45 µm mesh was collected, and all particles left on the
other sieve were considered to have a diameter larger than the mesh size of the sieve.
3.2.2 Bulk hydrogel composition
A few compositions were tested. First, monomer solutions with TEMED as a promoter
for the dissociation of APS were studied.
40 mL of a 10% concentrated monomer solution were prepared, with 4% in weight (with
respect to the monomer) concentration for the cross-linker:
• 3.84 g AMPS
POLITECNICO DI MILANOPOLITECNICO DI MILANOPOLITECNICO DI MILANOPOLITECNICO DI MILANO
Faculty of Engineering of Industrial Processes Course of Materials and Nanotechnology Engineering
36
• 0.16 g MBAm
• 0.04 g APS
• 34.00 g H2O
• 0.04 g TEMED
The solution was stirred for 30 minutes to ensure complete dissolution and
homogenization.
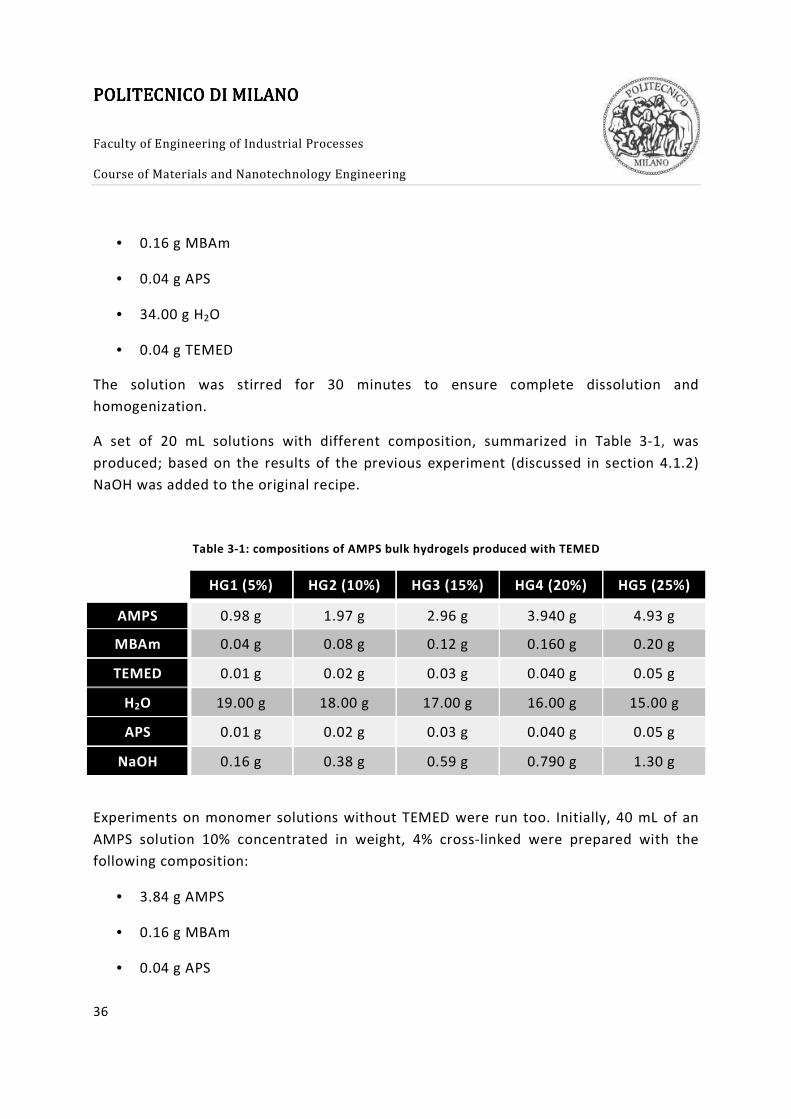
A set of 20 mL solutions with different composition, summarized in Table 3-1, was
produced; based on the results of the previous experiment (discussed in section 4.1.2)
NaOH was added to the original recipe.
Table 3-1: compositions of AMPS bulk hydrogels produced with TEMED
HG1 (5%) HG2 (10%) HG3 (15%) HG4 (20%) HG5 (25%)
AMPS 0.98 g 1.97 g 2.96 g 3.940 g 4.93 g
MBAm 0.04 g 0.08 g 0.12 g 0.160 g 0.20 g
TEMED 0.01 g 0.02 g 0.03 g 0.040 g 0.05 g
H2O 19.00 g 18.00 g 17.00 g 16.00 g 15.00 g
APS 0.01 g 0.02 g 0.03 g 0.040 g 0.05 g
NaOH 0.16 g 0.38 g 0.59 g 0.790 g 1.30 g
Experiments on monomer solutions without TEMED were run too. Initially, 40 mL of an
AMPS solution 10% concentrated in weight, 4% cross-linked were prepared with the
following composition:
• 3.84 g AMPS
• 0.16 g MBAm
• 0.04 g APS

Hydrogel Network in a Porous Resin MatrixHydrogel Network in a Porous Resin MatrixHydrogel Network in a Porous Resin MatrixHydrogel Network in a Porous Resin Matrix a study for chromatographic applications
3 EXPERIMENTAL
37
• 34.00 g H2O
The solution was stirred for 15 minutes, then heated to 60 °C and kept at that
temperature for 5 hours. While in the oven, the glass vials containing the solution were
kept closed, and their lids were sealed with parafilm to prevent reactions with oxygen
from the atmosphere. This procedure was followed every time a monomer solution kept
inside a vial needed to polymerize in an oven.
A set of solutions with different monomer concentrations was produced once again. The
composition of each of those 20 mL solutions is listed in Table 3-2:
Table 3-2: composition of AMPS bulk hydrogels produced without TEMED
HG1 (5%) HG2 (10%) HG3 (15%) HG4 (20%) HG5 (25%)
AMPS 0.98 g 1.97 g 2.96 g 3.940 g 4.93 g
MBAm 0.04 g 0.08 g 0.12 g 0.160 g 0.20 g
H2O 19.00 g 18.00 g 17.00 g 16.00 g 15.00 g
APS 0.01 g 0.02 g 0.03 g 0.04 g 0.05 g
The production of different kinds of hydrogel was also attempted. A positively charged
hydrogel, made of AETAC monomer cross-linked with MBAA was sought. As a first
experiment, 20 mL of an AETAC monomer solution 10% concentrated in weight and 4%
cross-linked were prepared with the following composition:
• 2.50 g AETAC (80%)
• 0.08 g MBAA
• 0.02 g APS
• 17.50 g H2O
The solution was stirred in a 30 mL glass vial for 30 minutes and stored in an oven at 60
°C for 24 hours.
POLITECNICO DI MILANOPOLITECNICO DI MILANOPOLITECNICO DI MILANOPOLITECNICO DI MILANO
Faculty of Engineering of Industrial Processes Course of Materials and Nanotechnology Engineering
38
The experiment was repeated for a monomer solution 20% concentrated in weight, with
the following composition:
• 4.92 g AETAC (80%)
• 0.08 g MBAA
• 0.02 g APS
• 15.11 g H2O
As in the aforementioned case, the solution was stored in a 30 mL sealed glass vial,
stirred for 30 minutes and put into an oven at 60 °C for 24 hours.
The first AETAC experiment was repeated, this time with salt present in solution along
with the other chemicals, leading to the following mixture:
• 2.50 g AETAC (80%)
• 0.079 g MBAA
• 0.02 g APS
• 17.51 g H2O
• 0.175 g NaCl
After 30 minutes of stirring in a 30 mL glass vial, the solution was put in an oven for 5
hours at 60 °C.
The experiment was repeated for similar solutions with lower monomer concentration.
Their exact compositions are listed in Table 3-3:
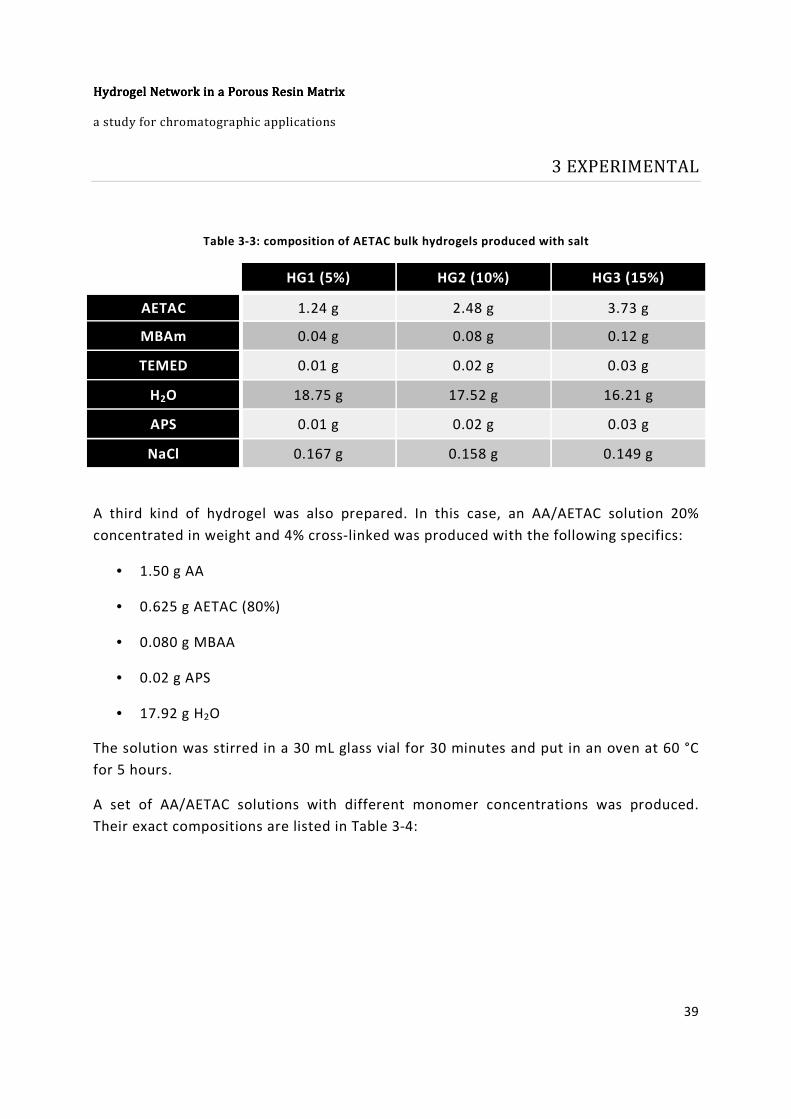
Hydrogel Network in a Porous Resin MatrixHydrogel Network in a Porous Resin MatrixHydrogel Network in a Porous Resin MatrixHydrogel Network in a Porous Resin Matrix a study for chromatographic applications
3 EXPERIMENTAL
39
Table 3-3: composition of AETAC bulk hydrogels produced with salt
HG1 (5%) HG2 (10%) HG3 (15%)
AETAC 1.24 g 2.48 g 3.73 g
MBAm 0.04 g 0.08 g 0.12 g
TEMED 0.01 g 0.02 g 0.03 g
H2O 18.75 g 17.52 g 16.21 g
APS 0.01 g 0.02 g 0.03 g
NaCl 0.167 g 0.158 g 0.149 g
A third kind of hydrogel was also prepared. In this case, an AA/AETAC solution 20%
concentrated in weight and 4% cross-linked was produced with the following specifics:
• 1.50 g AA
• 0.625 g AETAC (80%)
• 0.080 g MBAA
• 0.02 g APS
• 17.92 g H2O
The solution was stirred in a 30 mL glass vial for 30 minutes and put in an oven at 60 °C
for 5 hours.
A set of AA/AETAC solutions with different monomer concentrations was produced.
Their exact compositions are listed in Table 3-4:

POLITECNICO DI MILANOPOLITECNICO DI MILANOPOLITECNICO DI MILANOPOLITECNICO DI MILANO
Faculty of Engineering of Industrial Processes Course of Materials and Nanotechnology Engineering
40
Table 3-4: compositions of AA/AETAC bulk hydrogels
HG1 (5%) HG2 (15%) HG3 (20%)
AETAC 0.259 g 0.942 g 1.289 g
AA 0.75 g 2.26 g 2.99 g
MBAm 0.04 g 0.12 g 0.16 g
TEMED 0.01 g 0.03 g 0.04 g
H2O 18.97 g 16.89 g 15.91 g
APS 0.01 g 0.03 g 0.04 g
3.2.3 Titration of the resin
A four-steps procedure was followed in order to titrate the PS-DVB resin.
1. Flush the column with 60 mL of a 1 M HCl solution over 1 hour.
2. Flush the column with 60 mL of distilled water over 1 hour.
3. Circulate 25 mL of 0.5 M NaCl/0.05 M NaOH aqueous solution through the
column for 2 hours. The solution was circulated thoroughly through the column
to ensure that all sulphonic groups reacted.
4. Flush the column with 25 mL of distilled water over 25 minutes, and collect the
liquid that comes out (this includes the solution that was previously circulating
through the column).
The solution obtained this way was then titrated by a 0.1 M HCl solution. A Dosimat 665
titrator by Metrohm was used with the cell under nitrogen atmosphere maintained by
continuous flow of water-saturated nitrogen.
The titrator consists of a precise pump (able to control injected volume down to 1 µL)

Hydrogel Network in a Porous Resin MatrixHydrogel Network in a Porous Resin MatrixHydrogel Network in a Porous Resin MatrixHydrogel Network in a Porous Resin Matrix a study for chromatographic applications
3 EXPERIMENTAL
41
connected to a computer: the control software allows the operator to input number of
injections, their volume and time for equilibration between injections as well; the same
computer is also connected to a pH-meter and an Electro Conductivity-meter, so that
both pH and electrical conductivity are measured and recorded on a text file at the end
of each equilibration step and before each new injection. The titrator is completed by a
magnetic stirrer and a set of glass tanks, each having different volumetric capacities, but
all characterized by a truncated cone geometry; the magnetic stirrer has a steel rod
protruding upwards from its back, to which is bound a plastic disc with five round holes,
so that the disc is free to move vertically, up and down along the rod; the disc has also a
metallic jaw below it that can open up to a 75° angle.
The solution to be titrated goes into the tank with the appropriate volume; these tanks
are made so that a ring with two protrusions is fixed at their top, in a way that they can
be fixed to the bored disc thanks to the jaw that closes on it and is locked in position by
the protrusions on the tank. The disc has to be lowered down as far as it can without
touching the surface of the stirrer. The magnet may be inserted in the tank by letting it
through one of the holes, then the stirrer can be turned on; the central hole in the disc
is for the inlet of the pump, a tube that lets drop of the titrating solution in the tank:
this tube is connected to a bottle of the appropriate solution through the pump of the
titrator, which regulates the rate at which the solution must be added in the tank,
according to the data that were previously chosen and written on the program by the
operator. The electrodes of both pH-meter and EC meter are fitted in the holes so that
they can touch the solution to be titrated, but not the walls of the tank. Finally, a tube
connected to an external source of nitrogen must be connected to a glass coupling
(which ends in a shape that fits the holes perfectly); a similar coupling that lets the gas
out is fit in the last hole. When everything is set up, the operator may give the necessary
input for the computer to start the procedure.
When the procedure is over, the data recorded on the computer can be interpreted, and
possibly plotted on a diagram (either pH or electrical conductivity vs injected volume). In
this work, the diagram was merely drawn to check if there were significant deviations
from the expected result, meaning discontinuities along the curve; other than that, the
only meaningful information for the purpose of this research, is the injected volume at
which neutrality is achieved in the solution (which is a single point in such a diagram).
This volume, given that the concentration of the titrating solution injected is extremely

POLITECNICO DI MILANOPOLITECNICO DI MILANOPOLITECNICO DI MILANOPOLITECNICO DI MILANO
Faculty of Engineering of Industrial Processes Course of Materials and Nanotechnology Engineering
42
precise, can directly be converted in an amount of moles of charged groups in the
solution to be titrated; therefore, for neutrality to be achieved at that point, the titrated
solution must contain the same molar amount of ions.
The aforementioned Dosimat 665 was set up so that 20 mL were injected in 400 steps of
50 µL each. The accuracy of the measurements given by the titrator was increased
implementing a custom LabView program; under its supervision, pH and conductivity of
the solution were measured until the values of pH within a given time interval did not
exceed a given range of values. For the purpose of this thesis, the program was set to
keep the titrator measuring until the pH values did not vary more than 0.02 for 2
seconds. As no major mass transfer resistances exist in the protocols applied in this
work, this procedure was considered accurate enough for all titrations carried out in this
work.
3.2.4 Functionalization of the resin
300 mL of the plain (unfunctionalized) resin suspension were dispersed in 500 mL of
H2SO4 (concentrated); after 24 hours of stirring at 80 °C the suspension was poured into
a 2 L volumetric cylinder and diluted with 1200 mL of distilled water. After some hours
the resin was resting on the bottom of the volumetric column, so it was possible to
decant most of the supernatant and repeat the dilution process until the pH of the
supernatant was neutral. About 400 mL of resin were collected.
A Stone-Carta titration was run on a column filled with sulfonated resin. The exact same
procedure that was described for the titration of the standard PS-DVB resin in section
3.2.3 was followed.
3.2.5 Swelling Tests
Nine solutions were prepared in order to produce the gels to be tested. Their exact
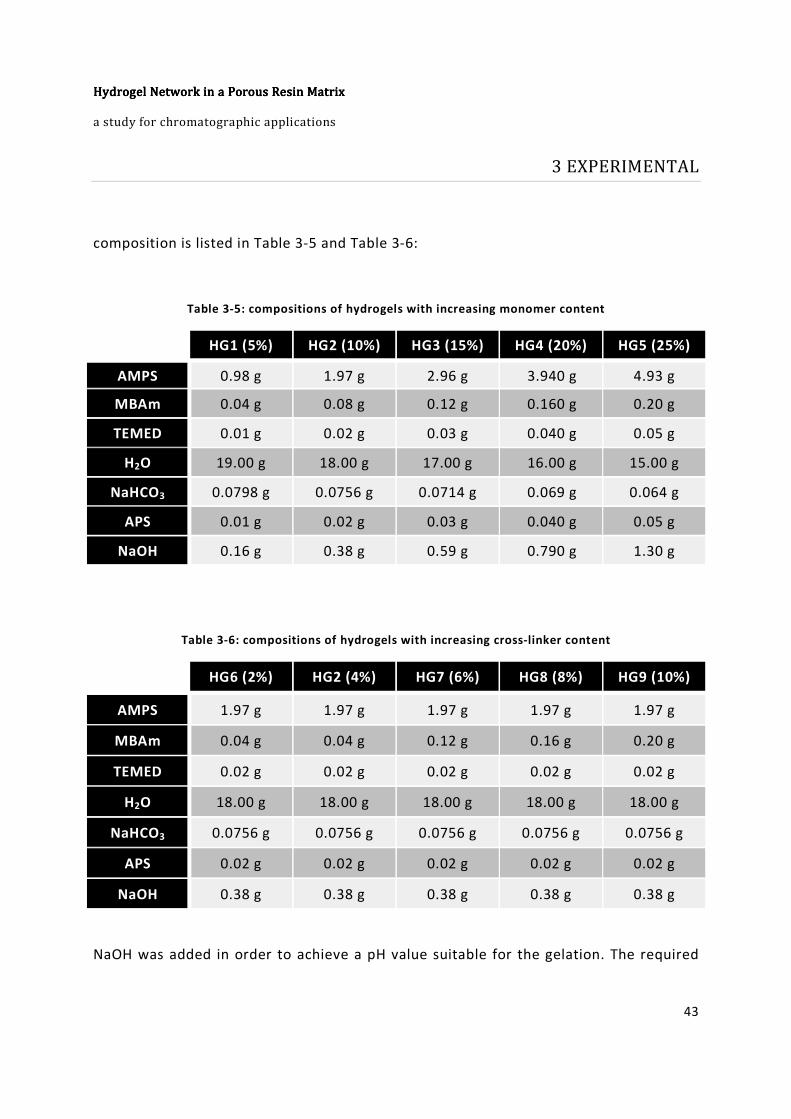
Hydrogel Network in a Porous Resin MatrixHydrogel Network in a Porous Resin MatrixHydrogel Network in a Porous Resin MatrixHydrogel Network in a Porous Resin Matrix a study for chromatographic applications
3 EXPERIMENTAL
43
composition is listed in Table 3-5 and Table 3-6:
Table 3-5: compositions of hydrogels with increasing monomer content
HG1 (5%) HG2 (10%) HG3 (15%) HG4 (20%) HG5 (25%)
AMPS 0.98 g 1.97 g 2.96 g 3.940 g 4.93 g
MBAm 0.04 g 0.08 g 0.12 g 0.160 g 0.20 g
TEMED 0.01 g 0.02 g 0.03 g 0.040 g 0.05 g
H2O 19.00 g 18.00 g 17.00 g 16.00 g 15.00 g
NaHCO3 0.0798 g 0.0756 g 0.0714 g 0.069 g 0.064 g
APS 0.01 g 0.02 g 0.03 g 0.040 g 0.05 g
NaOH 0.16 g 0.38 g 0.59 g 0.790 g 1.30 g
Table 3-6: compositions of hydrogels with increasing cross-linker content
HG6 (2%) HG2 (4%) HG7 (6%) HG8 (8%) HG9 (10%)
AMPS 1.97 g 1.97 g 1.97 g 1.97 g 1.97 g
MBAm 0.04 g 0.04 g 0.12 g 0.16 g 0.20 g
TEMED 0.02 g 0.02 g 0.02 g 0.02 g 0.02 g
H2O 18.00 g 18.00 g 18.00 g 18.00 g 18.00 g
NaHCO3 0.0756 g 0.0756 g 0.0756 g 0.0756 g 0.0756 g
APS 0.02 g 0.02 g 0.02 g 0.02 g 0.02 g
NaOH 0.38 g 0.38 g 0.38 g 0.38 g 0.38 g
NaOH was added in order to achieve a pH value suitable for the gelation. The required

POLITECNICO DI MILANOPOLITECNICO DI MILANOPOLITECNICO DI MILANOPOLITECNICO DI MILANO
Faculty of Engineering of Industrial Processes Course of Materials and Nanotechnology Engineering
44
amount of it was estimated by first calculating the number of moles of monomer
present in the solution, and then calculating the weight of the same number of moles of
NaOH plus a 15% of excess. Once the solutions were prepared and the pH was known to
be in the desired range, all the nine vials containing each solution were left for 10
minutes to rest at room temperature.
All the gels obtained had very similar initial volumes. All of them were removed from
their respective vials and put in 50 mL beakers containing a phosphate buffer (15.5 mM
NaH2PO4, 9.5 mM Na2HPO4). They were left in the beakers, sealed with Parafilm, and
periodically their weight was measured, to assess whether they had achieved
equilibrium volume or not. Whenever one sample appeared to be about to fill a beaker,
it would be moved to a larger container, in order to allow further expansion.
3.3 Solution soaking
10 mL of resin suspension were poured in a monomer solution with the following
composition:
• 3.94 g AMPS
• 0.16 g MBAA
• 16.00 g H2O
• 0.04 g APS
The resin was then sieved with two different filters: one was a standard paper filter, the
other one was a 20 µm polymer mesh.
The paper filter was placed upon a glass funnel leading to a 100 mL jar, in which the
excess solution could be collected. Half of the wet resin was poured onto it and let filter
through. After 30 minutes, the final, wet slurry was removed from the filter with a
stainless steel spatula and placed in a 100 mL glass jar.
As for the polymer mesh, it was placed upon a Buchner ceramic funnel, which was set on

Hydrogel Network in a Porous Resin MatrixHydrogel Network in a Porous Resin MatrixHydrogel Network in a Porous Resin MatrixHydrogel Network in a Porous Resin Matrix a study for chromatographic applications
3 EXPERIMENTAL
45
a 500 mL waste bottle connected to a vacuum pump. The mesh was wetted with ethanol
and then the vacuum pump was set on 500 mbar. Finally, the remaining resin was
poured into the funnel, spreading all over the polymer mesh, so that an homogenous
layer as thin as possible (roughly 2 mm) could be obtained. After a few seconds the dry
resin was collected and put into a 100 mL glass jar.
Both jars were sealed and put in an oven at 60 °C for 5 hours. After that, the resin was
dispersed in a solution of water and ethanol: this was done by spraying ethanol on the
dry resin, and then pouring water into the jar.
Light scattering analysis was run on the samples. Large aggregates were sieved out with
a 125 µm opening stainless steel sieve, then the samples were once more subjected to
light scattering analysis. This was repeated until the particle size distribution obtained
by light scattering confirmed that no more aggregates were present in the samples.
Afterwards, the resin was packed in a column. In order to avoid formation of air bubbles
it was necessary to wash the column with ethanol first.
For the packing, a 20% ethanol solution was let through the column with an increasing
flow rate, to avoid abrupt increases in stress that could cause critical failure in the
material:
1. 15 minutes at 1 mL/min
2. 10 minutes at 2 mL/min
3. 10 minutes at 3.5 mL/min
4. 5 minutes at 5 mL/min
The column was then titrated, following the procedure described in section 3.2.3.
A similar procedure was also followed with sulfonated PS-DVB resin. 10 mL of
functionalized resin were soaked in a 20% weight concentrated AETAC solution (with
15% weight concentration of cross-linker with respect to the monomer) with the
following composition:
• 4.25 g AETAC
POLITECNICO DI MILANOPOLITECNICO DI MILANOPOLITECNICO DI MILANOPOLITECNICO DI MILANO
Faculty of Engineering of Industrial Processes Course of Materials and Nanotechnology Engineering
46
• 0.60 g MBAA
• 0.02 g APS
• 15.74 g H2O
• 0.175 g NaCl
Again, about half of the resin was poured and sifted on a paper filter placed upon a glass
funnel leading into a 100 mL glass jar, while the rest was sifted on a 20 µm opening
polymer mesh that was previously wetted with ethanol and placed upon a Buchner
ceramic funnel, which was set on a 500 mL waste bottle connected to a vacuum pump.
Once properly dried, both samples were collected and stored into glass jars that were
put in an oven at 60 °C for 5 hours.
Afterwards, each sample was dispersed in 100 mL of 20% ethanol solution. Both samples
were analyzed by static light scattering to verify that no aggregation of resin particles
took place during polymerization.
The samples were then packed into two 0.5 mL glass HPLC columns, which were
previously washed with ethanol. The packings of both columns were titrated to evaluate
the R-NMe3+
groups. The titration procedure described in section 3.2.3 had to be
modified as follows to make it suitable for detecting positively charged groups:
1. Flush the column with 60 mL of a 1 M NaOH solution over 1 hour.
2. Flush the column with 60 mL of distilled water over 1 hour.
3. Circulate 25 mL of 0.5 M NaCl/0.05 M HCl aqueous solution through the column
for 2 hours.
4. Flush the column with 25 mL of distilled water over 25 minutes, and collect the
liquid that comes out (this includes the solution that was previously circulating
through the column).
Afterwards, both columns were cleaned with a 1 mL/min flow of 20% ethanol solution
for 20 minutes and stored.

Hydrogel Network in a Porous Resin MatrixHydrogel Network in a Porous Resin MatrixHydrogel Network in a Porous Resin MatrixHydrogel Network in a Porous Resin Matrix a study for chromatographic applications
3 EXPERIMENTAL
47
3.4 Oil dispersion
The procedure for this technique starts off in a way very similar to that of the solution
soaking technique. First, a monomer solution with the following composition was
prepared.
• 39.40 g AMPS
• 1.60 g MBAA
• 160.00 g H2O
• 0.20 g APS
Once all chemicals were fully dissolved, 50 mL of plain PS-DVB resin suspension were
poured into the mixture while it was still being stirred.
After 15 minutes, the excess solution could be sifted out. A 10 µm polymer mesh was
placed upon a Buchner ceramic funnel, which was set on a 500 mL waste bottle
connected to a vacuum pump. The mesh was wetted with ethanol, and then the vacuum
pump was set to 200 mbar.
The remaining resin was poured into the funnel, spreading all over the polymer mesh, so
that a homogenous layer as thin as possible (about 2 mm thick) could be obtained. In a
few seconds the resin became dry, so it was collected and put in a 100 mL glass jar.
The sample was then dispersed in a 250 mL beaker, filled with 160 mL of silicone oil: the
resin formed large aggregates of irregular shape. The beaker was placed inside a second
larger beaker (500 mL) containing 100 mL of silicon oil; this second beaker was in turn
placed on a heating plate, and equipped with an overhead stirrer. The head of the stirrer
was then lowered so that it could submerge in the suspension and the rotor was set at
65 rpm. As soon as the resin seemed reasonably dispersed (no aggregate larger than 2
mm in diameter could be spotted), the heating plate was set to 60 °C, and a
thermometer was put in the silicone oil inside the larger beaker, so that the actual
temperature of the system could be checked during the process. After the desired
temperature was reached the sample was kept stirring for 5 hours.

POLITECNICO DI MILANOPOLITECNICO DI MILANOPOLITECNICO DI MILANOPOLITECNICO DI MILANO
Faculty of Engineering of Industrial Processes Course of Materials and Nanotechnology Engineering
48
Afterwards, the suspension was sieved on a polymer mesh (25 µm mesh size) placed
upon a ceramic funnel sitting on top of a 500 mL glass bottle connected to a vacuum
pump. An underpressure of up to 300 mbar was used to accelerate the leaching of the
oil. To remove remaining traces of oil left on the resin, 1.6 L of 10% SPAN 20 in water
were used to wash it. This was done by carefully pouring said surfactant solution over
the resin, while it was still on the polymer mesh, with a weaker vacuum pressure
(roughly 150 mbar), taking care not to let the resin run dry.
Light scattering analysis was run on the sample. The material was put in a centrifuging
bottle (using water and ethanol to remove it from the surfaces it was sticking on) and
then subjected to 3 subsequent centrifuging cycles:
• Add 10% SPAN 20 so that the bottle contains around 60% of SPAN 20 solution
(the rest being resin, water and ethanol) and disperse on a shaking plate at 100
rpm for 1 hour.
• Centrifuge at 4000 rpm for 20 minutes.
• Let the bottle rest for at least 3 hours.
• Decant the supernatant, keeping all sedimented resin.
After centrifugation, 3 phases could be easily distinguished: resin resting on the bottom,
SPAN 20 dissolved in water above it and silicone oil on top of everything else, thus
making decantation an easy task. After that, more SPAN solution has to be added, and
then the mixture was put on a shaking plate for a while so that the resin could be
dispersed in it.
After the third centrifuging cycle, a second PSD analysis was run. Some minor
differences with the original PSD could be found, but they were thought to be negligible,
and possibly due to the mechanical stresses to which the material had been subjected
during the extended processing described above. In fact, the difference was only
apparent in a noticeable “shoulder” in the size distribution diagram towards the fine
diameters (25-50 µm). Therefore, the sample was considered ready for column packing
and titration.
The experiment was then repeated using EXXSOL D100S instead of silicone oil for

Hydrogel Network in a Porous Resin MatrixHydrogel Network in a Porous Resin MatrixHydrogel Network in a Porous Resin MatrixHydrogel Network in a Porous Resin Matrix a study for chromatographic applications
3 EXPERIMENTAL
49
dispersing the resin during polymerization of the gel. After the first cleaning, the change
in PSD was dramatic: both very large aggregates (over 150 µm in diameter) and fine
particles (below 25 µm in diameter) were detected by light scattering. This lead to the
conclusion that the use of carbon-based oils causes plasticization of the resin, that in
turn makes it unsuitable for column packing.
3.5 Liquid penetrant
A solution was prepared according to the following recipe:
• 39.40 g AMPS
• 1.60 g MBAA
• 0.20 g TEMED
• 95.24 g H2O
• 0.40 g NaHCO3
All ingredients were put in a 250 mL bottle, along with a magnet, so that the solution
could be mixed on a magnetic stirring plate.
After the complete solubilization of all ingredients, 50 mL of PS-DVB resin (suspended in
water) were poured into the bottle as well. The mixture was put on a shaking plate for
1.5 hours at medium speed (around 80 rpm), so that the monomer solution had time to
permeate the pore network inside the resin particles.
Then, the content of the bottle was poured onto a 25 µm polymer mesh, which was lying
on the inside of a ceramic funnel leading into a 500 mL waste bottle, connected to a
vacuum pump. A small underpressure was applied through the pump, but only very little
was needed in order to sift out the excess solution (about 150 mbar). After a few
seconds the vacuum pump was shut down and the partially dried resin was collected and
stored in a sealed 250 mL bottle at room temperature.
POLITECNICO DI MILANOPOLITECNICO DI MILANOPOLITECNICO DI MILANOPOLITECNICO DI MILANO
Faculty of Engineering of Industrial Processes Course of Materials and Nanotechnology Engineering
50
A second solution was then prepared in a 100 mL beaker by mixing:
• 95.24 g H2O
• 0.20 g NaHCO3
• 0.1 g APS
Then the beaker was emptied into the bottle containing the resin that was prepared for
the experiment and said bottle was placed on the magnetic stirrer set at 350 rpm.
Finally, NaOH was added until the pH of the solution became higher than 8.5. The
stirring speed was then lowered to 150 rpm and maintained in this condition for 15
minutes. The mixture was poured onto a new 25 µm polymer mesh, set up as always on
a ceramic funnel leading into a 500 mL waste bottle connected to a vacuum pump,
which was set to produce a pressure of 350 mbar, in order to remove all excess solution.
After only a few seconds, it was possible to spot several rather large cracks (up to 5 cm
in length and up to 300 µm wide) along with a few smaller ones. The dry resin was then
collected by scraping it off the filter with a spatula and putting it in a 30 mL vial, along
with a magnet. The collected resin was then re-dispersed in 10 mL of water and 2 mL of
ethanol, and the vial was placed on the magnetic stirrer, so that the resin particles could
disperse well. After 10 minutes, the resin was ready for column packing.
Once again, both the filling volume and the actual column were washed with a few
milliliters of ethanol, to improve the quality of the packing. As for the pump, the usual
increasing flow rate was used.
To titrate the final material an alternative method was developed. The functionalized
resin was dried: first, the column was unpacked and emptied on a 20 µm polymer mesh,
placed inside a ceramic funnel lying on top of a 500 mL waste bottle, connected to a
vacuum pump. To get all the resin out of the column, some ethanol was also used to
wash its volume. The pump was then set to 300 mbar; after 1 minute, the pressure was
increased to 400 mbar, and after another minute to 500 mbar. After 2 more minutes of
sieving, the resin was removed from the polymer mesh and put on a weighing plate
(which had been weighed earlier), and then heated in an oven. After 2 hours at 40 °C the
plate was removed from the oven, and the resin was weighed.

Hydrogel Network in a Porous Resin MatrixHydrogel Network in a Porous Resin MatrixHydrogel Network in a Porous Resin MatrixHydrogel Network in a Porous Resin Matrix a study for chromatographic applications
3 EXPERIMENTAL
51
Being that the resin could not be packed into a column due to strong backpressure rising
during the packing procedure (even at flow rates as low as 0.7 mL/min), the sample was
titrated in a manner more similar to the standard Stone-Carta method [16] summarized
in section 2.2. The resin was poured in a 30 mL vial, and to it 25 mL of 1M HCl were
added. The mixture was stirred with a magnet for 1 hour and then the content was
poured onto a 10 µm polymer mesh lying on a ceramic funnel connected to the vacuum
pump through a 500 mL waste bottle. The pump was set to 150 mbar, to make the
drying of the resin more rapid. After about 30 seconds of drying, the resin was collected
and put back in the vial, along with 25 more mL of 1M HCl. Again, the mixture was
stirred for 1 hour and then the resin was dried in the same exact manner as before. The
soaking in 1 M HCl was repeated a third time. After the last drying step, the resin was
left on the polymer mesh. Distilled water was carefully poured onto the resin, so that
the resin could not dry. The pH of the runoff was periodically checked and addition of
water stopped when it reached a neutral value. The pressure was then set to 300 mbar
and the material dried for one minute. The weight of the filtered material was compared
to the weight that was measured after it was thermally dried to ensure it was dried as
much as possible in this step; if not, the drying step was continued until the difference
between the two measured weights would be less than 0.1% of the measured values.
Finally, 25 mL of 0.05 M NaOH/0.5 M NaCl solution were added to the resin. This
amount of solution was taken as precisely as possible with a volumetric pipette. The
mixture was stirred for 2 hours with a magnet. A known amount of supernatant was
collected by filtration through a 20 μm polymer mesh and the still moist resin was
stored in a closed vial. The collected supernatant was titrated with 25 mL of 0.01 M HCl
solution, in 500 steps of 50 µL each, with a wait time of 10 seconds between each step.
3.6 Solution flow-through
About 10 mL of resin (63-100 µm in diameter fraction) were packed into a PEEK column,
with an increasing flow rate:
• 5 minutes at 1 mL/min

POLITECNICO DI MILANOPOLITECNICO DI MILANOPOLITECNICO DI MILANOPOLITECNICO DI MILANO
Faculty of Engineering of Industrial Processes Course of Materials and Nanotechnology Engineering
52
• 5 minutes at 2 mL/min
• 5 minutes at 3.5 mL/min
• 10 minutes at 5 mL/min
Then, 10 mL of monomer solution with the following composition were injected in the
column:
• 0.160 g MBAA
• 3.946 g AMPS
• 16.000 g H2O
• 0.02 g APS
To ensure a steady flow inside the column, a syringe pump was used for the injection: a
capillary tube was connected with the tip of a 20 mL syringe, and the monomer solution
was taken up with it. The syringe was then placed on the pump, the speed of which was
set to a low value (around 0.8 mL/min). A custom head with proper screw thread was
placed at the end of the capillary tube, which allowed for it to be safely connected to
the PEEK column containing the packed resin; this connection was made so that the
monomer solution would be fed into the column from the same direction from which
water had been flowing during packing of the resin, to avoid rearrangement of the resin
particles. The other end of the column was placed upon a 30 mL vial, so that the eluted
monomer solution could be stored for analysis, if necessary.
After collecting 10 mL of monomer solution leaving the column, the pump could be
stopped.
The capillary tube was detached from the column and from the syringe. The syringe
itself was removed from the pump and disposed of. The tube was then attached to 500
mbar of nitrogen pressure, to flush out most of the monomer solution left in the
capillary. Then, the pressure was set to 200 mbar. The column was fixed with a clasp
above a clean beaker of known weight. Without turning the pump off (or changing the
pressure that was set up) the capillary was reconnected with the column. The nitrogen
flow was let through the column for 5 minutes; meanwhile, the ejected solution was

Hydrogel Network in a Porous Resin MatrixHydrogel Network in a Porous Resin MatrixHydrogel Network in a Porous Resin MatrixHydrogel Network in a Porous Resin Matrix a study for chromatographic applications
3 EXPERIMENTAL
53
collected. Afterwards, the pump was turned off and the collected solution was weighed.
This experiment was repeated three more times, each time changing the pressure of the
nitrogen flow. All columns were flushed for 5 minutes. The 4 specimens obtained were:
• Column 1 flushed with 200 mbar N2 flow
• Column 2 flushed with 400 mbar N2 flow
• Column 3 flushed with 600 mbar N2 flow
• Column 4 flushed with 800 mbar N2 flow
Each column was sealed with full PEEK plugs, secured in place by the column’s end caps
at both ends. A graphical representation of this precaution is given in Figure 3-3
Figure 3-3: temperature resistant sealing of a PEEK column
All columns were placed in an oven at 60 °C for 5 hours to let polymerization of the gel
happen. Afterwards, all full plugs were removed, all frits were replaced with new ones
and the punched plugs were put back in place. Finally, all columns were titrated.
Based on the results of these experiments (which will be discussed in section 4.5) a
second set of tests were conducted to better identify the optimal pressure for the
nitrogen flow used to flush out the excess monomer solution left amongst the resin
particles packed into a column.
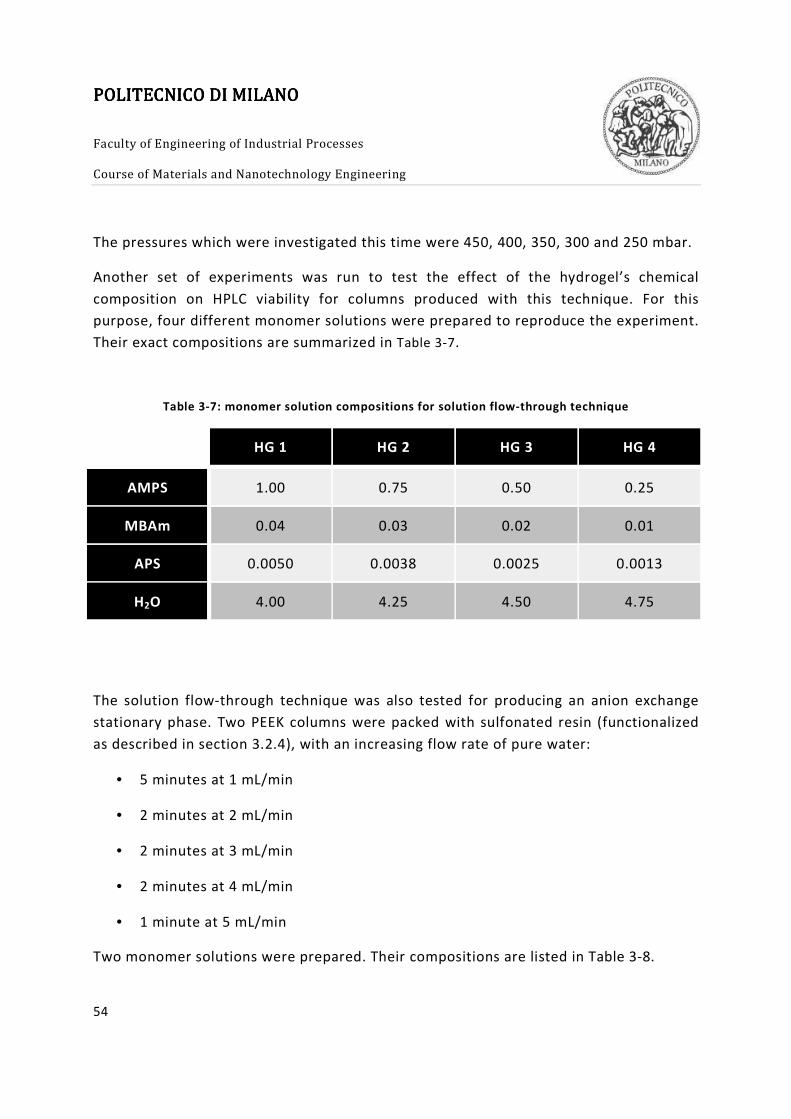
POLITECNICO DI MILANOPOLITECNICO DI MILANOPOLITECNICO DI MILANOPOLITECNICO DI MILANO
Faculty of Engineering of Industrial Processes Course of Materials and Nanotechnology Engineering
54
The pressures which were investigated this time were 450, 400, 350, 300 and 250 mbar.
Another set of experiments was run to test the effect of the hydrogel’s chemical
composition on HPLC viability for columns produced with this technique. For this
purpose, four different monomer solutions were prepared to reproduce the experiment.
Their exact compositions are summarized in Table 3-7.
Table 3-7: monomer solution compositions for solution flow-through technique
HG 1 HG 2 HG 3 HG 4
AMPS 1.00 0.75 0.50 0.25
MBAm 0.04 0.03 0.02 0.01
APS 0.0050 0.0038 0.0025 0.0013
H2O 4.00 4.25 4.50 4.75
The solution flow-through technique was also tested for producing an anion exchange
stationary phase. Two PEEK columns were packed with sulfonated resin (functionalized
as described in section 3.2.4), with an increasing flow rate of pure water:
• 5 minutes at 1 mL/min
• 2 minutes at 2 mL/min
• 2 minutes at 3 mL/min
• 2 minutes at 4 mL/min
• 1 minute at 5 mL/min
Two monomer solutions were prepared. Their compositions are listed in Table 3-8.
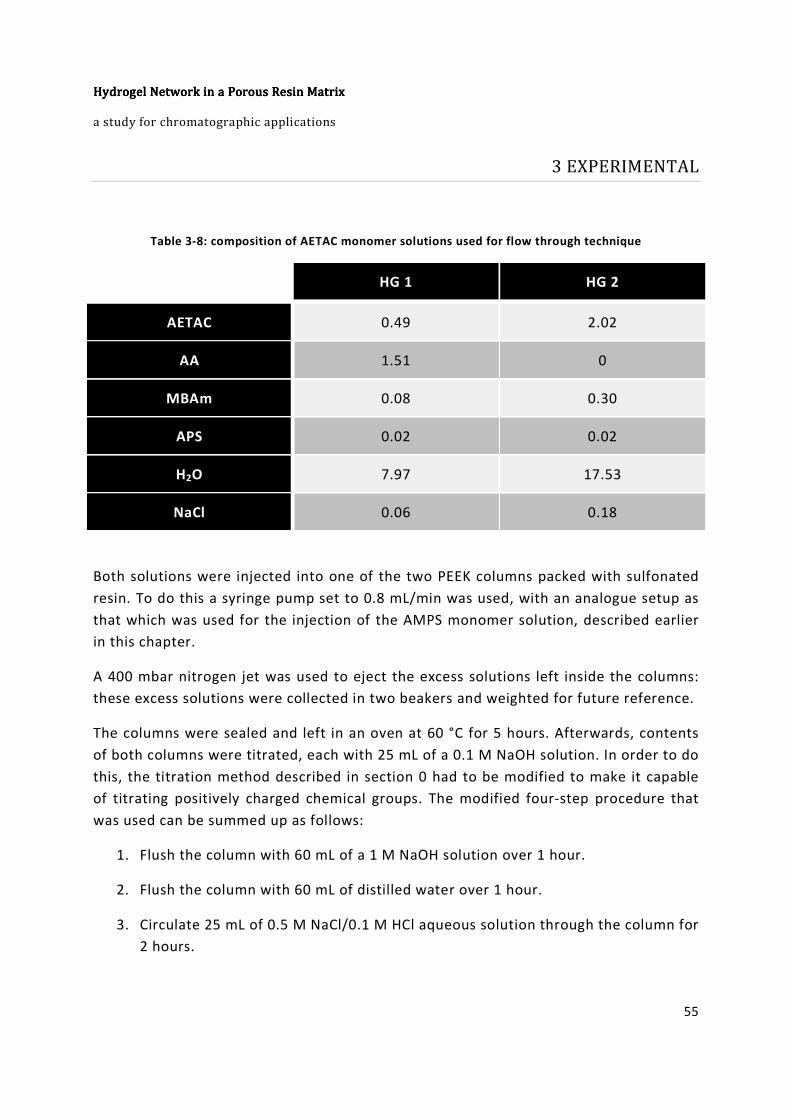
Hydrogel Network in a Porous Resin MatrixHydrogel Network in a Porous Resin MatrixHydrogel Network in a Porous Resin MatrixHydrogel Network in a Porous Resin Matrix a study for chromatographic applications
3 EXPERIMENTAL
55
Table 3-8: composition of AETAC monomer solutions used for flow through technique
HG 1 HG 2
AETAC 0.49 2.02
AA 1.51 0
MBAm 0.08 0.30
APS 0.02 0.02
H2O 7.97 17.53
NaCl 0.06 0.18
Both solutions were injected into one of the two PEEK columns packed with sulfonated
resin. To do this a syringe pump set to 0.8 mL/min was used, with an analogue setup as
that which was used for the injection of the AMPS monomer solution, described earlier
in this chapter.
A 400 mbar nitrogen jet was used to eject the excess solutions left inside the columns:
these excess solutions were collected in two beakers and weighted for future reference.
The columns were sealed and left in an oven at 60 °C for 5 hours. Afterwards, contents
of both columns were titrated, each with 25 mL of a 0.1 M NaOH solution. In order to do
this, the titration method described in section 0 had to be modified to make it capable
of titrating positively charged chemical groups. The modified four-step procedure that
was used can be summed up as follows:
1. Flush the column with 60 mL of a 1 M NaOH solution over 1 hour.
2. Flush the column with 60 mL of distilled water over 1 hour.
3. Circulate 25 mL of 0.5 M NaCl/0.1 M HCl aqueous solution through the column for
2 hours.
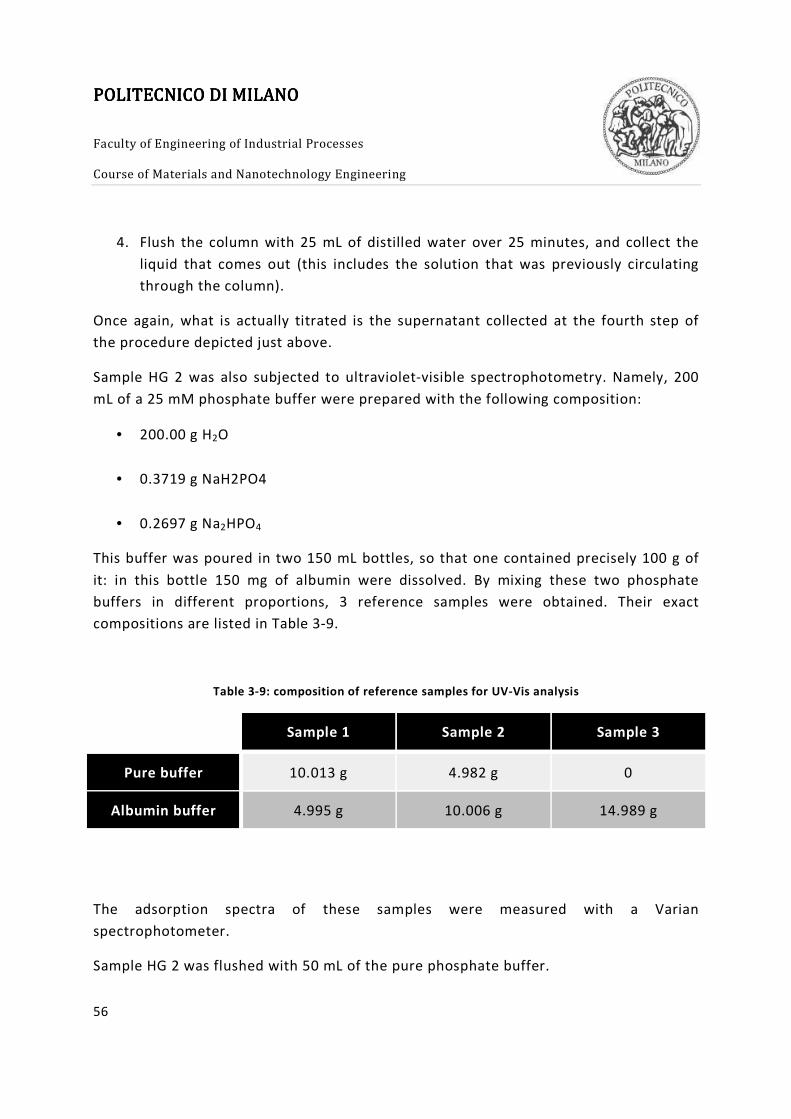
POLITECNICO DI MILANOPOLITECNICO DI MILANOPOLITECNICO DI MILANOPOLITECNICO DI MILANO
Faculty of Engineering of Industrial Processes Course of Materials and Nanotechnology Engineering
56
4. Flush the column with 25 mL of distilled water over 25 minutes, and collect the
liquid that comes out (this includes the solution that was previously circulating
through the column).
Once again, what is actually titrated is the supernatant collected at the fourth step of
the procedure depicted just above.
Sample HG 2 was also subjected to ultraviolet-visible spectrophotometry. Namely, 200
mL of a 25 mM phosphate buffer were prepared with the following composition:
• 200.00 g H2O
• 0.3719 g NaH2PO4
• 0.2697 g Na2HPO4
This buffer was poured in two 150 mL bottles, so that one contained precisely 100 g of
it: in this bottle 150 mg of albumin were dissolved. By mixing these two phosphate
buffers in different proportions, 3 reference samples were obtained. Their exact
compositions are listed in Table 3-9.
Table 3-9: composition of reference samples for UV-Vis analysis
Sample 1 Sample 2 Sample 3
Pure buffer 10.013 g 4.982 g 0
Albumin buffer 4.995 g 10.006 g 14.989 g
The adsorption spectra of these samples were measured with a Varian
spectrophotometer.
Sample HG 2 was flushed with 50 mL of the pure phosphate buffer.

Hydrogel Network in a Porous Resin MatrixHydrogel Network in a Porous Resin MatrixHydrogel Network in a Porous Resin MatrixHydrogel Network in a Porous Resin Matrix a study for chromatographic applications
3 EXPERIMENTAL
57
A fourth albumin solution was produced by dissolving 0.050 g of albumin in 25.00 g of
pure phosphate buffer.
A 50 mL bottle was weighted and then the albumin solution was poured into it. This
solution was then circulated through sample HG 2 for 2 hours. The remaining pure
buffer was used to flush the column, and all of the eluted solution was collected in the
same bottle that was used to let the albumin solution circuit through the column. The
bottle was weighted once more and then a 2 mL sample of it was taken in order to run
UV-Vis spectrometry analysis.

POLITECNICO DI MILANOPOLITECNICO DI MILANOPOLITECNICO DI MILANOPOLITECNICO DI MILANO
Faculty of Engineering of Industrial Processes Course of Materials and Nanotechnology Engineering
58
4 Results
In this chapter all results of the experiments described in chapter 3 are listed. An
explanation is given where possible. A brief clarification about the ideas that inspired
the four procedures that were followed is given as well.

POLITECNICO DI MILANOPOLITECNICO DI MILANOPOLITECNICO DI MILANOPOLITECNICO DI MILANO
Faculty of Engineering of Industrial Processes Course of Materials and Nanotechnology Engineering
60
4.1 Preliminary tests
4.1.1 Resin preparation
A mercury intrusion test of the PS-DVB resin revealed a total porosity of 83.11% and an
average pore diameter of 4.29 µm. These values are rather high: having a high porosity
can be good for the sake of this study, because it increases the volume accessible to the
mobile phase (therefore allowing for a higher capacity of the stationary phase), but the
high average diameter can be an issue for multiple reasons; in the particular case of this
study, the main problem would be that a large pore diameter strongly reduces capillary
forces, which have been used to retain the monomer solution inside the pores before
polymerization, so that hydrogel could form only within them. In fact, the Brooks-Corey
correlation, one of the most widely accepted models for the capillary pressure
encountered by a fluid in a porous medium states:
�� = ��4o6/� (15)
Where �� is the capillary pressure of the medium, � is the entry capillary pressure, �w is
the normalized water saturation and � is the pore size distribution index (an empirical
parameter that can have any positive value). Under the assumption of cylindrical pores �
can be calculated with Laplace-Young equation [32]:
� = .���1� n/ (16)
Where � is the interfacial tension, n is the radius of the interface (i.e. the pore radius for
the present study) and � is the contact angle between fluid and solid phases. As for �w
and � in Equation 15, they are both to be measured experimentally [32]: such
measurements require significant time and effort, and the exact value of the capillary
force in the porous resin media used in the experiments carried out over the course of
the present study was not judged worthy; it was thought sufficient to know that it scales
linearly with 1/ n and exponentially with a parameter that depends on the pore size
distribution of the resin (and ranges from 0.2 to 1 for most media [33], decreasing as the

Hydrogel Hydrogel Hydrogel Hydrogel Network in a Porous Resin MatrixNetwork in a Porous Resin MatrixNetwork in a Porous Resin MatrixNetwork in a Porous Resin Matrix a study for chromatographic applications
4 RESULTS
61
distribution broadens). Note that �w is a material property independent of experimental
conditions, and that it strictly ranges from 0 to 1.
Under the assumption of cylindrical pores, the entry capillary pressure can be estimated
from Equation 16: using � = 34 10-3
J/m2 and � = 87.4° (literature values for the system
polystyrene-water [34], [35]), and an average pore radius of 2.15 10-6
m (the value
measured for the resin used in this work by mercury intrusion), such pressure is equal to
1435 �I (= 14.35 L�I�). This means that, neglecting the effects of the pore size
distribution, an external pressure less than 14 mbar should be enough to remove the
fluid retained inside the pores of such resin. This value is rather low: while it is desirable
to be able to functionalize the material with a low pressure (thus reducing the costs of
the procedure), a too low capillary pressure would make it difficult to retain any liquid
inside the pores, even before applying any external pressure. In order to increase the
capillary force inside the pores, it would be advisable to reduce the average pore size of
the resin particles, even by one order of magnitude if possible. It may also be considered
that the value obtained from Equation (16) neglects the influence of the pore size
distribution: in a real material (with a non-razor-sharp pore size distribution) the actual
capillary pressure found inside the pores will be significantly higher, as suggested by
Equation (15).
Light scattering showed that the resin produced for the study had a rather broad
particle size distribution, with significant shoulders both in the short and in the long
diameter regions. This is shown in Figure 4-1.

POLITECNICO DI MILANOPOLITECNICO DI MILANOPOLITECNICO DI MILANOPOLITECNICO DI MILANO
Faculty of Engineering of Industrial Processes Course of Materials and Nanotechnology Engineering
62
Figure 4-1: Particle size distribution of the original PS-DVB resin
Remember that this result was obtained after a thorough sieving of the resin aimed at
removing particles with diameter less than 45 µm or greater than 200 µm: as it can be
seen, a significant amount of particles was left both in the small and in the large regions.
Also notice that the measurement is volumetric, so the shoulder in the smaller diameter
region indicates a very high number of fine particles in the resin. A broad PSD can have
deleterious effects: some of the techniques that were experimented are very susceptible
to the pore size distribution, which strongly depends on the PSD of the resin; a broader
PSD can generally cause problems during packing of the resin into a column; but most
importantly, a broad PSD increases randomness of all results that are affected by the
diameter of the pores or by that of the particles, and it consequently reduces the
experimental reproducibility. Therefore, it was decided to narrow the PSD by
fractionation. Three fractions were produced:
1. Particles with diameter between 45 µm and 63 µm
0
1
2
3
4
5
6
7
8
9
1 10 100 1000
Vo
lum
etr
ic p
erc
en
tag
e (
%)
Particle diameter (µm)
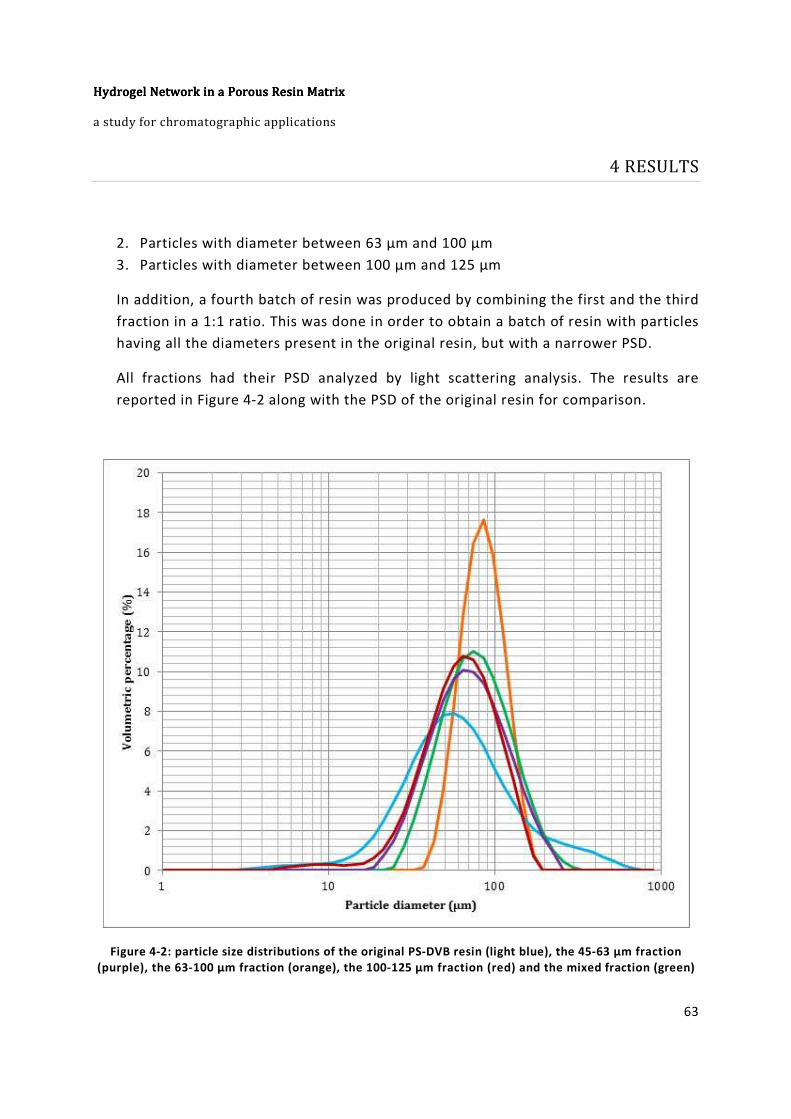
Hydrogel Hydrogel Hydrogel Hydrogel Network in a Porous Resin MatrixNetwork in a Porous Resin MatrixNetwork in a Porous Resin MatrixNetwork in a Porous Resin Matrix a study for chromatographic applications
4 RESULTS
63
2. Particles with diameter between 63 µm and 100 µm
3. Particles with diameter between 100 µm and 125 µm
In addition, a fourth batch of resin was produced by combining the first and the third
fraction in a 1:1 ratio. This was done in order to obtain a batch of resin with particles
having all the diameters present in the original resin, but with a narrower PSD.
All fractions had their PSD analyzed by light scattering analysis. The results are
reported in Figure 4-2 along with the PSD of the original resin for comparison.
Figure 4-2: particle size distributions of the original PS-DVB resin (light blue), the 45-63 µm fraction
(purple), the 63-100 µm fraction (orange), the 100-125 µm fraction (red) and the mixed fraction (green)
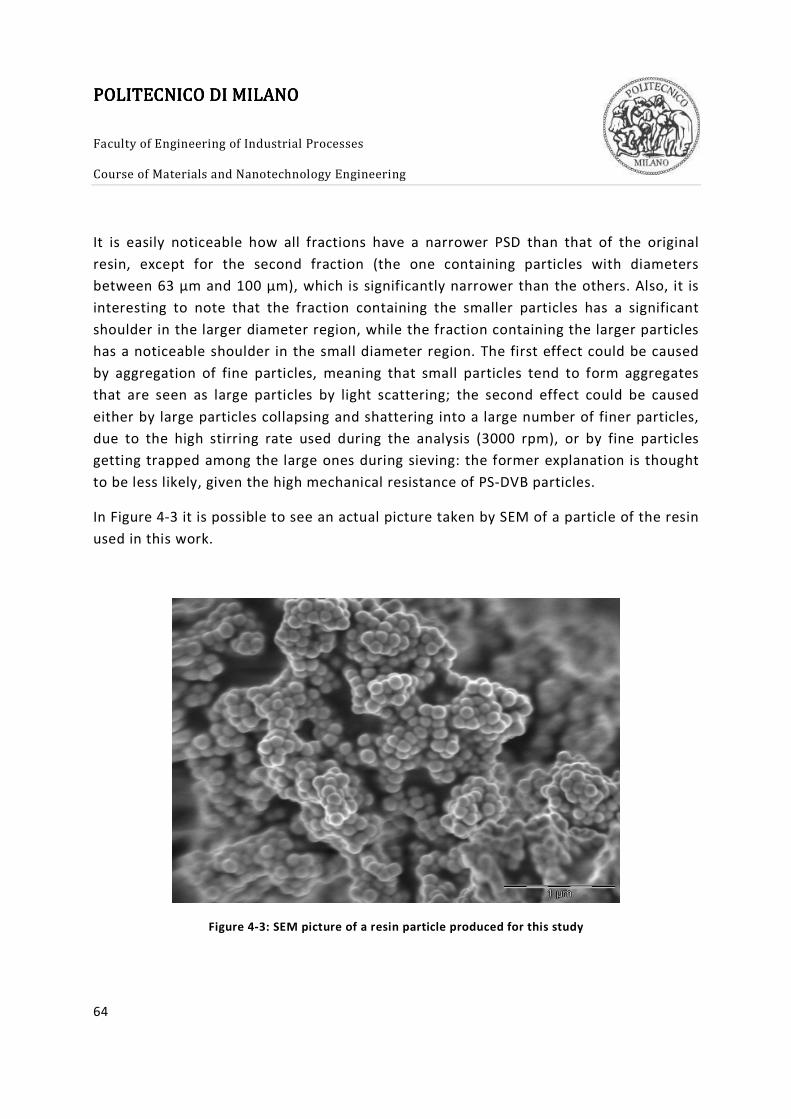
POLITECNICO DI MILANOPOLITECNICO DI MILANOPOLITECNICO DI MILANOPOLITECNICO DI MILANO
Faculty of Engineering of Industrial Processes Course of Materials and Nanotechnology Engineering
64
It is easily noticeable how all fractions have a narrower PSD than that of the original
resin, except for the second fraction (the one containing particles with diameters
between 63 µm and 100 µm), which is significantly narrower than the others. Also, it is
interesting to note that the fraction containing the smaller particles has a significant
shoulder in the larger diameter region, while the fraction containing the larger particles
has a noticeable shoulder in the small diameter region. The first effect could be caused
by aggregation of fine particles, meaning that small particles tend to form aggregates
that are seen as large particles by light scattering; the second effect could be caused
either by large particles collapsing and shattering into a large number of finer particles,
due to the high stirring rate used during the analysis (3000 rpm), or by fine particles
getting trapped among the large ones during sieving: the former explanation is thought
to be less likely, given the high mechanical resistance of PS-DVB particles.
In Figure 4-3 it is possible to see an actual picture taken by SEM of a particle of the resin
used in this work.
Figure 4-3: SEM picture of a resin particle produced for this study

Hydrogel Hydrogel Hydrogel Hydrogel Network in a Porous Resin MatrixNetwork in a Porous Resin MatrixNetwork in a Porous Resin MatrixNetwork in a Porous Resin Matrix a study for chromatographic applications
4 RESULTS
65
It is easy to notice that the resin particles are actually made of a large number of
aggregated styrene nanoparticles; also, the pores are quite irregular in shape and size,
and the same should be true for the particles too.
A simple way to portray the final particles used in this work is shown in Figure 4-4:
Figure 4-4: schematic representation of a core-shell PS-DVB resin particle
The aggregated nanoparticles constitute the continuous, solid matrix, while the void
spaces (clearly visible in the previous SEM picture) are the large pores. This final
morphology is quite well-suited for accommodating large molecules as well as the
hydrogels, as discussed later.

POLITECNICO DI MILANOPOLITECNICO DI MILANOPOLITECNICO DI MILANOPOLITECNICO DI MILANO
Faculty of Engineering of Industrial Processes Course of Materials and Nanotechnology Engineering
66
4.1.2 Bulk hydrogel composition
The experiments carried out to produce hydrogels with different compositions in bulk
were aimed at verifying which reactions would actually produce a suitable hydrogel.
Initially, only the effect of monomer concentration was studied, and not that of the cross-
linker, the concentration of which was kept at 4% in weight with respect to the monomer.
First, reactions using high temperature to induce fast spontaneous dissociation of APS
were tested: solutions having a monomer concentration higher than 5% in weight always
turned into a solid product, although the gel was softer than expected according to
previous experiments on acrylamide. To increase the gel stiffness, a 20% weight
concentration of monomer was used in most monomer solutions made for later
experiments: this is a rather high value for some systems, but it did help significantly in
producing stiffer hydrogels and increasing the amount of charge groups per volume.
Therefore, this monomer mixture concentration was used as a standard in most
experiments carried out in this thesis.
The reaction with TEMED turned out to be favored only at slightly basic pH. No reaction
happened at pH = 1, nor at pH = 14. Between pH 8 and 10 it worked well. This particular
condition was achieved by substituting water with a buffer solution (50 mM H2CO3) and
adding NaOH until the pH reached the desired value.
There is no apparent difference in the gel produced by TEMED induced reaction and the
one by the temperature induced reaction. The main difference between the two
reaction lies in their kinetics: while the temperature induced reaction takes 5 hours, the
TEMED induced one reaches full conversion in just a few seconds. In fact, by using
TEMED the technique defined “liquid penetrant technique” (discussed in section 3.5)
became feasible, since it needs to be carried out in a time frame much shorter than that
of the reaction without TEMED. Still, the temperature induced reaction was preferred
because introducing salts in the solution was thought to be a possible cause for a
reduction in capacity, taking into account the electrostatic nature of the separation
mechanism employed by these hydrogels.
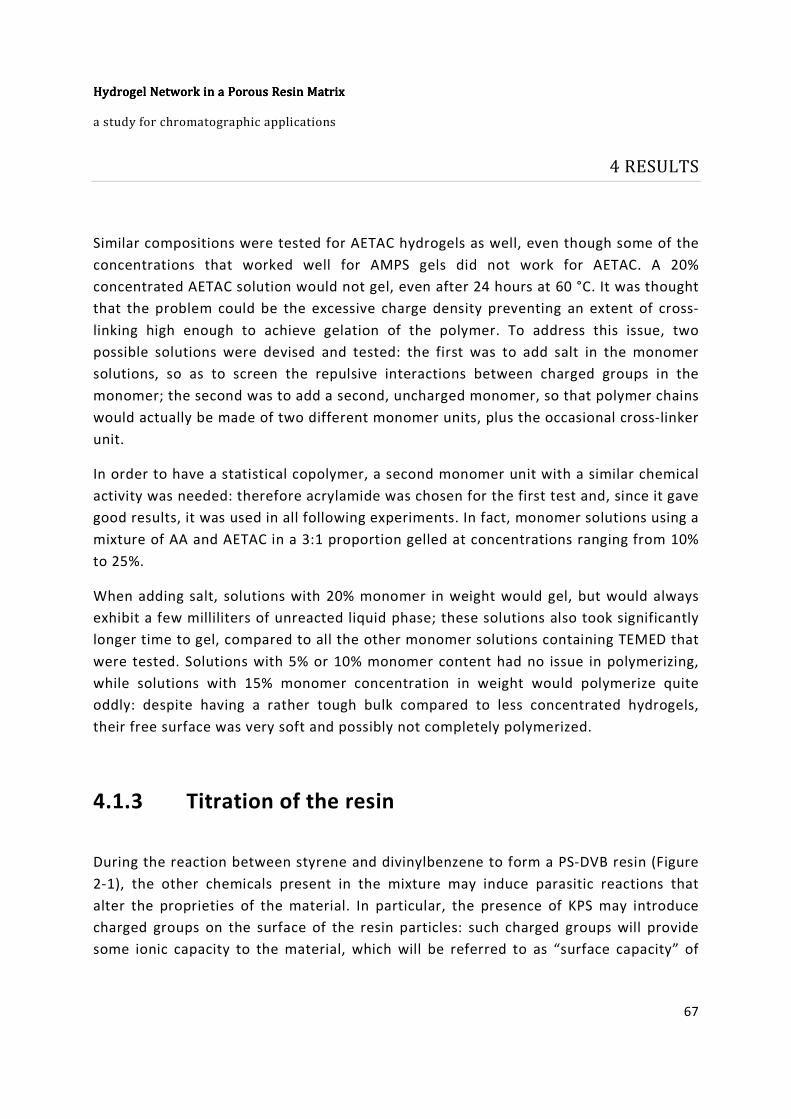
Hydrogel Hydrogel Hydrogel Hydrogel Network in a Porous Resin MatrixNetwork in a Porous Resin MatrixNetwork in a Porous Resin MatrixNetwork in a Porous Resin Matrix a study for chromatographic applications
4 RESULTS
67
Similar compositions were tested for AETAC hydrogels as well, even though some of the
concentrations that worked well for AMPS gels did not work for AETAC. A 20%
concentrated AETAC solution would not gel, even after 24 hours at 60 °C. It was thought
that the problem could be the excessive charge density preventing an extent of cross-
linking high enough to achieve gelation of the polymer. To address this issue, two
possible solutions were devised and tested: the first was to add salt in the monomer
solutions, so as to screen the repulsive interactions between charged groups in the
monomer; the second was to add a second, uncharged monomer, so that polymer chains
would actually be made of two different monomer units, plus the occasional cross-linker
unit.
In order to have a statistical copolymer, a second monomer unit with a similar chemical
activity was needed: therefore acrylamide was chosen for the first test and, since it gave
good results, it was used in all following experiments. In fact, monomer solutions using a
mixture of AA and AETAC in a 3:1 proportion gelled at concentrations ranging from 10%
to 25%.
When adding salt, solutions with 20% monomer in weight would gel, but would always
exhibit a few milliliters of unreacted liquid phase; these solutions also took significantly
longer time to gel, compared to all the other monomer solutions containing TEMED that
were tested. Solutions with 5% or 10% monomer content had no issue in polymerizing,
while solutions with 15% monomer concentration in weight would polymerize quite
oddly: despite having a rather tough bulk compared to less concentrated hydrogels,
their free surface was very soft and possibly not completely polymerized.
4.1.3 Titration of the resin
During the reaction between styrene and divinylbenzene to form a PS-DVB resin (Figure
2-1), the other chemicals present in the mixture may induce parasitic reactions that
alter the proprieties of the material. In particular, the presence of KPS may introduce
charged groups on the surface of the resin particles: such charged groups will provide
some ionic capacity to the material, which will be referred to as “surface capacity” of

POLITECNICO DI MILANOPOLITECNICO DI MILANOPOLITECNICO DI MILANOPOLITECNICO DI MILANO
Faculty of Engineering of Industrial Processes Course of Materials and Nanotechnology Engineering
68
the support from now on.
When measuring the ionic capacity of the composite material that is the objective of
this study, both the capacity of the hydrogel and the capacity of the resin are measured:
in order to assess if and how much gel was introduced into the pores of the resin by a
particular functionalization process, it is necessary to distinguish between the two.
Therefore, it was decided to titrate the resin used as a matrix for the hydrogel: once the
capacity of the resin would be measured, it could be possible to subtract it from the
value obtained for the final material to reckon the actual increase in capacity introduced
by the procedure.
In this research, a few slight changes were applied to the original Stone-Carta method,
in order to make it possible for packed columns to be titrated with an offline pump,
making the sample preparation the multiple steps procedure which is described in
section 3.2.3: this titration technique was first tested on a HPLC column packed with PS-
DVB resin (which was made with the process described in section 3.2.1). This was a
necessary step, to make sure that the method was suitable to measure the capacity of a
column filled with the resin that was produced for this purpose, which was meant to
exclude any relevant influence of the untreated material on the final measure.
The method used in this work still goes through the steps described by Stone and Carta,
but with an additional final step at the end, in which water is circulated through the
column containing the material to be titrated, meaning that a known amount of water is
let through the column multiple times: this is done to make sure that none of the
solution that went through the column in the previous step is left inside the pump or in
the various capillary tubes used in the process.
The pH measurements are plotted in Figure 4-5. The measurement closest to the
equivalence point is highlighted with a red diamond, and its coordinates on the diagram
are written next to it.

Hydrogel Hydrogel Hydrogel Hydrogel Network in a Porous Resin MatrixNetwork in a Porous Resin MatrixNetwork in a Porous Resin MatrixNetwork in a Porous Resin Matrix a study for chromatographic applications
4 RESULTS
69
Figure 4-5: pH measurements obtained by titration of plain PS-DVB sample
Recalling Equation (5), the difference between the number of moles of NaOH circulated
through the column in step 3 (0.675 mmol in this case) and the amount of moles of
NaOH left in the titrated solution is equal to the amount of sulphonic groups on the
surface of the material. Since 6.75 mL of 0.1 M HCl were required to reach pH 6.94, and
the dependence of pH on the volume of injected HCl is quite linear, 0.6692 mmol of
NaOH must have been present in the solution, from which the number of moles of
charged groups on the resin surface was estimated as 5.8 µmol. Note that this value is
low compared to the measured number of moles (it is smaller by 2 orders of
magnitude): therefore, even a small error in the measurements would significantly
affect this result.
Since the column volume was 0.628 mL, an ionic capacity of 9.24 µmol/mL column
volume was measured for the blank resin. The potential for error is large with this
method, especially when only small amounts of ion exchange groups are present:
therefore, not much emphasis should be put onto the specific value but rather on the
6,75; 6,94
0
7
14
0 5 10 15 20
pH
me
asu
red
volume of 0.1 M HCl injected (mL)

POLITECNICO DI MILANOPOLITECNICO DI MILANOPOLITECNICO DI MILANOPOLITECNICO DI MILANO
Faculty of Engineering of Industrial Processes Course of Materials and Nanotechnology Engineering
70
fact that only very few groups are present.
4.1.4 Functionalization of the resin
Being that PS-DVB resin has very low polarity, it is expected to be hydrophobic. Indeed,
during the experiments that were carried out in this study, this hydrophobic behavior
was apparent in several instances: especially while sieving, particles would hardly
disperse in water, and would rather stick to the metallic surface of the sieve, making the
procedure much harder. Furthermore, when the resin was stored in glass bottles
without filling them completely, resin particles would adhere to the glass walls that
were left untouched by the water and stick to those walls until ethanol was sprayed on
them.
This could have been a major issue, for the functionalization of the stationary phase was
supposed to happen through a reaction in liquid phase at the surface of the resin: if the
resin could not be wetted by an aqueous solution, the reaction could hardly happen.
To address this possible issue, part of the resin that was formerly produced was
sulfonated in order to make it more hydrophilic. A poly-styrene resin treated in such
fashion is a lot less hydrophobic, and the reaction to modify a standard PS-DVB resin is
rather simple [36]: basically, the desired amount of resin is suspended in sulfuric acid at
80 °C for 24 hours while gently stirred (at 25 rpm). Since this was done in the early stage
of this work, only a fraction of the poly-styrene resin was modified, just to be prepared
in case the non-sulfonated resin would demonstrate itself unsuitable for the purpose of
this study.
After sulfonation, a very slight beige coloring could be detected as the only apparent
difference with plain PS-DVB resin (which looks pearl white); furthermore, from the
behavior of the sulfonated resin during the production and stocking steps, it seemed to
be much less hydrophobic than its plain counterpart.
The sulfonation process introduces new sulfonic groups in a PS-DVB resin. This increases
the ionic capacity of the material. To measure the extent of this change, a sample of
Hydrogel Hydrogel Hydrogel Hydrogel Network in a Porous Resin MatrixNetwork in a Porous Resin MatrixNetwork in a Porous Resin MatrixNetwork in a Porous Resin Matrix a study for chromatographic applications
4 RESULTS
71
functionalized resin was titrated: based on the collected data (reported in Figure 4-6), an
ionic capacity of 77.4 µmol/mL column volume was measured.
Figure 4-6: pH measurements obtained by titration of a sulfonated PS-DVB sample
This means that sulfonation of blank PS-DVB resin significantly increases the “support
surface capacity” of a stationary phase. This is what causes the decrease in
hydrophobicity of the material; on the other hand, being that the charges introduced on
the surface of the resin particles by sulfonation are negative (sulfonic groups), such a
resin will not be an ideal matrix for a cation exchange hydrogel (such as an AMPS-based
one). However, it will be a better recipient for an anion exchange hydrogel (such as an
AETAC-based one).
17,35; 6,97
0
7
14
0 5 10 15 20
pH
me
asu
red
volume of 0.1 M NaOH injected (mL)

POLITECNICO DI MILANOPOLITECNICO DI MILANOPOLITECNICO DI MILANOPOLITECNICO DI MILANO
Faculty of Engineering of Industrial Processes Course of Materials and Nanotechnology Engineering
72
4.1.5 Swelling tests
During the preparation of the hydrogel solutions, solution number 5 needed addition of
a large amount of NaOH in order to reach an acceptable pH value. The cause for this
remains unclear.
Another issue that was encountered during the preparation of hydrogel solutions was
that solution number 1 did not gel. This was not entirely unexpected, given the results
discussed in section 4.1.2: it was concluded that 5% is below the minimum monomer
concentration in weight needed for an AMPS solution to polymerize into a gel.
As for the measurements of equilibrium volumes of all produced specimens, the results
are reported in Table 4-1 below.
Table 4-1: equilibrium volumes (mL) of AMPS hydrogels of various compositions
Days since gelation
0 21 30 41 50 62 75 90 98
Sp
eci
me
n
HG 2 20 144.08 220.92 243.40 275.45 293.36 307.76 320.96 323.22
HG 3 20 96.32 163.53 170.27 170.45
HG 4 20 136.87 185.48 193.43 194.60
HG 5 20 158.96 167.95 169.09 169.41
HG 6 20 156.13 315.48 356.68 392.41 422.86 429.67 434.88 435.54
HG 7 20 94.91 126.21 127.43 127.48
HG 8 20 82.05 86.30 87.69 87.98
HG 9 20 60.73 73.81 75.99 76.61
Most samples reached equilibrium in less than two months, but quite noticeably, two
out of eight samples swelled for a much longer time (more than three months), reaching
a much larger final volume long after the other samples had already stopped their own
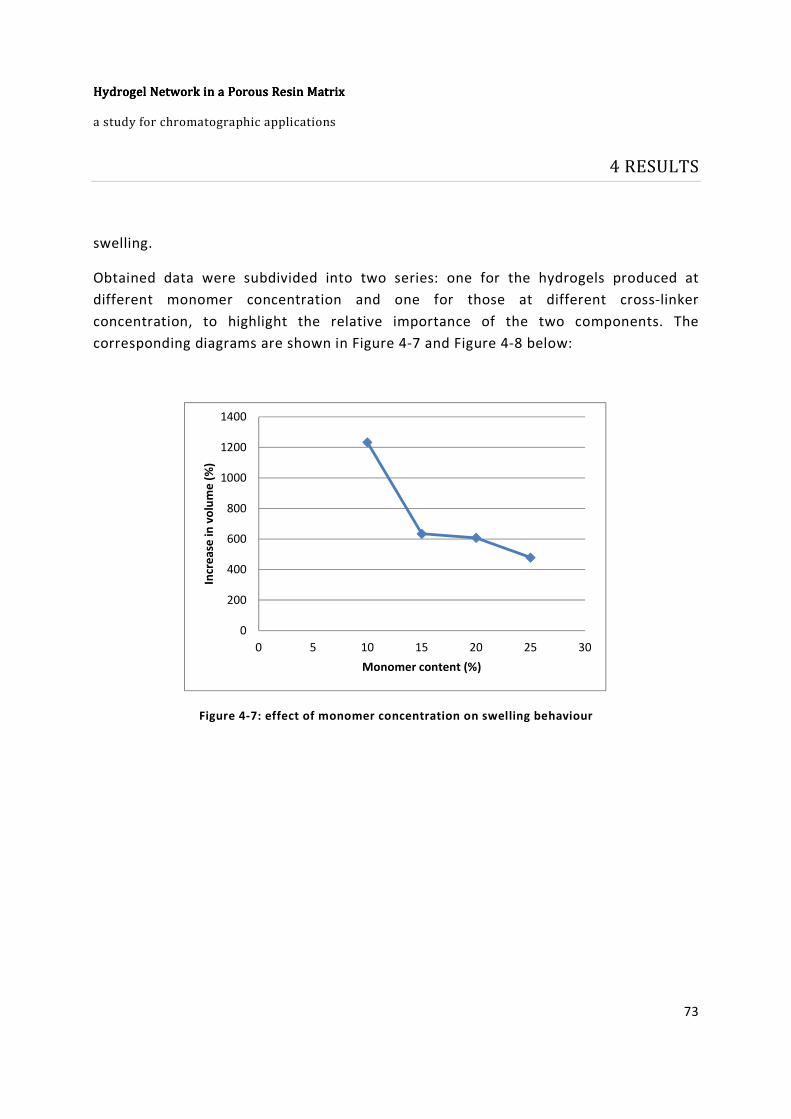
Hydrogel Hydrogel Hydrogel Hydrogel Network in a Porous Resin MatrixNetwork in a Porous Resin MatrixNetwork in a Porous Resin MatrixNetwork in a Porous Resin Matrix a study for chromatographic applications
4 RESULTS
73
swelling.
Obtained data were subdivided into two series: one for the hydrogels produced at
different monomer concentration and one for those at different cross-linker
concentration, to highlight the relative importance of the two components. The
corresponding diagrams are shown in Figure 4-7 and Figure 4-8 below:
Figure 4-7: effect of monomer concentration on swelling behaviour
0
200
400
600
800
1000
1200
1400
0 5 10 15 20 25 30
Incr
ea
se i
n v
olu
me
(%
)
Monomer content (%)
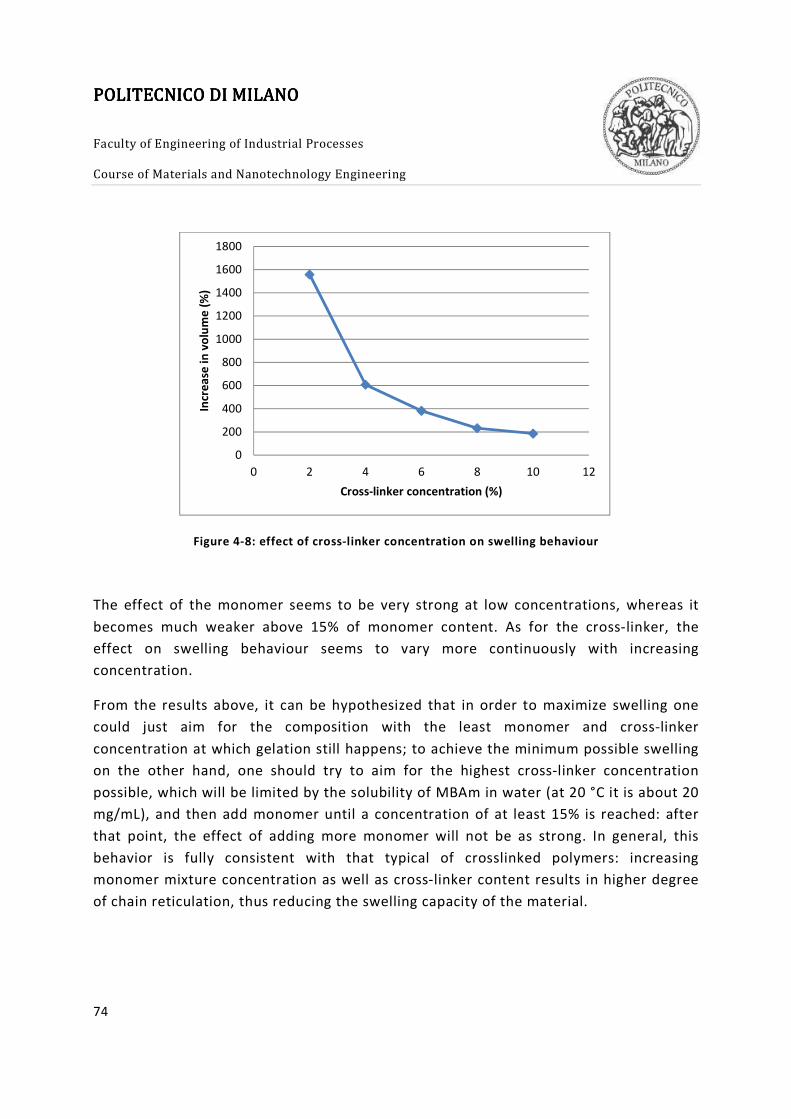
POLITECNICO DI MILANOPOLITECNICO DI MILANOPOLITECNICO DI MILANOPOLITECNICO DI MILANO
Faculty of Engineering of Industrial Processes Course of Materials and Nanotechnology Engineering
74
Figure 4-8: effect of cross-linker concentration on swelling behaviour
The effect of the monomer seems to be very strong at low concentrations, whereas it
becomes much weaker above 15% of monomer content. As for the cross-linker, the
effect on swelling behaviour seems to vary more continuously with increasing
concentration.
From the results above, it can be hypothesized that in order to maximize swelling one
could just aim for the composition with the least monomer and cross-linker
concentration at which gelation still happens; to achieve the minimum possible swelling
on the other hand, one should try to aim for the highest cross-linker concentration
possible, which will be limited by the solubility of MBAm in water (at 20 °C it is about 20
mg/mL), and then add monomer until a concentration of at least 15% is reached: after
that point, the effect of adding more monomer will not be as strong. In general, this
behavior is fully consistent with that typical of crosslinked polymers: increasing
monomer mixture concentration as well as cross-linker content results in higher degree
of chain reticulation, thus reducing the swelling capacity of the material.
0
200
400
600
800
1000
1200
1400
1600
1800
0 2 4 6 8 10 12
Incr
ea
se i
n v
olu
me
(%
)
Cross-linker concentration (%)

Hydrogel Hydrogel Hydrogel Hydrogel Network in a Porous Resin MatrixNetwork in a Porous Resin MatrixNetwork in a Porous Resin MatrixNetwork in a Porous Resin Matrix a study for chromatographic applications
4 RESULTS
75
4.2 Solution soaking
The solution soaking technique was the first one to be devised. It is clearly a very simple
idea, and does not provide any control over where gelation of the monomer solution can
or cannot occur: nothing prevents the formation of hydrogel outside of the pores. The
procedure only consists of three steps, portrayed in Figure 4-9:
Figure 4-9: graphic interpretation of the 3 steps involved in the solution soaking technique: soaking in
monomer solution (1), removal of excess solution (2) and heating at 60 °C for 5 hours (3)
The most evident weakness of this technique lies in step 2: there is no way to tell if the
solution is staying in the pores and measuring the amount of solution retained by the
resin is rather complicated. The easiest method to do it would be to completely dry the
resin before the soaking step, weigh it, then proceed with the first two steps of the
1 2
3

POLITECNICO DI MILANOPOLITECNICO DI MILANOPOLITECNICO DI MILANOPOLITECNICO DI MILANO
Faculty of Engineering of Industrial Processes Course of Materials and Nanotechnology Engineering
76
procedure and weight the resin again: the difference between the two measured
weights would then be the amount of solution retained. However, it is not possible to
establish whether this solution is inside the pores of the resin particles as it should be,
or if it is actually trapped in the interstitial spaces among the particles.
These possible issues were foreseen before the technique was experimented: however,
since the procedure as described in section 3.3 is very simple to carry out, it was
thought to provide important information about how to handle the materials and the
most relevant issues that could arise during their processing using different techniques.
In the case of AMPS gel grown on PS-DVB resin, sieving on a polymer mesh made the
material extremely hard to be re-dispersed in water or aqueous solutions; re-dispersion
in solutions at various concentrations of NaOH (0.05 to 5 M) could not be obtained
either. When the sieving is carried out on paper filter, leaving the resin noticeably more
moist during the drying step, re-dispersion is much easier and the resin can actually be
functionalized: this lead to the belief that partial drying is preferable for this procedure.
Based on the data shown in Figure 4-10, an ion capacity of up to 357.2 µmol/mL column
volume could be achieved with this technique.
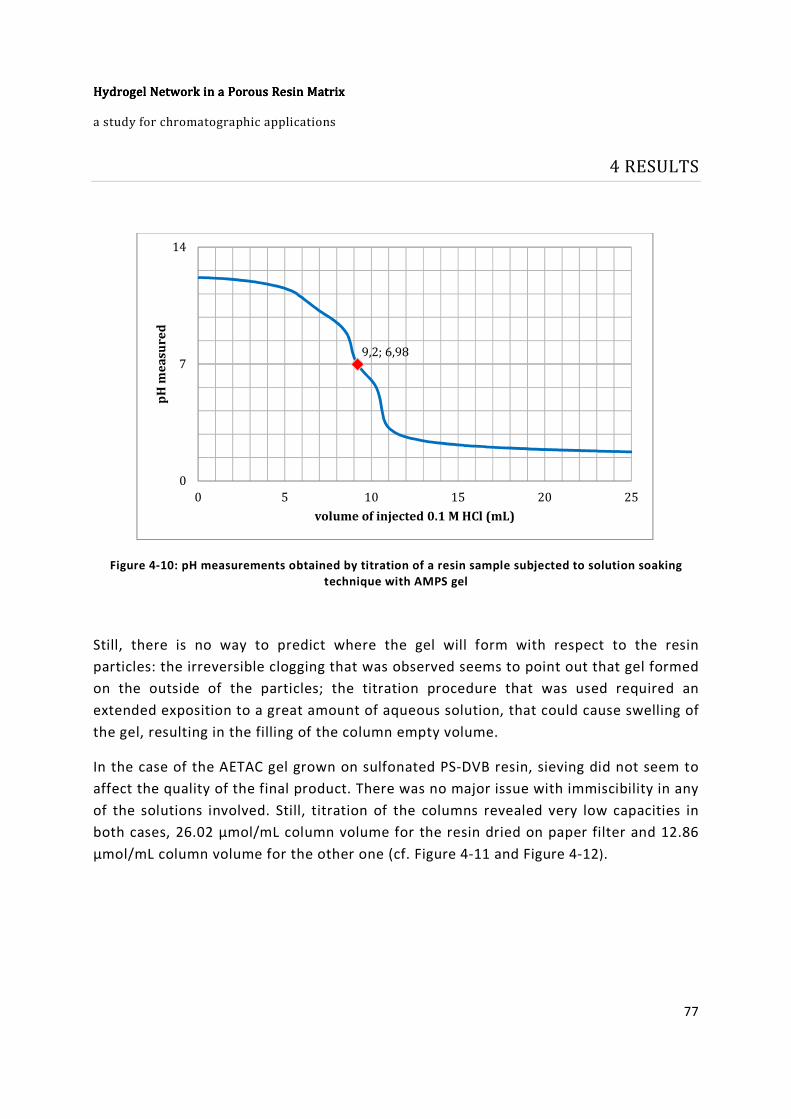
Hydrogel Hydrogel Hydrogel Hydrogel Network in a Porous Resin MatrixNetwork in a Porous Resin MatrixNetwork in a Porous Resin MatrixNetwork in a Porous Resin Matrix a study for chromatographic applications
4 RESULTS
77
Figure 4-10: pH measurements obtained by titration of a resin sample subjected to solution soaking
technique with AMPS gel
Still, there is no way to predict where the gel will form with respect to the resin
particles: the irreversible clogging that was observed seems to point out that gel formed
on the outside of the particles; the titration procedure that was used required an
extended exposition to a great amount of aqueous solution, that could cause swelling of
the gel, resulting in the filling of the column empty volume.
In the case of the AETAC gel grown on sulfonated PS-DVB resin, sieving did not seem to
affect the quality of the final product. There was no major issue with immiscibility in any
of the solutions involved. Still, titration of the columns revealed very low capacities in
both cases, 26.02 µmol/mL column volume for the resin dried on paper filter and 12.86
µmol/mL column volume for the other one (cf. Figure 4-11 and Figure 4-12).
9,2; 6,98
0
7
14
0 5 10 15 20 25
pH
me
asu
red
volume of injected 0.1 M HCl (mL)

POLITECNICO DI MILANOPOLITECNICO DI MILANOPOLITECNICO DI MILANOPOLITECNICO DI MILANO
Faculty of Engineering of Industrial Processes Course of Materials and Nanotechnology Engineering
78
Figure 4-11: pH measurements obtained by titration of a resin sample subjected to solution soaking
technique with AETAC gel (dried on paper filter)
Figure 4-12: pH measurements obtained by titration of a resin sample subjected to solution soaking
technique with AETAC gel (dried on polymer mesh)
24,87; 6,71
0
7
14
0 5 10 15 20 25 30 35
pH
me
asu
red
volume of 0.1 M NaOH injected (mL)
24,93; 6,76
0
7
14
0 5 10 15 20 25 30 35
pH
me
asu
red
volume of 0.1 M NaOH injected (mL)
Hydrogel Hydrogel Hydrogel Hydrogel Network in a Porous Resin MatrixNetwork in a Porous Resin MatrixNetwork in a Porous Resin MatrixNetwork in a Porous Resin Matrix a study for chromatographic applications
4 RESULTS
79
It is to be noted that both these values are well below the support surface capacity of
the sulfonated resin, which was reported to be 77.41 µmol/mL column volume in section
4.1.4. This could be due to the fact that most of the R-NMe3+ groups present in the gel
are bound to the sulfonic groups on the resin surface, and do not interact with the
solutions which have been used for the titration of the material. If this was the case, the
actual capacities would have been reduced by an amount equal to the support surface
capacity of the sulfonated PS-DVB resin.
Another reason for which the measured capacities are so much less than those found in
plain PS-DVB resin particles filled with AMPS gels (which are usually above 100 µmol/mL
column volume) could be that part of the monomer solution that was retained by the
resin after the drying step evaporated during the heating step, and then condensed on
the surface of the jar in which the resin was contained: indeed, a significant amount of
droplets could be seen on it.
It is well possible that both issues affected the results that were obtained.
In conclusion, the overall poor results should be attributed to the lack of control granted
by the solution soaking technique: there is no way to know if the monomer solution
retained by the resin before gelation will be only inside the pores, and, even in this case,
there is still no way to assess whether it will stay there; it could evaporate, or even
leach out of the pores and spread over the particle surface.
Therefore, the solution soaking technique was not elected as viable procedure to
produce the desired material.
4.3 Oil dispersion
The oil dispersion technique was first devised to address the issue that was encountered
while applying the solution soaking, where there was lack of control over where gelation
can occur with respect to the resin particles. In order to limit the space accessible to the
monomer solution it was thought to disperse the resin in a hydrophobic medium, after it

POLITECNICO DI MILANOPOLITECNICO DI MILANOPOLITECNICO DI MILANOPOLITECNICO DI MILANO
Faculty of Engineering of Industrial Processes Course of Materials and Nanotechnology Engineering
80
had been soaked in monomer solution. The steps in which the procedure could be
subdivided would then be those depicted in Figure 4-13:
Figure 4-13: graphic interpretation of the 4 steps involved in the oil dispersion technique: soaking in
monomer solution (1), dispersion in hydrophobic medium (2), heating at 60 °C for 5 hours (3) and
cleaning of the resin (4)
In this case the critical step is the second one: the resin needs to be suspended in the
continuous hydrophobic medium under stirring. This should ensure that all excess
solution left on the external surface of the resin particles segregates, thanks to the
centrifuge action exerted by the stirring, and forms droplets away from the resin;
meanwhile, all the solution retained in the pores is still trapped in there and is not able
to leave the pore volume without entering the hydrophobic phase. Note that PS-DVB
resins are hydrophobic, therefore the particles will be easily wetted by the hydrophobic
medium and segregation of the excess monomer solution (which is an aqueous solution)
1 2
3 4

Hydrogel Hydrogel Hydrogel Hydrogel Network in a Porous Resin MatrixNetwork in a Porous Resin MatrixNetwork in a Porous Resin MatrixNetwork in a Porous Resin Matrix a study for chromatographic applications
4 RESULTS
81
should be thermodynamically favored by the resulting hydrophobic effect.
As hydrophobic medium, a synthetic oil was thought to be the ideal candidate: oil
dispersion technique needs a very inert oil, to prevent any reaction between resin and
oil during the polymerization of the gel; thermal stability and good heat-transfer
properties are also desirable. Silicone oil, which is a suitable option in all these regards,
causes a significant increase in the average particle size according to light scattering
analysis run on the treated samples. Furthermore, inspection of the equipment used in
such analysis showed traces of silicone oil on several surfaces that were in contact with
the resin. Based on this observation it was assumed that the noticeable shoulder in the
fine size region in Figure 4-14 is not due to very fine particles (with diameters lesser
than 2 µm), but to small oil droplets.
Figure 4-14: PSD plot of a sample treated with the oil dispersion technique
Cleaning silicone oil requires an effort that makes the whole process unappealing for
industrial production. An efficient cleaning procedure might make this technique
feasible, but the tested cleaning methods did not prove efficient enough in the removal
of silicon oil due to its generally bad compatibility with surfactants.
0
1
2
3
4
5
6
7
1 10 100 1000
vo
lum
e f
rac
tio
n (
%)
particle diameter (µm)
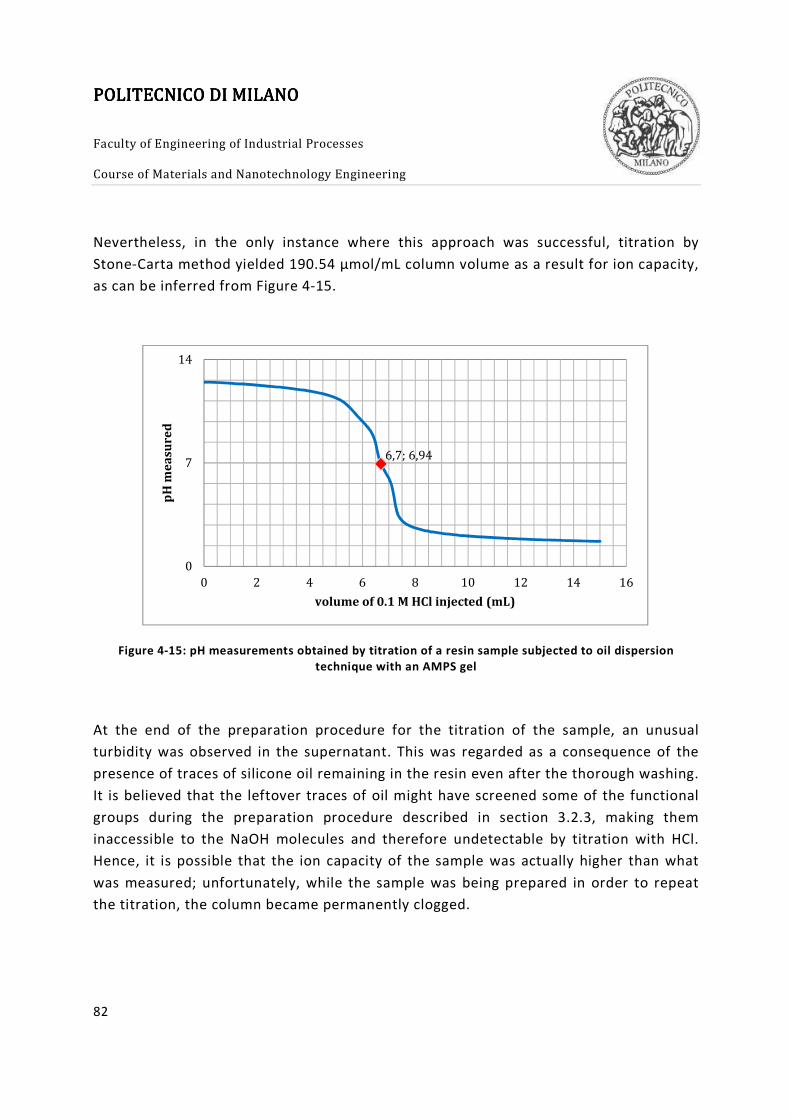
POLITECNICO DI MILANOPOLITECNICO DI MILANOPOLITECNICO DI MILANOPOLITECNICO DI MILANO
Faculty of Engineering of Industrial Processes Course of Materials and Nanotechnology Engineering
82
Nevertheless, in the only instance where this approach was successful, titration by
Stone-Carta method yielded 190.54 µmol/mL column volume as a result for ion capacity,
as can be inferred from Figure 4-15.
Figure 4-15: pH measurements obtained by titration of a resin sample subjected to oil dispersion
technique with an AMPS gel
At the end of the preparation procedure for the titration of the sample, an unusual
turbidity was observed in the supernatant. This was regarded as a consequence of the
presence of traces of silicone oil remaining in the resin even after the thorough washing.
It is believed that the leftover traces of oil might have screened some of the functional
groups during the preparation procedure described in section 3.2.3, making them
inaccessible to the NaOH molecules and therefore undetectable by titration with HCl.
Hence, it is possible that the ion capacity of the sample was actually higher than what
was measured; unfortunately, while the sample was being prepared in order to repeat
the titration, the column became permanently clogged.
6,7; 6,94
0
7
14
0 2 4 6 8 10 12 14 16
pH
me
asu
red
volume of 0.1 M HCl injected (mL)

Hydrogel Hydrogel Hydrogel Hydrogel Network in a Porous Resin MatrixNetwork in a Porous Resin MatrixNetwork in a Porous Resin MatrixNetwork in a Porous Resin Matrix a study for chromatographic applications
4 RESULTS
83
4.4 Liquid penetrant
This technique was originally inspired by a procedure often used in surface analysis,
which is called “dye penetrant inspection”. The procedure consists of 4 steps, summed
up in Figure 4-16 below: first, the specimen to be inspected must be carefully cleaned;
then, a liquid characterized by a bright colour (usually red) is applied on the surface of
the specimen so that it can penetrate any present crack due to capillary suction; after a
proper penetration time, the surface is cleaned once again while leaving the dye inside
the cracks (for example a with a water jet hitting the surface of the specimen in a
tangent direction); finally a proper “developer” is applied over the whole surface, so
that it can absorb the dye left inside the cracks therefore revealing their presence.
Figure 4-16: schematization of the dye penetrant inspection procedure in 6 steps: crack concealed by dirt
(a), precleaning (b), application of the dye (c), intermediate cleaning (d), application of the developer (e),
crack revelation (f)
The idea was to exploit the same principle used by the dye penetrant inspection, in
which capillary action makes the dye penetrate a crack and ensures that it does not
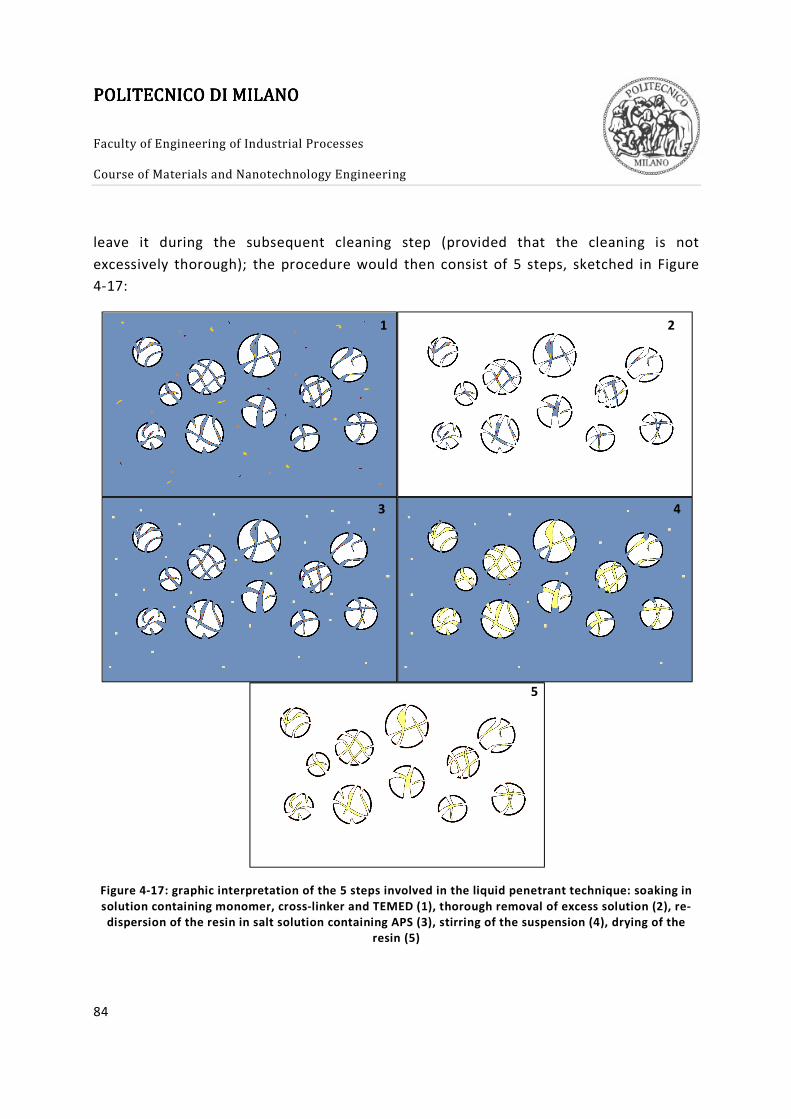
POLITECNICO DI MILANOPOLITECNICO DI MILANOPOLITECNICO DI MILANOPOLITECNICO DI MILANO
Faculty of Engineering of Industrial Processes Course of Materials and Nanotechnology Engineering
84
leave it during the subsequent cleaning step (provided that the cleaning is not
excessively thorough); the procedure would then consist of 5 steps, sketched in Figure
4-17:
Figure 4-17: graphic interpretation of the 5 steps involved in the liquid penetrant technique: soaking in
solution containing monomer, cross-linker and TEMED (1), thorough removal of excess solution (2), re-
dispersion of the resin in salt solution containing APS (3), stirring of the suspension (4), drying of the
resin (5)
1 2
3 4
5

Hydrogel Hydrogel Hydrogel Hydrogel Network in a Porous Resin MatrixNetwork in a Porous Resin MatrixNetwork in a Porous Resin MatrixNetwork in a Porous Resin Matrix a study for chromatographic applications
4 RESULTS
85
The critical step in this procedure would be the second one: the resin must be dried so
that no monomer solution can be found outside the pores in the particles, but some
solution must remain inside those pores, otherwise no functionalization would be
obtained. If this is done correctly, polymerization should happen at step 4: as soon as
the monomer solution in the pores and the initiator from the external solution mix, the
reaction starts. Being that both solutions are aqueous and that the external one is more
diluted, mass transport will take place according to Fick’s first law. The flux of monomer
going out of the pores will be greater than that of initiator entering the same pores
because the volume of the external phase is much greater than that of the pores, so a
great amount of monomer molecules needs to leave the pores to reach equilibrium, while
only a relatively low number of initiator molecules needs to enter the pores to make their
concentration uniform in the whole system: therefore, it is expected that polymerization
will tend to start out of the pores. Since this is undesirable, as already mentioned in
section 1.3, the drying in step 2 must be very accurate, so that the pores are left only
partially filled with monomer solution. If polymerization starts inside the pores, a
polymer network will quickly form due to the fast reaction kinetics in presence of
TEMED (taking only a few seconds, cf. section 4.1.2): once that happens, the polymer
network will significantly hinder diffusion of monomer outside the pores and the
polymerization will continue primarily inside the pores. In fact, the propagation reaction
only needs monomer, which should mainly be found there; monomer units that already
diffused out of the pores may still contribute to polymerization outwards, but their
amount should be negligible with respect to that inside the pores.
This mechanistic picture was purely theoretical and the experimental procedure was
designed to test its soundness: of course the actual outcome largely depends on the first
drying step, before the resin is re-dispersed in the TEMED solution. In order to have
good control over that, it would be necessary to deal with very narrow particle size
distribution, well-defined pore size distribution and perfect control over the pressure
used to sieve out the excess monomer solution.
All columns clogged while the resin treated following this procedure was being packed:
after two minutes while a 20% ethanol solution was flowing through at 1 mL/min rate, a
significant backpressure would quickly arise. Even packing at a very low flow rate of 0.5
mL/min resulted in the column blocking after passing 5 column volumes of eluent.

POLITECNICO DI MILANOPOLITECNICO DI MILANOPOLITECNICO DI MILANOPOLITECNICO DI MILANO
Faculty of Engineering of Industrial Processes Course of Materials and Nanotechnology Engineering
86
Being that the treated resin could not be packed into a column, an alternative to the
method defined in chapter 3.2.3 had to be designed. Following the titration procedure
described in section 3.5, a significant increase in ionic capacity was revealed, amounting
to 166.95 µmol/mL column volume. The complete results of the titration test are
displayed in Figure 4-18.
Figure 4-18: pH measurements obtained by titration of a resin sample subjected to liquid penetrant
technique with AMPS gel
While this increase in capacity is considerable, the inability to pack the resin into a
column is a serious issue. The initial expectation that this technique was not sound
appear to be true: the hydrogel tends to form out of the pores, which leads to fragments
of hydrogel being eroded by the eluent flow used during the packing. These fragments
can drift inside the column until they fill the interstitial spaces through which the mobile
phase is supposed to flow, thus clogging the column. This might be happening because
the amount of monomer solution retained inside the pores of the particles after the first
filtration has moved away from the centre of the particles due to the pressure exerted
by the vacuum pump: this causes the reaction between monomer and initiator to
happen in the proximity of the external surface of the particles, which leads to
19,6; 7,15
0
7
14
0 5 10 15 20 25 30
pH
me
asu
red
volume of 0.1 M HCl injected (mL)

Hydrogel Hydrogel Hydrogel Hydrogel Network in a Porous Resin MatrixNetwork in a Porous Resin MatrixNetwork in a Porous Resin MatrixNetwork in a Porous Resin Matrix a study for chromatographic applications
4 RESULTS
87
formation of hydrogel outside of the pores.
If this was actually the cause of the problem, there could be a few solutions for it, such
as producing PS-DVB resin particles with smaller pores and a narrower pore size
distribution (cfr. Equation 15); even then none of them would grant that no reaction at
all happens outside of the pores, or in the proximity of their end; as was already stated,
AMPS hydrogels can have a strong tendency to swelling, meaning that even a small
amount of gel sticking outside of a pore can lead to column blocking. This technique was
therefore decided to be unfit for the purpose of this research.
4.5 Solution flow-through
The solution flow-through technique was designed to overcome the limitations of all
previously explored techniques: in particular, it was decided to established better
control over the drying step than that achieved in both solution soaking and liquid
penetrant technique; furthermore, it was decided to bypass the issue of the
polymerization of the hydrogel outside the pores by letting the reaction happen in the
pores of resin particles after packing them into the column. This lead to a procedure
that can be summarized in the 4 steps shown in Figure 4-19:
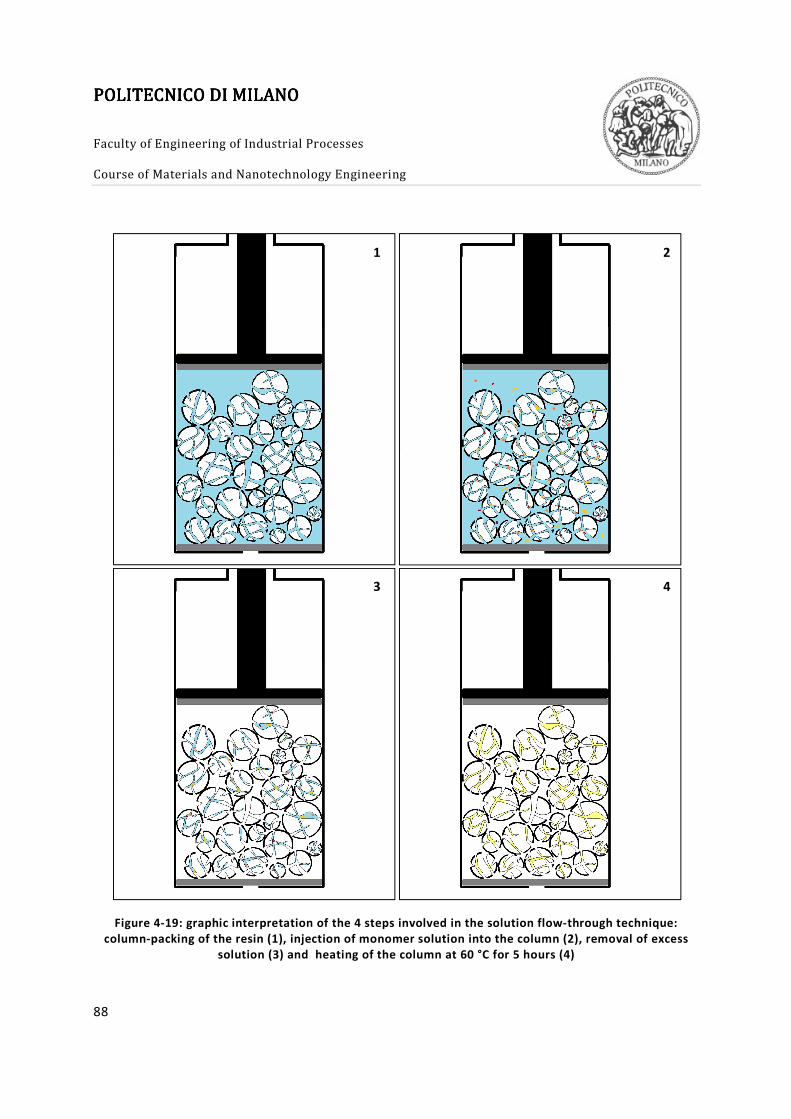
POLITECNICO DI MILANOPOLITECNICO DI MILANOPOLITECNICO DI MILANOPOLITECNICO DI MILANO
Faculty of Engineering of Industrial Processes Course of Materials and Nanotechnology Engineering
88
Figure 4-19: graphic interpretation of the 4 steps involved in the solution flow-through technique:
column-packing of the resin (1), injection of monomer solution into the column (2), removal of excess
solution (3) and heating of the column at 60 °C for 5 hours (4)
1 2
3 4

Hydrogel Hydrogel Hydrogel Hydrogel Network in a Porous Resin MatrixNetwork in a Porous Resin MatrixNetwork in a Porous Resin MatrixNetwork in a Porous Resin Matrix a study for chromatographic applications
4 RESULTS
89
The critical step in this procedure is the third one: only the excess solution must be
ejected, but the rest must be left inside the particles. On the other hand, the distinction
between pores and interstitial spaces is not as important as in the other techniques,
because the formation of hydrogel outside the pores cannot cause issues during the
packing of the resin, since the resin is already packed into a column when
polymerization happen. Removal of the excess solution is only necessary to prevent the
formation of a continuous, massive layer of solid hydrogel across the cross section of
the column that would halt the flow of the mobile phase.
A considerable advantage of this procedure is that the resin particles are confined in a
small known volume: since it is required that the columns involved are able to withstand
a temperature of 60 °C for 5 hours, only PEEK columns could be used. The ones used in
this work had a 4 mm internal diameter and measured 50 mm in length: the internal
volume would then be 628 µL. A typical value for the external porosity of a column
packed with spherical particles is 35-40% [14]; since the porosity of the PS-DVB particles
used in this thesis measured by mercury intrusion was determined to be 83%, the total
porosity of the column is approximately 89%. The excess solution is filling the interstitial
spaces among the particles: the volume of those spaces is given by the column volume
times the external porosity of the column, which in this case is equal to 235 µL. Hence,
in order to measure such volume, it was decided to weigh the amount of solution
ejected during the drying step.
For the first set of experiments, testing the effect of the pressure of the inlet nitrogen
flow during the flushing of the excess solution, only one of the samples could be
successfully titrated: the one in which the nitrogen flow had a 400 mbar pressure. When
titrated by Stone-Carta method, the sample revealed a capacity of 225.81 µmol/mL
column volume. The data from which this result was inferred are given in Figure 4-20.

POLITECNICO DI MILANOPOLITECNICO DI MILANOPOLITECNICO DI MILANOPOLITECNICO DI MILANO
Faculty of Engineering of Industrial Processes Course of Materials and Nanotechnology Engineering
90
Figure 4-20: pH measurements obtained by titration of a resin sample subjected to solution flow-through
technique with AMPS gel
The column prepared using this sample was later tested on a HPLC unit, to evaluate its
chromatographic performance. 0.1 mg of lysozyme were dissolved in 20 µL of a 20 mM
phosphate buffer (pH = 6) and were injected into the column over the course of 1
minute and the recorded chromatogram is shown in Figure 4-21.
11,2; 6,98
0
7
14
0 2 4 6 8 10 12 14
pH
me
asu
red
volume of 0.1 M HCl injected (mL)

Hydrogel Hydrogel Hydrogel Hydrogel Network in a Porous Resin MatrixNetwork in a Porous Resin MatrixNetwork in a Porous Resin MatrixNetwork in a Porous Resin Matrix a study for chromatographic applications
4 RESULTS
91
Figure 4-21: chromatogram for a 20 µL injection of lysozyme on the sample of Figure 4-20
By integrating the eluted peak, it was determined that 10.80 mg of lysozyme were
retained by the column: hence, a capacity of only 1.19 µmol of lysozyme per mL column
volume, or 17.20 mg/mL was calculated (i.e. 25% of the dynamic binging capacity of
Fractogel resins for the same protein [37]). The difference between the two values
measured by the two different titration methods was assumed to be due to the different
nature of the charge carriers involved: in other words, the charged species in the
hydrogel network are too densely packed, resulting in one single protein occupying
many of the sites that can bind each small ion that is injected in the column on a one-to-
one basis. This is a known issue in column chromatography, generally referred to as
“shielding” of the charges.
The next set of experiments aimed at determining the optimal pressure for the nitrogen
flow during the removal of excess solution with more precision. Results are reported in
Table 4-2, and a graphical interpretation is given in Figure 4-22: graphical representation of
the data presented in Figure 4-22 for a better understanding.

POLITECNICO DI MILANOPOLITECNICO DI MILANOPOLITECNICO DI MILANOPOLITECNICO DI MILANO
Faculty of Engineering of Industrial Processes Course of Materials and Nanotechnology Engineering
92
Table 4-2: collected volume of excess solution as a function of the inlet pressure of the nitrogen flow
Nitrogen Pressure (mbar) 250 300 350 400 450
Collected volume (mL) 182.91 378.20 332.88 289.41 63.74
Figure 4-22: graphical representation of the data presented in Table 4-2
Since the flow rate of the monomer solution leaving the column was very low for every
investigated nitrogen pressure, there was no issue of accuracy. The results indicate that
the liquid removal increases at increasing inlet pressure. However, a maximum of
removal is quickly established, most probably because of strong channeling at higher
pressures. The optimal pressure would be the one resulting in the removal of the
external liquid only, while leaving the pores filled with the monomer solution (in
average, capillary forces should be stronger inside the pores than among the resin
particles). Since the volume of external liquid was estimated around 235 µL, pressure
values from 300 to 400 mbar appear to be suitable. Therefore, the pressure which
0 100 200 300 400 500
0
50
100
150
200
250
300
350
400
Pressure of nitrogen flow (mbar)
Vo
lum
e o
f e
ject
ed
so
luti
on
(µ
L)

Hydrogel Hydrogel Hydrogel Hydrogel Network in a Porous Resin MatrixNetwork in a Porous Resin MatrixNetwork in a Porous Resin MatrixNetwork in a Porous Resin Matrix a study for chromatographic applications
4 RESULTS
93
allowed collecting the target amount in the minimum time was elected to be the optimal
pressure, in this case 300 mbar.
None of the specimens made in order to seek the optimal monomer content for the
solution to be injected could be titrated, except for the one with the least monomer
content (sample HG 4 with reference to Table 3-7): all the other columns clogged at
some point during the titration process. Upon inspection of their content, they all
revealed a significant volume of particles glued together, nearly at the end of each
column. The length of these “plugs” of gelled resin changed in every instance, from
approximately 7 mm to 35 mm, which would amount to 14-70% in terms of column
length. A picture of one of these plugs is given in Figure 4-23.
Figure 4-23: gelled resin “plug” found in specimen HG 3

POLITECNICO DI MILANOPOLITECNICO DI MILANOPOLITECNICO DI MILANOPOLITECNICO DI MILANO
Faculty of Engineering of Industrial Processes Course of Materials and Nanotechnology Engineering
94
The plug in sample HG 1 was placed in a 15 mL vial and soaked in a 20% ethanol
solution. After only a few seconds, the plug doubled its volume, then it continued
swelling at significantly slower rate. It reached a volume of about 15 mL in the end,
which would be equal to approximately 24 times the initial volume.
As for the one specimen that could actually be titrated by Stone-Carta method, the
resulting capacity for ions was 316.67 µmol/mL column volume.
Regarding the experiments on AETAC gels, it could be easily noted that the sulfonated
resin does not need a packing procedure as long and precise as that used for standard
PS-DVB resin: the reduced hydrophobicity of the functionalized resin means that its
particles are much easier to pack.
An ionic capacity as high as 208.33 µmol/mL column volume was measured by titration
of the samples obtained, as can be deducted from Figure 4-24.
Figure 4-24: pH measurements obtained by titration of a resin sample subjected to solution flow-through
technique with AETAC gel
23,74; 6,94
0
7
14
0 5 10 15 20 25 30
pH
me
asu
red
volume of 0.1 M NaOH injected (mL)

Hydrogel Hydrogel Hydrogel Hydrogel Network in a Porous Resin MatrixNetwork in a Porous Resin MatrixNetwork in a Porous Resin MatrixNetwork in a Porous Resin Matrix a study for chromatographic applications
4 RESULTS
95
This sample was also tested for protein capacity. This time, it was decided to measure it
by ultraviolet-visible spectrophotometry: this analysis measures the equilibrium binding
capacity of a material, meaning that kinetic effects are neglected. This was done in order
to be able to discern whether the reduction in capacity encountered when separating
proteins was in fact due to screening effects, or if it was actually an issue with protein
diffusion being excessively slow in the hydrogel medium.
The spectra measured by the spectrometer showed a peak at 278 nm for all reference
samples: the absorbance of each peak was noted and is reported in Table 4-3.
Table 4-3: results of UV-Vis analysis for all reference samples
Sample 1 Sample 2 Sample 3
Albumin
concentration
(mg/mL)
0.5 1.0 1.5
Absorbance at 278 nm
(AU) 0.21 0.43 0.66
It is important to observe that these results seem to indicate a linear dependence of the
measurable absorbance on the albumin concentration, as expected. This can be easily
seen in Figure 4-25 below.
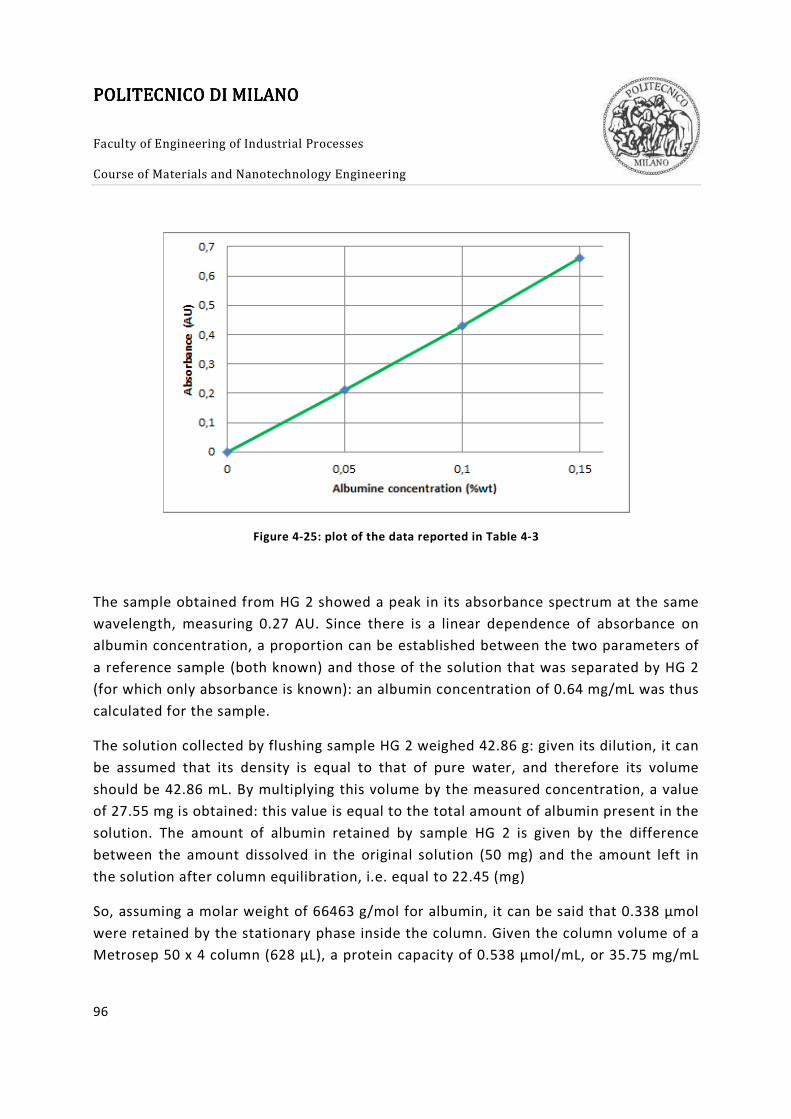
POLITECNICO DI MILANOPOLITECNICO DI MILANOPOLITECNICO DI MILANOPOLITECNICO DI MILANO
Faculty of Engineering of Industrial Processes Course of Materials and Nanotechnology Engineering
96
Figure 4-25: plot of the data reported in Table 4-3
The sample obtained from HG 2 showed a peak in its absorbance spectrum at the same
wavelength, measuring 0.27 AU. Since there is a linear dependence of absorbance on
albumin concentration, a proportion can be established between the two parameters of
a reference sample (both known) and those of the solution that was separated by HG 2
(for which only absorbance is known): an albumin concentration of 0.64 mg/mL was thus
calculated for the sample.
The solution collected by flushing sample HG 2 weighed 42.86 g: given its dilution, it can
be assumed that its density is equal to that of pure water, and therefore its volume
should be 42.86 mL. By multiplying this volume by the measured concentration, a value
of 27.55 mg is obtained: this value is equal to the total amount of albumin present in the
solution. The amount of albumin retained by sample HG 2 is given by the difference
between the amount dissolved in the original solution (50 mg) and the amount left in
the solution after column equilibration, i.e. equal to 22.45 (mg)
So, assuming a molar weight of 66463 g/mol for albumin, it can be said that 0.338 µmol
were retained by the stationary phase inside the column. Given the column volume of a
Metrosep 50 x 4 column (628 µL), a protein capacity of 0.538 µmol/mL, or 35.75 mg/mL
Hydrogel Hydrogel Hydrogel Hydrogel Network in a Porous Resin MatrixNetwork in a Porous Resin MatrixNetwork in a Porous Resin MatrixNetwork in a Porous Resin Matrix a study for chromatographic applications
4 RESULTS
97
column volume (i.e. 36% of the capacity of Fractogel resin for a similar protein reported
on its producer’s website) was measured. Since this value is some orders of magnitude
lower than the one that was gained for ion capacity, it can be deduced that the major
issue for protein separation using this type of materials is in fact the shielding effect,
more than diffusion limitations. This theory is also supported by the fact that the
capacities for proteins measured by HPLC and by UV-Vis are similar: static and dynamic
binding capacities are significantly different even for commercial materials, and the
difference measured for the material produced with the flow-through technique is not
much larger; this means that this material is possibly more susceptible to diffusion
limitations than most commercial resins for biochromatography, but only so slightly that
it can still offer a viable alternative to those other materials.
However, it should be pointed out that the shielding effect can only reduce the capacity
for proteins (with respect to the capacity for ions measured by means of titration) so
much: a single protein can have many positively charged groups interacting with a
stationary phase, typically a few dozens. If the shielding effect was the sole responsible
for the difference between the two measured capacities for the material, it would mean
that one protein is occupying 500-1000 charges; this is an unusually large value that
could only be justified by a high charge density in the hydrogel network: albumin
proteins usually have a hydrodynamic radius of about 5 nm [38], so in the volume
occupied by one (500 nm3 ca.) there should be 500-1000 monomer units, which would
translate to a charge density of 1-2 charges per nm3; assuming an average value of 1.5
charges per nm3 and rearranging dimensions, this value can be translated to 2490.87
µmol/mL of charge density in the hydrogel.
Titration data revealed that the total number of charges present in 1 mL of packed
material produced by this procedure is 208.33 µmol. By comparing the charge density of
the hydrogel with this value, it can be inferred that 8.4% of the column volume is
occupied by hydrogel, i.e. 0.053 mL. This is in contrast with experimental data: given
that the bed porosity is 35-40% and the pore volume of the resin measured by mercury
intrusion is 83.11%, 0.554 mL is the total volume accessible to the monomer solution
after the resin is packed into a column; being that 0.311 mL of solution were collected
from sample HG2 during the nitrogen injection step, it is expected that 0.243 mL of the
column volume are occupied by hydrogel (neglecting the effect of swelling on its
volume).

POLITECNICO DI MILANOPOLITECNICO DI MILANOPOLITECNICO DI MILANOPOLITECNICO DI MILANO
Faculty of Engineering of Industrial Processes Course of Materials and Nanotechnology Engineering
98
This seems to indicate that only 22% of the solution left inside the column after nitrogen
injection polymerized into a hydrogel. That could be explained by electrostatic
interaction between monomer and resin affecting the concentration gradient of
monomer in the fluid phase before polymerization: this means that the concentration of
monomer in the proximity of the resin is much higher than in the rest of the fluid phase,
leading to local polymerization. Note that this idea is consistent with the observation of
monomer solutions with 5% monomer concentration (such as those used for sample
HG2 and most specimen produced for the solution flow-through technique) not
polymerizing in bulk, as reported in section 4.1.2. Another effect that can lead to
incomplete polymerization is radical capture by oxygen; the procedure requires refitting
the column caps after flushing with nitrogen. During this step, the packing material is
exposed to air and oxygen can be absorbed into the liquid phase.
If either of these hypotheses was true, a significant amount of the monomer solution
retained inside the pores would not polymerize into a hydrogel after heating, and would
be eluted during the titration steps.
If this issue could be solved (e.g. by increasing the monomer and/or initiator
concentration in the monomer solution, by decreasing the charge density on the
functionalized resin, or by reducing the average pore diameter) and all of the retained
monomer solution could be made into a hydrogel, a significant improvement could be
expected.

5 Conclusions and outlook
In this chapter, an evaluation of all the results that were gathered over the course of
this thesis is given. Possible improvements to be applied in future studies are also
suggested.

POLITECNICO DI MILANOPOLITECNICO DI MILANOPOLITECNICO DI MILANOPOLITECNICO DI MILANO
Faculty of Engineering of Industrial Processes Course of Materials and Nanotechnology Engineering
100
The studied material needs to be improved before it can become interesting for
industrial purposes. There are three main issues that were encountered during this
work: limited service life, loss of capacity and charge shielding. The specific results of
each of the four techniques proposed for producing the desired material are hereby
summarized in Table 5-1.
Table 5-1: summary of results and comments about each of the four proposed techniques
Solution
soaking Oil dispersion
Liquid
penetrant
Solution flow-
through
Success in
producing a
working sample
with increased
capacity
Yes Yes No Yes
Highest ion
capacity obtained
(µmol/mL column
volume)
360 190 170 320
Reproducibility of
the result No No No Yes
Number of eluted
column volumes
before clogging
10-50 100 (ca) 5-20 500 (ca)
Loss of capacity Yes Yes Yes No
Specific issues
encountered with
produced
samples
Not working Cleaning Clogging Charge
shielding
Possible
improvements None
Devising a
more efficient
cleaning
procedure
Producing resin
with narrower
PSD and pore
size
distribution
Producing resin
with narrower
PSD and pore
size
distribution
Hydrogel Network in a Porous Resin MatrixHydrogel Network in a Porous Resin MatrixHydrogel Network in a Porous Resin MatrixHydrogel Network in a Porous Resin Matrix a study for chromatographic applications
5 CONCLUSION AND OUTLOOK
101
Although some of the produced samples were promisingly good in terms of capacity,
they seemed to lose their properties after processing less than 100 column volumes of
protein solution. When the specimens were used to separate ions, they would block
after 200-500 column volumes of aqueous solution processed; even before then,
whenever it was possible to run multiple measurements for the capacity of the
stationary phase, the value seemed to decrease.
Out of the four proposed techniques, the solution flow-through process seems to be the
most reliable in producing a composite material with increased capacity, at least with
the materials that were used in this study; all columns produced using this procedure
showed a significant increase in capacity and, with a careful design of the composition
of the hydrogel, it was possible to consistently produce and titrate the material.
One of the major issues that was encountered with the first specimens produced, where
columns would block after being injected with a few hundreds of column volumes, could
be addressed by reducing swelling of the hydrogel: those columns in which the
composition of the hydrogel was designed so that swelling would be minimal did not
block even after 1000 column volumes of injection. Minimization of swelling of the
hydrogel is therefore thought to be of critical importance.
To reduce swelling by adjusting the composition of the hydrogel, two possibilities exist:
the first is to increase cross-linking; the second is to increase the monomer
concentration. As it was stated at the end of section 4.1, the effect of increasing the
concentration of cross-linker in the monomer solution was quickly vanishing, so that it is
effective to add MBAA up to its solubility limit (cfr. section 4.1.5); the amount of
monomer present in solution has much less effect at concentrations higher than 10% in
weight on the other hand. Therefore, the optimal course of action is to produce 10%
monomer solutions and use the maximum concentration of cross-linker allowed by
solubility. With the monomers used in this research and MBAA as a cross-linker, a
concentration of 15% in weight for the cross-linker was used and found to be working
well.
Using such a composition for the hydrogel seemed to solve the issue with the limited
service life of the first specimens produced, and also to significantly reduce (if not
remove) the effect of loss in capacity that was often encountered with those specimens.

POLITECNICO DI MILANOPOLITECNICO DI MILANOPOLITECNICO DI MILANOPOLITECNICO DI MILANO
Faculty of Engineering of Industrial Processes Course of Materials and Nanotechnology Engineering
102
The third problem however proved to be more difficult to solve: shielding of the charges
present on the surface of a stationary phase is a well-known issue in chromatography,
and it cannot be removed without significantly reducing the overall capacity of the
material. To completely suppress shielding, one would have to reduce the density of
charges in the stationary phase. This means to either increase the volume occupied by
electrostatically charged groups (or by gel, in the present case) while keeping the
number of charged groups constant, or to reduce the number of charged groups while
keeping the volume constant. While the latter approach has no practical utility (it would
reduce the capacity towards ions without affecting the capacity for proteins), the former
could actually improve performances of the studied material.
The ideal way to increase the volume occupied by the hydrogel would be to enhance the
capillary forces acting on the monomer solution inside the pores before polymerization
of the gel. This would ensure that a larger fraction of the total pore volume is actually
filled by gel after polymerization, which would in turn increase the total capacity of the
material. One way to achieve this would be to reduce the average pore diameter of the
resin: In fact, Equation (16) states that as a first approximation the capillary pressure in
a porous medium is proportional to the reciprocal of the radius of the capillary
containing the fluid; also, for a very narrow pore size distribution the λ parameter in
Equation (15) tends to 1, which drastically reduces the influence of other material
characteristics (i.e. pore size distribution and normalized water saturation) on the
capillary pressure in the medium.
It can also be noted that Equation (15) seems to indicate that by broadening the pore
size distribution the capillary forces inside the pores could be further increased: this is
inaccurate, because doing so would increase the capillary forces inside the medium as a
whole, but not necessarily inside the individual pores; in fact, having a broad pore size
distribution would mean that large pores would be present as well as narrow ones, and
capillary forces would be significantly weaker in those large pores than in the narrower
ones, leading to poor liquid retention characteristics of the material, as is highlighted in
Figure 5-1: in it two hypothetical pore size distributions (amounting to the same total
pore volume) are plotted on the same diagram; the black line divides the pores with a
diameter larger than an arbitrary value (0.5 µm), which, according to Equation (16),
identifies a certain pressure for which all pores with a diameter larger than that will be
emptied. The picture below makes it clear that a larger amount of liquid will be retained

Hydrogel Network in a Porous Resin MatrixHydrogel Network in a Porous Resin MatrixHydrogel Network in a Porous Resin MatrixHydrogel Network in a Porous Resin Matrix a study for chromatographic applications
5 CONCLUSION AND OUTLOOK
103
by the resin having the narrower pore size distribution (the volume emptied by the
arbitrary pressure is highlighted).
Figure 5-1: effect of broad (red) and narrow (blue) pore size distribution on volume of retained liquid
In conclusion, it is believed that further investigations on the presented material could
make it suitable for industrial purposes: in particular, it would be advisable to assess the
effect of a narrower average pore diameter of the resin particles, and to always
minimize swelling of the hydrogel by carefully designing its chemical composition.
Considering the values obtained for protein separation on a HPLC device, a capacity
comparable with that of popular commercial materials such as Fractogel by Merck
Millipore seem to be obtainable, after the suggested improvements to the material have
been made.

POLITECNICO DI MILANOPOLITECNICO DI MILANOPOLITECNICO DI MILANOPOLITECNICO DI MILANO
Faculty of Engineering of Industrial Processes Course of Materials and Nanotechnology Engineering
104

6 Bibliography
[1] M. S. Tswett, "On a new category of adsorption phenomena and on its application to
biochemical analysis," Proceedings of the Warsaw Society of Naturalists (Biology
Section), vol. 14, no. 6, pp. 20-39, 1905.
[2] Waters, "HPLC - High Performance Liquid Chromatography," Waters - the science of
what's possible, [Online]. Available: http://www.waters.com/waters/it_IT/HPLC---
High-Performance-Liquid-Chromatography/nav.htm?cid=10048919&locale=it_IT.
[Accessed 5 June 2014].
[3] H. Schmidt-Traub, Preparative Chromatography of Fine Chemicals and
Pharmaceutical Agents, Weinheim: Wiley-VCH , 2005.
[4] S. Mahler, Monoclonal Antibodies Production – Downstream Processing and Process
Economics, Queensland, AUS: AIBN, 2009.
[5] F. Gritti and G. Guiochon, "The current evolution in column technology: how it
began, where is it going?," Journal of Chromatography A, vol. 1228, pp. 2-19, 2012.
[6] C. F. Poole, The Essence Of Chromatography, Amsterdam, NL: Elsevier Science B.V.,
2003.
[7] J. Y. He, Z. L. Zhang, H. Kristiansen, K. Redford, G. Fonnum and G. I. Modahl,
"Crosslinking effect on the deformation and fracture of monodisperse polystyrene-
co-divinylbenzene particles," eXPRESS Polymer Letters, vol. 7, no. 4, pp. 365-374,
2013.
[8] L. R. Snyder and J. J. Kirkland, Introduction to Modern Liquid Chromatography, New
York: Wiley-Interscience, 1979.
[9] F. Gritti, I. Leonardis, J. Abia and G. Guiochon, "Physical properties and structures of
fine core-shell particles used as packing materials for chromatography -
Relationships between particle characteristics and column performance," Journal of
Chromatography A, vol. 1217, pp. 3819-3843, 2010.
POLITECNICO DI MILANOPOLITECNICO DI MILANOPOLITECNICO DI MILANOPOLITECNICO DI MILANO
Faculty of Engineering of Industrial Processes Course of Materials and Nanotechnology Engineering
106
[10] C. C. Lin and A. T. Metters, "Hydrogels in controlled release formulations: network
design and mathematical modeling," Advanced Drug Delivery Reviews, vol. 58, no.
12-13, pp. 1379-1408, 2006.
[11] S. Q. Liu, R. Tay, M. Khan, P. L. R. Ee, J. L. Hendrick and Y. Y. Yang, "Synthetic
Hydrogels for Controlled Stem Cell Differentiation," Soft Matter, no. 6, pp. 67-81,
2010.
[12] C. W. Huck and G. K. Bonn, "Poly(Styrene-Divinylbenzene) Based Media for Liquid
Chromatography," Chemical Engineering and Technology, vol. 28, no. 12, pp. 1457-
1472, 2005.
[13] B. Amsden, "Solute Diffusion within Hydrogels. Mechanisms and Models,"
Macromolecules, no. 31, pp. 8382-8395, 1998.
[14] F. Gritti and G. Guiochon, "Mass transfer kinetics, band broadening and column
efficiency," Journal of Chromatography, vol. A, no. 1221, pp. 2-40, 2012.
[15] S. M. Howdle, K. Jeràbek, V. Leocorbo, P. C. Marr and D. C. Sherrington, "Revesibly
collapsible macroporous poly(styrene-divinylbenzene) resins," Polymer, vol. 41, no.
19, pp. 7273-7277, 2000.
[16] M. C. Stone and G. Carta, "Protein adsorption and transport in agarose and dextran-
grafted agarose media for ion exchange chromatography," Journal of
Chromatography A, no. 1146, p. 202, 2007.
[17] A. D. McNought and A. Wilkinson, IUPAC. Compendium of Chemical Terminology
(the "Gold Book"), Oxford: Blackwell Scientific Publications, 1997.
[18] U. W. Gedde, Polymer Physics, Berlin: Springer, 1995.
[19] M. Rubinstein and R. H. Colby, Polymer Physics, Oxford: Oxford University Press,
2003.
[20] J. H. Allison, H. C. Agrawal and B. W. Moore, "Effect of N,N,N,N-
tetramethylethylenediamine on the migration of proteins in SDS polyacrylamide

Hydrogel Network in a Porous Resin MatrixHydrogel Network in a Porous Resin MatrixHydrogel Network in a Porous Resin MatrixHydrogel Network in a Porous Resin Matrix a study for chromatographic applications
6 BIBLIOGRAPHY
107
gels," Analytical Biochemistry, no. 58, pp. 592-601, 1974.
[21] A. D. Schlüter, Synthesis of Polymers, New York: Wiley-VCH, Weinheim, 1999.
[22] J. W. Moore, Kinetics and Mechanism, New York: Wiley VCH, 1981.
[23] P. C. Hiemenz and T. P. Lodge, Polymer Chemistry, Boca Raton: CRC Press, 2007.
[24] K. Matyjaszwski and T. P. Davis, Handbook of Radical Polymerization, New York:
Wiley-VCH, 2002.
[25] P. J. Flory and J. Rehner, "Statistical theory of chain configuration and physical
properties of high polymers," Annals of the New York Academy of Sciences, vol. 44,
pp. 419-429, 1943.
[26] J. P. Baker, L. H. Hong, H. W. Blanch and J. M. Prausnitz, "Effect of Initial Total
Monomer Concentration on the Swelling Behavior of Cationic Acrylamide-Based
Hydrogels," Macromolecules, vol. 6, no. 27, pp. 1446-1454, 1994.
[27] B. A. Mann, K. Kremer and C. Holm, "The Swelling Behavior of Charged Hydrogels,"
Macromolecular Symoposia, vol. 237, no. 1, pp. 90-107, 2006.
[28] A. J. P. Martin and R. L. M. Synge, "A new form of chromatogram employing two
liquid phases," Biochemical Journal, no. 35, pp. 1358-1368, 1941.
[29] J. J. van Deemter, F. J. Zuiderweg and A. Klinkenberg, "Longitudinal diffusion and
resistance to mass transfer as causes of non ideality in chromatography," Chemical
Engineering Science, no. 5, pp. 271-289, 1956.
[30] GE Healthcare, "Products: Packing Equipment," General Electric, [Online]. Available:
http://www.gelifesciences.com/webapp/wcs/stores/servlet/productById/it/GELifeSc
iences/18115324. [Accessed 16 May 2014].
[31] Metrohm Italiana s.r.l., "Colonne IC trap per la purificazione di eluenti in sistemi a
gradiente," Metrohm s.r.l., [Online]. Available:
POLITECNICO DI MILANOPOLITECNICO DI MILANOPOLITECNICO DI MILANOPOLITECNICO DI MILANO
Faculty of Engineering of Industrial Processes Course of Materials and Nanotechnology Engineering
108
http://www.metrohm.it/Produkte2/IC/ColumsTrap.html. [Accessed 15 May 2014].
[32] R. H. Brooks and A. T. Corey, "Hydraulic properties of porous media," Hydrology
Papers, no. 3, 1964.
[33] D. J. Timlin, L. R. Ahuja, Y. Pachepsky, R. D. Williams, D. Gimenez and W. Rawls, "Use
of Brooks-Corey Parameters to Improve Estimates of Saturated Conductivity," Soil
Science Society of America Journal, vol. 63, 1999.
[34] D. A. Markgraf, Film Extrusion Manual, II ed., Norcross, GA: TAPPI Press, 2005, p.
299.
[35] M. Strobel, P. A. Thomas and C. S. Lyons, "Plasma fluorination of polystyrene,"
Journal of Polymer Science Part A: Polymer Chemistry, vol. 25, no. 12, pp. 3343-
3348, 1987.
[36] S. Moore, D. H. Spackman and W. H. Stein, "Chromatography of Amino Acids on
Sulphonated Styrene Resins," Analytical Chemistry, vol. 7, no. 30, pp. 1185-1190,
1958.
[37] Y. Kubo, K. Muranaka, S. Nakatani, H. Moriyama, K. Nakamura and Y. Yasuda, "Novel
High Binding Capacity Ion Exchange Resins For Biochromatography," in ISPPP,
Orlando (FL), 2007.
[38] M. A. Kiselev, I. A. Gryzunov, G. E. Dobretsov and M. N. Komarova, "Size of a human
serum albumin molecule in solution," Biofizika, vol. 3, no. 46, pp. 423-427, 2001.
[39] J. Jury, "An account of some experiments shown before the Royal Society; with an
enquiry into the cause of some of the ascent and suspension of water in capillary
tubes," Philosophical Transactions of the Royal Society of London, vol. 30, pp. 739-
747, 1718.
[40] A. Eon-Duval and G. Burke, "Purification of pharmaceutical-grade plasmid DNA by
anion-exchange chromatography in an RNase-free process," Journal of
Chromatography B, no. 804, pp. 327-335, 2004.

Hydrogel Network in a Porous Resin MatrixHydrogel Network in a Porous Resin MatrixHydrogel Network in a Porous Resin MatrixHydrogel Network in a Porous Resin Matrix a study for chromatographic applications
6 BIBLIOGRAPHY
109

7 Acknowledgements
This thesis was the result of a great deal of time and effort, which could not possibly have
been born of just one person: hence, the author now wishes to acknowledge the merits of
all those who have contributed to this work, one way or another:
Professor Massimo Morbidelli, who trusted me with the job in the first place: without him
I would never have had the chance to spend a semester in a chemical laboratory abroad; I
do not know yet how this will influence my life in the near future, but it surely increased
my interest in looking for a career abroad. And I think this is a great gift.
Doctor Bastian Brand, who had the original idea for the project and assisted me from the
beginning to the end of it; but most importantly, he taught me more than most teachers I
have met in my life. He was a the greatest “boss” I could have imagined, and I hope I will
meet him again one day.
Professor Giuseppe Storti, who has been incredibly supportive and present during the
whole duration of the study: a priceless asset, and also a great teacher, who could point
me the right way with just a few words whenever I needed it, even when I thought I was
completely lost.
My parents, who always supported me, even if I failed to understand that some times.
They always tried to give me what I needed most, whether I wanted it or not, especially
during the last year. I owe you everything.
My grandmothers, who prayed for me, my well-being and for success in my efforts on
daily basis. The ways of the Lord are mysterious (and sometimes twisted), but it seems
that in the end He let me succeed.
Mattia, who is the kindest man I have ever met and the best friend a man could wish for. I
relied on him for a lot of bothersome tasks which lead him through a great deal of
trouble, but he kept being careless about it, and never mentioned any of that. Sometimes
your greatness makes me feel like a lesser man, but this also gives me an urge to improve
myself, and I have to thank you for that.
Riccardo, who has a special talent he may not even be aware of: he can simplify every
problem, even those that seem insurmountable, making them look easy to overcome.

Hydrogel Network in a Porous Resin MatrixHydrogel Network in a Porous Resin MatrixHydrogel Network in a Porous Resin MatrixHydrogel Network in a Porous Resin Matrix a study for chromatographic applications
7 ACKNOWLEDGEMENTS
111
They say it is the prime feat for an engineer, but I am afraid you outweigh me a great deal
in this regard. Without your advice, I am not sure I would have taken up this last
challenge.
Giulio, who is always keen on spending time with me, despite the unspeakable horrors we
have witnessed together, and the amounts of resources I have costed him. You are a great
friend, and I hope to always have you by my side.
Finally I wish to thank all my other friends, who are too many to be mentioned here one
by one: were it not for you guys, I would have graduated two years ago. But, I would not
have enjoyed this journey in the least without you!