Policy Regulated Management of Schema Evolution … · Policy Regulated Management of Schema...
162
National Technical University of Athens SCHOOL OF ELECTRICAL AND COMPUTER ENGINEERING DIVISION OF COMPUTER SCIENCE Policy Regulated Management of Schema Evolution in Database–centric Environments PhD Thesis Of George Papastefanatos Diploma in Electrical and Computer Engineering (2000) Athens, February 2009
Transcript of Policy Regulated Management of Schema Evolution … · Policy Regulated Management of Schema...

National Technical University of Athens
SCHOOL OF ELECTRICAL AND COMPUTER ENGINEERING
DIVISION OF COMPUTER SCIENCE
Policy Regulated Management of Schema Evolution in Database–centric Environments
PhD Thesis
Of
George Papastefanatos
Diploma in Electrical and Computer Engineering (2000)
Athens, February 2009


NATIONAL TECHNICAL UNIVERSITY OF ATHENS
SCHOOL OF ELECTRICAL AND COMPUTER ENGINEERING
DIVISION OF COMPUTER SCIENCE
Policy Regulated Management of Schema Evolution in Database–centric Environments
PhD Thesis
Of
George Papastefanatos
Diploma in Electrical and Computer Engineering (2000)
Supervising Committee: Y. Vassiliou T. Sellis
G. Mentzas
Approved by the Examination Committee, 2nd February 2009.
...... Y.Vassiliou Professor N.T.U.A.
...... T. Sellis Professor N.T.U.A.
...... G. Mentzas Professor N.T.U.A.
...... P.Konstantopoulos Professor Athens Univ. of Economics and Business
...... K. Kontogiannis Associate Professor N.T.U.A.
...... Y.Theodoridis Associate Professor University of Piraeus
...... P.Vassiliadis Assistant Professor University of Ioannina
Athens, February 2009

George Papastefanatos Ph.D. Electrical and Computer Engineering N.T.U.A. © 2009 – All rights reserved

i
Contents
1. Introduction ................................................................................................................... 11
1.1 Research Challenges in Database Schema Evolution .............................................. 12
1.2 Contributions of this Thesis ..................................................................................... 15 1.3 Roadmap of the Thesis ............................................................................................. 17
2. Graph Representation of Database-Centric Environments ..................................... 21
2.1 Visualization and Representation Techniques for Database Systems ...................... 22
2.2 Modeling Database-centric Environments as Graphs .............................................. 24
2.3 Relations ................................................................................................................... 26 2.4 Database Constraints / Conditions ........................................................................... 26
2.4.1 Conditions ......................................................................................................... 27 2.4.2 Database Constraints ......................................................................................... 27
2.4.2.1 Primary Key Constraints ............................................................................... 28
2.4.2.2 Foreign Key Constraint ................................................................................. 28
2.4.2.3 Unique Key Constraints ................................................................................ 29
2.4.2.4 NOT NULL Constraints ................................................................................ 30
2.4.2.5 Check Constraints ......................................................................................... 30 2.5 Queries ..................................................................................................................... 31
2.5.1 Select-Project-Join (SPJ) flat queries................................................................ 31
2.5.2 Select-Project-Group (SPG) flat queries ........................................................... 35
2.5.3 Nested queries ................................................................................................... 37 2.5.4 Self-Join queries................................................................................................ 38
2.6 Functions .................................................................................................................. 39 2.7 Views ........................................................................................................................ 39 2.8 DML Statements ...................................................................................................... 40 2.9 Breaking the Graph into Modules ............................................................................ 41 2.10 Zooming Out the Graph ........................................................................................... 43 2.11 Summary .................................................................................................................. 44
3. Framework for Regulating Database Schema Evolution .......................................... 45
3.1 Management of Schema Evolution in Database Systems ........................................ 47
3.1.1 Relational Schema Evolution and Versioning .................................................. 47
3.1.2 Object – Oriented Schema Evolution ............................................................... 48
3.1.3 Model Management and Schema Mappings ..................................................... 49
3.1.4 Schema Evolution in Data Warehouses ............................................................ 50
3.1.5 View adaptation to Schema Evolution .............................................................. 51

3.1.6 Comparison with Related Work........................................................................ 52
3.2 Motivating example.................................................................................................. 54 3.3 Regulating Schema Evolution .................................................................................. 56 3.4 Algorithm Propagate Changes ................................................................................. 61 3.5 Tuning the propagation of changes .......................................................................... 62
3.5.1 Determining the Prevailing Policy .................................................................... 62
3.5.1.1 On-demand resolution ................................................................................... 63
3.5.1.2 A-priori resolution ......................................................................................... 65 3.5.1.3 Completeness ................................................................................................ 66
3.5.2 Determination of a node’s status....................................................................... 66
3.5.3 Next to Signal - Optimization and Pruning....................................................... 67
3.6 Experimental Evaluation .......................................................................................... 68 3.6.1 Effectiveness of Workflow Adaptation to Evolution Changes ......................... 70
3.6.2 Effectiveness of Workflow Annotation ............................................................. 72
3.6.3 Efficiently Adapting ETL Workflows to Evolution Changes ........................... 75
3.7 Summary .................................................................................................................. 77
4. Language Extensions for Regulating Database Schema Evolution .......................... 79
4.1 Extensions of SQL for Schema Evolution ............................................................... 81
4.2 Database-wide Default Values ................................................................................. 82 4.3 Top Level Constructs ............................................................................................... 83
4.3.1 Relations ........................................................................................................... 84 4.3.2 Views ................................................................................................................ 84 4.3.3 Queries .............................................................................................................. 85
4.4 Fine Grain Constructs............................................................................................... 86 4.4.1 Attributes........................................................................................................... 86 4.4.2 Constraints ........................................................................................................ 87 4.4.3 Conditions ......................................................................................................... 88
4.5 Evaluation of Language Extensions ......................................................................... 89 4.6 Summary – Discussion ............................................................................................. 90
5. A Metric Suite for Evaluating the Evolution of Database Systems .......................... 93
5.1 Related Work on Database Design Metrics ............................................................. 97
5.1.1 Conceptual Metrics ........................................................................................... 97 5.1.2 Relational Database Metrics ........................................................................... 100
5.1.3 Quality in Data Warehouses - Metrics ............................................................ 101
5.1.4 Entropy based approaches............................................................................... 104
5.2 A Metric Suite for Evaluating Schema Evolution Capabilities.............................. 105
5.2.1 Degree-related metrics .................................................................................... 105 5.2.2 Metrics with an eye for future events ............................................................. 108
5.2.3 Policy aware metrics ....................................................................................... 110
iii
5.2.4 Entropy-based metrics .................................................................................... 110 5.3 Experimental Evaluation ........................................................................................ 114
5.3.1 Effectiveness of the proposed metrics ............................................................ 116
5.3.2 Comparison of alternative design configurations ........................................... 120
5.4 Summary ................................................................................................................ 121
6. Hecataeus: An Impact Prediction Framework for Database Schema Evolution .. 123
6.1 System Architecture ............................................................................................... 125 6.2 Hecataeus’ Functionality ........................................................................................ 126
6.2.1 Creating the Evolution Graph from SQL files ................................................ 126
6.2.2 Editing the Evolution Graph ........................................................................... 127
6.2.3 Abstracting the Evolution Graph .................................................................... 128
6.2.4 Creating Evolution Scenarios ......................................................................... 129
6.2.4.1 Defining Events ........................................................................................... 129 6.2.4.2 Defining Policies ......................................................................................... 130 6.2.4.3 Highlighting the Impact of Changes ........................................................... 133
6.2.5 Saving Scenarios ............................................................................................. 133 6.2.6 Evaluating Metrics on the Graph .................................................................... 134
6.3 Summary ................................................................................................................ 136
7. Conclusions and Future Work .................................................................................. 137
7.1 Conclusions ............................................................................................................ 137 7.2 Future Work ........................................................................................................... 139
Bibliography ........................................................................................................................ 143
Appendix .............................................................................................................................. 153


v
List of Figures
Figure 1.1: A typical complex Information System going through structural changes .......... 12
Figure 1.2: Framework for the management of database schema evolution .......................... 16
Figure 2.1: Relation Graph ..................................................................................................... 26 Figure 2.2: Primary Key Constraint Graph ............................................................................. 28 Figure 2.3: Foreign Key Constraint Graph ............................................................................. 29 Figure 2.4: Combining Primary Key and Foreign Key Constraints ....................................... 29
Figure 2.5: Unique Constraint Graph...................................................................................... 30 Figure 2.6: Not Null Constraint Graph ................................................................................... 30 Figure 2.7: Check Constraint Graph ....................................................................................... 31 Figure 2.8: Select Part of the Query........................................................................................ 33 Figure 2.9: From Part of the Query ......................................................................................... 34 Figure 2.10: Where Part of the Query ..................................................................................... 34 Figure 2.11: Graph for SPJ query ........................................................................................... 35 Figure 2.12: Graph for Group By Query ................................................................................ 37 Figure 2.13: Nested Query ...................................................................................................... 38 Figure 2.14: Graph for Self-Join Query .................................................................................. 39 Figure 2.15: Modularization of the graph ............................................................................... 43 Figure 2.16: Abstraction of the graph ..................................................................................... 44 Figure 3.1: Tag-cloud Taxonomy of Related Work ................................................................ 47 Figure 3.2: Motivating Example Configuration ...................................................................... 55 Figure 3.3: Annotation of the graph with policies .................................................................. 58 Figure 3.4: Propagating addition of attribute PHONE............................................................ 60 Figure 3.5: Propagate Changes Algorithm ............................................................................ 61
Figure 3.6: Example of over-specification and under-specification of policies ..................... 63
Figure 3.7: Determine Policy Algorithm ................................................................................ 64
Figure 3.8: On Demand Policy Resolution ............................................................................. 64 Figure 3.9: First ETL scenario graph representation .............................................................. 69 Figure 3.10: Distribution of occurrence per kind of evolution events .................................... 70
Figure 3.11: Mixture Annotation ............................................................................................ 73 Figure 3.12: Worst Case Annotation ...................................................................................... 73 Figure 3.13: Optimistic Annotation ........................................................................................ 74 Figure 3.14: Manual (OMC) and Semi-automatic (OAC) Adaptation ................................... 76
Figure 3.15: Cost of Adaptation with and without use of Default Policies ............................ 76
Figure 5.1: Abstract representation of motivating example graph ......................................... 95
Figure 5.2: [Mood98]’s Data Model Quality Evaluation Framework .................................... 99
Figure 5.3: Design and Administrator Quality Dimensions [Vass00] .................................. 102

Figure 5.4: Bird’s-eye view of the configuration used in our experiments .......................... 115
Figure 5.5: Events affecting dimension tables: (a) WS schema, (b) WS-star schema .......... 117
Figure 5.6: Events affecting views: (a) WS-star and WS schema, (b) WS-views schema ... 117
Figure 5.7: Events affecting queries: (a) WS schema, (b) WS-star schema ......................... 119
Figure 5.8: Total number of events affecting queries: (a) Behavior for the WS-views with propagate policy; (b) Behavior for the WS-views schema with mixture policy ................... 119
Figure 5.9: Comparison of WS, WS-views, WS-star design configurations for distribution 1: (a) only affected queries and (b) all affected nodes .............................................................. 119 Figure 5.10: Comparison of WS, WS-views design configurations for distribution 2: (a) only affected queries; (b) all affected nodes ................................................................................. 120 Figure 6.1: System Architecture ........................................................................................... 125 Figure 6.2: Creating graph from SQL files ........................................................................... 127 Figure 6.3: Editing the properties of EMPS_PRJS view node ............................................. 128
Figure 6.4: Displaying only top-level node of modules ....................................................... 129 Figure 6.5: Adding event “DELETE_ATTRIBUTE” to attribute E_SAL of relation EMP 130
Figure 6.6: Defining the policy for propagating the deletion of attribute E_SAL from EMPS_PRJS view ................................................................................................................. 131
Figure 6.7: Defining the policy for blocking the deletion of attribute P_EXPENSES from Q2 query ..................................................................................................................................... 131
Figure 6.8: Parsing language extensions for definition of policies ....................................... 132 Figure 6.9: Highlighting the impact of deleting attribute EMP.E_SAL ............................... 132
Figure 6.10: XML representation of evolution scenarios ..................................................... 134 Figure 6.11: Evaluating “Degree In” metric for EMPS_PRJS view .................................... 135
Figure 6.12: Output for “Transitive Degree Out” metric for all nodes ................................. 135

vii
List of Tables
Table 2.1: Elements and Notations of Evolution Graph ......................................................... 26 Table 3.1: Parts of the system affected by evolution events and annotation of appropriate graph construct ........................................................................................................................ 59
Table 3.2: Characteristics of the ETL scenarios ..................................................................... 70 Table 3.3: Affected and adjusted activities per event kind ..................................................... 71 Table 4.1: Kind of nodes annotated per event ........................................................................ 89 Table 4.2: Distribution of annotated nodes per kind of policies and events ........................... 90
Table 4.3: Operations with and without SQL extensions ....................................................... 90 Table 5.1: Examples for Measurement Types for Design and Administration Quality Dimensions [Vass00] ............................................................................................................ 103
Table 5.2: Degree related Metrics ......................................................................................... 113 Table 5.3: Event-aware Metrics ............................................................................................ 113 Table 5.4: Policy-aware Metrics ........................................................................................... 113 Table 5.5: Entropy-based Metrics ......................................................................................... 113 Table 5.6: Distribution of events .......................................................................................... 115 Table A.1: Macro level actions dictated by framework for several kinds of events. ........... 154
Table A.2: Statuses assigned to nodes when propagate policy prevails ............................... 158


ix
Acknowledgements
This dissertation could not have been accomplished without the multifaceted support and factual solidarity of a number of people that all these years surrounded me with their care, tolerance and their deep interest for my research efforts. The elaboration of this thesis has been a difficult marching for me, where many pleasant and ambitious moments followed on even more frustrating ones. This has been, however, one of the most valuable lessons learned throughout that process as it taught me how to persist on my goals, how to explore and overcome seemingly impossible to solve problems.
First of all, I would like to thank my supervisor, Yannis Vassiliou, Professor at the National Technical University of Athens (NTUA) for giving me the opportunity to work on this dissertation, for the valuable reviews and advices he gave me whenever I asked for. Secondly, my thanks are given to Timos Sellis, Professor at NTUA and director of the Knowledge and Database Systems Laboratory (DBLab), who also supported me with his advices and interest regarding my work. I would like to acknowledge both for the necessary financial support that provided for me during all these years. Panos Vassiliadis, assistant Professor at the University of Ioannina and former member of DBLab has been the major contributor of this work as he has actually co-supervised and provided many ideas for this thesis. I thank him for teaching me how to organize my thoughts and overcome research problems. Additionally, I thank Gregorios Mentzas Professor at NTUA, Panos Konstantopoulos Professor at the Athens University of Economics and Business, Kostas Kontogiannis Associate Professor at NTUA and Yannis Theodoridis Associate Professor at the University of Piraeus, for serving in my thesis examination committee.
Moreover, special thanks are given to former undergraduate students Kostis Kyzirakos and Fotini Anagnostou for contributing to the implementation of Hecataeus during their diploma thesis and Alkis Simitsis for his fruitful comments and ideas regarding the topics of this thesis. Furthermore, I would like to mention the huge support I received from the members of DBLab, especially from Manolis V., Vaggelis Z., Lefteris S., Giannis R., Giannis K., Spyros A., Panos G. for the happy hours that we spent in DBLab as well as for their friendship and encouragement. Thanks are also given to all my close friends outside the DBLab who have been always tolerant and supportive to my efforts.
Last but not least, I want to thank my family for their great encouragement during all these years of my studies. Their love has been the necessary background for achieving undistracted my goals.


11
1. INTRODUCTION
In a typical organizational Information System, there is a variety of components inherently intertwined with each other. Several databases or data files operate on the organizational servers. Complex workflows are composed of different activities, each possibly running on a different server, and interacting with a different data store. Data entry or query forms are used by a large number of users updating or querying information. External data (e.g., Web data) are also imported from the Web and some corporate data are usually exported to the corporate web server (Figure 1.1).
In an ever-increasing pace, the database designer/administrator of the system is faced with the necessity of changing something in the overall configuration of the database schema. For example, a change in business requirements imposes that an entity such as an attribute has to be deleted or replaced in the database schema. A small change like this might impact a full range of applications and data stores around the system: queries and data entry forms can be invalidated, application programs might crash (resulting in the overall failure of a complex workflow), and several pages in the corporate Web server may become invisible (i.e., they cannot be generated any more). Similar problems arise in almost every kind of database-centric environments, where a set of objects and software artifacts are dependent upon a dynamic and evolving database system.
Forecasting and handling database schema evolution especially in large scale or distributed environments are time-consuming tasks, since they are not handled by current database systems with an automatic way, but rather they require great human effort by database administrators and developers. Considering the previous example, the deletion of an attribute requires from the administrator or the developer to manually detect eventual inconsistencies in the database or the applications around it (i.e. foreign keys that are invalid,

12
queries that become invalid, object models that are inconsistent with the underlying data model, etc.) and decide how to adjust each of them. Therefore, evolution-driven database modeling and design as well as techniques for minimizing the human effort consumed for evolution tasks can be very beneficial and can contribute to the overall design quality of the system.
DB
DB
Act1
Act2
Act3
Act4
Act5 WWW
Figure 1.1: A typical complex Information System going through structural changes
1.1 Research Challenges in Database Schema Evolution
Nowadays, information systems are continuously evolving environments, where design constructs are added removed or updated very often. Given its fundamental role, the evolution of the schema of a database system has a very strong impact on the applications accessing the data; thus, support for graceful evolution is of paramount importance. We mention here two experience examples to demonstrate the extent to which schema evolution is involved in the lifecycle of an information system. In the report described in [Sjob93], a quantification of the database schema evolution problem in large long-lived application

13
systems is presented. Over a period of 18 months, which included both the development and the operational phase of the examined system, they recorded 140% increase in the number of relations and over 200% increase in the number of attributes, as well as several evolution changes in all existing relations of system. Additionally, in [CMTZ08] the authors analyze the statistics collected for schema changes occurred in the context of a web information system, namely the widely known digital encyclopaedia Wikipedia, during the period of the last 4.5 years. The plethora of alterations includes a 100% increase in the number of tables and a 142% increase in the number of attributes. Furthermore, a 41.5% and 25.1% of the attributes of the original database were removed and renamed from the database schema, respectively. The major reasons for these alterations were (a) the improvement of performance, which in many cases induces partitioning of existing tables, creation of materialized views, etc., (b) the addition of new features which induces the enrichment of the data model with new entities, and (c) the growing need for preservation of database content history. All these changes have a tremendous impact on surrounding applications and specifically on queries (embedded in software modules), views, database procedures and processes that rely on a specific database schema.
Database schema evolution is a more complicated issue, which is related to every phase of the development of an Information System. According to [Rodd95], database schema evolution is accommodated when a database system facilitates the modification of the database schema without loss of existing data. Several reasons during the development or operational phase of database system can trigger the modification of a populated database schema, such as schema changes accompanying changes of requirements, schema restructuring (i.e. normalization, de-normalization) due to performance reasons, redefinition of views, migration from a legacy system towards novel platforms, etc. Almost all current RDBMS support SQL capabilities (i.e., Data definition language – DDL extensions) for creating and altering database objects and, in that sense, permit evolution operations on the database schema.
However, apart from the core database schema, database centric environments comprise a plethora of views and queries embedded in procedures, software modules, complex workflows, etc. that are also affected by evolution operations. Unfortunately, no support is provided for analyzing the impact and furthermore adjusting semantic and syntactical inconsistencies emerging on these parts, as results of such operations. Their reaction to evolution is still handled manually by administrators and developers. Although research has extensively dealt with the problem of database schema evolution investigating mainly the adaptation of internal database objects to schema changes, problems persist with existing queries and views, mainly due to the fact that in most cases, the proper attention is not given to their role as integral parts of the environment.
In the above context, we consider the following research challenges which are addressed in this dissertation.

14
1. Principled description of the architecture of a database-centric information system
In [BeLP00], the authors introduced the idea of model management as a first-class citizen of database research. Till then, metadata management had received significant attention from the research community, but with no major practical results in industrial applications. The main goal we need to pursue is to discover a commonly agreed formalism to express the internals of a database-centric system, on the grounds of a well-founded theory. The main questions that arise in this context are:
• Can we derive a model of the structural properties and dynamics of database-centric systems?
• How can we trace the full range of interdependencies in the components of a complex database-centric system at both a detailed and abstract level?
• Can we provide a formal background for the foundation of metrics and the evaluation of the quality of the design of the overall system?
2. Principled response to evolutionary events
Mostly all the work of the research community on database evolution has focused on conceptual models and object-oriented databases [Rodd00], without any treatment of the significantly more difficult problem of managing a regular relational database which is surrounded by a large number of applications. The main problem that we have to deal with is: Given a set of user constraints on the structure, content and future availability of a certain part of data stored in a database, how do we handle events that evolve the above properties in order to satisfy all user constraints? This research topic raises the following questions:
• Given a certain event, how do we forecast its impact as this is propagated throughout the whole database environment, via module interdependencies?
• How easily can we regulate the propagation of the effect of a potential change taking into account application constraints and user preferences?
• How do we handle conflicts? E.g., what happens if the administrator needs to delete a certain attribute, while a user has explicitly banned any such action?
• How do we treat evolution (and addition of information in particular), in the absence of user regulators?
• How can we perform all the above with minimal effort for existing systems? How can we efficiently define evolution semantics on existing database objects (since the data entry for metadata is always the biggest problem in metadata management)?
Viewed from another point of view that concerns the automation of the reaction to changes, the question that arises concerns our ability to derive (semi) automatic mechanisms

15
for the self-monitoring, impact prediction, auto-regulation and self-repairing of complex information systems.
3. Quality metrics for database schema evolution
Given a model that describes the structure and the potential for evolution of a database-centric environment, how good is a certain schema that a designer produces? Is design A better than design B? Evaluating the design of a database, given a prediction for its evolution in the future is a very difficult research problem. Specifically, the following research challenges arise:
• Can we measure and quantify in a principled way the vulnerability of certain parts of a database system and find these constructs that are most sensitive to evolution?
• What are the “right” measures for evaluating the quality of the design of a database centric environment, with respect its evolution capabilities?
4. Study of the fundamental laws of evolution
A fundamental problem in the area of database schema evolution is the lack of empirical studies. To our knowledge except for the two studies [Sjob93], [CMTZ08] described above, no other real world cases have been performed for monitoring the evolution lifecycle of a database schema in a principled way. To our perception, the following research questions present an interesting research agenda on this topic:
• Can we collect test cases and observe them in order to come up with the fundamental laws that govern database evolution?
• Can we establish an experimental protocol for monitoring existing real-world databases and discover the way they evolve?
• Can we collect such results and make them available to the research community (without unveiling crucial information that the database owners would like to keep hidden)?
1.2 Contributions of this Thesis
The research challenges described in the previous section were the basic guidelines for the issues proposed in this thesis. The basic contribution of this thesis is a framework for analyzing and regulating the impact of database schema evolution in a database centric environment (Figure 1.2).
We first provide a representation technique that maps all essential constructs of a database centric environment to graphs. The basis of our framework is a graph model, called evolution graph, which models in a coherent and uniform way internal structural elements of a database system such relations, views, triggers, etc. as well as external components

16
accessing a database system, such as queries extracted from procedures, object modules and their significant properties (e.g., attributes, conditions). Apart from the simple task of capturing the semantics of a database system, the graph model allows us to predict the impact of a change over the system and the application of graph-theoretic metrics.
We furthermore study techniques and algorithms for handling changes occurring in the database schema, in such way that the human interaction is minimized. Thus, we provide a mechanism for enriching the evolution graph with evolution semantics such as evolution events and policies regulating its behavior in the presence of hypothetical changes occurring in the database schema. Rules that dictate the proper actions, when additions, deletions or modifications are performed to relations, attributes and conditions (all treated as first-class citizens of the model) are provided. Specifically, assuming that a graph construct is annotated with a policy for a particular event (e.g., a relation node is tuned to deny deletions of its attributes), the proposed framework (a) performs the identification of the affected part of the graph and, (b) if the policy is appropriate, proposes the readjustment of the graph to fit to the new semantics imposed by the change. Additionally, we complement the proposed framework with a set of SQL extensions that allows the definition of evolution metadata with a feasible and efficient way.
Figure 1.2: Framework for the management of database schema evolution
To this end, we employ graph theoretic and information theoretic properties of the evolution graph and establish a suitable set of measurements for evaluating the design quality of a database centric environment with respect to its ability to sustain evolution operations. All of the above concepts are implemented in a powerful and user friendly tool, called

17
HECATAEUS, which is used for the application of the framework on real world evolution scenarios.
Our last contribution concerns the study of evolution processes that occurred on a real system, specifically a datawarehouse environment, during a long term period of its lifecycle. We have collected and have categorized the kinds of database schema changes occurred and the impact that these changes had on the database itself as well as on surrounding applications, e.g., ETL processes. We have extensively experimented with real as well as artificial evolution scenarios.
Therefore, our contributions can be outlined as following:
• a graph-based model for an extended system catalog, capturing relations, views, constraints and queries in a cohesive framework;
• a set of rules for the management of database evolution in a set of commonly encountered circumstances;
• an annotation of the essential elements of a database centric environment in order to regulate their behavior a priori, for the event of future, potential modifications of the database constructs they depend on;
• a feasible and powerful SQL extensions that enable the implementation of our ap-proach for evolution management;
• a set of metrics for the evaluation of database evolution and design. They act as predictors for the vulnerability of a software module of a database centric environment (either internal, e.g., a relation, or external, e.g., a query) to future changes to the structure of the environment. Secondly, they facilitate the assessment of the quality of alternative designs of the environment with a particular viewpoint on the evolution of its schema.
• a tool, named HECATAEUS, for automating the analysis of a database system and representing and visualizing its characteristics to the aforementioned graph-based model;
• the application and testing of the proposed framework over a real-world case study occurred in the Greek public sector.
1.3 Roadmap of the Thesis
This thesis is organized as following:
In Chapter 2, we introduce a graph modeling technique for representing database centric environment as graphs. We first present related approaches to visualization and representation techniques for database systems and classify our technique with regard to

18
these approaches. We then introduce the main concepts of the proposed modeling technique, the kind of nodes and edges comprising the Evolution Graph and describe in details the rules for the construction of the graph for the various components included in our model. We furthermore propose operations applied on the graph, such as modularization and abstraction.
In Chapter 3, we propose the framework for analyzing and regulating database schema evolution. The proposed framework enriches the evolution graph with evolution semantics, such as evolution events and policies that regulate the propagation of schema evolution towards the database-centric environment. We first collect and categorize the various approaches and techniques related to the research area of database evolution. We employ a motivating example that establishes the challenges and problems that we deal with in this chapter. Then, the main concepts of our framework and especially the algorithm Propagate Changes, which handles the reaction of the system to evolution changes, are presented. Lastly, we experimentally assess the proposed framework over a real-case database-centric environment.
In Chapter 4, we propose a set of feasible language extensions to SQL that prescribe the reaction of database objects to evolution changes. Specifically, the proposed extensions enrich the SQL definition of database objects and queries with evolution semantics, i.e., policies, which dictate their reaction to evolution events. The extensions involve the definition of default policies for the entire database environment, policies regarding top level nodes, such as relations, view and queries and lastly policies for fine grain constructs, such as attributes, constraints and conditions. Moreover, in this chapter we collect and review other approaches related to language extensions for schema evolution and we also evaluate the feasibility of the proposed technique, by applying the extension on a real database centric environment.
In Chapter 5, we introduce a set of metrics for evaluating the evolution properties of a database-centric environment such as the vulnerability of its design structures to hypothetical evolution events. Based on graph theoretic properties of the evolution graph, we provide metrics like the degrees (in, out, and total) of a node, the transitive degrees of a node (standing for the extent to which other nodes transitively depend upon it), and the degrees of a summarized variant of a module (e.g., a view) that abstract the internal semantics of the module and focus on its coupling to the rest of the environment. We then present an event aware set of metrics that takes into account the distribution of potential events on the graph. To this end, we include the special role of policies annotating the graph into a policy-aware set of metrics. We lastly provide an information theoretic definition of a module’s entropy that simulates the extent to which the vulnerability of a node is surprising. Finally, we extensively experiment with various configurations in the setup of a reference database environment and assess both the effectiveness of the proposed metrics (i.e., how well do they actually predict the impact of evolution events to a design construct) and how different design alternatives for the same schema behave with respect to schema evolution.
19
In Chapter 6, we present Hecataeus, an impact prediction software tool for database schema evolution. Hecataeus’ main features include the visualization and editing of the evolution graph from SQL source code and the annotation of the graph with polices and events. Given a hypothetical evolution event in the system, Hecataeus detects and highlights all affected graph constructs and propose their adaptations to the new semantics. Thus, Hecataeus offers the user the ability to create and perform scenarios which assess the impact of evolution process, before these scenarios are applied to a production environment. Furthermore, in this chapter, we present the basic features of Hecataeus via the use case of an evolution scenario.
Lastly, in Chapter 7, we summarize the conclusions of this dissertation and present potential application areas of the proposed framework. We then provide insights for issues opened by this thesis and challenges for further research efforts related to the policy-regulated schema evolution.


21
2. GRAPH REPRESENTATION OF DATABASE-CENTRIC
ENVIRONMENTS
Database–centric environments such as Information Systems (IS) can be described technically as a set of interrelated components that collect (retrieve), process, store, and distribute information to support decision making, coordination, control, analysis and visualization in an organization.
Current approaches to such environments involve the coordination of various components such as business processes, human roles, network infrastructure, hardware and software infrastructure, database etc. Database systems are the core of every IS as these are the parts where information is collected, stored and processed to the rest of the system. Therefore, a good database design is always crucial to the design of the whole IS, affecting the operation as well as the maintenance of the system. Traditional database modeling techniques, like ER diagrams, UML, etc., have been widely used in modeling database entities and relationships between them. Most of them, however, restrict themselves to model the database components in a more or less static way. That is that they restrict themselves to model explicitly the main database parts (entities, relationships) of an IS, ignoring components that interface with the database, such as queries, stored procedures, applications, etc. An ER diagram, for example, can describe in a precise way how data and furthermore information is represented, stored and treated within a database, but cannot tell what is happening “around” the database and what are the dependencies between the components that interface with the database.
The integration of components that interface with the database, such as queries and views, in a uniform representation is valuable, since it can be used for several purposes, including:

22
(a) the forecasting of the impact of database schema changes in the overall system (e.g., what happens if we delete a certain attribute of a table?),
(b) the visualization of the workload of the system (e.g., which queries pose the heaviest load on the system?) and
(c) the introduction of metrics and the evaluation of the quality of the design of the overall system.
Traditionally, dependency analysis has been performed with so called data dependency graphs, which use nodes to represent statements of the program and edges to represent dependencies between statements. Data dependency graphs normally represent every statement of the program with all of its dependencies. In this chapter, we introduce a graph modeling technique that uniformly covers relational tables, views, database constraints and SQL queries as first class citizens. We employ a graph theoretic approach and we map the aforementioned constructs to a graph, that we call Evolution Graph. First, we model the whole environment of the database system as a graph. We do not restrict the modeling to relations along with their interrelationships and any available views, but we extend the modeling to incorporate all the elements of an information system. To this end, we add queries as integral parts of the configuration of a database environment. In practice, a typical database is surrounded by forms, reports, web pages, stored procedures, and triggers deployed on the database server. Each of these software artifacts encompasses a list of queries via which it communicates with the database and exchanges queries and data with it. Therefore, queries constitute a convenient abstraction that captures the “skeleton” of all these applications with respect to their interrelationship to the database. We incorporate the graph with specific semantics, i.e., certain types for nodes and edges which are mapped to elements of the database centric environment.
Chapter Outline. In section 2.1, we provide related works regarding graph and visual representation of database systems. We present in section 2.2 the main concepts of the proposed modeling technique, the kind of nodes and edges comprising the Evolution Graph. In sections 2.3 - 2.8, we describe in details the rules for the construction of the graph for the various components included in our model. In sections 2.9, 2.10 we present further operations applied on the graph, such as modularization and abstraction. Lastly, in section 2.11, we summarize the proposed modeling technique.
2.1 Visualization and Representation Techniques for Database Systems
So far, research has provided various visualization techniques and languages for database schemas and queries [BaOO02], [JaTh03], [MuGP98], [HFLP89], [PaKi95], [Meln04]. Visualization is a very popular technique that helps designers/administrators to better understand and analyze the schema of a database and the queries interacting with it. We classify database schema and query representations into two categories:

23
• Graphical representations, which are used as an alternative visual way of writing and in general formulating a query, aiming at increasing the expressiveness of a query, the user-friendliness as well as the human-computer interaction capabilities of the DBMS.
• Representations that are used as a modeling technique for solving problems related to query rewriting and optimization, database design, schema mapping and integration.
In [CCLB97], a detailed survey on visual query languages and systems is provided. Visual query systems (VQSs) are query systems for databases that use visual representations to depict the domain of interest and express related requests. VQSs can be seen as an evolution of query languages adopted into database management systems; they are designed to improve the effectiveness of the human–computer communication. The main goal of visual query systems is to provide the ability to users to formulate graphically a query rather than to offer an alternative modeling technique for database schemas (e.g. ER, UML, etc.). Most of the visual query systems can be categorized according to their visual representation into form-based, diagram-based, icon-based or hybrid (combination of the last three representations). Through a visual query system, the user forms a query in a visual-fashion way, the system converts the visual query to the native DBMS query language and posts the query to the underlying DBMS.
GQL [PaKi95], [MuGP98], Visual-SQL [JaTh03] and VISUAL [BaOO02] are such visual query languages. GQL is a declarative graphical query language based on the functional data model, which combines graph-based visualization (nodes and edges) with other visual constructs-shapes. The authors propose a user interface for formulating queries as well as a formal query syntax accompanying GQL. In [BaOO02], the authors propose VISUAL, a graphical icon-based query language for object-oriented scientific databases where the data has spatial properties, includes complex objects, and queries are of exploratory in nature. Lastly, Visual-SQL is a graphical query technique that follows the paradigm of entity-relationship representation, representing queries and tables as entities.
In [HFLP89], they introduce the Query Graph Model (QGM), a query graph–based representation technique used for query rewriting and optimization. The goal of QGM is to provide a more powerful and conceptually more manageable representation of queries in order to reduce the complexity of query compilation and optimization. QGM maps queries and tables into graphs, comprising vertices, edges, and boxes. QGM is incorporated as a query abstraction mechanism into a query optimization system, called Starbust.
In [Meln04], the author proposes a graph based representation of database schemas and subsumes it into a general framework for model management. The author uses directed labeled graphs to represent database models including relational as well as XML models. The main constructs of the introduced representation comprise nodes for relations, queries, attributes, literals and data types and edges for the various relationships between them. This

24
representation is used to enable the definition of mapping operations between heterogeneous schemas. Mapping operations between two models are translated into mapping and transforming operations in their respective model graphs.
Lastly in [SVTS05], the authors propose a graph-based modeling technique for the representation of ETL activities and processes. They employ a uniform, graph-modeling framework for both the modeling of the internal structure of an ETL activity and for the modeling of the ETL scenario at large, which enables the treatment of the ETL environment from different viewpoints.
Our proposal aims to provide a principled method for expressing the core skeleton structure of the internals of database-centric environments, based on a graph-theoretic approach, in order to facilitate the design and maintenance of database-centric environments. In the context of database schema evolution, evolution graph provides the necessary semantics and properties for the establishment of the framework that is introduced in this thesis. Thus, we classify our approach primarily as a representation rather than a visualization technique for database systems and queries.
2.2 Modeling Database-centric Environments as Graphs
Our model maps to graphs relational database schemas as well as views and queries expressed in SQL syntax. Moreover, we distinguish the following essential components, which are included in our model: relations, conditions (covering database constraints and query conditions), queries and views. The proposed modeling technique represents all the aforementioned database parts as a directed graph. The nodes of the graph represent the entities of our model, where the edges represent the relationships among these entities. The database part of a database-centric environment is mainly composed by a large number of relations and even a larger number of views, queries, stored procedures, etc, which interrelate in a complex way. Graphs are employed as a modeling technique because they can address to the large size and complexity that characterize a database-centric environment. The following definition presents the main concepts of the proposed graph representation.
Definition 2.1 – Evolution Graph: Given a database-centric system S comprising a finite set of relations R={R1, ...,Rn}, a set of views V={V 1, ...,Vm} defined over R and a set of
queries Q={Q1, ..., Qk} defined over R∪∪∪∪V, then the Evolution Graph of S is a directed
acyclic graph G=(V,E), E⊆V×V such that:
FCNOBGBVSQCARV ∪∪∪∪∪∪∪∪⊆ ,
OBGBHWFMOS EEEEEEEEE ∪∪∪∪∪∪∪⊆
The set of nodes V comprises the following types of nodes:
• Relation Nodes (R) : set of nodes representing relations

25
• Query Nodes (Q) : set of nodes representing queries
• View Nodes (VS) : set of nodes representing views
• Attribute Nodes (A) : set of nodes representing attributes of relations, views or queries
• Condition Nodes (C) : set of nodes representing database constraints or binary operators that participate in conditions
• Group By Nodes (GB) : set of nodes representing group by operations
• Order By Nodes (OB) : set of nodes representing order by operations
• Parameter Nodes (P) : set of nodes representing parameter or constant values
• Function Nodes (F) : set of nodes representing functions
The set E comprises the following types of directed edges:
• Schema edges (ES) : Represent relationships between a relation, a view or a query and its schema. The schema of a view / query is the set of attributes that are contained in its SELECT clause.
• Mapping edges (EM) : Represent schema mappings between attributes or expressions.
• Where edges (EW) : Represent the relationship of a view or query with its WHERE clause.
• Operand edges (EO) : Represent participation of operands in a unary or a binary condition.
• From edges (EF) : Represent the relationship between a view or a query and the relations contained in the FROM clause.
• Group By edges (EGB) : Represent the participation of an attribute or an expression in the GROUP BY clause of a query.
• Having edges (EH) : Represent the relationship of a view or query with its HAVING
clause.
• Order By edges (EOB) : Represent the participation of an attribute or an expression in the ORDER BY clause of a query.
An overall picture of the types of nodes and edges comprising the evolution graph is shown in Table 2.1.

26
Nodes Edges Relations R Schema relationships ES Attributes A Operand relationships EO Conditions C Map-select relationships EM Queries Q From relationships EF Views VS Where relationships EW Group-By GB Having relationships EH Order-By OB Group-By relationships EGB Parameters P Order-By relationships EOB Function F
Table 2.1: Elements and Notations of Evolution Graph
In the following sections, we describe in details the guidelines for mapping the main components of a database system, such as relations, conditions, views and queries, to the semantics of the Evolution Graph. For each of the aforementioned essential database components, a separate subgraph is constructed, representing the schema of the component. The overall evolution graph is constructed by the union of all the constituent subgraphs of the components.
2.3 Relations
Each relation R(A1,A2,…,An) in the database schema, either a table or a file (it can be considered as an external table), is represented as a directed graph, which comprises: (a) a relation node, R∈R, representing the relation; (b) n attribute nodes, A i∈A, i=1..n, one for
each of the attributes; and (c) n schema relationships, S∈ES, directing from the relation node towards the attribute nodes, indicating that the attribute belongs to the relation. Figure 2.1 shows a graphical representation of the relation graph.
Figure 2.1: Relation Graph
2.4 Database Constraints / Conditions
Conditions, in our context, refer both to selection/join conditions, of queries and views as well as to constraints of the database schema.

27
2.4.1 Conditions
We consider three classes of atomic conditions that are composed through the appropriate
usage of an operator op belonging to the set of classic binary operators, Op (e.g., <, >, =, ≤,
≥, !=, IN, etc.):
(a) A op constant;
(b) A op A’;
(c) A op Q;
(d) exists Q.
where A, A’ are attributes of the underlying relations and Q is a subquery.
For each of the above atomic conditions a separate node, op∈C, is used for the representation of each operator. Graphically, the node is named with the respective operator and it is connected to the operand nodes of the conjunct clause through the respective operand relationships, EO. These edges are indexed according to the precedence of each operand (i.e., op1 for the left-side operand and op2 for the right-side) in the condition clause. Composite conditions are easily constructed by tagging the operator node with the appropriate Boolean operator (e.g., AND or OR) and connecting the respective edges to the corresponding conditions composing the composite condition.
2.4.2 Database Constraints
Well-known constraints of database relations – i.e., primary/foreign key, unique, not null, and check constraints – are easily captured by this modeling technique. For that reason we make the assumptions that foreign keys are subset relations of the source and the target attribute, check constraints are simple value-based conditions. Primary keys, which are unique-value constraints, are explicitly represented through a dedicated node tagged by their names and a single operand node.
We distinguish the following five types of constraints:
• Primary Key Constraints
• Foreign Key Constraints
• Unique Key Constraints
• Not Null Constraints
• Check Constraints
In the rest of this section, we explain how constraints are mapped to graph constructs of our model.

28
2.4.2.1 Primary Key Constraints
Let R(A1,…, An) be a relation with a primary key constraint on A1, ..., Ak attributes. The
graph representation of the primary key constraint involves (a) a new condition node PK∈C corresponding to the primary key constraint, (b) k edges directing from the {A1, ..., Ak} nodes towards the primary key node, all tagged with op∈EO indicating operand relationship. In Figure 2.2, the graphical representation of the specified primary key constraint is shown.
Figure 2.2: Primary Key Constraint Graph
The graph representation of a primary key constraint is an extension of the relation graph joining the attributes, involved in the constraint, with the node of the PK constraint. For the graphical representation of the primary key constraint, a separate square-shaped node is used tagged with the name of the PK constraint.
2.4.2.2 Foreign Key Constraint
Let R(A1, ..., An), S(B1, ..., Bm,) be two relations. A foreign key (FK) constraint involves a set of attributes, say {A1, ...,Ak} k≤n, belonging to source table R, which references a set of attributes, say {B1, ...,Bk} k≤m, belonging to table S. The graph representation of the FK
constraint involves (a) a new condition node FK∈C representing the foreign key constraint, (b) k edges directing from the source attributes {A1, ...,Ak} towards the FK node and (c) k edges directing from the FK node towards the referenced attributes {B1, ...,Bk}. All edges are
labeled with an op∈EO indicating operand relationships. The direction of the edges discriminates between the source and the referenced attribute.
Graphically, we denote the FK node in a square-shaped fashion, tagged with the name of the FK constraint.
29
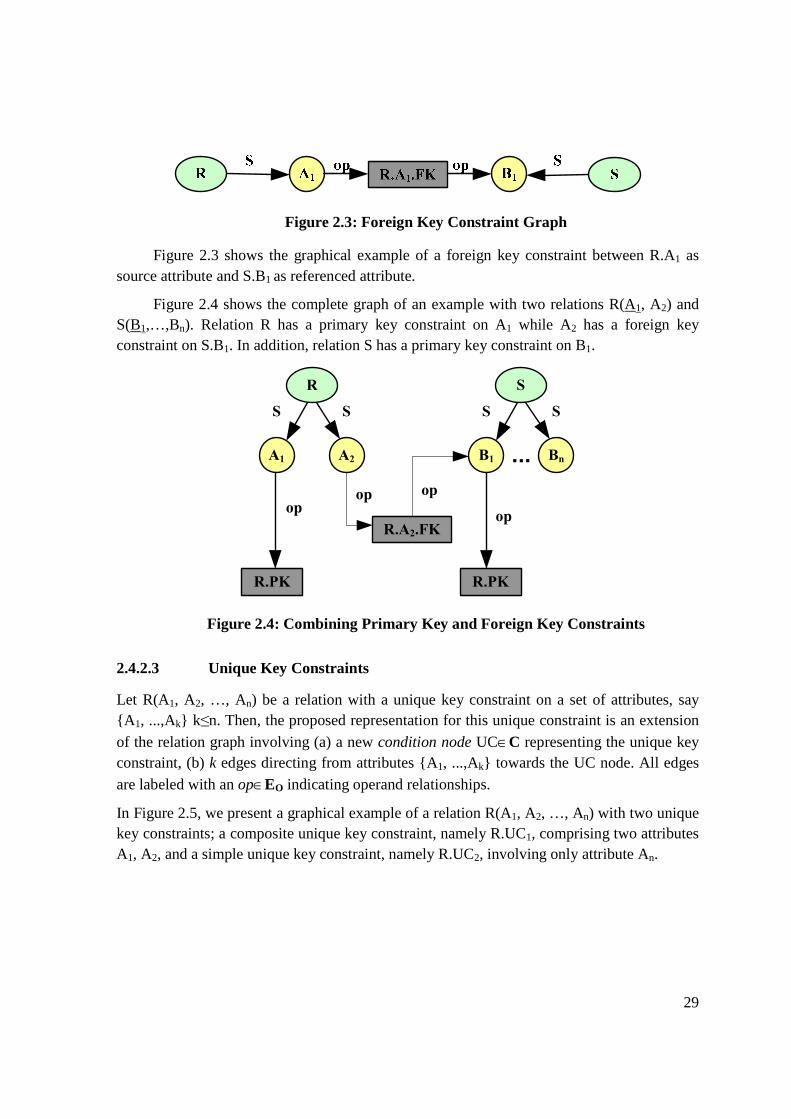
Figure 2.3: Foreign Key Constraint Graph
Figure 2.3 shows the graphical example of a foreign key constraint between R.A1 as source attribute and S.B1 as referenced attribute.
Figure 2.4 shows the complete graph of an example with two relations R(A1, A2) and S(B1,…,Bn). Relation R has a primary key constraint on A1 while A2 has a foreign key constraint on S.B1. In addition, relation S has a primary key constraint on B1.
op op
opop
S S
A1 A2
S S
...B1 Bn
R.PK R.PK
R.A2.FK
R S
Figure 2.4: Combining Primary Key and Foreign Key Constraints
2.4.2.3 Unique Key Constraints
Let R(A1, A2, …, An) be a relation with a unique key constraint on a set of attributes, say {A 1, ...,Ak} k≤n. Then, the proposed representation for this unique constraint is an extension
of the relation graph involving (a) a new condition node UC∈C representing the unique key constraint, (b) k edges directing from attributes {A1, ...,Ak} towards the UC node. All edges
are labeled with an op∈EO indicating operand relationships.
In Figure 2.5, we present a graphical example of a relation R(A1, A2, …, An) with two unique key constraints; a composite unique key constraint, namely R.UC1, comprising two attributes A1, A2, and a simple unique key constraint, namely R.UC2, involving only attribute An.

30
Figure 2.5: Unique Constraint Graph
Similarly to previous constraints, for the graphical representation of the unique key constraint, a separate square-shaped node is used, tagged with the name of the constraint.
2.4.2.4 NOT NULL Constraints
Let R(A1, A2, …, An) be a relation with a not null constraint on Ai,. The proposed representation for this not null constraint is an extension of the relation graph involving (a) a
new condition node NNC∈C representing the not null constraint, (b) an edge directing from
the attribute Ai towards the NNC node, labeled with op∈EO indicating operand relationship.
In Figure 2.6, we present a graphical example of a relation R(A1, A2, …, An) with a not null constraints on A1, named as R.A1.NNC.
Figure 2.6: Not Null Constraint Graph
For the graphical representation of the not null constraint, a separate square-shaped node is used, which labeled with the name of the not null constraint.
2.4.2.5 Check Constraints
Let R(A1, A2, …, An) be a relation with a check constraint on a set of attributes, say {A1, ...,Ak} k≤n. Then, the graph representation of the check constraint is an extension of the relation graph involving (a) a new condition node CC∈C representing the check constraint, (b) k edges directing from attributes {A1, ...,Ak} towards the CC node. All edges are labeled with op∈EO indicating operand relationships

31
In Figure 2.7, we present a graphical example of a relation R(A1, A2, …, Am) with a check constraint, named as R.CC1, involving attribute A1.
Figure 2.7: Check Constraint Graph
For the graphical representation of the unique key constraint, a separate square-shaped node is used, labeled with the name of the constraint.
2.5 Queries
SQL queries are essential components of our graph model. For each query Q in the system, a separate graph is constructed and connected with the graphs of the relations, which are referenced in the query syntax. The types of queries that are captured by our modeling and represented to graphs fall into the following four classes:
• Simple Select-Project-Join (SPJ) flat queries.
• Select-Project-Group (SPG) queries, i.e., queries with aggregation.
• Nested queries.
• Self-Join queries, i.e. queries with join operations on the same relation.
For each of the four classes, we present the construction of the graph, separately.
2.5.1 Select-Project-Join (SPJ) flat queries
The first class of queries involves Select-Project-Join (SPJ) queries, i.e. queries with simple join conditions. Let Q be the generic type of a flat SPJ query on n relations (R1, R2, …, Rn) with the following query syntax:
Q: SELECT R 1.A 11 as A 1, R 2.A 21 as A 2, …, R n.A n1 as A n
FROM R1, R 2, …, R n
WHERE cond1(R 1.A 11, constant) AND cond s(R n.A nk , R 1.A 1r )
For the representation of the above query to graph, the following considerations are made:
1. A query owns a unique identifier (i.e., name) and a schema. The schema of the query comprises all attributes either with their original or alias names, appearing in

32
the SELECT clause. These attributes depend on attributes of the underlying relations. In the above example, the name of the query is Q and its schema is {A1, …, An}.
2. A query depends on all entities (e.g., relations, views, inline views, etc.), which are included in the FROM clause. The FROM part of a query can be regarded as the relationship between the query and the relations involved in this query. In the above example, these entities are {R1, R2, …, Rn}.
3. A query optionally owns a set of selection/join conditions, which are expressed in the WHERE clause. The query depends on the attributes of the underlying relations that participate in the conditions. In the above example, the conditions of the query are {cond1(R1.A11, constant), conds(Rn.Ank, R1.A1r)}.
The graph representation of the above SPJ query involves (a) a query node Q∈Q
representing the query; (b) n attribute nodes, A i∈A, i=1..n, one for each of the schema
attributes of Q; and (c) n schema relationships, S∈ES, directing from the query node towards the attribute nodes. The edges, connecting node Q with all its attribute nodes, indicate schema relationships and therefore are labeled with an S in the same way that a relation node is connected with its attribute nodes.
Moreover, in order to represent the relationship between the query graph and the underlying relations, we make the convention that each query is decomposed into three main parts, the SELECT part, the FROM part and the WHERE part. Each of these parts is eventually mapped to a subgraph.
In that way the graph representation of the above query is the composition of the three subgraphs, each of which corresponds to each part of the query – SELECT, FROM, WHERE. In order to represent these parts, the following notation is introduced:
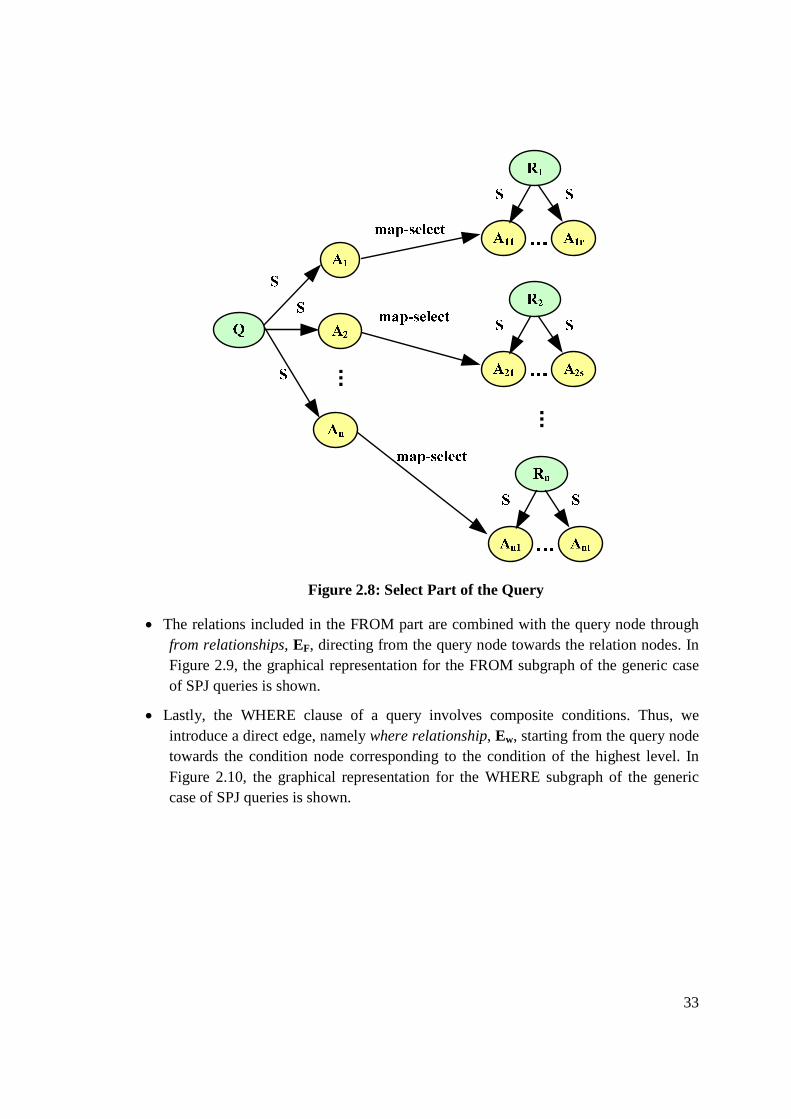
• The SELECT part of the query maps the respective attributes of the involved relations to the attributes of the query schema through map-select relationships, EM, directing from the query attributes towards the relation attributes. These edges actually map the schema of the query to that of the underlying relations. In Figure 2.8, the graphical representation for the SELECT subgraph of the generic case of SPJ queries is depicted.
33
...
...
Figure 2.8: Select Part of the Query
• The relations included in the FROM part are combined with the query node through from relationships, EF, directing from the query node towards the relation nodes. In Figure 2.9, the graphical representation for the FROM subgraph of the generic case of SPJ queries is shown.
• Lastly, the WHERE clause of a query involves composite conditions. Thus, we introduce a direct edge, namely where relationship, Ew, starting from the query node towards the condition node corresponding to the condition of the highest level. In Figure 2.10, the graphical representation for the WHERE subgraph of the generic case of SPJ queries is shown.

34
...
Figure 2.9: From Part of the Query
Figure 2.10: Where Part of the Query

35
The complete graph for the generic case of a SPJ flat query is constructed by the union of the respective SELECT, FROM, WHERE subgraphs. The complete graph is shown in Figure 2.11.
...
Figure 2.11: Graph for SPJ query
2.5.2 Select-Project-Group (SPG) flat queries
The second class of queries involves SPG queries, i.e. queries with aggregations. Let Q be the simple case of a flat SPG query on the relation R, with syntax:
Q: SELECT R.A 1 AS A 1, COUNT(R.*) AS A 2 FROM R
GROUP BY R.A1;
For the representation of aggregate queries, we employ two special purpose nodes: (a)
a new node denoted as GB∈GB, to capture the set of attributes acting as the aggregators; and
(b) one node per aggregate function F∈F labeled with the name of the employed aggregate function; e.g., COUNT, SUM, MIN. For the aggregators, we use edges directing from the query node towards the GB node that are labeled <group-by>, indicating group-by relationships, EGB. Then, the GB node is connected with each of the aggregators through an edge tagged also as <group-by>, directing from the GB node towards the respective

36
attributes. These edges are additionally tagged according to the order of the aggregators; we use an identifier i to represent the i-th aggregator. Moreover, for every aggregated attribute in the query schema, there exists an edge directing from this attribute towards the aggregate function node as well as an edge from the function node towards the respective relation attribute. Both edges are labeled <map-select> and belong to EM , as these relationships indicate the mapping of the query attribute to the corresponding relation attribute through the aggregate function node.
Additionally, for the HAVING clause of a query, we introduce a direct edge, namely having relationship, EH, starting from the query node towards the condition node corresponding to the condition of the highest level of the HAVING clause, similarly to the representation of the WHERE clause of the query.
The representation of the ORDER BY clause of a query is performed similarly to the representation of the GROUP BY clause. We employ a new node OB∈OB for the representation of the ORDER BY clause. A directed edge <order-by>, belonging to EOB, directs from the query node towards the OB node and the latter is connected via indexed <order-by> edges with all attributes of the relations that constitute the order by clause.
The graphical representation of the GROUP BY part of the above query is shown in Figure 2.12. For the GROUP BY representation as well as for the aggregate function nodes, separate square-shaped nodes are used.

37
Figure 2.12: Graph for Group By Query
2.5.3 Nested queries
The third class of queries involves the nested queries, i.e. queries involving a condition with subquery in the WHERE clause.
Let Q be the nested query
Q: SELECT R 1.A 1 as A 1 FROM R 1
WHERE R1.A 2 IN Q’ : ( SELECT R 2.B 1 as B 1
FROM R 2)
In order to capture the set of nested queries, we assume that modeling a nested query is considered as a specialization of the WHERE part of a simple SPJ query, as described above. In the special case of a nested query, the type of condition involved in the WHERE clause is A op Q, where A is an attribute of the underlying relation, Q is the nested query and op is a binary operator, such as IN, etc. Therefore, we extend the WHERE subgraph of the outer query by (a) constructing the respective graph for the subquery, (b) employing a separate operator node for the respective nesting operator (e.g., IN operator), and (c) employing two operand edges directing from the operator node towards the two operand nodes (the attribute of the outer query and the respective attribute of the inner query) in the same way that conditions are represented in simple SPJ queries
The graphical representation of the above query is shown in Figure 2.13.

38
Figure 2.13: Nested Query
2.5.4 Self-Join queries
The fourth class of queries involves the self - join queries, i.e. queries having a join operation on the same relation, using an alias name for the relation.
Let Q be the self-join query:
Q: SELECT R 1.A 1 AS A 1 FROM R AS R 1, R AS R 2 WHERE R 1.A 2=R2.A 1
For capturing the set of self-join queries, we stress that each reference via an alias to a relation in the FROM clause of the query is semantically equivalent with an inline view projecting all attributes of the referenced relation (i.e., SELECT *) and named with the respective alias. That is:
Q: SELECT R 1.A 1 AS A 1 FROM (SELECT * FROM R) AS R 1, (SELECT * FROM R) AS R 2 WHERE R 1.A 2=R2.A 1
The graphs of the views are constructed according to their definition in the same way query graphs are constructed. The graph of the self-join query is, then, connected with the graphs of the corresponding views. Hence, the join operation is represented between the query node and the attributes of the equivalent views.
The graphical representation of the above self-join query is shown in Figure 2.14. For graphical simplicity reasons, we have omitted the <from> edges connecting the query node to the view nodes.

39
m-s
m-s
m-s
m-s
m-s
where
S S
A1 A2S
Q
A1
op1
op2
from
from
S S
A1 A2
S S
A1 A2
=
R1
R2
R
Figure 2.14: Graph for Self-Join Query
2.6 Functions
Functions used in queries are integrated in our model through a special purpose node Fi∈F, denoted with the name of the function. Each function has an input parameter list comprising attributes, constants, expressions, and nested functions, and one (or more) output parameter(s). The function node is connected with each input parameter graph construct, nodes for attributes and constants or sub-graph for expressions and nested functions, through an operand relationship directing from the function node towards the parameter graph construct. This edge is additionally tagged with an appropriate identifier i that represents the position of the parameter in the input parameter list. An output parameter node is connected with the function node through a directed edge E∈O∪EM∪EG∪EO from the output parameter towards the function node. This edge is tagged based on the context, in which the function participates. For instance, a map-select relationship is used when the function participates in the SELECT clause, and an operand relationship for the case of the WHERE clause.
2.7 Views
Views are integrated in the proposed modeling technique as separate graphs. In section 2.5.4, a brief description of the representation of inline views was given, in the context of self join queries. Views are inherent constructs of the database schema. They constitute both queries over the database schema as far as their definition is concerned and relations to other queries as far as their functionality and their extension are concerned. Their dual role is captured and represented as intermediate graphs between relations and queries.

40
For the construction of the graph of a view, a separate node VS∈VS is introduced, labeled with the name of the view. The rest of the view’s graph is constructed according to its definition identically to the construction of a query’s graph; no other properties such as its extension or storage persistency are considered. In that sense, most kinds of views are captured by the proposed technique, such as stored (e.g., named views, the definition of which is stored in the database without persistent storage), inline (e.g., views that are defined ad hoc in the FROM clause of queries) or materialized views (e.g., named views, the definition of which is stored in the database having persistent storage).
2.8 DML Statements
As far as modification queries are concerned, there is a straightforward way to incorporate them in the graph, too. Their behavior with respect to their dependencies with the database schema can be captured by a graph representation that follows the one of SELECT queries and captures the intended semantics of the DML statement. In our discussions, we will use the term graph equivalence to refer to the fact that evolution changes (e.g., attribute addition) can be handled in the same way we handle the equivalent SELECT query, either these changes occur in the underlying relation of the INSERT statement or the sources of the provider subquery Q:
(a)The general syntax of INSERT statements can be expressed as:
INSERT INTO table_name ( attribute_set) VALUES ( value_set) | ( Q),
where Q is the provider subquery for the values to be inserted.
The graph equivalent SELECT query, which corresponds to the INSERT statement, comprises a SELECT and a FROM clause, projecting the same attribute set with the attribute set of the INSERT statement, and a WHERE clause for correlating the attribute set with the inserted values - value set or the projected attribute set of the subquery, i.e.,:
SELECT (attribute_set) FROM table_name WHERE (attribute_set) = (value_set)|(Q)
(b) Similarly, DELETE statements can be treated as SELECT * queries comprising a WHERE clause. The general syntax of a DELETE statement can be expressed as:
DELETE FROM table_name WHERE condition_set
Again, the equivalent SELECT query, which corresponds to the above DELETE statement, comprises a SELECT clause, projecting all the attributes (i.e., *) of the table, as well as a WHERE clause, containing the same set of conditions with that of the DELETE statement, i.e.,:
SELECT * FROM table_name

41
WHERE condition_set
(c) Finally, UPDATE statements can be treated as SELECT queries comprising a WHERE clause. The general syntax of an UPDATE statement can be expressed as:
UPDATE table_name SET (attribute_set) = (value_set)|(Q) WHERE condition_set
The equivalent SELECT query, which corresponds to the above UPDATE statement, comprises a SELECT clause, projecting the attribute set which is included in the SET clause of the UPDATE statement, as well as a WHERE clause, containing the same set of conditions with that of the UPDATE statement, i.e.,:
SELECT attribute_set FROM table_name WHERE condition_set AND (attribute_set) = (value_set)|(Q)
In that way, the representation of DML statements to graphs is accomplished through the representation of the equivalent SELECT query.
2.9 Breaking the Graph into Modules
In this section, we extend the semantics of the evolution graph by including the concept of modules as a logical operation applied on the graph. The need for modularization of the graph stems from the fact that existing semantics (i.e., types of edges) are not sufficient for the representation of the relationships between different components of the system (e.g., a relation and a set of queries), since they do not distinguish part-of and provider relationships. The modularization of the graph is an operation imposed on the graph that subsumes the nodes and edges of the graph into logical modules. It allows us to exploit graph-theoretic properties and introduce algorithms and metrics for the interrelation of the components with each other. A module in the evolution graph is a logical subset of nodes and edges with the following definition:
Definition 2.2 - Modules: Given an evolution graph G=(V,E), a module Gm=<Vm, Em> is a subgraph of G iff Vm⊆V, Em⊆E, Em⊆Vm×Vm and belongs to one of the following patterns:
• Relation Module: A relation module comprises the relation node, all attributes’ and constraints’ nodes belonging to the relation as well as the edges connecting these nodes. That is, Vm⊆R∪A∪C and Em⊆ES∪EO.
• Query Module: A query module comprises the node of the query, nodes for the attributes, group by clause, order by clause, functions, parameters/constants and conditions belonging to the query as well as the edges connecting these nodes with each other.

42
That is, Vm⊆Q∪A∪C∪GB∪OB∪P∪F and Em⊆ES∪EW∪EH∪EGB∪EOB∪EO.
• View Module: Lastly, a view module comprises the node of the view, nodes for the attributes, group by clause, order by clause, functions, parameters/constants and conditions belonging to the view as well as the edges connecting these nodes with each other.
That is, Vm⊆VS∪A∪C∪GB∪OB∪P∪F and Em⊆ES∪EW∪EH∪EGB∪EOB∪EO.
Modules are disjoint with each other and they are connected through edges concerning foreign keys, mapping and operand relationships. The set of edges Em, starting from and ending to nodes belonging to the same module, are called intramodule or part-of edges. The nodes of each module are connected to the nodes of other modules of the system by incoming or outgoing edges. Incoming or outgoing edges of a module Gm=<Vm, Em> are called
intermodule or provider edges, mE iff [BrMB96]:
Input( mE )={<v1, v2>⊆ E| v2⊆Vm and v1⊆V-V m}
Output( mE )={ <v1, v2>⊆ E| v1⊆Vm and v2⊆V-V m }
where v1, v2 are nodes of and <v1, v2> is an edge directing from v1 towards v2.
According to definition 2.2, for the set of intermodule edges it stands that:
mE ⊆EF∪EM∪ EGB∪EOB∪EO .
Within a module, we distinguish top-level nodes comprising the query, relation or the view nodes, and low-level nodes comprising the rest subgraph nodes.

43
M4
M3
M2
M1
op op
op
op
op2
op2
op1
op1
op2
op1where
from
from
from
map-select
map-select
map-select
S
S
S
Q
A1
A3
A2
op
op
op
op
S SS
R
A1 A2 A3
R.PK
S SS
S
B1 B2 B3
S.PK
S SS
K
C1 C2 C3
K.PK
K.C1.FK K.C2.FK
AND=
=
Figure 2.15: Modularization of the graph
In Figure 2.15, we present the modular graph of a simple database configuration involving 3 relations, namely R(A1,A2,A3), S(B1,B2,B3), K(C1,C2,C3), with two foreign key constraints, K.C1�R.A1 and K.C2 �S.B1 and a simple SPJ query Q defined on them.
Q : SELECT R.A 1 AS A 1, R.A 2 AS A 2, S.B 2 AS A 3 FROM R, S, K
WHERE R.A1 = K.C 1 AND S.B 1=K.C 2
There are 4 modules, one query module, named M4, corresponding to query Q and three relation modules, named M1, M2, M3, for relations R, S and K, respectively.
2.10 Zooming Out the Graph
Another operation imposed on the graph involves the abstraction of the graph, by eliminating specific types of nodes and edges. Abstracting the graph into a modular representation at a coarser level of detail (zoom-out) allows us to eliminate the detailed information and

44
semantics of the complete graph and depict only a high level view of the system, without however losing the interdependencies between the various modules.
The abstraction of the graph involves the following steps:
• for each query, view or relation module, all low-level nodes and intramodule edges, Em, are suppressed and only the respective top-level node n∈{R,Q,VS} is retained, ;
• all inter-module edges, mE , between two modules are also suppressed to an edge.
The surviving edge is annotated with a weight corresponding to the number of the edges that originally connected the two modules. We call this weight the strength of the edge as it assesses how tightly the involved modules are coupled. In Figure 2.16, the configuration of Figure 2.15 is presented in zoomed-out level.
Figure 2.16: Abstraction of the graph
2.11 Summary
In this chapter, we have presented a graph modeling technique for the representation of database-centric environments that covers in coherent way relational tables, views, database constraints and SQL queries. We have employed a graph theoretic approach and we have mapped the aforementioned constructs to a graph, that we call Evolution Graph. We have provided in details the rules for the construction of the graph and operations that are further applied on it, such as the modularization and the abstraction of the graph. Although the presented technique focuses on the representation of relational schemas and SQL queries, it could be easily extended to represent more complex queries (e.g., UNION) or other database objects, such as stored procedures. Our goal was not to construct a complete representation technique for database systems but rather a principled method for expressing the core skeleton structure of the internals of database-centric environments, based on a graph-theoretic approach, combining both relations as well as structures around the database. Thus, evolution graph is a representation of the dependencies at the most detailed level of all these components that allows us to apply algorithms and metrics for the prediction and regulation of evolution impact.

45
3. FRAMEWORK FOR REGULATING DATABASE SCHEMA
EVOLUTION
Database and software systems are rarely static environments following initial implementation. The evolution of the database schema within a database – centric environment may occur throughout its entire lifecycle. Possible reasons for schema evolution with respect to the various phases of the lifecycle of a system are:
• Ambiguous or incomplete requirements during the development phase, which induce a substantial and frequent alteration of the database schema.
• Change of requirements during the productive phase of an information system which results in the structural evolution of the database to include or exclude the new semantics.
• Reorganization of the database schema during the productive phase of an IS as a result of different design solutions that are decided, such as the normalization / denormalization of schemas, etc.
• Lastly, reorganization of the database schema during the productive phase of an IS as a result of novel technical solutions that are introduced in the current infrastructure. Such activities include the migration of an obsolete legacy system towards an RDBMS, the migration between different DB versions or technologies, etc.

46
Schema evolution changes may affect the software around the database (mainly views and queries) in two ways:
(a) syntactically, an alteration on the schema of a database object may evoke a com-pilation or execution failure during the execution of a piece of source code that depends on the specific object. For example, the deletion of an attribute that is used in a procedure syntactically invalidates the procedure. In that case, the developer must revalidate manually the invalid source code by removing all references to the removed attribute.
(b) semantically, a change may have an effect on the semantics of the software used. For instance, the modification of a foreign key constraint may affect the join operation performed on a query.
In the context of the evolution graph, alterations in the database schema are events, which transform specific parts of the graph (e.g., a relation graph sustaining a change) and eventually affect other dependent graph constructs (e.g., a view graph depending on the specific relation). The latter may raise, in turn, new evolution changes, which have impact on other dependent graph constructs (such as a query graph depending on the specific view).
In this chapter, we introduce a framework for impact analysis and regulation of database schema evolution. We exploit the dependencies which are represented as edges in the evolution graph to both detect syntactical and semantic inconsistencies following an evolution event. We furthermore regulate the impact of an evolution event towards the nodes of the graph by annotating the graph with rules, called policies. The adaptation of a node to an evolution event and furthermore the propagation of the event towards the rest of the graph is dictated by the rule defined on the node. The proposed framework enables the user to proactively identify and regulate the impact of evolution processes. It provides the appropriate semantics to perform hypothetical evolution scenarios and test alternative evolution policies for a given configuration before the evolution process is applied on a production environment.
Chapter Outline. In section 3.1, we collect and categorize the various approaches and techniques related to the research area of database evolution. In section 3.2, a motivating example is employed for the establishment of the challenges and problems that we deal with in this chapter. In section 3.3 the main concepts and definitions of the framework for regulating schema evolution are proposed. Additionally, in section 3.4 the algorithm Propagate Changes, which handles the reaction of the system to evolution changes, is presented, whereas in sections 3.5 we describe in details the main components of this algorithm. In section 3.6, we experimentally assess the proposed framework over a real-case database environment. Lastly, in section 3.7, we conclude our proposal.

47
3.1 Management of Schema Evolution in Database Systems
The problem of database schema evolution is a long-term problem in the literature of database research with numerous efforts under various different contexts. In Figure 3.1, a taxonomy of articles related to schema evolution according to [UnLeip] is presented in a tag-cloud style (i.e., the size of the fonts of a category corresponds proportionally to the number of articles published in this category). According to this taxonomy which includes more than 400 publications, database schema evolution has been paid a great attention over the last twenty years, both at the conceptual, such as ER, UML and O-O approaches and at the logical level, such as relational approaches, XML, etc. Recently, an emerging aspect related to schema evolution deals with model management approaches and ontologies.
Figure 3.1: Tag-cloud Taxonomy of Related Work for Database Schema Evolution
[Rodd95] presents a survey on schema versioning and evolution, whereas in [Rodd00] a categorization of the overall issues regarding evolution and change in data management is presented. We can classify the different efforts according to the data model they address into the following categories [Rodd00]: (a) evolution of object-oriented databases, (b) evolution of entity-relationship diagrams, (c) relational schema evolution and schema versioning and lastly, (d) evolution of (materialized) views, mainly in the context of data warehouses, characterized by the duality of views, which are both queries as far as their intention is concerned and sets of tuples as far as their extension is concerned. In the following sections, we present related works regarding schema evolution for the categories described above.
3.1.1 Relational Schema Evolution and Versioning
Schema evolution in traditional database systems is mainly investigated in the context of relational schema evolution and schema versioning. The distinction between modification, evolution and versioning of database schemata in the relational model has been, in some cases, confused. In [Rodd95] the author presents taxonomy of changes applicable to the ER model, as well as the necessary changes to the respective relational model. The following definitions are given regarding the different aspects of database schema evolution.

48
• Schema modification: Schema Modification is accommodated when a database system allows changes to the schema definition of a populated database.
• Schema evolution: Schema Evolution is accommodated when a database system facilitates the modification of the database schema without loss of existing data.
• Schema versioning: Schema Versioning is accommodated when a database system allows the accessing of all data, both retrospectively and prospectively, through user definable version interfaces.
A bibliography concerning database schema evolution and versioning is given in [Rodd92b].
In [McSn90], the authors discuss extensions to the conventional relational algebra to support both aspects of evolution of a database's contents and evolution of a database's schema. They define a relation's schema to be the relation's temporal signature, a function mapping the relation's attribute names onto their value domains, and a class, indicating the extent of support for time. They also introduce commands to change a relation, now defined as a triple consisting of a sequence of classes, a sequence of signatures, and a sequence of states. A semantic type of system is required to identify semantically incorrect expressions and to enforce consistency constraints among a relation's class, signature, and state following update.
Schema evolution is investigated at the conceptual level in the context of evolution of entity-relationship diagrams. In [LiCC94], the authors present an approach to schema evolution through changes to the Entity-Relationship (ER) schema of a database. They enhance the graphical constructs used in ER diagrams, and develop EVER, an EVolutionary ER diagram for specifying the derivation relationships between schema versions, relationships among attributes, and the conditions for maintaining consistent views of programs.
3.1.2 Object – Oriented Schema Evolution
Schema evolution in the context of object oriented database systems has also been widely investigated from various points of view. Most of them introduce a set of schema changes or transformations on the objects of the O-O DBMS and approach evolution as generalization hierarchies of classes and mappings between these hierarchies.
One of the first attempts to incorporate schema evolution capabilities in O-O DBMS is presented in [Bane87]. The authors introduce a prototype object-oriented database system, called ORION with capabilities for supporting schema evolution. They establish a taxonomy of over 20 useful schema changes under the ORION object-oriented data model and define the semantics of each schema change. They identify a set of invariant properties of an object-oriented schema which must be preserved across schema changes, such as distinct names,

49
and define a set of rules for selecting the most meaningful way to preserve these invariant properties.
In [Fer+95], they describe an algorithm that is implemented in the O2 object database system for automatically bringing the database to a consistent state after a schema update has been performed. They, also, define a set of primitive change operations on classes, such as creation, modification, deletion of classes, modification of inheritance between classes, etc. and introduce a history record for holding the version of each class, much alike the versioning techniques applied in relational databases systems.
Another framework, related to evolution in O-O DBMS, is presented in [RaRu95]. They address the problem of schema evolution in shared O-O database systems. They propose a framework for integrating view facilities to deal with schema evolution. When new requirements necessitate schema updates for a particular user, the user specifies schema changes to the personal view rather than to the shared database schema. Their approach, then, computes a new view schema that reflects the semantics of the desired schema change and replaces the old view with the new one.
Lastly, an approach on impact analysis for schema evolution in O-O database systems is presented in [KaSj01]. As usual, a categorization is made for the different types of evolution. Direct schema evolution applies for the cases where schema changes are allowed without any loss of data. Schema versioning is fit for the cases where schema changes produce new versions of a schema and its extensions, while the older versions are still accessible. In the latter case, the old applications can still be used with the previous versions of the schema. The goal of the paper is to determine whether a priori impact analysis actually helps the system’s stakeholders. They have developed a tool, namely SEMT, which parses Java files and visualizes (a) the O-O schema and applications and (b) the impact of a change towards affected objects. The implemented events include (a) add/delete/rename a field, (b) add/delete a super class of a class, (c) add/delete a class.
3.1.3 Model Management and Schema Mappings
Related to database evolution, model management is an approach to metadata management that offers a high level-programming interface than current techniques. The main abstractions are models, abstracting mainly schemas and interface definitions, and mappings between these models [Bern03], [Meln04], [VeMP04]. Model management applies to a number of database problems such as schema and data integration, schema evolution, etc.
Database schema evolution can be regarded as a special kind of the model management problem. Structural changes in a database (i.e. addition of a constraint, removal of an attribute, etc.) are regarded as changes in the model abstracting the database schema. The models, abstracting the database schema before and after the occurrence of the changes, must recover the mapping(s) between them. That is, a suitable mapping must exist among the

50
model representing the old database schema and the model representing the new one in order the various queries and in general the applications interacting with the database to conform to these changes.
In [BeRa00], [Bern03], the authors proposes a model management algebra, a set of operators for management of models and mappings between them comprising Match, Merge, Diff, Compose, Apply and ModelGen operators. The introduced algebra is applied to problems related to schema integration, schema evolution and round trip engineering.
In [Meln04], extending the work of [Bern03] the author propose a framework for generic model management, called Rondo, in which models are represented as directed graphs, and morphisms (edges between two graph representation of models) are mappings between entities (e.g. attribute, constraints, etc.) belonging to two different models. Extending operators proposed in [Bern03], a set of operators is introduced to manage mappings and transformations of models, including graph theoretic and set theoretic operators. Especially, for the Match operator, they propose the Similarity Flooding Algorithm, an algorithm for finding and ranking the similarity between two models, as well as creating a mapping between them. The proposed framework is not restricted to relational model, but covers XML and other database models, as well. Model management addresses problems related to data and schema integration, schema evolution, ETL, etc. A set of metrics is introduced in the context of model mapping, including metrics for similarity between two models, best matching between two models, etc.
In [VeMP03], [VeMP04], the authors propose a framework, called ToMas, for automatically adapting (rewriting) mappings as schemas evolve. Their approach considers not only local changes to a schema but also changes that may affect and transform many components of a schema. Their algorithm detects mappings affected by structural or constraint changes, including addition/removal of a constraint, removal of attributes, etc., and generates all the rewritings that are consistent with the semantics of the changed schemas. Their approach explicitly models mapping choices made by the user and maintains these choices, whenever possible, as the schemas and mappings evolve. When there is more than one candidate rewriting, the algorithm may rank them based on how close they are to the semantics of the existing mappings.
3.1.4 Schema Evolution in Data Warehouses
Research efforts related to the problem of schema evolution in multidimensional databases have been elaborated in accordance to the introduction of modeling concepts regarding data warehouses, such as the star and snowflake models. Most of these efforts [BlSH99], [BoKe00], [KaPR04] adjust the semantics of schema evolution to the multidimensional paradigm by introducing a set of evolution changes for the data warehouse constructs, such as slowly changing dimensions [Kimb96], addition/ modification / deletion of measures, etc.

51
[BlSH99] presents a formal framework to describe evolutions of multidimensional schemas and their effects on the schema and on the instances. The framework is based on a formal conceptual description of a multidimensional schema and a corresponding set of evolution operators, such as insert/delete dimension level, insert fact etc. [BoKe00] proposes, as well, a logical model for data warehouse representation which consists of a hierarchy of views, namely the base views, the intermediate views and the users views. In this context, the proposed model is enriched with a small set of evolution changes, such as addition/deletion of (materialized) views and sources. In [GLRV04], the authors deal with schema versioning in the context of data warehouses, where queries may span in multiple versions of DW schemas. The authors discuss versioning of star schemata, where histories of the schema are retained and queries are chronologically adjusted to ask the correct schema
In [FaPo04], AutoMed, a framework for the management of schema evolution in data warehouse environments is presented. They introduce a schema transformation-based approach to handle evolution of the source and the warehouse schema. Complex evolution events are expressed as simple transformations comprising addition, deletion, renaming, expansion and contraction of a schema construct. They also deal with the evolution of materialized data with use of IQL, a functional query language supporting several primitive operators for manipulating lists.
3.1.5 View adaptation to Schema Evolution
Views defined over evolving environments may become invalid due to changes at the sources or definition of a view. The problem of view adaptation to database schema changes comprises two special aspects:
• The first concerns the adaptation of the extent of a view in the presence of changes in the view definition, trying to minimize the rematerialization effort for the view [GMRR01], [MoDo96]. Changes in views definition are invoked by the user and rewritings are used to keep the view extent consistent with the data sources. For instance, if an attribute is added in the definition (i.e., in the SELECT clause) of a materialized view, the view must be rematerialized and populated with the values of the new attribute. The proposed techniques adjust the view extent to a consistent state without fully rematerializing the view from the underlying data warehouse. Thus, the problem is formulated as view adaptation after redefinition to avoid rematerialization of the view.
• The second deals with the adaptation of the view definition in the presence of changes in the underlying database schema [Bell02]. The author deals with the same problem, considering that the view redefinition is invoked by schema changes at the base relations and must be propagated, essentially, to the view definition. The problem is formulated as to how we can rewrite or transform the view in order to

52
avoid invalidation issues both at the data as well as the schema level. [NiLR98], [RuLN97] deal also with a specialized aspect of the view adaptation problem, the view synchronization problem, which considers that views become invalid after changes in view’s definition that are invoked by the user. The authors extend SQL, enabling the user to define evolution parameters characterizing the tolerance of a view towards changes and how these changes will be dealt with during the evolution process. Specifically, two evolution parameters are introduced, namely dispensable and replaceable parameters, which dictate whether an attribute referenced in the view is allowed to be dispensed from the view definition or replaced by a valid rewriting in the case that it is deleted from the source relation. Also, the authors propose an algorithm for rewriting views based on interrelationships between different data sources. The treatment of attribute deletions in [NiLR98] is quite elaborate; since a view becomes syntactically invalid, the proposed algorithm tries to restore the “lost” information from other information sources (connected via predefined join constraints) in order to make the view valid again. Lastly, [NiLR98] proposes a quality-cost model for view synchronization operations, comprising metrics for performance, divergence between view interface, content, etc.
Lastly, in [FaBB07], the authors tend to extend the work of [PaVV05]. They first consider a set of evolution changes occurring at the schema of a data warehouse, such as dimension, level creation, deletion etc. and provide an informal algorithm for adapting affected queries and views to such changes.
3.1.6 Comparison with Related Work
To this end, we compare some aspects of the proposed framework for regulating schema evolution with respect to the related literature presented above. Many of the above presented approaches to schema evolution can be considered orthogonal to the framework proposed in this dissertation. Our work can be compared to the existing literature with respect to the following aspects:
• Extensibility regarding evolution changes: Most schema changes proposed in the literature [Rodd95] and supported by current RDBMS are considered and incorporated as operations on the Evolution Graph. Even if we primarily focus on schema evolution in the context of relational database systems, our framework is not constrained only to such contexts. Evolution changes regarding other evolution contexts [BlSH99], or complex evolution events which are decomposed into a set of elementary schema changes [FaPo04], can be transformed to evolution operations on the graph and thus integrated in the framework. For instance, schema changes in the context of data warehouse are mapped to graph operations in [PVSV08].

53
• Schema Mapping and Transformation: The proposed framework focuses on detecting the impact of schema changes occurring on parts of a relational database-centric environment (either on the database schema or dependent constructs). In that sense, it is out of the scope of this work to provide techniques for view and query rewriting [Bell02], [GMRR01], [NiLR98], schema mapping [VeMP04], [FaPo04] and model integration [Bern03], [Meln04] or data evolution and maintenance. Such techniques can be mapped to transformations on the evolution graph and in that sense they are orthogonal to our approach. This is due to the fact that our algorithm stops at status determination and does not perform any rewritings. A designer can apply any rewriting algorithm, provided that he pays the annotation effort that each of the methods of the literature requires (e.g., LAV/GAV/GLAV or any other kind of metadata expressions). For example, such an expression could be stating that two select-project fragments of two relations are semantically equivalent. Due to this generality, our approach can be extended in the presence of new results on such algorithms. Also, the work of [KaSj01] has some similar aspects with the proposed framework of this dissertation, since they employ a directed graph for representing the object dependencies in O-O database environments and finding the impact of changes in database objects towards application objects.
• Regulating schema evolution through policies: Most related works consider that constructs affected by schema changes, such as queries and views, must retain their original semantics. Unfortunately, current DBMS languages do not incorporate evolution semantics, so that administrators / developers could prescribe the behavior of the system when database schema evolution changes occur. Our framework introduces additional evolution semantics, i.e., policies imposed as annotations on the graph constructs, for regulating the way parts of the graph are affected by evolution changes. These policies regulate whether affected constructs will retain their original semantics when they are affected by an evolution change or they will conform to the new semantics imposed by this change. In this context, our work can be compared with that of [NiLR98] in the sense that policies act as regulators for the propagation of schema evolution on the graph similarly to the evolution parameters introduced in [NiLR98]. However, the authors of [NiLR98] deal only with schema changes for deletion of attributes and relations. We furthermore extend this approach to incorporate attribute additions and the treatment of conditions. The treatment of attribute deletions in [NiLR98] is quite elaborate; we confine to a restricted version to avoid overcomplicating both the size of requested metadata and the language extensions. Still, the [NiLR98] approach for deletions can easily be taken into consideration in our framework. Also, the model of [VeMP04] is more restrictive, in the sense that it is intended towards retaining the original semantics of the queries by preserving mappings consistent when changes occur. Our work is a larger framework that allows the restructuring of the database graph (i.e., model) either towards

54
keeping the original semantics or towards its readjustment to the new semantics. [FaPo04] can be used orthogonally to our approach for the case that affected constructs must preserve the old semantics (i.e., block policy in our framework).
3.2 Motivating example
Before illustrating the main concepts of the proposed framework, we present in this section a motivating example that attempts to capture the problems and the challenges that we deal with. Observe the configuration of Figure 3.2, which depicts a small database centric system operating in the intranet of an imaginary company. In the database layer, the system retains data for all employees working in this company along with data for the projects they work for. In the application layer, data entry forms are used for inserting and updating records in the database. A report module is also used by company’s managers for analysis reasons. This module interacts with the database through a view layer. We distinguish the following roles for the users participating in this configuration: a) Database administrators are responsible for the management of the schema of the database as well as the views’ definition stored in the database, (b) developers are responsible for maintaining the queries contained in data entry forms and lastly (c) analysts are responsible for expressing and modifying queries in the report module.
For simplicity reasons, we consider that the database schema comprises only 3 relations with the following schemas expressed in DDL statements:
CREATE TABLE EMP( E_ID INTEGER PRIMARY KEY, E_NAME VARCHAR(25) NOT NULL,
E_TITLE VARCHAR(10), E_SAL INTEGER NOT NULL); CREATE TABLE PRJS( P_ID INTEGER PRIMARY KEY, P_NAME VARCHAR(25) NOT NULL, P_BUDGET INTEGER NOT NULL); CREATE TABLE WORKS( E_ID INTEGER, P_ID INTEGER, W_RESP VARCHAR(10), W_DUR INTEGER, PRIMARY KEY (E_ID,P_ID), FOREIGN KEY (E_ID) REFERENCES EMP(E_ID), FOREIGN KEY (P_ID) REFERENCES PRJS(P_ID));
The view layer comprises a view, namely Emps_Prjs , that correlates the employees with the projects they work for. On top of this view, we consider that the report module contains an aggregate query that calculates the expenses of each project per month by

55
summing up the salaries of all employees working for it and compares them with the budget of the project. Lastly, in the data entry forms, we consider solely an INSERT statement that inserts records in EMP relation. The definitions of the employed view and queries in terms of SQL syntax are included in the figure.
Figure 3.2: Motivating Example Configuration
Assume that due to changes in requirements the administrator must add an attribute to the relation EMP, say Phone . Should this change be propagated to the view and/or the query involved in the data entry form? Is actually the query affected by such an event? Although related research can handle the deletion of attributes, due to the obvious fact that queries become syntactically incorrect, the addition of information is deferred to a decision of the designer/developer. In general, given an evolution change that occurs on a part of the system, the following question arises (from the administrator’s point of view): Which parts of the system are affected and how?
The situation is more pressing when the attributes added involve the primary key of a relation. Assume, for example, that two attributes are added to relation Works , namely StartDate , EndDate , characterizing the period over which an employee has worked for a project. In this case, the uncertainty on the correctness of the view definition is increased: do we request all employees ever having worked in a project, or only the ones currently involved in some project? Similar considerations arise in the case where the WHERE clause of the view is modified. Assume that a field STATUS is added to all projects and the view definition is modified by incorporating the extra selection STATUS=’Active’ . Can we still use the view in order to answer the query or not? The answer is not obvious, since it depends on whether the query employed by the analysts, uses the view simply as a macro (in order to

56
avoid the extra coding effort) or, on the other hand, the query is supposed to work on the view, independently of what the view definition is [TsKl78]. In other words, whenever a query is defined over a view, there exists two possible ways to interpret its semantics: (a) the query is defined on the time-specific semantics of the view; if the view’s definition changes in the future the query’s semantics are affected, (b) the query’s author uses the view as an API ignoring the semantics of the view; if these semantics change in the future, the query should not be affected. The problem lies in the fact that there is no semantic difference in the way one defines the query over the view; i.e., we define the view in the same manner in both occasions. Again, given an evolution change that occurs on a part of the system and has an impact on other parts of the system, the following question arises (both from the administrator’s and the developer’s points of view): Can we predefine the reaction of the system to potential changes?
3.3 Regulating Schema Evolution
To deal with the above issues, we introduce a framework for the detection of the parts of the system, which are affected by an evolution change and the regulation of their reaction to this change [PaVV05]. The main mechanism comprises the annotation of the constructs of the evolution graph (i.e., nodes and edges) with further semantics that facilitate the impact analysis and regulation of schema evolution. First, we define events on the nodes of the graph which are mapped to evolution changes that occur on parts of a database. Constructs of the graph are, then, enriched with policies that allow the developer to specify the behavior of the affected constructs whenever events that alter the database graph occur. The combination of an event with a policy determined by the designer/administrator triggers the execution of the appropriate action that either blocks the event, or highlights properly the graph to adapt to the proposed change.
The space of potential events comprises the Cartesian product of two subspaces; specifically the space of hypothetical actions (addition/ deletion/modification) by the space of graph constructs sustaining evolution changes (e.g., nodes for relations, attributes, conditions, etc.). For each of the above events, the administrator annotates graph constructs with policies that dictate the way they will react to an event when affected.
We provide the following definitions concerning the main concepts of our framework.
Definition 3.1 – Evolution Action: An evolution action a is a tuple of the form {Action Type, Node Type} where (a) Action Type is the type of operation that applies on nodes of the graph, such as addition, deletion, modification and renaming and (b) Node Type is the type of node sustaining the action, such as relation node, attribute node, etc., as presented in section 2.
Examples of evolution actions are {addition, attribute}, { renaming, relation} and { modification, condition}. Evolution actions are classified as composite and elementary.

57
Composite evolution actions, such as splitting, merging, pivoting, etc., can be expressed as sequential combinations of elementary ones.
Evolution events on the schema of a database construct, either a relation, a view or a query, are operations that transform its schema from an initial state S to a state S’, and defined in the context of our framework as:
Definition 3.2 – Evolution Event: An evolution event e applied on the evolution graph G=(V, E) is a tuple of the form {a, n} where (a) a is the evolution action that triggers the
event and (b) n⊆V is the graph node on which this action occurs.
Examples of evolution events include {addition of attribute, Emp}, {renaming of attribute, E_Title}, etc. In the context of our graph model, evolution events are operations on nodes of the graph.
Definition 3.3 - Affected Node: A node n⊆V is affected by an event e occurring on node n0 iff a directed edge exists from n towards n0.
Affected nodes by an evolution event are nodes that are semantically or syntactically affected by this event. For instance, if a query node accesses a relation, on which an attribute is added, then this query node is affected by this event. Affected modules are graph modules (i.e., query modules, view modules), which comprise at least one affected node and thus regarded as candidates for evolution.
Definition 3.4 – Policy: A policy p for an event e applying on a graph node n⊆V is a
triple of the form {n,e, rule}, where (a) n⊆V is the node of the graph annotated, (b) e is an event occurring on the graph and (c) rule is the reaction that node n must have when affected by event e. Specifically, three kinds of rules are defined with respect to the semantics incurred by an event:
(a) propagate the change, meaning that the graph must be reshaped to adjust to the new semantics incurred by the event;
(b) block the change, meaning that we want to retain the old semantics of the graph and the hypothetical event must be blocked or, at least, constrained, through rewriting that preserves the old semantics; and
(c) prompt the administrator to interactively decide what will eventually happen.
Figure 3.3 depicts the triple relationship that characterizes the semantics of policies on the graph. We annotate elements of the graph with a specific rule, for reacting to events occurring on the same or other elements of the graph.

58
With
rule
Figure 3.3: Annotation of the graph with policies
Examples of policies imposed on the graph include {Q1, add attribute to Emp, block}, {Emps_Prjs, delete attribute Prjs.P_Budget, Propagate}, etc.
For better clarifying the relationship between the schema changes and the parts of the system that are affected by each change, in Table 3.1 we present (a) the kinds of events captured by our framework, (b) the parts of the system that are affected by each kind of event and (c) the allowed annotations of graph constructs with policies for each kind of event. For instance, for the case of an attribute addition, affected parts of the system comprise the relation or view on which the new attribute was added as well as any view or query defined on this relation / view.

59
parts of the system affectednodes annotated with policies
Events R/V R/V
Attr. R/V
Cond.Q/V Q/V
Attr. Q/V
Cond. R A V/Q C/F/GB/
OB/P Add A √ √ √ √
C √ √ √ √ √ √ R/V
Delete A √ √ √ √ √ √ √ √ √ C √ √ √ √ √ √ √ √
R/V √ √ √ √ Modify/ Rename
A √ √ √ √ √ √ √ √ √ √ C √ √ √ √ √ √ √ √
R/V √ √ √ √ A = Attribute, C = Condition, R= Relation, V=View, Q=Query, F= Function, GB = Group By, OB = Order By P = Parameter
Table 3.1: Parts of the system affected by evolution events and annotation of appropriate graph construct
Based on the annotation of parts of a system with policies for an event, our framework determines their reaction to this event by assigning a status to each of them. That is:
Definition 3.5 - Status: Let a node n⊆V annotated with a policy p for the event e; the status s assigned to n describes the action that is applied to the node n for adapting to event e. The status is a property assigned to a node based on its policy for this event, i.e., s =f(p) or equivalently from definition 4.3 (for policies) s=f(n , e, rule).
We will demonstrate the above concepts of our framework with an example for the case of attribute addition. The configuration refers to the motivating example presented in section 3.2.
Example of Attribute Addition: Consider the INSERT statement used in the data entry form, which is represented in our framework as the equivalent query Q1: SELECT * FROM
EMP. Assume that the provider relation EMP is extended with a new attribute PHONE. There are two possibilities:
• The * notation signifies the request for any attribute present in the schema of relation EMP. In this case, the * shortcut can be treated as “return all the attributes that EMP has, independently of which these attributes are”. Then, the query must also retrieve the new attribute PHONE.
• The * notation acts as a macro for the particular attributes that the relation EMP originally had. In this case, the addition to relation EMP should not be further propagated to the query.

60
A naïve solution to a modification of the sources; e.g., the addition of an attribute, would be that an impact prediction system must trace all queries and views that are potentially affected and ask the designer to decide upon which of them must be modified to incorporate the extra attribute. According, however, to the proposed framework, an element that is affected by the addition is annotated with the policies mentioned before. According to the policy defined on each construct the respective action is taken to correct the query. Therefore, for the example event of an attribute addition, the policies defined on the query and the actions taken according to each policy are:
• Propagate attribute addition. When an attribute is added to a relation appearing in the FROM clause of the query, this addition should be reflected to the SELECT clause of the query.
• Block attribute addition. The query is immune to the change: an addition to the relation is ignored. In our example, the second case is assumed, i.e., the SELECT * clause must be rewritten to SELECT A1,…,An without the newly added attribute.
• Prompt. In this case (default, for reasons of backwards compatibility), the designer or the administrator must handle the impact of the change manually; similarly to the way that currently happens in database systems.
E_ID
Name
E_ID PhoneName
EMP
QS
S
map-select
map-select
SS S
fromPolicy
On attribute addition To EMP
then propagate
Phone
S
map-select
...
...Status:
Add_Child
Status:
Add_Child
Figure 3.4: Propagating addition of attribute PHONE
The graph of the query Q1: SELECT * FROM EMP is shown in Figure 3.4. The annotation of node Q with for propagating addition indicates that the addition of PHONE node to EMP relation will be propagated to the query and the query is assigned a status for the addition of an attribute as the new attribute is included in the SELECT clause of the query. This is accomplished with the assignment of the appropriate status to every node that is affected by the attribute addition.

61
3.4 Algorithm Propagate Changes
The mechanism determining the reaction to a change, i.e., the assignment of a node with a status, is formally described in Figure 3.5 by the algorithm Propagate Changes [PVSV07], [PVSV09]. Given an evolution graph G(V,E) annotated with policies and an event e over a node n0, Propagate Changes assigns a status to each affected node of the graph, dictating the action that must be performed on the node to handle the event.
Algorithm Propagate Changes Input : (a) a session id SID
(b) a graph G(V,E) (c) an event e over a node n0 (d) a set of policies P defined over nodes of G (e) an optional default policy p0 defined by the user for the event e
Output : a graph G(V,E) with a Status value for each n∈V’ ⊆V
Parameters: (a) a global queue of messages Emsg
(b) each message m is of the form m = [SID, n S, n R, e, p S] where
SID : The unique identifier of the session regarding the evolution event e nS : The node that sends the message nR : The node that receives the message e : The event that occurs on nS pS : Policy of nS for the event e
Begin 1. Emsg.enqueue([SID,user,n0, e, p0]) 2. while (Emsg != ∅){ 3. m = Emsg.dequeue(); 4. pR = determinePolicy(m); 5. nR.Status=set_status(m,pR); 6. decide_next_to_signal(m,Emsg,G);} //enqueue m
End
Figure 3.5: Propagate Changes Algorithm
Specifically, given an event e over a node n0 altering the source database schema, Propagate Changes determines those nodes that are directly connected to the node altered and an appropriate message is constructed for each of them, which is added into the queue. For each processed node nR, its prevailing policy pR for the processed event e is determined. According to the prevailing policy, the status of each construct is set. Subsequently, both the initial changes, along with the readjustment caused by the respective actions, are recursively propagated as new events to the consumers of the activity graph. In Figure 3.4, the statuses assigned to the affected nodes by the addition of an attribute to EMP relation are depicted.
62
First, the algorithm sends a message to EMP relation for the addition of attribute PHONE to its schema, with a default propagate policy. It assigns the status ADD CHILD to relation EMP and propagates the event sending a new message to the query. Since an appropriate policy capturing this event exists on the query, the query is also assigned an ADD CHILD status. In the following sections, we discuss in more details the main components of the proposed algorithm.
3.5 Tuning the propagation of changes
In this section, we detail the internals of the algorithm Propagate Changes. Given an event arriving at a node of the graph, the algorithm involves three cases, specifically, (a) the determination of the appropriate policy for each node, (b) the determination of the node's status (on the basis of this policy) and (c) the further propagation of the event to the rest of the graph.
3.5.1 Determining the Prevailing Policy
It is possible that the policies defined over the different elements of the graph do not always align towards the same goal. Two problems might exist:
a) over-specification refers to the existence of more than one policies that are specified for a node of the graph for the same event, and,
b) under-specification refers to the absence of any policy directly assigned to a node.
Consider for example the case of Figure 5, where a simplified subset of the graph for a certain environment is depicted. A relation R with one attribute A populates a view V, also with an attribute A. A query Q, again with an attribute A is defined over V. Here, for reasons of simplicity, we omit all the parts of the graph that are irrelevant to the discussion of policy determination. As one can see, there are only two policies defined in this graph, both concerning the deletion of attributes of view V. The first policy is defined on view V and says: ‘Block all deletions for attributes of view V’, whereas the second policy is defined specifically for attribute V.A and says ‘If V.A must be deleted, then allow it’.

63
Figure 3.6: Example of over-specification and under-specification of policies
The first problem one can easily see is the over-specification for the treatment of the deletion of attribute V.A. In this case, one of the two policies must override the other. A second problem has to do with the fact that neither R.A, nor Q.A, have a policy for handling the possibility of a deletion. In the case that the designer initiates such an event, how will this under-specified graph react? To give you a preview, under-specification can be either offline prevented by specifying default policies for all attributes or online compensated by following the policy of surrounding nodes. In the rest of this section, we will refer to any such problems as policy misspecifications.
We provide two ways for resolving policy misspecifications on a graph construct: on-demand and a-priori policy misspecification resolution. Whenever a node is not explicitly annotated with a policy for a certain event, on-demand resolution determines the prevailing policy during the algorithm execution based on policies defined on other constructs. A-priori resolution prescribes the prevailing policy for each construct potentially affected by an event with use of default policies. Both a-priori and on-demand resolution can be equivalently used for determining the prevailing policy of an affected node. A-priori annotation requires the investment of effort for the determination of policies before hypothetical events are tested over the database schema. The policy overriding is tuned in such a way, though, that general annotations for nodes and edges need to be further specialized only wherever this is necessary. Our experiments, later, demonstrate that a-priori annotation can provide significant earnings in effort for the database administrator. On the other hand, one can completely avoid the default policy specification and annotate only specific nodes. This is the basic idea behind the on-demand policy and this way less effort is required at the expense of runtime delays whenever a hypothetical event is posed on the system.
3.5.1.1 On-demand resolution
The algorithm for handling policy conflicts on demand is shown in Figure 3.7. Intuitively, the main idea is that if a node has a policy defined specifically for it, it will know how to respond to an event. If an appropriate policy is not present, the node looks for a policy (a) at its container top-level node, or (b) at its providers.

64
Algorithm Determine Policy Input : a message m of the form m=[SID,nS,nR,e,pS] Output : a prevailing policy pR Begin 1. if (edge(ns,nr) isPartOf) // if m came from partof edge 2. return pS; // child node policy prevails 3. else // m came from provider 4. if exists policy(nR,e) // check if nR has policy for this event 5. return policy(nR); // return this policy 6. else if exists policy(nR.parent,e) 7. return policy(nR.parent); // return nR parent’s policy 8. else return ps; // else return providers policy
End
Figure 3.7: Determine Policy Algorithm
Algorithm follows the subsequent rule: the higher and left a module is at the hierarchy of Figure 3.8, the stronger its policy is.
Figure 3.8: On Demand Policy Resolution
Algorithm Determine Policy implements the following basic principles for the management of an incoming even to a node:
• If the policy is over-specified, then the higher and left a module is at the hierarchy of Figure 3.6, the stronger its policy is.
• If the policy is under-specified, then the adopted policy is the one coming from lower and right.
The algorithm assumes that a message is sent from a sender node ns to a receiver node nr. Due to its complexity, we present the actual decisions taken in a different order than the one of the code:

65
Check 1 (lines 6-7): This check concerns child nodes: if they do not have a policy of their own, they inherit their parent’s policy. If they do have a policy, this is covered by lines 4-5.
Check 2 (lines 1-5): if the event arrives at a parent node (e.g., a relation), and it concerns a child node (e.g., an attribute) the algorithm assigns the policy of the parent (lines 4-5), unless the child has a policy of its own that overrides the parent’s policy (lines 1-2). A subtle point here is that if the child did not have a policy, it has already obtained one by its parent in lines 6-7.
Check 3 (line 7): Similarly, if an event arrives from a provider to a consumer node via a map-select edge, the receiver will make all the above tests, and if they all fail, it will simply adopt the provider’s policy. For example, in the example of Figure 3.6, Q.A will adopt the policy of V.A if everything else fails.
3.5.1.2 A-priori resolution
A-priori resolution of policy conflicts enables the annotation of all nodes of the graph with policies before the execution of the algorithm. A-priori resolution guarantees that every node is annotated with a policy for handling an occurred event and thus no further resolution effort is required at runtime. That is, the receiver node of a message will always have a policy handling the event of the message. A-priori resolution is accomplished by defining default policies at 3 different scopes [Pap+08].
System-wide scope: First, we prescribe the default policies for all kinds of constructs, in a system-wide context. For instance, we impose a default policy on all nodes of the graph that blocks the deletion of the constructs per se.
Top-level scope: Next, we prescribe defaults policies for top-level nodes, namely relations, queries and views of the system, with respect to any combination of the following: the deletion of the construct per se, as well as the addition, deletion or modification of a construct’s descendants. The descendants can be appropriately specified by their type, as applicable (i.e., attributes, constraints or conditions).
Low-level scope: Lastly, we annotate specific low granularity constructs, i.e., attributes, constraints or conditions, with policies for their deletion or modification.
The above arrangement is order dependent and exploits the fact that there is a partial order of policy overriding. The order is straightforward: defaults are overridden by specific annotations and high level construct annotations concerning their descendants are overridden by any annotation of such descendant:
System-wide Scope ≤ Top-Level Scope ≤ Low-Level Scope
Furthermore, certain nodes or modules that violate the above default behaviors and must obey to an opposite reaction for a potential event are explicitly annotated. For example,

66
if a specific attribute of an activity must always block the deletion of itself, whereas the default activity policy is to propagate the attribute deletions, then this attribute node is explicitly annotated with block policy, overriding the default behavior.
3.5.1.3 Completeness
The completeness problem refers to the possibility of a node that is unable to determine its policy for a given event. It is easy to see that it is sufficient to annotate all the source relations for the on-demand policy, in order to guarantee that all nodes can determine an appropriate policy. For the case of a-priori annotation, it is also easy to see that a top-level, system-wide annotation at the level of nodes is sufficient to provide a policy for all nodes. In both cases, it is obvious that more annotations with extra semantics for specific nodes, or classes of nodes, that override the abovementioned (default) policies, are gracefully incorporated in the policy determination mechanisms.
3.5.2 Determination of a node’s status
In the context of our framework, the action applied on an affected graph construct is expressed as a status that is assigned on this construct. The status of each graph construct visited by Propagate Changes algorithm is determined locally by the prevailing policy defined on this construct and the event transmitted by the adjacent nodes. The status of a construct with respect to an event designates the way this construct is affected and reacts to this event, i.e., the kind of status that will be assigned to the construct. The general guidelines for assigning statuses on nodes stem from the rules provided in Table A.1 of Appendix A.
A visited node is initially assigned with a null status. If the prevailing policy is block or prompts then the status of the node is block and prompt respectively, independently of the occurred event. Recall that blocking the propagation of an event implies that the affected node is annotated for retaining the old semantics despite of change occurred at its sources. The same holds for prompt policy with the difference that the user, e.g., the administrator, the developer, etc. must decide upon the status of the node.
For determining the status of a node when a propagate policy prevails, we take into account the event action (e.g., attribute addition, relation deletion, etc.) transmitted to the node, the type of node accepting the event and lastly the scope of the event action. An event raises actions that may affect the node itself, its ancestors within a module or its adjacent dependent nodes. Thus, we classify the scope of evolution impacts with respect to an event that arrives at a node as:
• SELF: The event occurs on the node itself, e.g. a delete attribute event occurs on attribute an attribute node.

67
• CHILD: The event occurs on a descending node belonging to the same module, e.g., a view is notified with a delete attribute event for the deletion of one of its attributes.
• PROVIDER: The event occurs on a node belonging to another module, e.g., a query is notified for the addition of an attribute at the schema of one of its source relations.
In that manner, combinations of the event type and the event scope provide a non finite set of statuses, such as: DELETE SELF, DELETE CHILD, ADD CHILD, RENAME SELF, MODIFY PROVIDER etc. It is easy to see that that the above mechanism is extensible both with respect to event types and statuses. Lastly, the status assignment to nodes induces new events on the graph which are further propagated by Propagate Changes algorithm to all adjacent constructs. In Table A.2 of Appendix A, the statuses assigned to visited nodes for combinations of events and types of nodes are shown, when propagate policy prevails on the visited node. For each status the new event induced by the assignment of a node with status, which is further propagated to the graph, is also shown.
3.5.3 Next to Signal - Optimization and Pruning
The processing order of affected graph elements is, primarily, determined by a BFS traversal on the graph. Moreover, after the processing of each node the algorithm checks its assigned status. If the status is block or prompt, the further traversal of the graph beyond this node stops and the propagation of the event is either blocked or the framework prompts the administrator to decide. All nodes depending on the node that blocked the event are not notified and therefore remain immune to the event. For the case that the assigned status is not block or prompt, the algorithm inserts a message into the queue for all adjacent nodes connected with outgoing edges towards this node.
BFS traversal ensures that all affected constructs are examined for adaptation, but cannot guarantee that no cycles potentially resulting in controversial setting of statuses are detected. For instance, observe the graph of Figure 3.4, on which the event “deletion of attribute EMP.Name” occurs, and all nodes retain a prevailing policy for propagating the deletion. The PS algorithm determines the status of EMP.Name as “DELETE SELF” and inserts into queue two messages for nodes EMP and Q.Name. These nodes will in turn obtain statuses “DELETE CHILD” and “DELETE SELF” respectively, and each of them sends a message to node Q. The latter will be twice notified with the following messages: one of its children, namely Q.Name, is deleted and one of its provider’s children, namely EMP.Name, is deleted. Eventually, node Q must react to these two messages, the arriving order of which may result in the assignment of different statuses.
To deal with the above contradiction, we apply an additional optimization on the BFS traversal of the graph, requiring that messages are inserted into queue with a specific order. First all nodes connected via provider edges with the node suffering the event are notified and afterwards all nodes connected via part-of edges. Additionally, messages arriving from a

68
node connected via a provider edge are pruned if a status capturing the same event has already been set. This can ensure that no cycles and controversial statuses are detected on the graph. With the above constraints, the query Q will be notified by the child Q.NAME for its deletion and ignore the message coming from relation EMP.
It is easily noticed that with the use of policies our framework regulates the propagation of events towards the graph and thus the parts that are affected by an event. We are ready now to provide a refinement to the definitions of affected nodes in the presence of policies and a new definition regarding transformed nodes.
Definition 3.6 - Affected Node in the presence of policies: Let G(V,E) be an
evolution graph annotated with a set of policies P. A node n⊆V is affected by an event e (occurring on node n0) iff after the execution of PS a status s is assigned to n for handling e.
Affected nodes by an evolution event are nodes that are visited by PS algorithm and therefore assigned a status for handling an event. In that sense, nodes that are connected with a direct path towards the node sustaining an event are not affected if an intermediate node has blocked the propagation of the event towards them.
Definition 3.7 - Transformed Node: A node n⊆V is transformed by an event e (occurring on a node n0) iff the status s assigned to node n for handling the event e requires the transformation of n.
A transformed node by an event is a node, which is affected by this event through some kind of transformation, i.e., a status different from block is assigned to node, such as delete node, rename, etc. Rewritten modules to an event are graph modules, which comprise at least one transformed node, and therefore are adjusted to an evolution event explicitly through some kind of rewriting.
3.6 Experimental Evaluation
In this section, we present in details the experimental evaluation that we performed for our framework. We evaluated the proposed framework and capabilities of the approach in the configuration of a data warehouse environment and, specifically, via the reverse engineering of 7 real-world Extraction – Transformation – Loading (ETL) scenarios extracted from an application of the Greek public sector. The examined data warehouse maintains information regarding farming and agricultural statistics. Our goal was to evaluate the framework with respect to its effectiveness for adapting ETL workflows to evolution changes occurring at ETL sources and its efficiency for minimizing the human effort required for defining and setting the evolution metadata on the system.
The aforementioned ETL scenarios extract information out of a set of 7 source tables, namely S1 to S7 and 3 lookup tables, namely L1 to L3, and load it to 9 tables, namely T1 to T9,

69
stored in the data warehouse. The 7 scenarios comprise a total number of 59 activities. All ETL scenarios were source coded as PL\SQL stored procedures in the data warehouse.
First, we extracted embedded SQL code (e.g., cursor definitions, DML statements, SQL queries) from activity stored procedures. Table definitions (i.e., DDL statements) were extracted from the source and data warehouse dictionaries. Each activity was represented in our graph model as a view defined over the previous activities, and table definitions were represented as relation graphs. In Figure 3.9, we depict the graph representation of the first ETL scenario as modeled by our framework. For simplicity reasons, only top level nodes are shown. Activities are depicted as triangles; source, lookup and target relations as dark colored circles.
Figure 3.9: First ETL scenario graph representation
We, then, monitored the schema changes occurred at the source tables due to changes of requirements over a period of 6 months. The set of evolution events occurred in the source schema included renaming of relations and attributes, deletion of attributes, modification of their domain, and lastly addition of primary key constraints. We counted a total number of 374 evolution events and the distribution of occurrence per kind of event is shown in Figure 3.10.

70
Attribute Add;
92
Attribute Drop;
32
Attribute
Modify; 6
Attribute
Rename; 236
Constraint Add;
1
Relation
Rename; 7
Figure 3.10: Distribution of occurrence per kind of evolution events
In Table 3.2, we provide the basic properties of each examined ETL scenario and specifically its size in terms of number of activities and number of nodes comprising its respective graph, its evolved source tables and lookup tables and lastly the number of occurred events on these tables.
Scenario # Activ. # Nodes Sources # Events 1 16 1428 S1, S4 ,L1, L2, L3 142 2 6 830 S2, L1 143 3 6 513 S3, L1 83 4 16 939 S4, L1 115 5 5 242 S5 3 6 5 187 S6 1 7 5 173 S7 6
Table 3.2: Characteristics of the ETL scenarios
The intent of the experiments is to present the impact of these changes to the ETL flows and specifically to evaluate our proposed framework with respect to its effectiveness and efficiency.
3.6.1 Effectiveness of Workflow Adaptation to Evolution Changes
For evaluating the extent to which affected activities are effectively adapted to source events, we imposed policies on them for each separate occurred event. Our first goal was to examine whether our algorithm adjusts activities in accordance to the expected transformations, i.e., transformations that the administrators/developers would have manually enforced on the ETL activities to handle schema changes at the sources, by inspecting and rewriting every activity source code.
Hypothesis H1: Algorithm effectively determines the correct status of activities for various kinds of evolution events.

71
Methodology:
1. We first examined each event and its impact on the graph, by finding all affected activities.
2. Since all evolution events and their impact on activities were a-priori known, each activity was annotated with an appropriate policy for each event. An appropriate policy for an event is the policy (either propagate or block), which adjusts the activity according to the desired manual transformation, when this event occurs on the activity source.
3. In that manner, each event at the source schema of the ETL workflows was separately processed, by imposing a different policy set on the activities. We employed both propagate and block policies for all views and queries subgraphs comprising ETL activities. Policies were defined both at query and attribute level, i.e., query, view and attribute nodes were annotated.
4. We invoked each event and examined the extent to which the automated readjustment of the affected activities adheres to the desired transformation. We, finally, evaluated the effectiveness of our framework by measuring the number of affected activities by each event, i.e., these that obtained a STATUS, with respect to the number of successfully readjusted activities, i.e., these whose STATUS was consistent with the desired transformation.
Activities Event Type with Status with Correct Status Attribute Add 1094 1090 Attribute Delete 426 426 Attribute Modify 59 59 Attribute Rename 1255 1255 Constraint Add 13 5 Table Rename 8 8 Total 2855 2843
Table 3.3: Affected and adjusted activities per event kind
In Table 3.3, we summarize out results for different kinds of events. We, first, note that most of the activities were affected by attribute additions and renaming, since these kinds of events were the most common in our scenarios. Most important, we can conclude that our framework can effectively adapt activities to the examined kinds of events. Exceptions regarding attribute and constraint additions are due to the fact that specific events induced ad hoc changes in the functionality of the affected activities, which prompts the user to decide upon the proper readjustments. These exceptions are mainly owed to events occurred on the lookup tables of the scenarios. Additions of attributes at these tables incurred (especially
72
when these attributes were involved in primary key constraints) rewriting of the WHERE clause of queries contained in the affected activities.
Finally, whereas the above concern the precision of the method (i.e., the percentage of correct status determination for affected activities), we should also report on the recall of our method: The number of activities that were not affected by the event propagation, although they should have been affected, is zero.
3.6.2 Effectiveness of Workflow Annotation
Our second goal was to examine the extent to which different annotations of the graph with policies affect the effectiveness of our framework. This addresses the real case when the administrator/developer does not know the number and the kind of potential events that occur on the sources and consequently cannot decide a priori upon a specific policy set for the graph.
Hypothesis H2: Different annotations affect the effectiveness of the algorithm.
Methodology:
1. We first imposed a policy set on the graph.
2. We then invoked each event in sequence, retaining the same policy set on the graph.
3. We again examined the extent to which the automated readjustment of the affected activities (i.e., their obtained status) adheres to the desired transformation and evaluated the effectiveness of our framework for several annotation plans.
We experimented with 3 different policy sets.
• Mixture annotation : A mixture annotation plan for a given set of events comprises the set of policies imposed on the graph that maximizes the number of successfully adjusted activities. For finding the appropriate policy for each activity of the ETL scenarios, we examined its most common reaction to each different kind of event. For instance, the appropriate policy of an activity for attribute addition will be propagate if this activity propagates the 70% of the new attributes added at its source and blocks the rest 30%. In mixture annotation, propagate policies were applied on most activities for all kinds of events whereas block policies were applied on some activities regarding only attribute addition events.
• Worst-Case annotation: As opposed to the mixture annotation plan, the worst case scenario comprises the set of policies imposed on the graph that minimizes the number of successfully adjusted activities. The less common reaction to an event type was used for determining the prevailing policy of each activity.

73
1094
426
59
1255
13 8
1036
426
59
1255
5 8
Attribute Add Attribute
Drop
Attribute
Modify
Attribute
Rename
Constraint
Add
Table
Rename
MixtureAFFECTED CORRECT STATUS
Figure 3.11: Mixture Annotation
169
58
7
263
8 84 0 0 0 0 0
Attribute Add Attribute
Drop
Attribute
Modify
Attribute
Rename
Constraint
Add
Table
Rename
Worst-CaseAFFECTED CORRECT STATUS
Figure 3.12: Worst Case Annotation
• Optimistic annotation: Lastly, an optimistic annotation plan implies that all activities are annotated with a propagate policy for all potential events occurred at their sources.
Again, we measured the number of affected activities that obtained a specific status with respect to the number of correctly adapted activities. In Figure 3.11, Figure 3.12, Figure 3.13 we present the results for the different kinds of events and annotations.

74
1448
426
59
1255
13 8
486426
59
1255
5 8
Attribute Add Attribute
Drop
Attribute
Modify
Attribute
Rename
Constraint
Add
Table
Rename
Optimistic AFFECTED CORRECT STATUS
Figure 3.13: Optimistic Annotation
As stated in the hypothesis, different annotations on the graph have a different impact on the overall effectiveness of our framework, as they vary both the number of the affected activities (i.e., candidates for readjustment) and the number of the adjusted activities (i.e., successfully readjusted) on the graph. The mixture annotation manages most effectively to detect these activities that should be affected by an event and adjust them properly. In mixture annotation, the policies, imposed on the graph, manage to propagate event messages towards activities that should be readjusted, whereas block messages from activities that should retain their old functionality. On the contrary, the worst case annotation, fails to detect all affected activities on the graph as well as to adjust them properly, as it blocks event messages from the early activities of each ETL workflow. Since events are blocked in the beginning of the workflow, further activities cannot be notified for handling these events. Lastly, optimistic annotation provides both good and bad results. On the good side of things, the optimistic annotation is close to the mixture annotation in several categories. On the other hand, the optimistic annotation propagates event messages even towards activities, which should retain their old semantics. In that manner, optimistic annotations increases the number of affected activities (i.e., actually all the activities of the workflow are affected) without however handling properly their status determination.
Overall, a reasonable tactic for the administrator would be to either choose a mixture method, in case there is some a-priori knowledge on the desired behavior of constructs in an environment, or, progressively refine an originally assigned optimistic annotation whenever nodes that should remain immune to changes are unnecessarily affected.

75
3.6.3 Efficiently Adapting ETL Workflows to Evolution Cha nges
For measuring the efficiency of our framework, we examined the cost of manual adaptation of the ETL activities by the administrator / developer with respect to the cost of setting the evolution metadata on the graph (i.e., annotation with policies) and transforming properly the graph with use of our framework.
Developers’ effort comprises the detection, inspection and where necessary the rewriting of affected activities by an event. For instance, given an attribute addition in a source relation of an ETL workflow, the developer must detect all activities affected by the addition, decide how and whether this addition must be propagated or not to each SQL statement of the activity and lastly rewrite, if necessary, properly the source code. The effort required for the above operations depends highly on the developers’ experience but as well on the ETL workflow characteristics (e.g., the complexity of the activity source code, the workflow size, etc.). Therefore, the cost in terms of human effort for manual handling of source evolution, MC, can be quantified as the sum of (a) the number of SQL statements per activity, which are affected by an event and must be manually detected, AS, plus (b) the number of SQL statements, which must be manually rewritten for adapting to the event, RS. Thus human effort for manual adaptation of an activity, a, to an event, e, can be expressed as:
)( ea
ea
ea RSASMC += (1)
For a given set of evolution events E, and a set of manually adapted activities A in an ETL workflow, the overall cost, OMC, is expressed as:
∑∑∈ ∈
=Ee Aa
eaMCOMC (2)
For calculating OMC, we recorded affected and rewritten statements for all activities and events.
If the proposed framework had been used, instead of manually adapting all the activities, the human effort can be quantified as the sum of two factors: (a) the number of annotations (i.e., policy per event) imposed on the graph, AG, and (b) the cost of manually discovering and adjusting activities AR that escape the automatic status annotation of the tool, e.g., no annotations have been set on these activities or a prompt policy is assumed for these activities. The latter cost is expressed as:
∑∑∈ ∈
=Ee Aa
ea
R
MCRMC (3)
Therefore, overall cost for automated adaptation, OAC, is expressed as:
RMCAGOAC += (4)
Hypothesis H3: The cost of the semi-automatic adaptation, OAC, is equal or less than the cost of manually handling evolution, OMC.

76
For calculating OAC, we followed the mixture plan for annotating each attribute and query node potentially affected by an event occurred at the source schema and measured the number of explicit annotations, AG. We then applied our algorithm and measured the cost of manual adaptation for activities which were not properly adjusted. Figure 3.14 compares the OMC with OAC for 7 evolving ETL scenarios.
Figure 3.14: Manual (OMC) and Semi-automatic (OAC) Adaptation Cost per ETL Scenario
Figure 3.15: Cost of Adaptation with and without use of Default Policies
Figure 3.14 shows that the cost of manual adaptation is much higher than the cost of semi automating the evolution process. The divergence becomes higher especially for large

77
scenarios such as scenario 1 and 4 or scenarios with many events such as scenario 2, in which the administrator must manually detect a large number of affected activities or handle a large number of events.
Furthermore, to decrease the annotation cost, AG, we applied system wide default policies on the graph. With use of default policies, the annotation cost, AG, decreases to the number of explicit annotations of nodes that violates the default behavior. We, again, measured the number of explicit annotations as well as the remaining RMC. As shown in Figure 3.15, the cost of adaptation with use of our framework is further decreased, when default policies are used. With use of default policies, the overall adaptation cost is dependent neither to the scenario size (e.g., number of nodes) nor to the number of evolution events, but rather to the number of policies, deviating from the default behavior, that are imposed on the graph. Scenarios 1 and 4 comprised more cases for which the administrator should override the default system policies and thus, the overall cost is relatively high. On the contrary, in scenarios 2 and 3 the adaptation is achieved better by a default policy annotation, since the majority of the affected activities react in a uniform way (i.e., default) to evolution events.
3.7 Summary
In this chapter, the framework for the regulation of impact of database schema evolution towards affected constructs has been presented. The evolution graph of a database centric environment has been enriched with evolution semantics, namely evolution events that occur on the graph nodes and policies that regulate the propagation of these events on the graph. The strong flavor of inter-module dependency in the back stage of a database-centric environment makes the problem of schema evolution very important under these settings. We have provided a formal method for performing impact prediction for the adaptation of affected constructs, mainly queries and views to evolution events occurring at their sources. Policies are defined on the graph, which induce the readjustment of the graph in the presence of potential changes by assigning an appropriate status on affected parts of the graph. We have presented the core mechanism of the proposed framework which is the Propagate Changes algorithm. We have also provided two ways for the determination of prevailing policies on the graph, namely the a-priory and on-demand resolution. Lastly, we have included a detailed experimental evaluation of the framework over a real-case scenario of schema evolution.


79
4. LANGUAGE EXTENSIONS FOR REGULATING DATABASE SCHEMA
EVOLUTION
Syntactic as well as semantic adaptation of queries and views to changes occurring in the database schema is a time consuming task, treated in most situations manually by the administrators or the application developers. The detection of the affected parts as well as their adaptation to the change, are burdensome operations performed, most of the times, after the occurrence of each schema alteration. Therefore, in the previous chapter, we presented a framework for the a-priori handling of database schema evolution and the regulation of the impact that evolution operations have on the rest of the system. We associate parts potentially affected by evolution changes with policies that determine their reaction to such changes before their occurrence.
An important issue regarding our framework seems to be the cost of enriching with evolution semantics all database constructs as well as all queries, views, stored procedures, and in general the plethora of parts comprising a database centric system. Even a small database system may comprise some tens of database objects and even hundreds of dependent objects accessing the database schema. If transformed to the graph modeling technique, it will result in a large number of nodes, on which the administrator must manually impose a set of policies. Thus, setting evolution metadata on the various modules comprising the system with an efficient way is a crucial technical issue that we resolve in this thesis. We consider that the assignment of evolution metadata raises the following interesting challenges, regarding:
• Definition of policies: The enrichment of the database objects with policies must be a task requiring minimal effort from the user and therefore must be performed together with the creation or alteration of each object. For instance, the designer of the database schema must be able to define policies on relations during the creation or

80
alteration of each relation and to modify these semantics. The definition of policies is performed on queries and views similarly to relations. Therefore, the language proposed must extend the capabilities of data and query definition of SQL.
• Scope of events: The policies defined on a module must capture all possible events that may affect this module in various scope levels. The user must be able to define policies for the occurrence of an event on a specific part of the module, e.g. the deletion of a specific attribute, or for the occurrence of an event to any part of the module, e.g., the deletion of any attribute in the module. Therefore, the language proposed must enable the definition of policies targeting on specialized or module-wide events.
• Default policies: The extension proposed must enable the definition of default, system-wide policies for several kinds of events and parts of the system. For instance, the user must be able to define a default policy for additions of attributes to which any affected module must conform. Additionally, the language must enable the overriding of default behaviors through explicit annotation of specific modules.
Dealing with the above issues, in this chapter, we propose a set of SQL extensions that enables the implementation of the proposed framework for the management of evolution. For extending a system catalog with extra information regarding evolution metadata, we provide extensions to SQL regarding both top level construct definitions, such as tables, views, and queries, as well as fine grain constructs such as attributes, conditions of views/queries, and database constraints. Moreover, we provide a principled way for defining the proposed evolution semantics and in the same time minimizing the user effort. We, first, address the requirement for the definition of default policies on the whole system. The extensions permits the definition of default policies for various kinds of database constructs, such as relations, queries, attributes, etc. Furthermore, the extensions allow overriding default policies and explicitly annotating specific modules by extending the current SQL syntax for the definition of relations, views and queries. Lastly, the proposed extensions allow the definition of policies for handling either specialized or module-wide events, by annotating low level parts of a module, such as condition and attributes or top-level parts, such as queries, relations and views.
Chapter Outline. In section 4.1, approaches related to language extensions for schema evolution are presented. In section 4.2, we present the extension regarding definition of default policies on the system, and in sections 4.3, 4.4 the annotation of top level nodes and fine grain constructs, respectively. In section 4.5, we evaluate the feasibility of the proposed technique, by applying the extension on a real database centric environment. Lastly, in section 4.6 we conclude our proposal.

81
4.1 Extensions of SQL for Schema Evolution
Current RDBMS support all SQL extensions for performing evolution operations on the database schema, such as the CREATE, DROP and ALTER statements. However, they do not incorporate evolution semantics to the database schema nor to the definition of queries and views, so that administrators / developers could prescribe the behavior of the system when database schema evolution changes occur. On the contrary, to deal with the problems occurred by the evolution in databases, several practical techniques are usually used for this reason, like the use of variable names as placeholders for the real names of constructs like attributes and tables. For example, Oracle’s PL/SQL [UrHM04] uses the %TYPE and %ROWTYPE constructs to define variables as they are defined within the database. If the data type or precision of a column changes, the program automatically picks up the new definition from the database without having to make any code changes. Hence, the appropriate enrichment of the procedural code with such constructs provides data independence, reduces maintenance costs, and allows programs to adapt as the database changes to meet novel business requirements. Another technique is the CASCADE capabilities that RDBMS offer for deletion of dependencies between objects, such as foreign keys. During the definition of a foreign key constraint, the user determines the behavior (e.g., delete column, set null to all tuples) of the dependent column when the referenced primary key is deleted. However, such techniques partially confront the problem, as they are dealing with the simplest cases of evolution.
Most of the language extensions included in the related literature address specific perspectives and techniques for handling schema evolution. SQL/SE is a query language extension for databases supporting schema evolution [Rodd92a]. SQL/SE provides extensions for querying evolvable database schemas in the context of schema versioning and temporal databases. The author enriches the syntax of SQL queries with semantics for querying different versions of schemas and handling attributes that are not defined over different versions. Our proposed set of extensions does not require the existence of schema versioning or the integration of time within database schema evolution. We, actually, provide rules for the transformation and adaptation of queries and views to the last valid database schema without the assumption that the transformed queries retain the same semantics.
Another extension to SQL, namely SchemaSQL supports multi database querying [LaSS01]. SchemaSQL addresses the problem of interoperability between different database schemas and their respective instances, enabling the user to express queries over different schemas. SchemaSQL softens the distinction between schema and data by allowing to query schema (such as lists of attribute or relation names) in SQL-queries and also to use sets of values obtained from data tuples as schema in the output relation. This leads to a versatile query language which allows for transforming semantically equivalent but syntactically different schemas into each other.

82
Lastly, [NiLR98] introduces in the context of Evolvable View Environment framework an extension of SQL, named E-SQL. E-SQL is an extension of SQL augmented with specifications for how the view definition may be synchronized under database schema changes. Evolution preferences expressed as evolution parameters allow the user to specify criteria based on which the view will be transparently evolved by the system under schema changes at the underlying database. Specifically, the syntax of a view definition is enriched with parameters that dictate whether attributes and relations included in the view’s clauses can be dispensed or replaced in the case of their deletions from the underlying database schema. Also, it includes a parameter for determining whether the extent of the evolved view is a subset, a superset or an equal set of the extent of the original view. The general syntax of the proposed language extensions is given below:
CREATE VIEW V(V 1,..., V M) (ViewExtent = δV) AS SELECT R.A 1 (Disp.= true|false, Repl. = true|false), ...,
S.B N (Disp. = true|false, Repl. = true|false) FROM R(Disp.= true|false, Repl. = true|false),
S(Disp.= true|false, Repl. = true|false) WHERE C1(Disp.= true|false, Repl. = true|false)
AND ... C K(Disp.= true|false, Repl. = true|false)
The extension proposed in E-SQL can be considered similar to the extension proposed in this thesis from the perspective that evolution parameters resemble the concepts of policies used in our framework. Still, it is constrained only to handling deletions of attributes and relations, offering alternatives for removing the invalid references from the definition of the view or replacing them through a valid rewriting. Our proposed extension offers a wider range of evolution events and policies that the user can define on existing SQL. It also allows the definition of default policies for annotating with minimal effort large-scale systems.
4.2 Database-wide Default Values
In the following sections, we define the syntax for the proposed extensions of SQL. All extensions outlined are given in BNF and throughout these sections we refer to the system configuration employed as motivating example in section 3.2.
Regarding the definition of the default policies, we consider each assertion as a triplet (event, type of node, policy). Syntactically, this is expressed as follows:
ON <event> <type of node> THEN <policy>
An event refers to evolution events in the database schema comprising an event type, such as Delete, Add, Modify, Rename and a node type, which takes any of the following values in the partial order presented:
83
• NODE
• RELATION, QUERY, VIEW
• ATTRIBUTE, CONDITION, PK, FK, NNC, UC
Note that we annotate nodes with default values only for changes applied to themselves and not to any of their ancestors or descendants. For example, we can have the following annotations:
ON DELETE NODE THEN PROPAGATE ON DELETE ATTRIBUTE THEN PROMPT
The definitions of the default policies are expressed in SQL as follows.
• SQL Syntax
db-spec::= CREATE DATABASE <db-name> [policy-list] policy-list::= policy-clause [,policy-clause]
policy-clause::= ON event THEN policy event::= action-type construct-type
event-type::= Add | Delete | Modify | Rename construct-type::= NODE | RELATION | QUERY | VIEW | ATTRIBUTE |
CONDITION | PK | FK | NNC | UC policy::= propagate | block | prompt
• Example
CREATE DATABASE company ON DELETE ATTRIBUTE THEN PROMPT
4.3 Top Level Constructs
We extend SQL syntax to include evolution-based semantics both in DDL statements as well as in SQL queries. The general syntax is:
ON <event> TO <node> THEN <policy>
where event again refers to evolution events in the database schema, node refers to the specific database part suffering the event and policy can take the values {propagate, block, prompt}.

84
4.3.1 Relations
Definition of policies on relations regarding their behaviour on evolution changes is primarily enforced upon creation, and thus, we extend CREATE TABLE syntax with certain policy clauses. Policies imposed in a relation-wide scope can be applied both to the relation itself as well as to all schema attributes and constraints. In that way, the administrator has the ability to annotate with a single clause the entire relation schema instead of annotating each constituent attribute or constraint separately.
• SQL Syntax
table-spec::= CREATE TABLE <table-name> (table-element-list [, policy-list])
policy-list::= policy-clause [,policy-clause] policy-clause::= ON event TO node THEN policy
event::= Add Attribute | Delete Attribute | Modify Attribute | Rename Attribute | Delete Relation| Rename Relation | Add Condition | DeleteCondition | Modify Condition
node::= <table-name> policy::= propagate | block | prompt
• Example
CREATE TABLE WORKS( E_ID INTEGER, P_ID INTEGER, W_RESP VARCHAR(10), W_DUR INTEGER, PRIMARY KEY (E_ID,P_ID), FOREIGN KEY (E_ID) REFERENCES EMP(E_ID), FOREIGN KEY (P_ID) REFERENCES PRJS(P_ID), ON Add Attribute TO WORKS THEN propagate);
The above syntax corresponds to the annotation of the respective relation node (i.e., WORKS) with the policy that allows the addition of attributes and propagates this addition to
all queries and views accessing this relation. Similarly, policy clauses can extend ALTER
TABLE statements, enabling the administrator to define policies on existing relations.
4.3.2 Views
Views are inherent constructs of the database schema that constitute queries over the database schema –with respect to views’ definition– and relations to other queries –w.r.t. views’ functionality. Therefore, views invoke evolution events when (a) their definition is altered, affecting all queries defined over them and (b) the relations over which they are
85
defined are affected by schema changes. We enrich existing SQL syntax for views creation to capture potential events on their definitions as follows.
• SQL Syntax
view-spec::= CREATE VIEW <view-name> AS query-expression [policy-list]
policy-list::= policy-clause [,policy-clause] policy-clause::= ON event TO node THEN policy
event::= Add Attribute | Delete Attribute | Modify Attribute | Rename Attribute | Delete Relation| Rename Relation | Add Condition | DeleteCondition | Modify Condition
node::= <view-name> | <table-name> policy::= propagate | block | prompt
The policies capture events occurring at the source tables of views’ definition (i.e., the construct is a table-name) or events occurring at the view definition itself (i.e., the construct is a view-name).
• Example
CREATE VIEW EMPS_PRJS AS SELECT E.E_ID, E.E_NAME, E.E_SAL
P.P_ID, P.P_NAME, P_BUDGET FROM EMP E, PRJS P, WORKS W
WHERE W.E_ID = E.E_ID AND W.P_ID = P.P_ID
ON Modify Condition TO EMPS_PRJS THEN block;
Such syntax corresponds to the annotation of the view node EMPS_PRJS with a policy, which blocks changes in the WHERE clause of the view definition.
4.3.3 Queries
Queries are considered as top-level constructs in our framework and they are the primary consumers of evolution changes occurring at the database level. Policies’ clauses enrich query syntax with evolution semantics regarding the reaction of the query to such changes and have a query-wide scope. They prescribe both the behavior of the query itself and the query constituents, i.e., query attributes and query conditions. In such way, the developer may define a query-wide reaction to an evolution change instead of assigning explicit policies to each query attribute and condition.
• SQL Syntax

86
query- expression::= SELECT [ALL|DISTINCT] scalar-expression-list FROM table-expression [WHERE search-condition] [GROUP BY grouping-column-list] [HAVING group-condition] [ORDER BY sort-specification-list] [policy-list]
policy-list::= policy-clause [,policy-clause] policy-clause::= ON event TO node THEN policy
event::= Add Attribute | Delete Attribute | Modify Attribute | Rename Attribute | Delete View | Rename View | Delete Relation | Rename Relation | Add Condition | Delete Condition | Modify Condition
node::= <view-name> | <table-name> policy::= propagate | block | prompt
• Example
Q: SELECT P_ID, P_NAME, P_BUDGET, SUM(E_SAL) AS P_EXPENSES
FROM Emps_Prjs GROUP BY P_ID, P_NAME, P_BUDGET
ON Add Attribute TO emps-prjs THEN block;
The above syntax corresponds to the annotation of the query node Q with a policy, which blocks the inclusion of added attributes in the underlying view Emps_Prjs in the select clause of the query syntax.
4.4 Fine Grain Constructs
Policy annotation can be further specialized to fine grain constructs such as attributes, database constraints and conditions of views/queries. Such annotations enable the administrator to define specific policies on these constructs, which override policies defined on their top-level containers.
4.4.1 Attributes
Policies are defined for relation attributes in table definition and for view or query attributes in view or query definitions, respectively. Policies’ clauses refer to attribute constructs, which may be affected by an evolution change, prescribing in that way the specific behavior of that attribute.
• SQL Syntax
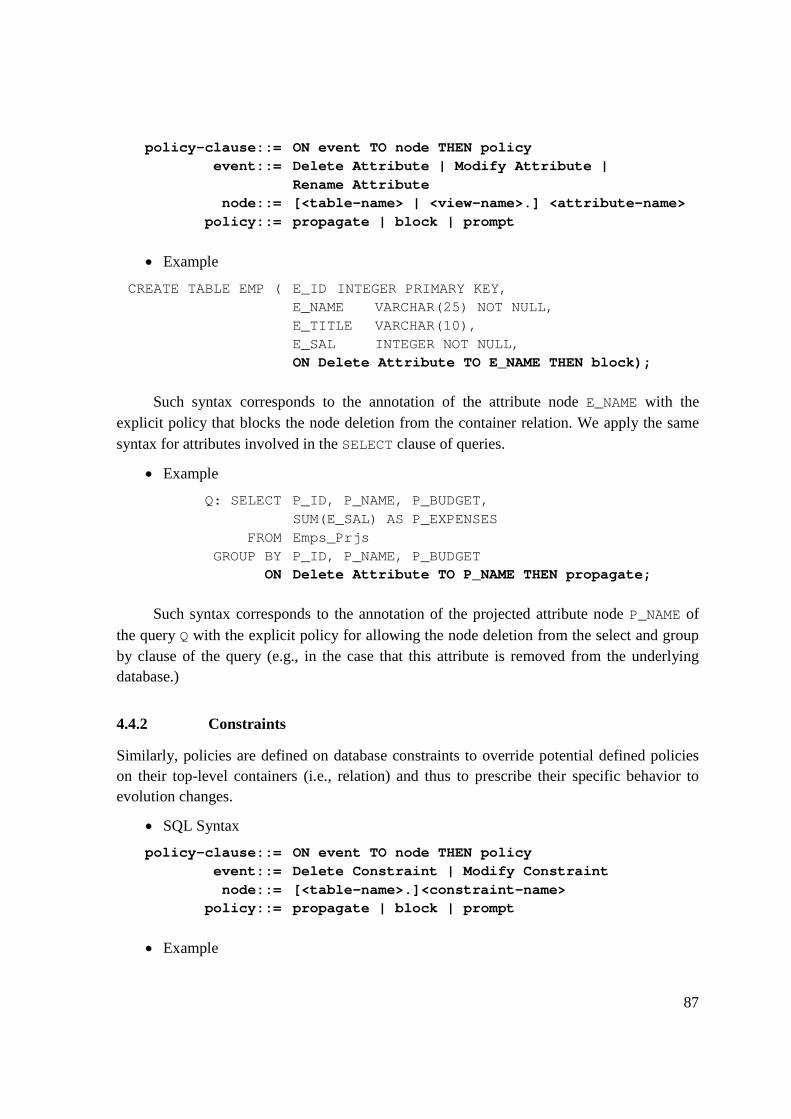
87
policy-clause::= ON event TO node THEN policy event::= Delete Attribute | Modify Attribute |
Rename Attribute node::= [<table-name> | <view-name>.] <attribute-name>
policy::= propagate | block | prompt
• Example
CREATE TABLE EMP ( E_ID INTEGER PRIMARY KEY, E_NAME VARCHAR(25) NOT NULL, E_TITLE VARCHAR(10), E_SAL INTEGER NOT NULL, ON Delete Attribute TO E_NAME THEN block);
Such syntax corresponds to the annotation of the attribute node E_NAME with the explicit policy that blocks the node deletion from the container relation. We apply the same syntax for attributes involved in the SELECT clause of queries.
• Example
Q: SELECT P_ID, P_NAME, P_BUDGET, SUM(E_SAL) AS P_EXPENSES
FROM Emps_Prjs GROUP BY P_ID, P_NAME, P_BUDGET
ON Delete Attribute TO P_NAME THEN propagate;
Such syntax corresponds to the annotation of the projected attribute node P_NAME of the query Q with the explicit policy for allowing the node deletion from the select and group by clause of the query (e.g., in the case that this attribute is removed from the underlying database.)
4.4.2 Constraints
Similarly, policies are defined on database constraints to override potential defined policies on their top-level containers (i.e., relation) and thus to prescribe their specific behavior to evolution changes.
• SQL Syntax
policy-clause::= ON event TO node THEN policy event::= Delete Constraint | Modify Constraint node::= [<table-name>.]<constraint-name>
policy::= propagate | block | prompt
• Example

88
CREATE TABLE EMP ( E_ID INTEGER PRIMARY KEY, E_NAME VARCHAR(25) NOT NULL, E_TITLE VARCHAR(10), E_SAL INTEGER NOT NULL, ON Modify Constraint TO EMP.PK THEN propagate);
The above syntax corresponds to the annotation of the constraint node Emp.PK with the explicit policy for allowing the modification of itself (e.g., the addition of a second attribute to the primary key constraint) and propagating this change to all dependent constructs.
4.4.3 Conditions
Policies are defined on condition clauses of queries and views for prescribing their behavior to evolution events too. The modification or deletion of a view or a query condition semantically impacts dependents parts of the system. Thus, policies imposed on conditions override query- or view-wide policies and handle semantic changes invoked by such events.
• SQL Syntax
policy-clause::= ON event TO node THEN policy event::= Delete Condition | Modify Condition node::= [<view-name>.]<condition-name>
policy::= propagate | block | prompt
Moreover, we provide a facility for the management of conditions as first class citizens. We employ a specific name for each condition as follows.
CREATE CONDITION <condition> AS <expression>
For instance, we might have the following statements, expressing (a) a simple condition employed in a query, (b) a foreign key constraint, and (c) a join condition, respectively.
CREATE CONDITION Emp_Age_Cond AS AGE>50 CREATE CONDITION Works_Emp_FK AS WORKS.EMP# IN EMP. EMP# CREATE CONDITION Works_Emp_J AS WORKS.EMP#=EMP.EMP#
Traditional statements for the definition of foreign keys or assertions for attribute domains are easily refined to the above “normal form”, without necessarily obliging the database designer or administrator to abide by the above syntax.
Conditions may be employed in the WHERE clause. For example, a query SELECT *
FROM EMP WHERE AGE_COND would simply use the condition as a macro. Parametric conditions, to allow referring to aliases in SQL queries are straightforward. One can also deal with the problem of existing code in a straightforward manner, since automatic condition names can be assigned to all the queries.
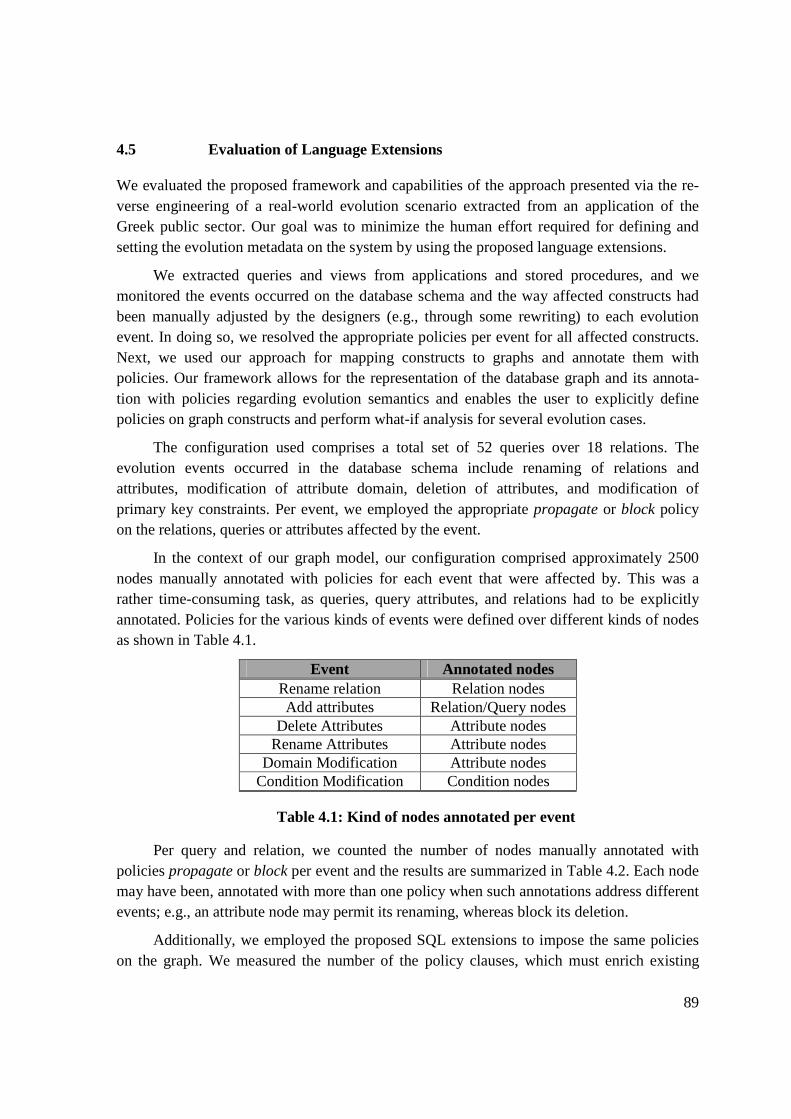
89
4.5 Evaluation of Language Extensions
We evaluated the proposed framework and capabilities of the approach presented via the re-verse engineering of a real-world evolution scenario extracted from an application of the Greek public sector. Our goal was to minimize the human effort required for defining and setting the evolution metadata on the system by using the proposed language extensions.
We extracted queries and views from applications and stored procedures, and we monitored the events occurred on the database schema and the way affected constructs had been manually adjusted by the designers (e.g., through some rewriting) to each evolution event. In doing so, we resolved the appropriate policies per event for all affected constructs. Next, we used our approach for mapping constructs to graphs and annotate them with policies. Our framework allows for the representation of the database graph and its annota-tion with policies regarding evolution semantics and enables the user to explicitly define policies on graph constructs and perform what-if analysis for several evolution cases.
The configuration used comprises a total set of 52 queries over 18 relations. The evolution events occurred in the database schema include renaming of relations and attributes, modification of attribute domain, deletion of attributes, and modification of primary key constraints. Per event, we employed the appropriate propagate or block policy on the relations, queries or attributes affected by the event.
In the context of our graph model, our configuration comprised approximately 2500 nodes manually annotated with policies for each event that were affected by. This was a rather time-consuming task, as queries, query attributes, and relations had to be explicitly annotated. Policies for the various kinds of events were defined over different kinds of nodes as shown in Table 4.1.
Event Annotated nodes Rename relation Relation nodes Add attributes Relation/Query nodes
Delete Attributes Attribute nodes Rename Attributes Attribute nodes
Domain Modification Attribute nodes Condition Modification Condition nodes
Table 4.1: Kind of nodes annotated per event
Per query and relation, we counted the number of nodes manually annotated with policies propagate or block per event and the results are summarized in Table 4.2. Each node may have been, annotated with more than one policy when such annotations address different events; e.g., an attribute node may permit its renaming, whereas block its deletion.
Additionally, we employed the proposed SQL extensions to impose the same policies on the graph. We measured the number of the policy clauses, which must enrich existing

90
SQL and DDL commands in order to annotate the same policies on the graph as opposed to the number of manual annotations on nodes. Hence, we evaluated 3 different cases: a) use of a default propagate policy for a specific query and for the events Delete, Rename and Modify Domains of attributes (query scope) instead of manually annotating each query attribute, b) use of default policies for all relations (relation scope) for propagating the aforementioned events, instead of annotating each query and c) use of default propagate policy for database (database scope) to allow the renaming of relations and the addition of attributes instead of annotating each relation. The results are shown in Table 4.3.
With the usage of the proposed SQL extensions, the human effort for explicitly annotating these nodes is minimized. Specifically, in the case study previously described, the whole process of manually identifying and adapting the changes lasted for 6 man-months, whereas by using our approach and appropriately annotating the database constructs and applying the respective policies, the same process lasted for less than half a man-month.
Event # of nodes Propagate Block
Rename relations 18 0 Add attributes 64 13 Delete Attributes 1608 92 Rename Attributes 1615 85 Domain Modification 1690 10 Condition Modification 0 21 Total Annotations 4995 221
Table 4.2: Distribution of annotated nodes per kind of policies and events
Scope # of operations Annotations Policy Clauses
Query scope 486 9 Relation Scope 5180 293 Database Scope 36 2
Table 4.3: Operations with and without SQL extensions
4.6 Summary – Discussion
In this chapter, we have presented a language extension to SQL for the annotation of database objects with evolution semantics. The introduced extensions alleviate from the designer the cost of manually imposing policies on the graph as well as to include evolution semantics in the definition of a database object or query. Specifically, the proposed extensions enriched the SQL definition of database objects and queries with evolution semantics, i.e., policies, which dictate their reaction to evolution events. The extensions

91
involved the definition of default policies for the entire database environment, policies regarding top level nodes, such as relations, view and queries and lastly policies for fine grain constructs, such as attributes, constraints and conditions. Lastly, in this chapter we have evaluated the feasibility of the proposed technique, by applying the extension on a real database centric environment.


93
5. A METRIC SUITE FOR EVALUATING THE EVOLUTION OF
DATABASE SYSTEMS
How good is the design of a database centric environment as far as its evolution is concerned? What makes a design good or bad and which configuration minimizes the effort required for handling changes in an evolvable database environment? Typically, such questions are answered by a set of rules, many of them empirically validated, such as ‘does the configuration follow a typical design pattern, such as the use of views as layers for handling evolution?’, or “is the database schema normalized” and so on. All recipes are based on practical observations of the past, as well as rules of thumb that have been established by expert practitioners and although valuable, they simply transfer the lessons learned the hard way in the “craft” of database design.
At the same time, the scientific community is not in possession of a fundamentally established theory for the evaluation of the design quality of database centric environments. So far, the researchers have dealt with metrics that evaluate the design quality of the database schema with respect to high level goals, such as completeness, understandability, etc. both at the conceptual and the logical level. Although structural properties of the database (e.g., number of relations or foreign keys) are considered, the employed approaches restrict themselves to constructs internal to the database without taking into account the incorporation of constructs surrounding the database into their models, nor the fact that a dependent software construct, and especially an information system, evolves over time. Since software maintenance makes up for at least 50% of all resources spent in a project, maintainability is an important factor for the determination of the quality of a design of a database environment as a whole. The problem is quite hard, since changes in the schema of a database-centric system affect both its internals but also, the surrounding deployed
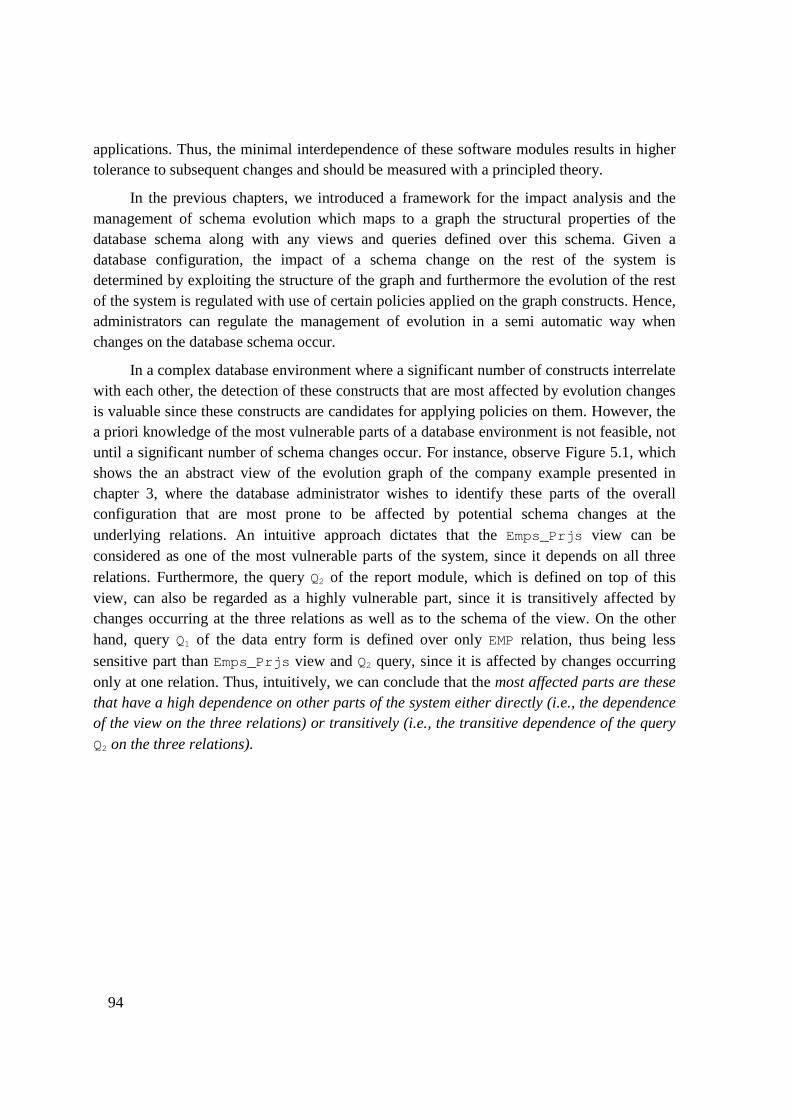
94
applications. Thus, the minimal interdependence of these software modules results in higher tolerance to subsequent changes and should be measured with a principled theory.
In the previous chapters, we introduced a framework for the impact analysis and the management of schema evolution which maps to a graph the structural properties of the database schema along with any views and queries defined over this schema. Given a database configuration, the impact of a schema change on the rest of the system is determined by exploiting the structure of the graph and furthermore the evolution of the rest of the system is regulated with use of certain policies applied on the graph constructs. Hence, administrators can regulate the management of evolution in a semi automatic way when changes on the database schema occur.
In a complex database environment where a significant number of constructs interrelate with each other, the detection of these constructs that are most affected by evolution changes is valuable since these constructs are candidates for applying policies on them. However, the a priori knowledge of the most vulnerable parts of a database environment is not feasible, not until a significant number of schema changes occur. For instance, observe Figure 5.1, which shows the an abstract view of the evolution graph of the company example presented in chapter 3, where the database administrator wishes to identify these parts of the overall configuration that are most prone to be affected by potential schema changes at the underlying relations. An intuitive approach dictates that the Emps_Prjs view can be considered as one of the most vulnerable parts of the system, since it depends on all three relations. Furthermore, the query Q2 of the report module, which is defined on top of this view, can also be regarded as a highly vulnerable part, since it is transitively affected by changes occurring at the three relations as well as to the schema of the view. On the other hand, query Q1 of the data entry form is defined over only EMP relation, thus being less sensitive part than Emps_Prjs view and Q2 query, since it is affected by changes occurring only at one relation. Thus, intuitively, we can conclude that the most affected parts are these that have a high dependence on other parts of the system either directly (i.e., the dependence of the view on the three relations) or transitively (i.e., the transitive dependence of the query Q2 on the three relations).

95
Figure 5.1: Abstract representation of motivating example graph
The above intuition is based on the assumption that events occur on the underlying relations with a uniform distribution and only structural properties of the examined configuration are considered. Assume now that according to system requirements the majority of evolution events involve changes occurring at the schema of EMP relation. That is, the possibility that a schema change occurs at EMP relation is much higher than the possibility that changes occur at the other relations. Should the administrator still measure the vulnerability of queries defined over EMP relation, i.e., Q1 in our example, with a similar manner? The distribution of occurrence of events on the system plays a significant role which must be taken into consideration by the administrators for the detection of the potentially most affected parts of the system and thus for the most accurate management of evolution.
Additionally, in the context of the proposed framework, the administrator can regulate the propagation of evolution on the system by imposing policies on specific parts. The “sensitivity” of constructs to evolution events is furthermore dependent on the policy semantics induced by the administrator. For instance, assume that Emps_Prjs view is annotated for not permitting changes at its schema and therefore blocking all events that occur at the underlying three relations. Should the administrator still consider that the query Q2 is vulnerable to changes occurring at the database schema? In the presence of policies, the dependency between parts of the system can be further determined by the specific policies imposed on them.
Summarizing the above concepts, we consider the following important factors as quality indicators for the establishment of a set of measurements concerning the evolution

96
capability of a database environment: (a) the structural properties of the system design both from a graph theoretic and an information theoretic perspective, (b) the distribution of occurrence of events on parts of the system and lastly, (c) the policy semantics imposed on the graph.
Furthermore, based on these quality factors, we propose in this chapter a set of metrics classified in the following categories.
• Future-agnostic graph-based metrics, building upon the properties of the nodes of the graph. Graph theoretic properties like the degrees of a node show how interrelated to other nodes a certain node is. Additionally, we employ a set of metrics that measure structural properties of the graph with use of the information theoretic notion of entropy.
• Future-aware metrics that extend the previous simple model with a hypothesis for the evolution events that will occur in the future. This hypothesis concerns a distribution of events for a certain time period. Depending on the era of the database environment, different events will occur (e.g., early phases are characterized by radical changes to the structure of the database whereas mature phases involve a higher degree of additions).
• Policy-aware metrics that take into consideration the special role of policies that are defined on the graph.
The contribution of this chapter involves the proposal and the experimental assessment of these metrics as:
• Firstly, they act as predictors for the vulnerability of a software module of a database centric environment (either internal, e.g., a relation, or external, e.g., a query) to future changes to the structure of the environment.
• Secondly, they facilitate the assessment of the quality of alternative designs of the environment with a particular viewpoint on the evolution of its schema.
Chapter Outline. In section 5.1, we present metrics and approaches for measures of quality that have been proposed in the related literature for the evaluation of database design. We then propose a set of metrics for the assessment of the vulnerability of all the design structures in a database environment (Section 5.2). We first exploit the graph and provide metrics like the degrees (in, out, and total) of a node, the transitive degrees of a node (standing for the extent to which other nodes transitively depend upon it), and the degrees of a summarized variant of a module (e.g., a view) that abstract the internal semantics of the module and focus on its coupling to the rest of the environment (Section 5.2.1). We then present an event aware set of metrics that takes into account the distribution of potential events on the graph (Section 5.2.2). To this end, we include the special role of policies annotating the graph into a policy-aware set of metrics (Section 5.2.3). We lastly provide an

97
information theoretic definition of a module’s entropy that simulates the extent to which the vulnerability of a node is surprising (Section 5.2.4). Finally, we extensively experiment with various configurations in the setup of a reference database environment (Section 5.3) and assess both the effectiveness of the proposed metrics (i.e., how well do they actually predict the impact of evolution events to a design construct) and how different design alternatives for the same schema behave with respect to evolution. We lastly conclude the concepts presented in this chapter in section 5.4.
5.1 Related Work on Database Design Metrics
Various approaches exist in the area of database metrics. Most of them attempt to define a complete set of database metrics and map them to abstract quality factors, such as maintainability, good database design, etc. We distinguish these approaches into these metrics referring to the conceptual design of the database (i.e. ER diagram) and to these referring to the logical design of the database (i.e. relational data diagram). We also present metrics proposed for evaluating the design quality of data warehouses. A last category of metrics that we examine relates to the information theoretic notion of entropy.
5.1.1 Conceptual Metrics
Conceptual metrics are useful for evaluating quality issues for a database in the early stage of the design. A “good” design at the conceptual level of a database may assure that fewer inconsistencies will emerge (i.e. incomplete requirements) and furthermore fewer changes are needed during the lifetime of the database and of the information system, in general.
Gray et al [GCMP91] propose some objective and open-ended metric to evaluate the quality of an ERD. The goal of these metrics is to provide designers of quantitative support for helping them to compare design alternatives. They suggest using this measure for determining the effort required to implement a design. They introduce the following two metrics:
ER Metric: ER Metric is a measure of the complexity of an ERD, defined as:
∑=
=n
i
CiEE
1
)( where n=number of entities, c>1 and Ei=complexity of entity i.
For each entity Ei , the complexity is defined as: Ei=D i*F i, where Di is the data architecture complexity and Fi is the functional complexity of the entity. The data architecture complexity of an entity is defines as:
Di=Ri*(a*FDA i+b*NFDAi)
where 0<a<b, Ri=number of relationships, FDAi=number of functionally dependent attributes and NDFAi=number of non-functionally dependent attributes.

98
Area Metric: Area Metric is a measure of the compliance of an ERD with the corresponding ERD in 3rd Normal Form. It is defined as:
333333
ReRe
ARAREA
EeAeEeAeM
×+×+×
×+×+×=
where Ae, Ee, Re=number of attributes, entities, relationships respectively in the ERD and A3, E3, R3 the respective numbers of the same ERD in 3rd Normal Form.
Kesh [Kesh95] develops a method for assessing the quality of an ERD, based on both ontological and behavioral components. Ontological components are distinguished into structure and content metrics. Structure metrics are Suitability (o1), Soundness(o2), Consistency(o3) and Conciseness(o4) whereas content metrics are Completeness(o5), Cohesiveness(o6) and Validity(o7). Behavioral components are considered to be Usability (from the user’s point of view) (s1), Usability (from the designer’s point of view) (s2), Maintainability(s3), Accuracy(s4) and Performance(s5).
The overall score for the data model quality of the ERD is the linear combination of the five behavioral metrics. Each behavioral metric is calculated as the average of the subset of the ontological metrics determining the behavioral metric. Each ontological metric, in turn, is assigned a value between 1 and 5 based on user’s scores or more complex formulas.
Moody [Mood98] attempts to refine quality factors into quantitative measures to reduce subjectivity and evaluation process. A set of eight quality factors is introduced, which comprise a set of candidate metrics for evaluating the quality of the data models. The author proposes a data model quality evaluation framework, which can be applied to a wide range of organizations. The proposed framework (shown in Figure 5.) comprises a set of 8 quality factors, which can be considered as properties of a data model that contribute to its quality. They can have positive and negative interactions with each other. They are, in turn, evaluated by a set of 25 quality metrics. The quality factors may contribute to the overall quality of the system according to weights, which determine the importance of each factor in a problem situation. Stakeholders are the persons involved in building or using the data model, such as the business user, the analyst, the data administrator and the application developer. Lastly, there may be different strategies and techniques for improving quality with respect to one or more quality factors.

99
Figure 5.2: [Mood98]’s Data Model Quality Evaluation Framework
The quality factors are Completeness, Integrity, Flexibility, Understandability, Correctness, Simplicity, Integration and Implementability.
Genero et al ‘s [GPCS00] focus on measuring the maintainability of ER diagrams through evaluating their structural complexity. From a system theory point of view, a system is called complex if it is composed of many and different type elements, with many and dynamically changing relationships between them. The complexity of an ER diagram could be influenced by the different elements that compose it, such as entities, relationships, attributes, generalizations, etc. Therefore, it is not advisable to define a general measure for its complexity [Fent94]. They introduce a set of open ended metrics and classify them into three main categories: Entity Metrics (i.e., number of entities within an ERD), Attribute Metrics (i.e., number of attributes within an ERD, number of composite attributes, etc.) and Relationship Metrics (i.e. number of M:N relationships, etc.).
The set of Entity Metrics comprises only one metric:
• NE: total number of entities within the ERD.
The set of Attribute Metrics comprises the following metrics:
• NA: total number of entity and relationship attributes (including derived, composite and multivalued attributes).
• DA: number of derived attributes. Derived attributes can be considered as redundancies in the ERD.
• CA: number of composite attributes
• MVA: number of multivalued attributes.
The set of Relationship Metrics comprises the following metrics:
• NR: total number of relationships within the ERD.

100
• M:NR: number of M:N relationships.
• 1:NR: number of 1:N (including 1:1) relationships.
• N-AryR: number of N-ary (not binary, e.g. 3-ary) relationships.
• BinaryR: number of binary relationships.
• NIS_AR: number of IS_A relationships.
• RefR: number of reflexive relationships.
• RR: number of redundant relationships within the ERD
Similar to [GPCS00], [PiGC02] propose a set of close-ended (proportional) metrics for ERD focusing mainly on the evaluation of the maintainability. RvsE metric (measures the relation between the relationships and entities), DA metric (proportion of derived attributes in the ERD, that is number of derived attributes divided by the number of all attributes minus one), CA metric (proportion of composite attribute), RR metric (proportion of redundant relationships), M:Nrel metric (proportion of M:N relationships), IS_Arel metric (proportion of IS_A relationships).
In [Wede00], a metric set for evaluating the stability capabilities of conceptual data model is proposed. The author sets up a framework for stability of conceptual schemas and proceeds to develop a set of metrics from it. The metrics are based on measurements of conceptual features, such as the number of conceptual constructs affected by a change, the complexity of a conceptual schema, the abstraction of a conceptual schema, etc.
Lastly, in [Ber+05], the authors present a set of quality indicators and metrics for conceptual models of data warehouses. They employ UML diagrams for modeling multidimensional databases and in this context they define metrics for capturing diagram’s properties such as, number of packages in a diagram, number of relationships between two packages, etc. Although, they provide a methodology for theoretically validating the proposed metric set, they do not present an empirical validation.
5.1.2 Relational Database Metrics
Relational database metrics may be used as measures for the quality of a database at the logical level. Relational metrics are used to measure internal characteristics and structures of a database, such as tables, foreign keys, etc. Normalization theory can give the guidelines for designing a database, but still cannot address other quality issues, such as the maintainability – or evolution - of a database.
In [CaPG01a], [CaPG01b], [PiGC01], the authors propose a set of metrics for relational databases that can be used in order to evaluate external quality factors, such as maintainability and analyzability. They suggest that these metrics can be applied to

101
measuring the product complexity of databases, which is an internal attribute, and furthermore evaluating external quality attributes. The proposed set of metrics mainly focuses on assessing the maintainability of a database, which comprises analyzability, testability, stability and changeability. They have both empirically (through experiment in various database systems) and theoretically (according to [BrMB96], [Zuse98]) validated these metrics. The introduced set includes the following metrics:
• NT: Number of relational tables in the database.
• NFK: Number of foreign keys in the database.
• NA: Total number of attributes in the database.
• DRT: Depth of Referential Tree is the maximum distance from a table towards another table through referential integrity constraints. That is, if table A has o foreign key to table B and table B in turn has a foreign key to table C, then DRT is equal to 2.
As for the relation between these metrics and the quality factors, they state that analyzability can be assessed by NT, NA and NFK metrics in a straightforward manner; the greater the values of these metrics are, the more analyzable the database schema is. DRT metric can also be used as an indicator for the analyzability of the database schema, but only in combination with NFK metric. In the same way, they conclude that changeability is proportional to the number of tables in the database, whereas stability relates to the number of tables in an inverse relationship; the fewer the tables are in the database, the more stable the schema is. Lastly, testability is related in a proportional way to NT, NA and NFK.
In [CSPL01], [GOPR01], they extend the notion of structure metrics to object oriented databases and Information Systems. Specifically in [GOPR01], they introduce a set of metrics for UML diagrams concerning object oriented information systems, whereas in [CSPL01] they propose a set of structural metrics for object relational databases.
5.1.3 Quality in Data Warehouses - Metrics
Quality in the context of data warehouses has been elaborately studied in [Vass00], [JJQV99] and [VaBQ00]. The authors propose mathematical techniques for measuring or optimizing certain aspects of DW quality and adapt the Goal-Question-Metric approach from software quality management to a meta data management environment in order to link these special techniques to a generic conceptual framework of DW quality.
Data warehouse quality can be classified into several quality dimensions according to the stakeholders that are typically interested in them. Users with different roles imply a different collection of quality dimensions, which a quality model should be able to address in a consistent and meaningful way. In [JJQV99], they summarize the quality dimensions of three stakeholders, the data warehouse administrator, the programmer, and the decision

102
maker. A set of quality dimensions corresponds to each of these roles; each of these dimensions is further mapped to sample types of measurement (metrics), which help to establish the quality of a particular DW component with respect to a particular quality dimension.
For example, regarding the data warehouse administrator, the dimensions comprising the design and administrator quality are shown in Figure 5.3 [Vass00]. Correctness dimension is concerned with the proper comprehension of the entities of the real world, the schemata of the sources (models) and the user needs. Completeness dimension is concerned with the preservation of all the crucial knowledge in the data warehouse schema (model). Minimality dimension describes the degree up to which undesired redundancy is avoided during the source integration process. Traceability dimension is concerned with the fact that all kinds of requirements of users, designers, administrators and managers should be traceable to the data warehouse schema. Interpretability dimension ensures that all components of the data warehouse are well described and thus administered easily and lastly meta data evolution dimension is concerned with the way the schema evolves during the data warehouse operation.
Figure 5.3: Design and Administrator Quality Dimensions [Vass00]
Various types of measurement - metrics are introduced to evaluate these dimensions. Table 5.1 relates these quality dimensions to data warehouse objects and shows how the quality of these objects can be measured.
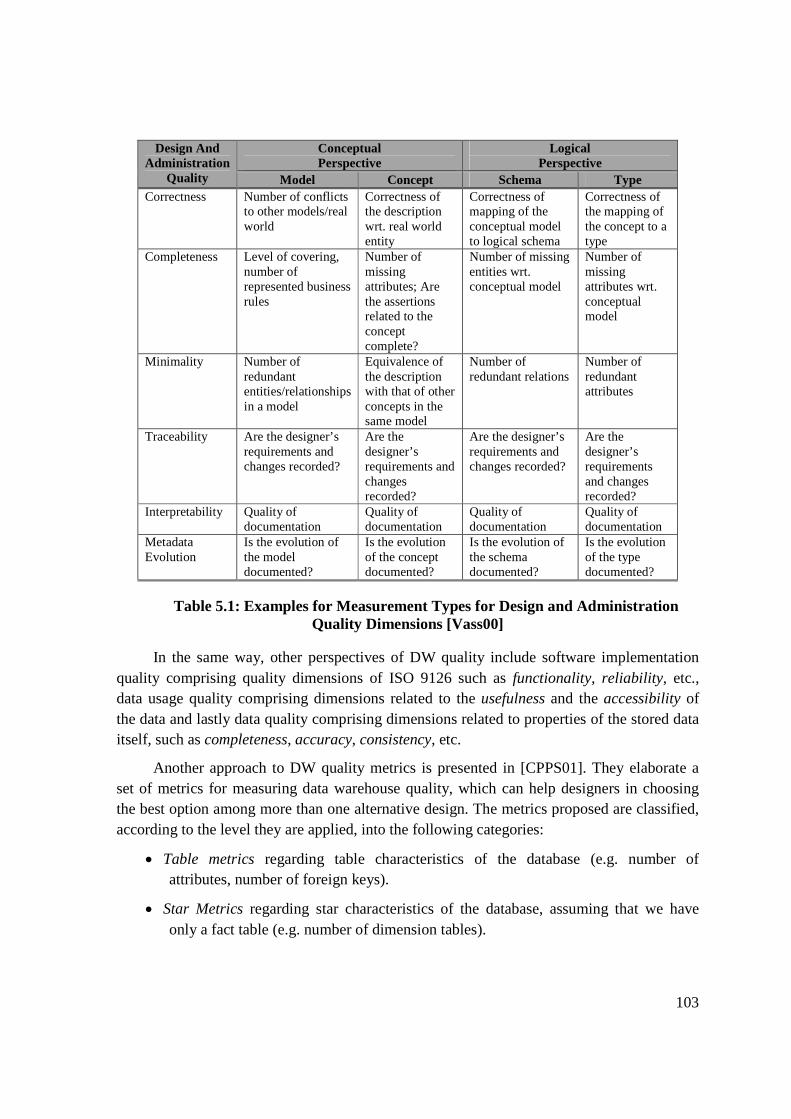
103
Design And Administration
Quality
Conceptual Perspective
Logical Perspective
Model Concept Schema Type Correctness Number of conflicts
to other models/real world
Correctness of the description wrt. real world entity
Correctness of mapping of the conceptual model to logical schema
Correctness of the mapping of the concept to a type
Completeness Level of covering, number of represented business rules
Number of missing attributes; Are the assertions related to the concept complete?
Number of missing entities wrt. conceptual model
Number of missing attributes wrt. conceptual model
Minimality Number of redundant entities/relationships in a model
Equivalence of the description with that of other concepts in the same model
Number of redundant relations
Number of redundant attributes
Traceability Are the designer’s requirements and changes recorded?
Are the designer’s requirements and changes recorded?
Are the designer’s requirements and changes recorded?
Are the designer’s requirements and changes recorded?
Interpretability Quality of documentation
Quality of documentation
Quality of documentation
Quality of documentation
Metadata Evolution
Is the evolution of the model documented?
Is the evolution of the concept documented?
Is the evolution of the schema documented?
Is the evolution of the type documented?
Table 5.1: Examples for Measurement Types for Design and Administration Quality Dimensions [Vass00]
In the same way, other perspectives of DW quality include software implementation quality comprising quality dimensions of ISO 9126 such as functionality, reliability, etc., data usage quality comprising dimensions related to the usefulness and the accessibility of the data and lastly data quality comprising dimensions related to properties of the stored data itself, such as completeness, accuracy, consistency, etc.
Another approach to DW quality metrics is presented in [CPPS01]. They elaborate a set of metrics for measuring data warehouse quality, which can help designers in choosing the best option among more than one alternative design. The metrics proposed are classified, according to the level they are applied, into the following categories:
• Table metrics regarding table characteristics of the database (e.g. number of attributes, number of foreign keys).
• Star Metrics regarding star characteristics of the database, assuming that we have only a fact table (e.g. number of dimension tables).

104
• Schema Metrics regarding characteristics of the whole database schema (e.g. number of fact tables, number of overall dimension tables).
They apply a formal validation process to these metrics concluding that all metrics are in an ordinal or in a superior scale.
Also, in [ChPr03] they focus on the quality of multidimensional schemas, more specifically on the analyzability and simplicity criteria. They present the underlying multidimensional model and address the problem of measuring and finding the right balance between analyzability and simplicity of multidimensional schemas. Analyzability and simplicity are assessed using quality metrics, which are described and illustrated based on a case study.
5.1.4 Entropy based approaches
In the context of databases, information theory and entropy are mainly used for the justification of data dependencies and normal forms. Such approaches are based on the statistical treatment of the information content of the database. Entropy has been proposed as a measure for redundancy as well as for validating data dependencies [Malv86], [Lee87], [CaPi87], [DaRo00], [NaKa01] (i.e., normal forms, functional, join, hierarchical and multivalued dependencies).
In [Malv86], they present an analytical data model, where the information content of a database relation is represented by a contingency table and analyzed using the methods of multivariate information theory. This approach lies in two points: database relations are treated as multivariate frequency distributions and data dependencies are taken into account. The resulting analytical model will be applied to supply database users with “statistical information”, answering queries such as, “to what extent are attributes related in a given database state” or “how does one attribute depend on the others”? Therefore, the information-theoretical analysis of the database content gets users able (a) to measure the statistical interdependence among two or more attributes (correlation theory), (b) to measure the effects on a given attribute of the remaining attribute (analysis of variance) and (c) to choose a set of variables, which select the important information of a view (decomposition theory).
Similarly to relational data, the information-theoretic treatment for XML databases is studied in [ArLi03]. They use techniques of information theory, and define a measure of information content of elements in a database with respect to a set of constraints. They first test this measure in the relational context, providing information theoretic justification for familiar normal forms such as BCNF, 4NF, PJ/NF, 5NFR, DK/NF, and then they show that the same measure applies in the XML context, which gives a characterization of a recently introduced XML normal form called XNF. Finally, they look at information theoretic criteria for justifying normalization algorithms.
105
An information theoretic approach to evaluating the design quality of data warehouses is presented in [LeLo03], where the relation between entropy and redundancy in the context of data warehouses is studied. Utilizing the information-theoretic treatment of relational databases developed, they show that the redundancy in the snowflake join of the primary key of the fact table is zero, i.e. it is minimal. They define a new normal form, namely SSNF – Snowflake Schema Normal Form, justifying it in terms of entropy-based equations.
On the other hand, various entropy-based metrics exist in the area of software engineering for evaluating the quality of software design [KiSW95], [Harr92], [DaLe88], [Alle02], but there is no work concerning the correlation of entropy with structural properties of databases, i.e. there are no entropy-based measures used for evaluating the design or evolution quality of a database schema.
To the best of our knowledge this is the first set of metrics that are explicitly targeted towards the assessment of the vulnerability of the design of a database – centric environment to evolutionary processes.
5.2 A Metric Suite for Evaluating Schema Evolution Capabilities
In the following sections, we introduce a metric set based on the properties of the evolution graph for measuring and evaluating the design quality of a database centric environment with respect to its ability to sustain changes. We will present simple metrics based on graph theoretic properties of the evolution graph. There are two possible contexts under which a graph can be examined according to the level of abstraction. We assess the metrics by examining the graph (a) at a coarse level of abstraction, where only relations, views and queries are present, i.e., module level, or (b) at its most detailed level, i.e., node level, that involves all the attributes of relations, views and queries, along with the internals of the queries. The zoom out operation imposed on the graph is described in section 2.10. We also consider metrics that measure the impact that events have on the graph taking into consideration the distribution of events on the graph. To this end, in the presence of policies on the graph, we reevaluate the vulnerability of constructs in the graph by introducing a metric which is aware of defined policies on nodes of the graph. Lastly, the last set of metrics comprises entropy-based metrics, which relate information theoretic properties of the graph with evolution capabilities.
5.2.1 Degree-related metrics
The first family of metrics comprises simple properties of each node or module in the graph and specifically the degree of nodes. The main idea lies in the understanding that the in-degree, out-degree and total degree of a node v demonstrate in absolute numbers the extent to
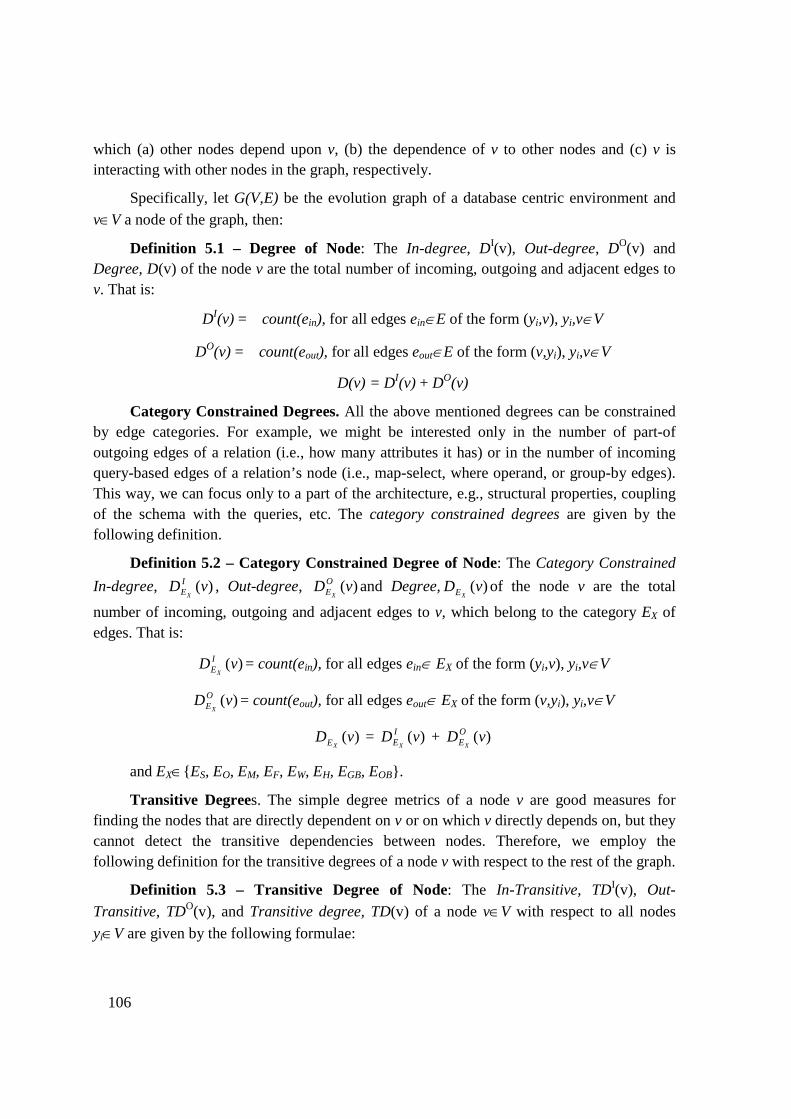
106
which (a) other nodes depend upon v, (b) the dependence of v to other nodes and (c) v is interacting with other nodes in the graph, respectively.
Specifically, let G(V,E) be the evolution graph of a database centric environment and
v∈V a node of the graph, then:
Definition 5.1 – Degree of Node: The In-degree, DI(v), Out-degree, DO(v) and Degree, D(v) of the node v are the total number of incoming, outgoing and adjacent edges to v. That is:
DI(v) = count(ein), for all edges ein∈E of the form (yi,v), yi,v∈V
DO(v) = count(eout), for all edges eout∈E of the form (v,yi), yi,v∈V
D(v) = DI(v) + DO(v)
Category Constrained Degrees. All the above mentioned degrees can be constrained by edge categories. For example, we might be interested only in the number of part-of outgoing edges of a relation (i.e., how many attributes it has) or in the number of incoming query-based edges of a relation’s node (i.e., map-select, where operand, or group-by edges). This way, we can focus only to a part of the architecture, e.g., structural properties, coupling of the schema with the queries, etc. The category constrained degrees are given by the following definition.
Definition 5.2 – Category Constrained Degree of Node: The Category Constrained
In-degree, )(vD IEX
, Out-degree, )(vDOEX
and Degree, )(vDXE of the node v are the total
number of incoming, outgoing and adjacent edges to v, which belong to the category EX of edges. That is:
)(vD IEX
= count(ein), for all edges ein∈ EX of the form (yi,v), yi,v∈V
)(vDOEX
= count(eout), for all edges eout∈ EX of the form (v,yi), yi,v∈V
)(vDXE = )(vD I
EX + )(vDO
EX
and EX∈{ ES, EO, EM, EF, EW, EH, EGB, EOB}.
Transitive Degrees. The simple degree metrics of a node v are good measures for finding the nodes that are directly dependent on v or on which v directly depends on, but they cannot detect the transitive dependencies between nodes. Therefore, we employ the following definition for the transitive degrees of a node v with respect to the rest of the graph.
Definition 5.3 – Transitive Degree of Node: The In-Transitive, TDI(v), Out-
Transitive, TDO(v), and Transitive degree, TD(v) of a node v∈V with respect to all nodes
yi∈V are given by the following formulae:

107
TDI(v) = ∑ ∑∈ ∈Vy vypathsp
p
i i
ecount),(
)( , for all distinct edges ep ∈paths of the form (yi,v)
TDO(v) = ∑ ∑∈ ∈Vy yvpathsp
p
i i
ecount),(
)( , for all distinct edges ep ∈paths of the form (v,yi)
TD(v) = TDI(v) + TDO(v)
Module degree. Assuming the degrees of the detailed graph can be computed, one can measure the degrees of the nodes of the zoomed-out graph. As already mentioned in chapter 2, zooming-out operation on the graph provides an abstract view of the modules of the graph, which comprises only top-level nodes, v∈{R,Q,VS} and edges between them. All edges are annotated with a strength corresponding to the number of edges previously connecting these modules. Thus, we define the module degree for a node of the zoomed out graph as:
Definition 5.4 –Degree of Module: The In-Module, DIs(v), Out-Module, DOs(v) and Module Degree, Ds(v) of a node v are given by the following formulae:
DIs(v) = ∑i
iestrength )( , for all edges ei of the form (y,v), y,v∈{R,Q,VS}
DOs(v) = ∑i
iestrength )( , for all edges ei of the form (v,y), y,v∈{R,Q,VS}
Ds(v) = DIs(v) + DOs(v), y,v∈{R,Q,VS}
Module transitive degree. Similarly to above, we may extend the transitive degrees to the zoomed-out graph according to the following definition:
Definition 5.5 –Transitive Degree of Module: The In-Module, TDIs(v), Out- Module, TDOs(v), and Module Transitive degree, TDs(v) of a node v∈{R,Q,VS} with respect to all
nodes yi∈{R,Q,VS} are given by the following formulae:
TDIs(v) = ∑ ∑∈ ∈Vy vypathsp
p
i i
estrength),(
)( , for ep∈paths of the form (yi,v)
TDOs(v) = ∑ ∑∈ ∈Vy yvpathsp
p
i i
estrength),(
)( , for ep∈paths of the form (v,yi)
TDs(v) = TDIs(v) + TDOs(v)
Weighted degree. Assume that we can assign a frequency freq(q) to each query q around the database. Here, we use the frequency of a query as a simple measure of its importance–other abstractions of importance can be used, too. What is important, though, is that given this measure, we can compute the effect of a change in a weighted way. Thus, if a node v of the graph is used by a query q, the weighted in-degree of the node due to this query is:

108
Definition 5.6 – Weighted Degree of Node: Let Gq=(Vq,Eq) the module subgraph of a query q with frequency freq(q). Then, the Weighted Degree, WDI(v|q), of a node v∈V with respect to the query q is given by the following formula:
WDI(v|q)=freq(q)*count(ei), for all edges ei of the form (y,v), y∈Vq.
Furthermore, we can define the weighted importance of node v, by summing all the weighted degrees of the queries that access v.
WDI(v)= ∑i
iI qvWD )|( , for queries qi that access v
Moreover, we can apply the exact same technique to the zoomed out-graph for calculating the weighted degrees of modules. That is:
WDIs(v|q)=freq(q)*strength(e), e being the edge (q,v)
WDIs(v)= ∑i
iIs qvWD )|( , for queries qi that access v
It is noteworthy that the metric can be extended to incorporate other kinds of nodes from which edges originate, too (i.e., except for query nodes). Take for example a view defined over a relation. We can extend the metric by assuming a frequency equal to the sum of frequencies of the queries accessing the view. Also, in the absence of any workload information, we can assume a frequency equal to 1 for all queries and this metric becomes equal to the simple degree metrics.
5.2.2 Metrics with an eye for future events
The metrics related to the degree of a node can serve as a possible crude basis of the sensitivity of a node –and consequently, of a schema- to the changes that can occur in the future. Still, the probability that a node will change in the future is not the same, neither for all types of events, nor for all nodes. For example the probability that a relation’s attribute R.A will be deleted is different from the probability that a new attribute will be added and queries using the relation will have to incorporate the new attribute and also different from the probability that another attribute R.B will be deleted. Therefore, the assessment of the sensitivity of a node can change completely if we incorporate this factor in our measurements.
Definition 5.7 – Flood Effect of an Event on a Node: Assume a node v in the graph G(V,E), an evolution event e over v∈V (which we denote as e|v) and a probability p of the event e to occur within a time period T. Then, the flood effect of e can be assessed by the following formula:
FE(e|v) = count(wi) * p
with wi∈V being the nodes of the graph, s.t. a path exists from wi to v.

109
Given, this simple measurement, we can easily define the flood effect of a sequence of independent events E = {e1, …, en} over a node v with probabilities {p1, ..., pn}.
FE (E|v) = ∑=
n
ii veFE
1
)|(
Now, we are ready to define the flood effect of a sequence of events over the whole graph. Assume a sequence of events E = {e1, …, en}, with each event defined over a different node, which we denote as v(ei), with possibility pi. Then, the flood effect of the sequence of events E over the graph G is defined by the following formula:
FE (E|G) = ∑=
n
iii eveFE
1
))(|(
Similar to the previous described module metrics, a simple variant of the flood effect involves reducing the size of the graph and assessing the flood effect over the zoomed out graph. In this case, we sacrifice accuracy but improve performance, as the size of the graph is significantly reduced. The sacrifice on accuracy is demonstrated by a simple example: assume two queries Q1 and Q2 using relation R, and attribute R.A being used in the selection clause of Q1 only. A deletion of R.A will not affect Q2. Nevertheless, the zoomed-out variant is incapable of capturing this effect.
Definition 5.8 – Flood Effect of an Event on a Module: Assume a node v in the zoomed out graph Gs(Vs,Es), Vs∈{R,Q,VS}, an evolution event e over v (which we denote as e|v) and a probability p of the event e to occur within a time period T. The flood effect for the zoomed out graph Gs(Vs,Es) can be defined as follows.
FES,cons(e|v) = count(wi) * p,
with wi∈Vs being the nodes of the zoomed out graph, s.t. a path exists from wi to v.
FES,overest(e|v) = p * ∑strength(ei)
with ei∈Es being the edges of all the paths of the zoomed out graph ending to v.
The conservative approach assigns a count of one for each pair of connected modules as the estimation of the impact of evolution. The overestimated approach counts all the strengths of all the involved edges, as if all possible edges of the detailed graph are affected by the evolution event. Similarly to the previous case, the two following measures are also defined, in the presence of a sequence of events E = {e1, …, en}:
FES (E|v) = ∑=
n
ii
S veFE1
)|( , FES(E|G) = ∑=
n
iii
S eveFE1
))(|(
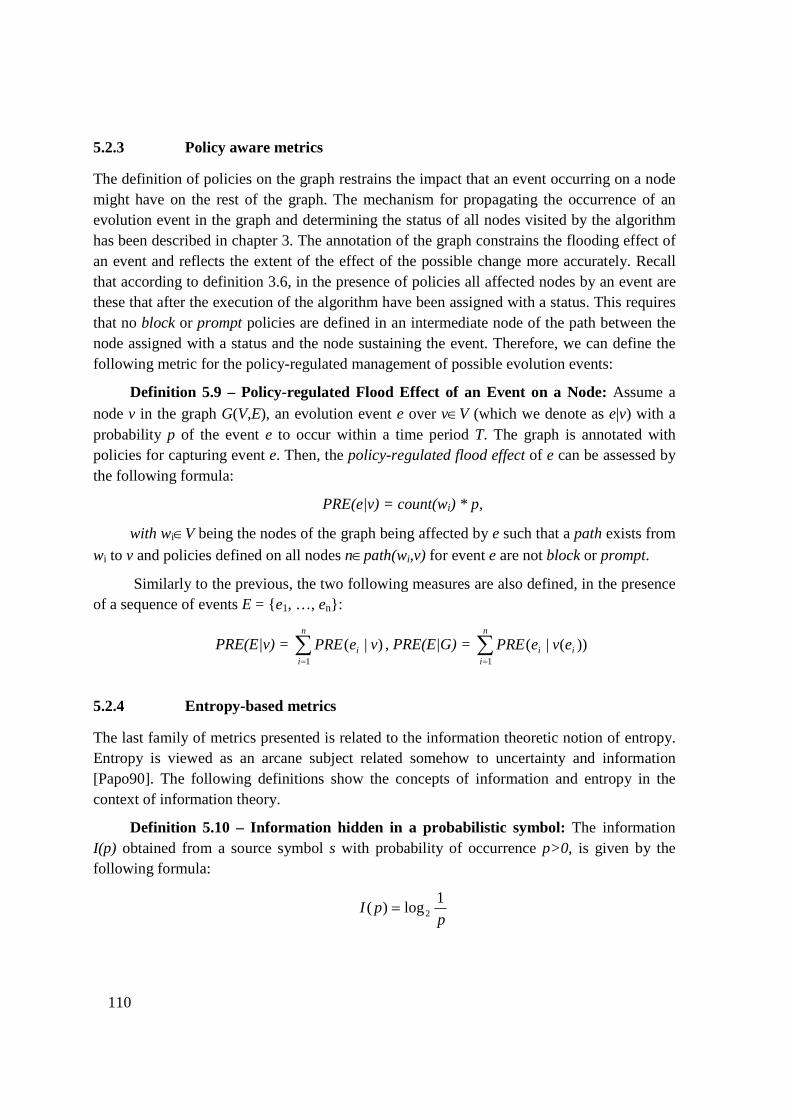
110
5.2.3 Policy aware metrics
The definition of policies on the graph restrains the impact that an event occurring on a node might have on the rest of the graph. The mechanism for propagating the occurrence of an evolution event in the graph and determining the status of all nodes visited by the algorithm has been described in chapter 3. The annotation of the graph constrains the flooding effect of an event and reflects the extent of the effect of the possible change more accurately. Recall that according to definition 3.6, in the presence of policies all affected nodes by an event are these that after the execution of the algorithm have been assigned with a status. This requires that no block or prompt policies are defined in an intermediate node of the path between the node assigned with a status and the node sustaining the event. Therefore, we can define the following metric for the policy-regulated management of possible evolution events:
Definition 5.9 – Policy-regulated Flood Effect of an Event on a Node: Assume a node v in the graph G(V,E), an evolution event e over v∈V (which we denote as e|v) with a probability p of the event e to occur within a time period T. The graph is annotated with policies for capturing event e. Then, the policy-regulated flood effect of e can be assessed by the following formula:
PRE(e|v) = count(wi) * p,
with wi∈V being the nodes of the graph being affected by e such that a path exists from
wi to v and policies defined on all nodes n∈path(wi,v) for event e are not block or prompt.
Similarly to the previous, the two following measures are also defined, in the presence of a sequence of events E = {e1, …, en}:
PRE(E|v) = ∑=
n
ii vePRE
1
)|( , PRE(E|G) = ∑=
n
iii evePRE
1
))(|(
5.2.4 Entropy-based metrics
The last family of metrics presented is related to the information theoretic notion of entropy. Entropy is viewed as an arcane subject related somehow to uncertainty and information [Papo90]. The following definitions show the concepts of information and entropy in the context of information theory.
Definition 5.10 – Information hidden in a probabilistic symbol: The information I(p) obtained from a source symbol s with probability of occurrence p>0, is given by the following formula:
ppI
1log)( 2=

111
Definition 5.11 – Entropy of a probabilistic source: Let S = {s1,...,sn} be a probabilistic source, with probability distribution P={p1,…,pn}. The average information obtained from a single sample from S is:
∑ ∑∑= ==
−===n
i
n
iii
n
i iiii pp
pppIpSH
1 12
12 log
1log)()(
The quantity H(S) is called the entropy of the source.
In general, entropy can characterize not only a probabilistic source but also any probabilistic model S, as it follows from Definition 5.12.
Definition 5.12 – Entropy of a probabilistic model: Given a probabilistic model S and a partition A = {A1, … An} of S consisting of the n events Ai with probability of occurrence P = { P(A1), …,P(An)}.The sum:
( ) ∑=
−=n
iii ppAH
12log ( )ii APp =
is called the entropy of the partition A.
Some useful remarks inferred by the above definitions are that:
a) entropy takes always a positive value as 0<pi<1 ⇒ log2pi <0, and also p*log2p → 0
for p → 0 and p → 1.
b) its maximum value is log2n corresponding to a uniform distribution of events.
c) for a probabilistic model with a uniform distribution for its partitions, entropy is an increasing function, i.e., H(An+1)>H(An).
Entropy is strongly related to the information that is “hidden” in a probabilistic model. For instance, in a uniform probabilistic model, all events are equally likely to occur and therefore the entropy of the model is maximum.
In our evolution context, the notion of entropy is used to evaluate the extent to which a part of a system is likely to be affected by a random evolution event on the graph. Entropy measures either the a priori uncertainty of the impact of an event on a part of the graph or equivalently the a posteriori amount of information we get from the knowledge that a part of the graph has been affected by an event. The more unpredictable the impact of a schema change on a part of the graph is, the more information is “hidden” and thus the more entropy characterizes this impact. The following definitions introduce the metrics of entropy regarding a node itself or a module with respect to evolution.
Definition 5.13 - Entropy of Node: Assume a node v in our graph G(V,E). We define
the probability that v∈V is affected by an arbitrary evolution event e over a node yk∈V as the number of paths from v towards yk divided by the total paths from v towards all nodes in the graph, i.e.,

112
P(v|yk) =
∑∈Vy
i
k
i
yvpaths
yvpaths
),(
),(, for all nodes yi ∈V.
Then, the information we gain when a node v is affected by an event occurred on node
yk is )|(
1log))|(( 2
kk yvP
yvPI = and the entropy of node v with respect to the rest of the
graph is then:
( ) ∑∈
−=Vy
ii
i
yvPyvPvH )|(log)|( 2 , for all nodes yi ∈V.
The above quantity expresses the average information we gain, or equivalently the amount of “surprise” conveyed, if node v is affected by an arbitrary evolution event on the graph. Observe that high entropy values correspond to nodes with a higher dependence with the rest of the graph. For instance, in the example of Figure 5.1, a query defined over only one relation, such as Q1, has an entropy value of 0, whereas a query defined over a view which in turns accesses three relations, such as Q2, has an entropy value of 2 and lastly view EMPS_PRJS has an entropy value of log23.
High entropy values correspond to these parts of the graph, that are dependent on many providers either directly or transitively, capturing in a “smoother” way than the local or the transitive degrees the dependencies in the graph.
Definition 5.14 - Entropy of Module: Moreover, we can apply the exact same
technique to the zoomed out-graph Gs(Vs,Es), by defining the probability of a node v∈Vs to be
affected by an evolution event over a node yk∈Vs as:
Ps(v|yk) =
∑ ∑
∑
∈ ∈
∈
si i
k
Vy yvpathspp
yvpathspp
estrength
estrength
),(
),(
)(
)(
, for all nodes yi ∈Vs.
with ep∈Es being the edges of all the paths of the zoomed out graph stemming from v
towards yk. Similarly, the entropy of node v∈Vs is:
( ) ∑∈
−=s
i Vyi
si
ss yvPyvPvH )|(log)|( 2 , for all nodes yi ∈Vs.
A summary of the proposed set of metrics is provided in the following tables.

113
Notation Metric
DI(v) In-Degree of a node v
DO(v) Out-Degree of a node v
D(v) Degree of a node v
(v)I
XED In-Category Constrained Degree of a node
v for all edges e∈ EX, EX∈{ ES, EO, EM, EF, EW, EH, EGB, EOB}
)(vO
XED Out-Category Constrained Degree of a
node v for all edges e∈ EX, EX∈{ ES, EO, EM, EF, EW, EH, EGB, EOB}
)(vXE
D Category Constrained Degree of a node v for all edges e∈ EX, EX∈{ ES, EO, EM, EF, EW, EH, EGB, EOB}
TDI(v) In-Transitive Degree of a node v
TDO(v) Out-Transitive Degree of a node v
TD(v) Transitive Degree of a node v
DIs(v) In-Degree of a module v
DOs(v) Out-Degree of a module v
Ds(v) Degree of a module v
TDIs(v) In-Transitive Degree of a module v
TDOs(v) Out-Transitive Degree of a module v
TDs(v) Transitive Degree of a module v
WDI(v|q) Weighted In degree of a node v w.r.t. a query q
WDI(v) Weighted In degree of a node v
WDIs(v|q) Weighted In degree of a module v w.r.t. a query q
WDIs(v) Weighted In degree of a module v
Table 5.2: Degree related Metrics
Notation Metric
FE(e|v) Flood Effect of an event e occurring at a node v
FE(E|v) Flood Effect of a sequence of events E occurring at a node v
FE (E|G) Flood Effect of a sequence of events E occurring at graph G
FEs(e|v) Flood Effect of an event e occurring at a module v
FEs(E|v) Flood Effect of a sequence of events E occurring at a module v
FEs (E|G) Flood Effect of a sequence of events E occurring at zoomed-out graph G
Table 5.3: Event-aware Metrics
Notation Metric
PRE(e|v) Policy regulated flood effect of an event e occurring at a node v
PRE(E|v) Policy regulated flood effect of a sequence of events E occurring at a node v
PRE(E|G) Policy regulated flood effect of a sequence of events E occurring at graph G
Table 5.4: Policy-aware Metrics
Notation Metric
H(v) Entropy of a node v wrt its evolution
Hs(v) Entropy of a module v wrt its evolution
Table 5.5: Entropy-based Metrics

114
5.3 Experimental Evaluation
In this section, we present the experimental evaluation that we performed for the proposed metric suite. We have employed a data warehouse environment as the testbed for our experiments. There are two major goals in our experiments.
1. To empirically validate the proposed set of metrics and prove that they constitute good indicators for the prediction of the effect evolution events have on a database environment. A clear desideratum in this context is the determination of the most suitable metric for this prediction under different circumstances.
2. To compare alternative design techniques with respect to their tolerance to evolution events.
Experimental setup for the first goal. To achieve the goal of determining the fittest prediction metric, we need to fix the following parameters: (a) a data warehouse schema surrounded by a set of queries and possibly views, (b) a set of events that alter the above configuration, (c) a set of administrator profiles that simulate the intention of the administrating team for the management of evolution events, and (d) a baseline method that will stand as an accurate estimate of the actual effort needed to maintain the warehouse environment.
We have employed the TPC-DS [TPCD07] schema as the testbed for our experiments. TPC-DS is a benchmark that involves six star schemas (with a large overlap of shared dimensions) standing for Sales and Returns of items purchased via a Store, a Catalog and the Web. We have used the Web Sales schema that comprises one fact table and thirteen dimension tables. The structure of the Web Sales schema is interesting in the sense that it is neither a pure star, nor a pure snowflake schema. In fact, the dimensions are denormalized, with a different table for each level; nevertheless, the fact table has foreign keys to all the dimension tables of interest (resulting in fast joins with the appropriate dimension level whenever necessary.) Apart from this “starified” schema, we have also employed two other variants in our experiments: the first involves a set of views defined on top of the TPC-DS schema and the second involves the merging of all the different tables of the Customer dimension into one. We have isolated the queries that involve only this subschema of TPC-DS as the surrounding query set of the warehouse. The views for the second variant of the schema were determined by picking the most popular atomic formulae at the WHERE clause of the surrounding queries. In other words, the aim was to provide the best possible reuse of common expressions in the queries.
We created two workloads of events to test different contexts for the warehouse evolution. The first workload of 52 events simulates the percentage of events observed in a real world case study in an agency of the Greek public sector. The second workload simulates a sequence of 68 events that are necessary for the migration of the current TPC-DS Web sales schema to a pure star schema. The main idea with both workloads is to simulate a

115
set of events over a reasonable amount of time. Neither the internal sequence of events per se, nor the exact background for deriving the events is important; but rather, the focus is on the generation of events that statistically capture a context under which administration and development is performed (i.e., maintenance of the same schema in the first case, and significant restructuring of a schema in the latter case.) The distribution of events is shown in Table 5.6.
Operation Distribution 1 Distribution 2 Rename Measure 29% (15) 0% (0) Add Measure 25% (13) 0% (0) Rename Dimension Attribute 21% (11) 0% (0) Add Dimension Attribute 15% (8) 37% (25) Delete Measure 6% (3) 0% (0) Delete Dimension Attribute 4% (2) 44% (30) Delete FKs 0% 13% (9) Delete Dimension Table 0% 6% (4)
Table 5.6: Distribution of events
Figure 5.4 depicts the first configuration (WS) at a zoomed out level.
Figure 5.4: Bird’s-eye view of the configuration used in our experiments
We annotate the graph with policies, in order to allow the management of evolution events. We use three annotation “profiles”, specifically: (a) propagate all, meaning that every change will be flooded to all the nodes that should be notified about it, (b) block all, meaning that a view/query is inherently set to deny any possible changes, and (c) reasonable

116
balanced, consisting of 80% of the nodes with propagate policies and 20% with blocking. The first policy practically refers to a situation without any annotation. The second policy simulates a highly regulatory administration team that uses our framework to capture an evolution event as soon as it leaves its source of origin; the tool highlights the node where the event was blocked. The third policy simulates a rather liberal environment, where most events are allowed to spread over the graph, so that their full impact can be observed; yet, 20% of critical nodes are equipped with blocking policies to simulate the case of nodes that
should be handled with special care.
Summarizing, the configuration of an experiment involves fixing a schema, a set of policies and a workload. We have experimented with all the possible combinations of values. The metrics that we have measure in each experiment involve the execution of the workload of evolution events in the specified configurations and the measurement of the affected nodes. Specifically, each node of the graph is monitored and we get analytic results on how many times each node was affected by an event. This measurement constitutes the baseline measurement that simulates what would actually happen in practice. This baseline measurement is compared to all the metrics reported in Section 4, being evolution-agnostic or not.
Experimental Setup for the second goal. The second goal of our experiments is to compare alternative designs of the warehouse with each other – i.e., we want to find which design method (pure star, TPC-DS with or without views) is the best for a given designer profile (which is expressed by the policies for the management of evolution.) Thus, the comparison involves the compilation of the baseline measurements, grouped per policy profile and alternative schema. We measure the total number of times each node was affected and we sum all these events. The intention is to come up with a rough estimation of the number of rewritings that need to be done by the administrators and the application developers (in this setting, it is possible that a query or view is modified in more than one of its clauses.) A second measurement involves only the query part: we are particularly interested in the effort required by the application developers (which are affected by the decisions of the administration team), so we narrow our focus to the effect inflicted to the queries only.
5.3.1 Effectiveness of the proposed metrics
In this experiment, we evaluate the effectiveness of the proposed metrics using the first distribution of events. We have constructed the following nine configurations by fixing each time a value for the schema and the policy. The schema takes one of the values {Web Sales (WS), Web Sales extended with views (WS-views), star variant of Web Sales (WS-star)} and the policy takes one of the values {Block-All, Propagate-All, Mixture}. In the rest, we discuss our findings organized in the following categories: (a) Fact Tables, (b) Dimension Tables, (c) Views, and (d) Queries.

117
Facts. Our experiments involved a single fact table. We observed that the number of events that occurred to the fact table does not change with the overall architecture. The presence of more or less dimensions or views did not affect the behavior of the fact table; on the contrary, it appears that the main reasons for the events that end up to the fact table, are its attributes. Therefore, the main predictor for the behavior of the evolution of the fact table is its out-degree, which is mostly due to the part-of relationships with its attributes.
Dimension Tables. Evolution on dimension tables can also be predicted by observing their out-degree, since this property practically involves the relationship of the dimension with its attributes as well as its relationship via foreign keys with other dimensions. Figure 5.5 depicts this case for the original web sales schema and its star variant, for which all customer-related dimensions have been merged into one dimension. Our baseline (depicted as a solid line with triangles) involves the actual number of times a node belonging to a dimension table was affected.
Figure 5.5: Events affecting dimension tables: (a) WS schema, (b) WS-star schema
Figure 5.6: Events affecting views: (a) WS-star and WS schema, (b) WS-views schema
Despite the spikes at the heavily correlated date dimension, out-degree is a predictor, keeping in mind that it is the actual trend that matters and not the values themselves.
Views. Views behave practically uniformly for all configurations, independently of schema or policy. Observe Figure 5.6 where we depict our findings concerning views. It is clear that strength of out-degree (strength-out) and total strength are the best predictors for
Total no. events on Views (schema=WS, policy=mixture)
0
10
20
30
40
50
60
ALL_SALES PROMOTIONAL_SALE AT PT
NumberAffected
DegreeTotal
DegreeIn
DegreeOut
StrengthIn
StrengthOut
StrengthTotal
TranDegreeIn
TranDegreeOut
Entropy In
Total no. events on Views (schema=WS-views, policy=block)
0
10
20
30
40
50
60
70
80
90
100
ALL_SALES PROMOTIONAL_SALE
CUSTOMER_CUST_ADDRESS
DAYS30DAYS30_60DAYS60_90DAYS90_120DAYS120
WEBSALES_ITEM_DATEDIM
AT PT
NumberAffected
StrengthOut
StrengthTotal
118
the evolution of views with the former being an interestingly accurate predictor in all occasions. Figure 5.6(a) is a representative of all the six configurations for the original web sales schema and its star variant. The policy makes no difference and all six experiments have resulted in exactly the same behavior. The rest of the metrics miss the overall trend and are depicted for completeness. Figure 5.6 (b) shows a representative graphical representation of the metrics, showing that the strength of the out-degree is consistently effective, whereas the total strength shows some spikes (mainly due to views that are highly connected to the sources, although these sources did not generate too much traffic of evolution events after all). The rest of the metrics behave similarly with Figure 5.6 (a).
Queries. Queries are typically dependent upon their coupling to the underlying DBMS layer. As a general guideline, the most characteristic measure of the vulnerability of queries to evolution events is their transitive dependence. A second possible metric suitable for a prediction is the entropy; however, it is not too accurate. Other metrics do not seem to offer good prediction qualities; the best of them, out-degree, does not exceed 70%. Recall that the baseline for our experiment is the actual number of events that reached a query (depicted as a solid line decorated with triangles in Figure 5.7 and Figure 5.8). Finally, we stress that the trend makes a metric successful and not the precise values.

119
Figure 5.7: Events affecting queries: (a) WS schema, (b) WS-star schema
Figure 5.8: Total number of events affecting queries: (a) Behavior for the WS-views with propagate policy; (b) Behavior for the WS-views schema with mixture policy
Figure 5.9: Comparison of WS, WS-views, WS-star design configurations for distribution 1: (a) only affected queries and (b) all affected nodes
Total no. affected query nodes
0
50
100
150
200
250
300
350
400
Block Propagate Mixture
Web Sales Web Sales w/ Views
Web Sales Star
Total no. affected nodes
0
100
200
300
400
500
600
700
800
900
1000
Block Propagate Mixture
Web Sales Web Sales w/ Views Web Sales Star
Total no. events on Queries (schema=WS, policy=block)
0
5
10
15
20
25
30
Q3 Q9 Q8 Q4 Q6 Q1 Q2 Q5
NumberAffectedTranDegreeOutEntropy InDegreeOut
Total no. events on Queries (schema=WS-star, policy=mixture)
0
5
10
15
20
25
30
Q3 Q9 Q8 Q4 Q7 Q6 Q1 Q2 Q5
NumberAffected DegreeOut Entropy In TransDegreeOut
Total no. events on Queries (schema=WS-views, policy=propagate)
0
5
10
15
20
25
30
35
Q3 Q9 Q8 Q4 Q6 Q10 Q1 Q2 Q5 Q7
NumberAffected Entropy In
DegreeOut TransDegreeOut
Total no. events on Queries (schema=WS-views, policy=mixture)
0
5
10
15
20
25
30
35
Q3 Q4 Q8 Q6 Q1 Q2 Q5 Q9 Q7
NumberAffected
Entropy In
TransDegreeOut
DegreeOut

120
Figure 5.10: Comparison of WS, WS-views design configurations for distribution 2: (a) only affected queries; (b) all affected nodes
Figure 5.7 shows two characteristic plots for the original web sales schema and its star variant. Each plot is a representative of the other plots concerning the same schema, with the trends following quite similar behavior. In all cases, transitive dependence gives a quite successful prediction, with around 80% accuracy. It is noteworthy that in the case of the 20% of failures, though, the metric identifies a query as highly vulnerable and in practice, the query escapes with few events. Fortunately, the opposite does not happen, so a query is never underestimated with respect to its vulnerability. Entropy is the second best metric and due to its smoothness, although it follows transitive dependence’s behavior, it misses the large errors of transitive dependence, although it also misses the scaling of events, for the same reason.
Queries are quite dependent on the policy and schema: views seem to block the propagation of events to the queries. Figure 5.8(b) shows a significant drop for the values of affected queries when the policy is a mixture of propagation and blocking policies. The propagate-all policy depicted in Figure 5.8(a) presents the flooding of the events, which involves more than double the number of occurrences as compared to the numbers of Figure 5.8 (b) for 80% of the cases. A block-all policy involved only 3 of the 10 queries and it is not depicted for lack of space). Interestingly, the transitive degree has a success ratio of 80%, as opposed to the rather unsuccessful out-degree.
5.3.2 Comparison of alternative design configurations
We compared the three alternative design configurations of our system in order to come up with an estimation of the number of rewritings that need to be done by the administrators and the application developers, and to assess the effect that a different schema configuration has on the system. Thus, we measured the number of affected nodes and specifically, the number of affected query nodes for the nine different configurations of policy sets and schemata. The first distribution of events was applied to all schemas, whereas the second was applied only to WS and WS-views.
Total no. affected query nodes
0
20
40
60
80
100
120
140
160
180
200
Block Propagate Mixture
Web Sales Web Sales w/ Views
Total no. affected nodes
0
100
200
300
400
500
600
700
Block Propagate Mixture
Web Sales Web Sales w/ Views

121
Figure 5.9 describes the effect that a design alternative has on how affected system constructs are in the case of evolution. A star schema has less maintenance effort than the other variants due to its reduced size. Clearly, the presence of views augments the effort needed by the administration team to maintain them (shown in the increased number of affected nodes of Figure 5.9b), which is because nodes belonging to views are extensively affected. Still, the interference of views between the warehouse and the queries serves as a “shield” for absorbing schema changes and not propagating them to queries. The drop in query maintenance due to the presence of views is impressive: whatever we pay in administration effort, we gain in development effort, since the cost of rewritings in terms of human effort mainly burdens application developers, who are obliged to adapt affected queries to occurred schema changes. The case of schema migration strengthens this observation (Figure 5.10). As for the different policy sets, we observe that blocking of events decreases the number of affected nodes in all configurations and saves significant human effort. It is, however, too conservative, constraining even the necessary readjustments that must be actually made on queries and views. On the other hand, propagate and mixture policy sets have an additional overhead, which is balanced by the automatic readjustments that are held on the system.
5.4 Summary
In this chapter we have introduced a set of metrics for evaluating the evolution properties of a database-centric environment such as the vulnerability of its design structures to hypothetical evolution events. Based on graph theoretic properties of the evolution graph, we have provided metrics like the degrees (in, out, and total) of a node, the transitive degrees of a node (standing for the extent to which other nodes transitively depend upon it), and the degrees of a summarized variant of a module (e.g., a view) that abstract the internal semantics of the module and focus on its coupling to the rest of the environment. We have then presented an event aware set of metrics that takes into account the distribution of potential events on the graph. We have also included the special role of policies annotating the graph into a policy-aware set of metrics. We have provided an information theoretic definition of a module’s entropy that simulates the extent to which the vulnerability of a node is surprising. Finally, we have extensively experimented with various configurations in the setup of a reference database environment and assess both the effectiveness of the proposed metrics (i.e., how well do they actually predict the impact of evolution events to a design construct) and how different design alternatives for the same schema behave with respect to schema evolution.


123
6. HECATAEUS: AN IMPACT PREDICTION FRAMEWORK FOR
DATABASE SCHEMA EVOLUTION
In the context of the proposed framework, we have implemented a tool, called HECATAEUS, used for the construction and visualization of the evolution graph and its annotation with policies regarding evolution semantics. HECATAEUS enables the user to transform SQL source code to evolution graphs, explicitly define policies and evolution events on the graph and determine affected and adjusted graph constructs according to the proposed algorithm. The graph modeling of the environment has versatile utilizations: apart from the impact prediction and the creation of hypothetical evolution scenarios, the user may also assess several graph-theoretic metrics of the graph that highlight sensible regions of the graph as described in chapter 5.
Hecataeus is a user-friendly visual environment that helps administrators and users to perform hypothetical evolution scenarios on database applications. Its main features are outlined as:
• Visualization of SQL code as directed graphs: Hecataeus parses schema definition and SQL code and creates a directed graph, which represents all the semantics of the database schema at the most granular level [PKVV05]. Separate nodes are constructed for each database object, such as relation nodes, attribute nodes, etc., and different edges exist for the various relationships between these objects, such as part-of edges, dependency edges, etc.
• Manipulation of the evolution graph: Hecataeus produces a fully dynamic graph, which users may manipulate. Thus, users may apply layout algorithms to transform the way graph is displayed, find add or remove graph constructs (i.e., nodes and edges) and change their semantics. Additionally, the tool offers capabilities for

124
zooming on parts of the graph, isolating modules and creating subgraphs and lastly displaying the graph at various abstraction levels (i.e., only top level nodes).
• Annotation of the graph with evolution semantics: Evolution semantics are easily applied on the graph through the annotation of the graph constructs with evolution events and policies. The occurrence of an event on a node of the graph as well as the policy, with which the node reacts to this event, are represented as properties of the specific node.
• Impact prediction of evolution changes: Hecataeus provides the ability to the user to trigger events defined on nodes of the graph and highlight the impact that these events have on the rest of the graph according to the defined polices. It denotes the parts of the graph that are affected by an event but most importantly nodes are assigned with a status that dictates their reaction to this event and colored accordingly.
• Export of evolution scenarios: The user may create an evolution scenario containing the graph along with all the evolution semantics, i.e., events, policies, statuses, which can be transformed and exported in XML format. Thus, administrators can create process and store as XML files multiple scenarios for the same database configuration and evaluate their results before applying to the production configuration.
• Definition of policies with extended SQL: Another useful feature that alleviates the user from manually defining semantics on the graph is the definition of policies with the extended SQL syntax as presented in chapter 4. Hecataeus can parse files containing such syntax for the annotation of the graph with policies.
• Application of metrics on the graph: Lastly, the user may apply metrics on constructs of the graph and detect crucial to the evolution of the system parts of the graph. The application of metrics is performed at various granular levels; at a specific node (e.g., the degree of a node), a module (e.g., the node with the highest transitive degree) or lastly at the whole graph (e.g., the entropy of the graph).
Chapter Outline. In section 6.1, the system architecture of Hecataeus is presented. We describe the main components of the tool and their interrelation between them. Then, in section 6.2, we present the main features of the proposed tool via a use case regarding a hypothetical evolution scenario applied on the configuration of the motivating example of chapter 3. First, Hecataeus is used for modeling the schema characteristics of the example database environment and creating the evolution graph (section 6.2.1 – 6.2.3). Then, in section 6.2.4 – 6.2.5, the main steps for creating and storing evolution scenarios with Hecataeus are presented and in 6.2.6 we focus on the capabilities of Hecataeus for evaluating metrics on the evolution graph. Lastly, we conclude the concepts presented in this chapter in section 6.3.
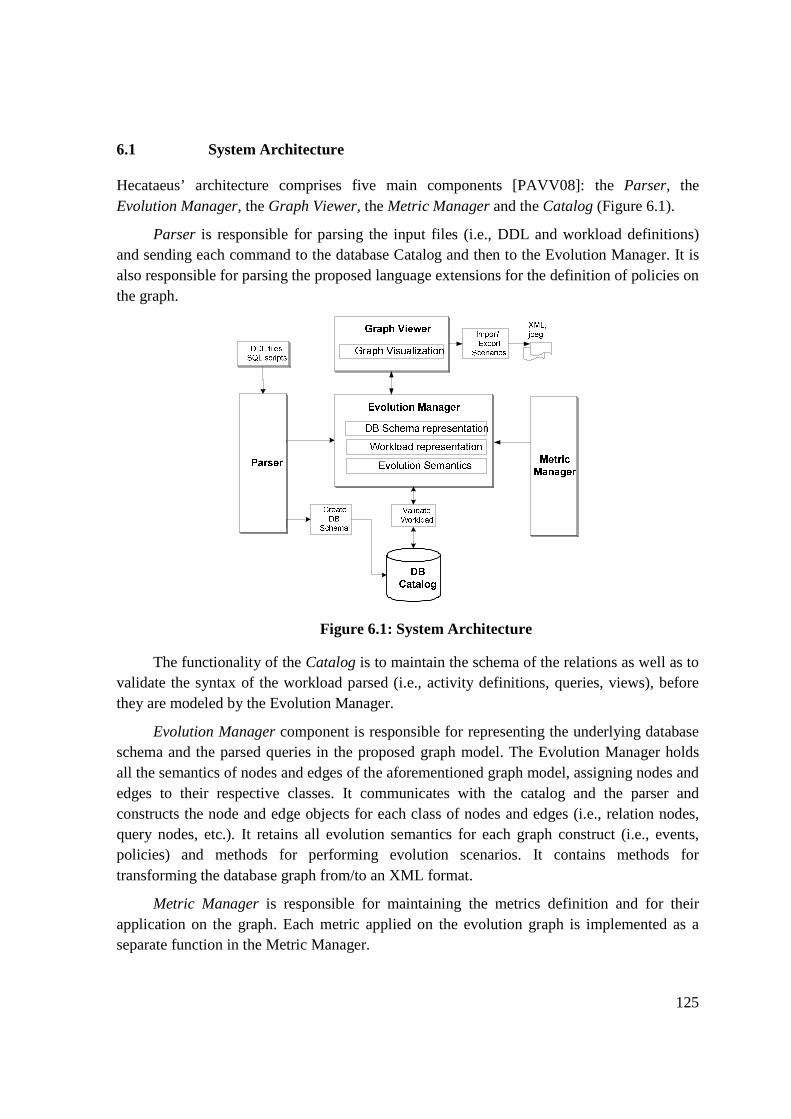
125
6.1 System Architecture
Hecataeus’ architecture comprises five main components [PAVV08]: the Parser, the Evolution Manager, the Graph Viewer, the Metric Manager and the Catalog (Figure 6.1).
Parser is responsible for parsing the input files (i.e., DDL and workload definitions) and sending each command to the database Catalog and then to the Evolution Manager. It is also responsible for parsing the proposed language extensions for the definition of policies on the graph.
Figure 6.1: System Architecture
The functionality of the Catalog is to maintain the schema of the relations as well as to validate the syntax of the workload parsed (i.e., activity definitions, queries, views), before they are modeled by the Evolution Manager.
Evolution Manager component is responsible for representing the underlying database schema and the parsed queries in the proposed graph model. The Evolution Manager holds all the semantics of nodes and edges of the aforementioned graph model, assigning nodes and edges to their respective classes. It communicates with the catalog and the parser and constructs the node and edge objects for each class of nodes and edges (i.e., relation nodes, query nodes, etc.). It retains all evolution semantics for each graph construct (i.e., events, policies) and methods for performing evolution scenarios. It contains methods for transforming the database graph from/to an XML format.
Metric Manager is responsible for maintaining the metrics definition and for their application on the graph. Each metric applied on the evolution graph is implemented as a separate function in the Metric Manager.

126
Lastly, Graph Viewer is responsible for the visualization of the graph and the interaction with the user. It communicates with the Evolution Manager, which holds all evolution semantics and methods. Graph Viewer offers distinct colorization for each set of nodes, edges according to their types and the way they are affected by evolution events, editing of the graph, such as addition, deletion and modification of nodes, edges and policies. It enables the user to raise evolution events, to detect affected nodes by each event and highlight appropriate transformations of the graph. Lastly, the user can import or export evolution scenarios to XML format and save scenarios to image formats (i.e., jpeg).
Hecataeus is an open source project, implemented in Java. For the parser and the database engine, we have used HSQLDB, an open source SQL relational database engine written in Java [HSQL], whereas for the graph visualization we have used the Java Universal Network/Graph Framework (JUNG), a software library that provides a common and extendible language for the modeling, analysis, and visualization of data that can be represented as a graph or network [JUNG].
6.2 Hecataeus’ Functionality
In the following sections, we present in more details some functionality issues of Hecataeus. We present the functionality of Hecataeus via the use case of a hypothetical evolution change occurring at the database schema of the motivating example configuration provided in chapter 3.
6.2.1 Creating the Evolution Graph from SQL files
Hecataeus’ primary input involves SQL files containing database schema definitions as well as queries and views definitions. As shown in Figure 6.2, first the user selects the two files containing the DDL and SQL files respectively.

127
Figure 6.2: Creating graph from SQL files
The tool parses the files and validates the syntax of the SQL code before creating and displaying the evolution graph. In case syntax inconsistencies exist in the definitions of a table or a query, Hecataeus informs the user and proceeds with creating the evolution graph without the inconsistent object.
6.2.2 Editing the Evolution Graph
Hecataeus constructs an editable user-friendly graph which user can manipulate. The layout of the evolution graph distinguishes different types of nodes. For each different type a unique color and shape is used (e.g., red circle for relations, green square for views, etc.). Additionally, top-level nodes of modules are bigger that the rest nodes, so that modules are easily discrete by the user. Single or multiple nodes can be selected and rearranged in the layout.
Operations such as additions, modifications, deletions and searching of nodes are supported by the tool. The user can manually add nodes as well as edges between nodes and define their properties. In Figure 6.3, the form for modifying the properties, i.e., name and type, of EMPS_PRJS view node is shown.

128
Figure 6.3: Editing the properties of EMPS_PRJS view node
6.2.3 Abstracting the Evolution Graph
Database systems comprise some tens of database objects and even hundreds of dependent objects accessing the database schema. When represented to graphs, it will result in a large number of nodes, which may confuse or make hard to users to manipulate. To deal with this issue, Hecataeus can display the graph in various abstraction levels, hiding or revealing certain types of nodes and relationships between them, according to the point of interest of the users. For instance, in Figure 6.4 the user wishes to hide the detailed representation (i.e., attributes, conditions, etc.) for all modules in the graph and display only module-level nodes and edges between them.
Additionally, the user can isolate and display only a part of the graph by selecting multiple nodes, e.g., all nodes comprising a relation module. Lastly, the user can display nodes with certain properties such as a policy, an event or a status defined on them.

129
Figure 6.4: Displaying only top-level node of modules
6.2.4 Creating Evolution Scenarios
Evolution scenarios are created by the users by enforcing evolution semantics on the graph. An evolution scenario comprises a set of events applied on nodes of the graph as well as a set of policies that dictate the way affected nodes react to evolution events. In the following sections, we present the implementation of a hypothetical scenario, namely the deletion of attribute E_SAL from relation EMP, with the use of Hecataeus.
6.2.4.1 Defining Events
The first step for creating an evolution scenario in Hecataeus involves the definition of the potential evolution events on the nodes of the graph. The user can define one or more potential events on a node or a set of nodes of the graph. This is easily accomplished by selecting a specific node and assigning to it a potential event. As shown in Figure 6.5, the user assigns the event “DELETE_ATTRIBUTE” to the attribute E_SAL of relation EMP. In that manner, one or more events of different types can be assigned to the same node. Furthermore, according to the type of the node the appropriate set of potential events is offered to the user, i.e., only RENAME_ATTRIBUTE and DELETE_ATTRIBUTE events are available to the user when an attribute node is selected. Events are actually properties that are assigned to nodes and thus an evolution scenario can comprise multiple assignments of events.

130
Figure 6.5: Adding event “DELETE_ATTRIBUTE” to att ribute E_SAL of relation EMP
6.2.4.2 Defining Policies
Similarly, policies are properties defined on a node for capturing the reaction of the node to an evolution event. A policy defined on a node comprises three parts: (a) the event node on which a hypothetical event occurs, the type of the hypothetical event and lastly the type of policy that is followed. In Figure 6.6, the user defines a policy on node EMPS_PRJS view. The policy defined on EMPS_PRJS view dictates that in case an event for deleting (i.e., event type) the attribute E_SAL (i.e., event node) of EMPS_PRJS view occurs then the event will be propagated towards the rest of the graph. In Figure 6.7, a second policy is defined on query node Q2 dictating that the deletion of attribute P_EXPENSES must be blocked. Additionally, the user can prescribe a default system-wide policy for all nodes in the graph, when no other definitions are explicitly defined on them. In our example, the propagation of the deletion of the attribute is considered as the default policy of this evolution scenario.
Hecataeus also supports the language extensions presented in chapter 4 for defining policies on the graph. The user can prepare a text file with expressions for the definition of policies on nodes of the graph. Hecataeus parses the file and annotates these nodes with the appropriate policies. For example, in Figure 6.8, the user imports the text file, which contains the expressions for defining the above policies on EMPS_PRJS and Q2 nodes.

131
Figure 6.6: Defining the policy for propagating the deletion of attribute E_SAL from EMPS_PRJS view
Figure 6.7: Defining the policy for blocking the deletion of attribute P_EXPENSES from Q2 query

132
Figure 6.8: Parsing language extensions for definition of policies
Figure 6.9: Highlighting the impact of deleting attribute EMP.E_SAL

133
6.2.4.3 Highlighting the Impact of Changes
Given an event and a set of policies defined on the evolution graph, the tool offers the user the ability to inspect the impact that this event has on the overall graph. Specifically, the user triggers the event and Hecataeus highlights the parts of the graph that are affected by this event according to the algorithm presented in chapter 3. Additionally, the tool assigns a status on each affected node, which indicates the action that must be performed on this node as a result of the policies defined for this event. In Figure 6.9, the impact of deleting attribute E_SAL of relation EMP is highlighted on the graph. Observe that, the EMPS_PRJS view node (i.e., the brown triangle) has been assigned with a status “TO_DELETE_CHILD” indicating that a child of this view must be deleted.
It is noted that each node is uniquely colored according to the status assigned to it (e.g., red for the status “TO_DELETE_SELF”, black for the status “BLOCK”, brown for status “TO_DELETE_CHILD”, etc.). Therefore, the user can easily detect by the color of the affected nodes the assigned statuses. In our example, the attributes E_SAL of relation EMP, Q1 and EMPS_PRJS are marked for deletion and their parents are annotated with a status for deleting one of their children. On the contrary, P_EXPENSES attribute of Q2 is annotated with a status for blocking the deletion of itself as well as the Q2 node as well. These results are consistent with the propagate policy defined on EMPS_PRJS node and block policy defined on Q2 node, respectively. For the rest of the modules (i.e., EMP and Q1) the default propagate policy dictates the deletion of the E_SAL attributes. Lastly, the coloring of the edges indicates the action that is performed on the relationships between the affected nodes. A red edge indicates that it must be deleted as a result of deleting one of its adjacent nodes, whereas the purple one indicates that one of the provider nodes is semantically affected.
6.2.5 Saving Scenarios
A featured functionality of Hecataeus is the reusability and extensibility of evolution scenarios. The user can save an evolution scenario, i.e., the graph along with all the evolution semantics defined on it, as an XML file. The XML representation contains information about all the properties of the nodes, edges, events and policies of the graph. It also contains information about the graphical layout of the graph, the position and the visibility of the nodes. In Figure 6.10, a part of the XML representation for the evolution graph of our example is presented. The tag <HNode> contains the properties for the GB node of Q2 query, such as its unique key in the graph, its name, type and position. Also, the two policies defined on EMPS_PRJS view and Q2 query are enclosed in the tags <HPolicy>, whereas the event defined on EMP.E_SAL attribute is enclosed in a <HEvent> tag.
The xml representation of evolution scenarios offers the user the ability to create a scenario, save it and then reuse it or extend it in Hecataeus. Thus, the user can easily test different evolution scenarios for a given database configuration and compare their impact.
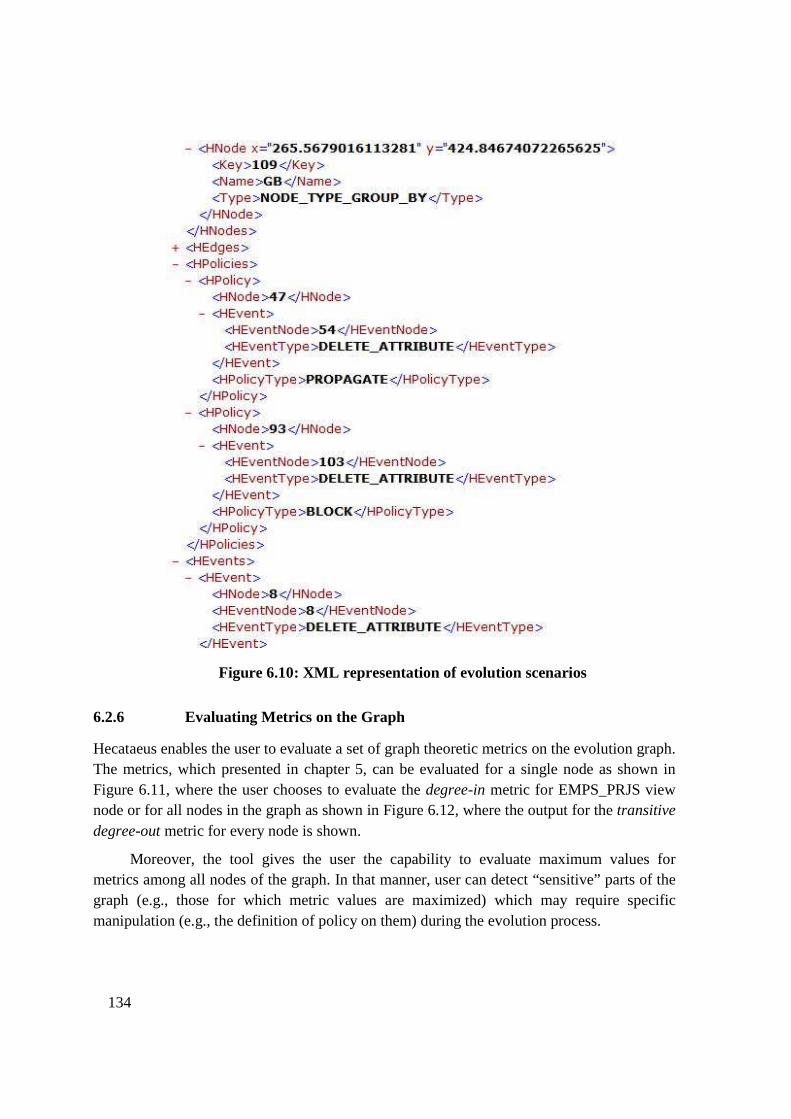
134
Figure 6.10: XML representation of evolution scenarios
6.2.6 Evaluating Metrics on the Graph
Hecataeus enables the user to evaluate a set of graph theoretic metrics on the evolution graph. The metrics, which presented in chapter 5, can be evaluated for a single node as shown in Figure 6.11, where the user chooses to evaluate the degree-in metric for EMPS_PRJS view node or for all nodes in the graph as shown in Figure 6.12, where the output for the transitive degree-out metric for every node is shown.
Moreover, the tool gives the user the capability to evaluate maximum values for metrics among all nodes of the graph. In that manner, user can detect “sensitive” parts of the graph (e.g., those for which metric values are maximized) which may require specific manipulation (e.g., the definition of policy on them) during the evolution process.

135
Figure 6.11: Evaluating “Degree In” metric for EMPS_PRJS view
Figure 6.12: Output for “Transitive Degree Out” metric for all nodes

136
6.3 Summary
In this chapter, we have presented in details a software tool, named Hecataeus, which enables the user to predict and regulate the impact of evolution process over a database-centric environment. Specifically, Hecataeus enables the user to visualize the evolution graph of a database –centric environment from SQL source code. It provides many features for editing the properties of the graph and modifying its layout. The enrichment of the graph with evolution semantics, i.e., events that modify the database schema of the environment and policies that dictate the reaction of the graph to these events, gives the user the ability to create evolution scenarios that forecast the impact of the evolution process before it is applied to a production environment. To this end, a set of metrics that exploit the graph theoretic properties of the evolution graph and indicate sensitive parts of the configuration are incorporated into the tool.
Special acknowledgments are given to Kostis Kyzirakos and Fotini Anagnwstou (former undergraduate students) for their huge efforts towards the design and development of Hecataeus. In [Kyzi05], a first version of Hecataeus to modeling SQL constructs as graphs is presented, where the model of chapter 2 is fully implemented. In [Anag07], Hecataeus is enhanced with capabilities for the definition of evolution events and policies, the impact prediction of events and the XML representation.

137
7. CONCLUSIONS AND FUTURE WORK
7.1 Conclusions
In this thesis, we have addressed the problem of database schema evolution with the introduction of a rule – based framework that regulates the impact of evolution processes. The problem of schema evolution in database centric environments exists in the fact that alterations occurring on the schema of database objects affect a numerous of database objects and software constructs that are dependent on the evolved objects. The impact of these alterations on other constructs can be either syntactical, e.g., a change may evoke a compilation or execution failure during the execution of a piece of code; or semantic, e.g., a change may have an effect on the semantics of the software used. Both ways require by the administrators/developers the redefinition and if necessary the recompilation of the affected constructs, so that these adhere to the new semantics.
To deal with the above issues, we introduced a framework for the automatic detection of the parts of the system, which are affected by an evolution change and the regulation of their reaction to this change. The framework is based on a graph representation of a database-centric environment. We proposed a graph modeling technique that uniformly covers relational tables, views, database constraints and SQL queries as first class citizens. We employed a graph theoretic approach and we mapped the aforementioned constructs to a graph, that we called Evolution Graph. The graph was furthermore annotated with evolution semantics that facilitate the impact analysis and regulation of schema evolution. We defined events on the nodes of the graph which are mapped to evolution changes that occur on parts of a database. Constructs of the graph were, then, enriched with rules, namely policies, that allow the developer to specify the behavior of the affected constructs whenever events that alter the database graph occur. The combination of an event with a policy determined by the designer/administrator triggers the execution of the appropriate action that either blocks the event, or highlights properly the graph to adapt to the proposed change. Additionally, we

138
proposed a set of language SQL extensions that enables the implementation of the proposed framework for the management of evolution. For extending a system catalog with extra infor-mation regarding evolution metadata, we provided extensions to SQL regarding both top level construct definitions, such as tables, views, and queries, as well as fine grain constructs such as attributes, conditions of views/queries, and database constraints. Moreover, we provided a principled way for defining the proposed evolution semantics and in the same time minimizing the user effort. Most importantly, the experimental evaluation of the framework was performed over a real-case database environment.
To this end, we studied the structural properties of the evolution graph for the definition of a set of metrics related to the evolution capabilities of database-centric environments. The metrics were categorized into (a) future-agnostic graph-based metrics, building upon the properties of the nodes of the graph. Graph theoretic properties like the degrees of a node reveal how interrelated to other nodes a certain node is. (b) Future-aware metrics that extended the previous simple model with a hypothesis for the evolution events that will occur in the future and lastly (c) policy-aware metrics that took into consideration the special role of policies defined on the graph. We also provided an experimental evaluation of the proposed metric set over various configurations in the setup of a reference database environment and assessed both the effectiveness of the proposed metrics (i.e., how well do they actually predict the impact of evolution events to a design construct) and how different design alternatives for the same schema behaved with respect to evolution. Lastly, a software tool, called Hecataeus, was developed in the context of this thesis incorporating the concepts and functionality of the proposed framework.
The concept of rule-based management of schema evolution, which is considered in this thesis, suggests that affected constructs do not always align towards retaining the same semantics before and after the evolution process. Their adaptation to the evolved semantics is dictated by the users with the use of policies. For instance, the propagation of the addition of a new attribute in the database schema towards objects referring to the evolved relation such as queries and views results in evolving the semantics of these objects as well. Such changes may, in turn, be propagated towards other dependent objects, inducing the semi-automatic redefinition of a whole path of dependent objects. The identification and regulation by the user of this impact before the evolution process occurs is one of the basic features and contributions of this thesis.
Another interesting aspect of this thesis is the evaluation of the design of a database – centric environment and the correlation with its evolution capabilities. The proposed set of metrics measure in a principled way the vulnerability to evolution of the design of a database – centric environment and identify these configurations that are most appropriate for sustaining evolution changes without great reengineering effort.
We believe that the introduced framework can be practically applied to a variety of current database – centric configurations and technologies. We have already elaborated the

139
application of our framework over a real-case datawarehouse configuration [PVSV07], [PVSV09] as presented in chapter 3. In that case, the sources of ETL workflows evolved over time and the ETL activities were affected and adapted to evolution events. Similarly, the scenario which involved the evolution of the data warehouse schema (i.e., change of dimensions) and the regulation of its impact on the workload of the warehouse was experimentally performed in chapter 5. In the same manner, we believe that the application of the framework to almost all kinds of database-centric systems can be beneficial for their evolution, especially for distributed environments where changes are performed locally affecting however a large number of dependent objects and applications. For instance, peer to peer databases are considered to be a representative example where evolution is performed independently in peers and affects other peers.
7.2 Future Work
The database schema evolution problem as posed in this thesis has long term research challenges that spread across technologies (O-O approach, XML, etc.) and design solutions. As stressed, the introduced framework addresses some of these challenges, but also raises a plethora of others that may require further research efforts. Some interesting directions for future work related to our approach could be the following:
Incorporation of other data models to the evolution graph: Our framework represents a relational approach to the database schema and its evolution. The incorporation of other approaches, such as XML, to the evolution graph as well as the mapping of evolution events occurring on XML schemas to events on the evolution graph would be a very interesting issue.
Patterns of evolution sequences: Another research goal that can be pursued is the identification of patterns of evolution sequences. The evolution of the database schema within an information system may occur throughout its entire lifecycle. An interesting issue is related to finding out patterns of transformations that are most common in each phase of the lifecycle and incorporate their handling into our framework. For instance,
• During the development phase, a proportional large number of deletions of entities (i.e., attributes, constraints and relations) occur in comparison to other phases of the lifecycle.
• During the normalization / denormalization process, the main evolution transformations comprise additions / deletions of PK and FK constraints to the involved relations.
• In the context of a data warehouse, slowly changing dimensions induce the modification (additions/deletions) of FK in the fact table, which is however less common than the modification of measures.

140
Patterns in the evolution of the database schema can be further observed in the context of the kind of information system employed (DW, WebIS, etc.). In most occasions, evolution processes can be decomposed in standard sequences of evolution events, which are performed in the database schema. For instance, in a relational data warehouse environment the addition of a dimension involves the sequence of essential evolution events, such as the addition of the dimension relation, the addition of a FK to the fact table, etc.
Patterns of evolution adaptations – optimization techniques: Apart from the patterns of evolution events occurring on a database schema, a similar research goal would be the investigation for patterns related to the impact that these events have on affected queries and views. Such patterns depend strongly on the functionality of the affected queries and views. To mention an example, again in an ETL environment, the majority of evolution events occurred at the sources is propagated and absorbed by the queries included in the ETL activities, while only few activities retain their old functionality when they are affected by changes. Other examples include modification queries (especially insert into) which in general propagate changes to their definitions, or views that act as macros to the underlying tables. The common reaction of affected constructs to evolution events can be further investigated in several contexts of database-centric environments. Repetitive patterns in the evolution of a database schema can help the administrator decide upon the appropriate policy set that must be applied on the graph and thus handle more effectively forthcoming evolution events. For instance, if in a data warehouse context, additions of dimensions result in most cases in the addition of grouping attributes in most of the affected queries, then a policy set comprising propagate policies for most queries is most optimal.
Towards this direction, a promising research subject is related with optimization techniques for defining appropriate policies on the graph. That means the administrator must define these policies on the graph and thus regulate the evolution in a way such that the human interaction for the affected objects to be minimized.
Evolution Benchmark: In [CMTZ08] the need for a benchmark for schema evolution is stressed. This need is enforced by the fact that numerous approaches and tools for schema evolution exist in the literature without however being practically evaluated and compared in a common testbed. For example, each approach addresses different cases of evolution under different contexts and technologies. Therefore, a benchmark for schema evolution should have some specific characteristics, such as a commonly agreed set of evolution events that occur on the database schema, a standard set of workload for the database, and most importantly a set of measurable parameters for the impact of evolution.
ECA rules for schema evolution: The policy-regulated technique of the proposed framework resembles the approach of Event-Condition-Action (ECA) rules of active databases on the grounds that the combination of an evolution event with a condition (i.e., policy defined on the node) raises an action (i.e., assignment of a status) on the graph. Current RDBMS support ECA rules for schema modifications with the form of schema

141
triggers [ORAC10g]. However, these triggers do not raise schema modifications to other database objects but only perform DML actions to existing tables. An interesting research problem would be the integration of the policy regulated technique into a framework of ECA rules for schema changes that would also involve schema modifications to queries and views.
Hecataeus: Lastly, a challenging direction for future work concerns Hecataeus itself. Hecataeus is an ongoing project which can be enhanced with numerous and powerful features. A first one could be the integration of the tool with all commercial RDBMS (e.g., with ODBC connections) so that schema definitions can be automatically derived from the database catalogue and backwards evolution transformations can be directly applied on database schemas. A second one concerns the automatic restructuring of the graph after it has been assigned with statuses regarding evolution and the production of SQL source code from the transformed graph for all database objects.


143
BIBLIOGRAPHY
[Alle02] E. B. Allen. Measuring Graph Abstractions of Software: An Information-Theory Approach. In IEEE METRICS, pp.182-193, 2002.
[Anag07] F. Anagnostou. HecataeusII: A Software System for Database Schema Representation and Evolution. Diploma Thesis. School of Electrical and Computer Engineering, National Technical University of Athens, November 2007.
[ArLi03] M.Arenas, L.Libkin. An Information Theoretic Approach to Normal Forms for Relational and XML Data. In Proceedings of the 22nd ACM SIGACT-SIGMOD-SIGART Symposium on Principles of Database Systems (PODS’03), June 9-12, 2003, San Diego, CA, USA.
[Bane87] J. Banerjee et al. Semantics and implementation of schema evolution in object-oriented databases. In Proceedings of ACM SIGMOD. San Francisco, California, May 1987.
[BaOO02] N. H. Balkir, G. Ozsoyoglu, Z. M. Ozsoyoglu. A Graphical Query Language: VISUAL And Its Query Processing. IEEE Transactions on Knowledge and Data Engineering, 14(5), pp. 955-978, 2002.
[Bell02] Z. Bellahsene. Schema evolution in data warehouses. In Knowledge and Information Systems, 4, pp.283-304, 2002.
[Ber+05] G. Berenguer, R. Romero, J. Trujillo, M. A. Serrano, M. Piattini. A Set of Quality Indicators and their Corresponding Metrics for Conceptual Models of Data Warehouses. In Proceedings of the 7th International Conference on Data Warehousing and Knowledge Discovery (DaWaK ’05), Copenhagen, Denmark, August 2005.

144
[BeLP00] P. Bernstein, A. Levy, R. Pottinger. A Vision for Management of Complex Models. In SIGMOD Record, vol. 29, no. 4, pp. 55-63, Dec. 2000.
[BeRa00] P. Bernstein, E. Rahm. Data Warehouse Scenarios for Model Management. In Proceedings of the 19th International Conference on Conceptual Modeling (ER 2000), pp. 1-15, 2000.
[Bern03] P. Bernstein. Applying Model Management to Classical Meta Data Problems. In Proc. of the CIDR Conference, Asilomar, California. January 2003.
[BlSH99] M. Blaschka, C. Sapia, G. Höfling. On Schema Evolution in Multidimensional Databases. In Proceedings of the 1st International Conference on Data Warehousing and Knowledge Discovery (DAWAK’99), pp. 153-164, Florence, Italy, 1999.
[BoKe00] M. Bouzeghoub, Z. Kedad. A Logical Model for Data Warehouse Design and Evolution. In Proceedings of the 2nd International Conference on Data Warehousing and Knowledge Discovery (DAWAK’00), pp. 178-188, London, UK, September 2000.
[BrMB96] L. Briand, S. Morasca, V. Basili. Property-Based Software Engineering Measurement. In IEEE Transactions on Software Engineering, 22(6), pp.68-86, 1996.
[CaPG01a] C.Calero, M.Piattini, M.Genero. A Case Study with Relational Database Metrics. In Proceedings of the ACS/IEEE International Conference on Computer Systems and Applications (AICCSA ’01), 2001.
[CaPG01b] C.Calero, M.Piattini, M.Genero. Empirical Validation of Referential Integrity Metrics. In Information and Software technology 43, pp. 949-957, 2001.
[CaPi87] R. Cavallo, M. Pittarelli. The theory of probabilistic databases. In Proceedings of the 13th International Conference on Very Large Data Bases (VLDB ‘87), September 1-4, 1987, Brighton, England.
[CCLB97] T. Catarci, M. F. Costabile, S. Levialdi, C. Batini. Visual Query Systems for Databases: A Survey. In Journal of Visual Languages and Computing, 8(2), pp. 215-260, 1997.
[ChPr03] S.S.Cherfi, N.Prat. Multidimensional Schemas Quality: Assessing and Balancing Analyzability and Simplicity. In ER (Workshops) pp. 140-151, 2003

145
[CMTZ08] C. A. Curino, H. J. Moon, L. Tanca, C.Zaniolo. Schema Evolution in Wikipedia - Toward a Web Information System Benchmark. In 10th International Conference on Enterprise Information Systems (ICEIS '08), Barcelona, Spain, June 2008.
[CPPS01] C.Calero, M.Piattini, C.Pascual, M.Serrano. Towards Data Warehouse Quality Metrics. In Proceedings of the 3rd Intl. Workshop on Design and Management of Data Warehouses, DMDW'2001, Interlaken, Switzerland, June 4, 2001.
[CSPL01] C. Calero, H. A. Sahraoui, M. Piattini, H. Lounis. Estimating Object-Relational Database Understandability Using Structural Metrics. In Proceedings Database and Expert Systems Applications, 12th International Conference, DEXA 2001 Munich, Germany, September 3-5, 2001.
[DaLe88] J.S.Davis, R.J. LeBlanc. A Study of the Applicability of Complexity Measures. In IEEE Transactions on Software Engineering 14(9): pp.1366-1372, 1988.
[DaRo00] M.M.Dalkilic, E.L.Robertson. Information Dependencies. In Proceedings of the 19th ACM SIGMOD-SIGACT-SIGART Symposium on Principles of Database Systems (PODS’00), May 15-17, 2000, Dallas, Texas, USA.
[FaBB07] C. Favre, F. Bentayeb, O. Boussaid. Evolution of Data Warehouses' Optimization: A Workload Perspective. In Proceedings of the 9th International Conference on Data Warehousing and Knowledge Discovery (DaWaK’07), Regensburg, Germany, September 2007.
[FaPo04] H. Fan, A. Poulovassilis. Schema Evolution in Data Warehousing Environments - A Schema Transformation-Based Approach. In Proceedings of the 23rd International Conference on Conceptual Modeling (ER’04), pp. 639-653, 2004.
[Fent94] N. Fenton. Software Measurement: A Necessary Scientific Basis. In IEEE Transactions on Software Engineering, 20(3), pp. 199-206, 1994.
[Fer+95] F. Ferrandina, T. Meyer, R. Zicari, G. Ferran, J. Madec. Schema and Database Evolution in the O2 Object Database System. In Proceedings of 21th International Conference on Very Large Data Bases(VLDB’95), pp.170-181, September 11-15, 1995, Zurich, Switzerland.

146
[GMRR01] A. Gupta, I. S. Mumick, J. Rao, K. A. Ross. Adapting materialized views after redefinitions: Techniques and a performance study. In Information Systems, 26, pp.323-362, 2001.
[GCMP91] R. Gray, B. Carey, N. McGlynn, A. Pengelly. Design metrics for database systems. BT Technology J., 9(4), pp. 69-79, 1991.
[GOPR01] M.Genero, J.Olivas, M.Piattini, F.Romero. Using Metrics to predict OO Information Systems Maintainability. In Proceedings of the 13th International Conference on Advanced Information Systems Engineering, CAISE’01, Interlaken, Switzerland, June 4-8, 2001.
[GPCS00] M.Genero, M.Piattini, C.Calero, M.Serrano. Measures to get better quality databases. In Proceedings of the 2nd International Conference on Enterprise Information Systems, ICEIS’00, Stafford, UK, July 4-7.
[GLRV04] M. Golfarelli, J. Lechtenbörger, S. Rizzi, G. Vossen. Schema Versioning in Data Warehouses. In 3rd International Workshop on Evolution and Change in Data Management (ECDM ’04), ER’ 2004 Workshops, pp. 415–428, 2004
[Harr92] W.Harrison. An Entropy-Based Measure of Software Complexity. In IEEE Transactions on Software Engineering 18(11), pp. 1025-1034, 1992.
[HFLP89] L. M. Haas, J. C. Freytag, G. M. Lohman, H. Pirahesh. Extensible Query Processing in Starburst. In Proceedings of the 1989 ACM SIGMOD International Conference on Management of Data, Portland, Oregon, May 31 - June 2, 1989.
[HSQL] HSQL Database Engine: http://hsqldb.org
[JaTh03] H. Jaakkola, B. Thalheim. Visual SQL - High-Quality ER-Based Query Treatment. In ER (Workshops) 2003: 129-139
[JJQV99] M.Jarke, M.A. Jeusfeld, C.Quix, P.Vassiliadis. Architecture and Quality in Data Warehouses: An Extended Repository Approach. In Information Systems, 24(3): pp. 229-253, 1999.
[JUNG] Java Universal Network/Graph Framework (JUNG): http://jung.sourceforge.net/index.html
147
[KaPR04] C. Kaas, T. B. Pedersen, B. Rasmussen. Schema Evolution for Stars and Snowflakes. In Proceedings of the 6th International Conference on Enterprise Information Systems (ICEIS’04), pp. 425-433, 2004.
[KaSj01] A. Karahasanovic, D. I. K. Sjøberg. Visualizing Impacts of Database Schema Changes - A Controlled Experiment. In International Symposium on Human-Centric Computing Languages and Environments(HCC 2001), Stresa, Italy, September, 2001.
[Kesh95] S. Kesh. Evaluating the quality of Entity Relationship Models. In Information and Software Technology, 37 (12), pp. 681-689, 1995.
[Kimb96] R. Kimball. Slowly Changing Dimensions, Data Warehouse Architect, DBMS Magazine, April 1996, http://www.dbmsmag.com
[KiSW95] K.Kim, Y.Shin, C.Wu. Complexity Measures for Object-Oriented Program Based on the Entropy. In Proceedings of the 2nd Asia-Pacific Software Engineering Conference (APSEC '95), December 6-9, 1995, Brisbane, Queensland, Australia.
[Kyzi05] K. Kyzirakos. Hecataeus: A Software System for Representing SQL Constructs as Graphs. Diploma Thesis. School of Electrical and Computer Engineering, National Technical University of Athens, October 2005.
[LaSS01] L.V.S. Lakshmanan, F. Sadri, I.N. Subramanian. SchemaSQL – An Extension to SQL for MultiDatabase Interoperability. In ACM Transactions on Database Systems 26(4), pp.476-519, 2001.
[Lee87] T. T. Lee. An information Theoretic analysis of relational Databases-Part I : Data Dependencies and Information Metric. In IEEE Transactions on Software Engineering, Vol. SE-13, No. 10, pp. 1049-1061, October 1987.
[LeLo03] M. Levene, G. Loizou, Why is the snowflake schema a good data warehouse design? In Information Systems Journal, 28(3): pp. 225-240, 2003.
[LiCC94] C.T. Liu, P.K. Chrysanthis, S.K. Chang. Database schema evolution through the specification and maintenance of changes on entities and relationships. In Proceedings of the International Conference on Entity-Relationship Approach (ER ’94), p.132-151. Manchester, U.K., Dec 1994.
[Malv86] F. M. Malvestuto. Statistical Treatment of the information content of a database. In Information Systems, Vol.11, No. 3, pp. 211-233, 1986.

148
[McSn90] L. E. McKenzie, R. T. Snodgrass. Schema Evolution and the Relational Algebra. In Information Systems, Vol.15, No 2, pp. 207-232, 1990.
[Meln04] S. Melnik. Generic Model Management - Concepts and Algorithms. LNCS 2967 - Springer-Verlag Berlin 2004.
[MoDo96] M. Mohania, D. Dong. Algorithms for adapting materialized views in data warehouses. In Proceedings of 8th international symposium on cooperative database systems for advanced applications (CODAS ‘96), p.309-316. Kyoto, Japan, Dec 1996.
[Mood98] D.L.Moody. Metrics for evaluating the Quality of Entity Relationship Models. In Proceedings of the 17th International Conference on Conceptual Modeling (ER’ 98), Singapore, November 1998, 213-225.
[MuGP98] N. Murray, C. A. Goble, N. W. Paton. A Framework for Describing Visual Interfaces to Databases. In Journal of Visual Languages and Computing, 9(4), pp.429-456, 1998.
[NaKa01] K.K.Nambiar, V.Kannoth. Generic Dependencies and Database Design. In International Journal on Computers and Mathematics with Applications, 41, pp. 281-288, 2001.
[NiLR98] A. Nica, A. J. Lee, E. A. Rundensteiner. The CSV algorithm for view synchronization in evolvable large-scale information systems. In Proceedings of International Conference on Extending Database Technology (EDBT ‘98). Lectures notes in computer science, Springer, p.359-373. Valencia, Spain, Mar 1998.
[ORAC10g] Oracle® Database SQL Reference 10g Release 2 (10.2). Chapter 16: SQL Statements: CREATE SYNONYM to CREATE TRIGGER.
[PaKi95] A. Papantonakis, P. J. H. King. Syntax and Semantics of Gql, a graphical query language. In Journal of Visual Languages and Computing, 6(1),pp. 3-25, 1995.
[Papo90] A. Papoulis. Probability & statistics, Englewood Cliffs, NJ.Prentice Hall, c1990.

149
[Pap+08] G. Papastefanatos, P.Vassiliadis, A.Simitsis, K.Aggistalis, F.Pechlivani, Y.Vassiliou. Language Extensions for the Automation of Database Schema Evolution. In 10th International Conference on Enterprise Information Systems (ICEIS '08), Barcelona, Spain, June 2008.
[PaVV05] G. Papastefanatos, P. Vassiliadis, Y. Vassiliou. Adaptive Query Formulation To Handle Database Evolution (Extended Version). In 18th Conference on Advanced Information Systems Engineering (CAiSE ‘06) CAiSE Forum, Luxembourg, June 2006.
[PAVV08] G. Papastefanatos, F. Anagnostou, Y. Vassiliou, P. Vassiliadis. Hecataeus: A What-If Analysis Tool for Database Schema Evolution. In 12th European Conference on Software Maintenance and Reengineering (CSMR '08), Athens, Greece, 1-4 April, 2008.
[PiGC01] M.Piattini, M.Genero, C.Calero. Table Oriented metrics for relational databases. In Software Quality Journal, 9, pp. 79-97, 2001.
[PiGC02] M. Piattini, M.Genero, C. Calero. Data Model Metrics. Handbook of Software Engineering and Knowledge Engineering, Vol II, 2002.
[PKVV05] G. Papastefanatos, K. Kyzirakos, P. Vassiliadis, Y. Vassiliou. Hecataeus: A Framework for Representing SQL Constructs as Graphs. In 10th International Workshop on Exploring Modeling Methods for Systems Analysis and Design - EMMSAD '05 (in conjunction with CAISE'05) - Oporto, Portugal, June 2005.
[PVSV07] G. Papastefanatos, P. Vassiliadis, A. Simitsis, Y. Vassiliou. What-if Analysis for Data Warehouse Evolution. In 9th International Conference on Data Warehousing and Knowledge Discovery (DaWaK '07), Regensburg, Germany, 3-7 September, 2007.
[PVSV08] G. Papastefanatos, P. Vassiliadis, A. Simitsis, Y. Vassiliou. Design Metrics for Data Warehouse Evolution. In Proceedings of the 27th International Conference on Conceptual Modeling (ER 2008), Barcelona, Spain, October 2008.
[PVSV09] G. Papastefanatos, P.Vassiliadis, A.Simitsis, Y.Vassiliou. Policy-regulated Management of ETL Evolution. In Journal on Data Semantics - XIII: Special Issue "Semantic Data Warehouses", 2009 (to appear)

150
[RaRu95] Y. G. Ra, E. A. Rundensteiner. A transparent object-oriented schema change approach using view evolution. In Proceedings of the Eleventh International Conference on Data Engineering (ICDE ‘95), p.165-172, Taipei, Taiwan, March 1995.
[Rodd92a] J.F. Roddick. SQL/SE - A Query Language Extension for Databases Supporting Schema Evolution. In SIGMOD Record 21(3), pp.10-16, September 1992.
[Rodd92b] J.F. Roddick. Schema Evolution in Database Systems – An Annotated Bibliography. In SIGMOD Record 21(4), pp.35-40, December 1992.
[Rodd95] J.F. Roddick. A Survey of Schema Versioning Issues for Database Systems. In Information Software Technology, 37(7), pp.383-393, 1995.
[Rodd00] J.F. Roddick, L. Al-Jadir, L.E. Bertossi, M. Dumas, F. Estrella, H. Gregersen, K. Hornsby, J. Lufter, F. Mandreoli, T. Männistö, E. Mayol, L. Wedemeijer. Evolution and Change in Data Management - Issues and Directions. SIGMOD Record 29(1): pp.21-25, 2000.
[RuLN97] E. A. Rundensteiner, A. J. Lee, A. Nica. On preserving views in evolving environments. In Proceedings of the 4th KRDB Workshop, pp.13.1–13.11. Athens, Greece, Aug 1997.
[SVTS05] A. Simitsis, P. Vassiliadis, M. Terrovitis, S. Skiadopoulos. Graph-Based Modeling of ETL Activities with Multi-level Transformations and Updates. In Proceedings of the Seventh International Conference on Data Warehousing and Knowledge Discovery (DaWaK’05), pp. 43-52, 2005.
[Sjob93] D. Sjoberg. Quantifying Schema Evolution. In Information and Software Technology, 35(1): pp. 35-44, 1993.
[TPCD07] The TPC BENCHMARK™ DS, www.tpc.org/tpcds/spec/tpcds1.0.0.d.pdf, April 2007.
[TsKl78] D. Tsichritzis, A.C. Klug. The ANSI/X3/SPARC DBMS Framework Report of the Study Group on Database Management Systems. In Information Systems 3(3), pp. 173-191, 1978.
[UnLeip] Caravela 2.0. Publication Categorizer for Schema Evolution and Data Cleaning. University of Leipzig, http://pubs.dbs.uni-leipzig.de

151
[UrHM04] S. Urman, R. Hardman, M. McLaughlin. Oracle Database 10g PL/SQL Programming. Oracle Press, 2004.
[VaBQ00] P.Vassiliadis, M.Bouzeghoub, C.Quix. Towards Quality-oriented Data Warehouse Usage and Evolution. In Information Systems 25(2), pp. 89-115, 2000.
[Vass00] P.Vassiliadis. Data Warehouse Modeling and Quality Issues. PhD Thesis. National Technical University of Athens, Athens 2000.
[VeMP03] Y. Velegrakis, R. Miller, L. Popa. Mapping Adaptation under Evolving Schemas. In Proceedings of 29th International Conference on Very Large Data Bases (VLDB’04), pp. 584-595, Berlin, Germany, September 2003.
[VeMP04] Y. Velegrakis, R. Miller, L. Popa. Preserving Mapping consistency under schema changes. In VLDB Journal, 13, pp. 274-293, 2004.
[Wede00] L. Wedemeijer. Defining Metrics for Conceptual Schema Evolution. In Proceedings of the 9th International Workshop on Foundations of Models and Languages for Data and Objects, FMLDO’00, Dagstuhl Castle, Germany, September 18-21, 2000.
[Zuse98] H. Zuse. A framework of Software Measurement, 1998, Berlin, Walter de Gruyter.


153
APPENDIX
The following tables present an overall picture of our framework. In Table A.1, potential events tested by the designer/administrator are depicted in the first column of the table. The two rightmost columns depict possible policies that the administrator could have set and the macro level actions by our approach. Per event, we present the candidate modules for change and the type of impact (i.e., semantic or syntactical) the change has on them.

154
Event on source schema
Candidate Modules For Change
Impact Prevailing Policy*
Action
Add A 1.Queries/views that must include the added attribute in the SELECT clause 2.Queries/views with SELECT * clause that must exclude the added attribute
Semantic Policy = P Include attribute in SELECT clause Policy = B Rewrite SELECT clause excluding added
attribute Policy = ? One of the above
C Queries/views referring to the relation/view over which the condition is added
Semantic Policy = P Leave query intact Policy = B Retain old view (without the added condition)
and all queries with block policy refer to the old view
Policy = ? One of the above R / V No direct
impact
Delete A Queries/views referring to this attribute (i.e. in the SELECT clause, WHERE clause, etc.)
Syntactical, Semantic
Policy = P Remove deleted attribute from query/view definition (i.e., SELECT, WHERE, GROUP BY clause)
Policy = B Rewrite properly query/view in order to be valid.
Policy = ? One of the above C Queries/views referring to
relation/view from which the condition is removed
Semantic Policy = P Leave query intact Policy = B Retain old view (including the original
condition) and all queries with block policy refer to the old view
Policy = ? One of the above R / V Queries/views referring to
relation/view Syntactical, Semantic
Policy = P Remove relation from query/view definition (i.e., FROM clause) along with the attributes and conditions involving this relation (i.e., SELECT, WHERE, GROUP BY clauses)
Policy = B Rewrite properly query/view in order to be valid
Policy = ? One of the above Modify/ Rename
A Queries/views referring to this attribute (i.e. in the SELECT clause, WHERE clause, etc.)
Syntactical, Semantic
Policy = P Rename modified attribute in the query/view definition (i.e., SELECT, WHERE, GROUP BY clause, etc)
Policy = B Rewrite properly query/view in order to be valid.
Policy = ? One of the above C Queries/views referring to
relation/view of which the condition is modified
Semantic Policy = P Leave query intact Policy = B Retain old view (including the original
condition) and all queries with block policy refer to the old view
Policy = ? One of the above R / V Queries/views referring to
relation/view Syntactical, Semantic
Policy = P Rename relation in the query/view definition (i.e., FROM clause)
Policy = B Rewrite properly query/view in order to be valid.
Policy = ? One of the above * Policy Types: P=Propagate, B =Block, ?=Prompt (def)
Table A.1: Macro level actions dictated by framework for several kinds of events.

155
In Table A.2, the statuses, i.e., the actions dictated at the detailed level of nodes, assigned to visited nodes by Propagate Changes Algorithm for combinations of events and types of nodes are shown, when propagate policy prevails on the visited node. For each status the new event induced by the assignment of a node with status, which is further propagated to the graph, is also shown.
Event on the graph
On node Scope1 Status Raised Event
Add
R/V/Q None
affected N/A N/A N/A
A
R S Add Child Add Attribute
V S, P Add Child Add Attribute
Q S, P Add Child Add Attribute
C P Modify Provider Modify Condition
C
R C Add Child Add Condition
V S, P Add Child,
Modify Provider Add Condition, Modify Condition
Q S, P Add Child,
Modify Provider Add Condition, Modify Condition
A S Add Child Add Condition
GB V S, P
Add Child, Modify Provider
Add GB, Modify GB
Q S, P Add Child,
Modify Provider Add GB, Modify GB
OB V S, P
Add Child, Modify Provider
Add OB, Modify OB
Q S, P Add Child,
Modify Provider Add OB, Modify OB
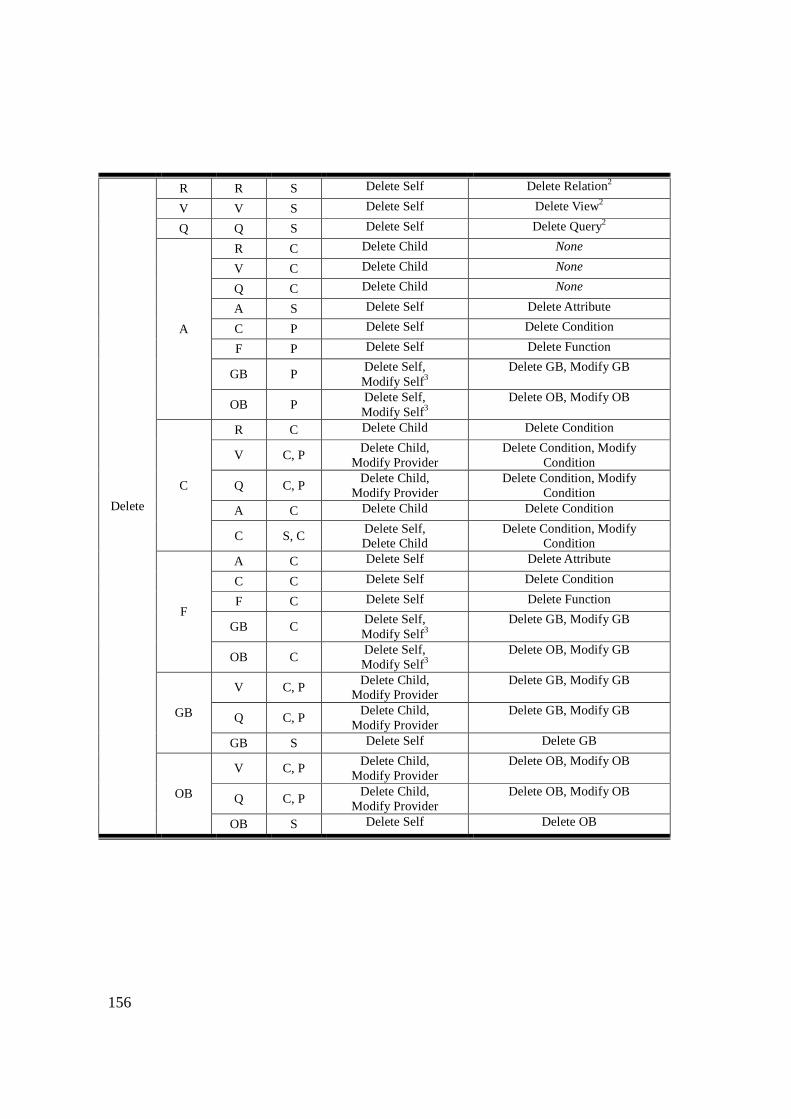
156
Delete
R R S Delete Self Delete Relation2
V V S Delete Self Delete View2
Q Q S Delete Self Delete Query2
A
R C Delete Child None
V C Delete Child None
Q C Delete Child None
A S Delete Self Delete Attribute
C P Delete Self Delete Condition
F P Delete Self Delete Function
GB P Delete Self, Modify Self3
Delete GB, Modify GB
OB P Delete Self, Modify Self3
Delete OB, Modify OB
C
R C Delete Child Delete Condition
V C, P Delete Child,
Modify Provider Delete Condition, Modify
Condition
Q C, P Delete Child,
Modify Provider Delete Condition, Modify
Condition A C Delete Child Delete Condition
C S, C Delete Self, Delete Child
Delete Condition, Modify Condition
F
A C Delete Self Delete Attribute
C C Delete Self Delete Condition
F C Delete Self Delete Function
GB C Delete Self, Modify Self3
Delete GB, Modify GB
OB C Delete Self, Modify Self3
Delete OB, Modify GB
GB
V C, P Delete Child, Modify Provider
Delete GB, Modify GB
Q C, P Delete Child,
Modify Provider Delete GB, Modify GB
GB S Delete Self Delete GB
OB
V C, P Delete Child,
Modify Provider Delete OB, Modify OB
Q C, P Delete Child,
Modify Provider Delete OB, Modify OB
OB S Delete Self Delete OB
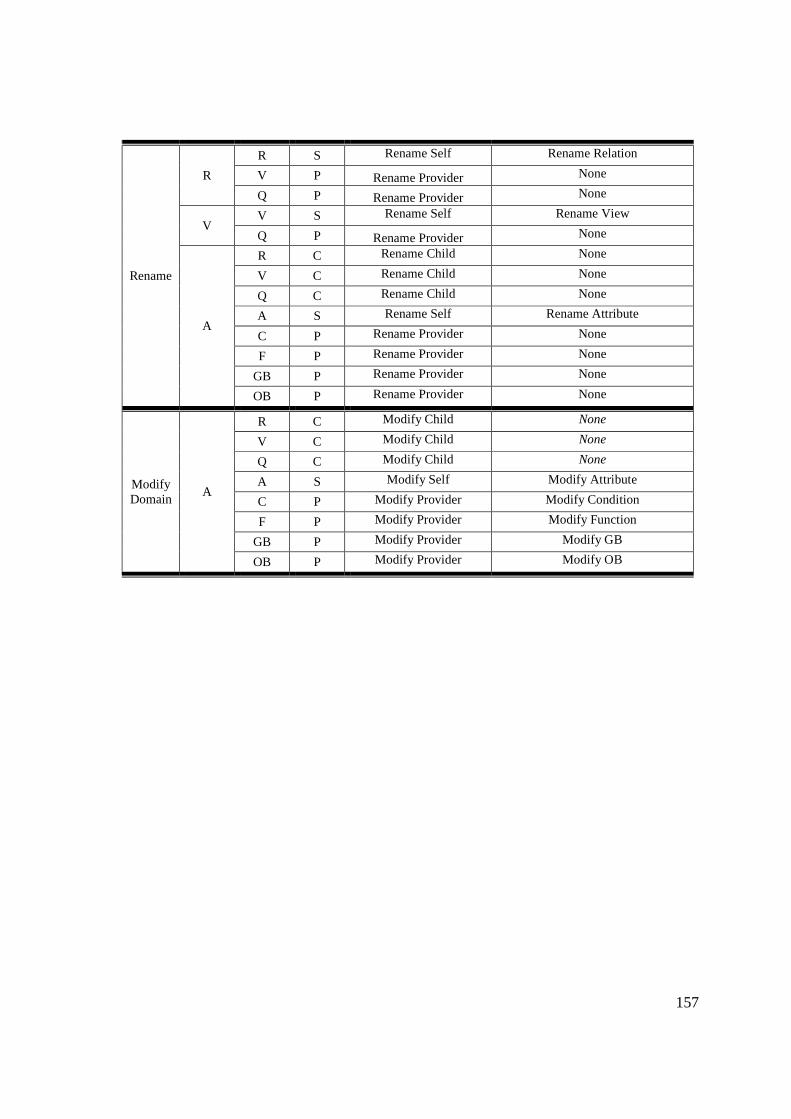
157
Rename
R
R S Rename Self Rename Relation
V P Rename Provider None
Q P Rename Provider None
V V S Rename Self Rename View
Q P Rename Provider None
A
R C Rename Child None
V C Rename Child None
Q C Rename Child None
A S Rename Self Rename Attribute
C P Rename Provider None
F P Rename Provider None
GB P Rename Provider None
OB P Rename Provider None
Modify Domain
A
R C Modify Child None
V C Modify Child None
Q C Modify Child None
A S Modify Self Modify Attribute
C P Modify Provider Modify Condition
F P Modify Provider Modify Function
GB P Modify Provider Modify GB
OB P Modify Provider Modify OB

158
Modify
C
R C Modify Child Modify Condition
V C, D Modify Child,
Modify Provider Modify Condition
Q C, D Modify Child,
Modify Provider Modify Condition
A C Modify Child Modify Condition
C S, C Modify Self, Modify Child
Modify Condition
F
A C Modify Self Modify Attribute
C C Modify Self Modify Condition
GB C Modify Self Modify GB
OB C Modify Self Modify OB
GB V C, D
Modify Child, Modify Provider
Modify GB
Q C, D Modify Child,
Modify Provider Modify GB
OB V C, D
Modify Child, Modify Provider
Modify OB
Q C, D Modify Child,
Modify Provider Modify OB
P P S Modify Self Modify Parameter
C C Modify Self Modify Condition
1Scope: S (SELF), C(CHILD), P(PROVIDER) 2All attributes in the schema are first deleted before Delete Relation, Delete View and Delete Query events occur. 3The value for the status depends on whether GB / OB node have other children. If no other children exist then Delete GB/OB is assigned, Modify GB/OB otherwise.
Table A.2: Statuses assigned to nodes when propagate policy prevails