Policy Brief -...
8
Policy Brief Round 2: Trading Partners Respond The Estimated Impacts of Tariffs on Steel and Aluminum March 13, 2018 Summary President Donald Trump March 8 signed Proclamations imposing tariffs of 25 percent on U.S. imports of steel and 10 percent on U.S. imports of aluminum from all countries except, for now, Canada and Mexico. 1 The Proclamations state the President may “if necessary” raise the tariffs on imports from the remaining countries to unspecified rates to reflect country exclusions. Several U.S. trading partners that remain subject to the duties are expected to seek compensation (referred to here as retaliation) for the negative impacts these tariffs will have on their exports to the United States. This Policy Brief updates our March 5 Policy Brief to examine the potential net impacts on U.S. jobs across all industries of retaliation threatened by U.S. trading partners in response to the imposition of U.S. steel and aluminum tariffs. Dr. Joseph Francois is Professor of Economics, University of Bern, and Managing Director, World Trade Institute. Dr. Francois was the acting director of the Office of Economics at the U.S. International Trade Commission and holds a PhD in economics from the University of Maryland. By Dr. Joseph Francois and Laura M. Baughman Laura M. Baughman is President of Trade Partnership Worldwide, LLC and The Trade Partnership. She holds degrees in economics from Columbia and Georgetown Universities. Trade Partnership Worldwide, LLC/ The Trade Partnership www.tradepartnership.com
Transcript of Policy Brief -...

Policy Brief Round 2: Trading Partners Respond
The Estimated Impacts of Tariffs on Steel and Aluminum
March 13, 2018
1
Summary
President Donald Trump March 8 signed Proclamations imposing tariffs of 25 percent on U.S. imports of steel and 10 percent on U.S. imports of aluminum from all countries except, for now, Canada and Mexico.1 The Proclamations state the President may “if necessary” raise the tariffs on imports from the remaining countries to unspecified rates to reflect country exclusions. Several U.S. trading partners that remain subject to the duties are expected to seek compensation (referred to here as retaliation) for the negative impacts these tariffs will have on their exports to the United States.
This Policy Brief updates our March 5 Policy Brief to examine the potential net impacts on U.S. jobs across all industries of retaliation threatened by U.S. trading partners in response to the imposition of U.S. steel and aluminum tariffs.
Dr. Joseph Francois is Professor
of Economics, University of Bern,
and Managing Director, World
Trade Institute. Dr. Francois was
the acting director of the Office of
Economics at the U.S.
International Trade Commission
and holds a PhD in economics
from the University of Maryland.
By Dr. Joseph Francois and Laura M. Baughman
Laura M. Baughman is President
of Trade Partnership Worldwide,
LLC and The Trade Partnership.
She holds degrees in economics
from Columbia and Georgetown
Universities.
Trade Partnership Worldwide, LLC/ The Trade Partnership
www.tradepartnership.com

2 Policy Brief: Round 2: Trading Partners Respond
“Eighteen jobs are lost for every
one gained.”
2
This Brief updates our March 5 Policy Brief,2 which estimated the potential net impacts on U.S. jobs across all industries of the (then proposed) steel and aluminum tariffs applied to targeted steel and aluminum imports from all countries. We also break down the employment impacts by state.
We find that the tariffs coupled with retaliation would continue to have positive employment impacts on U.S. steel and aluminum producers, as well as a handful of other sectors able to attract capital and labor released from sectors that are harmed by the tariffs and retaliation. However, the tariffs and retaliation would harm workers in other sectors including manufacturers and others who use steel and aluminum. Those positive and negative impacts would ripple through the economy affecting workers in every sector. Briefly, we find:
• The tariffs and retaliation would increase U.S. steel employment and non-ferrous metals (primarily aluminum) employment by 26,346 jobs, but cost a net of 495,136 jobs throughout the rest of the economy, for a total net loss of nearly 470,000 jobs;
• Eighteen jobs would be lost for every steel/aluminum job gained;
• More than two thirds of the lost jobs would affect workers in production and low-skill jobs.
• Every state will experience a net loss of jobs.
3 Policy Brief: Round 2: Trading Partners Respond
1
Results
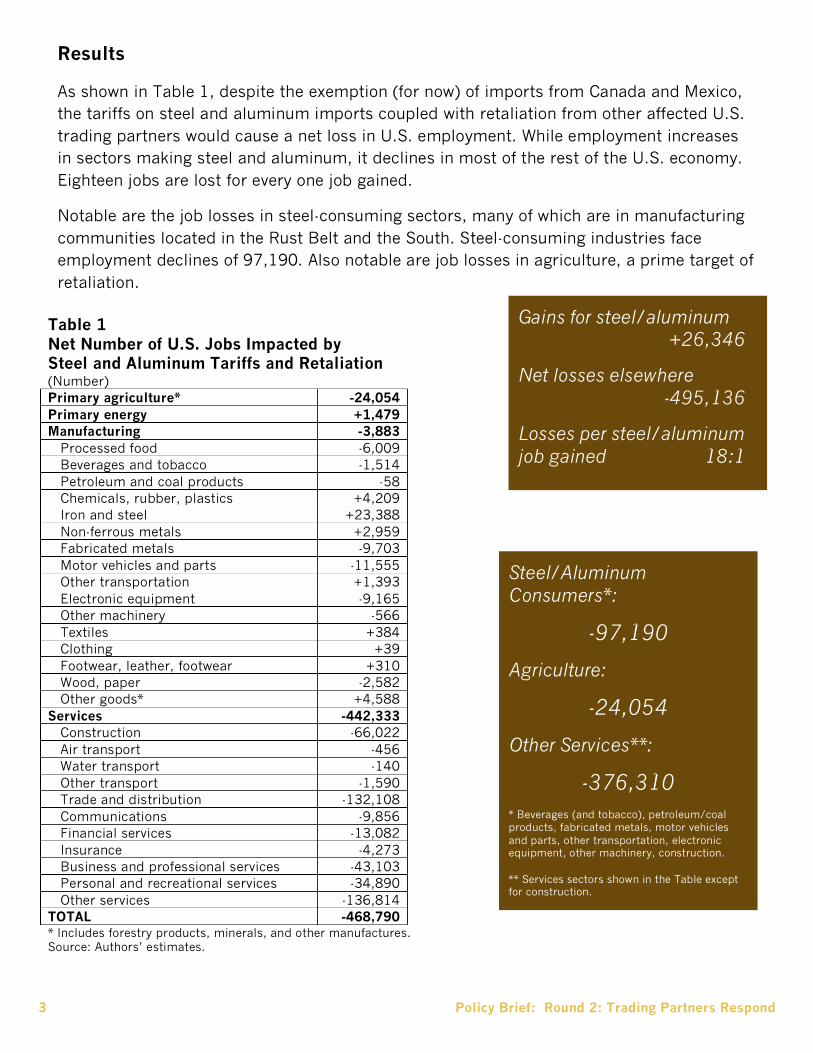
As shown in Table 1, despite the exemption (for now) of imports from Canada and Mexico, the tariffs on steel and aluminum imports coupled with retaliation from other affected U.S. trading partners would cause a net loss in U.S. employment. While employment increases in sectors making steel and aluminum, it declines in most of the rest of the U.S. economy. Eighteen jobs are lost for every one job gained.
Notable are the job losses in steel-consuming sectors, many of which are in manufacturing communities located in the Rust Belt and the South. Steel-consuming industries face employment declines of 97,190. Also notable are job losses in agriculture, a prime target of retaliation.
Table 1 Net Number of U.S. Jobs Impacted by Steel and Aluminum Tariffs and Retaliation (Number) Primary agriculture* -24,054 Primary energy +1,479 Manufacturing -3,883 Processed food -6,009 Beverages and tobacco -1,514 Petroleum and coal products -58 Chemicals, rubber, plastics +4,209 Iron and steel +23,388 Non-ferrous metals +2,959 Fabricated metals -9,703 Motor vehicles and parts -11,555 Other transportation +1,393 Electronic equipment -9,165 Other machinery -566 Textiles +384 Clothing +39 Footwear, leather, footwear +310 Wood, paper -2,582 Other goods* +4,588 Services -442,333 Construction -66,022 Air transport -456 Water transport -140 Other transport -1,590 Trade and distribution -132,108 Communications -9,856 Financial services -13,082 Insurance -4,273 Business and professional services -43,103 Personal and recreational services -34,890 Other services -136,814 TOTAL -468,790 * Includes forestry products, minerals, and other manufactures. Source: Authors’ estimates.
Gains for steel/aluminum +26,346
Net losses elsewhere -495,136
Losses per steel/aluminum job gained 18:1
Steel/Aluminum Consumers*:
-97,190
Agriculture:
-24,054
Other Services**:
-376,310 * Beverages (and tobacco), petroleum/coal products, fabricated metals, motor vehicles and parts, other transportation, electronic equipment, other machinery, construction.
** Services sectors shown in the Table except for construction.

4 Policy Brief: Round 2: Trading Partners Respond
2
Services sectors are hit the hardest for several reasons. First, as the largest component of the U.S. economy, services are key inputs into the output of every U.S. sector, so as manufacturing, agriculture and energy output decline, so too do services output and related jobs. Second, consumers reduced spending when they are hit by higher costs (of a new car, a new washing machine, etc.) and, for many, lost wages from unemployment. As a result, households pull back on spending; services like education, entertainment and even healthcare are on the front lines of the spending reduction impacts, with additional attendant job losses.
We are also able to disaggregate the employment effects by skill level. High-skilled jobs (managers, professionals, technicians and related workers) account for 31 percent of the net job losses. Low-skilled workers (production workers, machine operators, office workers, administrative workers, sales/shops staff, and farm workers) bear the brunt of the tariffs, accounting for 69 percent of the total job losses.
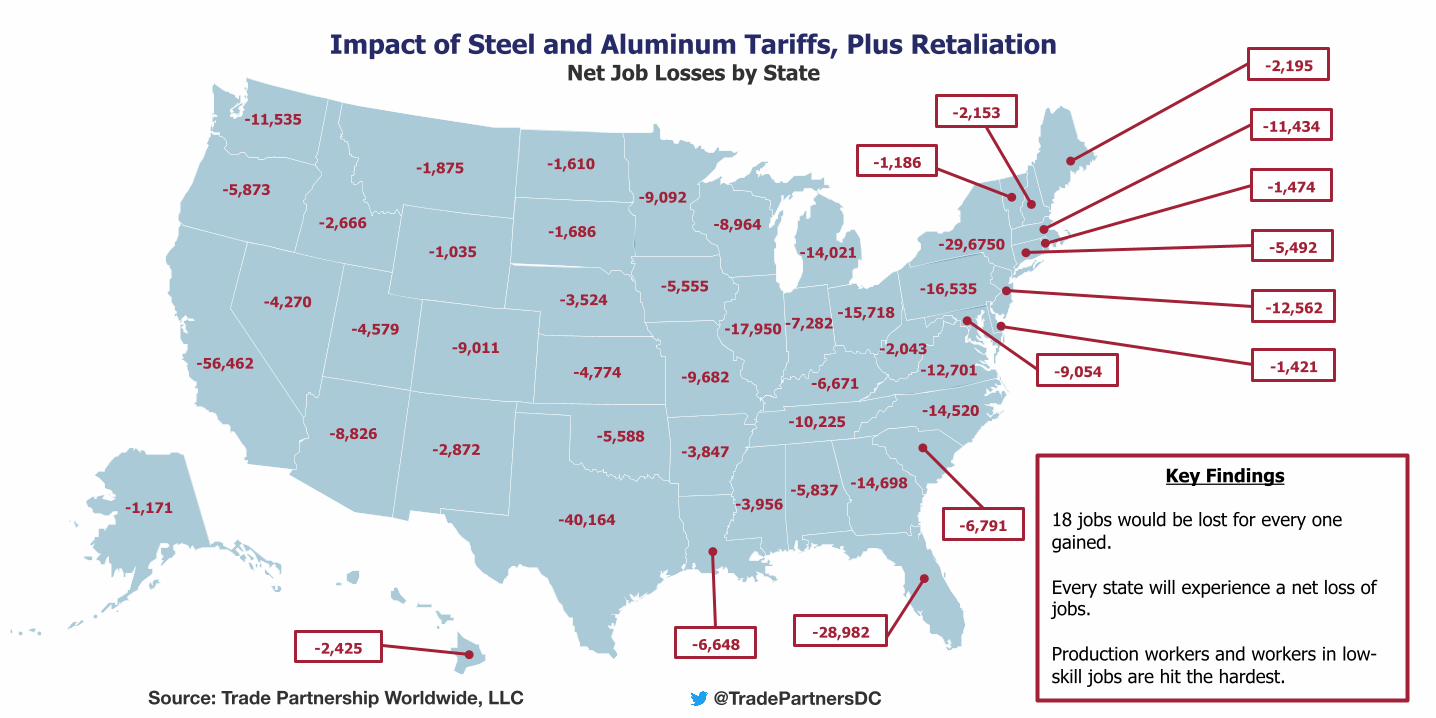
Finally, Table 2 shows that every U.S. state will experience a net loss of jobs as a result of the steel and aluminum tariffs and retaliation. Heaviest hit are California, Texas and New York. But noteworthy are large net employment losses in the states in which the steel and aluminum sector figures prominently: Illinois (-17,950), Indiana (-7,282), Michigan (-14,021), Ohio (-15,718), Pennsylvania (-16,535) and Wisconsin (-8,964).

5 Policy Brief: Round 2: Trading Partners Respond
3
Conclusion
Steel and aluminum tariffs and associated retaliation by U.S. trading partners would reverberate throughout the U.S. economy in ways that will, on balance, reduce U.S. employment. While U.S. steel and aluminum jobs would increase, those gains would come at a high cost to workers in other sectors of the economy.
Endnotes 1. Presidential Proclamation on Adjusting Imports of Steel into the United States, March 8, 2018, https://www.whitehouse.gov/presidential-actions/presidential-proclamation-adjusting-imports-steel-united-states/; Presidential Proclamation on Adjusting Imports of Aluminum into the United States, March 8, 2018, https://www.whitehouse.gov/presidential-actions/presidential-proclamation-adjusting-imports-aluminum-united-states/. 2. The Trade Partnership. “Does Import Protection Save Jobs? The Estimated Impacts of Proposed Tariffs on Imports of U.S. Steel and Aluminum,” Policy Brief, March 5, 2018, http://tradepartnership.com/reports/does-import-protection-save-jobs-the-estimated-impacts-of-proposed-tariffs-on-imports-of-u-s-steel-and-aluminum-2018/.
Table 2 Employment Impact of Steel and Aluminum Tariffs, Plus Retaliation, by State Steel, Other Total Steel, Other Total Aluminum Sectors Impact Aluminum Sectors Impact Alabama +1,291 -7,129 -5,837 Montana +11 -1,886 -1,875 Alaska +2 -1,173 -1,171 Nebraska +83 -3,607 -3,524 Arizona +165 -8,991 -8,826 Nevada +37 -4,307 -4,270 Arkansas +627 -4,473 -3,847 New Hampshire +138 -2,291 -2,153 California +1,217 -57,679 -56,462 New Jersey +213 -12,775 -12,562 Colorado +182 -9,193 -9,011 New Mexico +14 -2,886 -2,872 Connecticut +209 -5,701 -5,492 New York +399 -30,073 -29,675 Delaware +23 -1,445 -1,421 North Carolina +531 -15,051 -14,520 Dist. of Col. +2 -2,070 -2,068 North Dakota +8 -1,618 -1,610 Florida +256 -29,238 -28,982 Ohio +2,851 -18,569 -15,718 Georgia +316 -15,014 -14,698 Oklahoma +266 -5,854 -5,588 Hawaii +2 -2,427 -2,425 Oregon +556 -6,429 -5,873 Idaho +49 -2,715 -2,666 Pennsylvania +2,743 -19,278 -16,535 Illinois +1,514 -19,464 -17,950 Rhode Island +61 -1,534 -1,474 Indiana +3,413 -10,695 -7,282 South Carolina +399 -7,190 -6,791 Iowa +291 -5,846 -5,555 South Dakota +24 -1,710 -1,686 Kansas +114 -4,888 -4,774 Tennessee +591 -10,816 -10,225 Kentucky +596 -7,267 -6,671 Texas +1,555 -41,719 -40,164 Louisiana +302 -6,949 -6,648 Utah +210 -4,789 -4,579 Maine +11 -2,206 -2,195 Vermont +11 -1,198 -1,186 Maryland +100 -9,154 -9,054 Virginia +304 -13,005 -12,701 Massachusetts +167 -11,601 -11,434 Washington +318 -11,853 -11,535 Michigan +1,658 -15,678 -14,021 West Virginia +239 -2,282 -2,043 Minnesota +420 -9,512 -9,092 Wisconsin +1,054 -10,018 -8,964 Mississippi +307 -4,263 -3,956 Wyoming +3 -1,038 -1,035 Missouri +309 -9,991 -9,682 TOTAL +26,346 -495,136 -468,790 Source: Authors’ estimates.
For Further Information, contact The Trade Partnership
1701 K Street, NW Suite 575
Washington, DC 20006 202-347-1041

6 Policy Brief: Round 2: Trading Partners Respond
1
Methodology
We base our analysis on the Global Trade Analysis Project (GTAP) database. The GTAP database covers international trade and economy-wide inter-industry relationships and national income accounts, as well as tariffs, some nontariff barriers and other taxes. This includes value-chain related linkages across industries and borders. These data are included in a computer-based model of production and trade known as a “computable general equilibrium” (CGE) model. This is the same model used by the Commerce Department to arrive at the tariff rates it argues will yield increases in U.S. steel production sufficient to bring the industry to 80 percent capacity utilization.
While our model incorporates the GTAPv10 database, we have updated the data from the 2014 benchmark year to better reflect the U.S. economy in 2016. The base year for our analysis of the imposition of steel and aluminum tariffs is 2016.
We focused on the impacts of imposing the tariffs and retaliation on the U.S. workforce. For the analysis conducted here, we treat wages as “sticky,” meaning changes in demand for labor (positive or negative) are first reflected in changes in employment rather than changes in wages. This is appropriate for an examination of the immediate impacts of the tariffs on workers. We also examined the employment impacts on workers in different occupation/skill categories in the United States, and across the states.
It is important to emphasize that our employment impact estimates are net. They take into account potential increases as well as decreases in employment as demand increases in some cases for U.S. products, and declines in others. These changes arise not only from the direct impacts of the re-imposition of tariffs, but also the indirect impacts of changes in supply and demand for goods and services generally across the economy. For example, you will see that some sectors that you might not think would benefit from steel tariffs – textiles, for example – show employment increases. This is because declines in production in other sectors releases labor and capital that can now be used more productively in other sectors, like textiles. So output and related employment rises there.
We applied a 25 percent tariff to U.S. imports of the steel products detailed in the Commerce Department’s steel national security report, and a 10 percent tariff to U.S. imports of the aluminum products detailed in the Commerce Department’s aluminum national security report, excluding imports from Canada, Mexico and
What is covered?
The affected steel products fall into one of five categories: (1) carbon and alloy flat products (e.g., sheet, strip, plate); (2) carbon and alloy long products (e.g., bars, rails, rods and beams); (3) carbon and alloy pipe and tube (includes some stainless); (4) carbon and alloy semi-finished products (e.g., slab, ingots, blooms, billets); and (5) stainless products (flat, long, pipe and tube, and semifinished). See U.S. Department of Commerce, Bureau of Industry and Security, Office of Technology Evaluation, “The Effect of Imports of Steel on the National Security,” an Investigation Conducted Under Section 232 of the Trade Expansion Act of 1962, as Amended, January 11, 2018, https://www.commerce.gov/sites/commerce.gov/files/the_effect_of_imports_of_steel_on_the_national_security_-_with_redactions_-_20180111.pdf. The affected aluminum products are: (1) unwrought aluminum; (2) aluminum castings and forgings; (3) aluminum plate, sheet, strip, and foil (flat rolled products); (4) aluminum wire; (5) aluminum bars, rods and profiles; and (6) aluminum tubes and pipes; and (7) aluminum tube and pipe fittings. See U.S. Department of Commerce, Bureau of Industry and Security, Office of Technology Evaluation, “The Effect of Imports of Aluminum on the National Security,” an Investigation Conducted Under Section 232 of the Trade Expansion Act of 1962, as Amended, January 11, 2018, p. 7, https://www.commerce.gov/sites/commerce.gov/files/the_effect_of_imports_of_steel_on_the_national_security_-_with_redactions_-_20180111.pdf.

7 Policy Brief: Round 2: Trading Partners Respond
2
Australia. We excluded Australia in addition to Canada and Mexico because at the time of this writing, it appeared likely that imports from Australia will be excluded from the tariffs.
Our retaliation scenario involved further restricting U.S. exports to countries/areas that account for over 90 percent of affected imports: the European Union, Korea, Brazil, Japan, China, Russia, Turkey, Taiwan, India, Vietnam and South Africa. We limited product coverage for retaliation to U.S. exports of primary agriculture, processed foods, beverages and tobacco, clothing, vehicles and electronics (drawing heavily for product coverage from the retaliation list threatened by the European Union). Clearly, a different set of countries choosing to retaliate, and imposing retaliation on a different basket of goods, will yield results different than those presented in this Policy Brief.
Impact of Steel and Aluminum Tariffs, Plus Retaliation Net Job Losses by State
-5,837 -1,171
-8,826 -3,847
-56,462 -9,011
-5,492
-1,421
-28,982
-14,698
-2,425
-2,666
-17,950 -7,282
-5,555
-4,774 -6,671
-6,648
-2,195
-9,054
-11,434
-12,562
-1,474
-14,021
-9,092
-3,956
-9,682
-1,875
-3,524 -4,270
-2,153
-2,872
-29,6750
-14,520
-1,610
-15,718
-5,588
-5,873
-16,535
-6,791
-1,686
-10,225
-40,164
-4,579
-1,186
-12,701
-11,535
-2,043
-8,964
-1,035
Key Findings 18 jobs would be lost for every one gained. Every state will experience a net loss of jobs. Production workers and workers in low-skill jobs are hit the hardest.
Source: Trade Partnership Worldwide, LLC @TradePartnersDC