
Changes in cannabis potency and first-time admissions to ...

Policing Cannabis and Drug Related Hospital Admissions:
Evidence from Administrative Records∗
Elaine Kelly and Imran Rasul
October 2012
Abstract
We evaluate the impact of a policing experiment that depenalized the possession of small
quantities of cannabis in the London borough of Lambeth, on hospital admissions related to
illicit drug use. To do so, we exploit administrative records on individual hospital admissions
classi�ed by ICD-10 diagnosis codes. These records allow the construction of a quarterly
panel data set by London borough running from 1997 to 2009 to estimate the short and
long run impacts of the depenalization policy unilaterally introduced in Lambeth between
2001 and 2002. We �nd the depenalization of cannabis had signi�cant longer term impacts
on hospital admissions related to the use of hard drugs, raising raising hospital admission
rates for men by between 40 and 100% of their pre-policy baseline levels. Among Lambeth
residents, the impacts are concentrated among men in younger age cohorts, and among those
with no prior history of hospitalization related to illicit drug or alcohol use. The dynamic
impacts across cohorts vary in pro�le with some cohorts experiencing hospitalization rates
remaining above pre-intervention levels six years after the depenalization policy is introduced.
We �nd evidence of smaller but signi�cant positive spillover e�ects in hospitalization rates
related to hard drug use among residents in boroughs neighboring Lambeth, and these are
again concentrated among younger cohorts without prior histories of hospitalizations related
to illicit drug or alcohol use. We combine these estimated impacts on hospitalization rates
with estimates on how the policy impacted the severity of hospital admissions to provide a
lower bound estimate of the public health cost of the depenalization policy.
Keywords: cannabis, Class-A drugs, depenalization, hospital admissions.
JEL Classi�cation: I18, K42, H75.
∗We thank the NHS information Centre for providing access to the Hospital Episode Statistics data underlicense 2806. This paper has been screened to ensure no con�dential information is revealed. Kelly thanks theESRC and IFS for �nancial support; Rasul gratefully acknowledges �nancial support from the Schoeller Foundation.We thank Jerome Adda, Jonathan Caulkins, Tom Crossley, Libor Dusek, Hilary Hoynes, Marco Manacorda andBrendon McConnell for valuable comments. All errors remain our own. Author a�liations and contacts: Kelly(Institute for Fiscal Studies, [email protected]); Rasul (University College London and Institute for Fiscal Studies,[email protected]).
1

1 Introduction
Illicit drug use generates substantial economic costs including those related to crime, ill-health, and
diminished labor productivity. In 2002, the O�ce for National Drug Control Policy estimated that
illicit drugs cost the US economy $181 billion in total [O�ce for National Drug Control Strategy,
2004]; for the UK, Gordon et al. [2006] estimated the total cost of drug-related crime and health
service use to be ¿15.4 billion in 2003/4. It is these social costs, coupled with the risks posed
to drug users themselves, that have led governments throughout the world to try and regulate
illicit drug markets. All such policies aim to curb both drug use and its negative consequences,
but there is ongoing debate amongst policy-makers as to relative weight that should be given to
policies related to prevention, enforcement, and treatment [Grossman et al., 2002].
The current trend in policy circles is to suggest regimes built solely around strong enforcement
and punitive punishment might be both costly and ine�ective. For example, after forty-years of
the US `war on drugs', the Obama administration has adopted a strategy that focuses more on
prevention and treatment, and less on incarceration [O�ce for National Drug Control Strategy,
2011], although other federal agencies such as the Drug Enforcement Agency and the O�ce for
National Drug Control Policy remain more focused on traditional incarceration-based approaches.
Other countries such as the Netherlands, Australia and Portugal, have long adopted more liberal
approaches that have depenalized or decriminalized the possession of some illicit drugs, most
commonly cannabis, with many countries in Latin America currently debating similar moves.
While such policies might help free up resources from the criminal justice system, these more
liberalized policies also carry their own risks: if such policies signal the health and legal risks
from consumption have been reduced, then this should reduce prices [Becker and Murphy, 1988],
potentially increasing the number of users as well as increasing use among existing users, all
of which could have deleterious consequences for user's health. The use of certain drugs might
also provide a causal `gateway' to more harmful and addictive substances [van Ours, 2003; Melberg
et al., 2010], and possible impacts onto other forms of anti-social behavior beyond criminal activity.
This paper considers the impact of a localized policing experiment that reduced the enforcement
of punishments against the use of one illicit drug - cannabis - on a major cost associated with
the consumption of illegal drugs: the use of health services by consumers of illicit drugs. The
policing experiment we study took place unilaterally in the London Borough of Lambeth and
ran from July 2001 to July 2002, during which time all other London boroughs had no change in
policing policy towards cannabis or any other illicit drug. The experiment - known as the Lambeth
Cannabis Warning Scheme (LCWS) - meant that the possession of small quantities of cannabis
was temporarily depenalized, so that this was no longer a prosecutable o�ence.1 We evaluate the
1Donohue et al. [2011] categorize illicit drug policies into three type: (1) legalization - a system in whichpossession and sale are lawful but subject to regulation and taxation; (ii) criminalization - a system of proscriptionson possession and sale backed by criminal punishment, potentially including incarceration; (iii) depenalization - ahybrid system, in which sale and possession are proscribed, but the prohibition on possession is backed only by such
2

short and long run consequences of this policy on healthcare usage as measured by detailed and
comprehensive administrative records on drug-related admissions to all London hospitals. Such
hospital admissions represent 60% of drug-related healthcare costs [Gordon et al., 2006]. To do
so we use a di�erence-in-di�erence research design that compares pre and post-policy changes in
hospitalization rates between Lambeth and other London boroughs. Our analysis aims to shed
light on the broad question of whether policing strategies towards the market for cannabis impact
upon public health, through changes in the use of illicit drugs and subsequent health of drug users.
Our primary data comes from a novel source that has not been much used by economists:
the Inpatient Hospital Episode Statistics (HES). These administrative records document every
admission to a public hospital in England, with detailed ICD-10 codes for classifying the primary
and secondary cause of each individual hospital admission.2 This is the most comprehensive health
related data available for England, in which it is possible to track the admissions history of the
same individual over time. We aggregate the individual HES records to construct a panel data set
of hospital admissions rates by London borough and quarter. We do so for various cohorts de�ned
along the lines of gender, age at the time of the implementation of the depenalization policy, and
previous hospital admissions history. As such these administrative records allow us to provide
detailed evidence on the aggregate impact of the depenalization policy on hospitalization rates,
and to provide novel evidence on how these health impacts vary across population cohorts.
The balanced panel data we construct covers all 32 London boroughs between April 1997 and
December 2009. This data series starts four years before the initiation of the depenalization policy
in the borough of Lambeth, allowing us to estimate policy impacts accounting for underlying trends
in hospital admissions. The series runs to seven years after the policy ended, allowing us to assess
the long term impacts of a short-lived change in policing strategy related to cannabis.
Given the detailed ICD-10 codes available for each admission, the administrative records allow
us to speci�cally measure admission rates for drug-related hospitalizations for each type of illicit
drug: although the depenalization policy would most likely impact cannabis consumption more
directly than the usage of other illicit drugs [Chu, 2012], this has to be weighed against the
sanctions as �nes or mandatory substance abuse treatment, not incarceration. The LCWS policing experiment weevaluate is a policy of depenalization. The practical way in which it was implemented is very much in line withpolicy changes in other countries that have changed enforcement strategies in illicit drug markets and as such weexpect our results to have external validity to those settings, including for the current debate on the potentialdecriminalization of cannabis in California [Kilmer et al., 2010]. As discussed in [Chu, 2012], medical marijuanalegislation represents a major change in US policy in recent years, where 17 states have now passed laws that allowindividuals with speci�c symptoms to use marijuana for medical purposes.
2Private healthcare constitutes less than 10% of the healthcare market in England, with most admissions forelective procedures. Focusing on admissions to public hospitals is therefore unlikely to produce a biased evaluationof the policing policy on drug-related hospitalizations. The HES contains an inpatient and an outpatient data set.We only use the inpatient data. The inpatient data includes all those admitted to hospital (under the order of adoctor) who are expected to stay at least one night, and contains ICD-10 diagnosis classi�cations. The outpatientdata covers those in which a patient is seen but does not require a hospital bed for recovery purposes (except for ashort recovery after a speci�c procedure). We do not use the HES outpatients data because it is only reliable from2006/7 onwards (and so not before the LCWS is initiated) and does not have information on diagnosis codes.
3

fact that hospitalizations related to cannabis usage are extremely rare and so policy impacts are
statistically di�cult to measure along this margin. Our main outcome variable therefore focuses
on hospital admissions related to hard drugs, known as `Class-A' drugs in England. This includes
all hospital admissions where the principal diagnosis relates to cocaine, crack, crystal-meth, heroin,
LSD, MDMA or methadone.3 The administrative records also contain information on the length of
hospital stays (in days) associated with each patient admission, and we use this to explore whether
the depenalization policy impacted the severity of hospital admissions (not just their incidence),
where the primary diagnosis relates to hospitalizations for Class-A drug use. Ultimately, we then
combine the estimated policy impacts on hospitalization rates, with the estimated policy impacts
on the severity of hospital admissions for Class-A drug use, to provide a conservative estimate of
the public health costs of the depenalization policy that arises solely through the increased demand
on hospital bed services.
We present four main results. First, relative to other London boroughs, the depenalization
policy had signi�cant long term impacts on hospital admissions in Lambeth related to the use
of Class-A drugs, with the impacts being concentrated among men. Exploring the heterogeneous
impacts across male cohorts, we �nd the direct impacts on Lambeth residents to be larger among
cohorts that were younger at the start of the policy, and concentrated especially among those with
no prior history of hospitalization related to drug or alcohol use. The magnitudes of the impacts
are large across age cohorts: the increases in hospitalization rates correspond to rises of between
40 and 100% of their pre-policy baseline levels in Lambeth, for those aged 15-24 and aged 25-34
on the eve of the policy. As far as our data allows, not much of the impact appears to arise from
drug users changing borough of residence over time with net in�ows into Lambeth.
Second, the dynamic impacts across cohorts vary in pro�le with some cohorts experiencing
hospitalization rates remaining above pre-intervention levels six years after the depenalization of
cannabis was �rst introduced. Third, we �nd evidence of positive spillover e�ects on hospitaliza-
tions related to Class-A drug use among those resident in boroughs neighboring Lambeth. These
spillovers are again concentrated among younger cohorts without prior histories of hospital admis-
sions related to the use of illicit drugs or alcohol. As expected, the magnitude of these spillover
e�ects are signi�cantly smaller than the direct impacts documented among Lambeth residents.
Finally, the severity of hospital admissions, as measured by the length of stay in hospital, signif-
icantly increases for admissions related to Class-A drug use. Taking the main within-Lambeth
channels through which the policy impacts public health through increased bed-days in hospital,
we estimate the annual cost of the policy to more than o�set the downward time trend in hospital
3The UK has a three tiered drug classi�cation system, with assignment from Class-C to Class-A intended toindicate increasing potential harm to users. Class-A drugs include cocaine, crack, crystal-meth, heroin, LSD,MDMA and methadone. Much of the ongoing policy debate on the decriminalization or depenalization of cannabis,reclassifying it from Class-B to Class-C, stems from the fact that legal drugs such as alcohol and tobacco, arethought to have higher levels of dependency and cause more physical harm to users than some illicit drugs includingcannabis [Nutt et al., 2007].
4

bed-day costs that is found to exist on average across all other London boroughs in the post-policy
period.
Taken together, our results suggest policing strategies towards the market for cannabis have
signi�cant, nuanced and long lasting impacts on public health.
Our analysis contributes to understanding the relationship between drug policies and public
health, an area that has received relatively little attention despite the sizable social costs involved.
This partly relates to well known di�culties in evaluating policies in illicit drug markets: multiple
policies are often simultaneously targeted towards high supply locations; even when unilateral
policy experiments or changes occur they often fail to cause abrupt or quantitatively large demand
or supply shocks, and data is rarely detailed enough to pin down interventions in speci�c drug
markets on other drug-related outcomes [DiNardo, 1993; Caulkins, 2000; Chu, 2012]. Our analysis,
that combines a focused policy and administrative records, makes some progress on these fronts.
To place our analysis into a wider context, it is useful to compare our �ndings with two earlier
prominent studies of the links between illicit drug enforcement policies and health outcomes: Model
[1993] uses data from the mid-1970s to estimate the impact on hospital emergency room admissions
of cannabis decriminalization, across 12 US states. She �nds that policy changes led to an increase
in cannabis-related admissions and a decrease in the number of mentions of other drug related
emergency room admissions, suggesting a net substitution towards cannabis. Our administrative
records also allow us to also check for such broad patterns of substitution or complementarity
between illicit drugs. Our results suggest that the depenalization of cannabis led to longer term
increases in the use of Class-A drugs, as measured by hospital inpatient admissions rather than
emergency room admissions as in Model [1993].4
More recent evidence comes from Dobkin and Nicosia [2009], who assess the impact of an
intervention that disrupted the supply of methamphetamine in the US by targeting precursors to
methamphetamine. They document how this led to a sharp price increase and decline in quality
for methamphetamine. Hospital admissions mentioning methamphetamine fell by 50% during the
intervention, whilst admissions into drug treatment fell by 35%. Dobkin and Nicosia [2009] �nd
no evidence that users substituted away from methamphetamine towards other drugs. Finally,
Dobkin and Nicosia [2009] �nd the policy of disrupting methamphetamine supply was e�ective
only for a relatively short period: the price of methamphetamine returned to its pre-intervention
level within four months and within 18 months hospital admissions rates had returned to their
baseline levels. In contrast, the cannabis depenalization policy we document has an impact on
hospitalization rates that, for many cohorts, lasts for up to six years after the policy was initiated
4An important distinction between our data and that used in Model [1993] is that the HES data has a patient-episode as its unit of observation, rather than `drug mentions' of which Model [1993] report up to six per patient-episode. Moreover, the data used in Model [1993] are not administrative records, but were collected by the DrugAbuse Warning Network from emergency rooms in 24 major SMSAs. As Model [1993] discusses, some data incon-sistencies arise because the emergency rooms in the sample change over time.
5

and despite the fact that the policy itself was only formally in place for one year.5
The paper is organized as follows. Section 2 describes the LCWS and the existing evidence on
its impact on crime. Section 3 details our administrative data, discusses the plausibility of a link
between policing-induced changes in the cannabis market and the consumption of Class-A drugs,
and describes our empirical method. Section 4 presents our baseline results which estimate the
impact of the LCWS by cohort and the associated robustness checks, and presents some tentative
evidence on changes in borough of residence of drug users. Section 5 presents extended results
related to dynamic e�ects, geographic spillovers, the severity of admissions, and the estimated
public health costs of the policy. Section 6 discusses the broader implications of our �ndings for
drug policy, and the potential for opening up a research agenda exploring the relationship between
police behavior and public health.
2 The Lambeth Cannabis Warning Scheme (LCWS)
The Lambeth Cannabis Warning Scheme (LCWS) was unilaterally introduced into the London
borough of Lambeth on 4th July 2001 by the borough's police force. The scheme was initially
launched as a pilot intended to last six months, and represented a change in policing policy
towards the market for cannabis. Under the scheme, those found in possession of small quantities
of cannabis for their personal use in Lambeth: (i) had their drugs con�scated; (ii) were given a
warning rather than being arrested. The main reason behind the policy change was to reduce
the number of individuals being criminalized for consuming cannabis, and to free up police time
and resources to deal with more serious crime, including those related to hard drugs or `Class-A
drugs' [Dark and Fuller, 2002; Adda et al., 2011]. The underlying motivation for the policy, as
well as the way in which it was implemented and the targeted outcomes, were very similar to the
way in cannabis depenalization policies have often been implemented throughout the world. In
keeping with other experiences of depenalization, the primary motivation behind the policy was
to free up police time and resources to tackle other crimes, and there was little or no discussion
of the depenalization policy's potential impact on public health. To this extent our results can
be informative of the existence of links between police drugs policy and public health in settings
outside of the speci�c London context we study.6
5As with the economics literature the bulk of the criminology literature has also focused on the crime impactsof drug enforcement policies. One exception is Hughes and Stevens [2010] who study the wider impacts of thedecriminalization of cannabis introduced in Portugal in 2001. However the evidence they present is based either onEurope wide survey data and compares trends in Portugal to those in Spain and Italy, or stakeholder interviews inPortugal. They do not present regression estimates to measure causal impacts. MacCoun and Reuter [2001] discussthe health impacts of cannabis depenalization after reviewing evidence from a range of countries.
6For example, there have been moves over the past decade in California towards more liberal policies related tocannabis. In 2010 California passed into law a depenalization policy that reduced the penalty associated with beingfound in possession of less than one ounce of cannabis, from a misdemeanor to a civil infraction. Further moves toa more liberal regulation of the cannabis market - almost to the point of legalization - remain on the policy agendain California [Kilmer et al. 2010]. The moves to medical marijuana legislation have also been pronounced, with 17
6

Anecdotal evidence suggests local support for the scheme began to decline once the policy was
announced to have been extended beyond the initial six-month pilot. Media reports cited that
local opposition arose due to concerns that children were at risk from the scheme, and that the
depenalization policy had increased drug tourism into Lambeth. The LCWS formally ended on 31st
July 2002. Post-policy, Lambeth's cannabis policing strategy did not return identically to what it
had been pre-policy, partly because of disagreements between the police and local politicians over
the policy's true impact. Rather, it adjusted to be a �rmer version of what had occurred during
the pilot so that police o�cers in Lambeth continued to issue warnings but would now also have
the discretion to arrest where the o�ence was aggravated.7 Hence when we refer to measuring the
long run impacts of the depenalization policy, we are capturing the total e�ects arising from: (i)
the long run impact of the introduction of the depenalization policy between June 2001 and July
2002; (ii) any longer term di�erences in policing towards cannabis from the post and pre-policy
periods.
The impact of the LCWS depenalization policy on patterns of crime in Lambeth and neigh-
boring boroughs is studied extensively by Adda et al. [2011]. For the purposes of the current
study on the relationship between drug-policing and public health, there are three key results on
the impact of the depenalization policy on crime to bear in mind: its impact on the market for
cannabis, on the market for Class-A drugs, and drug tourism. First, the LCWS led to a signi�cant
and permanent rise in cannabis related criminal o�ences in Lambeth. Using data on �nely disag-
gregated drug o�ence type reveals that both the demand for and supply of cannabis are likely to
have signi�cantly risen in Lambeth after the introduction of the depenalization policy. This result
is important for the current study because it suggests the depenalization policy caused an abrupt,
quantitatively large and permanent shock to the cannabis market, causing its equilibrium market
size to increase.8 This will consequently a�ect the equilibrium market size for Class-A drugs if
the markets are related in some way, either because of economies of scale in supplying both drug
markets, or because consumer preferences being such that the demands for cannabis and Class-A
drugs are either complements or substitutes.
Second, Adda et al. [2011] do indeed �nd evidence of the inter-relatedness between the markets
for cannabis and Class-A drugs: they report that the longer term e�ect of the LCWS was to lead
to a signi�cant increase in o�ences related to the possession of Class-A drugs. However, there is
little evidence that the police reallocated their e�orts towards crimes relating to Class-A drugs;
rather the police appear to have reallocated e�ort towards non-drug crime. In the current paper
we estimate the relationship between the policing of cannabis and hospital admissions related to
US states currently having such laws in place [Chu, 2012].7Aggravating factors included: (i) if the o�cer feared disorder; (ii) if the person was openly smoking cannabis in
a public place; (iii) those aged 17 or under were found in possession of cannabis; (iv) individuals found in possessionof cannabis were in or near schools, youth clubs or child play areas.
8Cannabis possession o�ences increased by 13.5% during the policy, and 24.2% in the post policy period (August2002 to January 2006) relative to the pre-policy period Adda et al. [2011].
7

Class-A drug use. It is therefore important that changes the reallocation of police resources to other
crimes did not counteract any mechanism linking cannabis and Class-A drug consumption. In our
analysis when we consider the long term impact of the depenalization policy we take as given the
results established in Adda et al. [2011] that in response to the policy, the police reallocated e�ort
away from cannabis related crime and towards non-drugs crime; the police did not reallocate e�ort
towards Class-A drug related crime. Given the addictive nature of Class-A drugs, and potential
lags in seeking out and receiving treatment, we might also reasonably expect any impact of the
LCWS on hospital admissions related to Class-A drug use to last well into the post-policy period.
We therefore later consider how the e�ects of the LCWS on drug-related hospital admissions evolve
over time across various cohorts.
The third key �nding from Adda et al. [2011] on the impact of the LCWS on crime is the
existence of drug tourism into Lambeth from its geographic neighboring boroughs. Indeed, these
�ows into Lambeth explain almost half the increase in cannabis o�ences in Lambeth. To explore
this further in terms of health outcomes, we later investigate whether there are similar geographic
spillovers in hospital admission rates related to Class-A admissions after the LCWS is introduced
in Lambeth, for those resident in neighboring boroughs. Our administrative data on hospital
admissions further allow us to shed light on the nature of drug tourists, by exploring how the
marginal impact on those resident in neighboring boroughs, di�ers from the marginal impact on
residents of Lambeth.
Standard consumer theory provides clear set of predictions on how such a depenalization policy
can impact the use of cannabis and other illicit drugs. Most existing studies assume that such
policies cause signi�cant reductions in the price of cannabis [Thies and Register, 1993; Grossman
and Chaloupka, 1998; Williams et al., 2004]. This will, all else equal, increase the demand for
cannabis in part because of greater demands from existing users and also because of an impact
on the extensive margin so that new individuals choose to start consuming cannabis at the lower
price. This will have a positive impact on the consumption of Class-A drugs if cannabis and Class-
A drugs are contemporaneously complements in user preferences, or will increase the demand for
Class-A drugs over time if the use of cannabis serves as a gateway to the use of other harder illicit
drugs. Of course if cannabis and Class-A drugs are substitutes, then the increased demand for
cannabis resulting from the depenalization of cannabis possession should reduce Class-A drug use
and potentially reduce hospitalizations related to Class-A drug use.9
9The administrative records we exploit are not rich enough to estimate a model of consumer demand and thenestimate whether cannabis and Class-A drugs are substitutes or complements. Such an exercise is conducted byDiNardo and Lemiuex [2001] for the case of cannabis and alcohol demands using the Monitoring the Future Datain the US.
8

3 Data, Descriptives and Empirical Method
3.1 Administrative Records on Hospital Admissions
Data on hospital admissions are drawn from the Inpatient Hospital Episode Statistics (HES). These
provide an administrative record of every inpatient health episode, de�ned as a single period of
care under one consultant in an English National Health Service hospital.10 These administrative
records are the most comprehensive data source on health service usage for England, and have not
been used much by research economists. Inpatients include all those admitted to hospital with
the intention of an overnight stay, plus day case procedures when the patient is formally admitted
to a hospital bed. As such, these records cover the most serious health events. Patients with
less serious conditions receive treatment elsewhere, including outpatient appointments, emergency
departments, or primary care services. If such health events are also impacted by drugs policing
strategies, our estimates based solely on inpatient records provide a strict lower bound impact of the
depenalization of cannabis on public health. For each patient-episode event in the administrative
records, the data record the date of admission, total duration in hospital, and ICD-10 diagnoses
codes in order of importance. Background patient information covers their age, gender, and their
zip code of residence at the time of admission.11
We assess how hospital admissions related to Class-A drug use and to cannabis use are impacted
by the depenalization of cannabis possession in Lambeth. For Class-A drug related admissions,
we include episodes where the drug is mentioned either in the primary diagnosis, or those episodes
directly caused by Class-A drugs. As hospital admissions for cannabis are far rarer, we include
episodes where the drug is mentioned as either a primary or a secondary diagnosis.12 Given that
our main outcome relates to rates of hospital inpatient admissions, we aggregate the individual
patient-episode level data by borough of residence and quarter, and calculate admission rates per
thousand population for diagnosis d, borough of residence b in quarter q of year y as follows,
Admitdbqy =TotdbqyPopby
, (1)
10We include all episodes of each hospital stay, so that if a patient is under the care of di�erent consultants duringtheir stay in hospital and before discharge, these count as multiple patient-episodes. Given the infrequency withwhich the same patient transfers across consultants during a hospital stay, the majority of results presented arerobust to re-de�ning episodes at the patient-consultant level.
11Between 10 and 12% of the population in England have private health insurance, largely provided by employers.However, this is typically a top-up to NHS care, and does not cover serious illness or most emergencies. Privatehospitals do not have emergency rooms, and the use of private primary health care is very rare. The data willtherefore capture a very high proportion of adverse drug reactions that require treatment in hospital. The ICD isthe international standard diagnostic classi�cation for epidemiological and clinical use.
12Diagnoses that mention Class-A drugs include (drug speci�c) mental and behavioral disorders (ICD-10 CodesF11 for opiods, F14 for cocaine, F16 for hallucinogens), intentional and accidental poisoning (T400-T406 T408-T409, X42, X62 Y12), and the �nding of the drug in the blood (R781-R785). Diagnoses that mention cannabisinclude mental and behavioral disorders (F12), and poisoning (T407).
9

where Totdbqy are total number of hospital admissions for diagnosis d, amongst those residing in
borough b, in quarter q of year y, and Popby is the population of borough b in year y. These
admission rates are calculated by gender and age cohort, where age is categorized into ten year
bins (15-24, 25-34, 35-44) and patient's age is de�ned as that on the eve of the LCWS policy. For
each age-gender cohort, we create a panel of hospital admission rates for all London boroughs,
excluding those that neighbor Lambeth (Croydon, Merton, Southwark and Wandsworth). Neigh-
boring boroughs are excluded from our baseline speci�cations, as evidence from Adda et al. [2011]
has already demonstrated substantive spillovers in criminal activity (and we later document such
policy spillovers in terms of public health). Our data covers hospital admissions among residents
of the remaining 28 boroughs (including Lambeth), by quarter, from April 1997 to December 2009.
To reiterate, the geographic information we use relates to the patient's borough of residence,
not the borough in which they are hospitalized. This helps ameliorate concerns that any changes
in Class-A drug related hospitalization rates are driven by changes in the location of hospitals,
or changes in drug-related services provided by hospitals.13 Hence, any documented change in
hospital admissions for Class-A drug related diagnoses in Lambeth following the introduction of
the LCWS might then operate through two mechanisms: (i) a change in behavior of those resident
in Lambeth prior to the policy; (ii) a change in the composition of Lambeth residents, with the
policy potentially inducing a net in�ow of people into the borough with a higher propensity for
Class-A drug use. In Section 4.3 we use our data to shed light on these channels separately, but
our baseline estimates, in line with much of the earlier literature, certainly combine both channels.
The administrative records also allow us to create panels based on prior histories of patient
admissions because the HES records have unique patient identi�ers that allow the same patient to
be tracked over episodes between 1997 and 2009. We focus on histories of admissions related to the
use of either drugs (Class-A drugs, cannabis, or other illicit drug), or alcohol, and create panels by
borough-quarter-age cohort-gender, for those with and without pre-policy histories of admissions
related to drugs or alcohol. Among those with no pre-policy admissions, we calculate admission
rates as per (1). For those with pre-policy admission rates, Popby is replaced by the number of
distinct individuals admitted for diagnoses related to illicit drugs or alcohol whilst residing in
borough b between April 1997 and June 2001, the eve of the LCWS policy in Lambeth.
The depenalization policy likely lowers prices for cannabis in Lambeth, all else equal. For
those with no prior history of hospitalization for drug or alcohol use, this might induce greater
consumption of Class-A drugs if they are complements to cannabis, or cannabis acts a gateway to
such substances. To be clear, among this cohort we pick up the combined impacts among those
13Annual O�ce for National Statistics (ONS) population estimates at the borough level are only provided in�ve-year bands [O�ce for National Statistics, 2011]. As such, the estimates will only record the size of a particular10-year age cohort once every �ve years. For example, in 2001, the 25-34 cohort was equal to the population aged20-24 plus the population 25-29. To deal with this populations are interpolated in all other years, but taking aweighted sum of the relevant cohorts. In 2002, the same cohort were 21-30, and therefore split between three�ve-year age bins. We therefore interpolate as follows: (0.8× total aged 20-24) + total aged 25-29 + (0.2 × totalaged 30-34). Results are robust to �xing the population at 2001 levels.
10

that were previously using illicit drugs (and potentially other substances) but not so heavily so as
to induce hospitalizations, as well as those that begin to use cannabis and Class-A drugs for the
�rst time as a result of the price impacts on cannabis of the depenalization policy. Among the
cohort with histories of hospitalization for drug or alcohol use, there are likely to be long term and
heavy users of illicit substances. Such individuals' consumption of Class-A drugs might reasonably
be more habitual and so less price sensitive. Hence this cohort might be less impacted by the
depenalization of cannabis.
3.2 Cannabis and Class-A Drug Use
Our primary interest is to understand how changes in police enforcement strategies towards the
cannabis market - as embodied in the LCWS policy - impacts public health through changes in
hospitalization rates related to illicit drug use. Of course the policy would most directly a�ect
the consumption of cannabis, although changes in hospital admissions related to cannabis use
are statistically hard to detect given the rarity of such events. On this point, it is instructive to
compare rates of drug related hospital admissions from the HES administrative records, to rates
of self-reported drug use from household surveys the most reliable of which is the British Crime
Survey (BCS). Estimates from the BCS in 2002/3 indicate that cannabis was by far the most
popular illicit drug, with 16% of 16-24 year-olds and 9% of 25-34 year-olds reporting to have used
cannabis in the month prior to the survey. The corresponding �gures for Class-A drug use are just
4% and 2% respectively [Condon and Smith, 2003]. The HES records show that there are seven
times as many inpatient hospital admissions for Class-A drugs than for cannabis. This reinforces
the notion that cannabis related policing policies such as the LCWS, may not lead to a rise in
cannabis related hospital admissions even if there is a substantial increase in cannabis usage caused
by the policy.
What is important for our analysis is that a body of evidence suggests the cannabis and Class-
A drug markets are linked: while little is known about such potential linkages on the supply
side, on the demand side this might be because cannabis users are more likely to consume Class-A
drugs, both contemporaneously and in the future [van Ours, 2003; Melberg et al., 2010; Bretteville-
Jensen et al., 2008; Colea et al., 2004]. There are of course multiple explanations for this positive
correlation between admissions for cannabis and subsequent risky behaviors. One explanation
is state dependence so that cannabis users have particular characteristics that also lead them to
subsequently misuse Class-A drugs, a channel shown to be of �rst order importance using data from
the NLSY97 by Deza [2011]. Alternatively, the use of cannabis might act as a causal �gateway� to
the use of harder drugs, as has been suggested by [Beenstock and Rahav, 2002; Bretteville-Jensen
et al., 2008; Melberg et al., 2010; van Ours, 2003].
For our study what is important is that some correlation between the market sizes for cannabis
and other illicit drugs exists, not whether this is link is causal or not. To show the relatedness
11

between these markets as recorded in the hospital admissions records we exploit, we present de-
scriptive evidence from the HES to suggest how cannabis consumption today might correlate to
Class-A drug use in the future. To do so we exploit the individual identi�ers in the administrative
records, allowing us to track the same person over time. We then calculate the probability, condi-
tional on an admission in 1997 or 1998, of being readmitted to hospital at least once between 2000
and 2004. Four groups of admission are considered: (i) �cannabis admissions�, who were admitted
for cannabis, the drug a�ected by the LCWS; (ii) �Class-A admissions�, who were admitted for the
use of a harder drug; (iii) �alcohol admissions�, who were admitted for alcohol related diagnoses;
(iv) �all other admissions�, who were admitted for any other cause and serve as a benchmark for the
persistence of ill-health over these time periods.14 Table 1 shows the mean and standard deviation
for each probability of readmission, conditional on prior admissions.
Two points are of note. First, there is substantial persistence in hospital admissions for the
same risky behavior, as shown on the leading diagonal in Columns 1-3. Persistence is particularly
high for Class-A drugs and alcohol, where 26 and 23% of individuals respectively, were readmitted
for the ill-e�ects of the same risky behavior over the two time periods. Reading across the last row
of Table 1 on subsequent readmission to hospital from 2000 to 2004 for any diagnosis unrelated to
drugs or alcohol, we see that this readmission probability is between 15 and 28% conditional on
having been previously admitted in 1997-8 for some risky behavior related to illicit drug or alcohol
use. Second, although admissions for any form of risky behavior in 2000-4 is best predicted by
admission for the same behavior in 1997-8, we note that for those admitted for Class-A drugs in
2000-4, 5.4% will have been admitted for cannabis related diagnoses in 1997-8. This is signi�cantly
higher than having been previously admitted for alcohol related diagnoses (2.2%) over the same
period. This highlights the particularly robust correlation between cannabis use at a given moment
in time, and future hospital admissions for Class-A related drug use.
In this paper our focus is on establishing whether a change in police enforcement in the cannabis
market - as embodied in the LCWS - has a causal impact on hospital admissions for Class-A
drugs. The evidence presented in Table 1 and the existing evidence documenting a causal impact
of cannabis consumption on the subsequent use of other illicit substances, suggests that as long as
the policy a�ects the usage of cannabis consumption in some way, this is likely to have a knock
on e�ect on the usage of Class-A drugs in the long run. It is these longer term e�ects on public
health that we now focus on measuring.
14As already noted, cannabis related admissions are rare and so in Table 1 we expand the geographic coverageof the sample to cover metropolitan local authorities in Greater Manchester, Merseyside, the West Midlands, Tyneand Wear, and South Yorkshire, in addition to London that our main analysis is based on. This sample accountsfor approximately 30% of England's population. We exclude Lambeth from this analysis to prevent any impact ofthe LCWS contaminating these results. For Class-A drug admissions, we include episodes that mention Class-Adrugs as either a primary or secondary diagnosis, as the objective is to assess correlations in drug use, not the causeof admission. We exclude those admitted for more than one risky behavior related to cannabis, Class-A drugs andalcohol. Finally, observations for 1999 are dropped to ensure that we only capture new incidents between 1997-8and the later time period.
12
3.3 Empirical Method and Descriptive Evidence
To estimate the impact of the depenalization policy on hospital admissions rates, we estimate the
following balanced panel data speci�cation for diagnosis d in London borough b in quarter q and
year y,
Admitdbqy = α + β0Pqy + β1[Lb × Pqy] + β2PPqy + β3[Lb × PPqy] + δXbqy + λb + λq + ubqy, (2)
where Admitdbqy is the of the number of admissions to hospital where the primary diagnosis relates
to Class-A drugs, per thousand of the population, as de�ned in (1). Pqy and PPqy are dummies for
the policy and post-policy periods respectively and Lb is a dummy for the borough of Lambeth.
The speci�cation is estimated separately for each age-gender cohort. The parameters of interest
are estimated using a standard di�erence-in-di�erence (DD) research design: β1 and β3 capture
di�erential changes in hospital admission rates in Lambeth during and after the depenalization
policy period, relative to other London boroughs.
β0 and β2 capture London-wide time trends in admissions. In particular, β0 captures London-
wide trends in hospitalization rates occurring at the same time as the LCWS was in operation in
Lambeth. β2 captures longer term London-wide trends in hospitalization rates after the depenal-
ization policy in Lambeth o�cially ends. This coe�cient picks up any impacts on hospitalization
rates related to diagnosis-d for London and nationwide policies, including the nationwide depe-
nalization of cannabis possession that occurred from January 2004 through to January 2009.15
Although there are of course expected to be strong London-wide trends in hospitalization rates,
our research design identi�es whether: (i) hospitalization rates in Lambeth signi�cantly diverge
away from London-wide trends during and after the depenalization policy is in place; (ii) these
divergences precisely coincide with the depenalization policy's operation in Lambeth.
In Xbqy we control for two sets of borough-speci�c time varying characteristics. The �rst
contains the shares of the population under 5 and over 75 (by borough and year), who place the
heaviest burden on health services. Second, Xbqy includes controls for admission rates, by borough-
quarter-cohort, for conditions that should be una�ected by the LCWS, in particular malignant
neoplasms, diseases of the eye and ear, diseases of the circulatory system, diseases of the respiratory
system, and diseases of the digestive system. These capture contemporaneous changes in healthcare
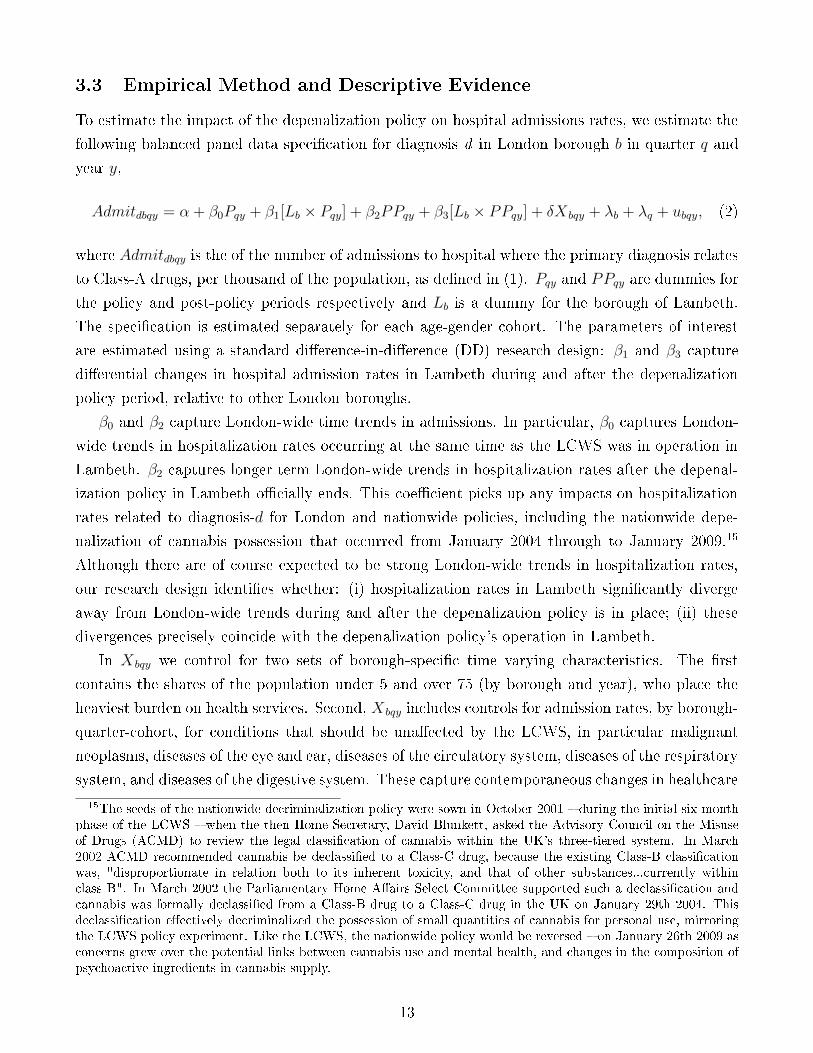
15The seeds of the nationwide decriminalization policy were sown in October 2001 � during the initial six monthphase of the LCWS � when the then Home Secretary, David Blunkett, asked the Advisory Council on the Misuseof Drugs (ACMD) to review the legal classi�cation of cannabis within the UK's three-tiered system. In March2002 ACMD recommended cannabis be declassi�ed to a Class-C drug, because the existing Class-B classi�cationwas, "disproportionate in relation both to its inherent toxicity, and that of other substances...currently withinclass B". In March 2002 the Parliamentary Home A�airs Select Committee supported such a declassi�cation andcannabis was formally declassi�ed from a Class-B drug to a Class-C drug in the UK on January 29th 2004. Thisdeclassi�cation e�ectively decriminalized the possession of small quantities of cannabis for personal use, mirroringthe LCWS policy experiment. Like the LCWS, the nationwide policy would be reversed � on January 26th 2009 asconcerns grew over the potential links between cannabis use and mental health, and changes in the composition ofpsychoactive ingredients in cannabis supply.
13

provision or levels of illness in the population that could a�ect drug-related admissions. The
admission rates for these diagnoses are all constructed from the HES administrative records. The
�xed e�ects capture remaining permanent di�erences in admissions by borough (λb) and quarter
(λq). Observations are weighed by borough shares of the London-wide population. De�ning t as
quarters since April 1997: t = [4 × (y − 1997)] + q, we assume a Prais-Winsten borough speci�c
AR(1) error structure, ubqy = ubt = ρbubt−1+ebt, where ebt is a classical error term. ubqy is borough
speci�c heteroskedastic, and contemporaneously correlated across boroughs.16
Table 2 provides descriptive evidence on the unconditional long term e�ects of the depenaliza-
tion policy on Class-A related hospital admissions rates, with each row showing hospital admissions
rates (Admitdbqy) as de�ned in (1). We focus �rst on male cohorts of various ages on the eve of
the LCWS policy. Columns 1 and 2 present means and standard deviations of hospital admission
rates related to Class-A drug usage in Lambeth during the pre-policy and post-policy periods
respectively; Columns 3-4 give the corresponding statistics for the average borough in the rest
of London (excluding Lambeth's neighboring boroughs). We note that in the pre-policy period
Lambeth had substantially higher rates of admissions than the London average. Indeed, ranking
boroughs by their per-policy hospital admission rates related to Class-A drugs, Lambeth has the
third highest for men and second highest for women. However, as shown later, there is no evidence
of diverging or converging trends in Class-A related hospital admissions rates between Lambeth
and the London average in the pre-policy period from 1997 to 2001. In Lambeth, admissions rates
in the pre-policy period are lowest for the youngest cohort, re�ecting the overall pattern of drug
admissions by age.
Comparing Columns 1 and 2 begins to highlight the potential health impacts of the depenal-
ization policy: hospital admission rates in Lambeth rise over time for the 15-24 and 25-34 cohorts,
but fall slightly for the oldest cohort. In contrast for the rest of London admissions rates rise only
for the youngest cohort and are stable or declining for the older two age cohorts. Columns 5-6
then present di�erence-in-di�erence estimates of how Class-A drug admissions rates relate to the
LCWS policy. Column 5 shows that unconditional on any other factor, admission rates for both
the 15-24 and 25-34 cohorts signi�cantly rose in Lambeth relative to the London borough average,
after the introduction of the policy to depenalize the possession of cannabis. The relative increases
in admission rates of .054 and .079 per thousand population for the youngest two age cohorts are
statistically signi�cant at the 5% level: the increases correspond to a 146% rise relative to the
pre-policy level for the 15-24 cohort, and a 44% increase above the baseline level for the cohort
aged 25-34 on the eve of the policy. The e�ect for the oldest cohort is not statistically signi�cantly
di�erent from zero. Column 6 then shows this basic pattern of di�erence-in-di�erences to remain
in magnitude and signi�cance once borough and quarter year �xed e�ects are controlled for. These
16While we think it is important to try and control for the general state of health within the borough using thevariables described in Xbqy, our main results are robust to excluding such controls. We also note that estimatingAR(1) error terms is the most conservative approach: allowing standard errors to be clustered either by boroughor by borough-year leads to far smaller estimates of standard errors for the main results.
14

results suggest that among younger male age cohorts, the policy of depenalizing the possession of
cannabis is associated with signi�cantly higher hospitalization rates in Lambeth for Class-A drug
use in the longer term.
Table A1 shows the corresponding results for female age cohorts: we �nd no signi�cant impacts
on Class-A related hospitalization for any female age cohort. The rate of admissions for such
diagnoses among women is generally lower than among men and this might be one reason it is
harder to statistically measure any impact. On the other hand, the fact that there are very di�erent
trends in hospitalizations for Class-A drugs across genders within Lambeth, suggests the earlier
results for men are not merely picking up other changes in hospital behavior or how diagnoses are
recorded, that might otherwise have been expected to impact men and women equally.
Table A2 shows the corresponding descriptive evidence for hospital admissions related to
cannabis use for male cohorts. As already discussed, cannabis hospital admission rates are gener-
ally lower than for Class-A drugs, especially among older age cohorts, despite much higher levels
of cannabis usage as suggested by survey data. The di�erence-in-di�erence results suggest the
LCWS had no signi�cant impact on hospital admissions for cannabis: the point estimates for the
youngest male cohorts are positive but not precisely estimated, and a similar set of �ndings are
obtained when examining the impact of the depenalization policy on hospitalizations for cannabis
related diagnoses among female cohorts (not shown).
To relate these �ndings to the literature, recall that Model [1993] �nd that the de facto decrim-
inalization of cannabis in twelve US states from the mid-1970s signi�cantly increased cannabis-
related emergency room admissions. Chu [2012] similarly �nds that the passage of US state laws
that allow individuals to use cannabis for medical purposes leads to a signi�cant increase in re-
ferred treatments to rehabilitation centres. Our evidence from London suggests that if a similar
e�ect occurs from the depenalization of cannabis possession, it does not then feed through to sig-
ni�cantly higher rates of hospitalization that involve an overnight stay, which is what our inpatient
administrative data measures. For the bulk of our remaining analysis, we therefore continue to
focus on Class-A hospital admissions among male cohorts of various ages.
4 Baseline Results
4.1 The Impact of the LCWS by Cohort
Table 3 presents estimates of the full baseline speci�cation (2), where we consider the impact of the
LCWS on Class-A drug related hospital admissions rates for three male age cohorts in Columns
1 to 3. These �ndings represent our core results: they show that the addition of time varying
local authority controls makes very little di�erence to the unconditional di�erence-in-di�erence
estimates presented in Table 2: the �rst row shows that in the longer term post-policy period,
there are statistically signi�cant rises in admission rates of between 3 and 6% for the youngest two
15

cohorts in Lambeth, relative to other non-neighboring London boroughs. In line with the earlier
descriptive evidence, no impact of the policy is found on the oldest age cohort, that were aged
34-44 on the eve of the cannabis depenalization policy being introduced in Lambeth.
The second row of Table 3 shows that in the short-run, during the 13 months in which the
LCWS was actually in operation, there are no statistically signi�cant e�ects on hospitalization
rates for two of the three cohorts, and among those aged 25-34 hospitalization rates are actually
declining during the policy period. Hence, as might be expected, any impact of the cannabis
depenalization policy on hospitalization rates for Class-A drug use takes time to work through.
The other coe�cients in Table 3, estimates of β0 and β2, show that for London on average, there
are no signi�cant long-term time trends in admission rates during and after the policy period
for the older two cohorts, once other correlates of admissions rates are controlled for. For the
youngest cohort in Column 1, hospital admission rates are rising over time but the results overall
show that hospitalization rates in Lambeth are diverging away from this London wide average in
the post-policy period, all else equal.17
Our results therefore suggest the depenalization of cannabis led to longer term increases in
the use of Class-A drugs and subsequent hospitalizations related to Class-A drug use among the
younger two age cohorts. If the depenalization policy led to a decline in the equilibrium price
of cannabis in Lambeth, as is often argued to be an unambiguous e�ect of such policies [Kilmer
et al., 2010], then this result suggests that cannabis and Class-A drugs have a negative cross-price
elasticity, so that the two types of illicit drug are contemporaneous complements, or the use of
cannabis serves as gateway to the later use of harder illicit drugs.18 This is in line with other
studies that have estimated the cross-price elasticity between cannabis and an speci�c Class-A
drug: cocaine - either using decriminalization as a proxy for a price reduction [Thies and Register,
1993; Grossman and Chaloupka, 1998], or using actual price information [Williams et al., 2004].
In Table 4 we seek to exploit the richness of our administrative records to examine the long
run policy impacts on age cohorts further subdivided by their histories of hospital admission for
drug and alcohol related diagnoses during the pre-policy period from April 1997 to June 2001.
This allows us to shed light on whether those prior record of substance abuse resulting in hospital
admission respond di�erentially to the depenalization of cannabis than does the rest of the popula-
tion.19 Relative to the existing literature linking drug enforcement policies and health, this allows
us to present novel evidence on the characteristics of the marginal individuals most impacted by
17As mentioned earlier, estimating AR(1) error terms is the most conservative approach: allowing standard errorsto be clustered either by borough or by borough-year leads to far smaller estimates of standard errors for thesebaseline results. This pattern of signi�cant policy impacts across male age cohorts is robust to using slightlydi�erent dependent variable measures of hospitalizations related to Class-A drug use: (i) the absolute number ofadmissions (Totdbqy); (ii) the log of the number of Class-A related admissions per 1000 of the population plus one
Ln(
TotdbqyPopby
+ 1).
18No reliable information on the price of illicit drugs exists at the borough level for our study period.19During this pre-policy period 9368 individuals were admitted to hospital for drugs or alcohol (primary or
non-primary): 710 in the 15-24 cohort; 2709 among those 25-34; and 5949 among those aged 35-44.
16

a policy of depenalizing cannabis. Our coe�cients of interest remain the di�erential impact over
time of the policy in Lambeth relative to the rest of London.
Columns 1 to 3 of Table 4 consider admissions among male each age cohort for those without
a prior record of admissions. The evidence suggests that for all age cohorts, there are signi�cant
increases in Class-A drug related hospitalizations in Lambeth relative to the rest of London in the
post-policy period relative to pre-policy. The impacts are large, ranging from a .042 increase in
the admission rate per thousand among the youngest cohort to a 0.19 increase among the oldest
cohort of men that were aged 35-44 on the eve of the policy. We �nd no evidence of signi�cant
increases in hospitalization rates among each age cohort in the very short run when the LCWS
policy is actually in place (and the point estimates are each smaller than the longer term impacts
in Lambeth): as is intuitive, this suggests that any increase in Class-A drug use as a result of the
policy takes time to work through to increased hospitalization rates.
The London-wide trends in admissions rates shown in the third row of Columns 1 to 3 re�ect
how this samples is de�ned: admission rates for those without previous admissions must necessarily
rise (weakly) over time given they start at zero and cannot be negative. The data suggests that
this upward trend is signi�cantly more pronounced in Lambeth post-policy across all age cohorts.
The remaining Columns in Table 4 then repeat the estimation for each age cohort among those
that have a prior history of at least one hospitalization for drug or alcohol related diagnoses.
These borough-quarter-year aggregates are therefore constructed from fewer individual patients
(ranging from 1,709 individuals in the 15-24 age cohort, 4,397 in the 25-34 age cohort, and 6,165
in the oldest age cohort). The results suggests that in the longer term such cohorts are either not
a�ected by the depenalization policy, or their admission rates decline in the long term.20 However,
relative to the results in Columns 1-3, some of the non-signi�cance of the �ndings on the main
coe�cient of interest, β1, for the cohorts with histories of hospital admissions, are driven by the
coe�cient being less precisely estimated. This imprecision might re�ect the greater heterogeneity
among populations that have histories of hospitalization for drug and alcohol use. Moreover, given
that most individuals begin using illicit drugs early in life, those in older cohorts with histories
of hospitalizations for drug and alcohol use are likely to be long term drug users. Hence on the
margin, such long term drug users appear to be much less clearly impacted by the depenalization
of cannabis in terms of further hospital admissions for Class-A drug use.21 In terms of standard
consumer theory, such long term users might be more habituated in their behavior and less price
sensitive to any change in price of cannabis induced by the depenalization policy.
20This downward trend among the speci�cations based on those with admissions histories partially re�ects thefact that not all such individuals are admitted more than once. Of the 12271 individuals admitted for drugs oralcohol related diagnoses in the pre-policy period, only 56% (6871 individuals) have a second admission at anypoint during the sample period, and only 38% (4684 individuals) have another episode in the policy or post-policyperiod, and this naturally induces a downward time trend to be picked up in β0 and β2.
21This �nding is also consistent with the evidence based on NLSY97 data in Deza [2011] who uses a dynamicdiscrete choice model to document that the gateway e�ect from cannabis to hard drugs use is weaker among olderage cohorts.
17

In summary the evidence suggests that there are quantitatively large impacts of the the police
policy of depenalizing cannabis on public health, as measured in hospitalization rates for Class-A
related drug use, and that a signi�cant portion of this increase is concentrated among individuals
that have no prior history of hospitalization for drug or alcohol related diagnoses. To be clear,
these results cannot be interpreted as suggesting that there are some individuals that start taking
Class-A drugs as a result of the depenalization of cannabis. All we can infer is that those that have
no prior history of hospital admissions related to illicit drugs or alcohol, be it because they were
not consuming illicit drugs, or were consuming them in moderation, are signi�cantly impacted by
the depenalization policy.
4.2 Robustness Checks
We now present robustness check on our principal �ndings. An obvious concern with these results
is that they might in part be confounded by natural time trends in hospitalizations for Class-A
drugs. These time trends might also di�er across age groups and by hospital admissions histories.
To directly address this, we repeat the analysis but augment (2) with controls for borough speci�c
linear time trends. Table 5 presents the results, again broken down for cohorts based on age and
prior admissions histories.22
The inclusion of borough speci�c linear time trends serves to reinforce the earlier conclu-
sions. For the speci�cations in Columns 1-3 by age cohort among those with no prior history of
hospitalization for drug or alcohol related diagnoses, we continue to �nd signi�cant increases in
hospitalization rates in the long run in Lambeth relative to the rest of London. The magnitudes
of these point estimate impacts are in fact larger among each age cohort than was reported in
Table 4 when time trends were not controlled for. Hospitalization rates signi�cantly increase by
.07 among the youngest cohort aged 15-24 on the eve of the policy, increase signi�cantly by .17
among those aged 25-34, and increase signi�cantly by .30 for the oldest age cohort with no history
of hospitalizations for drug and alcohol use.
Columns 4-6 show the impacts among age cohorts with a prior history of hospitalization for
drug or alcohol related diagnosis. In these sub-populations we �nd no signi�cant longer term
increases for any of the age cohorts. Taken together these results reinforce the notion that in the
longer term, the impacts of the policy on public health are very much concentrated among those
that, prior to the policy, had no history of hospitalization for alcohol or drug related diagnoses.23
22For the speci�cations in Columns 1-3 of Table 5 based on samples without a prior record of hospital admissionsthe time trend is set to zero pre-policy and allowed to be linear thereafter (λb×quarters post Q3 2001). For thespeci�cations by age cohort with a history of admissions in Columns 4-6 of Table 5, the borough speci�c time trendis assumed to be linear over the sample period.
23Again the coe�cients on the policy period and post-policy dummy variables, β0 and β2, re�ect the way in whichthe cohorts are de�ned by hospitalization history: for those with no prior history of hospitalizations, hospitalizationrates must necessarily (weakly) rise over time; among those with a prior history of hospitalization, hospitalizationrates must necessarily fall as long as not every individual in this cohort is re-admitted to hospital in the post-policyperiod.
18

A second way to address the concern of whether the results are in part driven by di�erential time
trends in hospitalization rates is to exploit the four years of panel data prior to the introduction
of the depenalization policy. Speci�cally, we use this period to test whether within the pre-policy
period there is any evidence of a divergence in trends in hospitalization rates between Lambeth
and the rest of London. We therefore estimate (2) but additionally control for an interaction
between the Lambeth dummy and a dummy set equal to one from mid way during the pre-policy
period (Q1 2000) until the actual start of the policy (Q2 2001), and zero otherwise. The sample
stops in Q3 2001 when the LCWS policy is actually initiated. As Table A3 shows, for all male age
cohorts and admissions histories, this placebo dummy interaction is not found to be signi�cantly
di�erent from zero suggesting that hospitalization rates in Lambeth are not diverging from London
in the years prior to the depenalization policy. As discussed in Section 2, this is very much in line
with the evidence related to the underlying motivation behind why the policy was introduced,
that emphasized the ability of the police to reallocate their e�ort towards non-cannabis crime,
and which hardly mentioned the potential impacts on public health. Hence the data supports the
assertion that the depenalization policy was not introduced speci�cally into Lambeth because of
concerns over worsening public health related to drug-related hospital admissions. Nor is there any
evidence of reversion to the mean in hospitalization rates with Lambeth converging back towards
London-wide averages.
A second robustness check addresses the concern that the OLS speci�cations estimated do not
account for the censoring in the data: indeed de�ning the dependent variable as in equation (1)
we treat those borough-quarter-year observations in which there are zero admissions the same in
which there are strictly positive numbers of admissions. We address this by re-estimating (2) using
a Tobit model that allows us to estimate the impact of the policy on both the extensive margin (i.e.
the probability that there is at least one admission in a given borough-quarter) and the intensive
margins (the admission rate per borough-quarter, conditional on at least one admission). However,
the introduction of non-linearity means the di�erence-in-di�erence coe�cient no longer equals the
marginal e�ect of the interaction term [Ai and Norton, 2003]. Policy impacts are therefore produced
by using our Tobit estimates to calculate the average interaction term for PPqy × Lambeth and
Pqy×Lambeth.24 Estimated policy e�ects on the extensive and intensive margins are presented in
Table A4 by male age cohort. In line with the baseline results in Table 3, we see that the policy
leads to a statistically signi�cant increase in admission rates on the intensive margin, that is an
increase in the admission rate conditional on at least one admission per borough quarter, for the
two youngest age cohorts. On the extensive margin, namely the probability of a positive admission
24Following Buis [2010], given that both interacted variables are binary, the average interaction e�ect on eachmargin can be calculated by: �rst, using the Tobit estimates to produce the conditional expected value of admissionsfor the four Lambeth x policy period (PPqy or Pqy) cells (e.g, Lambeth = 0, PPqy=0; Lambeth = 1, PPqy = 0;Lambeth = 0, PPqy = 1; Lambeth = 0, PPqy = 0); and, second, taking the double di�erence of those conditionalexpected admission rates. The average interaction e�ect for the intensive margin in the post-policy period istherefore equal to the following:
19

rate, the impact is positive but not statistically signi�cant except for the oldest cohort.
4.3 Interpretation
Throughout the analysis we have used the borough of residence at the time of admission to build
hospitalization rates across cohorts. The documented increase in hospital admissions for Class-A
drug related diagnoses in Lambeth following the introduction of the LCWS might then operate
through two mechanisms: (i) a change in behavior of those resident in Lambeth prior to the
policy; (ii) a change in the composition of Lambeth residents, with the policy inducing a net
in�ow of people into the borough with a higher propensity for Class-A drug use. Undoubtedly, the
geographical distances between London boroughs are small and travel costs are low relative to the
�xed costs of permanently changing residence. However, if drug users perceive the depenalization
of cannabis in Lambeth as signaling a wider weakening of police enforcement against all illicit
drugs, there might be longer term bene�ts to relocating to the borough. Our results pick up the
combined e�ect of both channels, but for policy design it is useful to understand whether both
channels are indeed at play. In this subsection we therefore try to shed some light on the extent
to which our results might be explained by the migration of drug users into Lambeth from other
parts of London as a result of the depenalization policy.25
The HES data contain information on borough of residence for each individual admission to
hospital, with individual identi�ers allowing us to link patients across episodes and time. The
major limitation of using hospital administrative records to shed light on changes in borough of
residence in response to the policy, is that for those that are admitted only once during the study
period, the data does not allow us to identify whether they have changed residence over time
prior to the admission, or will do so subsequent to the admission. These individuals, that form
the bulk of hospital admissions and that are included in the main analysis, cannot be included in
the analysis below examining migration patterns. While this obviously limits our ability to shed
light on the potential net migration into Lambeth of drug users in response to the depenalization
policy, we know of no data set representative at the London borough level, that would match both
changes in residence over time with individual hospital admissions or health outcomes over time.
β3 = (E[ARqyb|PPqy = 1, Lb = 1, λb, λq, λy, Xbqy, ARqyb > 0]−
E[ARqyb|PPqy = 0, Lb = 1, λb, λq, λy, Xbqy, Admitsqyb > 0])−
(E[ARqyb|PPqy = 1, Lb = 0, λb, λq, λy, Xbqy, Admitsqyb > 0]−
E[ARqyb|PPqy = 0, Lb = 0, λb, λq, λy, Xbqy, Admitsqyb > 0]) (3)
where the conditional expected values are taken over all observations and then averaged. The correspondingdi�erence-in-di�erence coe�cient on the extensive margin (the probability of a non-zero admission rate) can becalculated analogously. The exercise is repeated for the policy-period.
25We thank Jonathan Caulkins and Libor Dusek for comments that have motivated this subsection.
20

We therefore proceed by documenting changes in borough of residence for those that have at
least two admissions into hospital between 1997 and 2007. To get a sense of the sample selection
this induces, we note that in the pre-policy period, 326,683 men are admitted into hospital for any
diagnosis, of which 10.6% are re-admitted (at least once) somewhere in London during the one-year
period in which the LCWS policy is in place, and 25.3% are re-admitted (at least once) anytime in
the post-policy period. Among those 1,746 individuals admitted for Class-A drug related diagnosis
in the pre-period, only 14.7% are observed being re-admitted for any diagnosis during the policy
period, and 28.2% are observed being re-admitted for any diagnosis during the post-policy period.
If individuals are induced to migrate to Lambeth in response to the depenalization policy,
they might do so at some point during its actual period of operation between June 2001 and July
2002. To check for this, we �rst focus on those 1,630 individuals that are admitted to hospital
for any diagnosis in Lambeth during the policy period, and that are observed having at least one
prior hospital admission somewhere in London pre-policy. Of these 1,630 individuals, 1.7% are
admitted for Class-A related diagnosis in Lambeth during the policy period. These are perhaps
the most likely individuals to have moved to Lambeth in speci�c response to the depenalization
policy. However we note that among this group, almost all their earlier pre-policy admissions (for
any diagnosis) occur in Lambeth, so that there is no strong evidence of these individuals having
recently moved to Lambeth during the policy period.
While these results focus on those admitted for Class-A drug related diagnosis in Lambeth
during the policy period, it might well be the case that drug users that migrate into Lambeth
because of the policy are �rst admitted for some other diagnosis. Hence, we next focus on the
98.3% of hospital admissions in Lambeth during the policy period for any diagnosis unrelated
to Class-A drug usage. Among these individuals, nearly all of them are observed with all their
earlier admissions in Lambeth; only 10.3% have their last prior admission in some other borough,
indicating that they changed their borough of residence at some point between their last admission
and the end of the policy period. Taken together, these two pieces of evidence show that among
those men with at least two hospital admissions since 1997, there is very limited evidence of there
being signi�cant changes of residence into Lambeth during the formal policy period between June
2001 and July 2002.
Our next set of results examines longer term patterns of changes in borough residence. Given
the �xed costs of changing residence and that in the post-policy period policy enforcement in
Lambeth remained somewhat di�erent than other boroughs, it might be reasonable to assume
that a net in�ow of drug users into Lambeth simply takes some time to occur. To check for this
we examine whether in�ows into Lambeth from other London boroughs change between two four-
year windows: the �rst four year window occurs entirely pre-policy from April 1997 to April 2001,
and the second four year window occurs entirely post-policy from April 2003 to April 2007. In
each window we check whether among those admitted to hospital at least twice in the four-year
window, and, where at least one admission relates to a diagnosis indicating Class-A drug use,
21

whether changes in borough of residence between the �rst and last admission vary over time.
In the �rst four-year pre-policy window from 1997-2001 we observe: (i) of those that have their
�rst admission outside of Lambeth, 1.4% are observed with a later admission in Lambeth; (ii) of
those that have their �rst admission in Lambeth, 16% are observed with a later admission outside
of Lambeth. Doing the same for the later four-year window from 2003-7 to see if this pattern of
migration is altered in the longer term, we �nd that: (i) of those that have their �rst admission
outside of Lambeth, 3.0% are observed with a later admission in Lambeth; (ii) of those that have
their �rst admission in Lambeth, 30% are observed with a later admission outside of Lambeth.
Hence there is evidence of more frequent changes of residence among this subsample post-policy,
but that this increase occurs both into Lambeth and from Lambeth: the in�ow into Lambeth
from other boroughs in the post-policy window relative to the pre-policy window increases (3.0%
relative to 1.8%), but this is o�set by the percentage increase in out�ows from Lambeth to other
boroughs among such individuals (30% relative to 16%).26 Overall this suggests is that, among
those with multiple hospital admissions, there is increased mobility of residents across boroughs
over time, but there is no strong evidence of systematically increased in�ows into Lambeth over
the second four year window relative to the �rst.
5 Extended Results
In this Section we consider three margins of policy impact in more detail: the dynamic response,
spillover e�ects into neighboring boroughs driven by drug tourism (rather than permanent changes
in residence), and the severity of hospital admissions. Establishing the existence and magnitude
of each e�ect is important to feed into any assessment of the overall social costs of the change in
drug enforcement policy.
5.1 The Dynamics of the Response
When investigating how the impact of the depenalization policy on hospitalizations for Class-
A drugs evolves over time, our objectives are two-fold: to assess how long the change in police
enforcement took to �lter through to hospital admissions, and whether, and how quickly, those
e�ects eventually die out. To chart the time pro�le of responses, we replace the post-policy period
indicator in (2), PPqy, with three 2-year time-bins: 1-2 years post reform (Q3 2002 to Q2 2004,
TB1); 3-4 years post reform (Q3 2004 to Q2 2006, TB2); and, 5-6 years post reform (Q3 2006 to
26One additional strategy we considered to shed light on changes in residence induced by the policy. First, weconsidered using the administrative records on outpatients, that would include visits to general practitioners andlocal health clinics. Such events are far more common than hospital admissions. However such data only reliablyexists in the post-policy period from 2006/7, and contains no information on diagnosis.
22

Q2 2008, TB3),
Admitdbqy = α + β0Pqy + β1[Lb × Pqy] +3∑
k=1
(µkTBkqy + γk[Lb × TBk
qy])
+ δXbqy + λb + λq + ubqy (4)
where all other variables are as previously de�ned. This speci�cation is estimated for each 10-
year age cohort by pre-policy drugs or alcohol admission history. Impacts of LCWS on admission
rates in Lambeth, in each time period (β1, γ1, γ2, and γ3), are then plotted in Figures 1A and
1B. Figure 1A shows that for those who were not admitted for drugs or alcohol in the pre-policy
period, there is a similar inverse-U shaped pattern of dynamic responses across age cohorts. For
each cohort the depenalization policy has no impact during the policy period, estimated impacts
increase thereafter for some time before starting to decline. In line with the evidence in Tables
4 and 5, the magnitudes of the impacts are largest for those in the older cohorts aged 25-34 and
35-44: for these two age cohorts, the policy impacts are over .20 three to four years into the
post-policy period: this corresponds to more than a 100% increase in hospitalization rates relative
to the pre-policy baseline levels in Lambeth for the 25-34 age cohort, and a 55% increase for the
35-44 age cohort. In the �nal period considered, 4-6 years into the post-policy period, we see that
there remain signi�cant policy impacts among all three age cohorts, although the policy impact is
trending downwards so that eventually the impact would be expected to go to zero.
In comparison to the literature linking policies to regulate the market for illicit drugs and public
health, these dynamic responses are of signi�cant duration. For example, Dobkin and Nicosia [2009]
study the impact of a government program designed to reduce the supply of methamphetamine on
hospitalization rates (by targeting precursors to methamphetamine), as well as other outcomes.
This policy is sometimes claimed to have been the DEA's greatest success in disrupting the supply
of an illicit drug in the US and indeed Dobkin and Nicosia [2009] �nd that the policy had signi�cant
impacts on public health. However, they document that these e�ects were short lived: within 18
months admissions rates had returned to pre-intervention levels. In contrast, the depenalization
policy we document has an impact on hospitalization rates that lasts at least 5-6 years post-policy
for many cohorts even though the policy itself is only in place for a year.
The dynamic impacts among those who have been previously hospitalized for a drug or alcohol
related diagnosis in the pre-policy period are very di�erent, as shown in Figure 1B. In line with
the regression results shown with and without time trends in Tables 4 and 5 for these cohorts,
there are few policy impacts among these cohorts as measured by hospitalization rates related to
Class-A drug use.
These dynamic results con�rm further reinforce the earlier �nding that the impacts of the
depenalization of cannabis possession on hospitalization rates related to Class-A drug use, are in
the longer term concentrated among those with no prior history of hospitalizations for such drug
23

use. The impacts on hospitalizations related Class-A drug us take a year or two to emerge after
the policy if �rst initiated, and among cohorts with no prior history of admissions for Class-A
drug use or alcohol use, the policy impacts remain above pre-intervention levels six years after the
depenalization policy is �rst introduced.
5.2 Spillovers in Neighboring Boroughs
As discussed earlier, when studying the impacts on crime of the LCWS policy, Adda et al. [2011]
provide detailed evidence that the depenalization of cannabis in Lambeth induced a substantial
degree of drug tourism from geographically neighboring boroughs into Lambeth. Indeed such
drugs tourism can explain around half the estimated long run increase in cannabis possession
o�ences within Lambeth. We analyze whether there are similar spillover e�ects on public health
in Lambeth's neighbors, in terms of hospital admission rates for Class-A related drugs. Our
administrative data on hospital admissions further allows us to shed light on the nature of drug
tourists, by exploring how the marginal individual impacted in neighboring boroughs di�ers from
the marginal individual resident in Lambeth itself.
To do so we augment (2) with interactions between the policy and post-policy period and
whether the borough (of residence) is a geographic neighbor (Nl = 1) or not (Nl = 0).27 As the
characteristics of drug tourists might correlate to their pre-policy hospital admissions history, we
�nd it informative to again split the results by age and admissions history cohorts.
Table 6 presents the results. The �rst two rows correspond the policy impacts in Lambeth and
follow the same patterns of signi�cance and magnitudes as previously discussed in Table 4. The
third row, showing the coe�cient on the interaction term between the policy-policy dummy and
the dummy for whether the borough is a neighbor to Lambeth (Nl = 1) is the coe�cient of interest
for understanding whether there are spillover impacts on public health from the depenalization
policy. In Columns 1 to 3 we see that among those without pre-policy admissions histories, there
are signi�cant increases in admissions rates in neighboring boroughs for the 25-34 and 35-44 age
cohorts. As might be expected, the magnitude of the impacts are smaller in neighboring boroughs
than in Lambeth itself: for the 25-34 cohort, the estimated .074 rise in neighboring boroughs is still
signi�cantly smaller than the corresponding increase in Lambeth (.142). The impact for the 35-44
cohort is around four times larger in Lambeth (.195) than in neighboring boroughs (.047), with the
di�erence being statistically signi�cant at the 1% level as shown at the foot of Table 6. As with
the results within Lambeth, we �nd no evidence that hospital admissions rates for Class-A drug
us in neighboring boroughs rise during the short run when the depenalization policy is actually in
place in Lambeth.
Columns 4 to 6 then focus on those with histories of hospitalization for drug or alcohol related
diagnoses. As with the �ndings in Lambeth, the impacts among those cohort - across all age
27Boroughs that neighbor Lambeth are Southwark, Croydon, Wandsworth and Merton.
24

groups - are not statistically di�erent from zero for the two younger age cohorts, and negative for
the oldest age cohort. As shown at the foot of Table 6, for all cohorts we cannot reject the null
that the long run policy impact in Lambeth di�ers from that in neighboring boroughs.
Taken together these results suggest that among those that reside in neighboring boroughs, the
drug tourists that are induced to travel to Lambeth as a result of the depenalization of cannabis
are more likely to be those that have no prior history of hospitalization for drug or alcohol: these
cohorts include those that are likely to have never consumed cannabis or consumed it in small
quantities. This is the same cohort of individuals that we previously found to be most directly
a�ected among residents of Lambeth. Reassuringly, the magnitudes of these spillovers in public
health are smaller than the direct impacts documented within Lambeth. Among those cohorts
whose prior involvement is risky behavior has been extreme enough to result in hospital admission
for diagnoses related to illicit drugs or alcohol, relatively fewer individuals are induced to travel
to Lambeth as a result of cannabis being depenalized there. This is closely in line with the direct
results for Lambeth presented in Tables 4 and 5.
5.3 Severity of Hospital Admissions
A third dimension along which to consider policy impacts relates to the severity of hospitalizations,
as measured by the number of days the individual is required to stay in hospital for. This margin
is of policy relevance because it maps directly into the resultant healthcare costs associated with
the depenalization of cannabis, as calculated below in Section 5.4. We therefore �rst document
how the length of individual hospital episodes for diagnoses related to Class-A drug use changes
di�erentially between Lambeth and other London boroughs post-policy relative to the pre-policy
period. To do so, we estimate a speci�cation analogous to (2) but where the dependent variable
is the individual length of hospital stay in days and the sample is con�ned to episodes where the
primary diagnoses relates to Class-A drugs. We focus on the �rst episode for any hospital stay
(that is the same as the entire hospital stay for 93% of observations), and to avoid the results being
driven by outliers, we drop observations where the length of the stay is recorded to be longer than
100 days (that excludes a further 2% of all stays).28
Table 7 presents the results, again split by age cohort. The data suggests that in the longer
term post-policy, across all three age cohorts, the length of stay signi�cantly increases in Lambeth
relative to the London average. For example, among the 15-24 age cohort, hospital stays increased
by 3.7 days, and this is relative to a baseline pre-policy hospital stay length of 7.2 days, an
increase of 49%. The proportionate changes for the other age cohorts are 29% for the 25-34 age
cohort and 20% for the oldest age cohort. Hence, the proportionate changes in length of hospital
stay are greater for age cohorts that were younger at the time the depenalization policy was
28These results remain robust to having the dependent variable speci�ed in logs so that outliers are less likely todrive the estimated impacts.
25

introduced. This emphasizes that quite apart from the impacts of the depenalization of cannabis
on hospitalization rates for Class-A diagnosis that has been the focus of our analysis so far, the
policy also has impacts on the severity of those admissions for Class-A drug use. Both margins
are relevant for thinking through the public health costs of the policy as detailed in the next
subsection.
Finally, the coe�cients in the third row of Table 7 show that in other London boroughs there
are negative time trends in the duration of such individual hospitalizations conditional on all other
controls in (2). Hence the �ndings for Lambeth post-policy do not appear to be driven by some
systematic lengthening of hospital stays for such diagnosis that might be occurring more generally
across London.
5.4 The Public Health Costs of the Depenalization Policy
Our �nal set of results attempt to provide a lower bound estimate of the public health costs to
Lambeth associated with the depenalization policy, as measured exclusively through hospitaliza-
tions related to Class-A drug usage. This combines the earlier unconditional estimates from Table
2 (that do not di�er much from the baseline estimates in Table 3) on changes in the number of
individuals being hospitalized for such diagnosis, and the results from Table 7 showing the pol-
icy impacts on the length of hospital episodes, holding constant hospitalization rates related to
Class-A diagnoses. Combining the evidence on both margins allows us to infer the overall increase
in hospital bed-days related to Class-A drug use attributable to the depenalization policy. More
speci�cally, the change in average hospital-bed days from the pre to the post policy periods, per
quarter for residents of borough b in cohort c is given by,
4Hbc = Npost,bcLpost,bc − Npre,bcLpre,bc (5)
where Npost,bc represents the number of admissions per quarter in the post period in borough b for
cohort c, and Lpost,bc is the average length of stay of those that are admitted in this group in the
post-policy period; Npre,bc and Lpre,bc are of course analogously de�ned over the pre-policy period.
Rearranging (5), the change in hospital bed-days can be decomposed as occurring through two
channels,
4Hbc = (Npost,bc −Npre,bc)Lpre,bc +Npost,bc(Lpost,bc − Lpre,bc) (6)
The �rst channel represents the policy impact occurring through a change in the number of hospital
admissions for Class-A diagnoses, holding constant the length of stay �xed at the pre-reform levels.
The (Npost,bc − Npre,bc) term can be straightforwardly derived from the unconditional baseline
estimates presented in Table 2. The second channel represents the policy impact through a change
26

in the average length of hospital stays, holding constant admission numbers at the post-policy
level. The (Lpost,bc−Lpre,bc) corresponds exactly to the estimates reported for each cohort in Table
7. The total public health cost of the policy is then 4Hbc multiplied by the cost of a hospital
bed-day.
We use published National Health Service estimates of the cost per hospital bed-day.29 This cost
is comprised largely of hospital ward costs (nursing, therapies, basic diagnostics and overheads),
hence there is actually little variation by diagnosis: the average cost per additional bed day across
all adult inpatient diagnoses categories is ¿240 [Department of Health, 2012], but the upper end
of the hospital bed-day costs, relating to those for adult acute (inpatient) mental health stays, are
only slightly higher at ¿295 [PSSRU, 2011]. We therefore use a �gure between these estimates,
of ¿250 per hospital bed-day, as quoted by the NHS Institute [NHS Institute, 2012]. This likely
represents a lower bound of the true cost of a hospital bed-day because it does not include any
speci�c treatment costs or the additional costs from any associated stay in intensive care.
We then take our estimates from Tables 2 and 7 for each age cohort to calculate each component
of (6). For the youngest age cohort of those 15-24 on the eve of the depenalization policy, 4Hbc
=27.2 bed-days per quarter; of this total change, 24.1 bed-days operate through the �rst channel
of increased hospitalization rates, and 4.1 bed-days through the second channel of longer hospital
stays conditional on admission. Among those aged 25-34 on the eve of the policy, 4Hbc =52.5
bed-days per quarter, where the �rst channel corresponds to an increase of 42.6 bed-days, and
the second component generates an increase of 9.9 bed-days. Finally, for the oldest cohort of
35-44 year olds, 4Hbc =-26.9 bed-days per quarter, where the point estimate in the third row of
Table 2 implies a decrease in hospitalization rates post-policy of 30.7 bed-days (although this point
estimate was not statistically di�erent from zero), and this is only partially o�set by the increase
through the second channel of 3.8 bed-days.
Applying the estimated costs per hospital bed-day of ¿250 to the change in the total number
of hospital bed-days per quarter, for each cohort in Lambeth in the post-policy period on average,
reveals the increased public health cost to be: (i) ¿6,802 among those aged 15-24 on the eve of
the policy; (ii) ¿13,136 among those aged 25-34 on the eve of the policy. Summing across four
quarters we derive the conservative public health cost of the depenalization policy to be ¿79,752
per annum, on average across all the post-policy years in the sample.
There are a number of ways this monetary amount can be benchmarked. One way to do this
would be relative to health costs in Lambeth as a whole. However, there are multiple components
of health costs related to preventative and curative care, and it is unclear which subset of these
costs provide the most appropriate benchmark. Moreover, in England health expenditures stem
from both local borough sources but also expenditures of the national government. Given these
29Since 2003/4, hospitals have been paid a price or �tari�� for each patient, based on the diagnosis group. Theseare based on the average stay for the diagnosis group. Additional days spent in hospital are paid at a daily rate.Prior to 2003/4, including the period covered by the LCWS, funding was not as strongly linked to patient numbersor diagnoses.
27

complications, perhaps the more transparent method through which the benchmark the public
heath costs of the depenalization policy is to compare it to the London-wide time trends in hospital
bed-days, by cohort. This provides a sense of the increased public costs through natural rises over
time in hospital bed-days for hospitalizations related to Class-A drug use that would have to be
borne between the pre and post policy periods absent the depenalization policy. More precisely
this London-wide time trend for cohort c is given by,
4Hc = (Npost,c −Npre,c)Lpre,c +Npost,c(Lpost,c − Lpre,c), (7)
where (Npost,c − Npre,c) can be derived from the coe�cient on the post-policy dummy presented
in the unconditional estimates in Table 2, and (Lpost,c − Lpre,c) is measured from the coe�cient
on the post policy dummy in Table 7. For the youngest age cohort of those 15-24 on the eve of
the depenalization policy, 4Hc =3.79 bed-days per quarter; of this total change, −4.7 bed-days
operate through the �rst channel of increased hospitalization rates, and 8.5 bed-days through the
second channel of longer hospital stays conditional on admission. Among those aged 25-34 on
the eve of the policy, 4Hc =−3.5 bed-days per quarter, where the �rst channel corresponds to a
decrease of 6.5 bed-days, and the second component generates an increase of 3.0 bed-days. Finally,
for the oldest cohort of 35-44 year olds, 4Hbc =−2.4 bed-days per quarter, where the �rst channelcorresponds to an increase of 2.6 bed-days, and the second component generates a decrease of 5.2
bed-days.
Aggregating these cohorts across four quarters then suggests the natural decrease in costs
associated with hospital bed-days is ¿4,935. Hence the increase in bed-days attributable to the
policy more than o�sets this natural decrease in hospital bed-days attributable to London wide
time trends.
Of course, this calculation still underestimates the total public costs of the increased hospital
bed days within Lambeth due to the policy because of the existence of many additional channels
that we have ignored. First, we have ignored any additional demands placed on other parts of the
national health service unrelated to hospital inpatient stays, as a result of the depenalization pol-
icy. These include demands through outpatient appointments, hospital emergency departments,
and through treatment centres. Indeed, the existing evidence from the US on the link between
the availability of cannabis and health relate to emergency or treatment costs: Model [1993] �nd
that the de facto decriminalization of cannabis in twelve US states from the mid-1970s signi�-
cantly increased cannabis-related emergency room admissions. Chu [2012] similarly �nds that the
passage of US state laws that allow individuals to use cannabis for medical purposes leads to a
signi�cant increase in referred treatments to rehabilitation centres. Second, we have ignored any
cost to individual users of being hospitalized. Such events almost surely impact individual welfare,
especially given the robust association found across countries in the gradient between health and
life satisfaction.
28

6 Discussion
We evaluate the impact of a policing experiment that depenalized the possession of small quantities
of cannabis in the London borough of Lambeth, on hospital admissions related to illicit drug
use. Despite health costs being a major social cost associated with markets for illicit drugs,
evidence on the link between how such markets are regulated and public health remains scarce.
Our analysis provides novel evidence on this relationship, at a time when many countries are
debating moving towards more liberal policies towards illicit drugs markets, with the depenalization
or decriminalization of cannabis possession as the most often suggested or implemented policy.
We have exploited administrative records on individual hospital admissions classi�ed by ICD-10
diagnosis codes, that have previously not been much used by economists. We use these records to
construct a quarterly panel data set by London borough running from 1997 to 2009 to estimate
the short and long run impacts of the depenalization policy unilaterally introduced in Lambeth
between 2001 and 2002.
We �nd the depenalization of cannabis had signi�cant longer term impacts on hospital admis-
sions related to the use of hard drugs. Among Lambeth residents, the impacts are concentrated
among men in younger age cohorts, and among those with no prior history of hospitalization re-
lated to illicit drug or alcohol use. The dynamic impacts across cohorts vary in pro�le with some
cohorts experiencing hospitalization rates remaining above pre-intervention levels six years after
the depenalization policy is �rst introduced. We �nd evidence of smaller but signi�cant positive
spillover e�ects in hospitalization rates for hard drug use among residents in boroughs neighbor-
ing Lambeth, and these are again concentrated among younger cohorts without prior histories
of hospitalizations related to illicit drug or alcohol use. We combine these estimated impacts on
hospitalization rates with estimates on how the policy impacted the severity of hospital admissions
to provide a lower bound estimate of the public health cost of the depenalization policy.
Our analysis contributes to the nascent literature evaluating the health impacts of changes
in enforcement policies in the market for illicit drugs. The depenalization of cannabis is one of
the most common forms of such policy either implemented (such as in the Netherlands, Australia
and Portugal) or being debated around the world (such as in many countries in Latin America).
The practical way in which the depenalization policy we study was implemented is very much in
line with policy changes in other countries that have changed enforcement strategies in illicit drug
markets and as such we expect our results to have external validity to those settings. However
unlike those settings, we are able to exploit a (within-city) borough level intervention and so
estimate the policy impacts using a di�erence-in-di�erence design, as well as exploring di�erential
impacts across population cohorts, where cohorts are de�ned by gender, age, previous admissions
history, and borough of residence. This is di�erent from much of the earlier research that, with the
exception of studies based on US or Australian data, can typically only study nationwide changes in
drug enforcement policies such as depenalization, and have therefore had to rely on time variation
29

alone to identify policy impacts [Reuter, 2010]. The administrative records we exploit allow us to
provide novel evidence on how the impacts of such policies vary across population cohorts, over
time within a cohort, how they interact with potential changes of residence of drug users, and how
drug tourism might be induced without permanent changes in residence.
Clearly, such policy impacts are unlikely to ever be estimated using randomized control trial
research designs. We have used a di�erence-in-di�erence research design exploiting an unusual
policy experiment in one London borough that allows us to exploit within and across borough
di�erences in health outcomes to identify policy impacts. The key concern with such a research
design is to distinguish policy impacts from time trends. To do so, we have used the detailed
administrative records to present evidence on how di�erent cohorts (by gender, age and previous
admissions history) are di�erentially impacted by the policy, how the results are strengthened
when controlling for time trends, and checked for the presence of trends in the pre-policy period.
Our results suggest policing strategies have signi�cant, nuanced and lasting impacts on public
health. In particular our results provide a note of caution to moves to adopt more liberal approaches
to the regulation of illicit drug markets, as typically embodied in policies such as the depenalization
of cannabis. While such policies may well have numerous bene�ts such as preventing many young
people from being criminalized (around 70% of drug-related criminal o�ences relate to cannabis
possession in London over the study period), allowing the police to reallocate their e�ort towards
other crime types and indeed reduce total crime overall [Adda et al., 2011], there remain potentially
o�setting costs related to public health that also need to be factored into any cost bene�t analysis
of such approaches.
Two further broad points are worth reiterating. First, our analysis relates to the more general
study of the interplay between the consumption of di�erent types of drug. In particular there
is a large literature testing for the �gateway hypothesis� that the consumption of one �soft� drug
causally increases the probability of subsequently using a �harder drug�. The crucial challenge for
identi�cation is the potential for unobserved factors or heterogeneity that could drive consumption
of multiple types of drug. Existing work has tried to tackle this problem by either: (i) instrumenting
the gateway drug with a factor unrelated to the underlying heterogeneity, typically using cigarette
and alcohol prices [Pacula, 1998; Beenstock and Rahav, 2002; DiNardo and Lemiuex, 2001]; or, (ii)
using econometric techniques to model the possible e�ects of unobserved heterogeneity [van Ours,
2003; Pudney, 2003; Melberg et al., 2010]. To be clear, in our analysis we make no attempt to
test for gateway e�ects directly, but our contribution to this literature is to demonstrate that the
markets for cannabis and hard drugs are concretely linked - be it because of gateway e�ects or some
other channel - so that changes in policy that a�ect one market will have important repercussions
for the other [DeSimone and Farrelly, 2003; van Ours and Williams, 2007; Bretteville-Jensen et al.,
2008].
Finally, our analysis highlights the impact that policing strategies can have on public health
more broadly. It is possible that other policing strategies, such as police visibility or zero-tolerance
30
policies, could also have �rst order implications for public health. These e�ects could operate
through a multitude of channels including: (i) police behavior directly impacting markets and
activities that determine individual health, such as the case studied in this paper; (ii) police
behavior a�ecting perceptions of crime and thus in�uencing psychic well-being. This possibility
opens up a rich area of further study at the nexus of the economics of crime and health.
References
Adda, J., B. McConnell, and I. Rasul [2011]. Crime and the Depenalization of Cannabis Possession:
Evidence from a Policing Experiment, Mimeo, University College London
Ai, C. and E. Norton [2003]. �Interation Terms in Logit and Probit models�. Economic Letters,
80: 123�129
Becker, G. and K. Murphy [1988]. �A Theory of Rational Addiction�. Journal of Political Economy,
96: 675�700
Beenstock, M. and G. Rahav [2002]. �Testing the Gateway Theory: Do Cigarette Prices A�ect
Illicit Drug Use?� Journal of Health Economics, 21: 679�698
Bretteville-Jensen, A. L., H. O. Melberg, and A. M. Jones [2008]. �Sequential Patterns of Drug Use
Initiation: Can we Believe in the Gateway Theory?� The B.E. Journal of Economic Analysis
& Policy, 8: 2
Buis, M. [2010]. �Stata tip 87: Interpretation of Interactions in Non-Linear Models�. Stata Journal,
10: 305�308
Caulkins, J. P. [2000]. �Drug Prices and Emergency Department Mentions for Cocaine and Heroin�.
Journal of Public Health, 91: 1446�1448
Chu, Y.-W. [2012]. Medical Marijuana Laws and Illegal Marijuana Use, Mimeo, Michigan State
University
Colea, J. C., A. Goudiea, M. Fielda, A.-C. Loverseeda, S. Charltona, and H. Sumnall [2004]. �The
E�ects of Perceived Quality on the Behavioural Economics of Alcohol, Amphetamine, Cannabis,
Cocaine, and Ecstasy Purchases�. Drug and Alcohol Dependence, 94: 183�190
Condon, J. and N. Smith [2003]. �Prevalence of Drug Use: Key Findings from the 2002/2003
British Crime Survey�. Home O�ce Findings 229
Dark, S. and M. Fuller [2002]. �The Lambeth Cannabis Warning Pilot Scheme�. MPA Report
Report 17 (http://www.mpa.gov.uk/committees/mpa/2002/020926/17/).
31

Department of Health [2012]. �NHS Payment by Results 2010-
11 National Tari� Information�. URL http://data.gov.uk/dataset/
payment-by-results-2010-11-national-tariff-information
DeSimone, J. and M. Farrelly [2003]. �Price and Enforcement E�ects on Cocaine and Marijuana
Demand�. Economic Inquiry, 41: 98�115
Deza, M. [2011]. Is There a Stepping-Stone E�ect in Drug Use? Separating State Dependence
from Unobserved Heterogeneity Within and Across Illicit Drugs, Mimeo, University of California,
Berkeley
DiNardo, J. [1993]. �Law Enforcement, the Price of Cocaine and Cocaine Use�. Mathematical and
computer Modelling, 17: 53�64
DiNardo, J. and T. Lemiuex [2001]. �Alcohol, Marijuana and American Youth: The Unintended
E�ects of Government Regulation�. Journal of Health Economics, 20: 991�1010
Dobkin, C. and N. Nicosia [2009]. �The War on Drugs: Methamphetamine, Public Health, and
Crime�. American Economic Review, 99: 324�349
Donohue, J., B. Ewing, and D. Peloquin [2011]. Rethinking America's Illegal Drug Policy, NBER
Working Paper 16776
Gordon, L., L. Tinsley, C. Godfrey, and S. Parrott [2006]. �The Economic and Social Costs of Class
A Drug Use in England and Wales, 2003/04�. In N. Singleton, R. Murray, and L. Tinsley, (Eds.)
�Measuring Di�erent Aspects of Problem Drug Use: Methodological Developments�, Home O�ce
Online Report 16/06. Home O�ce
Grossman, M. and F. J. Chaloupka [1998]. �The Demand for Cocaine by Young Adults: A Rational
Addiction Approach�. Journal of Health Economics, 17: 427�474
Grossman, M., F. J. Chaloupka, and K. Shim [2002]. �Illegal Drug Use and Public Policy�. Health
A�airs, 21: 134�145
Hughes, C. E. and A. Stevens [2010]. �What Can We Learn from the Portuguese Decriminalisation
of Illicit Drugs?� British Journal of Criminology, 50: 999�1022
Kilmer, B., J. Caulkins, R. Pacula, R. MacCoun, and P. Reuter [2010]. Altered State? Assessing
How Marijuana Legalization in California Could In�uence Marijuana Consumption and Public
Budgets, RAND Occasional Papers 315-RC. RAND Corporation
MacCoun, R. and P. Reuter [2001]. Drug War Heresies: Learning from Other Vices, Times and
Places. Cambridge University Press
32

Melberg, H. O., A. M. Jones, and A. L. B. Jensen [2010]. �Is Cannabis a Gateway to Hard Drugs?�
Empirical Economics, 38: 583�603
Model, K. [1993]. �The E�ect of Marijuana Decriminalisation on Hospital Emergency Room Drug
Episodes: 1975-1978�. Journal of the American Statistical Association, 88: 737�747
NHS Institute [2012]. �Quality and Service Improvement Tools. Length of Stay - Improving Length
of Stay�. URL http://www.institute.nhs.uk/quality_and_service_improvement_tools/
quality_and_service_improvement_tools/length_of_stay.html. Last accessed 10/11/2012
Nutt, D., I. A. King, W. Saulsbury, and C. Blakemore [2007]. �Development of a Rational Scale
to Assess the Harm of Drugs of Potential Misuse�. Lancet, 369: 1047�1053
O�ce for National Drug Control Strategy [2004]. �The Economics Costs of Drug Abuse in the
United States 1992-2002�. ONDCP Publication No. 207303
O�ce for National Drug Control Strategy [2011]. �2011 Nation Drug Control Strategy�
O�ce for National Statistics [2011]. �Population Estimates for UK, England and Wales, Scotland
and Northern Ireland - Current Datasets�
Pacula, R. L. [1998]. �Does Increasing the Beer Tax Reduce Marijuana Consumption?� Journal
of Health Economics, 17: 557�585
PSSRU [2011]. �Unit Costs of Health and Social Care 2011�. URL http://www.pssru.ac.uk/
project-pages/unit-costs/2011/index.php
Pudney, S. [2003]. �The Road to Ruin? Sequences of Intiation to Drugs and Crime in Britain�.
Economic Journal, 113: C182�C198
Reuter, P. [2010]. Marijuana Legalization What Can Be Learned from Other Countries?, RAND
Working Paper WR-771-RC
Thies, C. and C. Register [1993]. �Decriminalization of Marijuana and the Demand for Alcohol,
Marijuana and Cocaine�. Social Science Journal, 13: 385�399
van Ours, J. [2003]. �Is Cannabis A Stepping-Stone for Cocaine?� Journal of Health Economics,
22: 539�554
van Ours, J. and J. Williams [2007]. �Cannabis Prices and Dynamics of Cannabis Use�. Journal
of Health Economics, 26: 578�596
Williams, J., R. L. Pacula, F. J. Chaloupka, and H. Wechsler [2004]. �Alcohol and Marijuana
Use Among College Students: Economic Complements or Substitutes?� Health Economics, 13:
825�843
33

Means, standard deviations in parentheses, standard errors in square brackets
Admitted in 2000-2004 for:
Cannabis Related Diagnoses .092 .011 .005 .001
(.289) (.105) (.071) (.034)
Class-A Related Diagnoses .054 .257 .022 .004
(.227) (.440) (.145) (.061)
Alcohol Related Diagnoses .060 .064 .225 .015
(.238) (.245) (.418) (.121)
All Other Diagnoses .283 .146 .208 .316
(.451) (.353) (.409) (.465)
Observations (individuals) 533 3950 15595 485992
Table 1: Hospital Re-admission Probabilities
Admitted in 1997 or 1998 for:
(1) Cannabis Related
Diagnoses
(2) Class-A Drug
Related Diagnoses
(3) Alcohol Related
Diagnoses
(4) All Other
Diagnoses
Notes: *** denotes significance at 1%, ** at 5%, and * at 10% level. The figures refer to the probability of re-admission as a hospital inpatient over the period 2000 to 2004, conditional on an earlier hospital admission in 1997 or 1998. Class-A drugs include cocaine, opioids, and hallucinogens. For each type of admission related to a risky behavior (Class-A drugs, cannabis, alcohol) , we include episodes that mention this substance as either a primary or secondary (any further) diagnosis. We exclude a small number of cases for those admitted for more than one behavior related to cannabis, Class-A drugs and alcohol. The sample is based on all male individuals aged 10-39 on 1st July 2001, the eve of the LCWS policy. The sample is drawn from all London boroughs, except Lambeth, plus all unitary authorities Greater Manchester, Merseyside, the West
Notes: The figures refer to the probability of re-admission as a hospital inpatient over the period 2000 to 2004, conditional on an earlier hospital admission in 1997 or 1998. Class-A drugs include cocaine, opioids, and hallucinogens. For each type of admission related to a risky behavior (Class-A drugs, cannabis, alcohol) , we include episodes that mention this substance as either a primary or secondary (any further) diagnosis. We exclude a small number of cases for those admitted for more than one behavior related to cannabis, Class-A drugs and alcohol in 1997 or 1998. The sample is based on all male individuals aged 10-39 on 1st July 2001, the eve of the LCWS policy. The sample is drawn from all London boroughs, except Lambeth, plus all unitary authorities Greater Manchester, Merseyside, the West Midlands, Tyne and Wear, and South Yorkshire, in addition to London. The total numbers admitted between 2000 and 2004 - irrespective of admission history - are as follows: all other diagnoses, 1325795; cannabis 3446; Class A drugs, 14105; alcohol, 53033. Totals exclude those admitted for more than one drug/alcohol related diagnosis.

Means, standard deviations in parentheses, standard errors in square brackets
(1) Pre-Policy (2) Post-Policy (3) Pre-Policy (4) Post-Policy (5) Unconditional (6) Fixed Effects
Men aged 15-24 .037 .131 .028 .069 .054** .054**
(.067) (.082) (.049) (.074) [.022] [.022]
Men aged 25-34 .179 .259 .084 .086 .079** .080**
(.103) (.127) (.094) (.086) [.034] [.034]
Men aged 35-44 .362 .311 .069 .061 -.039 -.039
(.122) (.186) (.088) (.080) [.065] [.065]
Observations (b-q-y) 17 30 459 810 - -
Table 2: Class-A Drug Related Hospital Admission Rates for Male Cohorts,
by Borough and Time Period
Lambeth Rest of London Post-Policy Minus Pre-Policy
Notes: *** denotes significance at 1%, ** at 5%, and * at 10% level. The dependent variable is the number of male Class-A drug related hospital admissions per 1000 of the male population in the cohort, where the primary diagnosis refers to a Class-A drug. Class-A drugs include cocaine, opioids, and hallucinogens. All observations are at the borough-quarter-year level. Observations are at the quarter-borough-year level and are weighted by population of the borough relative to the population of London. In Columns 1 and 3 the pre-policy period runs from Q1 1997 to Q2 2001. The policy period runs from Q3 2001 to Q2 2002. In Columns 2 and 4 the post-policy period runs from Q3 2001 to Q4 2009. In Columns 3 and 4 the sample is based on all London boroughs excluding Lambeth and boroughs neighbouring Lambeth. In Columns 5 and 6, standard errors on differences are calculated assuming a Prais-Winsten borough specific AR(1) error structure, that allows for borough specific heteroskedasticity and error terms to be contemporaneously correlated across boroughs. In Column 6, the differences are calculated from regression specification that also controls for borough and quarter fixed effects. Male age cohorts are defined by age on the eve of the introduction of the LCWS policy, 1st July 2001.

Table 3: The Impact of the LCWS by Male Age Cohort
(1) Aged 15-24 (2) Aged 25-34 (3) Aged 35-44
Post-Policy x Lambeth .0380* .0749** -.0339
(.0229) (.0334) (.0626)
Policy Period x Lambeth .0282 -.0288 -.156
(.0396) (.0606) (.104)
Post-Policy .0289*** -.00715 .000513
(.00609) (.00707) (.00766)
Policy-Period .00986 -.0227*** -.0123
(.00765) (.00775) (.00892)
Borough and Quarter Fixed Effects Yes Yes Yes
Demographic Controls Yes Yes Yes
Adjusted R-squared .256 .395 .435
Observations (borough-quarter-year) 1,428 1,428 1,428
Dependent Variable: Male Hospital Admission Rates for Class-A Drug Related Diagnoses
Notes: *** denotes significance at 1%, ** at 5%, and * at 10% level. The dependent variable is the log of the number of Class-A drug related hospital admissions per 1000 of the population in the cohort, plus one, where the primary diagnosis refers to a Class-A drug. Class-A drugs include cocaine, opioids, and hallucinogens. Observations are at the quarter-borough-year level and are weighted by population of the borough relative to the population of London. Panel corrected standard errors are calculated using a Prais-Winsten regression, where a borough specific AR(1) process is assumed. This also allows the error terms to be borough specific heteroskedastic, and contemporaneously correlated across boroughs. The sample period runs from January 1997 to December 2009. The Policy-Period dummy variable is equal to one from Q3 2001 to Q2 2002, and zero otherwise. The Post-Policy dummy is equal to one from Q3 2002 onwards, and zero otherwise. Columns 1, 4, and 5 relate admissions to those aged 10-19 on 1st July 2001. Columns 2, 6, and 7 relate to admissions of those aged 20-29 on 1st July 2001. Columns 3, 8 and 9 relate to admissions for those aged 30-39 on 1st July 2001. All specifications include borough, quarter and year fixed effects, and control for shares of the population aged under 5 and over 75 at the borough-year
Notes: *** denotes significance at 1%, ** at 5%, and * at 10% level. The dependent variable the number of Class-A drug related hospital admissions per 1000 of the population in the cohort where the primary diagnosis refers to a Class-A drug. Class-A drugs include cocaine, opioids, and hallucinogens. All observations are at the borough-quarter-year level. The sample period runs from Q2 1997 until Q4 2009. Control boroughs are all other London boroughs, excluding Lambeth's neighbours (Croydon, Merton, Southwark and Wandsworth). Panel corrected standard errors are calculated using a Prais-Winsten regression, where a borough specific AR(1) process is assumed. This also allows the error terms to be borough specific heteroskedastic, and contemporaneously correlated across boroughs. Observations are weighted by the share of the total (excluding neighbouring boroughs) London population that year in the borough. The Policy-Period dummy variable is equal to one from Q3 2001 to Q2 2002, and zero otherwise. The Post-Policy dummy is equal to one from Q3 2002 onwards, and zero otherwise. Column 1 relates to admissions of those aged 15-24 on 1st July 2001. Column 2 relates to admissions of those aged 25-34 on 1st July 2001. Column 3 relates to admissions of those aged 35-44 on 1st July 2001. All specifications include borough and quarter fixed effects, and control for shares of the population aged under 5 and over 75 at the borough-year level, and borough-quarter-year level admissions for malignant neoplasm, diseases of the eye and ear, diseases of the circulatory system, diseases of the respiratory system, and diseases of the digestive system. These admission rates are derived from the HES administrative records at the borough-quarter-year level.

Table 4: The Impact of the LCWS by Male Age Cohort and Admission history
Age Cohort: Aged 15-24 Aged 25-34 Aged 35-44 Aged 15-24 Aged 25-34 Aged 35-44
Pre-Policy Drugs or Alcohol Admissions: No No No Yes Yes Yes
(1) (2) (3) (4) (5) (6)
Post-Policy x Lambeth .0423*** .137*** .187*** 3.903 -2.055 -8.115***
(.0143) (.0329) (.0395) (4.142) (1.469) (1.304)
Policy Period x Lambeth .0240 .0482 .0317 1.787 -1.149 -5.666**
(.0242) (.0543) (.0654) (7.247) (2.868) (2.379)
Post-Policy .0545*** .0665*** .0539*** -5.634*** -9.851*** -4.788***
(.00473) (.00552) (.00499) (.519) (.567) (.421)
Policy-Period .0394*** .0517*** .0422*** -6.695*** -9.289*** -4.788***
(.00601) (.00633) (.00572) (.933) (.938) (.682)
Borough and Quarter Fixed Effects Yes Yes Yes Yes Yes Yes
Demographic Controls Yes Yes Yes Yes Yes Yes
Adjusted R-squared .327 .413 .381 .181 .413 .367
Observations (borough-quarter-year) 1,428 1,428 1,428 1428 1428 1428
Dependent Variable: Male Hospital Admission Rates for Class-A Drug Related Diagnoses
Notes: *** denotes significance at 1%, ** at 5%, and * at 10% level. The dependent variable is the log of the number of Class-A drug related hospital admissions per 1000 of the population in the cohort, plus one, where the primary diagnosis refers to a Class-A drug. Class-A drugs include cocaine, opioids, and hallucinogens. Observations are at the quarter-borough-year level and are weighted by population of the borough relative to the population of London. Panel corrected standard errors are calculated using a Prais-Winsten regression, where a borough specific AR(1) process is assumed. This also allows the error terms to be borough specific heteroskedastic, and contemporaneously correlated across boroughs. The sample period runs from January 1997 to December 2009. The Policy-Period dummy variable is equal to one from Q3 2001 to Q2 2002, and zero otherwise. The Post-Policy dummy is equal to one from Q3 2002 onwards, and zero otherwise. Columns 1, 4, and 5 relate admissions to those aged 10-19 on 1st July 2001. Columns 2, 6, and 7 relate to admissions of those aged 20-29 on 1st July 2001. Columns 3, 8 and 9 relate to admissions for those aged 30-39 on 1st July 2001. All specifications include borough, quarter and year fixed effects, and control for shares of the population aged under 5 and over 75 at the borough-year level, and borough-quarter-
Notes: *** denotes significance at 1%, ** at 5%, and * at 10% level. The dependent variable is the number of Class-A drug related hospital admissions per 1000 of the population in the cohort where the primary diagnosis refers to a Class-A drug. Class-A drugs include cocaine, opioids, and hallucinogens. All observations are at the borough-quarter-year level. The sample period runs from Q2 1997 until Q4 2009. Control boroughs are all other London boroughs, excluding Lambeth's neighbours (Croydon, Merton, Southwark and Wandsworth). Panel corrected standard errors are calculated using a Prais-Winsten regression, where a borough specific AR(1) process is assumed. This also allows the error terms to be borough specific heteroskedastic, and contemporaneously correlated across boroughs. Observations are weighted by the share of the total (excluding neighbouring boroughs) London population that year in the borough. The Policy-Period dummy variable is equal to one from Q3 2001 to Q2 2002, and zero otherwise. The Post-Policy dummy is equal to one from Q3 2002 onwards, and zero otherwise. Columns 1 and 4 relate to admissions of those aged 15-24 on 1st July 2001. Columns 2 and 5 relate to admissions of those aged 25-34 on 1st July 2001. Columns 3 and 6 relate to admissions for those aged 35-44 on 1st July 2001. All specifications include borough and quarter fixed effects, and control for shares of the population aged under 5 and over 75 at the borough-year level, and borough-quarter-year level admissions for malignant neoplasm, diseases of the eye and ear, diseases of the circulatory system, diseases of the respiratory system, and diseases of the digestive system. All these admission rates are also derived from the HES administrative records at the borough-quarter-year level.

Age Cohort: Aged 15-24 Aged 25-34 Aged 35-44 Aged 15-24 Aged 25-34 Aged 35-44
Pre-Policy Drugs or Alcohol Admissions: No No No Yes Yes Yes
(1) (2) (3) (4) (5) (6)
Post-Policy x Lambeth .0651*** .172*** .300*** 3.183 -2.357 -6.417***
(.0188) (.0427) (.0489) (5.637) (1.962) (1.497)
Policy-Period x Lambeth .0250 .0411 .0578 1.854 -.702 -6.604***
(.0243) (.0517) (.0602) (7.133) (2.857) (1.959)
Post-Policy .0361*** .0637*** .0494*** -6.420*** -9.655*** -4.295***
(.00420) (.00570) (.00512) (.862) (.787) (.565)
Policy-Period .0367*** .0512*** .0395*** -6.815*** -9.220*** -4.803***
(.00465) (.00610) (.00570) (.954) (.893) (.649)
Borough and Quarter Fixed Effects Yes Yes Yes Yes Yes Yes
Demographic Controls Yes Yes Yes Yes Yes Yes
Borough Specific Post-Policy Linear Time Trend Yes Yes Yes Yes Yes Yes
Adjusted R-squared .391 .446 .449 .170 .400 .404
Observations (borough-quarter-year) 1428 1428 1428 1428 1428 1428
Table 5: Time TrendsDependent Variable: Male Hospital Admission Rates for Class-A Drug Related Diagnoses
Notes: *** denotes significance at 1%, ** at 5%, and * at 10% level. The dependent variable is the number of Class-A drug related hospital admissions per 1000 of the population in the cohort where the primary diagnosis refers to a Class-A drug. Class-A drugs include cocaine, opioids, and hallucinogens. All observations are at the borough-quarter-year level. The sample period runs from Q2 1997 until Q4 2009. Control boroughs are all other London boroughs, excluding Lambeth's neighbours (Croydon, Merton, Southwark and Wandsworth). Panel corrected standard errors are calculated using a Prais-Winsten regression, where a borough specific AR(1) process is assumed. This also allows the error terms to be borough specific heteroskedastic, and contemporaneously correlated across boroughs. Observations are weighted by the share of the total (excluding neighbouring boroughs) London population that year in the borough. The Policy-Period dummy variable is equal to one from Q3 2001 to Q2 2002, and zero otherwise. The Post-Policy dummy is equal to one from Q3 2002 onwards, and zero otherwise. Columns 1 and 3 relate admissions of those aged 15-24 on 1st July 2001. Columns 2 and 5 relate to admissions of those aged 25-34 on 1st July 2001. Columns 3 and 6 relate to admissions for those aged 35-44 on 1st July 2001. Columns 1-3 control for post Q3 2001 borough specific linear time trends. Columns 4-6 control for borough specific linear time trends. All Columns include borough and quarter fixed effects, and control for shares of the population aged under 5 and over 75 at the borough-year level, and borough-quarter-year level admissions for malignant neoplasm, diseases of the eye and ear, diseases of the circulatory system, diseases of the respiratory system, and diseases of the digestive system. All these admission rates are also derived from the HES administrative records at the borough-quarter-year level.

Age Cohort: Aged 15-24 Aged 25-34 Aged 35-44 Aged 15-24 Aged 25-34 Aged 35-44
Pre-Policy Drugs or Alcohol Admissions: No No No Yes Yes Yes
(1) (2) (3) (4) (5) (6)
Post-Policy x Lambeth (PP x L) .0362** .142*** .195*** 3.870 -2.536* -8.186***
(.0145) (.0314) (.0440) (4.142) (1.467) (1.180)
Policy Period x Lambeth (P x L) .0229 .0457 .0534 1.807 -1.109 -6.227***
(.0248) (.0529) (.0720) (7.191) (2.885) (2.174)
Post-Policy x Neighbours (PP x N) .000756 .0740*** .0469*** -1.749 .234 -3.618***
(.00849) (.0167) (.0135) (1.162) (1.296) (.702)
Policy-Period x Neighbours (P x N) -.0106 -.00274 .0164 -3.351* -1.464 -3.496***
(.0147) (.0259) (.0224) (2.001) (2.378) (1.200)
Post-Policy (PP) .0519*** .0651*** .0563*** -5.657*** -9.957*** -4.821***
(.00451) (.00575) (.00504) (.524) (.573) (.421)
Policy-Period (P) .0380*** .0515*** .0442*** -6.643*** -9.380*** -4.845***
(.00585) (.00654) (.00588) (.962) (.957) (.682)
Testing Differences between Lambeth and Her Neighbors
(PP x L) - (PP x N) .0355* .0675** .148*** 5.16 -2.77 -4.57
(.0185) (.0333) (.0421) (7.43) (1.67) (1.50)
(P x L) - (P x N) .0335* .0484 .0370 1.08 .355 -2.73
(.0326) (.0556) (.0687) (.717) (3.27) (2.10)
Borough and Quarter Fixed Effects Yes Yes Yes Yes Yes Yes
Demographic Controls Yes Yes Yes Yes Yes Yes
Adjusted R-squared .331 .449 .382 .158 .351 .399
Observations (borough-quarter-year) 1,632 1,632 1,632 1,632 1,632 1,632
Table 6: Impacts in Neighboring Boroughs
Dependent Variable: Male Hospital Admission Rates for Class-A Drug Related Diagnoses
Notes: *** denotes significance at 1%, ** at 5%, and * at 10% level. The dependent variable is the number of Class-A drug related hospital admissions per 1000 of the population in the cohort where the primary diagnosis refers to a Class-A drug. Class-A drugs include cocaine, opioids, and hallucinogens. Observations are at the quarter-borough-year level and are weighted by population of the borough relative to the population of London. Panel corrected standard errors are calculated using a Prais-Winsten regression, where a borough specific AR(1) process is assumed. This also allows the error terms to be borough specific heteroskedastic, and contemporaneously correlated across boroughs. The sample period runs from Q2 1997 to Q4 2009. The Policy-Period dummy variable is equal to one from Q3 2001 to Q2 2002, and zero otherwise. The Post-Policy dummy is equal to one from Q3 2002 onwards, and zero otherwise. Columns 1 and 4 relate to admissions of those aged 15-24 on 1st July 2001. Columns 2 and 5 relate to admissions of those aged 25-34 on 1st July 2001. Columns 3 and 6 relate to admissions for those aged 35-44 on 1st July 2001. The Neighbors dummy variable is equal to one when the local authority neighbors Lambeth (Croydon, Merton, Southwark and Wandsworth), and zero otherwise. All columns include borough and quarter fixed effects, and control for shares of the population aged under 5 and over 75 at the borough-year level, and borough-quarter-year level admissions for malignant neoplasm, diseases of the eye and ear, diseases of the circulatory system, diseases of the respiratory system, and diseases of the digestive system. All these admission rates are also derived from the HES administrative records at the borough-quarter-year level.

(1) Aged 15-24 (2) Aged 25-34 (3) Aged 35-44
Post-Policy x Lambeth 3.72*** 3.49*** 2.38***
(1.34) (.820) (.570)
Policy Period x Lambeth .077 4.80*** -6.24***
(1.28) (1.09) (1.53)
Post-Policy -2.74* -2.43*** -1.97***
(1.34) (.798) (.615)
Policy-Period -.030 -.297 1.98
(1.39) (1.10) (1.54)
Borough and Quarter Fixed Effects Yes Yes Yes
Demographic Controls Yes Yes Yes
Adjusted R-Squared .083 .098 .071
Observation (individual hospital episode) 1374 2810 1806
Table 7: Impacts on Length of Hospital StayDependent Variable: Length of Hospital Stay in Days for Males Admitted with Drug-Related Diagnoses
Notes: *** denotes significance at 1%, ** at 5%, and * at 10% level. The dependent variable is the number of days spent in hospital (discharge date - admission date) amongst those admitted to hospital for Class A drugs. Observations are at the episode or admission level. The sample includes only the first episode of a hospital stay (93% of all episodes) and episodes lasting less than 100 days (excluding 160 or 2% of episodes across all years and cohorts). Standard errors are clustered at the borough level. The sample period runs from January 1997 to December 2009. The Policy-Period dummy variable is equal to one from Q3 2001 to Q2 2002, and zero otherwise. The Post-Policy dummy is equal to one from Q3 2002 onwards, and zero otherwise. All columns include borough and quarter fixed effects, and control for borough-quarter-year level admissions for malignant neoplasm, diseases of the eye and ear, diseases of the circulatory system, diseases of the respiratory system, and diseases of the digestive system. All these admission rates are also derived from the HES administrative records at the borough-quarter-year level.
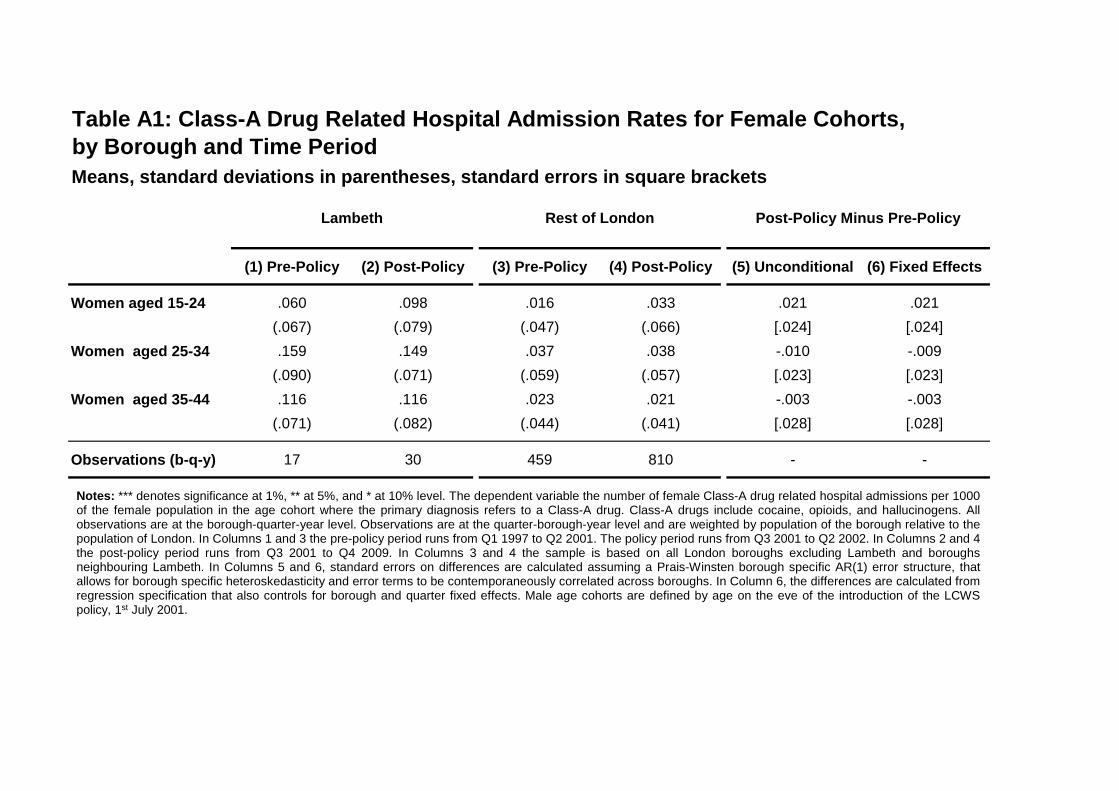
Means, standard deviations in parentheses, standard errors in square brackets
(1) Pre-Policy (2) Post-Policy (3) Pre-Policy (4) Post-Policy (5) Unconditional (6) Fixed Effects
Women aged 15-24 .060 .098 .016 .033 .021 .021
(.067) (.079) (.047) (.066) [.024] [.024]
Women aged 25-34 .159 .149 .037 .038 -.010 -.009
(.090) (.071) (.059) (.057) [.023] [.023]
Women aged 35-44 .116 .116 .023 .021 -.003 -.003
(.071) (.082) (.044) (.041) [.028] [.028]
Observations (b-q-y) 17 30 459 810 - -
Table A1: Class-A Drug Related Hospital Admission Rates for Female Cohorts,
by Borough and Time Period
Lambeth Rest of London Post-Policy Minus Pre-Policy
Notes: *** denotes significance at 1%, ** at 5%, and * at 10% level. The dependent variable the number of female Class-A drug related hospital admissions per 1000 of the female population in the age cohort where the primary diagnosis refers to a Class-A drug. Class-A drugs include cocaine, opioids, and hallucinogens. All observations are at the borough-quarter-year level. Observations are at the quarter-borough-year level and are weighted by population of the borough relative to the population of London. In Columns 1 and 3 the pre-policy period runs from Q1 1997 to Q2 2001. The policy period runs from Q3 2001 to Q2 2002. In Columns 2 and 4 the post-policy period runs from Q3 2001 to Q4 2009. In Columns 3 and 4 the sample is based on all London boroughs excluding Lambeth and boroughs neighbouring Lambeth. In Columns 5 and 6, standard errors on differences are calculated assuming a Prais-Winsten borough specific AR(1) error structure, that allows for borough specific heteroskedasticity and error terms to be contemporaneously correlated across boroughs. In Column 6, the differences are calculated from regression specification that also controls for borough and quarter fixed effects. Male age cohorts are defined by age on the eve of the introduction of the LCWS policy, 1st July 2001.

Means, standard deviations in parentheses, standard errors in square brackets
(1) Pre-Policy (2) Post-Policy (3) Pre-Policy (4) Post-Policy (5) Unconditional (6) Fixed Effects
Men aged 15-24 .055 .108 .025 .083 .001 .001
(.075) (.072) (.055) (.094) [.018] [.018]
Men aged 25-34 .083 .088 .025 .047 -.018 -.017
(.087) (.057) (.044) (.060) [.027] [.027]
Men aged 35-44 .125 .093 .018 .039 -.046 -.044
(.136) (.078) (.044) (.064) [.041] [.040]
Observations (borough-quarter-year) 17 30 558 930 - -
Table A2: Cannabis Related Hospital Admissions for Male Cohorts, by Borough and Time Period
Lambeth Rest of London Post-Policy Minus Pre-Policy
Notes: *** denotes significance at 1%, ** at 5%, and * at 10% level. The dependent variable is the number of hospital admissions per thousand population where the diagnosis (primary or secondary) refers to cannabis. Observations are at the quarter-borough-year level and are weighted by population of the borough relative to the population of London. In Columns 1 and 3 the pre-policy period runs from Q1 1997 to Q2 2001. The policy period runs from Q3 2001 to Q2 2002. In Columns 2 and 4 the post-policy period runs from Q3 2001 to Q4 2009. In Columns 3 and 4 the sample is based on all London boroughs excluding Lambeth. In Columns 5 and 6, standard errors on differences are calculated assuming a Prais-Winsten borough specific AR(1) error structure, that allows for borough specific heteroskedasticity and error terms to be contemporaneously correlated across boroughs. In Column 6, the differences are calculated from regression specification that also controls for borough and quarter fixed effects. Male age cohorts are defined by age on the eve of the introduction of the LCWS policy, 1st July 2001.

Table A3: Placebo Pre-Policy Check
(1) Aged 15-24 (2) Aged 25-34 (3) Aged 35-44
2nd Half Pre-Policy x Lambeth .0216 -.00403 -.00509
(.0278) (.0356) (.0468)
2nd Half Pre-Policy .0122** .0103 .00206
(.00494) (.00838) (.0123)
Borough and Quarter Fixed Effects Yes Yes Yes
Demographic Controls Yes Yes Yes
Adjusted R-squared .187 .393 .680
Observations (borough-quarter-year) 476 476 476
Dependent Variable: Male Hospital Admission Rates for Class-A Drug Related Diagnoses
Notes: *** denotes significance at 1%, ** at 5%, and * at 10% level. The dependent variable is the log of the number of Class-A drug related hospital admissions per 1000 of the population in the cohort, plus one, where the primary diagnosis refers to a Class-A drug. Class-A drugs include cocaine, opioids, and hallucinogens. Observations are at the quarter-borough-year level and are weighted by population of the borough relative to the population of London. Panel corrected standard errors are calculated using a Prais-Winsten regression, where a borough specific AR(1) process is assumed. This also allows the error terms to be borough specific heteroskedastic, and contemporaneously correlated across boroughs. The sample period runs from January 1997 to December 2009. The Policy-Period dummy variable is equal to one from Q3 2001 to Q2 2002, and zero otherwise. The Post-Policy dummy is equal to one from Q3 2002 onwards, and zero otherwise. Columns 1, 4, and 5 relate admissions to those aged 10-19 on 1st July 2001. Columns 2, 6, and 7 relate to admissions of those aged 20-29 on 1st July 2001. Columns 3, 8 and 9 relate to admissions for those aged 30-39 on 1st July 2001. All specifications include borough, quarter and year fixed effects, and control for shares of the population aged under 5 and over 75 at the borough-year
Notes: *** denotes significance at 1%, ** at 5%, and * at 10% level. The dependent variable the number of Class-A drug related hospital admissions per 1000 of the population in the cohort where the primary diagnosis refers to a Class-A drug. Class-A drugs include cocaine, opioids, and hallucinogens. All observations are at the borough-quarter-year level. The sample period runs from Q2 1997 until Q2 2001. Control boroughs are all other London boroughs, excluding Lambeth's neighbours (Croydon, Merton, Southwark and Wandsworth). Panel corrected standard errors are calculated using a Prais-Winsten regression, where a borough specific AR(1) process is assumed. This also allows the error terms to be borough specific heteroskedastic, and contemporaneously correlated across boroughs. Observations are weighted by the share of the total (excluding neighbouring boroughs) London population that year in the borough. The 2nd Half Pre dummy variable is equal to one from Q2 1999 to Q2 2001, and zero otherwise. Column 1 relates to admissions of those aged 15-24 on 1st July 2001. Column 2 relates to admissions of those aged 25-34 on 1st July 2001. Column 3 relates to admissions of those aged 35-44 on 1st July 2001. All specifications include borough and quarter fixed effects, and control for shares of the population aged under 5 and over 75 at the borough-year level, and borough-quarter-year level admissions for malignant neoplasm, diseases of the eye and ear, diseases of the circulatory system, diseases of the respiratory system, and diseases of the digestive system. All these admission rates are also derived from the HES administrative records at the borough-quarter-year level.

Table A4: Tobit Specifications
Margin: Extensive Intensive Extensive Intensive Extensive Intensive
Age Cohort:
(1) (2) (3) (4) (5) (6)
Post-Policy x Lambeth .150 .0434*** .0133 .0712*** .0385* -.0441
(.109) (.0147) (.0252) (.0241) (.0220) (.0308)
Borough and Quarter Fixed Effects Yes Yes Yes Yes Yes Yes
Demographic Controls Yes Yes Yes Yes Yes Yes
Observations (borough-quarter-year) 1428 1428 1428 1428 1428 1428
Dependent Variable: Male Hospital Admission Rates for Class-A Drug Related Diagnoses
Aged 15-24 Aged 25-34 Aged 35-44
Robust standard errors in parentheses
Notes: *** denotes significance at 1%, ** at 5%, and * at 10% level. The dependent variable is the number of Class-A drug related hospital admissions per 1000 of the population in the cohort where the primary diagnosis refers to a Class-A drug. Class-A drugs include cocaine, opioids, and hallucinogens. Observations are at the quarter-borough-year level and are weighted by population of the borough relative to the population of London. Standard errors are robust to the presence of heteroskedasticity. The sample period runs from April 1997 to December 2009. The Policy-Period dummy variable is equal to one from Q3 2001 to Q2 2002, and zero otherwise. The Post-Policy dummy is equal to one from Q3 2002 onwards, and zero otherwise. All specifications include borough and quarter fixed effects, and control for shares of the population aged under 5 and over 75 at the borough-year level, and borough-quarter-year level admissions for malignant neoplasm, diseases of the eye and ear, diseases of the circulatory system, diseases of the respiratory system, and diseases of the digestive system. All these admission rates are also derived from the HES administrative records at the borough-quarter-year level. The estimates on the interaction terms, Post-Policy x Lambeth coefficients are produced by taking the double difference of the conditional expected values for the four Lambeth (0 and 1) x Post Policy (0 and 1) cells.

Figure 1B: Impact of the LCWS by Period Post-Policy Among Those with
Previous Admissions for Drugs/Alcohol
Figure 1A: Impact of the LCWS by Period Post-Policy Among Those Without
Previous Admissions for Drugs/Alcohol
Notes: Each panel in Figures 1A and 1B refers to a separate specification, where the policy and post policy dummies are replaced by four time dummies: the policy period (Q3 2001-Q2 2002); 1-2 years post reform (Q3 2002 - Q2 2004); 3-4 years post reform (Q3 2004 - Q2 2006); and, 5-6 years post reform (Q3 2006 - Q2 2008). The pre-policy period is the omitted category. Data from Q3 2008 onwards is excluded. Each plotted square corresponds to the Lambeth x Time Band dummy coefficient. The vertical green lines give the 95% confidence intervals. Age refers to age on the eve of the LCWS introduction (1st July 2001). In Figure 1A the sample includes all those who were not admitted for drug or alcohol use in the pre-policy period. In Figure 1B the sample includes all those who were previously admitted for drug or alcohol use in the pre-policy period.
-.2
0.2
.4
Pol 1-2 3-4 5-6 Pol 1-2 3-4 5-6 Pol 1-2 3-4 5-6
15-24 25-34 35-44
Lam
beth
x T
ime
-Ban
d C
oeffic
ient
Time Band (Years Post Policy)
-10
01
02
0
Pol 1-2 3-4 5-6 Pol 1-2 3-4 5-6 Pol 1-2 3-4 5-6
15-24 25-34 35-44
Lam
beth
x T
ime
-Ban
d C
oeffic
ient
Time Band (Years Post Policy)