
policies covering cyber...Cyber Security Breaches Survey 2018: Statistical Release Summary The Cyber...
58
Cyber Security Breaches Survey 2018 Over four in ten businesses (43%) and two in ten charities (19%) experienced a cyber security breach or attack in the last 12 months. Three-quarters of businesses (74%) and over half of all charities (53%) say that cyber security is a high priority for their organisation’s senior management. Under three in ten businesses (27%, versus 33% in the previous 2017 survey), and two in ten charities (21%) have a formal cyber security policy or policies. Bases: 1,519 UK businesses (excluding sole traders, and agriculture, forestry or fishing businesses); 569 UK registered charities Businesses (outer ring) Charities (inner ring) % where cyber security is a high priority for directors, trustees or senior managers 19 43 53 74 21 27 % with formal policy or policies covering cyber security risks % reporting any breaches or attacks in the last 12 months The Cyber Security Breaches Survey is a quantitative and qualitative survey of UK businesses and, for the first time in this 2018 release, charities. The quantitative survey was carried out in winter 2017 and the qualitative survey in early 2018. It helps these organisations to understand the nature and significance of the cyber security threats they face, and what others are doing to stay secure. It also supports the Government to shape future policy in this area. Responsible statistician: Rishi Vaidya 020 7211 2320 Statistical enquiries: [email protected] @DCMSinsight General enquiries: [email protected] 0207 211 6200 Media enquiries: 020 7211 2210
Transcript of policies covering cyber...Cyber Security Breaches Survey 2018: Statistical Release Summary The Cyber...

Cyber Security Breaches Survey 2018
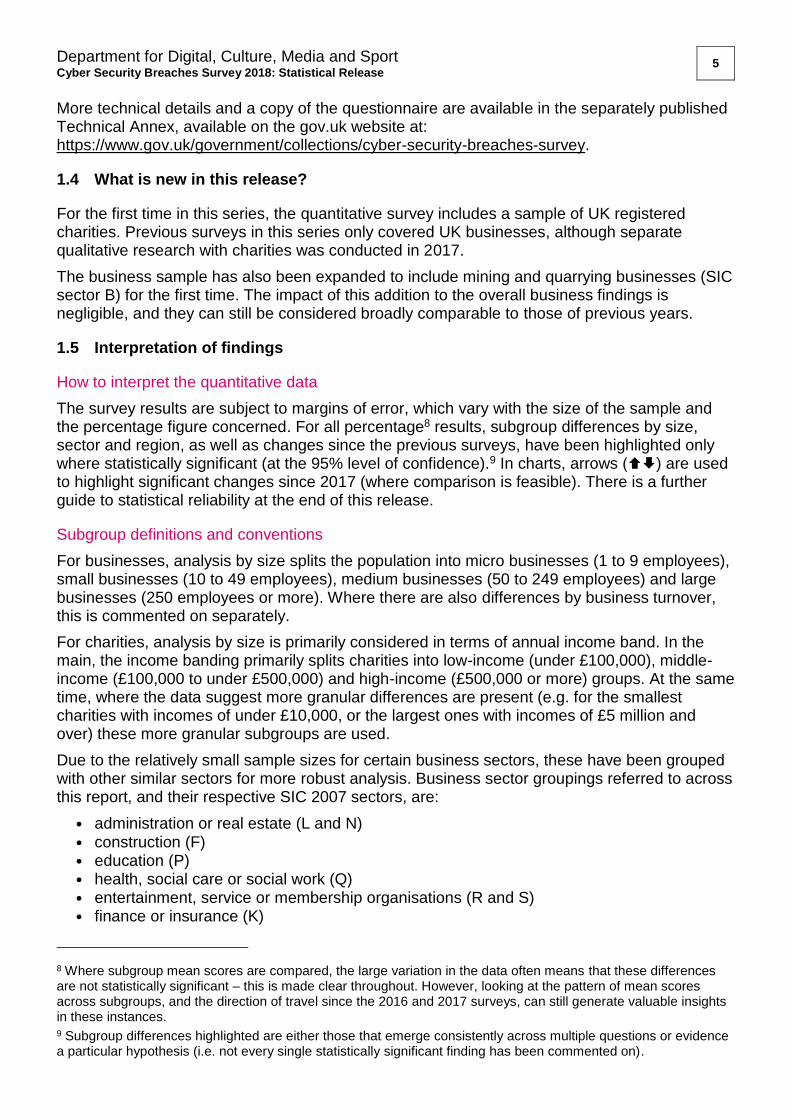
Over four in ten businesses (43%) and two in ten charities (19%) experienced a cyber security breach or attack in the last 12 months.
Three-quarters of businesses (74%) and over half of all charities (53%) say that cyber security is a high priority for their organisation’s senior management.
Under three in ten businesses (27%, versus 33% in the previous 2017 survey), and two in ten charities (21%) have a formal cyber security policy or policies.
Bases: 1,519 UK businesses (excluding sole traders, and agriculture, forestry or fishing
businesses); 569 UK registered charities
Businesses (outer ring)
Charities (inner ring)
% where cyber security is a high priority for directors, trustees or senior managers
1943
5374
2127
% with formal policy or policies covering cyber
security risks
% reporting any breaches or
attacks in the last 12 months
The Cyber Security Breaches Survey is a quantitative and qualitative survey of UK businesses and, for the first time in this 2018 release, charities. The quantitative survey was carried out in winter 2017 and the qualitative survey in early 2018. It helps these organisations to understand the nature and significance of the cyber security threats they face, and what others are doing to stay secure. It also supports the Government to shape future policy in this area.
Responsible statistician:
Rishi Vaidya 020 7211 2320
Statistical enquiries:
[email protected] @DCMSinsight
General enquiries:
[email protected] 0207 211 6200
Media enquiries:
020 7211 2210

Department for Digital, Culture, Media and Sport Cyber Security Breaches Survey 2018: Statistical Release
Contents
Summary ...................................................................................................................................... 1
Chapter 1: Introduction ............................................................................................................. 4
1.1 Code of practice for Official Statistics ............................................................. 4
1.2 Background .................................................................................................... 4
1.3 Methodology ................................................................................................... 4
1.4 What is new in this release? ........................................................................... 5
1.5 Interpretation of findings ................................................................................. 5
1.6 Acknowledgements......................................................................................... 6
Chapter 2: Profiling UK businesses and charities ..................................................................... 7
2.1 Online exposure ............................................................................................. 7
2.2 Cloud computing ............................................................................................. 8
2.3 Use of personal devices ................................................................................. 9
Chapter 3: Awareness and attitudes ....................................................................................... 10
3.1 Importance of cyber security ......................................................................... 10
3.2 Sources of information .................................................................................. 12
3.3 Awareness of Government initiatives and communications .......................... 14
3.4 The General Data Protection Regulation (GDPR) ........................................ 16
Chapter 4: Approaches to cyber security ................................................................................ 17
4.1 Investment in cyber security ......................................................................... 17
4.2 Outsourcing cyber security ........................................................................... 20
4.3 Staff approaches .......................................................................................... 22
4.4 Governance and planning ............................................................................. 25
4.5 Risk management ......................................................................................... 28
4.6 Dealing with third-party suppliers or contractors ........................................... 31
4.7 Implementing Government initiatives ............................................................ 32
Chapter 5: Incidence and impact of breaches ........................................................................ 35
5.1 Experience of breaches or attacks ............................................................... 35
5.2 How are businesses affected? ...................................................................... 38
5.3 Financial cost of breaches or attacks ........................................................... 41
Chapter 6: Dealing with breaches ........................................................................................... 45
6.1 Identifying and understanding breaches ....................................................... 45
6.2 Responding to breaches ............................................................................... 47
6.3 Reporting breaches ...................................................................................... 48
Chapter 7: Conclusions .......................................................................................................... 52
Annex A: Further information ................................................................................................ 53
Annex B: Guide to statistical reliability .................................................................................. 54

Department for Digital, Culture, Media and Sport 1 Cyber Security Breaches Survey 2018: Statistical Release
Summary
The Cyber Security Breaches Survey 2018 comprised:
• a random probability telephone survey of 1,519 UK businesses and 569 UK registered charities from 9 October 2017 to 14 December 20171
• 50 in-depth interviews undertaken in January and February 2018 to follow up with organisations that participated in the survey, as well as higher education institutions.
For business results, comparisons are made where feasible to the 2017 and 2016 surveys (for which quantitative survey fieldwork was undertaken in late 2016 and late 2015 respectively). Charities were surveyed for the first time in the 2018 survey.
Main findings
The overwhelming majority of businesses and charities are reliant on online services, which exposes them to cyber security risks.
Virtually all UK businesses (98%) and charities (93%) represented in the survey rely on some form of digital communication or services, such as staff email addresses, websites, online banking and the ability for customers to shop online. More businesses had websites or social media pages in the 2017 survey than in 2016. The 2018 figures are similar to 2017, and therefore also higher than in 2016.
Charities are exposed to further online risks. Around three in ten enable people to donate online (31%) and just under three in ten allow beneficiaries to access their services online (27%). This is especially true of larger charities (53% of charities with an income of £500,000 or more let people donate online, and 49% enable beneficiaries to access services online).
Organisations of all sizes, and a substantive majority of large businesses and charities in particular, have been breached or attacked. Those with more potential risk factors are also among the most likely to experience cyber security breaches or attacks.
Over four in ten businesses (43%) and two in ten charities (19%) have experienced cyber security breaches or attacks in the last 12 months. This rises to seven in ten (72%) among large businesses2, and a similar proportion (73%) among the largest charities with incomes of £5 million or more.
Breaches were more often identified among the organisations that hold personal data, where staff use personal devices for work (known as bringing your own device, or BYOD) or that use cloud computing.
• The majority of businesses (56%) and over two-fifths of charities (44%) hold personal data on customers, beneficiaries or donors electronically. Among these, 47 per cent of businesses and 30 per cent of charities have experienced breaches or attacks.
• Just under half (45%) of businesses and two-thirds (65%) of charities have BYOD. The businesses where this occurs are more likely to have had breaches or attacks (49%).
1 This excludes sole traders, as well as agriculture, forestry and fishing businesses, which were outside the scope of the survey. Data are weighted to be representative of the respective populations of businesses and charities. 2 For businesses, analysis by size splits the population into micro businesses (1 to 9 employees), small businesses (10 to 49 employees), medium businesses (50 to 249 employees) and large businesses (250 employees or more).

Department for Digital, Culture, Media and Sport 2 Cyber Security Breaches Survey 2018: Statistical Release
Breaches impact on organisations in various ways. Where breaches have resulted in lost assets or data, the financial consequences have been especially significant.
Of all the organisations that experienced breaches or attacks, over half (53%) of the businesses and six in ten (59%) of the charities report being impacted by these. These impacts most commonly included needing new measures against future attacks (36% of businesses and 38% of charities), extra staff time required to deal with the breach (32% and 26%), and staff being stopped from carrying out day-to-day work (27% and 24%).
Typically, organisations incur no specific financial cost from cyber security breaches. This is reflective of the fact that most breaches or attacks do not have any material outcome (a loss of assets or data), so do not always need a response. However, where breaches do result in such a material outcome, the costs can be significant.
The average (mean) cost of breaches with such outcomes is £3,100 for businesses and £1,030 for charities. This is much higher for medium businesses (£16,100) and large businesses (£22,300). Moreover, the estimated total cost of breaches has consistently increased for medium businesses specifically, even when including breaches that do not result in lost assets or data (from £1,860 in the 2016 survey and £3,070 in the 2017 survey, to £8,180 in 2018).
Senior managers in most businesses and charities prioritise cyber security, but this is still not always matched by action or engagement from senior management teams.
Three-quarters of businesses (74%) and over half of all charities (53%) say that cyber security is a high priority for their organisation’s senior management. The proportion of businesses saying cyber security is a low priority has fallen since 2016 (from 30%, to 24% in this survey), indicating that it is now on the agenda for more businesses. More specifically, more small businesses now say it is a very high priority than in the 2017 survey (up from 33% to 42%).
The qualitative survey offers various insights into what makes cyber security a priority, linking it to an organisational culture, and engagement from senior managers:
• Staff in organisations that used personal data were typically more aware of the impact that breaches could have on brands and reputation.
• Where senior managers were seen to be interested in cyber security, those responsible tended to feel more empowered to take action.
• Those that took more action on cyber security tended to see it as complementing rather than competing with their existing strategic priorities, for example by keeping key services running, protecting the finances or protecting reputations.
Despite many organisations stating that cyber security is a high priority, just three in ten businesses (30%) and a quarter of charities (24%) have board members or trustees with responsibility for cyber security. One in five businesses (20%) and two in five charities (38%) also never update their senior managers on cyber security issues. The business findings are again similar to the 2017 survey on the whole, although there are indications of a significant shift towards more regular engagement with senior managers – more are now being updated on a daily basis (8%, versus 4% in the 2017 survey).
There is more that organisations might do around training and awareness raising, documenting risks and adopting good-practice technical controls to better protect themselves.
A fifth of businesses (20%) and a lower proportion of charities (15%) have had any staff attend internal or external cyber security training in the last 12 months. Alongside this, one in ten businesses (10%) and two in ten charities (22%) report cyber skills gaps, disagreeing that the people dealing with cyber security in their organisation have the right skills and knowledge to do

Department for Digital, Culture, Media and Sport 3 Cyber Security Breaches Survey 2018: Statistical Release
the job effectively. The qualitative survey also highlights potential barriers to upskilling staff on cyber security, related to cost, format, regularity and not seeing the need for training:
• There was a sense that induction training, irregular training, or training that was not mandatory could be easily forgotten, and needed to be more regular.
• Cost and logistics meant that face-to-face training sessions were difficult, and organisations often wanted access to more video training sessions or webinars.
• Organisations needed more evidence on what value training would add – what it would teach them beyond what they already felt they knew.
Basic technical controls might also be improved, particularly among smaller businesses and charities. The survey findings show that half of all businesses (51%) and three in ten charities (29%) have implemented all of the five basic technical controls listed under the Government-endorsed Cyber Essentials scheme, which includes:
• applying software updates when available (92% of businesses and 75% of charities) • up-to-date malware protection (90% and 73%) • firewalls with appropriate configurations (89% and 69%) • restricting IT admin and access rights to specific users (78% and 65%) • security controls on company-owned devices (65% and 42%).
Relatively few businesses (37%) and charities (31%) have rules and controls around encryption. This is also not especially prevalent among organisations that hold personal information on customers, beneficiaries or donors. Of these, 56 per cent of businesses and a similar proportion (55%) of charities do not have such rules.
Businesses and charities can also continue to formalise their approaches to cyber security. Under three in ten businesses (27%, versus 21% in the previous 2017 survey), and two in ten charities (21%) have a cyber security policy or policies. Very few businesses (13%) and charities (8%) have a cyber security incident management process in place.
Organisations should seek out the latest Government information and guidance, which will help them to implement better cyber security.
Six in ten businesses (59%) and four in ten charities (42%) have sought any information, advice or guidance in the last 12 months on the cyber security threats they face. Relatively few – four per cent of businesses and five per cent of charities – recalled using Government sources of information. Of the businesses that did, the vast majority of them (84%) say they found this information useful.3
The qualitative survey highlights that organisations want information, advice and guidance that is tailored to their contexts and needs. The interviewed organisations had a range of existing information sources which they expected to distribute relevant information. These included peer networks, trade associations and regulators, such as the respective charity regulators in each UK country. All these groups, alongside the Government, continue to have an important role to play in improving the cyber security of UK businesses and charities.
3 There were too few charities responding to this question to report the charity result.

Department for Digital, Culture, Media and Sport 4 Cyber Security Breaches Survey 2018: Statistical Release
Chapter 1: Introduction
1.1 Code of practice for Official Statistics
The Cyber Security Breaches Survey is an Official Statistic and has been produced to the standards set out in the Code of Practice for Official Statistics.
1.2 Background
Publication date: 25 April 2018
Geographic coverage: United Kingdom
The Department for Digital, Culture, Media and Sport (DCMS) commissioned the Cyber Security Breaches Survey of UK businesses and charities as part of the National Cyber Security Programme. The findings help these organisations to understand the nature and significance of the cyber security threats they face, and what others are doing to stay secure. It also supports the Government to shape future policy in this area, in line with the National Cyber Security Strategy 2016–2021.4
The latest survey was carried out by Ipsos MORI, in partnership with the Institute for Criminal Justice Studies at the University of Portsmouth. It covers:
• awareness and attitudes towards cyber security • approaches to cyber security, including estimates of spending by organisations • the nature and impact (including estimated costs) of cyber security breaches • differences by size, sector and geographic location.
This 2018 publication follows previous surveys in this series, published in 2016 (with quantitative survey fieldwork in late 2015) and 2017 (with quantitative fieldwork in late 2016)5, and separate qualitative research undertaken with charities in 20176.
1.3 Methodology
As in previous years, there were two strands to the Cyber Security Breaches Survey:
• A random probability telephone survey of 1,519 UK businesses and 569 UK registered charities was undertaken from 9 October 2017 to 14 December 2017. The data have been weighted to be statistically representative of these two populations.
• A total of 50 in-depth interviews were undertaken in January and February 2018 to follow up with businesses and charities that had participated in the survey, as well as higher education institutions, and gain further qualitative insights.
Sole traders and public sector organisations were outside the scope of the survey. In addition, businesses with no IT capacity or online presence were deemed ineligible, which led to a small number of specific sectors (agriculture, forestry and fishing) being excluded. These exclusions are consistent with previous years, and the survey is considered comparable across years.7
4 See https://www.gov.uk/government/publications/national-cyber-security-strategy-2016-to-2021. 5 See https://www.gov.uk/government/collections/cyber-security-breaches-survey for previous surveys.
6 See https://www.gov.uk/government/publications/cyber-security-in-charities for the previous charities research. 7 In previous years of the survey, the mining and quarrying sector was also excluded from the business sample. As of April 2018, this sector is estimated to account for under 0.1 per cent of all UK businesses, so the addition of this sector has not meaningfully impacted on the comparability of findings across years.
Department for Digital, Culture, Media and Sport 5 Cyber Security Breaches Survey 2018: Statistical Release
More technical details and a copy of the questionnaire are available in the separately published Technical Annex, available on the gov.uk website at: https://www.gov.uk/government/collections/cyber-security-breaches-survey.
1.4 What is new in this release?
For the first time in this series, the quantitative survey includes a sample of UK registered charities. Previous surveys in this series only covered UK businesses, although separate qualitative research with charities was conducted in 2017.
The business sample has also been expanded to include mining and quarrying businesses (SIC sector B) for the first time. The impact of this addition to the overall business findings is negligible, and they can still be considered broadly comparable to those of previous years.
1.5 Interpretation of findings
How to interpret the quantitative data
The survey results are subject to margins of error, which vary with the size of the sample and the percentage figure concerned. For all percentage8 results, subgroup differences by size, sector and region, as well as changes since the previous surveys, have been highlighted only where statistically significant (at the 95% level of confidence).9 In charts, arrows () are used to highlight significant changes since 2017 (where comparison is feasible). There is a further guide to statistical reliability at the end of this release.
Subgroup definitions and conventions
For businesses, analysis by size splits the population into micro businesses (1 to 9 employees), small businesses (10 to 49 employees), medium businesses (50 to 249 employees) and large businesses (250 employees or more). Where there are also differences by business turnover, this is commented on separately.
For charities, analysis by size is primarily considered in terms of annual income band. In the main, the income banding primarily splits charities into low-income (under £100,000), middle-income (£100,000 to under £500,000) and high-income (£500,000 or more) groups. At the same time, where the data suggest more granular differences are present (e.g. for the smallest charities with incomes of under £10,000, or the largest ones with incomes of £5 million and over) these more granular subgroups are used.
Due to the relatively small sample sizes for certain business sectors, these have been grouped with other similar sectors for more robust analysis. Business sector groupings referred to across this report, and their respective SIC 2007 sectors, are:
• administration or real estate (L and N)
• construction (F) • education (P) • health, social care or social work (Q) • entertainment, service or membership organisations (R and S) • finance or insurance (K)
8 Where subgroup mean scores are compared, the large variation in the data often means that these differences are not statistically significant – this is made clear throughout. However, looking at the pattern of mean scores across subgroups, and the direction of travel since the 2016 and 2017 surveys, can still generate valuable insights in these instances. 9 Subgroup differences highlighted are either those that emerge consistently across multiple questions or evidence a particular hypothesis (i.e. not every single statistically significant finding has been commented on).

Department for Digital, Culture, Media and Sport 6 Cyber Security Breaches Survey 2018: Statistical Release
• food or hospitality (I) • information or communications (J) • utilities or production (including manufacturing) (B, C, D and E) • professional, scientific or technical (M) • retail or wholesale (including vehicle sales and repairs) (G) • transport or storage (H).
These groupings are slightly different from previous years, as the sampling approach in the 2018 survey allowed sectors to be split out in a more granular fashion than before.
Where figures in charts do not add to 100% this is due to rounding of percentages or because the questions allow more than one response.
How to interpret the qualitative data
The qualitative survey findings offer more nuanced insights and case studies into how and why businesses and charities hold attitudes or adopt behaviours with regards to cyber security. The findings reported here represent common themes emerging across multiple interviews. Where examples or insights from one organisation, or a small number of organisations are pulled out, this is to illustrate findings that emerged more broadly across interviews. However, as with any qualitative findings, these examples are not intended to be statistically representative.
The qualitative findings are mainly covered in Chapters 3 (on awareness and attitudes) and 4 (on approaches to cyber security). This reflects the focus of the qualitative interviews.
1.6 Acknowledgements
Ipsos MORI and DCMS would like to thank all the businesses, charities and individuals who agreed to participate in the survey and those that provided an input into the survey’s development. We would also like to thank the organisations who endorsed the fieldwork and encouraged businesses to participate, including the Association of British Insurers (ABI), the Confederation of British Industry (CBI), the Federation of Small Businesses (FSB), ICAEW, techUK, the Charity Commission for England and Wales, and the Charity Commission for Northern Ireland.

Department for Digital, Culture, Media and Sport 7 Cyber Security Breaches Survey 2018: Statistical Release
Chapter 2: Profiling UK businesses and charities
This chapter sets out businesses’ and charities’ exposure to cyber security risks, as well as their use of cloud computing. These risks can come about via their reliance on digital services and e-commerce, and use of personal devices in the workplace (also known as bringing your own device, or BYOD). It provides the context for the different attitudes and approaches to cyber security evidenced in later chapters.
2.1 Online exposure
Once again, virtually all UK businesses represented in the survey rely on some form of digital communication or services (98% mention any of those listed in Figure 2.1), and the same is true for the overwhelming majority of charities (93%). This is the case even for the smallest organisations (98% of micro businesses and 85% of charities with an income of under £10,000).
These findings are in line with the 2017 survey, and maintain the rises seen from 2016 to 2017 in terms of the proportion of businesses with websites or social media pages.
Figure 2.1: Organisations’ reliance on online services
Storing of personal data is widespread. Irrespective of size, a majority of businesses hold personal data (55% of micro or small businesses, through to 78% of large businesses). This is most likely to be found in:
• finance or insurance (80%) • health, social care or social work (78%) • education (77%) • administration or real estate (72%) • professional, scientific or technical sectors (67%).
There are other major sectoral differences. As might be expected, the presence of industrial control systems is greater in the utilities and production sectors (12%). Education businesses are more likely (39%, versus 21% overall) to let customers order, book and pay online.
Charities are less likely than businesses to have adopted online banking. This chimes with the 2017 DCMS qualitative research which found that smaller charities in particular were very cautious about moving to online banking because of the perceived security risks. This year’s qualitative survey also finds that low-income charities typically framed cyber security in terms of
92%
83%
76%
57%
56%
21%
2%
86%
72%
50%
60%
44%
20%
2%
Bases: 1,519 UK businesses; 569 charities
Q. Which of the following, if any, does your organisation currently have or use?
Email addresses for organisation or employees
Website or blog
Online bank account
Social media pages or accounts
Industrial control system
Ability for customers to order, book or pay online
Personal information about customers held electronically
Businesses Charities

Department for Digital, Culture, Media and Sport 8 Cyber Security Breaches Survey 2018: Statistical Release
how safe their finances were and avoiding fraud – for example, one low-income charity said they required two people to sign cheques while another said they never divulged any bank details, for fear of being defrauded.
It is worth noting that charities are exposed to other online risks not mentioned in Figure 2.1. Around three in ten charities enable people to donate online (31%) and just under three in ten allow beneficiaries to access their services online (27%). This is especially true of larger charities (53% of charities with an income of £500,000 or more let people donate online, and 49% enable beneficiaries to access services online).
Which organisations consider online services as core to their work?
Around half of all businesses (52%) and charities (48%) consider online services to be a core part of the goods and services they provide, at least to some extent. Businesses are more likely to say this is to a large extent (15%, versus 8% of charities).
These findings range by size, both for businesses (from 51% of micro businesses to 64% of large businesses saying these kinds of services are core, at least to some extent) and charities (from 42% of charities with incomes under £100,000, to 76% of charities with incomes of £500,000 or more).
The types of businesses most likely to consider online services to be a core part of their organisation in this respect are information or communications firms (65% saying at least to some extent, versus 52% overall) and entertainment, service or membership businesses (64%), which is a similar pattern to the 2017 survey. Finance or insurance firms are also more likely to say that online services are core to a large extent (33%, versus 15% overall). By contrast, businesses in the construction sector are more likely to say that online services are not at all core to their work (59%, versus 46% overall).
2.2 Cloud computing
The use of externally-hosted web services, known as cloud computing, is widespread. Six in ten businesses and five in ten charities currently use cloud computing, as Figure 2.2 shows. The figure for businesses is broadly unchanged since the 2017 survey, but remains significantly higher than 2016 (when it was 49%). The figure for charities becomes more in line with businesses when removing charities with incomes under £10,000 (rising to 62%).
Medium businesses are more likely than average to use the cloud, as shown in Figure 2.2.
Figure 2.2: Use of externally-hosted web services (cloud computing)
The business sectors most likely to use these externally-hosted web services include:
• information or communications (81%) • education (77%) • professional, scientific or technical sectors (75%)
Bases: 1,519 UK businesses; 655 micro firms; 349 small firms; 263 medium firms; 252 large firms; 569 charities
% using externally-hosted web services
to host websites or email, or transfer or
store data
Within large firms
Within medium firms
Within micro firms
Within small firms
Businesses overall
Charities overall
5161 6861 59 64

Department for Digital, Culture, Media and Sport 9 Cyber Security Breaches Survey 2018: Statistical Release
• finance or insurance (74%).
It is worth noting that over half (55%) of the businesses and four in ten (40%) of the charities that say online services are not a core part of the goods and services they provide, do still use cloud computing. This indicates that while organisations may not consider themselves as online organisations, many may still have data stored on external servers.
2.3 Use of personal devices
Just under half of business say someone in their organisation regularly uses a personal device for business purposes (known as BYOD), as Figure 2.3 illustrates. This is generally consistent across different business sizes.
Businesses in the financial and insurance, as well as the information and communications sectors are more likely to have BYOD.
A much greater proportion – around two-thirds – of charities have BYOD, and this was broadly consistent across size bands. To put this in context, DCMS’s 2017 qualitative research with charities suggested that smaller charities with tight budgets, would often not have a head office, or would have restructured and encouraged staff to work from home with their own computers to save money. This latest quantitative survey result, indicates that BYOD can be a much greater source of risk for charities than for businesses.
Figure 2.3: Organisations where bringing your own device (BYOD) occurs
In the qualitative survey, organisations acknowledged that BYOD made cyber security more difficult to manage, because there was less technical control that could be imposed on personal devices. Some organisations had covered home working in a written policy. Nonetheless, the quantitative survey finds that only two in ten businesses (19%) and around one in ten charities (12%) where BYOD was present have a policy covering the use of personally-owned devices for business activities.
“We do allow people to work from home, which is a nightmare really, because you don't know how people work from home. Are they running a Windows XP machine that has never been patched and so massively full of security risks? … So we have to have a policy saying these are the things you have to have in place if you're going to work from home.”
Small business
Bases: 1,519 UK businesses; 105 finance or insurance firms; 99 information or communications firms; 569 charities
% where staff use personally-owned
devices for regular work
Businesses overall
60 6545 66
Withininfo/comms
Withinfinance/
insurance
Charities overall

Department for Digital, Culture, Media and Sport 10 Cyber Security Breaches Survey 2018: Statistical Release
Chapter 3: Awareness and attitudes
This chapter looks at how big a priority cyber security is to businesses and charities. It also covers where these organisations get information, advice or guidance about cyber security.
There is a relatively greater focus on the qualitative survey, alongside the quantitative survey findings, in this chapter compared to the rest of the report. This reflects that the qualitative interviews specifically covered: perceptions of the information and support available, and the factors that might make cyber security a greater or lesser priority for different organisations.
3.1 Importance of cyber security
Three-quarters of businesses (74%) and over half of all charities (53%) say that cyber security is a high priority for their organisation’s senior management, as illustrated in Figure 3.1 below. A third of businesses and a fifth of charities say cyber security is a very high priority for their senior managers.
As was the case in previous years, this prioritisation is much stronger in medium and large businesses, of which nine in ten say that cyber security is a high priority. In charities, there is also a strong difference by size – when excluding those with incomes under £10,000, around two-thirds (64%) say cyber security is a high priority for senior managers, and among high-income charities with £500,000 or more, over eight in ten (86%) say this.
The overall business results are consistent with the 2017 survey. It is worth noting that the proportion of businesses saying cyber security is a low priority has fallen since 2016 (from 30%, to 24% in this survey), indicating that it is now on the agenda for more businesses. More specifically, in this latest survey, more small businesses say it is a very high priority than in the 2017 survey (up from 33% to 42%).
Figure 3.1: Whether senior managers consider cyber security a high priority
The sectors among most likely to say cyber security is a very high priority are the finance and insurance sectors (61%, versus 35% overall) and health, social care or social work sectors (55%). By contrast, the sectors where senior managers are most likely to see cyber security as a low priority include:
• construction (35%, versus 24% overall) • entertainment, service and membership organisations (35%)
Bases: 1,519 UK businesses; 263 medium firms; 252 large firms; 569 charities
Q. How high or low a priority is cyber security to your organisation's directors, trustees
or senior management?
% very high % fairly high % fairly low % very low
35
44
59
20
39
45
32
34
16
6
5
23
8
2
3
23
2
2
% don’t know
% high priority
74
53
89
Businesses overall
Medium businesses
Large businesses
Charities overall
91
1%
1%

Department for Digital, Culture, Media and Sport 11 Cyber Security Breaches Survey 2018: Statistical Release
• food or hospitality (38%).
Reasons for prioritising or deprioritising cyber security
The qualitative survey highlights a range of factors that might determine whether cyber security is considered a priority and acted on, or not. These factors mirror those that have been raised in the 2017 and 2016 surveys.
• Organisational culture differed considerably across organisations. Those that considered themselves to be offline organisations, to have nothing worth stealing, or to be too small to be targeted inevitably did less to protect themselves – this was particularly the case among charities. By contrast, staff in organisations that held and used personal data were seen to be more cyber security-conscious and more aware of the impact that breaches could have on brands and reputation.
“Why are they [hackers] going to go for us when there are much harder things they can tackle and win? They're going to go in to Government bodies, and they could get much more profit and kudos out of that.”
Middle-income charity
• The seniority and time-commitment of staff overseeing cyber security impacted on the organisation’s approach. The responsible individuals were often junior staff members, whose role was bound by the strategic priorities decided by more senior staff. When senior staff were not especially engaged with cyber security, the responsible individuals felt constrained in the action they could take, especially if cyber security was only part of their overall job role. By contrast, where senior managers were seen to be interested in cyber security, those responsible tended to feel more empowered to take action.
• Where organisations thought of cyber security as competing against other priorities for spending, it tended to lose out. For example, one mentioned that they would sooner spend extra funding on marketing rather than cyber security. Those that took more action on cyber security tended to see it more as complementing their existing strategic priorities, for example by keeping key services running, protecting the finances or reputation.
• Those responsible for cyber security had sometimes shifted the mind-set of senior managers by sharing case studies of breaches from other similar organisations.
“We can illustrate what happened to other organisation … That’s the kind of thing that allows us to drive it home and say, ‘that could have been us.’”
High-income charity
• Some organisations had a fatalistic attitude towards cyber security. These organisations did not need convincing about the risks, but felt that there was little point in taking action, as no organisation could be totally secure no matter what they did.
• Another barrier to taking action was the perceived burden of implementation of cyber security measures. Some organisations felt that more cyber security measures would stop people being able to carry out their work flexibly, and that these kinds of measures were difficult to sell to staff.
How often is senior management updated on cyber security?
As noted in the previous section, the involvement of senior managers in cyber security often helped to improve the organisational culture. In total, just over half (56%) of all businesses and three in ten charities (31%) update their senior managers on cyber security issues at least quarterly, or with every breach. As might be expected, this is higher among the businesses that consider cyber security a high priority (66% update senior managers at least once a quarter or per breach) and charities that consider it a priority (45% do so).

Department for Digital, Culture, Media and Sport 12 Cyber Security Breaches Survey 2018: Statistical Release
Figure 3.2 shows that among businesses, one in five never update their senior managers on cyber security issues, and this is higher still in charities. This was more often the case in the food or hospitality sectors (where 31% never update senior managers).
The business findings are again similar to the 2017 survey on the whole, although there are indications of a significant shift towards more regular engagement with senior managers – more are being updated on a daily basis than in 2017.
Figure 3.2: Updates given to senior management on cyber security
3.2 Sources of information
Three-fifths of businesses and two-fifths of charities have actively sought information, advice or guidance on cyber security in the past year. There is a strong difference between micro and small firms (with under 50 staff), and medium and large firms (with 50 or more staff), as Figure 3.3 indicates. There was also a strong variation within charities, with much greater information seeking among middle-income charities (68%) and high-income charities (81%).
Businesses in the following sectors were all more likely than average to have sought information:
• finance or insurance (78%) • administration or real estate (72%) • information or communications (71%) • professional, scientific or technical sectors (69%).
By contrast, businesses in the retail and wholesale sectors (49%) and in food or hospitality (41%) were less likely than the average firm to have sought information.
Bases: 1,519 UK businesses; 569 charities
Q. Approximately how often, if at all, are your organisation's directors or senior
management given an update on any actions taken around cyber security?
% never % less than once a year % annually % quarterly % monthly
% weekly % daily % each time there is a breach % don’t know
20
38
7
11
12
18
14
19
19
7
9 8 5
3
4
3
44
2
Businesses
Charities
1% 1%

Department for Digital, Culture, Media and Sport 13 Cyber Security Breaches Survey 2018: Statistical Release
Figure 3.3: Whether organisations have sought information, advice or guidance
As in previous years, the top (unprompted) sources of information for businesses were external security or IT consultants (29%), followed by general internet searching (11%). These were also the main sources of information for charities (12% used consultants and 5% used search engines). A further four per cent of charities used charity-specific sources such as the Council for Voluntary Services, Institute of Fundraising, and the Charity Commission. Only four per cent of businesses and five per cent of charities used Government sources of information (excluding information from regulators) on cyber security, rising to around one in ten among large businesses and high-income charities (11% in each case).10
Reasons for not seeking information, advice or guidance
The proportion of businesses seeking information (59%) is consistent with the 2016 and 2017 survey findings, so does not indicate any increase in information seeking. The qualitative survey offers a range of reasons for why the individuals responsible for cyber security within organisations may have not sought out further information, advice or guidance.
• Where the responsible individuals had other aspects to their job, they could not afford to dedicate time to it.
• In cases where the individual in charge was not a technical expert, they often did not know where to start looking or were not confident in judging the trustworthiness of information.
• Where organisations had outsourced their IT or cyber security functions, some expected the outsourced provider to keep them informed.
• There were also instances where cyber security was a priority but it was considered common sense – not an issue where they felt a need to seek further advice.
What kind of information do organisations want?
A common theme from the qualitative survey was around wanting information that seemed better tailored to specific organisations. Several organisations discussed a desire for more information in a summarised format, and in plain English. Many also wanted guidance that was
10 This includes any mentions of “Government”, as well as the National Cyber Security Centre. It does not include police, regulators or the NHS, which were all mentioned separately (each by 1% or fewer of all businesses and of all charities).
Bases: 1,519 UK businesses; 655 micro firms; 349 small firms; 263 medium firms; 252 large firms;
119 food or hospitality firms; 217 retail or wholesale firms; 569 charities
Within large firms
Within medium
firms
Within micro firms
Within small firms
Businesses overall
Charities overall
% that have sought information, advice or guidance in the last 12 months on the cyber security threats faced by their organisation
425559 65
Withinhospitality/
food
Withinretail/
wholesale
79 77 4941

Department for Digital, Culture, Media and Sport 14 Cyber Security Breaches Survey 2018: Statistical Release
more clearly aimed at their organisation in terms of size and sector. For example, those in charities often wanted guidance that was labelled as being for charities.11
“It was almost overwhelming, all the information … Sometimes they'd be really huge documents, quite long ones. Sometimes you need it short and snappy. You've only got so much time to deal with things.”
High-income charity
The organisations with specialists in charge of cyber security often wanted more specific information on the latest threats. Among these interviews, some pointed out that the US Government’s National Institute of Standards and Technology (NIST) website had a wider range of articles for end users, and also covered current phishing threats.12
“In future, I want more specific advice on what to look out for, such as what should be regarded as suspicious.”
Small business
Preferred information sources and channels
Typically, the larger organisations in the qualitative survey had a wider range of information sources. Illustrating this wide range, sources mentioned included the National Cyber Security Centre (NCSC) and NIST websites, the Information Security Forum, the British Standards Institute, the SANS Institute, the Register (the UK online magazine) and Reddit (where there were specific forums covering the latest potential threats).
Across all organisations, another key source of information was peer networks and personal contacts. These were often considered more trustworthy than other external sources, and as a way for organisations to benchmark their cyber security against others. These ranged from industry-specific forums through to more informal information sharing when meeting IT colleagues from other organisations. Non-specialists also got advice from friends in the industry, or from people on management boards that had cyber security experience.
In certain sectors with strong established associations or bodies, organisations often expected to hear about cyber security from trade associations or regulators. This included: the health sector, where the NHS was expected to disseminate relevant information; the education sector (the Janet network was mentioned for higher education); and charities, which mentioned their country’s respective Charity Commission. Organisations in the education sector also had established networks for safeguarding issues, which overlapped with cyber security in terms of internet usage policies.
3.3 Awareness of Government initiatives and communications
Of the relatively small proportion of businesses (3%) that recalled (without prompting) using Government information, advice or guidance, the vast majority (84%) say they found this information useful. However, most organisations are still not aware of major Government initiatives of communications in this area.
11 The National Cyber Security Centre has recently (after this survey was conducted) launched a guide to cyber
security for small charities on its website: https://www.ncsc.gov.uk/charity.
12 Since the survey was completed, this type of threat information has also been added to the National Cyber Security Centre website, at: https://www.ncsc.gov.uk/threats.

Department for Digital, Culture, Media and Sport 15 Cyber Security Breaches Survey 2018: Statistical Release
As Figure 3.2 shows, when prompted, three in ten businesses and the same proportion of charities are aware of the Government’s Cyber Aware communications campaign.13 For businesses this is an increase from the 2017 survey (from 21% to 29%). Fewer are aware of the Government’s 10 Steps guidance14 or the Cyber Essentials accreditation scheme15.
As Figure 3.4 also suggests, larger organisations tend to be more aware of each of these initiatives or schemes. This also goes for high-income charities, which are also typically more aware of Cyber Aware (40%, versus 30% overall), 10 Steps (34% versus 19%) and Cyber Essentials (29% versus 8%).
Information and communication firms also tend to be more aware than other sectors of each of these initiatives.
Figure 3.4: Awareness of Government cyber security initiatives and accreditation schemes
The qualitative survey may help to explain why awareness of some Government initiatives and schemes is not higher. It found that some organisations had not expected there to be any Government information on cyber security, so had not sought it out. Others thought that Government information would not be tailored enough, would be too detailed, or not detailed enough for their needs.
In addition, there were mixed perceptions about the authoritativeness of Government information. Organisations in heavily-regulated sectors like education thought that Government advice would be taken very seriously.
“They [the Government] are a very authoritative source of information. If we received something from the Government saying that they thought that people were trying to target private primary schools, we would take that very seriously.”
Medium business
13 See https://www.cyberaware.gov.uk/. 14 See https://www.ncsc.gov.uk/guidance/10-steps-cyber-security. 15 See https://www.cyberessentials.ncsc.gov.uk/.
Bases: 1,519 UK businesses; 655 micro firms; 349 small firms; 263 medium firms; 252 large firms;
99 information or communications firms; 569 charities
% aware of Cyber
Essentials scheme
% aware of Government’s
10 Steps guidance
% aware of Government’s
Cyber Aware campaign
Charities overall
Withininfo/comms
Within large firms
Within medium
firms
Within micro firms
Within small firms
Businesses overall
302729 31 33 51 41
191314 15 24 34 31
889 9 23 37 21

Department for Digital, Culture, Media and Sport 16 Cyber Security Breaches Survey 2018: Statistical Release
By contrast, other organisations suggested that the WannaCry ransomware attack in May 2017, which affected organisations all over the world, including public-sector organisations such as the NHS, had undermined trust in the Government on this topic.
“I wouldn't think of the Government as being necessarily cyber-savvy. Look at the NHS attack … You think the NHS is under the control of the Government, so the Government can't be seen to be doing its own due diligence.”
Micro business
3.4 The General Data Protection Regulation (GDPR)
On 25 May 2018, the General Data Protection Regulation (GDPR) will be implemented in the UK. The survey included questions on this topic area, which have been covered in more detail in a separate DCMS report.16
The quantitative survey finds that two-fifths (38%) of businesses and just over two-fifths (44%) of charities are aware of GDPR (at the time of fieldwork in winter 2017). Of these, 13 per cent of businesses and nine per cent of charities had amended their cyber security policies or processes specifically in preparation for GDPR.
In the qualitative survey, organisations noted that GDPR was a particularly effective prompt because it is a legal requirement with potential large fines for breaches. This meant it was being raised at management board level. There were also examples where GDPR had been used as leverage, to get senior managers to approve improvements to cyber security.
“I think GDPR is going to help. It's going to certainly allow us to enforce access controls in a more rigid manner.”
High-income charity
However, there was also some concern that this momentum risked being lost after May. In one organisation, the responsible individual said that their board currently wanted weekly updates on cyber security and progress on implementing GDPR, but speculated that this would not continue to feature on the weekly agenda in board meetings shortly after implementation.
16 Cyber Security Breaches Survey 2018: Preparations for the new Data Protection Act is available on the gov.uk website at: https://www.gov.uk/government/statistics/cyber-security-breaches-survey-2018-preparations-for-the-new-data-protection-act.

Department for Digital, Culture, Media and Sport 17 Cyber Security Breaches Survey 2018: Statistical Release
Chapter 4: Approaches to cyber security
This chapter looks at how much businesses and charities are investing in cyber security and what drives this level of investment. It then examines how organisations broach the subject of cyber security with their staff, and the policies and procedures they have in place to identify and reduce risks.
As in Chapter 3, there is a relatively greater focus on the qualitative survey, alongside the quantitative survey findings, in this chapter compared to the rest of the report. This reflects that the qualitative interviews specifically covered: perceptions of cyber insurance, finding and working with outsource cyber security providers, and cyber security training.
4.1 Investment in cyber security
Levels of investment
Two-thirds of businesses have some level of cyber security spend, which is the same proportion as last year.17 On the other hand, charities are much less likely to spend anything on cyber security – even when excluding the smallest charities with incomes under £10,000, three-fifths (58%) of the remaining charities do not spend anything.
As in previous years of the survey, spending varies by the size of the organisation, with larger organisations tending to spend more – this is visible in Table 4.1.18 This pattern repeats across charities as well, with those with incomes of £5 million or more spending an average of £215,000 on cyber security.
The average amount spent across all businesses has been relatively consistent over the past two years, while the averages within each size band have fluctuated, without any noticeable pattern. Nonetheless, this year the average spending by medium businesses is significantly higher in real terms (taking into account inflation) at £41,600, compared to £15,500 in the 2017 survey.19
Table 4.1: Average investment in cyber security in last financial year
All
businesses Micro/ small businesses20
Medium businesses
Large businesses
All charities
Mean spend £3,580 £2,220 £41,600 £149,000 £3,660
Median spend £152 £152 £5,190 £24,700 £0
% spending £0 33% 33% 16% 9% 68%
Base 1,142 823 171 148 471
17 Respondents were asked to include spending on any activities or projects to prevent or identify cyber security
breaches or attacks, including software, hardware, staff salaries, outsourcing and training-related expenses, but excluding any spending undertaken to repair or recover from breaches or attacks. The figures in Table 4.1 exclude “don’t know” and “refused” responses.
18 Figures in these tables are presented to three significant figures, or to the nearest whole number (if under 100). 19 Statistical significance testing of spending and cost estimates against previous years takes into account inflation of 2.8% since the 2017 survey and 4.0% since the 2016 survey, based on Office for National Statistics (ONS) data. This has been taken from the ONS website, at: https://www.ons.gov.uk/economy/inflationandpriceindices. 20 Micro and small firms have been merged to make this analysis more statistically robust.

Department for Digital, Culture, Media and Sport 18 Cyber Security Breaches Survey 2018: Statistical Release
As shown in Figure 4.1, spending across businesses tends to be higher in sectors that consider cyber security as more of a priority, notably among finance or insurance, and information or communications firms – this is also consistent with previous years. In general, businesses that consider cyber security to be a very high priority tend to spend a greater amount (£8,500 overall, compared with £3,580 for businesses overall).
Spending is also correlated with turnover, with high-turnover organisations typically spending more, as might be expected.
Figure 4.1: Average investment in cyber security in last financial year, by business sector grouping
Among charities, spending is generally higher in the group of charities that focus on healthcare, social care, disability or ageing (where it is £8,210 overall for this sector grouping, versus and average of £3,660 across all charities). This reflects findings in the qualitative survey suggesting that these types of charities have a greater organisational focus on data protection than others, because of the types of individuals they deal with.
Drivers of investment
By far the most common (unprompted) reason that businesses invest in cyber security is to protect the data of customers, service users or donors, and this is an even stronger motivation among charities (62% of charities that invest do so for this reason, versus 47% of businesses). The next most common reasons given are to prevent fraud or theft, and to protect other assets. This is shown in Figure 4.2.
Grouping some of the specific reasons suggests that businesses place a greater emphasis on internal operations and assets, whereas charities tend to be more focused on fulfilling their external obligations. Taken together, businesses are more likely to say their investment is about business continuity, preventing downtime or protecting intellectual property (28% mention at least one of these, versus 14% of charities). Charities are more likely to put their investment down to protecting beneficiary or donor data, meeting client or donor requirements, or complying with laws or regulations (66%, versus 52% of businesses).
The findings from this year’s survey are very similar to those seen in the 2017 survey.
Bases: 98 administration or real estate firms; 113 construction firms; 69 education firms;
87 entertainment, service or membership organisations firms; 76 finance or insurance firms; 99 food or hospitality firms; 71 health or social care firms; 77 information, communications or utility firms; 102 professional, scientific or technical fi rms; 165 retail or wholesale firms; 71 transport or storage firms; 114 utilities or production firms
Within information/communications
Within finance/insurance
Within professional/scientific/technical
Within hospitality/food
Within construction
Within administration/real estate
Within health/social care/social work
Within transport/storage
Within retail/wholesale
Within utilities/production
Within entertainment/service/membership
£17,900
£14,300
£8,400
£6,570
£4,270
£2,940
£2,770
£2,370
£1,860
£1,300
£900
£770
Within education

Department for Digital, Culture, Media and Sport 19 Cyber Security Breaches Survey 2018: Statistical Release
Figure 4.2: Main reasons for investing in cyber security, among organisations that invest
Among charities, the reasons for investing are similar across all income bands, whereas among businesses, there are several different reasons for investing:
• A number of reasons are given more frequently by large firms, including protecting the organisation’s reputation or brand (24%, compared with 9% overall), complying with laws or regulations (18% versus 5%) and meeting client requirements (16% versus 6%).
• Medium firms are most likely to say that preventing fraud or theft is a main reason for investing (25%, compared with 16% overall).
• Protecting customer or user data is most likely to be given as a reason by businesses in the finance or insurance sectors (65%) and the construction sector (60%).
• Businesses in the finance or insurance and education sectors tend to more concerned about fulfilling their external obligations. Finance or insurance businesses are more likely to mention reasons related to meeting customer requirements (17%, versus 6% overall) and complying with laws or regulations (23% versus 5%). Complying with laws or regulations is also relatively more important in the education sector (23%).
Cyber insurance
A small minority of businesses and charities say they have a specific cyber security insurance policy (nine per cent and four per cent respectively).21 This was more common among businesses in the finance or insurance sectors (20%), and among medium (19%) and large businesses (24%). Among charities, cyber insurance is more common among high-income charities (20% among those with incomes of £500,000 or more).
Among the organisations without insurance, the most common reason given for not taking it up is that they do not consider themselves at enough of a risk to warrant it (41% of the businesses and 53% of the charities without insurance). The other main reason is lack of awareness (for
21 These findings are not comparable with the 2017 and 2016 surveys, which asked whether businesses had any insurance to cover them in the event of a cyber security breach or attack (rather than a specific cyber security insurance policy).
Bases: 849 businesses investing in cyber security; 250 charities
Q. What are the main reasons that your organisation invests in cyber security?
47%
23%
19%
16%
11%
9%
6%
5%
4%
62%
18%
11%
19%
10%
9%
10%
9%
5%
Protecting customer or donor data
Preventing fraud or theft
Protecting trade secrets, intellectual property or other assets (e.g. cash)*
Business continuity or preventing downtime
Protecting reputation or brand
Customers or donors require it
Complying with laws or regulations
Protecting our staff and systems
Protecting against viruses
Top unprompted responses (5% or more)
7
Businesses Charities

Department for Digital, Culture, Media and Sport 20 Cyber Security Breaches Survey 2018: Statistical Release
22% of these businesses and 17% of these charities), which could encompass lack of awareness of the existence of cyber insurance, of how to take up a policy, or of why they might need cyber insurance.
Those in the finance or insurance sectors who did not have specific cyber insurance are particularly likely to say, albeit still in small numbers, that they are covered by another policy (19%, versus 6% of all businesses) or that cyber insurance offers insufficient coverage for their needs (7%, versus 1% overall).
The qualitative survey highlights that those responsible for cyber security within an organisation are often not the same individuals who will make decisions about insurance, and this may be one of the reasons it is not being considered. Some organisations also felt that they already had enough funds to cover a loss due to a cyber attack, so did not see the need for insurance. There was also an ideological barrier raised around cyber insurance, with the responsible individual in one large organisation saying they would prefer to invest money in preventing a breach rather than paying for insurance, which would only help them should a breach occur.
The qualitative survey also provides insights on the mixed perceptions that organisations have of the cyber insurance market. Individuals in some of the larger organisations felt there was a lack of clarity as to what cyber insurance would cover, and there was also some scepticism about the conditions under which insurance would pay out. In several cases, individuals noted that these were only their perceptions, not based on first-hand experience, but that they had been discouraged from taking on cyber insurance for these reasons.
4.2 Outsourcing cyber security
Around half of all businesses (49%) have an outsourced provider that manages their cyber security, which is the same proportion as in the 2017 survey. Charities are half as likely as businesses to outsource their cyber security, with only a quarter (24%) doing so. If organisations do not currently outsource their cyber security, they generally do not intend to do so – only four per cent of businesses, and seven per cent of charities, say they intend to use an outsourced provider in the future.
As Figure 4.3 illustrates, outsourcing is more common among finance or insurance firms and those in administration or real estate. By size, outsourcing is more common among small and medium firms, than either micro or large firms.
Among charities, there is a more direct correlation with size, with the larger high-income charities being most likely to outsource (64% of those with an income of £500,000 or more do so, versus 24% overall).
Figure 4.3: Use of outsourced cyber security providers
Bases: 1,519 UK businesses; 655 micro firms; 349 small firms; 263 medium firms; 252 large firms;
150 administration or real estate firms; 105 finance or insurance firms; 569 charities
Within large firms
Within medium
firms
Within micro firms
Within small firms
Businesses overall
Charities overall
% of organisations that have an outsourced cyber security provider
244149 63 64 49 7362
Withinfinance/
insurance
Withinadmin/
real estate
Department for Digital, Culture, Media and Sport 21 Cyber Security Breaches Survey 2018: Statistical Release
Choosing a provider
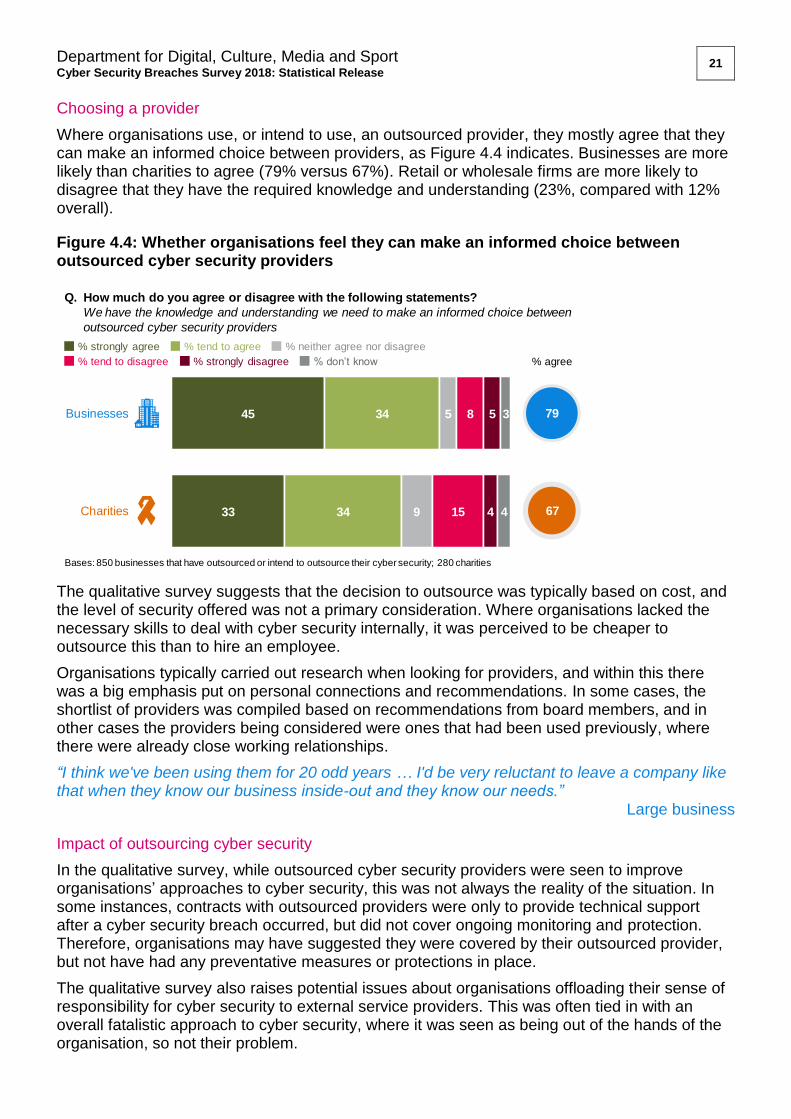
Where organisations use, or intend to use, an outsourced provider, they mostly agree that they can make an informed choice between providers, as Figure 4.4 indicates. Businesses are more likely than charities to agree (79% versus 67%). Retail or wholesale firms are more likely to disagree that they have the required knowledge and understanding (23%, compared with 12% overall).
Figure 4.4: Whether organisations feel they can make an informed choice between outsourced cyber security providers
The qualitative survey suggests that the decision to outsource was typically based on cost, and the level of security offered was not a primary consideration. Where organisations lacked the necessary skills to deal with cyber security internally, it was perceived to be cheaper to outsource this than to hire an employee.
Organisations typically carried out research when looking for providers, and within this there was a big emphasis put on personal connections and recommendations. In some cases, the shortlist of providers was compiled based on recommendations from board members, and in other cases the providers being considered were ones that had been used previously, where there were already close working relationships.
“I think we've been using them for 20 odd years … I'd be very reluctant to leave a company like that when they know our business inside-out and they know our needs.”
Large business
Impact of outsourcing cyber security
In the qualitative survey, while outsourced cyber security providers were seen to improve organisations’ approaches to cyber security, this was not always the reality of the situation. In some instances, contracts with outsourced providers were only to provide technical support after a cyber security breach occurred, but did not cover ongoing monitoring and protection. Therefore, organisations may have suggested they were covered by their outsourced provider, but not have had any preventative measures or protections in place.
The qualitative survey also raises potential issues about organisations offloading their sense of responsibility for cyber security to external service providers. This was often tied in with an overall fatalistic approach to cyber security, where it was seen as being out of the hands of the organisation, so not their problem.
Bases: 850 businesses that have outsourced or intend to outsource their cyber security; 280 charities
Q. How much do you agree or disagree with the following statements?
We have the knowledge and understanding we need to make an informed choice between
outsourced cyber security providers
% strongly agree % tend to agree % neither agree nor disagree
% tend to disagree % strongly disagree % don’t know
45
33
34
34
5
9
8
15
5
4
3
4
% agree
67
79Businesses
Charities
Department for Digital, Culture, Media and Sport 22 Cyber Security Breaches Survey 2018: Statistical Release
“We hope our provider protects us from that. A combination of the IT provider and also the accounting software provider.”
Medium business
4.3 Staff approaches
Who is responsible for cyber security?
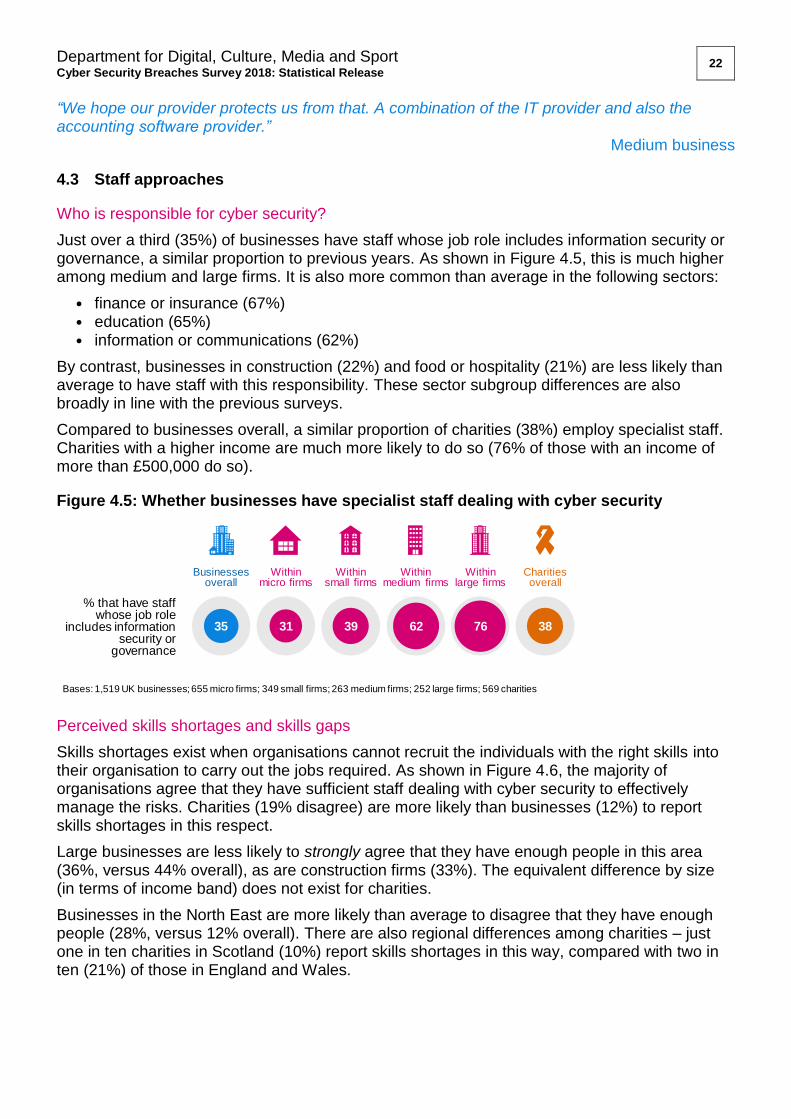
Just over a third (35%) of businesses have staff whose job role includes information security or governance, a similar proportion to previous years. As shown in Figure 4.5, this is much higher among medium and large firms. It is also more common than average in the following sectors:
• finance or insurance (67%) • education (65%) • information or communications (62%)
By contrast, businesses in construction (22%) and food or hospitality (21%) are less likely than average to have staff with this responsibility. These sector subgroup differences are also broadly in line with the previous surveys.
Compared to businesses overall, a similar proportion of charities (38%) employ specialist staff. Charities with a higher income are much more likely to do so (76% of those with an income of more than £500,000 do so).
Figure 4.5: Whether businesses have specialist staff dealing with cyber security
Perceived skills shortages and skills gaps
Skills shortages exist when organisations cannot recruit the individuals with the right skills into their organisation to carry out the jobs required. As shown in Figure 4.6, the majority of organisations agree that they have sufficient staff dealing with cyber security to effectively manage the risks. Charities (19% disagree) are more likely than businesses (12%) to report skills shortages in this respect.
Large businesses are less likely to strongly agree that they have enough people in this area (36%, versus 44% overall), as are construction firms (33%). The equivalent difference by size (in terms of income band) does not exist for charities.
Businesses in the North East are more likely than average to disagree that they have enough people (28%, versus 12% overall). There are also regional differences among charities – just one in ten charities in Scotland (10%) report skills shortages in this way, compared with two in ten (21%) of those in England and Wales.
Bases: 1,519 UK businesses; 655 micro firms; 349 small firms; 263 medium firms; 252 large firms; 569 charities
% that have staff whose job role
includes information security or
governance
Within large firms
Within medium firms
Within micro firms
Within small firms
Businesses overall
Charities overall
3831 6235 39 76

Department for Digital, Culture, Media and Sport 23 Cyber Security Breaches Survey 2018: Statistical Release
Figure 4.6: Perceptions of cyber skills shortages
Skills gaps are different to skills shortages – they describe the situation when current staff within an organisation do not have the skills to carry out their job as required. Only a minority of organisations report skills gaps in relation to cyber security, although again this is more common among charities (22% disagree) than businesses (10%), as Figure 4.7 shows.
Businesses in the education sector are among the most likely to identify skills gaps (21% disagree, versus 10% overall).
In contrast to the skills shortage results, large businesses are among the most likely to strongly agree that staff within their organisation have the right skills around cyber security (49%, versus 39% overall). High-income charities are also more likely to strongly agree (38% of those with an income of £500,000 or more do so, versus 25% overall).
Once again, charities in Scotland are much less likely to identify skills gaps than those in England and Wales (eight per cent compared with 24%), although there are no observed regional differences for businesses.
Figure 4.7: Perceptions of cyber skills gaps
Bases: 1,519 UK businesses; 569 charities
Q. How much do you agree or disagree with the following statements?
We have enough people dealing with cyber security in our organisation to effectively
manage the risks
% strongly agree % tend to agree % neither agree nor disagree
% tend to disagree % strongly disagree % don’t know
44
34
30
30
11
14
7
11
5
8
3
4
% agree
63
74Businesses
Charities
Bases: 1,519 UK businesses; 569 charities
Q. How much do you agree or disagree with the following statements?
The people dealing with cyber security in our organisation have the right cyber security
skills and knowledge to do this job effectively
% strongly agree % tend to agree % neither agree nor disagree
% tend to disagree % strongly disagree % don’t know
39
25
31
32
16
16
6
11
4
10
3
6
% agree
57
70Businesses
Charities

Department for Digital, Culture, Media and Sport 24 Cyber Security Breaches Survey 2018: Statistical Release
Staff training
A fifth (20%) of businesses have had staff attend internal or external training on cyber security in the last 12 months, which is similar to previous years. The overall figure comprises 12 per cent of businesses providing internal training, seven per cent offering external training and 10 per cent where staff attended seminars or conferences.
This is lower for charities (15%). Specifically, nine per cent of charities provide internal training, seven per cent external training, and eight per cent had staff attend seminars or conferences.
As shown in Figure 4.8, training of any kind is much more common among larger firms, and is more prevalent within the finance or insurance sector, and the information or communications sector. Training is much rarer among food or hospitality firms (9%, versus 20% overall).
Among charities, there is similar variation by income band (ranging from nine per cent of charities with an income of less than £100,000, to 56% of charities with an income of £500,000 or more providing training).
Figure 4.8: Organisations where staff have had cyber security training in the last 12 months
It is worth noting that businesses that report cyber skills gaps are less likely than average to have sent staff on cyber security training (12% of businesses that report skills gaps have done so, versus 20% overall). A similar difference exists among charities, albeit with smaller sample sizes. This suggests that organisations that have identified a problem with skills gaps have not necessarily taken steps to address it through offering training. The qualitative survey helps to explain this – the next section lays out various barriers to training raised in interviews.
Organisations are most likely to send directors or senior management staff on cyber security training, and this is more common among businesses than charities, as Figure 4.9 indicates. Across businesses, this proportion is lower among medium businesses (63%, versus 76% for the average business) and large businesses (59%).
Among businesses, the figure for directors or senior management is similar to 2017, although a lower proportion of businesses offer training specifically to IT staff than in the 2017 survey.
Bases: 1,519 UK businesses; 655 micro firms; 349 small firms; 263 medium firms; 252 large firms;
99 information or communications firms; 105 finance or insurance firms; 569 charities
Within large firms
Within medium
firms
Within micro firms
Within small firms
Businesses overall
Charities overall
% of organisations where staff have attended internal or external training, or seminars or conferences on cyber security in the last 12 months
151620 26 43 65 5938
Withinfinance/
insurance
Withininfo/comms

Department for Digital, Culture, Media and Sport 25 Cyber Security Breaches Survey 2018: Statistical Release
Figure 4.9: Which individuals receive cyber security training where it is offered
It is considerably rarer for non-specialist and non-senior staff to attend this kind of training, both in businesses and charities. In addition, just seven per cent of charities offered such training to any volunteers. This contrasts with findings from the qualitative survey, which highlighted that many organisations wanted all their staff to be vigilant of cyber security threats.
“Part of cyber security is about making sure that individuals understand the role they have got to play, both in implementing controls, but also recognising that they have to highlight where controls aren't working.”
Higher education institution
Barriers to training
The qualitative survey also raised several barriers to training, including cost, format, regularity and not seeing the need for training:
• There was a sense that induction training, irregular training, or training that was not mandatory could be easily forgotten. There were various examples of good practice to combat this. One smaller organisation arranged individual sessions with every staff member. One had moved towards more targeted training, making staff go on training courses only after they had failed an internal penetration test with a fake phishing email. Another organisation required all their staff to complete an annual online module on cyber security, and non-completion meant that they would not be eligible for their yearly bonus.
• Cost and logistics meant that face-to-face training sessions were difficult, and some wanted or had already adopted more video training sessions or webinars. This matches similar findings from the 2017 qualitative research with charities.
• Those who framed cyber security strongly in terms of common sense sometimes did not see what value training would add – what it would teach them beyond what they already felt they knew.
4.4 Governance and planning
Formal policies and documentation
It is still uncommon across all organisations for cyber security risks and approaches to be documented in any way. Moreover, businesses are less likely than they were in the 2017 survey to have a formal policy on cyber security (27%, versus 33% in the 2017 survey). While the
Bases: 505 businesses that offer cyber security training; 190 charities
Q. Who in your organisation attended any of the training, seminars or conferences over
the last 12 months?
76%
30%
26%
25%
59%
22%
31%
16%
Directors or senior management staff
IT staff
Staff members whose job role includes information security or
governance
Other staff who are not cyber security or IT specialists
Businesses Charities
13

Department for Digital, Culture, Media and Sport 26 Cyber Security Breaches Survey 2018: Statistical Release
changes within each size band across years are not statistically significant, the pattern of the findings suggests this drop is mostly due to fewer micro businesses having formal policies.
Charities are also less likely than businesses to have a formal policy in place, as Figure 4.10 illustrates.
As in previous years, it is the largest firms that are among the most likely to have a formal policy and to have their cyber security risks documented. This is also the case for charities, with over six in ten high-income charities (63% of those with incomes of £500,000 or more) having a policy and around two-thirds (67%) documenting the risks.
Businesses in the finance or insurance, education, and information or communications sectors are more likely to have documented their approaches to cyber security in terms of both these indicators.
Figure 4.10: Whether organisations have formal policies or document cyber security risks in any way
What is covered in policies?
As Figure 4.11 attests, cyber security policies, where they exist, typically cover a range of cyber security risks. For businesses, these figures are broadly in line with the 2017 survey, but it is worth noting that the proportion of businesses with policies covering the use of their own IT devices has dropped since the 2016 survey (from 88% to 79%). This decrease does not appear to be focused within a particular size band.
Bases: 1,519 UK businesses; 655 micro firms; 349 small firms; 263 medium firms; 252 large firms; 569 charities
% with cyber security risks documented in business continuity
plans, internal audits or risk registers
% with formal policy or policies covering cyber security risks
22
21
7721
20 5927
28 37
39
Within large firms
Within medium firms
Within micro firms
Within small firms
Businesses overall
Charities overall
59
74
5

Department for Digital, Culture, Media and Sport 27 Cyber Security Breaches Survey 2018: Statistical Release
Figure 4.11: Most common features of cyber security policies
Policies in charities are less likely than those drawn up in businesses to cover the use of cloud computing. For both businesses and charities, data classification is much less commonly covered in cyber security policies than other areas. This latter topic is only typically a feature in the cyber security policies of large businesses (61% of large businesses with a cyber security policy include data classification in this policy, versus 43% overall).
Board responsibilities
The qualitative survey findings this year and in previous years have consistently shown the importance of having board-level support for cyber security. In spite of this, most organisations have not made specific board members or trustees responsible for cyber security, as Figure 4.12 shows. Nonetheless, these figures do suggest progress since the 2017 survey, with large businesses in particular more likely to have board-level cyber security responsibilities than before (62%, versus 40% in the 2017 survey).
This kind of board-level responsibility is, as per last year, more common than average among information or communications firms and finance or insurance firms – both sectors where senior managers already tend to prioritise cyber security more than average.
A quarter of charities (24%) have trustees with responsibility for cyber security. In contrast to businesses, this does not differ by size (in terms of income band), suggesting that the largest charities are much further behind large businesses in this respect.
Bases: 633 businesses with cyber security policies; 229 charities
Q. Which of the following, if any, are covered within your cyber security-related
policies?
79%
65%
60%
66%
60%
59%
43%
74%
58%
54%
59%
60%
42%
42%
What staff are permitted to do on organisation’s IT devices
What can be stored on removable devices (e.g. USB sticks)
Remote or mobile working
Document management system
Use of personally-owned devices for business activities
Use of new digital technologies such as cloud computing
Data classification
Businesses Charities

Department for Digital, Culture, Media and Sport 28 Cyber Security Breaches Survey 2018: Statistical Release
Figure 4.12: Whether organisations have board members or trustees with responsibility for cyber security
Reasons for not having governance procedures in place
Organisations that had none of the governance procedures discussed in this section were asked why they did not have such measures in place. The most common answer is that cyber security is not considered enough of a priority to warrant such measures (for 31% of the businesses and 29% of the charities without these measures). For businesses, this is an increase on last year’s figure (20%).
At the same time, the next most common answer – that the organisation is too small or insignificant to need measures – has decreased since the 2017 survey. This year, a quarter (24%) of micro and small businesses give this response (versus 39% in the 2017 survey). A fifth of charities (22%) give this response. A similar proportion of the charities (20%) and businesses (21%) without any measures also say they do not consider themselves to be at risk.
4.5 Risk management
Actions taken to identify risks
More than half of all businesses (56%) and just under half of all charities (46%) say they have taken some form of action to identify cyber risks to their organisation. The business figure is consistent with the 2017 survey, which itself was an increase from the 2016 figure (51%).
Figure 4.13 shows that these kinds of actions are more common among larger firms. The size difference is also present for charities, with over eight in ten high-income charities (84% of those with an income of £500,000 or more) having taken any of these actions. However, it is worth noting that this leaves 11 per cent of large firms and 16 per cent of high-income charities that are still not taking any action to identify cyber risks.
Investing in threat intelligence is especially uncommon across businesses and charities. With the exception of risk assessments, charities are less likely than businesses to have undertaken each of the specific activities mentioned here.
Bases: 1,519 UK businesses; 655 micro firms; 349 small firms; 263 medium firms; 252 large firms;
99 information or communications firms; 105 finance or insurance firms; 569 charities
Within large firms
Within medium
firms
Within micro firms
Within small firms
Businesses overall
Charities overall
% of organisations where there are board members or trustees with responsibility for cyber security
242830 32 48 62 4749
Withinfinance/
insurance
Withininfo/comms

Department for Digital, Culture, Media and Sport 29 Cyber Security Breaches Survey 2018: Statistical Release
Figure 4.13: Ways in which organisations have identified cyber security risks in the last 12 months
Organisations in the retail and wholesale sectors are among the least likely to have taken any of these actions (47% have done so, versus a 56% average).
Actions taken to prevent or minimise risks
As Figure 4.14 shows, the overwhelming majority of organisations have certain cyber security rules or controls in place, although each of these rules tends to be more common in businesses than in charities. The figures for businesses are very similar to those seen in the 2017 survey.
There are several rules or controls that are in place in the majority of businesses and charities of all sizes: applying software updates when available, maintaining up-to-date malware protection, having firewalls with appropriate configurations, and restricting IT admin and access rights to specific users.
The difference between businesses and charities is most pronounced in relation to only allowing access via devices owned by the organisation – charities are far less likely to stipulate this, which is reflective of the fact that they are typically much more reliant on staff using personal devices for their work (as noted in Chapter 2). In addition, whereas the majority of businesses have security controls on their own devices and back up data securely, most charities do not do these things as a matter of course.
As in previous years, rules and controls around encryption continue to be far more atypical across all organisations, including those for whom such rules may be especially important. For example, organisations that hold personal information on customers are more likely than average to have such rules, but over half of such businesses (56%) and charities (55%) do not. Tightening encryption is therefore still a potential area for improvement for many organisations.
Rules around BYOD once again appear challenging for organisations to enforce. While two-thirds (66%) of businesses have a rule restricting access to company-owned devices, it is noteworthy that four in ten (40%) of these businesses still say they have staff who use personal devices for regular business activities; the equivalent figure for charities is higher still (48%).
Bases: 1,519 UK businesses; 655 micro firms; 349 small firms; 263 medium firms; 252 large firms; 569 charities
Q. Which of the following, if any, have you done over the last 12 months to identify
cyber security risks to your organisation?
Business-as-usual health checks that are undertaken regularly
Risk assessment covering cyber security risks
External audit
Ad-hoc health checks or reviews beyond regular processes
Invested in threat intelligence
Any of the listed activities56%
36%
24%
22%
21%
15%
8%
46%
24%
20%
14%
15%
10%
4%
Businessesoverall
Micro firms
Smallfirms
Mediumfirms
Largefirms
56
50
65
79
89
% anyBusinesses Charities
Internal audit

Department for Digital, Culture, Media and Sport 30 Cyber Security Breaches Survey 2018: Statistical Release
Figure 4.14: Rules or controls that organisations have implemented
There are broad differences by business sector. The use of the various rules and controls tends to be more widespread within:
• education • finance or insurance • administration or real estate • health, social care or social work • information or communications.
Nonetheless, even in the education sector, encryption of personal data is only mentioned by under half (43%) of education firms.
How do organisations conceptualise cyber security risks?
The qualitative survey findings suggest that good cyber security means different things to different organisations, and this in turn creates different approaches to risk management:
• Some organisations saw their staff purely as a source of risk, and took approaches that were more based around limiting the access and control that staff had. They often noted the frustration that staff could have with this approach, for example in not being allowed to check personal emails or use their own USB sticks. On the other hand, other organisations discussed the importance of getting non-specialist staff on board with the cyber security agenda, as they were effectively the organisation’s first line of defence, for example in reporting phishing emails. In one case, this way of thinking is what made the organisation make their cyber security training mandatory for all staff.
“It's a fine balance, a tightrope I think we walk, and I think that's getting more complicated and this is what frustrating people … understanding this tightrope we have to walk to get security right along with personal rights.”
Large business
Bases: 1,519 UK businesses, 569 charities
Q. Which of the following rules or controls, if any, do you have in place?
Businesses Charities
92%
90%
89%
78%
70%
67%
66%
65%
58%
38%
37%
32%
75%
73%
69%
65%
53%
47%
32%
42%
38%
32%
31%
23%
Applying software updates when they are available
Firewalls with appropriate configuration
Up-to-date malware protection
Restricting IT admin and access rights to specific users
Only allowing access via company-owned devices
Security controls on company-owned devices (e.g. laptops)
Segregated wireless network
Monitoring of user activity
Encrypting personal data
Guidance on acceptably strong passwords
Backing up data securely via other means
Backing up data securely via a cloud service

Department for Digital, Culture, Media and Sport 31 Cyber Security Breaches Survey 2018: Statistical Release
“I think good cyber security, for us, is making sure our users have good knowledge about what to do and what not to do in how they encounter technology on a daily basis … making sure they are not opening up the organisation to any cyber threats.”
High-income charity
• Some organisations, typically those that did not feel especially knowledgeable about cyber security, framed the issue in terms of hacking, fraud and theft. Consequently, for these organisations, there was less of a central focus on protection of personal data. By contrast, those organisations that dealt regularly with personal data tended to have more of an organisational culture that focused on protecting these data as a matter of course.
4.6 Dealing with third-party suppliers or contractors
Around one in ten businesses (12%) and charities (10%) require their suppliers to adhere to any cyber standards. The figure for businesses is in line with both the 2016 and 2017 surveys.
Larger businesses are more likely to have this requirement (37%). Among charities, there is also variation by income, with a third of high-income charities with more than £500,000 having this requirement (34%, versus 10% overall).
Where organisations do set minimum standards, the most common requirements placed on suppliers are to adhere to a recognised international standard, such as the Payment Card Industry Data Security Standard, or ISO 27001. A small number of organisations are using the Government-endorsed Cyber Essentials scheme with suppliers at present, as shown in Figure 4.15. The figures for businesses are broadly in line with the 2017 survey.
Figure 4.15: Most commonly required cyber security standards for suppliers
The qualitative survey also raised reasons for why organisations did not always impose standards on suppliers. In some cases, the supplier was a household name and the individual in charge of cyber security felt that this was a mark of quality in itself. In other cases, there was a similar approach with suppliers as there was with outsourced providers – organisations were using suppliers based on personal contacts, and therefore had a sense of personal trust in these suppliers, which they felt did not need a formal assessment. Some smaller organisations also remarked that they did not have the power to change supplier behaviour once contracts had been agreed, but felt that they might have more leeway to do this when getting new suppliers and agreeing new terms.
50%
39%
27%
8%
5%
44%
44%
29%
14%
14%
Bases: 292 businesses with supplier standards; 119 charities
Q. Which of the following, if any, do you require your suppliers to have or adhere to?
Payment Card Industry Data Security Standard (PCI DSS)
Recognised standard such as ISO 27001
Independent service auditor’s report (e.g. ISAE 3402)
Cyber Essentials
Cyber Essentials Plus
Businesses Charities

Department for Digital, Culture, Media and Sport 32 Cyber Security Breaches Survey 2018: Statistical Release
4.7 Implementing Government initiatives
Cyber Essentials
The Government-endorsed Cyber Essentials scheme enables organisations to be certified independently for having met a good-practice standard in cyber security. It requires them to enact basic technical controls across five areas: boundary firewalls and internet gateways, secure configurations, user access controls, malware protection, and patch management (applying software updates).
The survey findings show that half of all businesses (51%) have implemented all of the technical controls under Cyber Essentials, consistent with the 2016 and 2017 surveys.22 As in previous years, use of these technical controls is more common among medium (80%) and large firms (88%), compared with small (57%) and micro firms (47%). The proportion is much higher than average in finance or insurance businesses (76%).
Charities are less likely than businesses to have implemented all of the Cyber Essentials technical controls (29%, versus 51% of businesses). This proportion varies by income, with three-quarters of high-income charities (76% of those with an income of more than £500,000) having done so.
As in previous years, most organisations, particularly smaller ones, may not currently realise they can receive Cyber Essentials certification for the measures they already have in place. As seen in Chapter 3, only a small proportion of organisations are aware of the scheme.
Looking at the figures for all businesses and charities, only four per cent of businesses, and two per cent of charities, have been certified for the Cyber Essentials standards.
Nonetheless, despite low uptake in absolute terms, the proportions of medium and large businesses who recognise that they have achieved the Cyber Essentials standards have risen steadily since 2016 (up from 4% to 13% of medium businesses, and from 10% to 25% of large businesses). Information and communications firms are also more likely to recognise having adopted these standards (10%, versus 4% overall), repeating the same sector-level difference seen in previous years.
10 Steps to Cyber Security
The Government’s 10 Steps to Cyber Security guidance23 sets out a comprehensive risk management regime organisations can follow to improve their cyber security. These steps have been mapped to specific questions in the survey, and these are covered individually across this report. Table 4.2 brings them together, and again shows a situation very similar to the findings from the 2016 and 2017 surveys.
While most organisations have certain technical controls, fewer have taken a more sophisticated approach in terms of senior-level risk management, user education and incident management.
22 In the survey, the answers taken to indicate these controls are: firewalls with appropriate configurations, security controls on company-owned devices, restricting IT admin and access rights to specific users, up-to-date malware protection, and applying software updates when they are available. 23 See https://www.ncsc.gov.uk/guidance/10-steps-cyber-security.
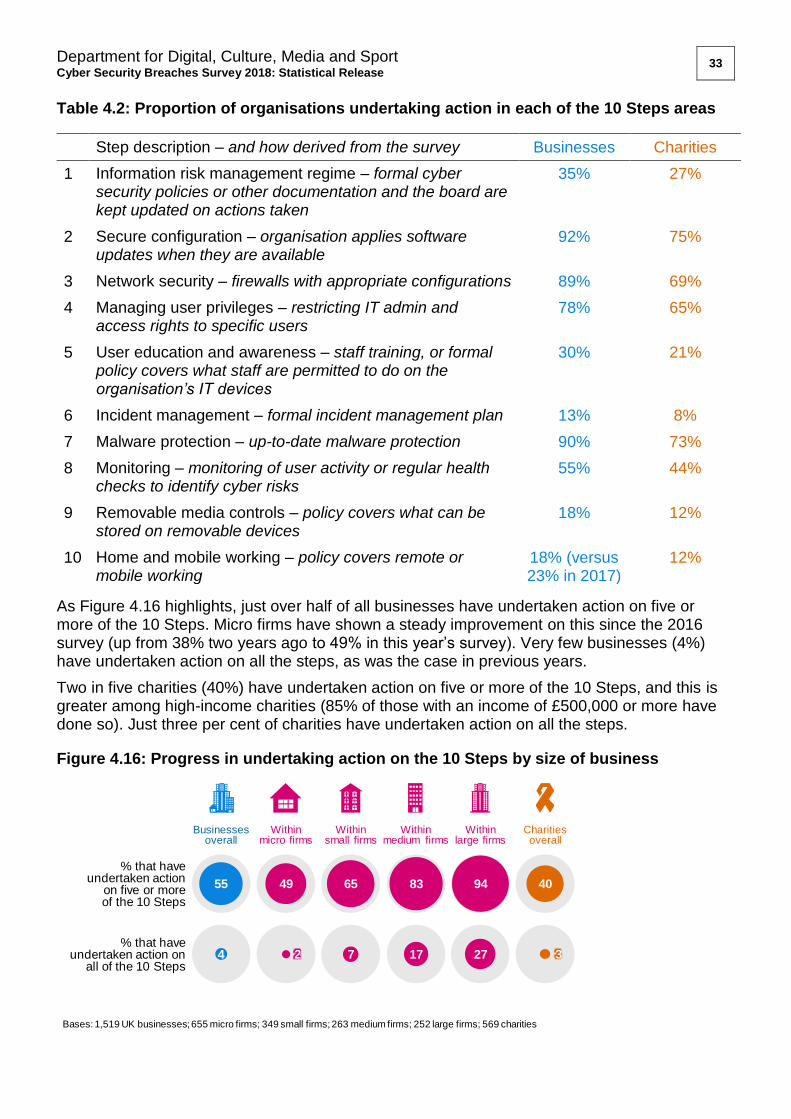
Department for Digital, Culture, Media and Sport 33 Cyber Security Breaches Survey 2018: Statistical Release
Table 4.2: Proportion of organisations undertaking action in each of the 10 Steps areas
Step description – and how derived from the survey Businesses Charities
1 Information risk management regime – formal cyber security policies or other documentation and the board are kept updated on actions taken
35% 27%
2 Secure configuration – organisation applies software updates when they are available
92% 75%
3 Network security – firewalls with appropriate configurations 89% 69%
4 Managing user privileges – restricting IT admin and access rights to specific users
78% 65%
5 User education and awareness – staff training, or formal policy covers what staff are permitted to do on the organisation’s IT devices
30% 21%
6 Incident management – formal incident management plan 13% 8%
7 Malware protection – up-to-date malware protection 90% 73%
8 Monitoring – monitoring of user activity or regular health checks to identify cyber risks
55% 44%
9 Removable media controls – policy covers what can be stored on removable devices
18% 12%
10 Home and mobile working – policy covers remote or mobile working
18% (versus 23% in 2017)
12%
As Figure 4.16 highlights, just over half of all businesses have undertaken action on five or more of the 10 Steps. Micro firms have shown a steady improvement on this since the 2016 survey (up from 38% two years ago to 49% in this year’s survey). Very few businesses (4%) have undertaken action on all the steps, as was the case in previous years.
Two in five charities (40%) have undertaken action on five or more of the 10 Steps, and this is greater among high-income charities (85% of those with an income of £500,000 or more have done so). Just three per cent of charities have undertaken action on all the steps.
Figure 4.16: Progress in undertaking action on the 10 Steps by size of business
Bases: 1,519 UK businesses; 655 micro firms; 349 small firms; 263 medium firms; 252 large firms; 569 charities
% that haveundertaken action on
all of the 10 Steps
% that have undertaken action
on five or more of the 10 Steps
40
27
49 8355
4 7
65
Within large firms
Within medium firms
Within micro firms
Within small firms
Businesses overall
Charities overall
17
94
2 3

Department for Digital, Culture, Media and Sport 34 Cyber Security Breaches Survey 2018: Statistical Release
Finance or insurance firms are most likely to have undertaken action on five or more of the 10 Steps (87%), while those in the food or hospitality sectors (42%) and utilities or production sectors (42%) are least likely to have done so.
Businesses who are aware of the 10 Steps are also more likely to have undertaken five or more of the steps (76%, versus 55% overall). The same is true of charities (55%, versus 40% overall). In particular, those who are aware of the 10 Steps are more likely to have undertaken the less common steps, such as implementing an information risk management regime (undertaken by 65% of businesses aware of the 10 Steps, versus 35% overall).

Department for Digital, Culture, Media and Sport 35 Cyber Security Breaches Survey 2018: Statistical Release
Chapter 5: Incidence and impact of breaches
This chapter provides measures of the nature, level, outcomes and impact of breaches incurred by businesses and charities, including estimates of the total financial cost from breaches. The survey aims to account for all types of breaches that a firm might face (although it can only, of course, measure the breaches that have been identified), and also drills down into cost of the single most disruptive breaches.
It is important to note that the survey specifically covers breaches or attacks, so figures reported here also include cyber security attacks that did not necessarily get past an organisation’s defences (but attempted to do so).
5.1 Experience of breaches or attacks
Types of breaches or attacks experienced
Consistent with last year’s survey24, over four in ten businesses have experienced some kind of cyber security breach in the past 12 months. Two in ten charities have identified such a breach.
As Figure 5.1 highlights, medium and large businesses are most likely to have experienced breaches, as are businesses in the information or communications, and finance or insurance sectors – indeed, the majority of businesses in all these subgroups have identified breaches.
Similarly, size matters among charities, with high-income charities being the most likely to have identified breaches (62% of those with an income of £500,000 or more). Specifically, three-quarters (73%) of those with incomes of £5 million or more have experienced breaches.
Figure 5.1: Proportion of organisations that have identified breaches or attacks in the last 12 months
As might be expected, organisations that are exposed to more risk factors around personal data and use of personal devices are more likely than average to have experienced breaches:
• Businesses that hold customers’ personal data are more likely to have experienced being breached (47%), as are charities that hold such data on beneficiaries or donors (30%).
• Businesses that have staff using personal devices for work (BYOD) are more likely than average to report breaches (49%).
24 Direct comparisons to the 2016 survey are not possible across many questions in this chapter, given changes made in the 2017 survey to the question asking what breaches businesses had experienced. Such comparisons to the 2016 survey have been limited to the overall cost of breaches.
Bases: 1,519 UK businesses; 655 micro firms; 349 small firms; 263 medium firms; 252 large firms;
105 finance or insurance firms; 99 information or communications firms; 569 charities
Within large firms
Within medium
firms
Within micro firms
Within small firms
Businesses overall
Charities overall
% experiencing a cyber security breach or attack in last 12 months
194043 47 64 72 5957
Withinfinance/
insurance
Withininfo/comms

Department for Digital, Culture, Media and Sport 36 Cyber Security Breaches Survey 2018: Statistical Release
Separately, businesses that use cloud computing are also more likely to have faced breaches than those that do not (52%, versus 43% overall), as are charities (28%, versus 20% overall). Use of cloud computing should not (necessarily) be seen as a risk factor, and the survey does not determine whether the breaches that users of cloud computing do incur are related to their use of cloud computing.
Even among the businesses that say cyber security is a low priority for senior management, a significant proportion have still experienced breaches (31% have done so), which is similar to the 2017 survey findings.
Types of breaches or attacks experienced
Figure 5.2 shows that the types of breaches that businesses and charities face are very similar. The most commonly reported breaches are examples of cyber-related fraud – fraudulent emails or websites directed at staff were the most frequent, followed by people impersonating the organisation in emails or online. As per last year, breaches that rely on technical factors beyond the reach of non-specialist staff, such as denial-of-service attacks (attacks that attempt to take down an organisation’s website) are relatively less common – this highlights that the engagement of non-specialist staff is important, as they are more typically the ones targeted by cyber attacks.
Compared to the 2017 survey, there has been a fall in the proportion of businesses reporting viruses, spyware or malware (outside of ransomware, which is asked about separately), and a slight increase in the proportion identifying unauthorised external access to their devices or networks (i.e. hacking activity).
Figure 5.2: Types of breaches or attacks suffered among the organisations that have identified breaches
Among those organisations that have experienced breaches in the past 12 months, fraudulent emails or websites directed at staff are most commonly picked out as the single most disruptive breaches that organisations face. This is in line with the business findings from the 2017 survey.
The full breakdown of breaches considered to be the most disruptive is shown in Figure 5.3.
Bases: 778 businesses that identified a breach or attack in the last 12 months; 218 charities
Q. Have any of the following happened to your organisation in the last 12 months?
75%
28%
24%
15%
15%
12%
8%
7%
5%
74%
27%
24%
10%
7%
13%
3%
6%
6%
Fraudulent emails or being directed to fraudulent websites
Viruses, spyware or malware
Others impersonating organisation in emails or online
Ransomware
Unauthorised use of computers, networks or servers by outsiders
Hacking or attempted hacking of online bank accounts
Denial-of-service attacks
Unauthorised use of computers, networks or servers by staff
Any other breaches or attacks
Businesses Charities
5
9

Department for Digital, Culture, Media and Sport 37 Cyber Security Breaches Survey 2018: Statistical Release
Figure 5.3: The single most disruptive breach suffered among the organisations that have identified breaches
Extent of breaches experienced
Most businesses (58%) and charities (66%) that identify breaches have experienced them less than once a month, as Figure 5.4 demonstrates. Nonetheless, this still leaves substantive proportions that experience breaches at least once a month (40% of businesses and 33% of charities). Moreover, among businesses, the proportion of one-off occurrences has dropped since the 2017 survey (from 37% to 30%). This could be because organisations are facing attacks more often, or are getting better at identifying attacks (or a mixture of the two).
Among large businesses that have identified breaches, just under half (46%) experience breaches at least once a month, and one in ten (9%) report being attacked several times a day.
Figure 5.4: Frequency of breaches or attacks experienced in the last 12 months
Bases: 778 businesses that identified a breach or attack in the last 12 months; 218 charities
Q. What was the one cyber security breach, or related series of breaches or attacks,
that caused the most disruption to your organisation in the last 12 months?
48%
13%
10%
7%
6%
4%
3%
1%
4%
48%
12%
12%
6%
11%
11%
2%
1%
1%
Fraudulent emails or being directed to fraudulent websites
Viruses, spyware or malware
Others impersonating organisation in emails or online
Ransomware
Unauthorised use of computers, networks or servers by outsiders
Hacking or attempted hacking of online bank accounts
Denial-of-service attacks
Unauthorised use of computers, networks or servers by staff
Any other breaches or attacks
Businesses Charities
Bases: 778 businesses that identified a breach or attack in the last 12 months; 218 charities
Q. Approximately how often in the last 12 months did you experience cyber security
breaches or attacks?
% only once % less than once a month % once a month % once a week
30
36
28
30
17
14
10
13
5
2
9
5
% once a day % several times a day % don’t know
Businesses
Charities
1%

Department for Digital, Culture, Media and Sport 38 Cyber Security Breaches Survey 2018: Statistical Release
Table 5.1 shows that the mean number25 of breaches or attacks is substantially higher than the median number, in line with the 2017 survey findings. What this indicates is that the typical business or charity is likely to only experience a handful of breaches in the space of a year, but that a minority experience hundreds of breaches or attacks in this timeframe – particularly the larger organisations.
Table 5.1: Average number of breaches or attacks among those that identified any breaches in last 12 months
All
businesses Micro/small
businesses26 Medium
businesses Large
businesses All charities
Mean number 886 868 47 6490 288
Median number 4 4 6 12 2
Base 742 406 168 168 210
5.2 How are businesses affected?
Outcomes of breaches
Not all breaches or attacks lead to a negative consequence in terms of a loss of finances or data, which attests to the preventative measures that many organisations have in place. Nonetheless, as Figure 5.5 illustrates, a sizeable proportion of the breaches that businesses (37%) and charities (40%) identify do have such outcomes. Temporary loss of access to files or networks is the most commonly reported outcome. The outcomes for businesses are consistent with the 2017 survey findings.
Having software or systems damaged or corrupted is more commonly mentioned by medium size businesses that have faced breaches (23%, versus 15% overall).
Among businesses, the outcome is strongly linked to the type of breach incurred. Businesses suffering ransomware attacks are far more likely to report temporary loss of files or networks (72%, versus 22% overall), corrupted or damaged software or systems (53% versus 15%), loss of access to third-party services (25% versus 8%), and permanent loss of files (24% versus 6%). Businesses facing unauthorised use of devices or networks by people outside the business are more likely to mention that money was stolen (15%, versus 6% overall).
25 Figures in all the tables in this chapter are presented to three significant figures, or to the nearest whole number (if under 100). It should be noted that the mean results here are driven up by a very small number of respondents across all size bands reporting an extremely high number of breaches in the past year (in the thousands). The median figures are therefore also shown to give a better sense of what the typical business is likely to face. 26 Across this chapter, micro and small firms have been merged to make the analysis more statistically robust.

Department for Digital, Culture, Media and Sport 39 Cyber Security Breaches Survey 2018: Statistical Release
Figure 5.5: Outcome of breaches among organisations that identified any breaches or attacks in the last 12 months
Nature of the impact
Even breaches that do not result in negative financial consequences or data loss can still have an impact on organisations. Of all the ones that experienced breaches, over half (53%) of the businesses and six in ten (59%) of the charities report being impacted by the breach in one of the ways noted in Figure 5.6.
The most common consequence of a breach is for organisations to take up new measures to prevent or protect against future breaches or attacks – over a third of both businesses and charities report doing so. Around a third also report needing additional staff time to deal with the breach or attack.
Information and communications sector firms that have been breached are more likely to mention extra staff time (49%, versus 32% overall) as well as reputational damage (15%, versus 3% overall) as impacts on their business.
37%
22%
15%
10%
8%
6%
6%
2%
2%
40%
25%
14%
14%
4%
2%
3%
1%
2%
Bases: 778 businesses that identified a breach or attack in the last 12 months; 218 charities
Q. Thinking of all the cyber security breaches or attacks experienced in the last 12
months, which, if any, of the following happened as a result?
Any listed outcome
Temporary loss of access to files or networks
Software or systems corrupted or damaged
Website or online services taken down or slowed
Lost access to relied-on third-party services
Permanent loss of files (not personal data)
Money stolen
Personal data altered, destroyed or taken
Lost or stolen assets, trade secrets or intellectual property
Businesses Charities

Department for Digital, Culture, Media and Sport 40 Cyber Security Breaches Survey 2018: Statistical Release
Figure 5.6: Impacts of breaches among organisations that identified any breaches or attacks in the last 12 months
Time taken to recover from breaches
Focusing on the single most disruptive attack faced by organisations in the past year, around two-thirds of businesses and just over half of all charities say it took no time at all to recover, which Figure 5.7 shows. The business figures are again in line with the 2017 survey.
This did not differ discernibly by the size of the business or charity.
53%
36%
32%
27%
20%
6%
5%
4%
4%
3%
2%
1%
59%
38%
36%
24%
10%
5%
3%
1%
Under 1%
4%
0%
0%
Bases: 778 businesses that identified a breach or attack in the last 12 months; 218 charities
Q. Have the breaches or attacks experienced in the last 12 months impacted your
organisation in any of the following ways, or not?
Any listed impact
New measures needed for future attacks
Added staff time to deal with breach or inform others
Stopped staff carrying out daily work
Other repair or recovery costs
Prevented provision of goods and services
Complaints from customers
Discouraged from carrying out intended future business activity
Reputational damage
Loss of revenue or share value
Goodwill compensation to customers
Fines or legal costs
Businesses Charities
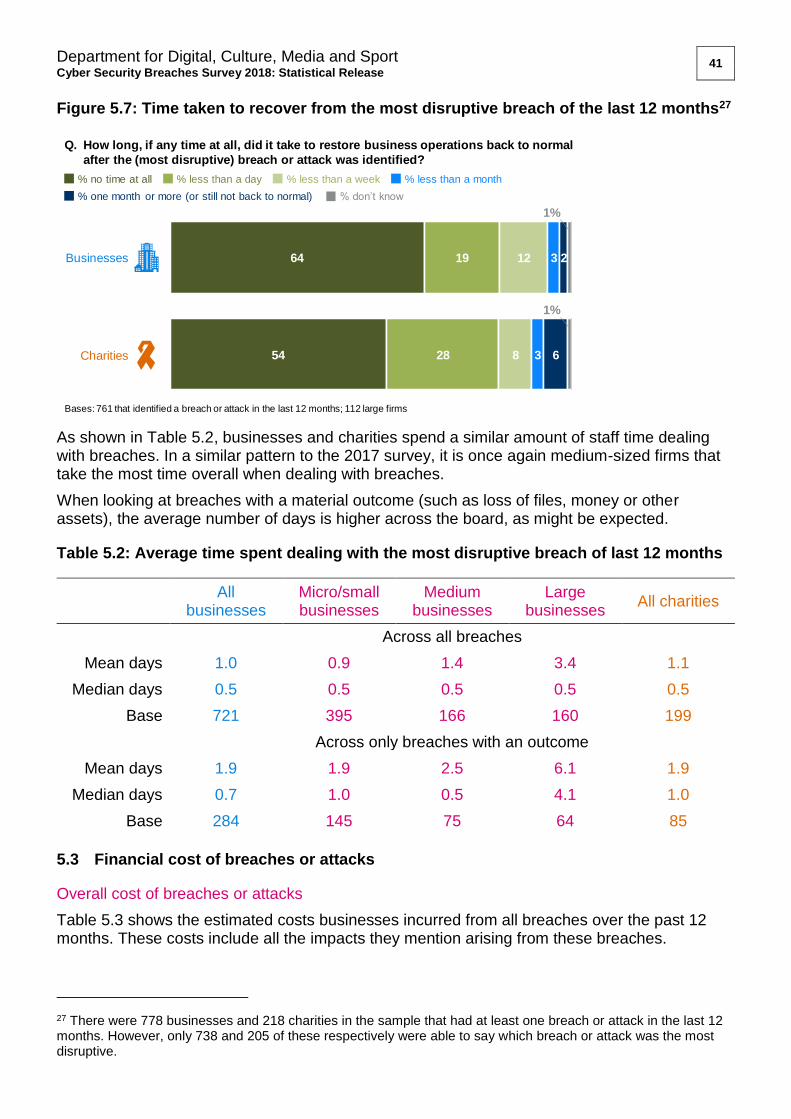
Department for Digital, Culture, Media and Sport 41 Cyber Security Breaches Survey 2018: Statistical Release
Figure 5.7: Time taken to recover from the most disruptive breach of the last 12 months27
As shown in Table 5.2, businesses and charities spend a similar amount of staff time dealing with breaches. In a similar pattern to the 2017 survey, it is once again medium-sized firms that take the most time overall when dealing with breaches.
When looking at breaches with a material outcome (such as loss of files, money or other assets), the average number of days is higher across the board, as might be expected.
Table 5.2: Average time spent dealing with the most disruptive breach of last 12 months
All
businesses Micro/small businesses
Medium businesses
Large businesses
All charities
Across all breaches
Mean days 1.0 0.9 1.4 3.4 1.1
Median days 0.5 0.5 0.5 0.5 0.5
Base 721 395 166 160 199
Across only breaches with an outcome
Mean days 1.9 1.9 2.5 6.1 1.9
Median days 0.7 1.0 0.5 4.1 1.0
Base 284 145 75 64 85
5.3 Financial cost of breaches or attacks
Overall cost of breaches or attacks
Table 5.3 shows the estimated costs businesses incurred from all breaches over the past 12 months. These costs include all the impacts they mention arising from these breaches.
27 There were 778 businesses and 218 charities in the sample that had at least one breach or attack in the last 12 months. However, only 738 and 205 of these respectively were able to say which breach or attack was the most disruptive.
Bases: 761 that identified a breach or attack in the last 12 months; 112 large firms
Q. How long, if any time at all, did it take to restore business operations back to normal
after the (most disruptive) breach or attack was identified?
% no time at all % less than a day % less than a week % less than a month
64
54
19
28
12
8
3
3
2
6
% one month or more (or still not back to normal) % don’t know
Businesses
Charities
1%
1%

Department for Digital, Culture, Media and Sport 42 Cyber Security Breaches Survey 2018: Statistical Release
The median cost is £0 across businesses and charities, which implies that, typically, organisations incur no specific financial cost from cyber security breaches. This is reflective of the fact that most breaches or attacks do not have any material outcome (a loss of assets or data), so do not always need a response. When filtering down only to breaches with such a material outcome, median costs are much higher, particularly for large businesses.
Moreover, in both cases the mean cost estimates are much higher, especially among medium and large businesses, which suggests there are a small number of businesses and charities that do face significant financial costs.
Looking back to the 2016 survey, there is a trend over time of a falling total cost for businesses. However, bucking this trend considerably, the estimated total cost of breaches has consistently increased for medium businesses specifically (from £1,860 in the 2016 survey and £3,070 in the 2017 survey, to £8,180 in this latest survey).28
Table 5.3: Average cost of all breaches or attacks identified in the last 12 months
All
businesses Micro/small businesses
Medium businesses
Large businesses
All charities
Across all breaches
Mean cost £1,230 £894 £8,180 £9,260 £484
Median cost £0 £0 £0 £0 £0
Base 725 408 161 156 203
Across only breaches with an outcome
Mean cost £3,100 £2,310 £16,100 £22,300 £1,030
Median cost £500 £500 £1,940 £8,830 £178
Base 277 147 74 56 80
Costs associated with the most disruptive breaches
Tables 5.4 to 5.7 show cost estimates for the single most disruptive breach in the last 12 months. Again, these are presented for all breaches, as well as those with an actual outcome.
As can be seen across these tables, direct cost and recovery cost estimates tend to be higher for medium and large businesses, whereas long-term cost estimates (for costs to date and expected future costs) tend to be a bigger consideration for large businesses specifically. It also appears that charities have on the whole faced less financially costly breaches (in terms of their most disruptive breach) than businesses.
While these direct, recovery and long-term cost estimates have shifted since the 2017 survey, there is no discernible pattern or direction of travel to be noted between the 2016 and 2018 results.
28 While this section of the report comments on the direction of travel of cost estimates over time, these differences have not been found to be statistically significant at the 95% level of confidence after factoring in inflation, which reflects the relatively small sample sizes of the survey, and the high variance in the sampled cost estimates. However, it is worth noting that the specific difference for medium firms is statistically significant at the 90% level of confidence, even when factoring in inflation. Inflation is assumed to be 2.8% since the 2017 survey and 4.0% since the 2016 survey, based on ONS data (see https://www.ons.gov.uk/economy/inflationandpriceindices).

Department for Digital, Culture, Media and Sport 43 Cyber Security Breaches Survey 2018: Statistical Release
Direct costs include: costs from staff being prevented from carrying out their work; lost, damaged or stolen outputs, data, or assets; and lost revenue if customers could not access online services.
Table 5.4: Average direct cost of the most disruptive breach from the last 12 months
All
businesses Micro/small businesses
Medium businesses
Large businesses
All charities
Across all breaches
Mean cost £695 £448 £5,420 £8,200 £285
Median cost £0 £0 £0 £0 £0
Base 702 395 153 154 194
Across only breaches with an outcome
Mean cost £1,790 £1,190 £12,100 £15,300 £678
Median cost £100 £100 £0 £2,710 £0
Base 272 145 68 59 80
Recovery costs include: additional staff time needed to deal with the breach or to inform customers or stakeholders; costs to repair equipment or infrastructure; and any other associated repair costs.
Table 5.5: Average recovery cost of the most disruptive breach from the last 12 months
All
businesses Micro/small businesses
Medium businesses
Large businesses
All charities
Across all breaches
Mean cost £342 £299 £1,280 £1,150 £180
Median cost £0 £0 £0 £0 £0
Base 703 395 154 154 196
Across only breaches with an outcome
Mean cost £842 £736 £2,810 £2,500 £297
Median cost £0 £0 £0 £954 £0
Base 272 145 68 59 82

Department for Digital, Culture, Media and Sport 44 Cyber Security Breaches Survey 2018: Statistical Release
As defined in the survey, the long-term cost of breaches includes: the loss of share value; loss of investors or funding; long-term loss of customers; costs from handling customer complaints; and any compensation, fines or legal costs.
Table 5.6: Average estimated long-term cost of the most disruptive breach from the last 12 months
All
businesses Micro/small businesses
Medium businesses
Large businesses
All charities
Across all breaches
Mean cost £384 £371 £390 £1,890 £33
Median cost £0 £0 £0 £0 £0
Base 699 395 153 151 196
Across only breaches with an outcome
Mean cost £891 £862 £890 £3,940 £59
Median cost £0 £0 £0 £0 £0
Base 271 145 67 59 82

Department for Digital, Culture, Media and Sport 45 Cyber Security Breaches Survey 2018: Statistical Release
Chapter 6: Dealing with breaches
This chapter explores how well businesses and charities deal with breaches, including identification, response, reporting and adaptation to prevent future breaches.
In the survey, questions on this topic were generally framed in terms of the most disruptive breach an organisation had faced in the last 12 months. Sector and regional subgroup analysis has not been undertaken on these questions due to the relatively small sample size of organisations that have experienced breaches.
6.1 Identifying and understanding breaches
How and when were breaches identified?
The vast majority of organisations report identifying their most disruptive breach very quickly. Figure 6.1 shows that around nine in ten businesses (89%, in line with the 2017 survey29) and charities (93%) identified these breaches within a day. These findings are consistent across size and income bands.
Figure 6.1: Time taken to identify the most disruptive breach of the last 12 months
The findings highlight the importance of staff vigilance. Just as in 2017, the most disruptive breach was most commonly spotted by individuals rather than picked up automatically by software. In around three-fifths of the businesses (57%) and the charities (62%) experiencing breaches, the most disruptive breach was reported directly by staff, contractors or volunteers. In seven per cent of these businesses and eight per cent of charities found to be breached, the most disruptive breach was uncovered through individuals highlighting unusual emails or file activity. Relatively few businesses (12%) and charities (5%) report identifying their most disruptive breach via antivirus or anti-malware software.
Having a specific individual in an organisation whose job role includes cyber security is also linked to a faster response (93% of businesses employing someone in this role identified their breaches within 24 hours, versus 89% of businesses overall).
29 As in Chapter 5, direct comparisons to the 2016 survey are not possible across this chapter, given changes made in the 2017 survey to the question asking what breaches businesses had experienced.
Bases: 738 businesses that identified a breach or attack in the last 12 months; 205 charities
Q. How long was it, if any time at all, between this breach or attack occurring and it
being identified as a breach?
7
22
67
% immediately
% within 24 hours
% within a week
% longer than a week (2% for businesses and 2% for charities)
% don’t know (2% for businesses and 2% for charities)
4
34
59
Businesses Charities

Department for Digital, Culture, Media and Sport 46 Cyber Security Breaches Survey 2018: Statistical Release
It is also noteworthy that not all of the most disruptive breaches were identified internally. In six per cent of the businesses experiencing breaches, they were notified of their most disruptive breach by their customers – in some cases through customer complaints. This was much lower (2%) for the charities experiencing breaches.
How well do businesses understand their breaches?
Among those experiencing breaches, a sizeable minority of businesses (44%) and charities (36%) are not aware of the factors that led to their most disruptive breach. Figure 6.2 indicates that this is more often the case in smaller businesses, but that even a quarter of large businesses cannot pinpoint what caused their most disruptive breach. Similarly, the low-income and middle-income charities are less likely to comprehend these factors than high-income charities (38% of those with incomes under £500,00030 cannot identify specific factors, versus 29% of those with incomes of £500,000 or more).
The source of the breach is typically a much greater unknown. Two-thirds of businesses (65%) and a majority of charities (56%) experiencing breaches do not know where their most disruptive breaches originally came from.
Figure 6.2: Organisations’ understanding of the factors and sources behind their most disruptive breaches of the last 12 months
Among the most frequently mentioned contributing factors are external attacks that were not specifically targeted at any particular organisation (mentioned by 14% of the businesses and 14% of the charities experiencing breaches), human error (7% of businesses and 8% of charities) and staff lacking awareness (7% of businesses and 2% of charities). This again shows the importance of staff awareness-raising and training.
At the same time, having basic technical controls is becoming increasingly important. Compared to the 2017 survey, more of the businesses experiencing breaches this year say that their most disruptive breach was caused by unsecure software or browser settings (6%, versus 2% in the 2017 survey) or through exploitation of publicly available details or domain names (4%, versus 1% in the 2017 survey).
The top response also highlights how every organisation can be subjected to cyber attacks, given that many attacks are not targeted. However, the qualitative survey findings suggest that
30 The low-income (£0 to under £100,000) and middle-income (£100,000 to under £500,000) bands have been combined in this chapter, due to sample sizes being too to analyse them separately.
Bases: 738 businesses that identified a breach or attack in the last 12 months; 247 micro firms; 155 small firms;
168 medium firms; 168 large firms; 205 charities
% that don’t know the source of the
most disruptive breach or attack
% that don’t know what factors led to
the most disruptive breach or attack
56
36
5265
47 3344
65 65
39
Within large firms
Within medium firms
Within micro firms
Within small firms
Businesses overall
Charities overall
57
26

Department for Digital, Culture, Media and Sport 47 Cyber Security Breaches Survey 2018: Statistical Release
smaller organisations in particular still consider cyber security to be less important, because they believe hackers or criminals would target them less than bigger organisations or online organisations.
“The worst that could happen is that someone could hack in and stop your computers working, but because of where we are and what we are I would imagine we are probably not even on anybody's map as far as that's concerned.”
Middle-income charity
The most commonly suspected source of the most disruptive breach is email attachments (mentioned by 21% of the businesses and 18% of the charities experiencing breaches), not linked back to a specific actor. Notably, organised crime is less often mentioned by businesses than in the 2017 survey (down from 7% to 1%), but this is higher for charities (6%). Charities are also more likely than businesses to say non-professional hackers were responsible for their most disruptive breach (6%, versus 2% of businesses). This underlines the wide range of actors putting charities, in particular, at risk of cyber security breaches.
Accidental versus intentional breaches
Businesses were more likely to face intentional breaches than in the 2017 survey (74% of businesses say their most disruptive breach was intentional rather than accidental, compared to 66% in the 2017 survey). A similar proportion of charities (72%) say their most disruptive breach was intentional. As before, smaller organisations were just as likely as large organisations to face intentional breaches in this regard.
6.2 Responding to breaches
Were there response plans in place?
Around half of the businesses (52%) and charities (53%) identifying breaches had contingency plans in place to deal with their most disruptive breach. In the overwhelming majority of cases, these contingency plans were considered effective (94% of the businesses and 90% of the charities that had contingency plans say they were effective), highlighting the value of forward planning.
Despite this, very few businesses (13%) and charities (8%) overall have a formal cyber security incident management process in place. As Figure 6.3 illustrates, this is far more common among large businesses. Similarly, it is more prevalent than average among high-income charities (32% among those with an income of £500,000 or more), and among the industry sectors that are more likely to prioritise cyber security, such as finance or insurance businesses (29%), health, social care or social work businesses (25%), and information or communications firms (23%) – but it is still not the norm in any of these types of organisations.

Department for Digital, Culture, Media and Sport 48 Cyber Security Breaches Survey 2018: Statistical Release
Figure 6.3: Whether organisations have incident management processes and contingency plans
The fact that charities are less likely than businesses to have incident management processes is consistent with them being more generally less likely to document their approaches to cyber security via policies, risk registers, internal audits or business continuity plans (as covered in Chapter 4).
6.3 Reporting breaches
In the vast majority of businesses experiencing breaches (93%), the directors or senior management were informed of the most disruptive breach, and this is consistent with the 2017 survey. This is also the case in most charities experiencing breaches (68%), though to a much lesser degree than in businesses. These findings are consistent across size and income bands.
As was found in both previous surveys, external reporting of breaches is much rarer (41% of the businesses and just 27% of the charities experiencing breaches reported their most disruptive breach to anyone outside of their organisation).
Micro (41%), small (43%) and medium (40%) businesses were each more likely than large businesses (30%) to report these breaches externally. However, this difference is largely due to reporting to outsourced providers. It disappears when excluding organisations that only reported their most disruptive breach to their outsourced cyber security provider (i.e. not to any external authority, or to stakeholders).
Three in ten (29%) of the businesses and two in ten (21%) of the charities experiencing breaches reported their most disruptive breach to anyone other than an outsourced provider. Figure 6.4 shows how this breaks down across businesses (there are too few charities in the sample to break down at this question). The proportion of these businesses reporting to an internet service provider has increased since the 2017 survey (from 9% to 20%).
Bases: 1,519 UK businesses (*738 that identified a breach or attack in the last 12 months); 655 micro firms (*247); 349
small firms (*155); 263 medium firms (*168); 252 large firms (*168); 569 charities (*205)
% where there was an effective contingency plan to deal with the
most disruptive breach or attack*
% with a formal cyber security incident
management process
48
8
6544
9 3013
49 56
18
Within large firms
Within medium firms
Within micro firms
Within small firms
Businesses overall
Charities overall
65
46
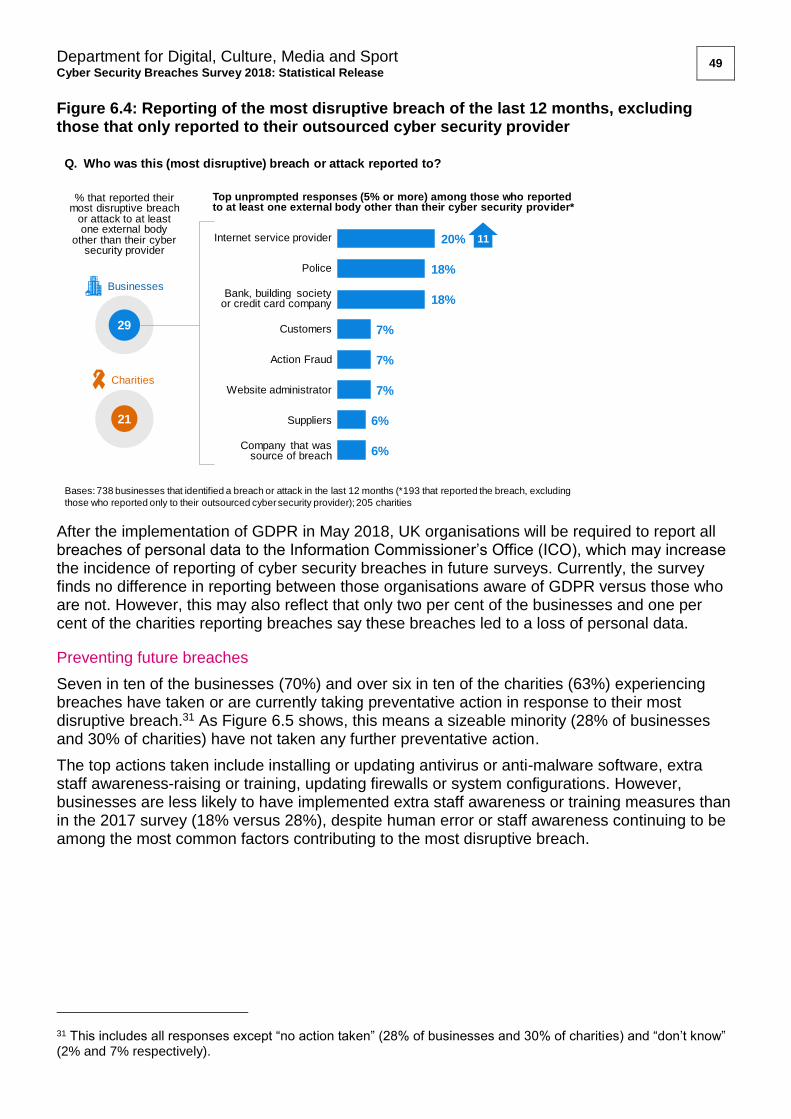
Department for Digital, Culture, Media and Sport 49 Cyber Security Breaches Survey 2018: Statistical Release
Figure 6.4: Reporting of the most disruptive breach of the last 12 months, excluding those that only reported to their outsourced cyber security provider
After the implementation of GDPR in May 2018, UK organisations will be required to report all breaches of personal data to the Information Commissioner’s Office (ICO), which may increase the incidence of reporting of cyber security breaches in future surveys. Currently, the survey finds no difference in reporting between those organisations aware of GDPR versus those who are not. However, this may also reflect that only two per cent of the businesses and one per cent of the charities reporting breaches say these breaches led to a loss of personal data.
Preventing future breaches
Seven in ten of the businesses (70%) and over six in ten of the charities (63%) experiencing breaches have taken or are currently taking preventative action in response to their most disruptive breach.31 As Figure 6.5 shows, this means a sizeable minority (28% of businesses and 30% of charities) have not taken any further preventative action.
The top actions taken include installing or updating antivirus or anti-malware software, extra staff awareness-raising or training, updating firewalls or system configurations. However, businesses are less likely to have implemented extra staff awareness or training measures than in the 2017 survey (18% versus 28%), despite human error or staff awareness continuing to be among the most common factors contributing to the most disruptive breach.
31 This includes all responses except “no action taken” (28% of businesses and 30% of charities) and “don’t know” (2% and 7% respectively).
Bases: 738 businesses that identified a breach or attack in the last 12 months (*193 that reported the breach, excluding
those who reported only to their outsourced cyber security provider); 205 charities
Q. Who was this (most disruptive) breach or attack reported to?
% that reported their most disruptive breach
or attack to at least one external body
other than their cyber security provider
Top unprompted responses (5% or more) among those who reported to at least one external body other than their cyber security provider*
Bank, building society or credit card company
Police
Suppliers
Internet service provider
Customers
Company that was source of breach
Action Fraud
Website administrator
20%
18%
18%
7%
7%
7%
6%
6%
29
Businesses
Charities
21
11

Department for Digital, Culture, Media and Sport 50 Cyber Security Breaches Survey 2018: Statistical Release
Figure 6.5: Most common actions following the most disruptive breach of the last 12 months
Medium and large businesses are more likely to have implemented any preventative measures following their most disruptive breach (78% of medium businesses and 82% of large businesses experiencing breaches have or are taking preventative action, versus 70% overall), as are high-income charities (85% of charities with an income of £500,000 or more, versus a 63% average). This is particularly true in terms of further action to raise staff awareness (35% of medium businesses, 40% of large businesses and 35% of high-income charities have done this).
As may be expected, the picture in Figure 6.5 changes slightly when looking only at organisations whose most disruptive breach resulted in a material outcome (e.g. the loss of files, money or other assets). The most common responses remain largely the same, but it is worth noting that even less emphasis is placed on additional staff awareness-raising or training in these cases – this is shown in Figure 6.6.
Figure 6.6: Most common actions following the most disruptive breach of the last 12 months, where breaches had material outcomes
Both businesses and charities are more likely to take any remedial action when breaches have outcomes, with just one in ten (10%) of these businesses and around one in eight (12%) of
Bases: 738 businesses that identified a breach or attack in the last 12 months; 205 charities
Q. What, if anything, have you done since this (most disruptive) breach or attack to
prevent or protect your organisation from further breaches like this?
Top unprompted responses (5% or more)
Businesses Charities
22%
18%
15%
9%
5%
28%
19%
13%
7%
15%
2%
30%
Additional staff training or communications
Installed, changed or updated antivirus or anti-malware software
Changed or updated firewall or system configurations
Created or changed policies and procedures
Hired an outsourced cyber security provider
No action taken
10
Bases: 287 businesses that identified a breach or attack with an outcome in the last 12 months; 87 charities
Q. What, if anything, have you done since this (most disruptive) breach or attack to
prevent or protect your organisation from further breaches like this?
Businesses where breaches had outcomes Charities
Top unprompted responses (5% or more)
29%
14%
23%
16%
11%
10%
31%
10%
8%
15%
3%
12%
Additional staff training or communications
Installed, changed or updated antivirus or anti-malware software
Changed or updated firewall or system configurations
Created or changed policies and procedures
Hired an outsourced cyber security provider
No action taken
19

Department for Digital, Culture, Media and Sport 51 Cyber Security Breaches Survey 2018: Statistical Release
these charities taking no action. This again reflects the qualitative survey findings that suffering a material breach is often what it takes to spur organisations into changing their behaviour.

Department for Digital, Culture, Media and Sport 52 Cyber Security Breaches Survey 2018: Statistical Release
Chapter 7: Conclusions
The Cyber Security Breaches Survey 2018 raises important points for businesses, charities and the Government to consider:
• Cyber security is a high priority for most businesses and charities. Among businesses, there are also indications that senior managers are more regularly engaged with the topic than in the 2017 survey. At the same time, there is still a lot that organisations can do better. Just five in ten businesses (51%) and three in ten charities (29%) have implemented all of the five basic technical controls under Cyber Essentials, comprising: boundary firewalls and internet gateways, secure configurations, user access controls, malware protection, and patch management (applying software updates).
• Businesses and charities need to consider their organisational cultures. Some organisations continue to see themselves as offline, or too small to be at risk (although this line of thought has declined since the 2017 survey). This is despite having potential risk factors such as their use of personal devices for work purposes. The qualitative survey suggests that organisations take more action on cyber security when they see it as complementing their organisational priorities, rather than competing with them. They take less action when they think it will be a burden to implement cyber security controls, or when they have a fatalistic attitude towards cyber security.
• Increased support from senior managers can empower those in charge of cyber security. Despite this management boards for two in ten businesses (20%) and four in ten charities (38%) have never discussed cyber security, and only a minority of organisations (30% of businesses and 24% of charities) have board members or trustees specifically overseeing cyber security. The upcoming implementation of GDPR may be an opportunity for senior managers to address cyber security.
• Awareness raising and engagement among wider staff is also important. As in 2017, the most disruptive breaches are most commonly spotted by individual staff members rather than picked up automatically by anti-malware programmes. Organisations in the qualitative survey also noted the importance of regular and targeted training for all staff. However, in reality staff training remains rare; just two in ten businesses (20%) and even fewer charities (15%) have had staff undertake any form of cyber security training in the past year. Furthermore, businesses in this latest survey are less likely to have responded to breaches with additional staff training than in 2017.
• Information, advice and guidance needs to be highly tailored. The qualitative survey shows that businesses want advice that is directed at businesses like theirs. Charities want advice that is labelled for charities. A large number of organisations do not have specialist staff to improve their cyber security, so need to have information simplified and in plain English. Others are much more sophisticated, and want updates on the latest threats.
• Charities must consider additional risks, in terms of how they deal with volunteers and donors, and because they tend to have more staff using personal devices for work. Around three in ten allow people to donate online (31%) or let beneficiaries access their services online (27%). Despite this, charities are typically behind businesses when it comes to seeking information, advice or guidance, training staff and having written policies. It is true that charities are less likely than businesses to report breaches or attacks, but this may equally be because they are less likely to have identified any such attacks. Where charities do report breaches resulting in lost assets or data, these have significant financial consequences, just as for businesses.
Department for Digital, Culture, Media and Sport 53 Cyber Security Breaches Survey 2018: Statistical Release
Annex A: Further information
1. The Department for Digital, Culture, Media and Sport would like to thank the following people for their work in the development and carrying out of the survey and for their work compiling this report.
• Kelly Finnerty, Ipsos MORI Social Research Institute • Helen Motha, Ipsos MORI Social Research Institute • Jayesh Navin Shah, Ipsos MORI Social Research Institute • Yasmin White, Ipsos MORI Social Research Institute • Professor Mark Button, Institute for Criminal Justice Studies, University of Portsmouth • Dr Victoria Wang, Institute for Criminal Justice Studies, University of Portsmouth
2. The next update to these statistics is expected to be the results of the next Cyber Security Breaches Survey. This iteration of the survey is expected to be carried out between autumn 2018 and winter 2018-19, with the results then being published later in 2019.
3. The Cyber Security Breaches Survey was first published in 2016 as a research report, and became an Official Statistic in 2017. The 2017 full report can be found at https://www.gov.uk/government/collections/cyber-security-breaches-survey. The 2017 statistical release includes the full report, infographics and the technical and methodological information.
4. The responsible DCMS statistician for this release is Rishi Vaidya. For enquiries on this release, please contact Rishi on 0207 211 2320 or [email protected].
5. For general enquiries contact:
Department for Digital, Culture, Media and Sport 100 Parliament Street London SW1A 2BQ
Telephone: 020 7211 6000
6. DCMS statisticians can be followed on Twitter via @DCMSInsight.
7. The Cyber Security Breaches Survey is an Official Statistics publication and has been produced to the standards set out in the Code of Practice for Official Statistics. For more information, see https://www.statisticsauthority.gov.uk/code-of-practice/. Details of the pre-release access arrangements for this dataset have been published alongside this release.

Department for Digital, Culture, Media and Sport 54 Cyber Security Breaches Survey 2018: Statistical Release
Annex B: Guide to statistical reliability
The final data from the survey are based on weighted samples, rather than the entire population of UK businesses or charities. Percentage results are therefore subject to margins of error, which vary with the size of the sample and the percentage figure concerned.
For example, for a question where 50% of the 1,519 businesses sampled in the survey give a particular answer, the chances are 95 in 100 that this result would not vary more or less than 3.7 percentage points from the true figure – the figure that would have been obtained had the entire UK business population responded to the survey. The margins of error that are assumed to apply in this report are given in the following table.32
Margins of error (in percentage points) applicable to percentages at or near these levels
10% or 90% 30% or 70% 50%
1,519 businesses ±1.9 ±2.9 ±3.2
655 micro firms ±2.4 ±3.7 ±4.1
349 small firms ±3.4 ±5.2 ±5.7
263 medium firms ±3.9 ±6.0 ±6.6
252 large firms ±4.0 ±6.1 ±6.7
569 charities ±3.4 ±5.2 ±5.7
There are also margins of error when looking at subgroup differences. A difference from the average must be of at least a certain size to be statistically significant. The following table is a guide to these margins of error.
Differences required (in percentage points) from overall result for significance at or near these percentage levels
10% or 90% 30% or 70% 50%
655 micro firms ±1.5 ±2.3 ±2.5
349 small firms ±2.9 ±4.4 ±4.5
263 medium firms ±3.5 ±5.3 ±5.8
252 large firms ±3.5 ±5.3 ±5.9
Low-income charities ±2.6 ±3.9 ±4.2
Middle-income charities ±3.8 ±5.7 ±6.2
High-income charities ±2.7 ±4.2 ±4.5
32 In calculating these margins of error, the design effect of the weighting has been taken into account. The overall effective base size was 931 for businesses (versus 706 in 2017) and 295 for charities.

Department for Digital, Culture, Media and Sport 55 Cyber Security Breaches Survey 2018: Statistical Release

4th Floor 100 Parliament Street London SW1A 2BQ
© Crown copyright 2018
You may re-use this information (not including logos) free of charge in any format or medium, under the terms of the Open Government Licence.
To view this licence, visit www.nationalarchives.gov.uk/doc/open-government-licence/ or write to the Information Policy Team, The National Archives, Kew, London TW9 4DU, or email: [email protected]


