Polarcus Limited
30
www.polarcus.com 1 13 November, 2012 Rolf Ronningen, CEO Tom Henrik Sundby, CFO Polarcus Limited
Transcript of Polarcus Limited

www.polarcus.com 1
13 November, 2012
Rolf Ronningen, CEO
Tom Henrik Sundby, CFO
Polarcus Limited

www.polarcus.com 2
Disclaimer
This Presentation of Polarcus Limited (the “Company”) has been prepared solely for information purposes. This Presentation may not be
distributed, reproduced or used without the consent of the Company.
The information contained herein does not purport to contain all information concerning the Company. No party has made any kind of
independent verification of any of the information set forth herein, including any statements with respect to projections or prospects of the
business or the assumptions on which such statements are based. The Company nor any of its subsidiaries make any representations or
warranty, express or implied, as to the accuracy, reliability or completeness of this Presentation or of the information contained herein and shall
have no liability for the information contained in, or any omissions from, this Presentation.
Included in this Presentation are various “forward-looking statements”, including statements regarding the intent, opinion, belief or current
expectations of the Company or its management. Such forward-looking statements are not guarantees of future performance and involve known
and unknown risks, uncertainties and other factors that may cause the actual results, performance and outcomes to be materially different from
any future results, performance or outcomes expressed or implied by such forward-looking statements, including, among others, risks or
uncertainties associated with the Company’s business, segments, development, growth management, financing, market acceptance and
relations with customers, and, more generally, general economic and business conditions, changes in domestic and foreign laws and
regulations, taxes, changes in competition and pricing environments, fluctuations in currency exchange rates and interest rates and other
factors, including lack of operating history. Should one or more of these risks or uncertainties materialize, or should underlying assumptions
prove incorrect, actual results may vary materially from those described in this document.
No information contained herein constitutes, or shall be relied upon as constituting, any advice relating to the future performance of the
Company. The Company undertakes no obligation to publicly update or revise any forward-looking statements included in this Presentation.

www.polarcus.com 3
Agenda
Highlights
Financials
Operations & Market update
Summary & Q&A
Appendices
1
2
3
4
5

www.polarcus.com 4
ARCTIC PROGRAMS A RESOUNDING SUCCESS
• Financial Highlights Q3 2012: – Revenues of USD 174.6 million, up 119% from Q3 11
– EBITDA of USD 64.6 million, up 170% from Q3 11
– EBIT of USD 39.7 million, up 763% from Q3 11
– Net Cash Flow from operating activities of USD 74.3
million, up 109% from Q3 2011
• Fleet backlog with an estimated total value of USD
280 million
• Vessel utilization at 92%, comprising Contract 86%
and Multi-Client 6%
• Excellent Arctic performance over 8 vessel months
• USD 10 million guarantee facility for bid and
performance bonds secured

www.polarcus.com 5
Agenda
Highlights
Financials
Operations & Market update
Summary & Q&A
Appendices
1
2
3
4
5

www.polarcus.com 6
Consolidated income statement
Quarter ended Nine months ended Year ended
(In thousands of USD) Notes 30-Sep-12 30-Sep-11 30-Sep-12 30-Sep-11 31-Dec-11
Revenues
Contract revenue 170,232 62,292 374,408 176,118 274,757
Multi-client revenue 3,943 17,543 10,317 17,543 20,571
Other income 471 - 4,171 - 3,248
Total Revenues 174,646 79,835 388,897 193,661 298,577
Operating expenses
Vessel Operating expenses (103,831) (49,369) (237,168) (130,624) (199,460)
Sales, general and administrative costs (6,261) (6,521) (18,054) (17,829) (22,799)
Depreciation and amortisation 10 (24,847) (19,338) (62,513) (42,462) (60,802)
Total Operating expenses (134,939) (75,228) (317,735) (190,915) (283,061)
Gross profit/(loss) 39,707 4,607 71,162 2,746 15,516
Financial Expenses
Finance costs 11 (21,407) (15,522) (70,941) (39,380) (59,472)
Finance income 12 3,032 692 9,528 1,279 5,761
Changes in fairvalue of financial instruments 5 - 4,363 48 6,099 6,720
Gain on acquisition of joint-venture - - 3,602 - -
Net Financial Expenses (18,375) (10,468) (57,763) (32,002) (46,991)
Profit/(loss) for the period before tax 21,332 (5,861) 13,398 (29,256) (31,475)
Income tax expense (258) - (315) (1) (24)
Profit/(loss) for the period 21,074 (5,861) 13,083 (29,257) (31,499)
Other comprehensive income
Other comprehensive income/(loss) for the period - - - - -
Total comprehensive income/(loss) for the period 21,074 (5,861) 13,083 (29,257) (31,499)
Profit/(Loss) per share during the period (In USD)
- Basic
0.042
(0.014)
0.026
(0.071)
(0.075)
- Diluted
0.040
(0.024)
0.025
(0.082)
(0.086)

www.polarcus.com 7
Cash flow
Quarter ended Nine months ended Year ended
(In thousands of USD) 30-Sep-12 30-Sep-11 30-Sep-12 30-Sep-11 Dec-11
Cash flows from operating activities
Profit/(loss) for the period 21,074 (5,861) 13,083 (29,257) (31,499)
Depreciation, amortization and changes in fair value of financial instruments 25,703 15,470 64,478 37,986 56,152
Net Interest expenses 18,158 14,563 61,311 37,440 53,277
Other adjustments 1,665 - (1,898) - -
Net working capital 7,683 11,665 28,990 265 (30,368)
Net cash flows from operating activities 74,283 35,838 165,964 46,435 47,561
Cash flows from investing activities
Decrease/(Increase) in restricted cash 2,927 73,893 17,178 95,031 87,066
Purchases of property, plant and equipment (14,265) (81,432) (295,683) (275,885) (303,579)
Payments for multi-client project library (8,640) (13,397) (19,221) (13,397) (17,282)
Other - (63) (4,984) (178) (219)
Net cash flows used in investing activities (19,978) (20,999) (302,711) (194,429) (234,013)
Cash flows from financing activities
Net proceeds from the issuance of financial instruments (52) - 305,873 178,610 255,058
Repayment of lease liabilities, long-term debt and bonds (13,893) (17,025) (89,688) (32,754) (35,996)
Net interest paid (12,738) (26,513) (52,701) (52,630) (59,111)
Net cash flows from financing activities (26,682) (43,538) 163,485 93,226 159,951
Net increase/(decrease) in cash and cash equivalents 27,623 (28,700) 26,739 (54,768) (26,501)
Cash and cash equivalents at the beginning of the period 59,451 60,768 60,336 86,836 86,836
Cash and cash equivalents at the end of the period 87,074 32,068 87,074 32,068 60,336
www.polarcus.com 8
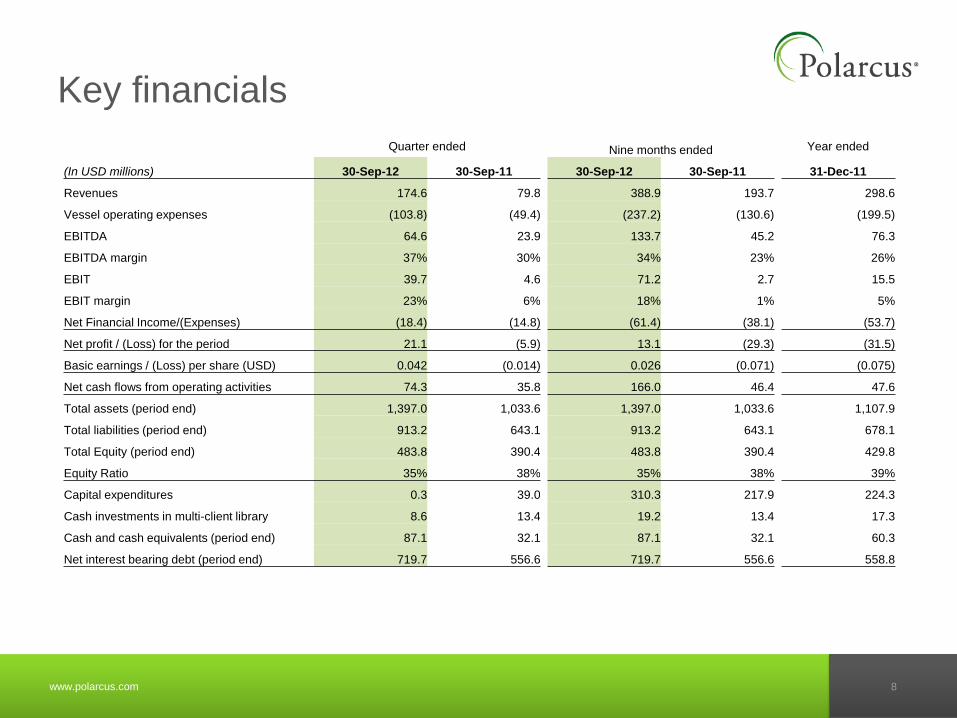
Key financials
Quarter ended Nine months ended Year ended
(In USD millions) 30-Sep-12 30-Sep-11 30-Sep-12 30-Sep-11 31-Dec-11
Revenues 174.6 79.8 388.9 193.7 298.6
Vessel operating expenses (103.8) (49.4) (237.2) (130.6) (199.5)
EBITDA 64.6 23.9 133.7 45.2 76.3
EBITDA margin 37% 30% 34% 23% 26%
EBIT 39.7 4.6 71.2 2.7 15.5
EBIT margin 23% 6% 18% 1% 5%
Net Financial Income/(Expenses) (18.4) (14.8) (61.4) (38.1) (53.7)
Net profit / (Loss) for the period 21.1 (5.9) 13.1 (29.3) (31.5)
Basic earnings / (Loss) per share (USD) 0.042 (0.014) 0.026 (0.071) (0.075)
Net cash flows from operating activities 74.3 35.8 166.0 46.4 47.6
Total assets (period end) 1,397.0 1,033.6 1,397.0 1,033.6 1,107.9
Total liabilities (period end) 913.2 643.1 913.2 643.1 678.1
Total Equity (period end) 483.8 390.4 483.8 390.4 429.8
Equity Ratio 35% 38% 35% 38% 39%
Capital expenditures 0.3 39.0 310.3 217.9 224.3
Cash investments in multi-client library 8.6 13.4 19.2 13.4 17.3
Cash and cash equivalents (period end) 87.1 32.1 87.1 32.1 60.3
Net interest bearing debt (period end) 719.7 556.6 719.7 556.6 558.8

www.polarcus.com 9
Key financials – historic development
4.6
39.7
(10.00)
-
10.00
20.00
30.00
40.00
50.00
Q1-10 Q2-10 Q3-10 Q4-10 Q1-11 Q2-11 Q3-11 Q4-11 Q1-12 Q2-12 Q3-12
EBIT
23%
6%
79.8
174.6
(20.00)
20.00
60.00
100.00
140.00
180.00
Q1-10 Q2-10 Q3-10 Q4-10 Q1-11 Q2-11 Q3-11 Q4-11 Q1-12 Q2-12 Q3-12
Revenues
23.9
64.6
(20.00)
-
20.00
40.00
60.00
80.00
Q1-10 Q2-10 Q3-10 Q4-10 Q1-11 Q2-11 Q3-11 Q4-11 Q1-12 Q2-12 Q3-12
EBITDA 37%
30% 35.6
74.3
(20.00)
-
20.00
40.00
60.00
80.00
Q1-10 Q2-10 Q3-10 Q4-10 Q1-11 Q2-11 Q3-11 Q4-11 Q1-12 Q2-12 Q3-12
Cash from operations

www.polarcus.com 10
Fleet Utilization 87% YTD
Including Vyacheslav Tikhonov
55%
81% 79%
89% 85%
73%
53%
73% 77%
81% 86%
30%
8% 3%
8%
6%
35%
9% 17%
10% 13%
25%
13% 16% 18%
7% 7% 10% 10%
4% 1% 2% 3% 5% 3% 2% 4% 1%
0%
10%
20%
30%
40%
50%
60%
70%
80%
90%
100%
Q1-10 Q2-10 Q3-10 Q4-10 Q1-11 Q2-11 Q3-11 Q4-11 Q1-12 Q2-12 Q3-12
Yard stay (including shakedown)
Transit
Multi-Client Seismic Contract
Exclusive Seismic Contract

www.polarcus.com 11
Funding overview
• Total funding of USD 1.5 B
• Continued de-levering by repayment of
USD 14 million in principal debt in Q3
2012
• Gross debt USD 845 million by end Q3
2012
• USD 10 million guarantee facility for
bid and performance bonds secured
547
160
80
70
180
40
410
0
200
400
600
800
1000
1200
1400
1600
1
Bank loan
Unsecured Bonds
Sale lease back
Vendor financing
Bonds
Convertibles
Equity
www.polarcus.com 12
0
20
40
60
80
100
120
140
160
180
200
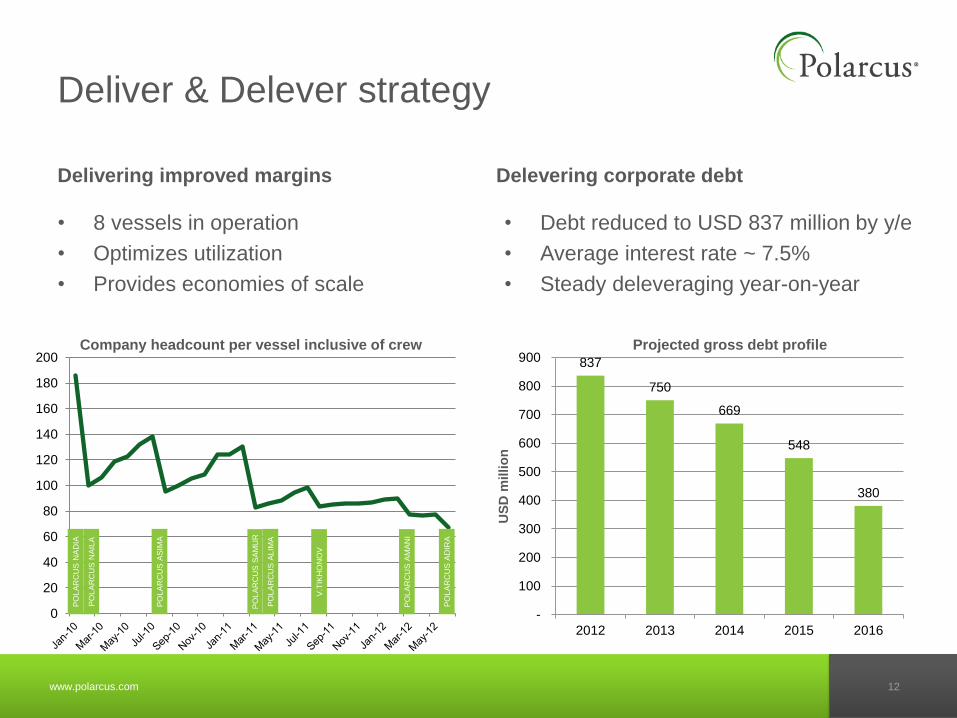
Deliver & Delever strategy
Delivering improved margins
• 8 vessels in operation
• Optimizes utilization
• Provides economies of scale
Delevering corporate debt
837
750
669
548
380
-
100
200
300
400
500
600
700
800
900
2012 2013 2014 2015 2016
US
D m
illio
n
• Debt reduced to USD 837 million by y/e
• Average interest rate ~ 7.5%
• Steady deleveraging year-on-year
PO
LA
RC
US
NA
DIA
PO
LA
RC
US
NA
ILA
PO
LA
RC
US
AS
IMA
PO
LA
RC
US
SA
MU
R
V.T
IKH
ON
OV
PO
LA
RC
US
AM
AN
I
PO
LA
RC
US
AD
IRA
PO
LA
RC
US
AL
IMA
Projected gross debt profile Company headcount per vessel inclusive of crew

www.polarcus.com 13
Polarcus Share
• Listed on the Oslo Stock
Exchange
• Market Cap ~500 MUSD
• High liquidity in the shares
• ~2500 shareholders
• Management and BoD
represents 21%
Shareholder Share %
ZICKERMAN HOLDING LT 40,571,476 8.00
DRYDOCKS WORLD LLC 37,500,000 7.39
ZICKERMAN GROUP LTD 22,948,081 4.52
VARMA MUTUAL PENSION 19,648,025 3.87
BANK OF AMERICA MERR 17,384,469 3.43
BARCLAYS CAPITAL SEC 13,225,166 2.61
MORGAN STANLEY & CO 13,134,609 2.59
VERDIPAPIRFONDET DNB 9,991,137 1.97
JO HAMBRO CAP MGT UM 9,338,596 1.84
AWILCO INVEST AS 8,450,000 1.67
CREDIT SUISSE SECURI 7,839,325 1.55
SKANDINAVISKA ENSKIL 7,631,938 1.50
BANK OF NEW YORK MEL 7,076,565 1.40
JP MORGAN CLEARING C 7,041,571 1.39
EUROCLEAR BANK S.A./ 7,005,782 1.38
VERDIPAPIRFONDET DEL 5,564,917 1.10
CLEARSTREAM BANKING 5,327,371 1.05
BANK OF NEW YORK MEL 5,212,618 1.03
CREDIT SUISSE SECURI 4,733,702 0.93
STATE STREET BANK & 4,521,365 0.89
Top 20 Shareholders 254,146,713 50.11%
Other shareholders 253,049,466 49.89%
Total 507,196,179 100%
Top 20 Shareholders (as per 31 Oct)

www.polarcus.com 14
Agenda
Highlights
Financials
Operations & Market update
Summary & Q&A
Appendices
1
2
3
4
5

www.polarcus.com 15
Global player specializing in Arctic & ESSA
Current vessel locations
Completed surveys
Arctic and ESSA (Environmentally Sensitive Sea Areas)
Polarcus Samur
Polarcus Naila
Polarcus Nadia
Polarcus Asima Polarcus Alima
Polarcus Amani
Polarcus Selma*
Polarcus Adira
Note: *Vyacheslav Tikhonov (Polarcus Selma) on charter to Sovcomflot
Sources:
www.imo.org
www.biosecurity.govt.nz
>25% project awards in Arctic / ESSA

www.polarcus.com 16
2012 Arctic program: a resounding success
• ~10 000 sq km acquired in ice
infested waters
• Two vessels in First Pass™ mode
• Low technical downtime
• Ice management executed to plan
to optimise acquisition window

www.polarcus.com 17
Dynamic ice management critical due to the high concentration of icebergs
Extensive support vessel fleet supporting logistics & ice management
Ice-1A Support Fleet
Ice management key to Arctic success

www.polarcus.com 18
Arctic strategy pays off
• Ice Class 1A vessels: 8 vessel months in Baffin Bay
• Optimum 3D spreads providing top tier performance
• Importance of Arctic vessel technology acknowledged
• Emissions reduction in focus by clients
• Triple E energy efficiency initiative across fleet
• Marine mammal mitigations in place across fleet
• Flexible geophysical solution to geological challenges
• Ice management capabilities demonstrated
• Arctic / remote logistics executed safely & efficiently
RIGHTSIZE
RIGHTDESIGN
RIGHTPLAN
www.polarcus.com 19
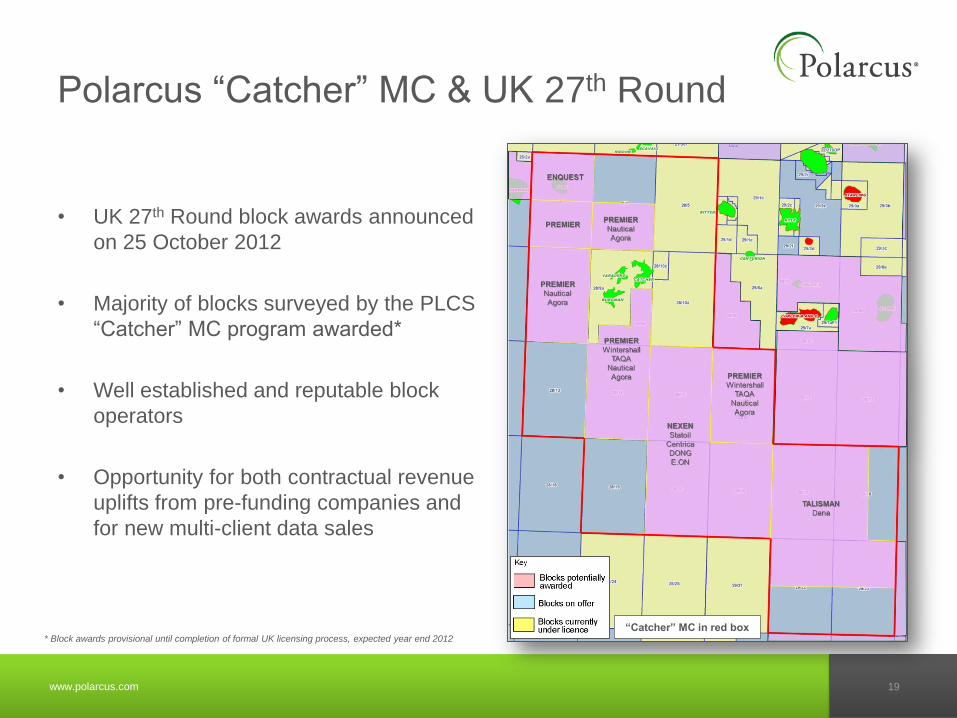
Polarcus “Catcher” MC & UK 27th Round
• UK 27th Round block awards announced
on 25 October 2012
• Majority of blocks surveyed by the PLCS
“Catcher” MC program awarded*
• Well established and reputable block
operators
• Opportunity for both contractual revenue
uplifts from pre-funding companies and
for new multi-client data sales
“Catcher” MC in red box * Block awards provisional until completion of formal UK licensing process, expected year end 2012

www.polarcus.com 20
Global 3D Seismic fleet capacity
46%
3% 25%
10%
16%
1 - 5 years
6 - 10 years
11 - 15 years
16 - 19 years
20+ years
Fleet age profile 2012
Global 3D 6+ streamer fleet
• Estimated seismic fleet growth 2013
– 2015 net 2% Year on Year
assuming 4 vessels being stacked
• Lead time for new build capacity
traditionally between 24 – 36 months
• Further fleet retirement expected
excludes COSL (3 vessels) & Sinopec (1 vessel)
59 60 62 63 64
0
10
20
30
40
50
60
70
2011 2012 2013 2014 2015
www.polarcus.com 21
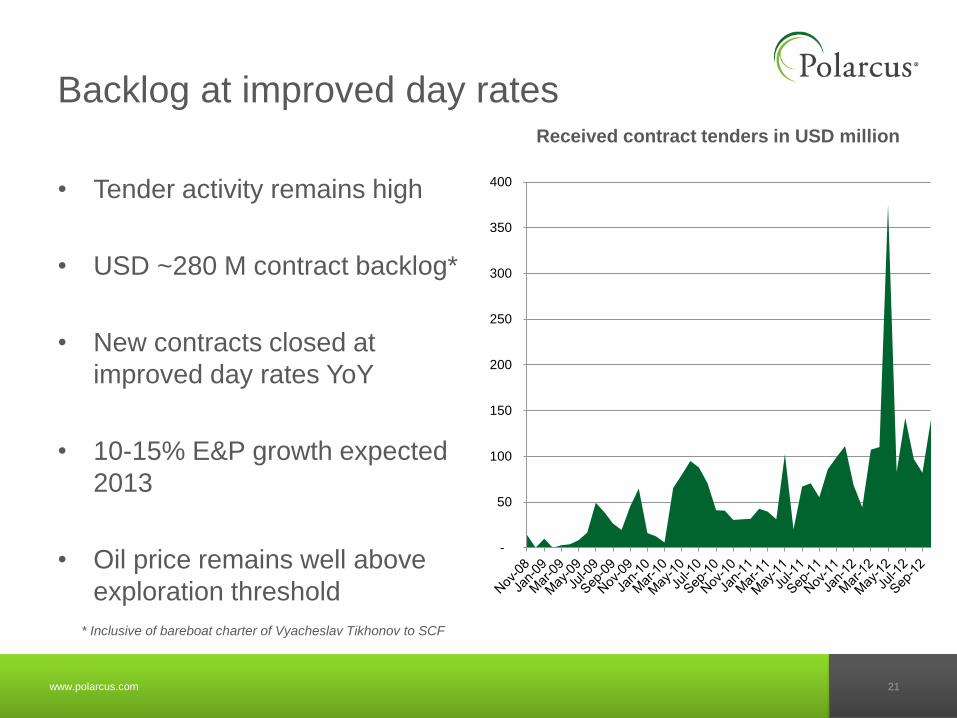
Backlog at improved day rates
• Tender activity remains high
• USD ~280 M contract backlog*
• New contracts closed at
improved day rates YoY
• 10-15% E&P growth expected
2013
• Oil price remains well above
exploration threshold
* Inclusive of bareboat charter of Vyacheslav Tikhonov to SCF
Received contract tenders in USD million
-
50
100
150
200
250
300
350
400
www.polarcus.com 22
Agenda
Highlights
Financials
Operations & Market update
Summary & Q&A
Appendices
1
2
3
4
5

www.polarcus.com 23
RIGHTSIZE, RIGHTDESIGN, RIGHTPLAN
• Delivering & delevering
• Successful execution in true Arctic environment
• Polarcus strategy continues to pay off
www.polarcus.com 24
Agenda
Highlights
Financials
Operations & Market update
Summary & Q&A
Appendices
1
2
4
5
3

www.polarcus.com 25
Polarcus in brief
• 8 high-end 3D seismic vessels representing 12% market share
• Youngest most uniform fleet in industry
• 500+ professionals and global presence
• State of the art technology with complete broadband solution
• Specialized Arctic and low environmental impact offerings
• Clear strategy for delivery and deleveraging
• Listed on Oslo Børs Main List
2008 2009 2010
Polarcus
launched
2008
2012 2011
Polarcus Asima in operation offshore west Greenland

www.polarcus.com 26
Polarcus Fleet
• 8 new and uniform 3D seismic
vessels in operation
• Polarcus Amani and Polarcus Adira
delivered on time and on budget
• Reduced noise and vibrations
• Ice class 1A
• Improved transit performance
POLARCUS NADIA &
POLARCUS NAILA
12 Streamer 3D vessel
POLARCUS ASIMA &
POLARCUS ALIMA
12 Streamer 3D vessel
POLARCUS SAMUR &
Vyacheslav Tikhonov
8 Streamer 3D vessel
POLARCUS AMANI &
POLARCUS ADIRA
12-14 Streamer 3D vessel

www.polarcus.com 27
First
Pass
Wide tow
High
Density
3D
Base-
line 4D
High
density
4D
4D
Monitor
Multi-
vessel
3D
Multi-
vessel
4D
Monitor
Arctic
Operations
Multi
Azimuth
Vessel +
Equipment Personnel +
Procedures
Acquisition
Portfolio
Broadband Solutions
Polarcus offering

www.polarcus.com 28
Awards through RIGHTDESIGN
ICE-1A or 1A* Class1
Safe Arctic operations 1 POLARCUS ASIMA, ALIMA,
SAMUR, SELMA, AMANI & ADIRA
ULSTEIN X-BOW®
Improved efficiency and
reduced emissions Fuel: MGO with low
sulfur content
BWM-T 2
Removal of invasive species from ballast water 2 POLARCUS ASIMA, ALIMA, SAMUR, SELMA, AMANI & ADIRA
IMO Green Passport
Multiple main engines and independent
propellers in case of failure
DYNPOS-AUTR
Systems redundancy
with DP2
CLEAN DESIGN
High specification
exhaust catalysts
Double hull – no oil contact
with outer skin
Bilge water cleaning system to
reduce contaminants to <5ppm
Triple – E™
Environmental &
Energy Efficiency Sentinel® solid streamers

www.polarcus.com 29
Debt overview
Debt Security Size Balance
30 Sep 2012 Tenure Maturity Interest
Vendor Financing Seismic Equipment USD 70m USD 13m 2.5 years Jun-13 8%
Convertible Bond Unsecured USD 35m USD 35m 5 years Jul-13 8.50%
Unsecured Bond Unsecured NOK 240m NOK 240m 3 years Nov-14 14%
Senior secured bond 2nd priority
5 vessel fleet USD 80m USD 80m 5 years Oct-15 12.50%
Senior Secured Convertible bond Selma USD 125m USD 125m 5 years Apr-16 2.88%
Sale leaseback Nadia & Naila USD 180m USD 167m 10 years Sep-19 ~12%
Fleet bank facility
Tranche 1 Asima USD 80m USD 67m 12 years Aug-22 6.20%
Fleet bank facility
Tranche 2 Alima USD 55m USD 48m 12 years Mar-23 5.10%
Fleet bank facility
Tranche 3 Amani USD 114m USD 109m 12 years Mar-24 5.60%
Fleet bank facility
Tranche 4 Adira USD 114m USD 114m 12 years Jun-24 5.60%
Fleet bank facility
Tranche 5 Samur USD 47m USD 47m 12 years Jun-24 5.40%

www.polarcus.com 30