POL 168: Chican@/Latin@ Politics Professor Brad Jones Dept. of Political Science UC-Davis.
28
POL 168: Chican@/Latin@ Politics Professor Brad Jones Dept. of Political Science UC-Davis
-
date post
21-Dec-2015 -
Category
Documents
-
view
220 -
download
2
Transcript of POL 168: Chican@/Latin@ Politics Professor Brad Jones Dept. of Political Science UC-Davis.

POL 168: Chican@/Latin@ Politics
Professor Brad Jones
Dept. of Political Science
UC-Davis

Today
• Latino Public Opinion
• Participation

Updated Analysis: Most Concern
Party Having Most Concern for Latinos
0
10
20
30
40
50
60
2002 2004 2006 2007
Year
REP DEM NO DIFF

Republican Identifiers
Party Having Most Concern for Latinos: Republican Identifiers
0
10
20
30
40
50
60
2002 2004 2006 2007
Year
REP DEM NO DIFF
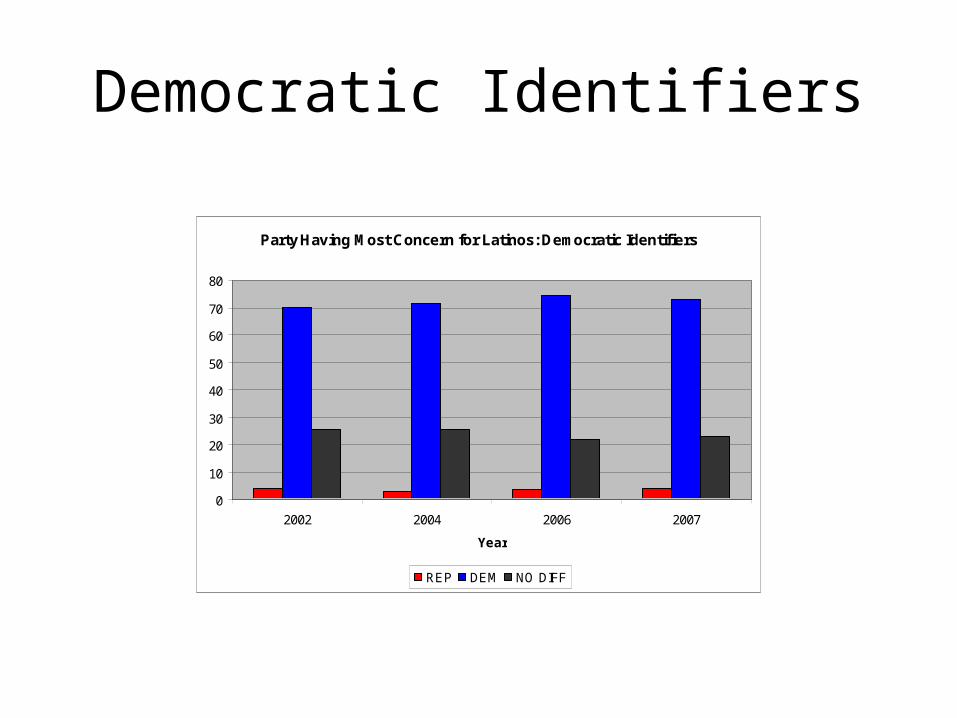
Democratic Identifiers
Party Having Most Concern for Latinos: Democratic Identifiers
0
10
20
30
40
50
60
70
80
2002 2004 2006 2007
Year
REP DEM NO DIFF

Independent Identifiers
Party Having Most Concern for Latinos: Independent Identifiers
0
5
10
15
20
25
30
35
2002 2004 2006 2007
Year
REP DEM NO DIFF

Party Affiliation: 2002-2007
Party Affiliation, 2002-2007
0
5
10
15
20
25
30
35
40
45
50
2002 2004 2006 2007
Year
Per
cen
tag
e
REP DEM IND

Information and Political Behavior
• Nicholson, Pantoja, Segura article• What do we know about political information in the
general setting?– Highly related to participation: the more one knows, the more
one is likely to participate.
• Main points in this article?• Argument has typically been made that racial/ethnic
minorities are less informed.– Why? SES issues; educational differences.– These authors find relatively high levels of information on issues,
but this is not uniform.– Suggests appeals to Latino vote cannot merely rely on symbols.– Simply speaking Spanish will not work uniformly!

What do we know about Latinos?
• Attitudes toward government?
• Politicians?
• Political Parties?
• The Acculturation Issue?
• Participation?
• I M P L I C A T I O N S
• Mobilization? Courting the Latino Vote?

Voting Rights Act
• Monumental legislation with respect to voting and civil liberties
• Has spawned many “landmark” Supreme Court decision• Import
– Federalized authority over electoral process• Original intent primarily focused on African-American
voting rights in the South• 14th and 15th Amendments, in practice, were hard to
enforce– Enforcement Act of 1870– Force Act of 1871– Both repealed; essentially no enforcement until 1950s.– States Gone Wild (especially Southern States)
• Poll Taxes, Literacy Tests, Hostile Voting Locales

VRA of 1965
• The impetus begins in Kennedy Admin.• http://www.youtube.com/watch?v=-srOvwG81Iw
&feature=related• Landmark legislation passed by the LBJ
administration in 1965. • The VRA applied to specific areas:
– Where registration and turnout was less than 50 percent of the potential electorate.
– All the Southern states and Texas and Arizona were “covered” by the VRA; counties in other states were also covered (including CA)

VRA of 1965
• Section 2 of the VRA was crucial for minority voting rights.– Prohibited minority vote dilution– Prohibited practices aimed at denying minorities an
unfair chance to vote.
• Section 5 equally crucial– Required preclearance– Direct hand of the federal government in the drawing
of congressional district lines– The effect of proposed changes in “VRA covered”
areas was now a “live” issue.

Why Care About Majority Minority Districting?
• Consider some public opinion data.
• “Descriptive Representation” – To what extent are Latino/as represented by a
Latino/a?– Does it matter?
• Pew 2004 National Survey of Latinos: Politics and Civic Participation
Descriptive Representation
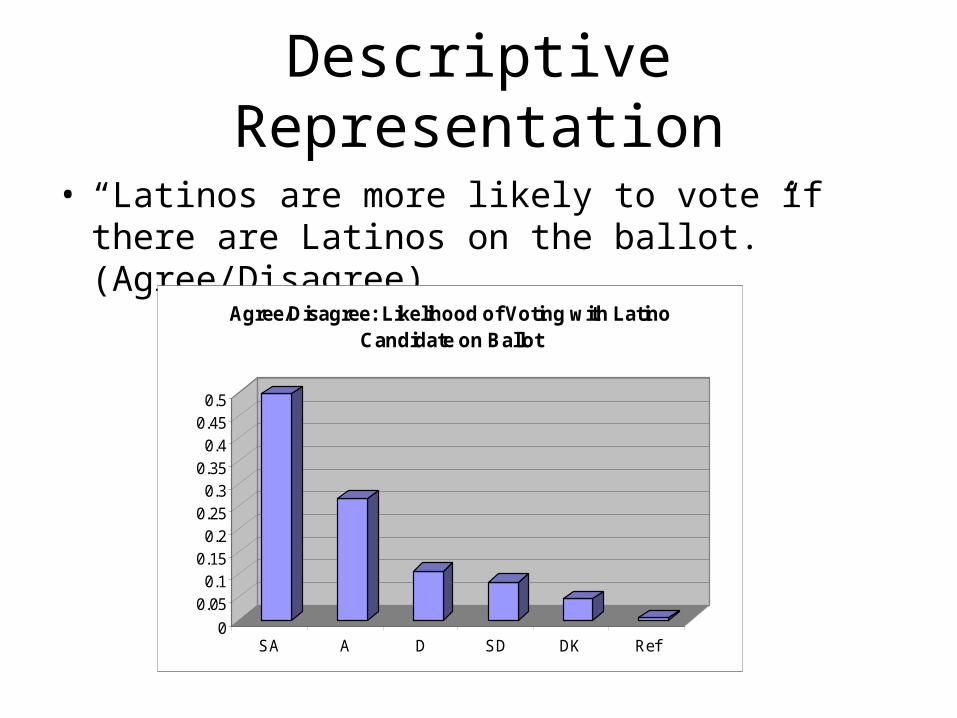
• “Latinos are more likely to vote if there are Latinos on the ballot.” (Agree/Disagree)
0
0.050.1
0.150.2
0.250.3
0.350.4
0.450.5
SA A D SD DK Ref
Agree/Disagree: Likelihood of Voting with Latino Candidate on Ballot
Descriptive Representation
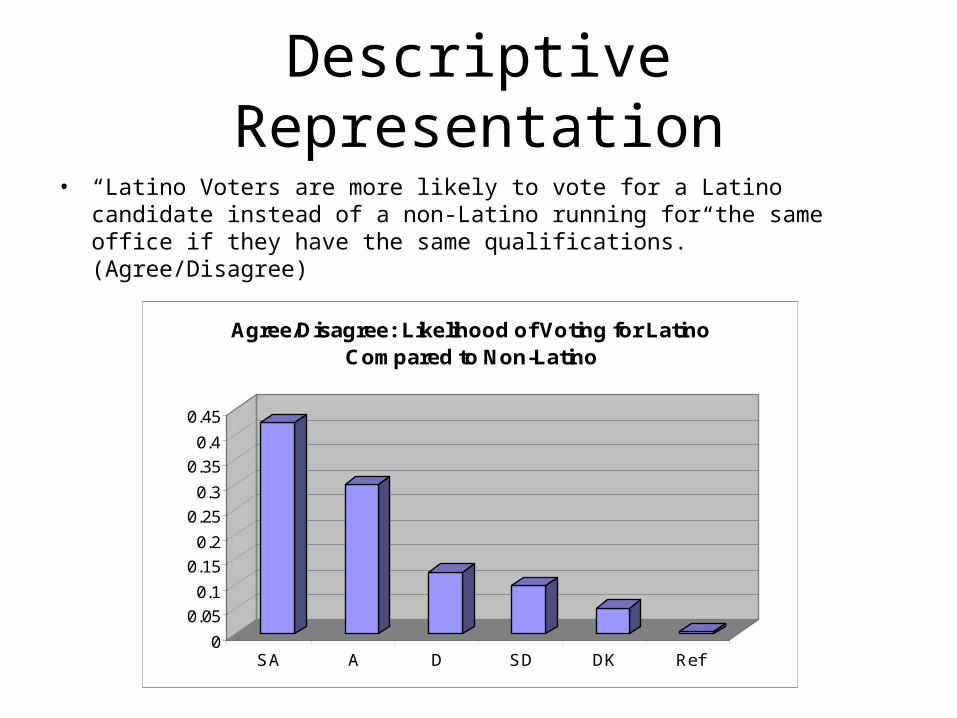
• “Latino Voters are more likely to vote for a Latino candidate instead of a non-Latino running for the same office if they have the same qualifications.” (Agree/Disagree)
0
0.05
0.1
0.15
0.2
0.25
0.3
0.35
0.4
0.45
SA A D SD DK Ref
Agree/Disagree: Likelihood of Voting for Latino Compared to Non-Latino
Other Results
• 56 percent of respondents agree with the statement: “Latino voters will usually pick a Latino candidate even if there is a better qualified non-Latino running…”.
• 37 percent of respondents agree with the statement: “I am more likely to vote if there are Latinos on the ballot.” (i.e. most disagree)
• Implications of this?• There are implications of descriptive representation and
the VRA
VRA
• Requires reauthorization, most recently 2006
• Mobile vs. Bolden 446 U.S. 55 (1980) – Required plaintiffs to prove discriminatory
intent; a difficult task.– Reauthorization in 1982 revised proof
requirement; requirement was now just to show the results of discrimination.

VRA and Latino Voting
• 1975 Amendments to VRA– Sec. 203 extended coverage to linguistic
minorities, thus expanding coverage.– Asian, Alaskan natives, American Indians and
persons of Spanish Heritage– Required native language electoral materials
in covered areas (given a threshold was met)
• VRA opens up possibility of “descriptive representation” (recall last few slides)

VRA and Voting
• Latino Representation– 5 in 1970; 21 currently– Congressional Hispanic Caucus
• http://www.house.gov/baca/chc/history.shtml
– Congressional Hispanic Caucus Institute• http://www.chci.org/
– Why the increase?– In part, redistricting efforts.

Redistricting• Thornburg v. Gingles (1986)
– Upheld constitutionality of majority-minority districts (50 percent or more)– Implications?
• What happened?– Claims of “racial gerrymandering.”– Challenges to Constitutionality of Districts– Shaw v. Reno (1993)– 5-4 decision: equal protection violated because irregularly shaped districts
segregated races “for purposes of voting, without regard for traditional districting principles…” (Shaw v. Reno)
– Bush v Vera (1996) and Hunt v. Cromartie (2001) have rolled back this interpretation
– Race may be used as one of “several factors” in the creation of districts• League of United Latin American Citizens v. Perry, 548 U. S. 399
(2006): Texas “DeLay” plan violated the VRA in the 23rd district.– Court Recognizes growing power of Latino vote, whose vote was diluted.
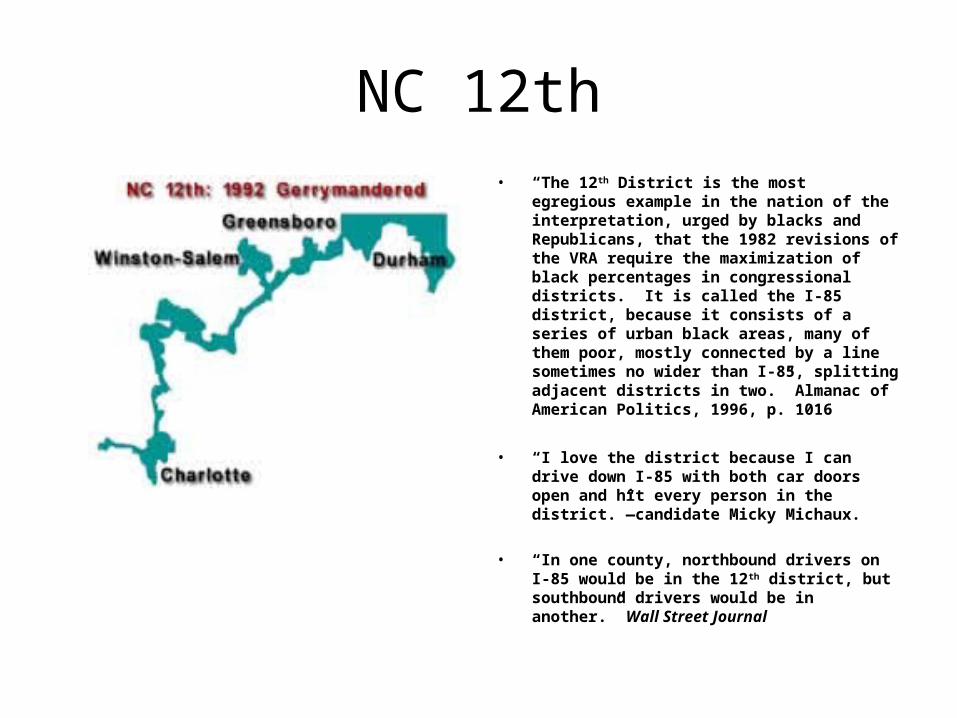
NC 12th• “The 12th District is the most egregious example
in the nation of the interpretation, urged by blacks and Republicans, that the 1982 revisions of the VRA require the maximization of black percentages in congressional districts. It is called the I-85 district, because it consists of a series of urban black areas, many of them poor, mostly connected by a line sometimes no wider than I-85, splitting adjacent districts in two.” Almanac of American Politics, 1996, p. 1016
• “I love the district because I can drive down I-85 with both car doors open and hit every person in the district.”—candidate Micky Michaux.
• “In one county, northbound drivers on I-85 would be in the 12th district, but southbound drivers would be in another.” Wall Street Journal
Redistricting and Related Issues
• Problem with Majority-Minority Districts?• Emphasis on “impact” or “influence”
districts.– The critical mass argument is made here.
• Diverse electoral districts– In many places, Latinos and African-
Americans live in close proximity.– Districting means a large number of both
groups will reside in the district.

Congressional Districts
• Some Examples – CA 33rd District
• 30 percent African American• 35 percent Hispanic Origin• African American representative Diane Watson
– CA 35th District• 34.1 percent African American• 47.4 Hispanic Origin• African American representative Maxine Waters
– CA 37th District• 24.8 percent African American• 43.2 percent Hispanic Origin• African American representative Laura Richardson
– http://www.census.gov/prod/2004pubs/03statab/congdist.pdf
– http://velazquez.house.gov/chc/

Ideology: Characteristics of MCs
• Ideology Estimates for Incumbents• Controlling for Race, Ethnicity, and Party Affiliation• Incumbent Ideology• Black Latino White• All Incumbents• Mean (s.d.) .54 (.19) .29 (.31) -.04 (.38)• Median (i.q.r.) .56 (.16) .37 (.28) -.03 (.70)• N Cases 312 156 4187• Democrats• Mean (s.d.) .56 (.11) .42 (.13) .30 (.18)• Median (i.q.r.).57 (.15) .40 (.20) .31 (.24)• N Cases 303 128 2106
Take-Away Points
• Importance of Ideology
• Democratic Dominant
• Issue of Descriptive Representation
• “Can an African-American represent Latinos”
• Ideological characteristics of the population (more on that tomorrow)
• Election of minority representatives?

Voting Rules
• US Congress– Single-member district– Winner-take-all– Implications
• Reinforces two-party dominant system– Incentive for third parties to emerge small.
• Not all publicly held offices work this way
Alternative Voting Systems
• Often proposed as a solution for low levels of minority representation.
• Examples– Cumulative Voting: Cast as many votes as
there are candidates running. – It’s up to you how to distribute those votes. – Why might this help minority candidates?– Research shows it does work
Alternative Voting Systems
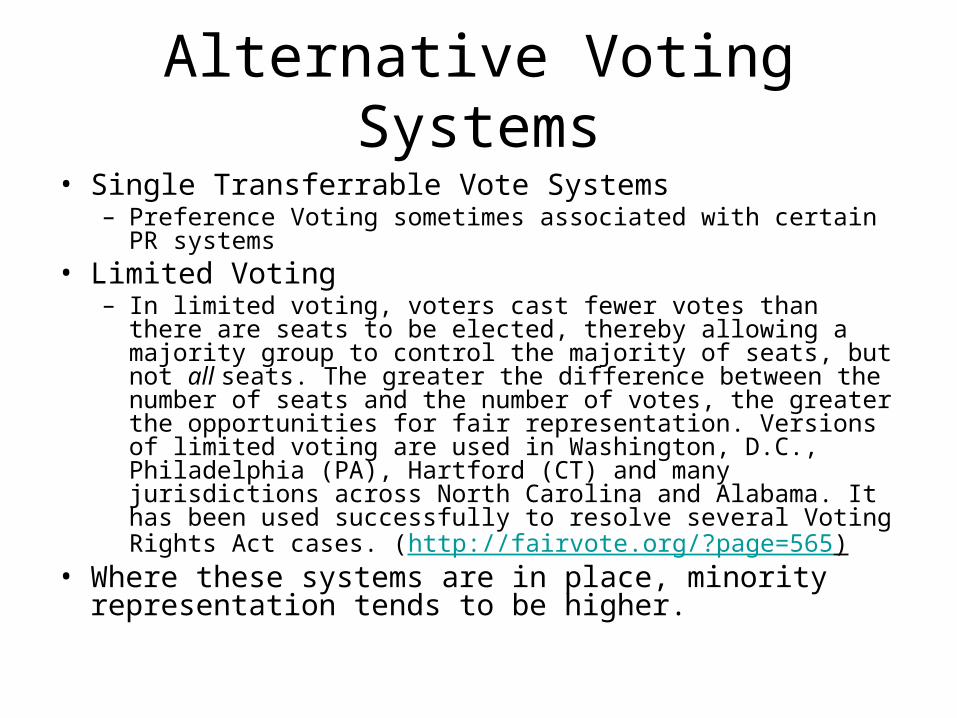
• Single Transferrable Vote Systems– Preference Voting sometimes associated with certain PR
systems• Limited Voting
– In limited voting, voters cast fewer votes than there are seats to be elected, thereby allowing a majority group to control the majority of seats, but not all seats. The greater the difference between the number of seats and the number of votes, the greater the opportunities for fair representation. Versions of limited voting are used in Washington, D.C., Philadelphia (PA), Hartford (CT) and many jurisdictions across North Carolina and Alabama. It has been used successfully to resolve several Voting Rights Act cases. (http://fairvote.org/?page=565)
• Where these systems are in place, minority representation tends to be higher.