POL 168 Chican@/Latin@ Politics
27
POL 168 Chican@/Latin@ Politics Professor Brad Jones Dept. of Political Science UC-Davis Winter 2008
description
POL 168 Chican@/Latin@ Politics. Professor Brad Jones Dept. of Political Science UC-Davis Winter 2008. Latino Participation. What is political participation? The different flavors? Barriers to participation? Costs associated with participation - PowerPoint PPT Presentation
Transcript of POL 168 Chican@/Latin@ Politics

POL 168Chican@/Latin@ Politics
Professor Brad JonesDept. of Political Science
UC-DavisWinter 2008
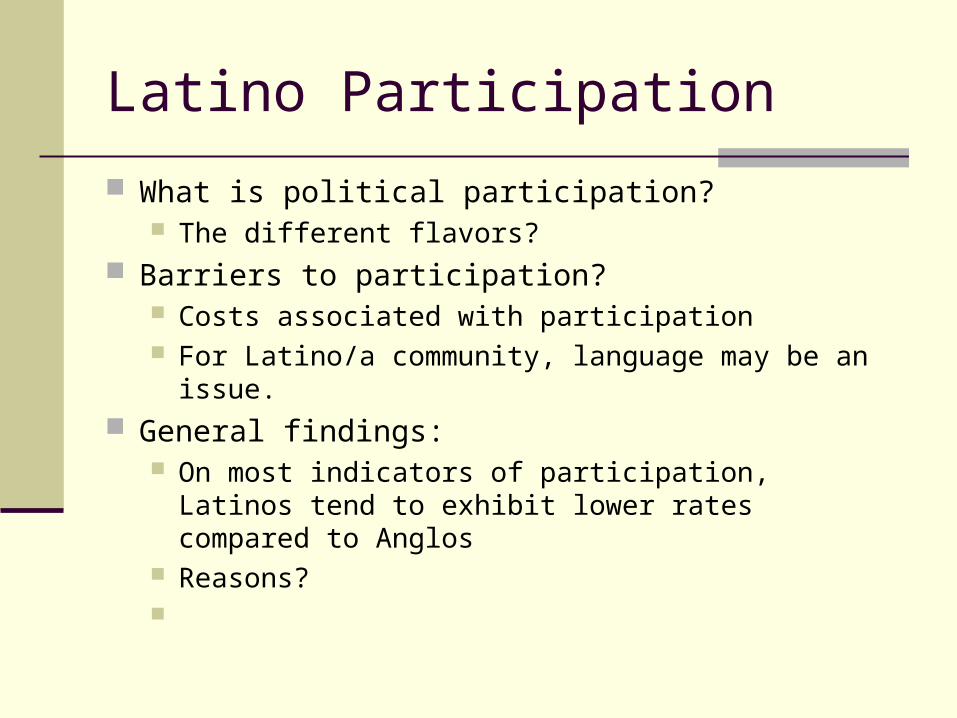
Latino Participation
What is political participation? The different flavors?
Barriers to participation? Costs associated with participation For Latino/a community, language may be an issue.
General findings: On most indicators of participation, Latinos tend to
exhibit lower rates compared to Anglos Reasons?

Some Data
Pew 2004 National Survey of Latinos: Politics and Civic Participation
National survey of Latino/a individuals Let’s turn to some simple analysis and see
what we learn.

Interest in Politics
Interest in politics does a good job of predicting subsequent participation.
Contrast Latina vs. Latino Question asks about attention paid to politics.
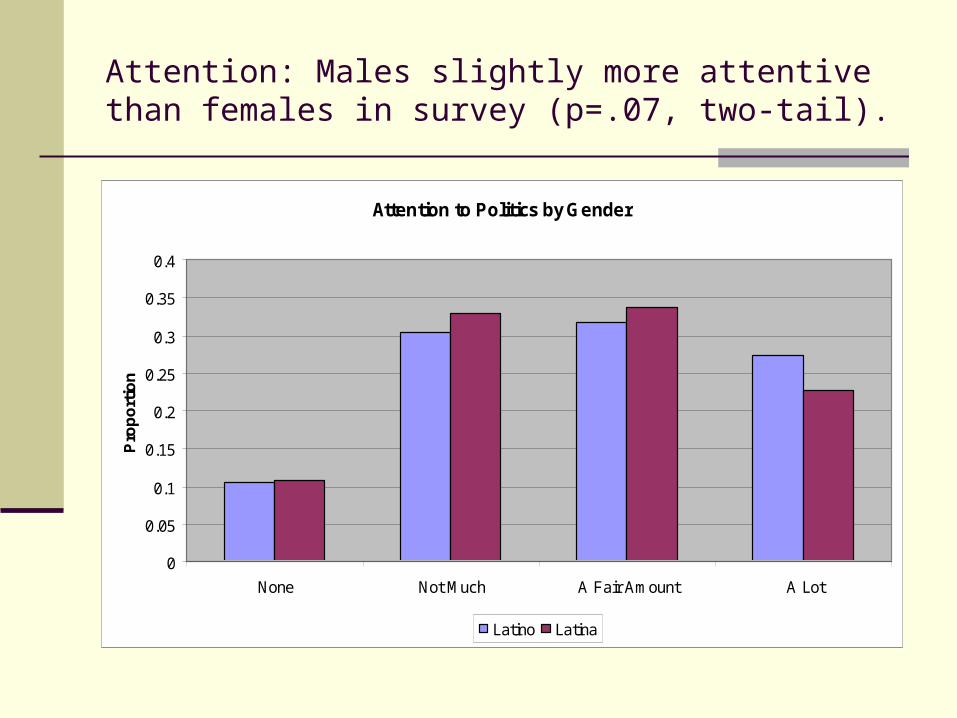
Attention: Males slightly more attentive than females in survey (p=.07, two-tail).
Attention to Politics by Gender
0
0.05
0.1
0.15
0.2
0.25
0.3
0.35
0.4
None Not Much A Fair Amount A Lot
Pro
po
rtio
n
Latino Latina

Attention: US-born more attentive than non US-born in survey (p=.00, two-tail).
Attention to Politics by Birthplace
0
0.05
0.1
0.15
0.2
0.25
0.3
0.35
0.4
0.45
None Not Much A Fair Amount A Lot
Pro
port
ion
Non US-Born US Born

Other Results
Mexican Origin slightly less attentive compared to non-Mexican origin.
Cuban Origin significantly more attentive to politics compared to non-Cubano
No significant differences in attentiveness for Central or South American descent.
Comparisons to Anglo population?

Party Affiliation
Why care about party affiliation? Closed primaries Dominance of two-party system (like it or not)
Concerns about “monolithic” vote. Is it fair to characterize Latino/as as a singular
group? Let’s consider some data.

Identification: All Respondents
0
5
10
15
20
25
30
35
REP DEM IND Other DK Ref
Party Affiliation (All Respondents)

Identification: By Gender
Party Affiliation by Gender
0
0.05
0.1
0.15
0.2
0.25
0.3
0.35
0.4
REP DEM IND Other DK Ref
Latino Latina

Identification: By Birthplace
Party Affiliation by Birthplace
0
0.05
0.1
0.15
0.2
0.25
0.3
0.35
0.4
0.45
0.5
REP DEM IND Other DK Ref
Non US-born US-born

Identification by Origin: Mexican
Mexican Origin About 14 percent identify REPUBLICAN About 35 percent identify DEMOCRAT About 26 percent identify INDEPENDENT About 12 percent identify as “SOMETHING
ELSE” Take-away points?

Identification by Origin: Cuba
Cuban Origin About 47 percent identify REPUBLICAN About 19 percent identify DEMOCRAT About 17 percent identify INDEPENDENT About 6 percent identify as “SOMETHING
ELSE” Take-away points?

Identification by Origin: Puerto Rico
Puerto Rican Origin About 16 percent identify REPUBLICAN About 44 percent identify DEMOCRAT About 17 percent identify INDEPENDENT About 12 percent identify as “SOMETHING
ELSE” Take-away Points?

Identification: Central American
Central American Origin 14 percent REPUBLICAN 32 percent DEMOCRAT 31 percent INDEPENDENT 6 percent SOMETHING ELSE “Leaners” 47 percent DEM

Identification: South American
South American Origin 17 percent REPUBLICAN 36 percent DEMOCRAT 28 percent INDEPENDENT 10 percent SOMETHING ELSE “Leaners” 47 percent DEM

Implications of all of this?
Are Latino/as monolithic, in terms of partisanship?
What do these sliver of data suggest for the future? (If anything)
Other interesting features of these data… “Descriptive Representation”
To what extent are Latino/as represented by a Latino/a?
Does it matter?
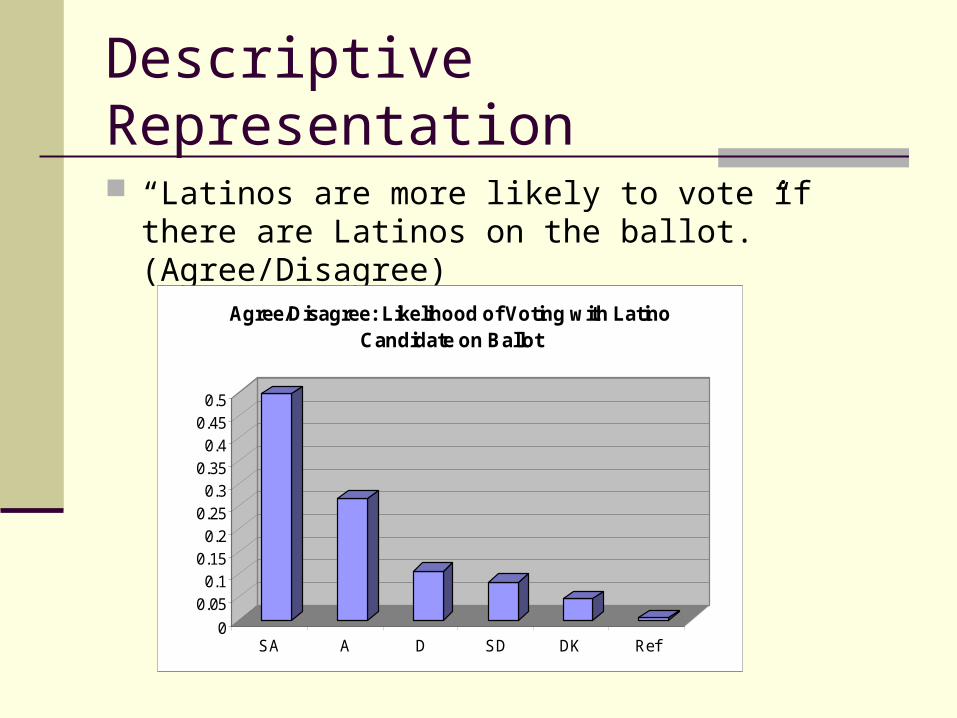
Descriptive Representation
“Latinos are more likely to vote if there are Latinos on the ballot.” (Agree/Disagree)
0
0.050.1
0.150.2
0.250.3
0.350.4
0.450.5
SA A D SD DK Ref
Agree/Disagree: Likelihood of Voting with Latino Candidate on Ballot

Descriptive Representation
“Latino Voters are more likely to vote for a Latino candidate instead of a non-Latino running for the same office if they have the same qualifications.” (Agree/Disagree)
0
0.05
0.1
0.15
0.2
0.25
0.3
0.35
0.4
0.45
SA A D SD DK Ref
Agree/Disagree: Likelihood of Voting for Latino Compared to Non-Latino

Other Results
56 percent of respondents agree with the statement: “Latino voters will usually pick a Latino candidate even if there is a better qualified non-Latino running…”.
37 percent of respondents agree with the statement: “I am more likely to vote if there are Latinos on the ballot.” (i.e. most disagree)
Implications of this?

Side-trip to Immigration
You didn’t think I could keep away from it… 65 percent say undocumented migrants “help the
economy by providing low-cost labor.” 61 percent of Republican Latinos agree. 56 percent of US-born Latinos agree. 78 percent of Mexican origin agree 56 percent of Cuban origin agree 41 percent of Puerto Rican origin agree 69 percent of Central American origin agree 61 percent of South American origin agree

Immigration
54 percent support guest worker program with provision migrants must return to their home country.
67 percent of Republican Latinos agree. 51 percent of US-born Latinos agree. 57 percent of Mexican origin agree 64 percent of Cuban origin agree 42 percent of Puerto Rican origin agree 43 percent of Central American origin agree 50 percent of South American origin agree

Immigration
87 percent support “path-to-citizenship.” 85 percent of Republican Latinos agree. 80 percent of US-born Latinos agree. 90 percent of Mexican origin agree 91 percent of Cuban origin agree 79 percent of Puerto Rican origin agree 90 percent of Central American origin agree 90 percent of South American origin agree

Immigration
57 say immigrants “have to speak English to say they are part of American society.”
65 percent of Republican Latinos agree. 53 percent of US-born Latinos agree. 54 percent of Mexican origin agree 65 percent of Cuban origin agree 54 percent of Puerto Rican origin agree 54 percent of Central American origin agree 71 percent of South American origin agree

Immigration
82 percent say immigrants “have to believe in the US Constitution to say they are part of American society.”
91 percent of Republican Latinos agree. 81 percent of US-born Latinos agree. 80 percent of Mexican origin agree 91 percent of Cuban origin agree 78 percent of Puerto Rican origin agree 81 percent of Central American origin agree 84 percent of South American origin agree

Immigration
55 percent say immigrants “have to become a US citizen to say they are part of American society.”
64 percent of Republican Latinos agree. 57 percent of US-born Latinos agree. 51 percent of Mexican origin agree 63 percent of Cuban origin agree 63 percent of Puerto Rican origin agree 52 percent of Central American origin agree 47 percent of South American origin agree

Immigration
http://www.youtube.com/watch?v=6Lb3oFzCj_0