Poisonings Among Arizona Residents, 2004-2007 · Poisonings among Arizona Residents 2013 ... (26...
30
1 Poisonings among Arizona Residents 2013 Resources for the development of this report were provided through funding to the Arizona Department of Health Services from the Centers for Disease Control and Prevention, Cooperative Agreement 5U17CE002023 Core Violence and Injury Prevention Program. Permission to quote from or reproduce materials from this publication is granted when acknowledgment is made. Prepared by: Jennifer D. Dudek, MPH 150 North 18 th Avenue, Suite 320 Phoenix, AZ 85007 Office of Injury Prevention Bureau of Women’s and Children’s Health Arizona Department of Health Services December 2014
Transcript of Poisonings Among Arizona Residents, 2004-2007 · Poisonings among Arizona Residents 2013 ... (26...
1
Poisonings among Arizona Residents 2013
Resources for the development of this report were provided through funding to the Arizona Department of Health Services from the Centers for Disease Control and Prevention, Cooperative Agreement 5U17CE002023
Core Violence and Injury Prevention Program.
Permission to quote from or reproduce materials from this publication is granted when acknowledgment is made.
Prepared by: Jennifer D. Dudek, MPH 150 North 18th Avenue, Suite 320 Phoenix, AZ 85007 Office of Injury Prevention Bureau of Women’s and Children’s Health Arizona Department of Health Services December 2014
2
Table of Contents Executive Summary ........................................................................................................................... 2 Overview of Poisonings among Arizona Residents .............................................................................. 4 Poison Control Centers Serving Arizona .............................................................................................. 6 Five-Year Trends in Poisonings among Arizona Residents, 2009-2013 .................................................. 7
Mortality ................................................................................................................................................... 7 Non-Fatal Inpatient Hospitalizations ...................................................................................................... 10
Poisoning-Related Mortality, 2013 ................................................................................................... 12 Non-Fatal Poisoning-Related Inpatient Hospitalizations, 2013 ........................................................... 17 Poisoning and Prescription Drug Overdoses as an Arizona Public Health Concern .............................. 27 Poisoning Prevention Tips and Resources ......................................................................................... 28 Methodology ................................................................................................................................... 29

3
Executive Summary Poisoning was the leading cause of injury-related mortality among Arizona residents in 2013; a total of 1,240 (26 percent) deaths were attributable to poisoning. The age-adjusted poisoning mortality rate increased five percent from 18.2 deaths per 100,000 residents in 2012 to 19.1 deaths per 100,000 residents in 2013. Males aged 45 through 54 years had the highest rate of poisoning-related deaths with 40.8 deaths per 100,000 residents. Poisoning mortality rates were highest among American Indians (40.7 deaths per 100,000 residents) and White, non-Hispanics (23.1 deaths per 100,000 residents). Seventy-eight percent of the poisoning-related deaths in 2013 were due to unintentional injuries (n=965); 14 percent were due to suicide (n=168); and eight percent were of an undetermined manner of death (n=107). The poisons most commonly specified on death certificates in 2013 were pharmaceutical opioids (n=328), alcohol (n=241), and methamphetamines and other stimulants (n=205). Among counties with at least 20 poisoning-related deaths in 2013, Navajo County had the highest fatality rate (58.8 deaths per 100,000 residents). In 2013, there were 6,580 non-fatal inpatient hospitalizations due to poisonings, an almost ten percent decrease since 2012. Adult females continue to have the highest rates of non-fatal poisoning-related inpatient hospitalizations. As in 2012, females 45 through 54 years of age had the highest rate with 164.9 cases per 100,000 residents, and females 55 through 64 years of age had the second highest rate of 143.5 cases per 100,000 residents. African-American residents had the highest age-adjusted poisoning-related rate of non-fatal inpatient hospitalizations with 125.2 per 100,000 followed closely by White, non-Hispanic residents with 120 cases per 100,000 residents. Unintentional poisoning accounted for 46 percent of non-fatal poisoning-related inpatient hospitalizations (n=2,994), and intentional poisonings comprised an additional 46 percent (n=3,029). Hospital charges for non-fatal poisoning-related inpatient hospitalizations totaled more than $213 million in 2013, and Arizona residents spent a total of 21,640 days hospitalized for these injuries. Mohave County had the highest age-adjusted rate of inpatient hospitalizations due to non-fatal poisonings (160.5 hospitalizations per 100,000 residents). In 2013, there were 11,528 non-fatal poisoning-related emergency department visits among Arizona residents. The highest age-specific rates of non-fatal poisoning-related emergency department visits for both males and females were among children one to four years of age (413.6 visits per 100,000 residents and 373.4 per 100,000 residents, respectively). Fifty-three percent of the non-fatal poisoning-related emergency department visits were the result of unintentional poisonings (n=6,055), and 35 percent of the visits resulted from intentional injuries (n=4,040). The data presented in this report show that poisoning is a public health problem that impacts the lives of thousands of Arizona residents each year. These injuries can occur throughout the life span, and like so many injuries, poisonings are preventable. Understanding the circumstances of poisonings is an important step towards educating and empowering communities and implementing prevention strategies.
4
Overview of Poisonings among Arizona Residents
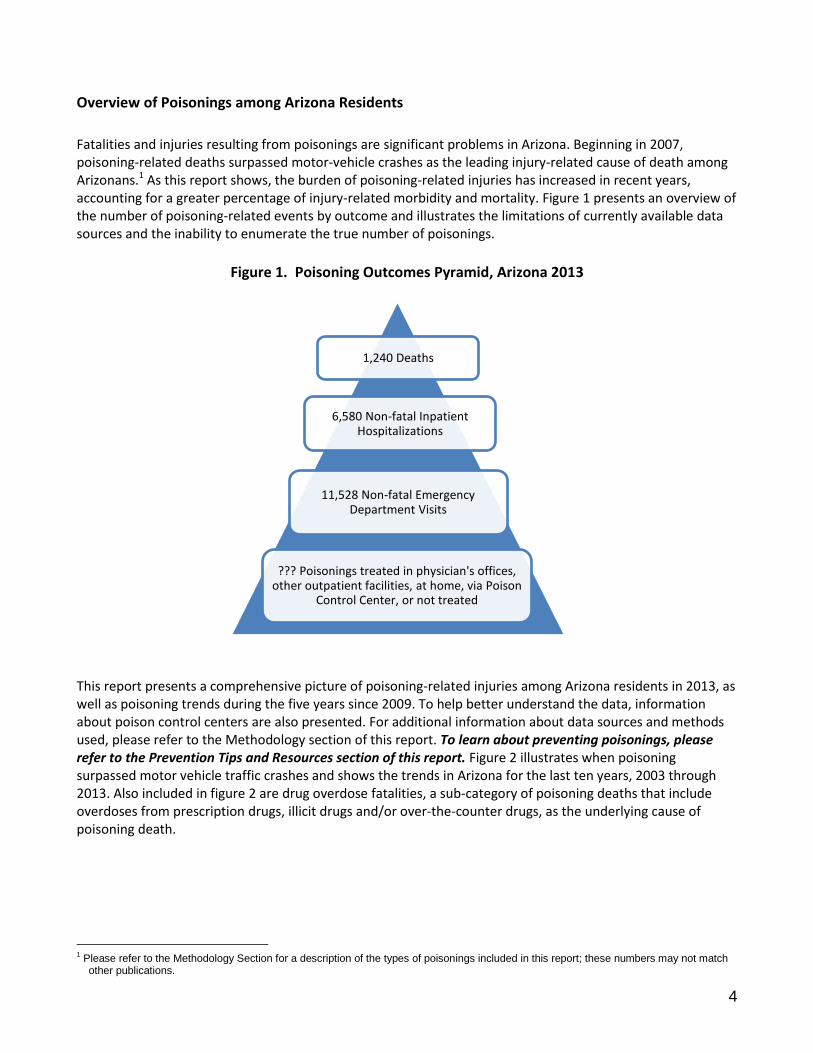
Fatalities and injuries resulting from poisonings are significant problems in Arizona. Beginning in 2007, poisoning-related deaths surpassed motor-vehicle crashes as the leading injury-related cause of death among Arizonans.1 As this report shows, the burden of poisoning-related injuries has increased in recent years, accounting for a greater percentage of injury-related morbidity and mortality. Figure 1 presents an overview of the number of poisoning-related events by outcome and illustrates the limitations of currently available data sources and the inability to enumerate the true number of poisonings.
Figure 1. Poisoning Outcomes Pyramid, Arizona 2013
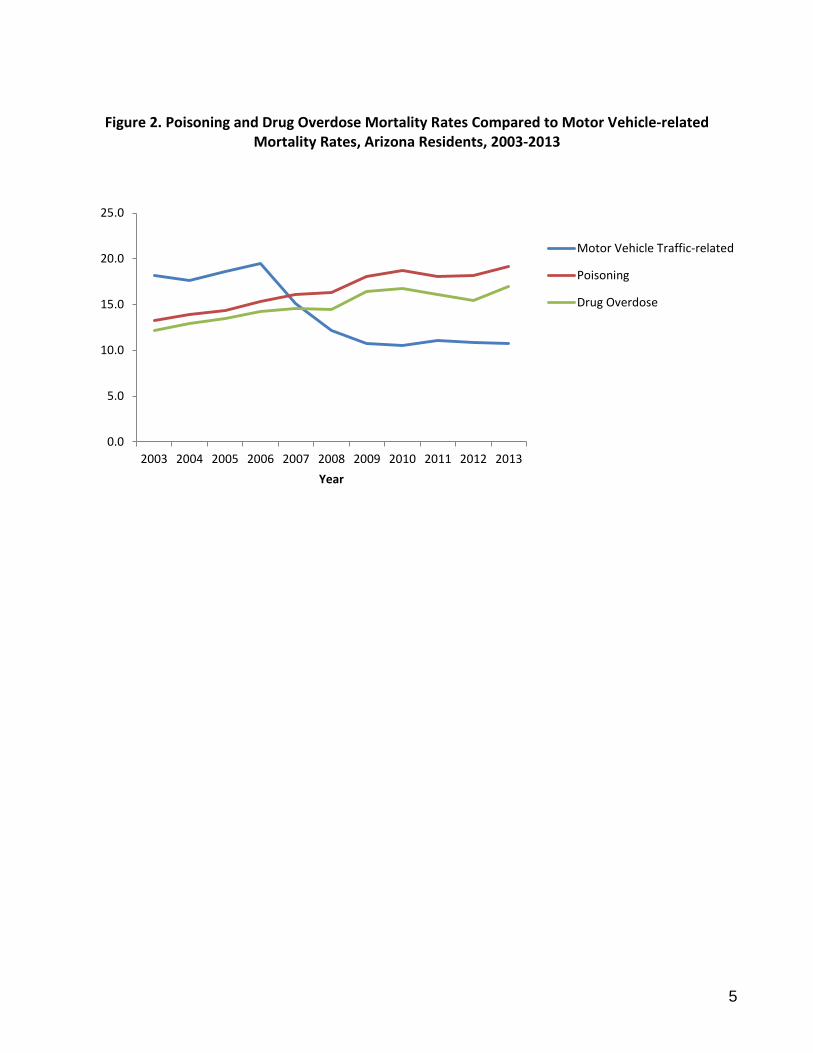
This report presents a comprehensive picture of poisoning-related injuries among Arizona residents in 2013, as well as poisoning trends during the five years since 2009. To help better understand the data, information about poison control centers are also presented. For additional information about data sources and methods used, please refer to the Methodology section of this report. To learn about preventing poisonings, please refer to the Prevention Tips and Resources section of this report. Figure 2 illustrates when poisoning surpassed motor vehicle traffic crashes and shows the trends in Arizona for the last ten years, 2003 through 2013. Also included in figure 2 are drug overdose fatalities, a sub-category of poisoning deaths that include overdoses from prescription drugs, illicit drugs and/or over-the-counter drugs, as the underlying cause of poisoning death.
1 Please refer to the Methodology Section for a description of the types of poisonings included in this report; these numbers may not match
other publications.
1,240 Deaths
6,580 Non-fatal Inpatient Hospitalizations
11,528 Non-fatal Emergency Department Visits
??? Poisonings treated in physician's offices, other outpatient facilities, at home, via Poison
Control Center, or not treated
5
Figure 2. Poisoning and Drug Overdose Mortality Rates Compared to Motor Vehicle-related Mortality Rates, Arizona Residents, 2003-2013
0.0
5.0
10.0
15.0
20.0
25.0
2003 2004 2005 2006 2007 2008 2009 2010 2011 2012 2013
Year
Motor Vehicle Traffic-related
Poisoning
Drug Overdose
6
Poison Control Centers Serving Arizona Poison Control Centers (PCCs) are widely considered to be a cost-effective tool for reducing healthcare costs resulting from poisoning events. It has been estimated that for every dollar invested in a PCC, seven dollars of medical care can be avoided.2 Because of the clear benefit to citizens, the state of Arizona has mandated the existence of a PCC since 1980. Per Arizona Revised Statutes (ARS) 36-1161 through 36-1163, the Arizona Department of Health Services is responsible for establishing a poison and drug information system consisting of two poison control centers. While the poison control centers are charged with serving as a resource for poison identification and treatment, they are also tasked with educating the public about poisoning prevention. As of December 2014, two of the nation’s 57 nationally recognized PCCs were located in Arizona. The Arizona Poison and Drug Information Center (APDIC) is affiliated with the University of Arizona College of Pharmacy located in Tucson. The Banner Good Samaritan Poison & Drug Information Center (BGSPDIC) is located in Phoenix. The BGSPDIC serves Maricopa County, including the metropolitan Phoenix area. The APDIC serves the remainder of the state. While the BGSPDIC serves a smaller geographic area, it covers about 60 percent of the state’s residents. Similar to other nationally recognized PCCs, both Arizona centers are accessed by calling the National Poison Control Center toll-free telephone number: 1-800-222-1222. Calls to this number are routed to the appropriate PCC based on geography. Because calls are routed based on the telephone number from which the call is placed, individuals with an Arizona telephone area code will speak to either BGSPDIC or APDIC, even if they are calling from outside Arizona. Individuals are encouraged to call PCCs with any concerns, whether or not an incident has occurred. While providing information and medical advice about poisonings, both of Arizona’s centers provide additional services to residents including drug information and identification, medical consultation with clinicians, and poisoning prevention education and outreach. In 2013, the APDIC documented 22,418 calls for human exposures to toxins and poisons, out of 42,416 total calls (53 percent). Forty of these cases resulted in death and 32 percent (n=7,533) of the calls were managed in a healthcare facility. In 2013, the BGSPDIC documented 43,380 calls for human exposures to toxins and poisons, out of more than 73,000 total calls (59 percent). Forty-one percent of all human exposures involved children 12 years or younger and 73 percent of calls were managed at home. The availability of a 24-hour poison control center allows many people who may have sought emergency care to be treated in their own homes, resulting in financial savings for themselves and the healthcare facilities they may have otherwise visited. Combining both APDIC and BGSPDIC numbers, it is estimated that more than 48,000 callers may have sought medical treatment at an emergency department in 2013 if they had not been able to consult with the poison control center and care for themselves at home. This means the community saved more than $38 million in emergency treatment costs.3 A survey of patients who called a PCC found that 79 percent of the patients surveyed would have used the local emergency medical services in the absence of a poison control hotline, at an estimated cost of more than five times the operating costs of the PCC.4
2 Miller TR, Lestina DC. Costs of poisoning in the United States and savings from poison control centers: A benefit-cost analysis. Ann Emerg
Med February 1997; 29:239-245. 3 Banner Good Samaritan Poison & Drug Information Center 2013 Summary, accessed December, 2014 at
www.bannerhealth.com/Locations/Arizona/Banner+Good+Samaritan+Poison+and+Drug+Information+Center/About+Us/By+the+Numbers.htm 4 Kearney TE, Olson KR, Bero LA, Heard SE, Blanc PD. Health Care Cost Effects of Public Use of a Regional Poison Control Center. West
J Med 1995; 162:499-504.
7
Five-Year Trends in Poisonings among Arizona Residents, 2009-2013
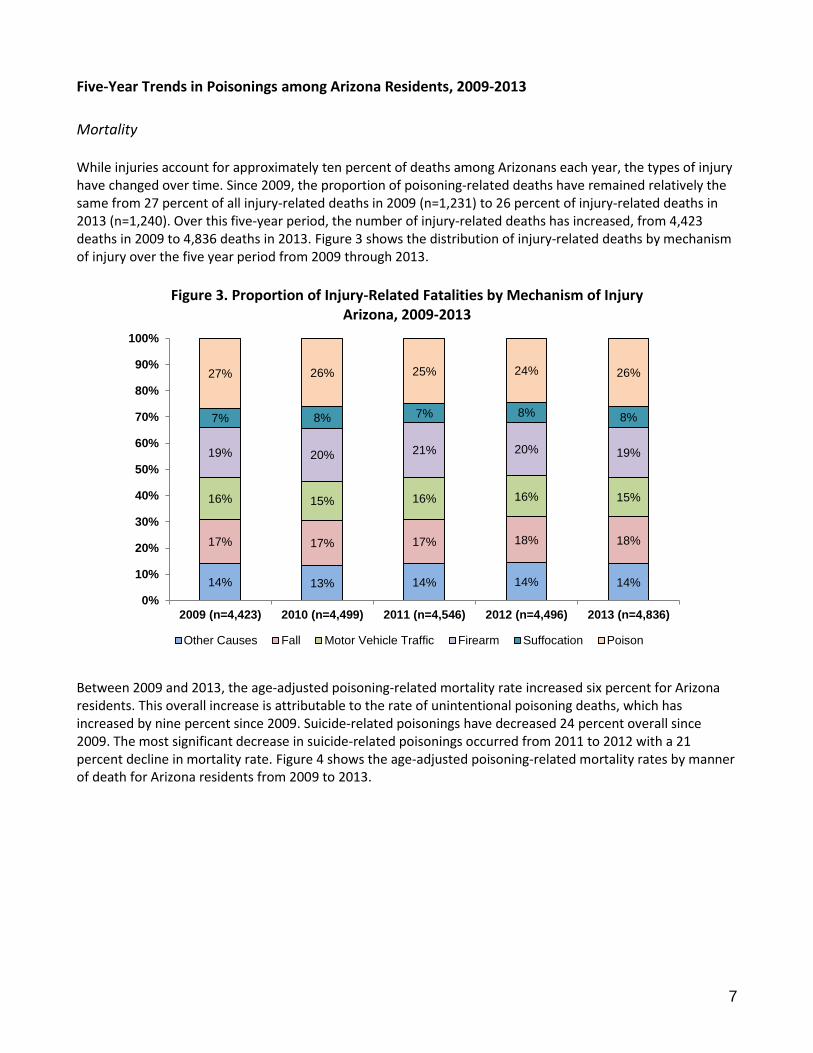
Mortality While injuries account for approximately ten percent of deaths among Arizonans each year, the types of injury have changed over time. Since 2009, the proportion of poisoning-related deaths have remained relatively the same from 27 percent of all injury-related deaths in 2009 (n=1,231) to 26 percent of injury-related deaths in 2013 (n=1,240). Over this five-year period, the number of injury-related deaths has increased, from 4,423 deaths in 2009 to 4,836 deaths in 2013. Figure 3 shows the distribution of injury-related deaths by mechanism of injury over the five year period from 2009 through 2013.
Figure 3. Proportion of Injury-Related Fatalities by Mechanism of Injury
Arizona, 2009-2013
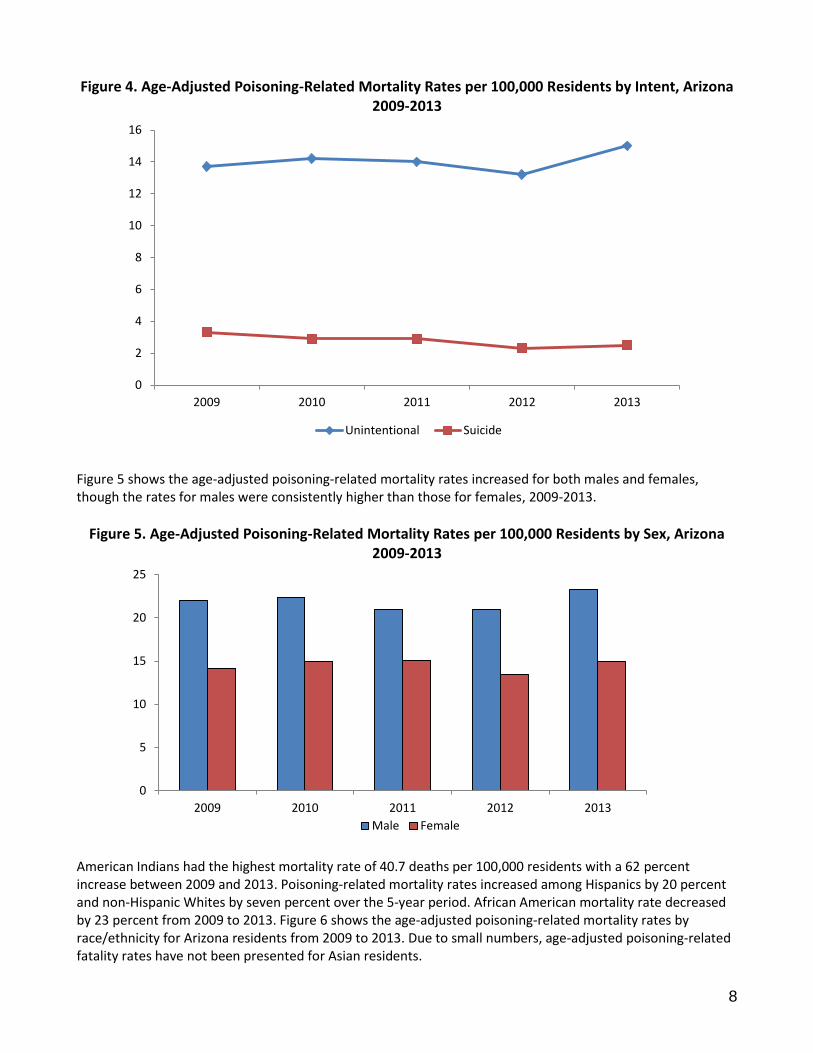
Between 2009 and 2013, the age-adjusted poisoning-related mortality rate increased six percent for Arizona residents. This overall increase is attributable to the rate of unintentional poisoning deaths, which has increased by nine percent since 2009. Suicide-related poisonings have decreased 24 percent overall since 2009. The most significant decrease in suicide-related poisonings occurred from 2011 to 2012 with a 21 percent decline in mortality rate. Figure 4 shows the age-adjusted poisoning-related mortality rates by manner of death for Arizona residents from 2009 to 2013.
14% 13% 14% 14% 14%
17% 17% 17% 18% 18%
16% 15% 16% 16% 15%
19% 20% 21% 20% 19%
7% 8% 7% 8% 8%
27% 26% 25% 24% 26%
0%
10%
20%
30%
40%
50%
60%
70%
80%
90%
100%
2009 (n=4,423) 2010 (n=4,499) 2011 (n=4,546) 2012 (n=4,496) 2013 (n=4,836)
Other Causes Fall Motor Vehicle Traffic Firearm Suffocation Poison
8
Figure 4. Age-Adjusted Poisoning-Related Mortality Rates per 100,000 Residents by Intent, Arizona 2009-2013
Figure 5 shows the age-adjusted poisoning-related mortality rates increased for both males and females, though the rates for males were consistently higher than those for females, 2009-2013.
Figure 5. Age-Adjusted Poisoning-Related Mortality Rates per 100,000 Residents by Sex, Arizona 2009-2013
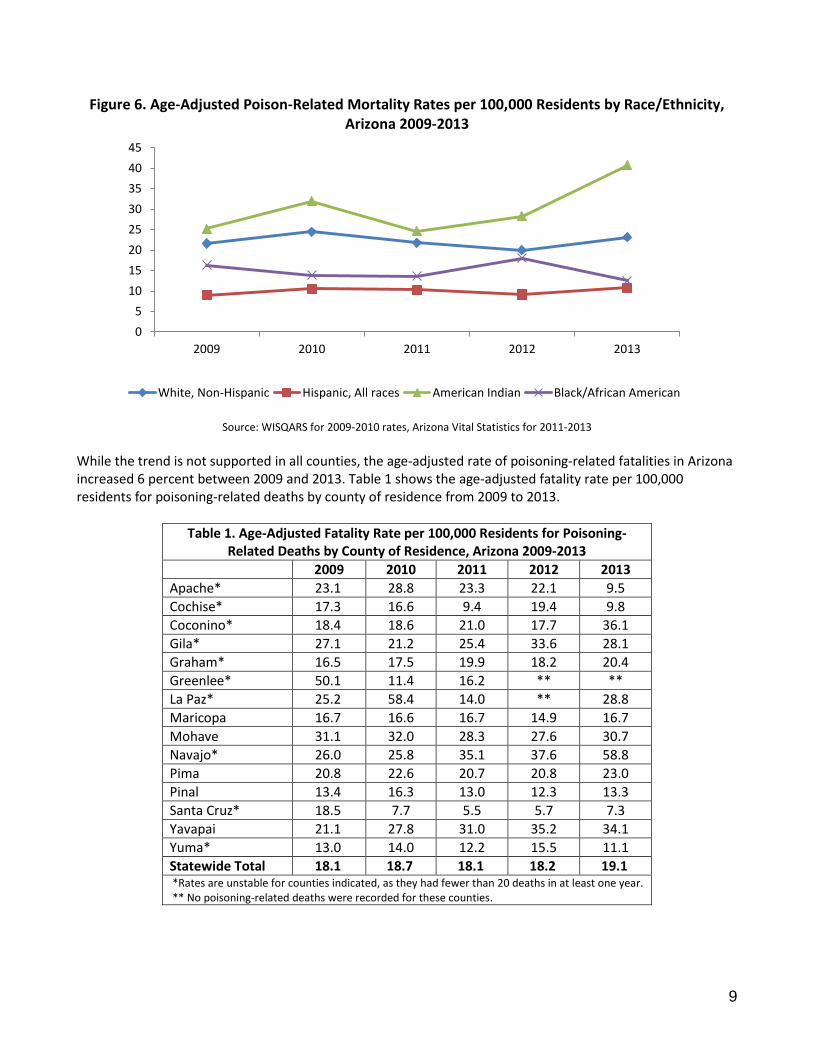
American Indians had the highest mortality rate of 40.7 deaths per 100,000 residents with a 62 percent increase between 2009 and 2013. Poisoning-related mortality rates increased among Hispanics by 20 percent and non-Hispanic Whites by seven percent over the 5-year period. African American mortality rate decreased by 23 percent from 2009 to 2013. Figure 6 shows the age-adjusted poisoning-related mortality rates by race/ethnicity for Arizona residents from 2009 to 2013. Due to small numbers, age-adjusted poisoning-related fatality rates have not been presented for Asian residents.
0
2
4
6
8
10
12
14
16
2009 2010 2011 2012 2013
Unintentional Suicide
0
5
10
15
20
25
2009 2010 2011 2012 2013
Male Female
9
Figure 6. Age-Adjusted Poison-Related Mortality Rates per 100,000 Residents by Race/Ethnicity, Arizona 2009-2013
Source: WISQARS for 2009-2010 rates, Arizona Vital Statistics for 2011-2013
While the trend is not supported in all counties, the age-adjusted rate of poisoning-related fatalities in Arizona increased 6 percent between 2009 and 2013. Table 1 shows the age-adjusted fatality rate per 100,000 residents for poisoning-related deaths by county of residence from 2009 to 2013.
Table 1. Age-Adjusted Fatality Rate per 100,000 Residents for Poisoning-Related Deaths by County of Residence, Arizona 2009-2013
2009 2010 2011 2012 2013
Apache* 23.1 28.8 23.3 22.1 9.5
Cochise* 17.3 16.6 9.4 19.4 9.8
Coconino* 18.4 18.6 21.0 17.7 36.1
Gila* 27.1 21.2 25.4 33.6 28.1
Graham* 16.5 17.5 19.9 18.2 20.4
Greenlee* 50.1 11.4 16.2 ** **
La Paz* 25.2 58.4 14.0 ** 28.8
Maricopa 16.7 16.6 16.7 14.9 16.7
Mohave 31.1 32.0 28.3 27.6 30.7
Navajo* 26.0 25.8 35.1 37.6 58.8
Pima 20.8 22.6 20.7 20.8 23.0
Pinal 13.4 16.3 13.0 12.3 13.3
Santa Cruz* 18.5 7.7 5.5 5.7 7.3
Yavapai 21.1 27.8 31.0 35.2 34.1
Yuma* 13.0 14.0 12.2 15.5 11.1
Statewide Total 18.1 18.7 18.1 18.2 19.1 *Rates are unstable for counties indicated, as they had fewer than 20 deaths in at least one year. ** No poisoning-related deaths were recorded for these counties.
0
5
10
15
20
25
30
35
40
45
2009 2010 2011 2012 2013
White, Non-Hispanic Hispanic, All races American Indian Black/African American
10
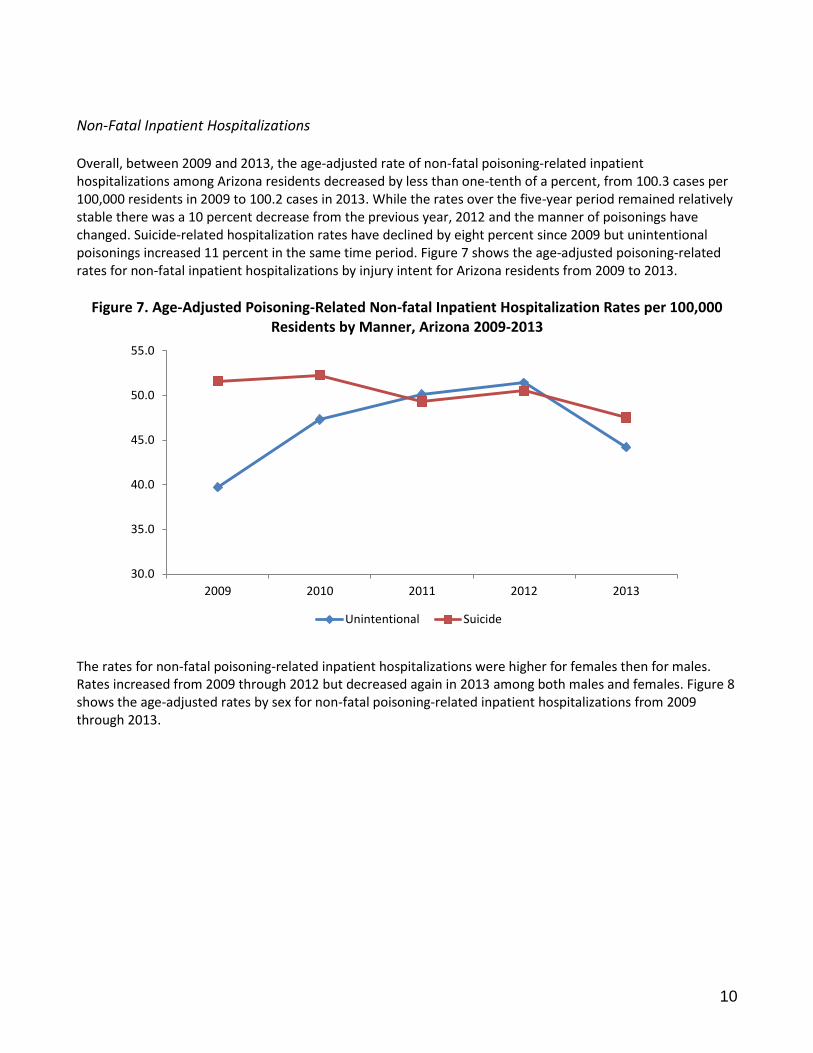
Non-Fatal Inpatient Hospitalizations Overall, between 2009 and 2013, the age-adjusted rate of non-fatal poisoning-related inpatient hospitalizations among Arizona residents decreased by less than one-tenth of a percent, from 100.3 cases per 100,000 residents in 2009 to 100.2 cases in 2013. While the rates over the five-year period remained relatively stable there was a 10 percent decrease from the previous year, 2012 and the manner of poisonings have changed. Suicide-related hospitalization rates have declined by eight percent since 2009 but unintentional poisonings increased 11 percent in the same time period. Figure 7 shows the age-adjusted poisoning-related rates for non-fatal inpatient hospitalizations by injury intent for Arizona residents from 2009 to 2013.
Figure 7. Age-Adjusted Poisoning-Related Non-fatal Inpatient Hospitalization Rates per 100,000 Residents by Manner, Arizona 2009-2013
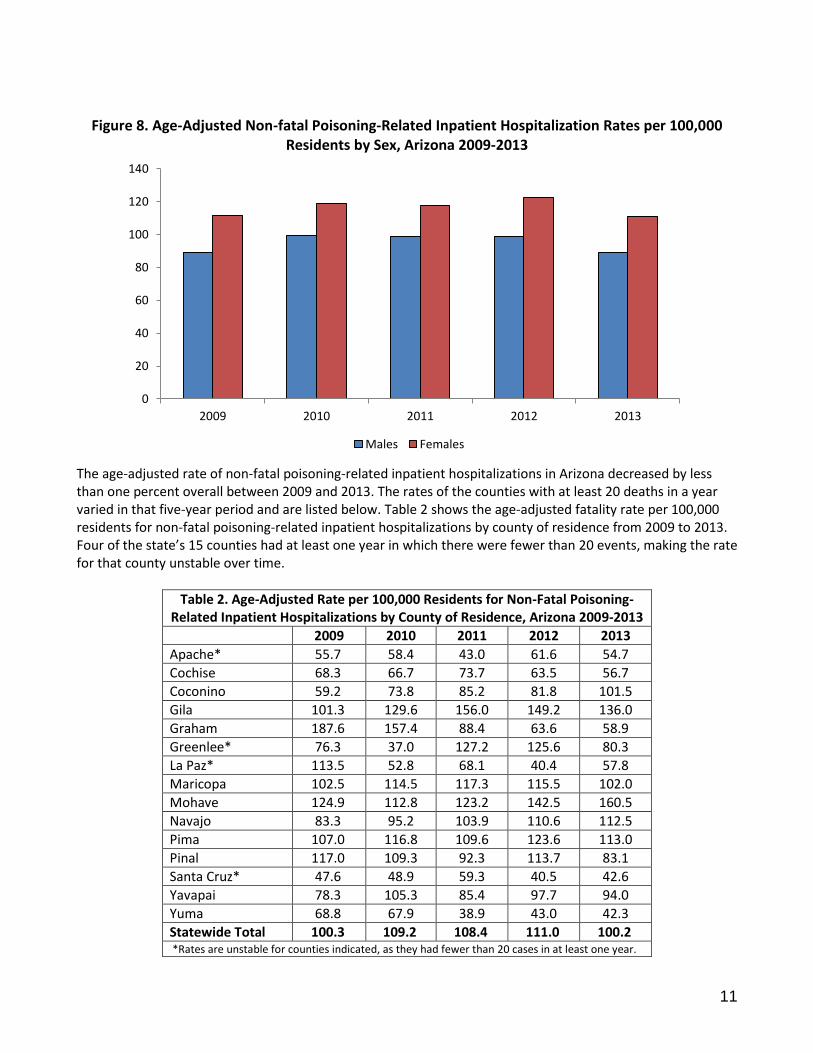
The rates for non-fatal poisoning-related inpatient hospitalizations were higher for females then for males. Rates increased from 2009 through 2012 but decreased again in 2013 among both males and females. Figure 8 shows the age-adjusted rates by sex for non-fatal poisoning-related inpatient hospitalizations from 2009 through 2013.
30.0
35.0
40.0
45.0
50.0
55.0
2009 2010 2011 2012 2013
Unintentional Suicide
11
Figure 8. Age-Adjusted Non-fatal Poisoning-Related Inpatient Hospitalization Rates per 100,000 Residents by Sex, Arizona 2009-2013
The age-adjusted rate of non-fatal poisoning-related inpatient hospitalizations in Arizona decreased by less than one percent overall between 2009 and 2013. The rates of the counties with at least 20 deaths in a year varied in that five-year period and are listed below. Table 2 shows the age-adjusted fatality rate per 100,000 residents for non-fatal poisoning-related inpatient hospitalizations by county of residence from 2009 to 2013. Four of the state’s 15 counties had at least one year in which there were fewer than 20 events, making the rate for that county unstable over time.
Table 2. Age-Adjusted Rate per 100,000 Residents for Non-Fatal Poisoning-Related Inpatient Hospitalizations by County of Residence, Arizona 2009-2013
2009 2010 2011 2012 2013
Apache* 55.7 58.4 43.0 61.6 54.7
Cochise 68.3 66.7 73.7 63.5 56.7
Coconino 59.2 73.8 85.2 81.8 101.5
Gila 101.3 129.6 156.0 149.2 136.0
Graham 187.6 157.4 88.4 63.6 58.9
Greenlee* 76.3 37.0 127.2 125.6 80.3
La Paz* 113.5 52.8 68.1 40.4 57.8
Maricopa 102.5 114.5 117.3 115.5 102.0
Mohave 124.9 112.8 123.2 142.5 160.5
Navajo 83.3 95.2 103.9 110.6 112.5
Pima 107.0 116.8 109.6 123.6 113.0
Pinal 117.0 109.3 92.3 113.7 83.1
Santa Cruz* 47.6 48.9 59.3 40.5 42.6
Yavapai 78.3 105.3 85.4 97.7 94.0
Yuma 68.8 67.9 38.9 43.0 42.3
Statewide Total 100.3 109.2 108.4 111.0 100.2 *Rates are unstable for counties indicated, as they had fewer than 20 cases in at least one year.
0
20
40
60
80
100
120
140
2009 2010 2011 2012 2013
Males Females
12
Poisoning-Related Mortality, 2013
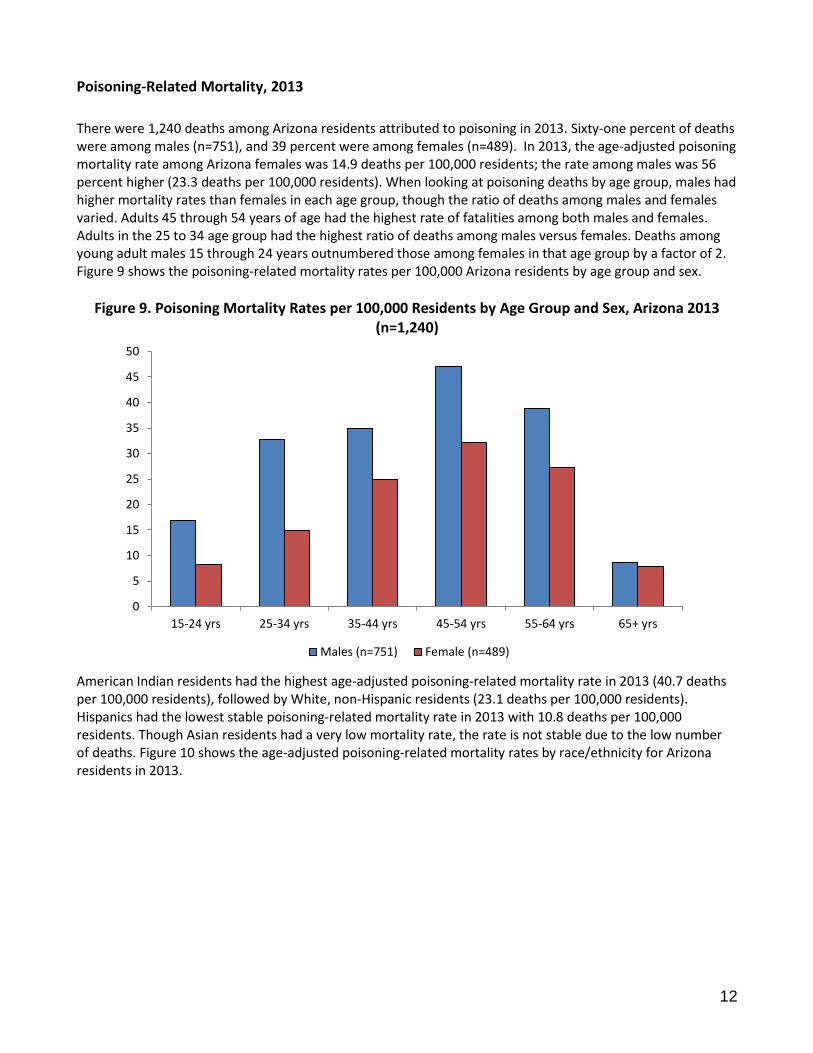
There were 1,240 deaths among Arizona residents attributed to poisoning in 2013. Sixty-one percent of deaths were among males (n=751), and 39 percent were among females (n=489). In 2013, the age-adjusted poisoning mortality rate among Arizona females was 14.9 deaths per 100,000 residents; the rate among males was 56 percent higher (23.3 deaths per 100,000 residents). When looking at poisoning deaths by age group, males had higher mortality rates than females in each age group, though the ratio of deaths among males and females varied. Adults 45 through 54 years of age had the highest rate of fatalities among both males and females. Adults in the 25 to 34 age group had the highest ratio of deaths among males versus females. Deaths among young adult males 15 through 24 years outnumbered those among females in that age group by a factor of 2. Figure 9 shows the poisoning-related mortality rates per 100,000 Arizona residents by age group and sex.
Figure 9. Poisoning Mortality Rates per 100,000 Residents by Age Group and Sex, Arizona 2013 (n=1,240)
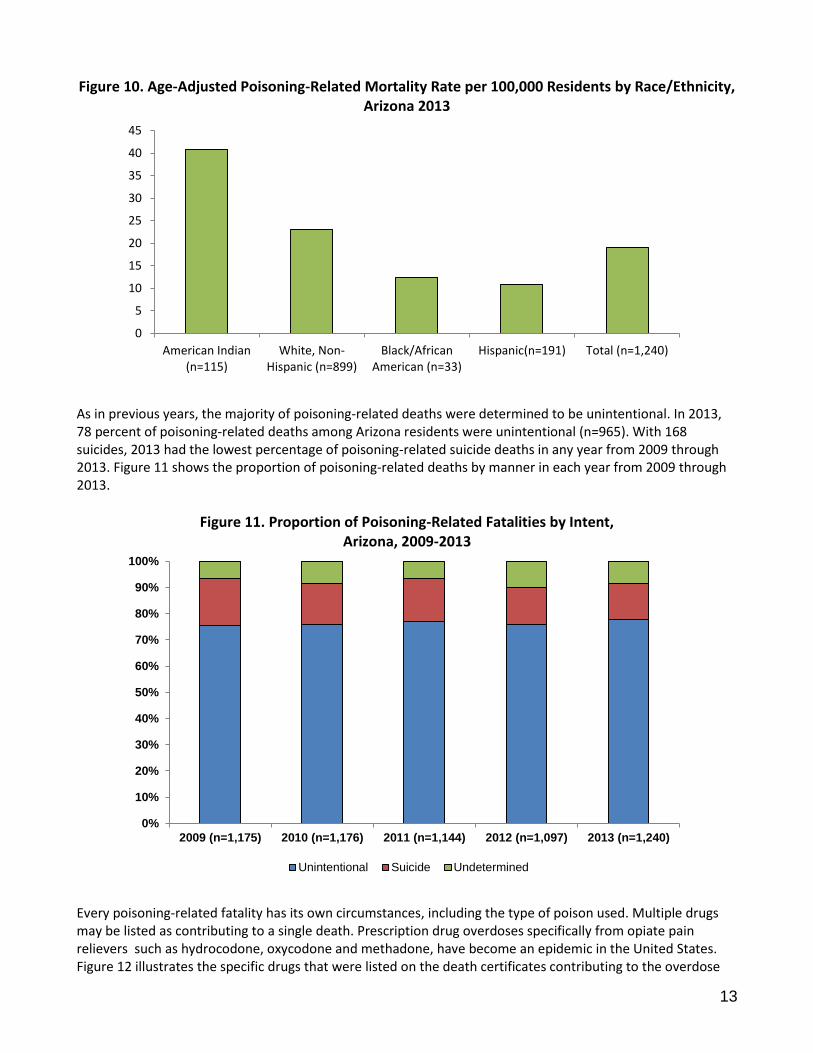
American Indian residents had the highest age-adjusted poisoning-related mortality rate in 2013 (40.7 deaths per 100,000 residents), followed by White, non-Hispanic residents (23.1 deaths per 100,000 residents). Hispanics had the lowest stable poisoning-related mortality rate in 2013 with 10.8 deaths per 100,000 residents. Though Asian residents had a very low mortality rate, the rate is not stable due to the low number of deaths. Figure 10 shows the age-adjusted poisoning-related mortality rates by race/ethnicity for Arizona residents in 2013.
0
5
10
15
20
25
30
35
40
45
50
15-24 yrs 25-34 yrs 35-44 yrs 45-54 yrs 55-64 yrs 65+ yrs
Males (n=751) Female (n=489)
13
Figure 10. Age-Adjusted Poisoning-Related Mortality Rate per 100,000 Residents by Race/Ethnicity, Arizona 2013
As in previous years, the majority of poisoning-related deaths were determined to be unintentional. In 2013, 78 percent of poisoning-related deaths among Arizona residents were unintentional (n=965). With 168 suicides, 2013 had the lowest percentage of poisoning-related suicide deaths in any year from 2009 through 2013. Figure 11 shows the proportion of poisoning-related deaths by manner in each year from 2009 through 2013.
Figure 11. Proportion of Poisoning-Related Fatalities by Intent, Arizona, 2009-2013
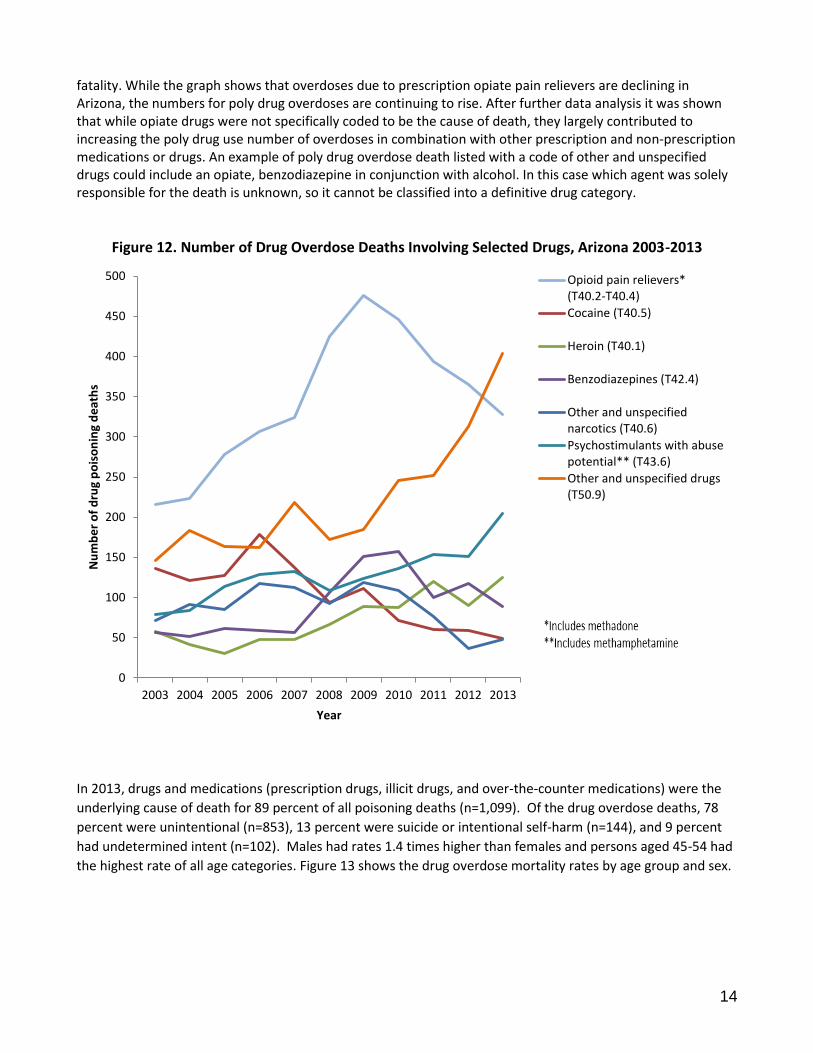
Every poisoning-related fatality has its own circumstances, including the type of poison used. Multiple drugs may be listed as contributing to a single death. Prescription drug overdoses specifically from opiate pain relievers such as hydrocodone, oxycodone and methadone, have become an epidemic in the United States. Figure 12 illustrates the specific drugs that were listed on the death certificates contributing to the overdose
0
5
10
15
20
25
30
35
40
45
American Indian(n=115)
White, Non-Hispanic (n=899)
Black/AfricanAmerican (n=33)
Hispanic(n=191) Total (n=1,240)
0%
10%
20%
30%
40%
50%
60%
70%
80%
90%
100%
2009 (n=1,175) 2010 (n=1,176) 2011 (n=1,144) 2012 (n=1,097) 2013 (n=1,240)
Unintentional Suicide Undetermined
14
fatality. While the graph shows that overdoses due to prescription opiate pain relievers are declining in Arizona, the numbers for poly drug overdoses are continuing to rise. After further data analysis it was shown that while opiate drugs were not specifically coded to be the cause of death, they largely contributed to increasing the poly drug use number of overdoses in combination with other prescription and non-prescription medications or drugs. An example of poly drug overdose death listed with a code of other and unspecified drugs could include an opiate, benzodiazepine in conjunction with alcohol. In this case which agent was solely responsible for the death is unknown, so it cannot be classified into a definitive drug category.
Figure 12. Number of Drug Overdose Deaths Involving Selected Drugs, Arizona 2003-2013
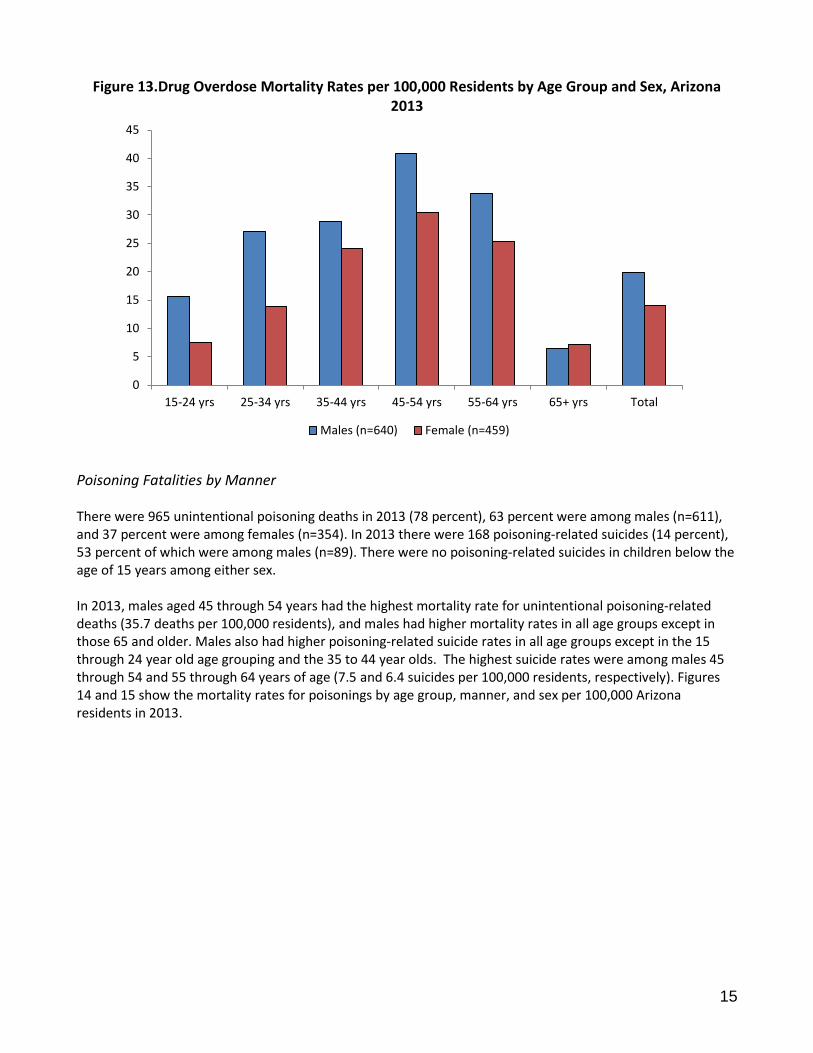
In 2013, drugs and medications (prescription drugs, illicit drugs, and over-the-counter medications) were the
underlying cause of death for 89 percent of all poisoning deaths (n=1,099). Of the drug overdose deaths, 78
percent were unintentional (n=853), 13 percent were suicide or intentional self-harm (n=144), and 9 percent
had undetermined intent (n=102). Males had rates 1.4 times higher than females and persons aged 45-54 had
the highest rate of all age categories. Figure 13 shows the drug overdose mortality rates by age group and sex.
0
50
100
150
200
250
300
350
400
450
500
2003 2004 2005 2006 2007 2008 2009 2010 2011 2012 2013
Nu
mb
er
of
dru
g p
ois
on
ing
de
ath
s
Year
Opioid pain relievers*(T40.2-T40.4)
Cocaine (T40.5)
Heroin (T40.1)
Benzodiazepines (T42.4)
Other and unspecifiednarcotics (T40.6)
Psychostimulants with abusepotential** (T43.6)
Other and unspecified drugs(T50.9)
15
Figure 13.Drug Overdose Mortality Rates per 100,000 Residents by Age Group and Sex, Arizona 2013
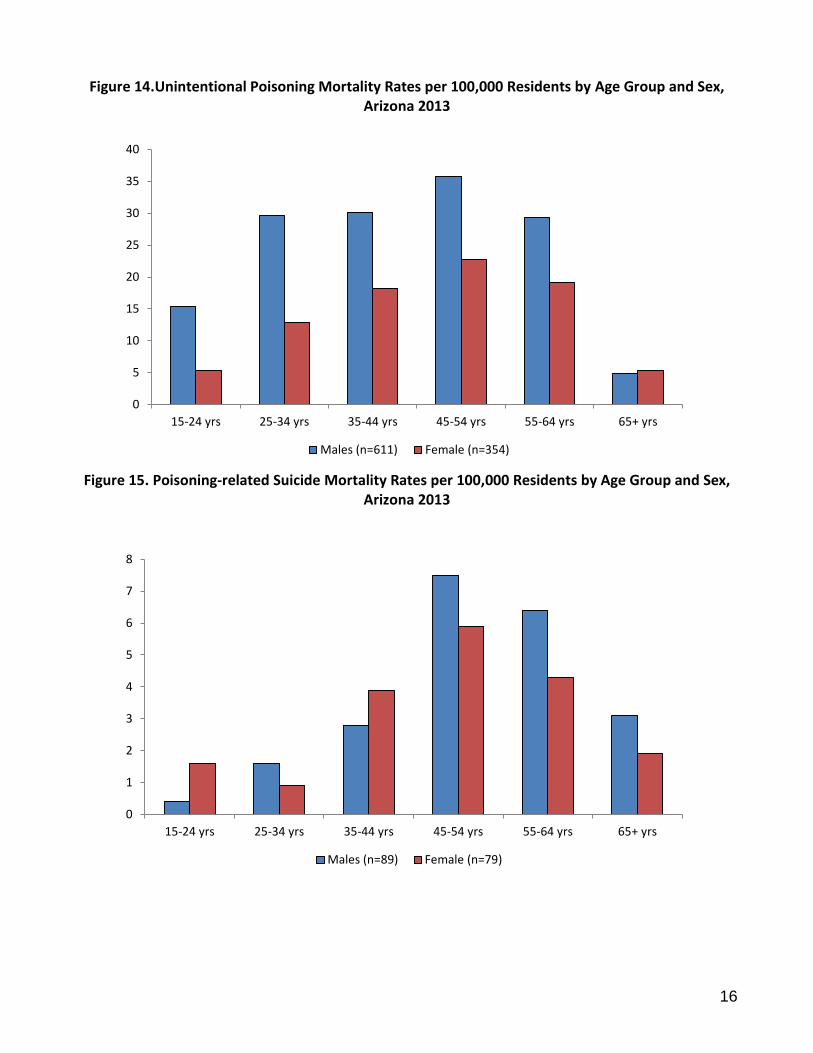
Poisoning Fatalities by Manner There were 965 unintentional poisoning deaths in 2013 (78 percent), 63 percent were among males (n=611), and 37 percent were among females (n=354). In 2013 there were 168 poisoning-related suicides (14 percent), 53 percent of which were among males (n=89). There were no poisoning-related suicides in children below the age of 15 years among either sex. In 2013, males aged 45 through 54 years had the highest mortality rate for unintentional poisoning-related deaths (35.7 deaths per 100,000 residents), and males had higher mortality rates in all age groups except in those 65 and older. Males also had higher poisoning-related suicide rates in all age groups except in the 15 through 24 year old age grouping and the 35 to 44 year olds. The highest suicide rates were among males 45 through 54 and 55 through 64 years of age (7.5 and 6.4 suicides per 100,000 residents, respectively). Figures 14 and 15 show the mortality rates for poisonings by age group, manner, and sex per 100,000 Arizona residents in 2013.
0
5
10
15
20
25
30
35
40
45
15-24 yrs 25-34 yrs 35-44 yrs 45-54 yrs 55-64 yrs 65+ yrs Total
Males (n=640) Female (n=459)
16
Figure 14.Unintentional Poisoning Mortality Rates per 100,000 Residents by Age Group and Sex, Arizona 2013
Figure 15. Poisoning-related Suicide Mortality Rates per 100,000 Residents by Age Group and Sex,
Arizona 2013
0
5
10
15
20
25
30
35
40
15-24 yrs 25-34 yrs 35-44 yrs 45-54 yrs 55-64 yrs 65+ yrs
Males (n=611) Female (n=354)
0
1
2
3
4
5
6
7
8
15-24 yrs 25-34 yrs 35-44 yrs 45-54 yrs 55-64 yrs 65+ yrs
Males (n=89) Female (n=79)
17
Non-Fatal Poisoning-Related Inpatient Hospitalizations, 2013
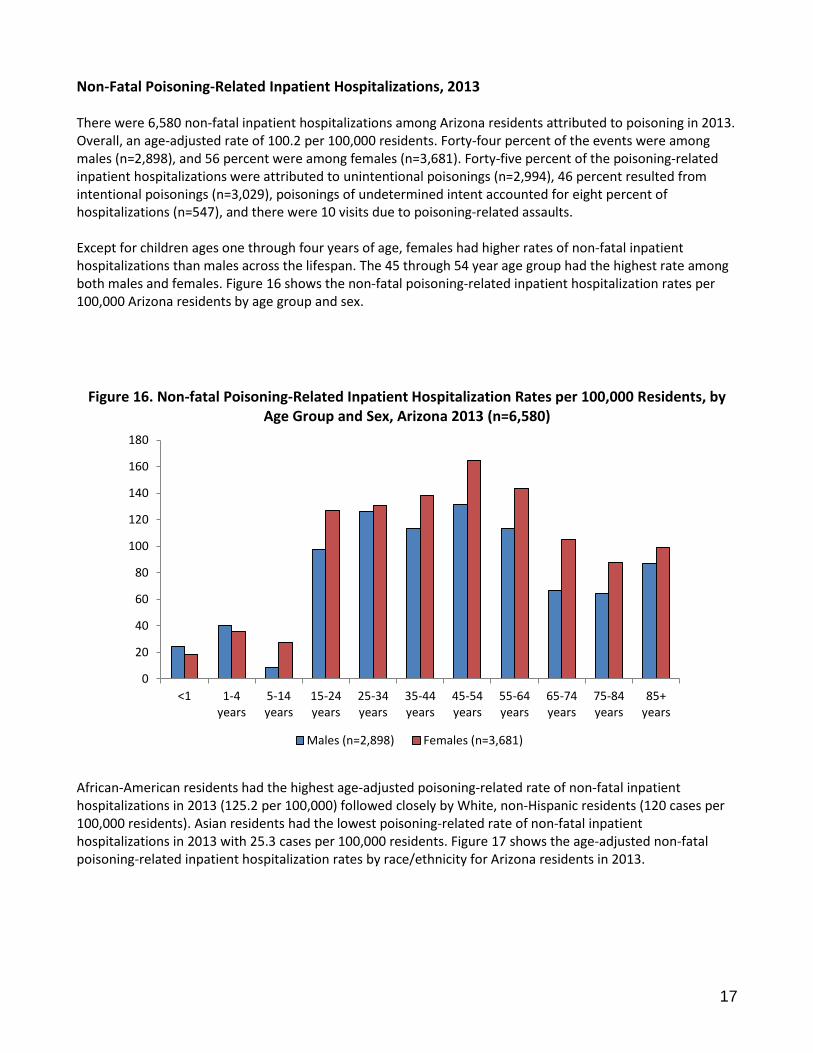
There were 6,580 non-fatal inpatient hospitalizations among Arizona residents attributed to poisoning in 2013. Overall, an age-adjusted rate of 100.2 per 100,000 residents. Forty-four percent of the events were among males (n=2,898), and 56 percent were among females (n=3,681). Forty-five percent of the poisoning-related inpatient hospitalizations were attributed to unintentional poisonings (n=2,994), 46 percent resulted from intentional poisonings (n=3,029), poisonings of undetermined intent accounted for eight percent of hospitalizations (n=547), and there were 10 visits due to poisoning-related assaults. Except for children ages one through four years of age, females had higher rates of non-fatal inpatient hospitalizations than males across the lifespan. The 45 through 54 year age group had the highest rate among both males and females. Figure 16 shows the non-fatal poisoning-related inpatient hospitalization rates per 100,000 Arizona residents by age group and sex.
Figure 16. Non-fatal Poisoning-Related Inpatient Hospitalization Rates per 100,000 Residents, by Age Group and Sex, Arizona 2013 (n=6,580)
African-American residents had the highest age-adjusted poisoning-related rate of non-fatal inpatient hospitalizations in 2013 (125.2 per 100,000) followed closely by White, non-Hispanic residents (120 cases per 100,000 residents). Asian residents had the lowest poisoning-related rate of non-fatal inpatient hospitalizations in 2013 with 25.3 cases per 100,000 residents. Figure 17 shows the age-adjusted non-fatal poisoning-related inpatient hospitalization rates by race/ethnicity for Arizona residents in 2013.
0
20
40
60
80
100
120
140
160
180
<1 1-4years
5-14years
15-24years
25-34years
35-44years
45-54years
55-64years
65-74years
75-84years
85+years
Males (n=2,898) Females (n=3,681)

18
Figure 17. Age-Adjusted Non-Fatal Poisoning-Related Inpatient Hospitalization Rate per 100,000 by Race/Ethnicity, Arizona 2013
There were 99 hospitalizations among individuals of other or unknown race/ethnicity.
Mohave County had the highest rate of inpatient hospitalizations for non-fatal poisonings in 2013, with 160.5 cases per 100,000 county residents. Followed by Gila County with 136.0 inpatient hospitalizations per 100,000 residents. The rate of non-fatal poisoning-related inpatient hospitalizations were distributed among residents of Arizona’s counties as shown in Figure 18.
Figure 18. Age-adjusted Non-Fatal Poisoning-Related Inpatient Hospitalization Rates per 100,000 Residents by County, Arizona 2013*
*Only Counties with 20 or more records were included in graph; Does not include 3 cases with unknown county information
Among all manners of non-fatal poisoning-related inpatient hospitalization, 94 percent were due to overdoses of a drug or medication. This percentage includes both prescription and non-prescription drugs. Unfortunately, the lack of specificity in the data on drug type makes further analysis impossible for 2013 data.
0
20
40
60
80
100
120
140
Black/AfricanAmerican(n=343)
White, non-Hispanic
(n=4,652)
AmericanIndian (n=301)
Hispanic(n=1,134)
Asian/PacificIslander (n=51)
All ethnicities(n=6,580)
0
20
40
60
80
100
120
140
160
180
19
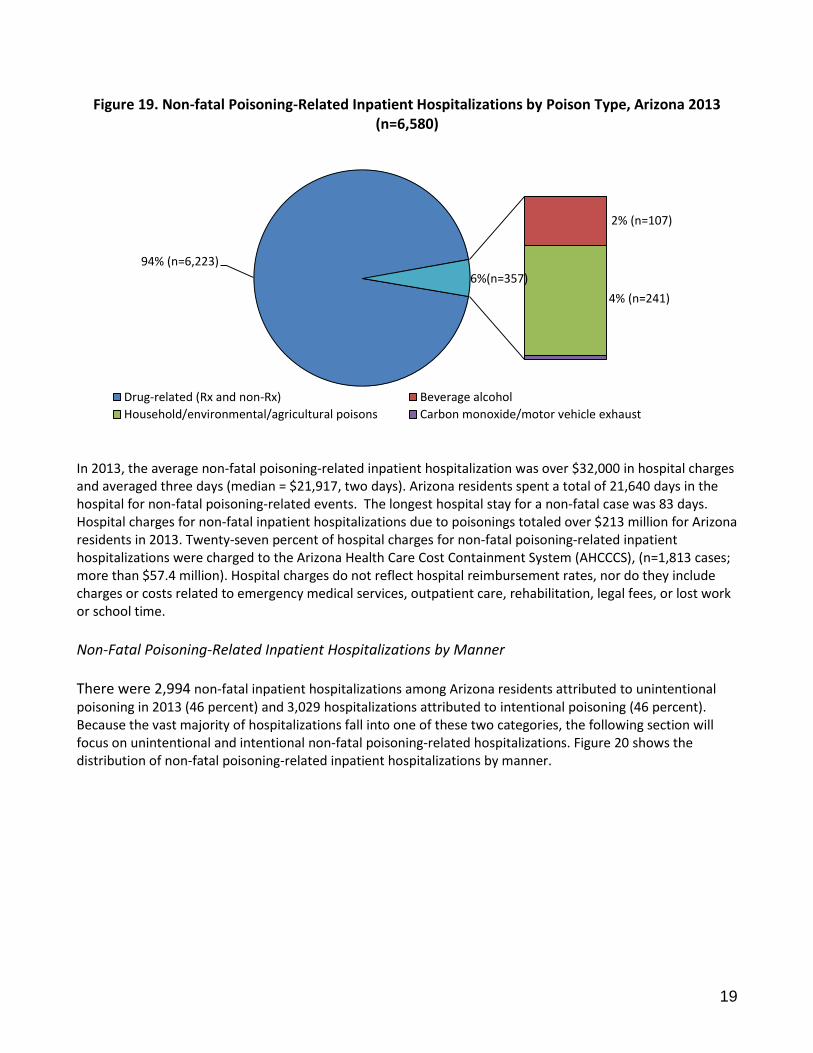
Figure 19. Non-fatal Poisoning-Related Inpatient Hospitalizations by Poison Type, Arizona 2013 (n=6,580)
In 2013, the average non-fatal poisoning-related inpatient hospitalization was over $32,000 in hospital charges and averaged three days (median = $21,917, two days). Arizona residents spent a total of 21,640 days in the hospital for non-fatal poisoning-related events. The longest hospital stay for a non-fatal case was 83 days. Hospital charges for non-fatal inpatient hospitalizations due to poisonings totaled over $213 million for Arizona residents in 2013. Twenty-seven percent of hospital charges for non-fatal poisoning-related inpatient hospitalizations were charged to the Arizona Health Care Cost Containment System (AHCCCS), (n=1,813 cases; more than $57.4 million). Hospital charges do not reflect hospital reimbursement rates, nor do they include charges or costs related to emergency medical services, outpatient care, rehabilitation, legal fees, or lost work or school time.
Non-Fatal Poisoning-Related Inpatient Hospitalizations by Manner There were 2,994 non-fatal inpatient hospitalizations among Arizona residents attributed to unintentional poisoning in 2013 (46 percent) and 3,029 hospitalizations attributed to intentional poisoning (46 percent). Because the vast majority of hospitalizations fall into one of these two categories, the following section will focus on unintentional and intentional non-fatal poisoning-related hospitalizations. Figure 20 shows the distribution of non-fatal poisoning-related inpatient hospitalizations by manner.
94% (n=6,223)
2% (n=107)
4% (n=241)
6%(n=357)
Drug-related (Rx and non-Rx) Beverage alcohol
Household/environmental/agricultural poisons Carbon monoxide/motor vehicle exhaust
20
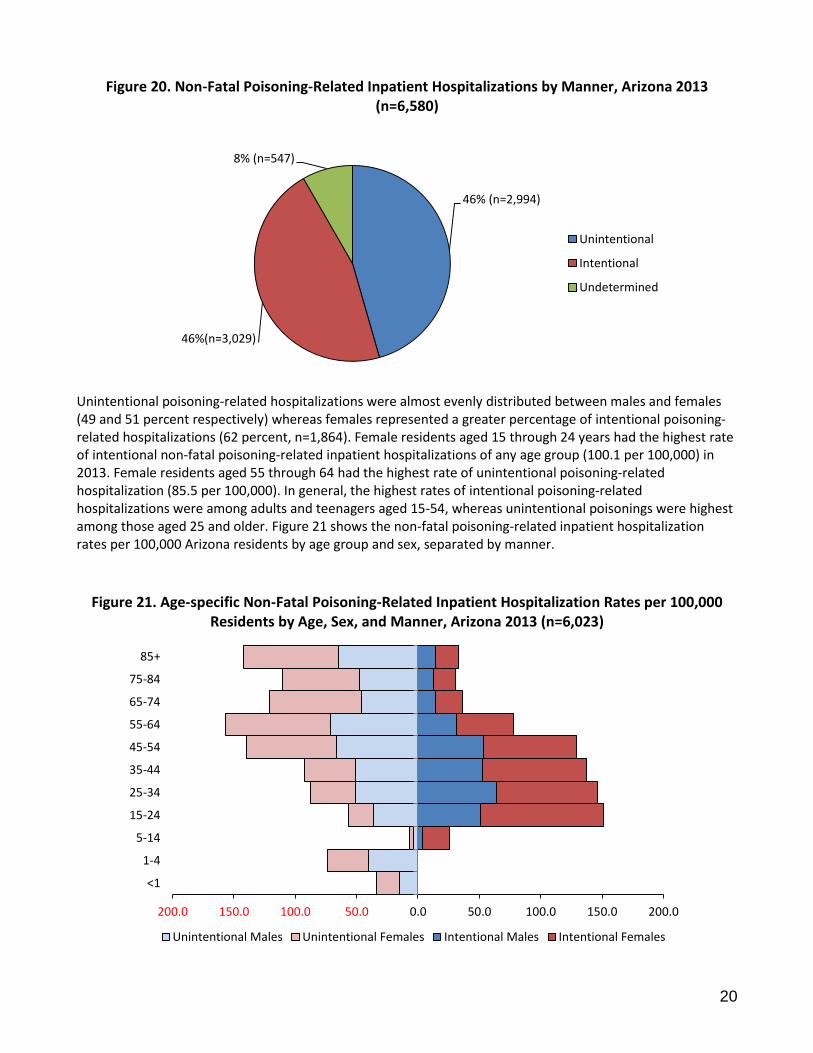
Figure 20. Non-Fatal Poisoning-Related Inpatient Hospitalizations by Manner, Arizona 2013 (n=6,580)
Unintentional poisoning-related hospitalizations were almost evenly distributed between males and females (49 and 51 percent respectively) whereas females represented a greater percentage of intentional poisoning-related hospitalizations (62 percent, n=1,864). Female residents aged 15 through 24 years had the highest rate of intentional non-fatal poisoning-related inpatient hospitalizations of any age group (100.1 per 100,000) in 2013. Female residents aged 55 through 64 had the highest rate of unintentional poisoning-related hospitalization (85.5 per 100,000). In general, the highest rates of intentional poisoning-related hospitalizations were among adults and teenagers aged 15-54, whereas unintentional poisonings were highest among those aged 25 and older. Figure 21 shows the non-fatal poisoning-related inpatient hospitalization rates per 100,000 Arizona residents by age group and sex, separated by manner.
Figure 21. Age-specific Non-Fatal Poisoning-Related Inpatient Hospitalization Rates per 100,000 Residents by Age, Sex, and Manner, Arizona 2013 (n=6,023)
46% (n=2,994)
46%(n=3,029)
8% (n=547)
Unintentional
Intentional
Undetermined
200.0 150.0 100.0 50.0 0.0 50.0 100.0 150.0 200.0
<1
1-4
5-14
15-24
25-34
35-44
45-54
55-64
65-74
75-84
85+
Unintentional Males Unintentional Females Intentional Males Intentional Females
21
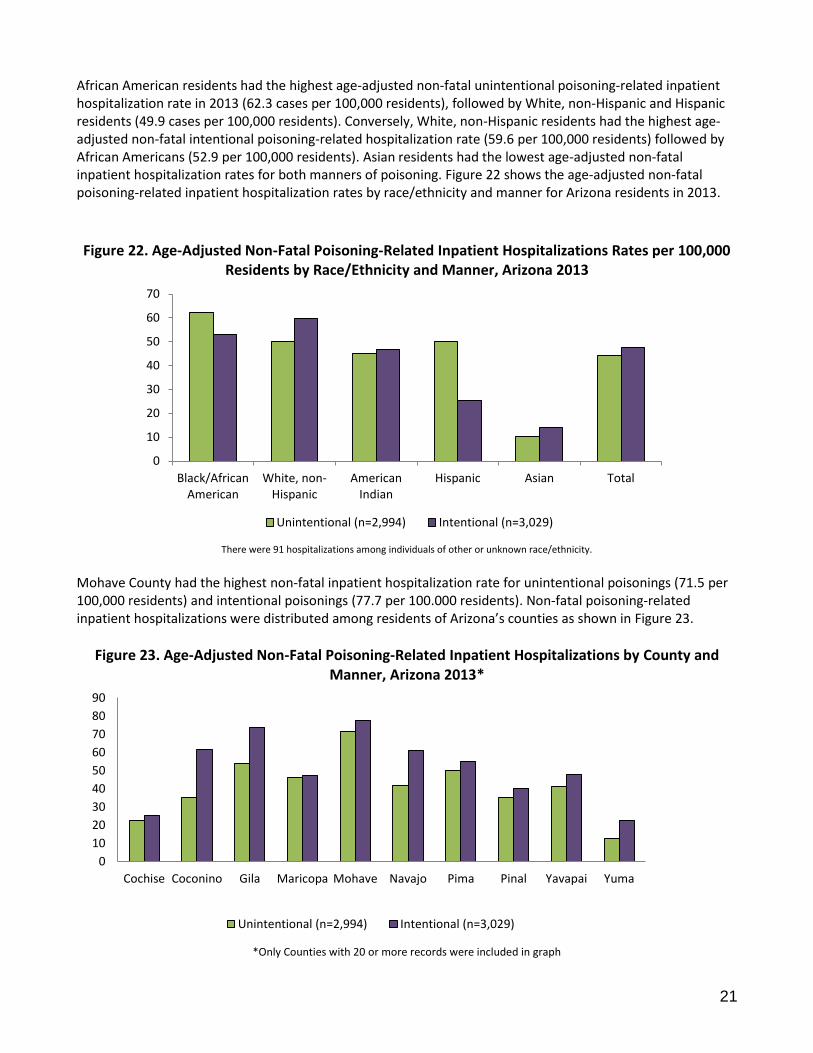
African American residents had the highest age-adjusted non-fatal unintentional poisoning-related inpatient hospitalization rate in 2013 (62.3 cases per 100,000 residents), followed by White, non-Hispanic and Hispanic residents (49.9 cases per 100,000 residents). Conversely, White, non-Hispanic residents had the highest age-adjusted non-fatal intentional poisoning-related hospitalization rate (59.6 per 100,000 residents) followed by African Americans (52.9 per 100,000 residents). Asian residents had the lowest age-adjusted non-fatal inpatient hospitalization rates for both manners of poisoning. Figure 22 shows the age-adjusted non-fatal poisoning-related inpatient hospitalization rates by race/ethnicity and manner for Arizona residents in 2013.
Figure 22. Age-Adjusted Non-Fatal Poisoning-Related Inpatient Hospitalizations Rates per 100,000 Residents by Race/Ethnicity and Manner, Arizona 2013
There were 91 hospitalizations among individuals of other or unknown race/ethnicity.
Mohave County had the highest non-fatal inpatient hospitalization rate for unintentional poisonings (71.5 per 100,000 residents) and intentional poisonings (77.7 per 100.000 residents). Non-fatal poisoning-related inpatient hospitalizations were distributed among residents of Arizona’s counties as shown in Figure 23.
Figure 23. Age-Adjusted Non-Fatal Poisoning-Related Inpatient Hospitalizations by County and Manner, Arizona 2013*
*Only Counties with 20 or more records were included in graph
0
10
20
30
40
50
60
70
Black/AfricanAmerican
White, non-Hispanic
AmericanIndian
Hispanic Asian Total
Unintentional (n=2,994) Intentional (n=3,029)
0
10
20
30
40
50
60
70
80
90
Cochise Coconino Gila Maricopa Mohave Navajo Pima Pinal Yavapai Yuma
Unintentional (n=2,994) Intentional (n=3,029)
22
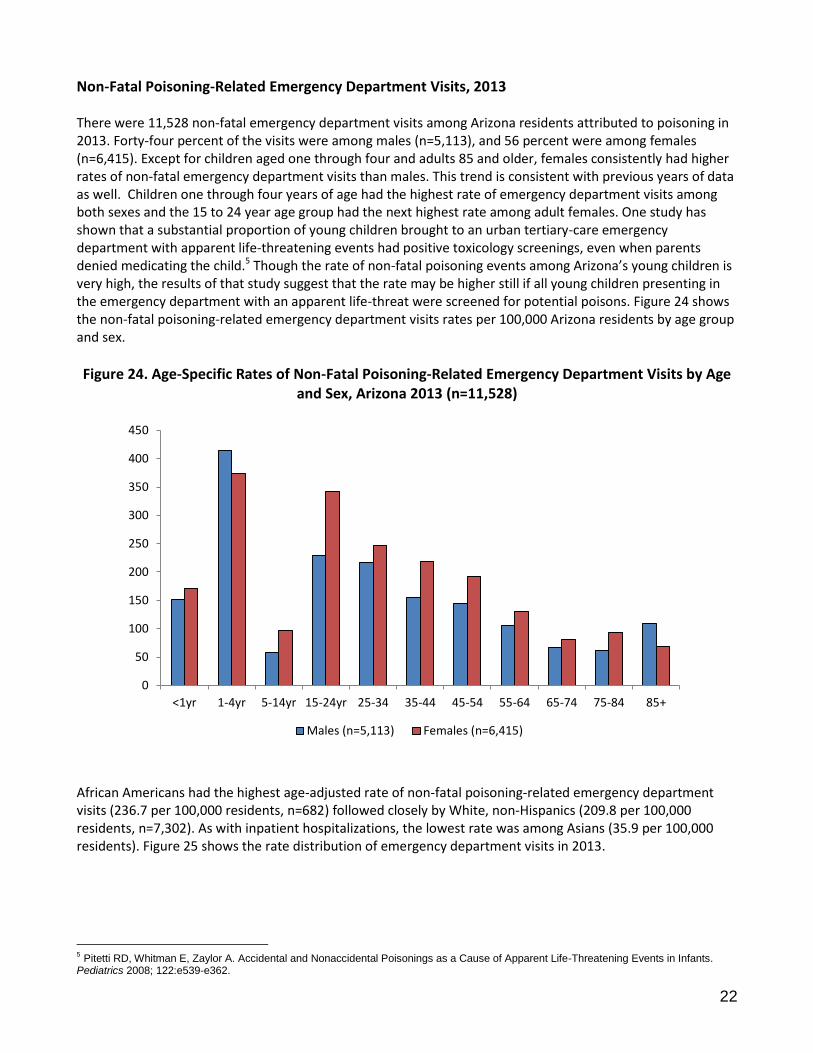
Non-Fatal Poisoning-Related Emergency Department Visits, 2013 There were 11,528 non-fatal emergency department visits among Arizona residents attributed to poisoning in 2013. Forty-four percent of the visits were among males (n=5,113), and 56 percent were among females (n=6,415). Except for children aged one through four and adults 85 and older, females consistently had higher rates of non-fatal emergency department visits than males. This trend is consistent with previous years of data as well. Children one through four years of age had the highest rate of emergency department visits among both sexes and the 15 to 24 year age group had the next highest rate among adult females. One study has shown that a substantial proportion of young children brought to an urban tertiary-care emergency department with apparent life-threatening events had positive toxicology screenings, even when parents denied medicating the child.5 Though the rate of non-fatal poisoning events among Arizona’s young children is very high, the results of that study suggest that the rate may be higher still if all young children presenting in the emergency department with an apparent life-threat were screened for potential poisons. Figure 24 shows the non-fatal poisoning-related emergency department visits rates per 100,000 Arizona residents by age group and sex.
Figure 24. Age-Specific Rates of Non-Fatal Poisoning-Related Emergency Department Visits by Age and Sex, Arizona 2013 (n=11,528)
African Americans had the highest age-adjusted rate of non-fatal poisoning-related emergency department visits (236.7 per 100,000 residents, n=682) followed closely by White, non-Hispanics (209.8 per 100,000 residents, n=7,302). As with inpatient hospitalizations, the lowest rate was among Asians (35.9 per 100,000 residents). Figure 25 shows the rate distribution of emergency department visits in 2013.
5 Pitetti RD, Whitman E, Zaylor A. Accidental and Nonaccidental Poisonings as a Cause of Apparent Life-Threatening Events in Infants. Pediatrics 2008; 122:e539-e362.
0
50
100
150
200
250
300
350
400
450
<1yr 1-4yr 5-14yr 15-24yr 25-34 35-44 45-54 55-64 65-74 75-84 85+
Males (n=5,113) Females (n=6,415)
23
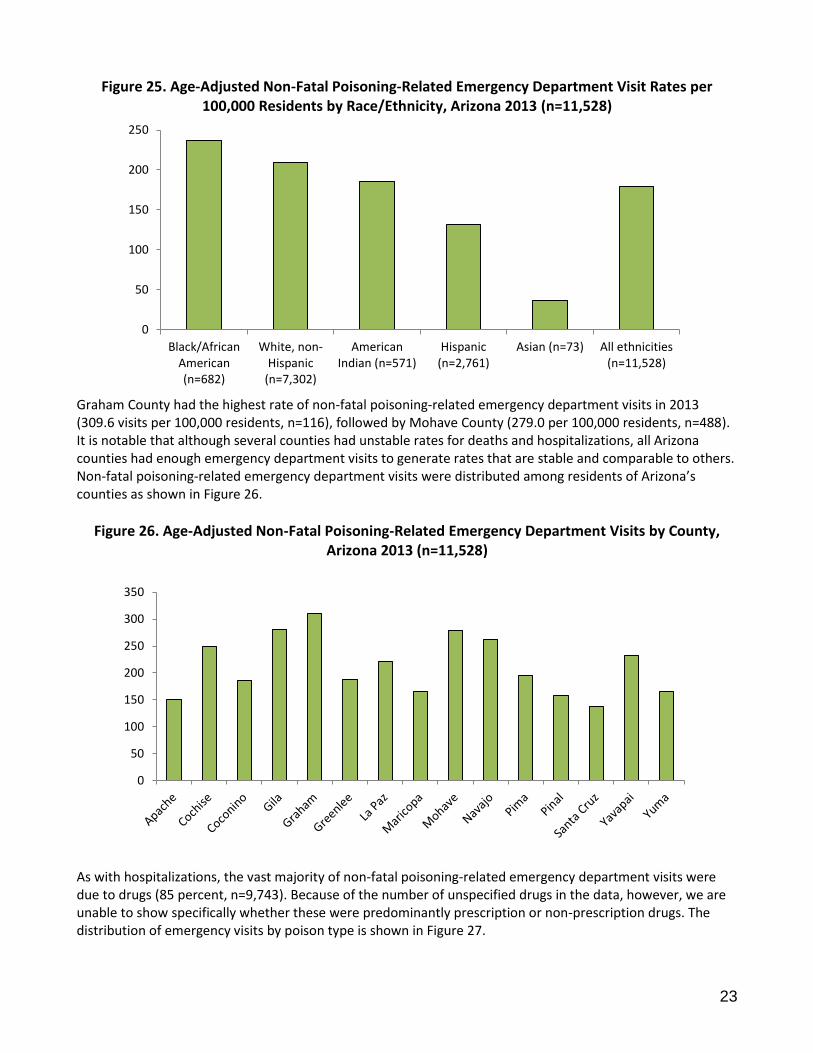
Figure 25. Age-Adjusted Non-Fatal Poisoning-Related Emergency Department Visit Rates per 100,000 Residents by Race/Ethnicity, Arizona 2013 (n=11,528)
Graham County had the highest rate of non-fatal poisoning-related emergency department visits in 2013 (309.6 visits per 100,000 residents, n=116), followed by Mohave County (279.0 per 100,000 residents, n=488). It is notable that although several counties had unstable rates for deaths and hospitalizations, all Arizona counties had enough emergency department visits to generate rates that are stable and comparable to others. Non-fatal poisoning-related emergency department visits were distributed among residents of Arizona’s counties as shown in Figure 26.
Figure 26. Age-Adjusted Non-Fatal Poisoning-Related Emergency Department Visits by County, Arizona 2013 (n=11,528)
As with hospitalizations, the vast majority of non-fatal poisoning-related emergency department visits were due to drugs (85 percent, n=9,743). Because of the number of unspecified drugs in the data, however, we are unable to show specifically whether these were predominantly prescription or non-prescription drugs. The distribution of emergency visits by poison type is shown in Figure 27.
0
50
100
150
200
250
Black/AfricanAmerican(n=682)
White, non-Hispanic
(n=7,302)
AmericanIndian (n=571)
Hispanic(n=2,761)
Asian (n=73) All ethnicities(n=11,528)
0
50
100
150
200
250
300
350
24
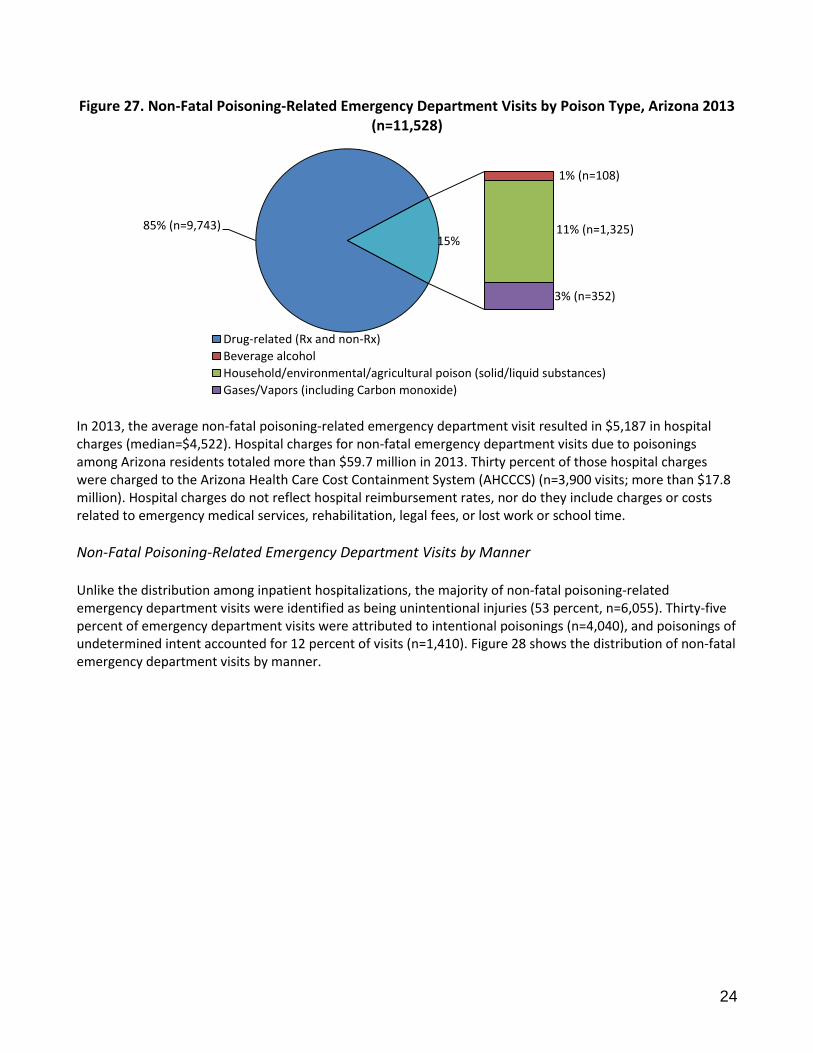
Figure 27. Non-Fatal Poisoning-Related Emergency Department Visits by Poison Type, Arizona 2013
(n=11,528)
In 2013, the average non-fatal poisoning-related emergency department visit resulted in $5,187 in hospital charges (median=$4,522). Hospital charges for non-fatal emergency department visits due to poisonings among Arizona residents totaled more than $59.7 million in 2013. Thirty percent of those hospital charges were charged to the Arizona Health Care Cost Containment System (AHCCCS) (n=3,900 visits; more than $17.8 million). Hospital charges do not reflect hospital reimbursement rates, nor do they include charges or costs related to emergency medical services, rehabilitation, legal fees, or lost work or school time.
Non-Fatal Poisoning-Related Emergency Department Visits by Manner Unlike the distribution among inpatient hospitalizations, the majority of non-fatal poisoning-related emergency department visits were identified as being unintentional injuries (53 percent, n=6,055). Thirty-five percent of emergency department visits were attributed to intentional poisonings (n=4,040), and poisonings of undetermined intent accounted for 12 percent of visits (n=1,410). Figure 28 shows the distribution of non-fatal emergency department visits by manner.
85% (n=9,743)
1% (n=108)
11% (n=1,325)
3% (n=352)
15%
Drug-related (Rx and non-Rx)
Beverage alcohol
Household/environmental/agricultural poison (solid/liquid substances)
Gases/Vapors (including Carbon monoxide)
25
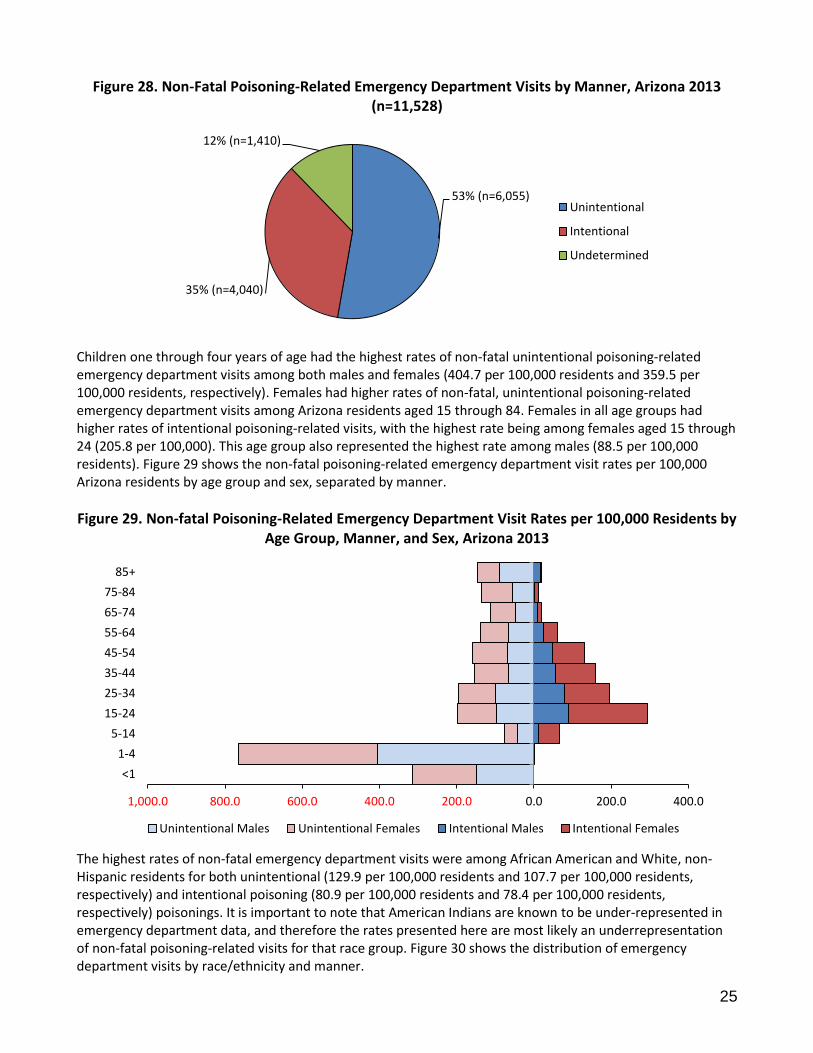
Figure 28. Non-Fatal Poisoning-Related Emergency Department Visits by Manner, Arizona 2013 (n=11,528)
Children one through four years of age had the highest rates of non-fatal unintentional poisoning-related emergency department visits among both males and females (404.7 per 100,000 residents and 359.5 per 100,000 residents, respectively). Females had higher rates of non-fatal, unintentional poisoning-related emergency department visits among Arizona residents aged 15 through 84. Females in all age groups had higher rates of intentional poisoning-related visits, with the highest rate being among females aged 15 through 24 (205.8 per 100,000). This age group also represented the highest rate among males (88.5 per 100,000 residents). Figure 29 shows the non-fatal poisoning-related emergency department visit rates per 100,000 Arizona residents by age group and sex, separated by manner.
Figure 29. Non-fatal Poisoning-Related Emergency Department Visit Rates per 100,000 Residents by Age Group, Manner, and Sex, Arizona 2013
The highest rates of non-fatal emergency department visits were among African American and White, non-Hispanic residents for both unintentional (129.9 per 100,000 residents and 107.7 per 100,000 residents, respectively) and intentional poisoning (80.9 per 100,000 residents and 78.4 per 100,000 residents, respectively) poisonings. It is important to note that American Indians are known to be under-represented in emergency department data, and therefore the rates presented here are most likely an underrepresentation of non-fatal poisoning-related visits for that race group. Figure 30 shows the distribution of emergency department visits by race/ethnicity and manner.
53% (n=6,055)
35% (n=4,040)
12% (n=1,410)
Unintentional
Intentional
Undetermined
1,000.0 800.0 600.0 400.0 200.0 0.0 200.0 400.0
<1
1-4
5-14
15-24
25-34
35-44
45-54
55-64
65-74
75-84
85+
Unintentional Males Unintentional Females Intentional Males Intentional Females
26
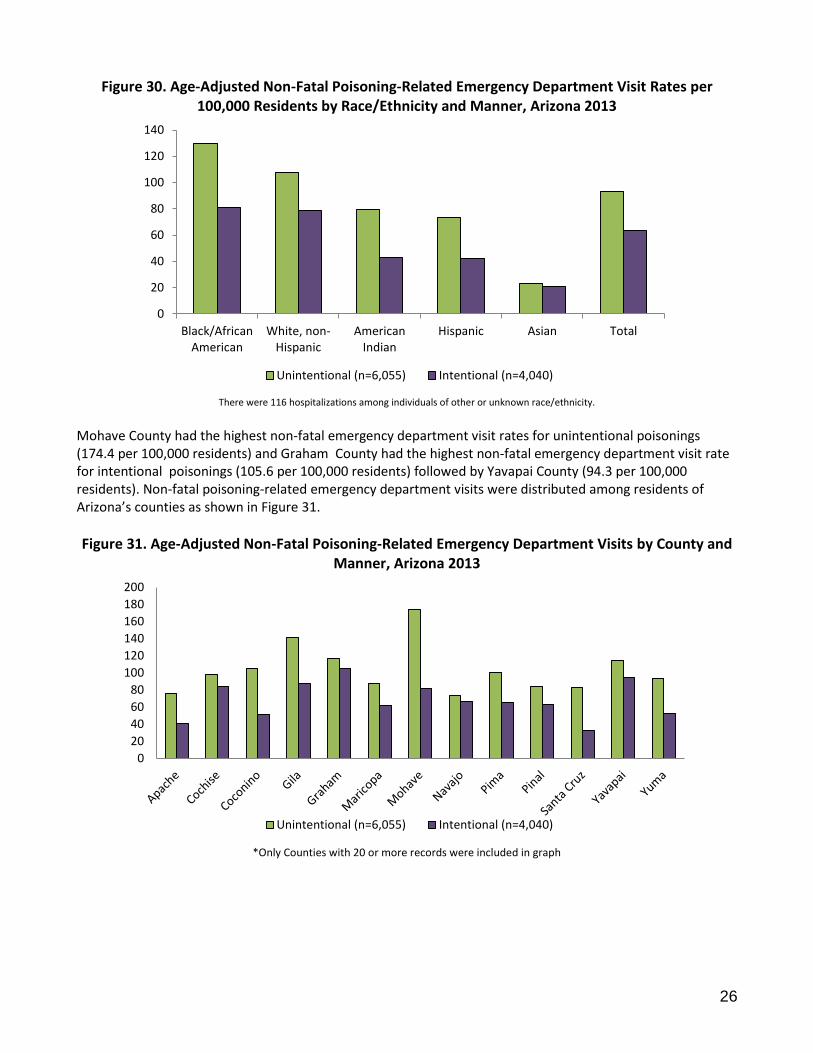
Figure 30. Age-Adjusted Non-Fatal Poisoning-Related Emergency Department Visit Rates per 100,000 Residents by Race/Ethnicity and Manner, Arizona 2013
There were 116 hospitalizations among individuals of other or unknown race/ethnicity.
Mohave County had the highest non-fatal emergency department visit rates for unintentional poisonings (174.4 per 100,000 residents) and Graham County had the highest non-fatal emergency department visit rate for intentional poisonings (105.6 per 100,000 residents) followed by Yavapai County (94.3 per 100,000 residents). Non-fatal poisoning-related emergency department visits were distributed among residents of Arizona’s counties as shown in Figure 31.
Figure 31. Age-Adjusted Non-Fatal Poisoning-Related Emergency Department Visits by County and Manner, Arizona 2013
*Only Counties with 20 or more records were included in graph
0
20
40
60
80
100
120
140
Black/AfricanAmerican
White, non-Hispanic
AmericanIndian
Hispanic Asian Total
Unintentional (n=6,055) Intentional (n=4,040)
0
20
40
60
80
100
120
140
160
180
200
Unintentional (n=6,055) Intentional (n=4,040)
27
Poisoning and Prescription Drug Overdoses as an Arizona Public Health Concern
Deaths
In 2013, poisoning was the leading cause of injury-related deaths (26 percent) accounting for more deaths among Arizonans than car crashes, falls, or firearm injuries.
Between 2009 and 2013, the age-adjusted poisoning-related mortality rate increased five percent for Arizona residents, due largely to increases in unintentional poisoning rates.
Drugs (prescription, non-prescription and illicit) were responsible for 89 percent of poisoning-related deaths. The poisons most commonly specified on death certificates in 2013 were pharmaceutical opioids (n=328), alcohol (n=241), and methamphetamine or other stimulants (n=205). Heroin was listed in 10 percent of cases (n=125).
In 2013, as in previous years, poisoning-related fatality rates were highest among American Indian (40.7 per 100,000 residents) and White, non-Hispanic Arizonans (23.1 per 100,000 residents).
Non-Fatal Hospitalizations and Emergency Department Visits
Between 2009 and 2013, the overall age-adjusted rate of non-fatal poisoning-related inpatient hospitalizations among Arizona residents decreased less than 1/10
th percent, from 100.3 cases per 100,000 residents in 2009 to
100.2 cases in 2013.
Adult women had the highest rates of non-fatal poisoning-related inpatient hospitalizations. Females 45 through 54 years of age had a rate of 164.9 cases per 100,000 residents, and females 55 through 64 years of age had a rate of 143.5 cases per 100,000 residents.
In 2013, there were 11,528 non-fatal poisoning-related emergency department visits among Arizona residents.
The highest rates of emergency department visits were among male and female children one through four years of age (413.6 per 100,000 for males, 373.4 per 100,000 for females). These rates represent a 4 percent decrease for males and 5 percent decrease for females since 2012.
Hospital charges for non-fatal poisoning-related inpatient hospitalizations totaled more than $213 million in 2013, and Arizona residents spent a total of 21,640 days hospitalized for non-fatal poisonings. Hospital charges for non-fatal poisoning-related emergency department visits totaled over $59.7 million in 2013.
Arizona’s Response Arizona’s Prescription Drug Misuse and Abuse Initiative (http://www.azcjc.gov/acjc.web/rx/default.aspx), which
began in 2012, has multi-faceted strategies at both the state and community level to address prescription drug abuse:
o Patient and provider education: The Arizona Opioid Prescribing Guidelines for the treatment of acute
pain and chronic non-terminal pain were published in November of 2014.
http://azdhs.gov/clinicians/clinical-guidelines-recommendations/index.php?pg=prescribing. The Arizona
Guidelines for Emergency Department Controlled Substance Prescribing were developed in 2012.
Arizona has two nationally affiliated poison control centers providing education and drug exposure
response throughout the state.
o Prescription monitoring: Arizona’s Controlled Substances Prescription Monitoring Program is managed by the Arizona State Board of Pharmacy. Dispensing pharmacies and practitioners are required under Arizona law to report information on Schedule II, III, and IV prescriptions to the database. (http://www.azpharmacy.gov/CS-Rx_Monitoring/aboutpmp.asp)
o Drug disposal: Since 2008, sites throughout Arizona have offered drug drop-off services as both individual and ongoing events. These efforts have been expanded in 2013 under the Prescription Drug Reduction Initiative.
Arizona’s Early Childhood home visitors provide education to young families, teaching them to avoid accidental poisoning and providing resources to mitigate the harm.
28
Poisoning Prevention Tips and Resources
Call 1-800-222-1222 to be connected to a local Poison Control Center. You can prevent poisonings!
Store household cleaners in their original containers, away from children o Pills, vitamins, antifreeze, nail polish remover, or insecticide may look similar to
children’s candy or beverages. Teach children not to eat or drink something without first asking an adult.
o Teach children to identify medication, and don’t refer to pills as ‘candy’.
Identify poisonous plants around your home and remove from children’s reach o Visit the Cornell University Department of Animal Science website on poisonous plants
at http://www.ansci.cornell.edu/plants or contact your local PCC to learn about poisonous plants.
Read the label and follow directions for using household products or medications
Check with your doctor or pharmacist to prevent dangerous medication interactions
Properly discard unused, unneeded, or expired medication o Look for drug disposal events in your community. These provide a safe, easy way to
responsibly get rid of unneeded medication. Such events may be sponsored by local hospitals, pharmacies, police or fire departments.
o Only flush drugs down the toilet if the label specifically says to do so Ask your pharmacist if you’re unsure about proper disposal
o To dispose of all other medications: Remove the medication from the original packaging Crush the pills and mix them with kitty litter, coffee grounds, or sand Seal the mixture in a plastic bag and dispose of it with your household trash
Properly discard unused or unneeded household poisons and their containers o Check with your city or county for hazardous waste collection events and locations. o Household poisons can include paints and solvents, auto fluids, household cleaners,
pesticide, and pool chemicals
Participate in National Poison Prevention Week, held annually during the 3rd week of March o The federal Health Resources and Services Administration (HRSA) provides an Event
Planner Kit to help your agency or business get involved. Visit www.poisonprevention.org for more information.
Visit Arizona’s Poison Control Centers on the internet at: Arizona Poison and Drug Information Center, Tucson, Arizona http://www.pharmacy.arizona.edu/outreach/poison/index.php Banner Good Samaritan Poison and Drug Information Center, Phoenix, Arizona http://www.bannerhealth.com/Locations/Arizona/Banner+Poison+Control+Center/_Banner+Poison+Control+Center.htm
29
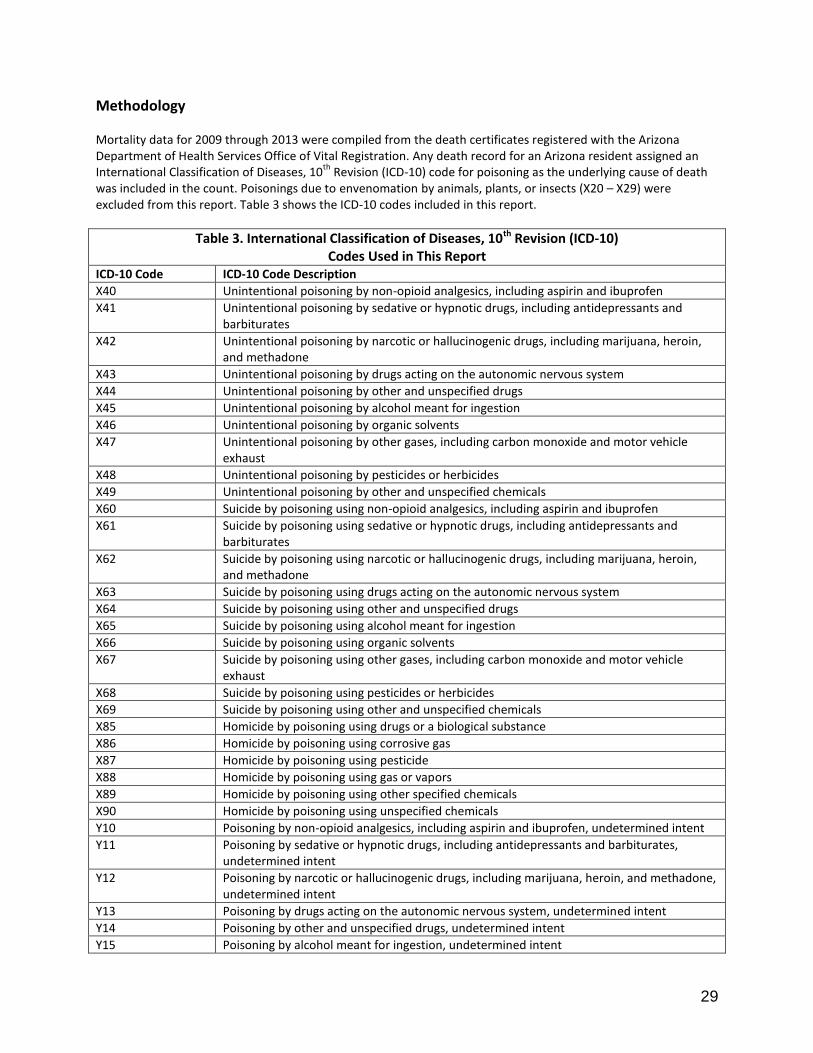
Methodology Mortality data for 2009 through 2013 were compiled from the death certificates registered with the Arizona Department of Health Services Office of Vital Registration. Any death record for an Arizona resident assigned an International Classification of Diseases, 10
th Revision (ICD-10) code for poisoning as the underlying cause of death
was included in the count. Poisonings due to envenomation by animals, plants, or insects (X20 – X29) were excluded from this report. Table 3 shows the ICD-10 codes included in this report.
Table 3. International Classification of Diseases, 10th Revision (ICD-10) Codes Used in This Report
ICD-10 Code ICD-10 Code Description
X40 Unintentional poisoning by non-opioid analgesics, including aspirin and ibuprofen
X41 Unintentional poisoning by sedative or hypnotic drugs, including antidepressants and barbiturates
X42 Unintentional poisoning by narcotic or hallucinogenic drugs, including marijuana, heroin, and methadone
X43 Unintentional poisoning by drugs acting on the autonomic nervous system
X44 Unintentional poisoning by other and unspecified drugs
X45 Unintentional poisoning by alcohol meant for ingestion
X46 Unintentional poisoning by organic solvents
X47 Unintentional poisoning by other gases, including carbon monoxide and motor vehicle exhaust
X48 Unintentional poisoning by pesticides or herbicides
X49 Unintentional poisoning by other and unspecified chemicals
X60 Suicide by poisoning using non-opioid analgesics, including aspirin and ibuprofen
X61 Suicide by poisoning using sedative or hypnotic drugs, including antidepressants and barbiturates
X62 Suicide by poisoning using narcotic or hallucinogenic drugs, including marijuana, heroin, and methadone
X63 Suicide by poisoning using drugs acting on the autonomic nervous system
X64 Suicide by poisoning using other and unspecified drugs
X65 Suicide by poisoning using alcohol meant for ingestion
X66 Suicide by poisoning using organic solvents
X67 Suicide by poisoning using other gases, including carbon monoxide and motor vehicle exhaust
X68 Suicide by poisoning using pesticides or herbicides
X69 Suicide by poisoning using other and unspecified chemicals
X85 Homicide by poisoning using drugs or a biological substance
X86 Homicide by poisoning using corrosive gas
X87 Homicide by poisoning using pesticide
X88 Homicide by poisoning using gas or vapors
X89 Homicide by poisoning using other specified chemicals
X90 Homicide by poisoning using unspecified chemicals
Y10 Poisoning by non-opioid analgesics, including aspirin and ibuprofen, undetermined intent
Y11 Poisoning by sedative or hypnotic drugs, including antidepressants and barbiturates, undetermined intent
Y12 Poisoning by narcotic or hallucinogenic drugs, including marijuana, heroin, and methadone, undetermined intent
Y13 Poisoning by drugs acting on the autonomic nervous system, undetermined intent
Y14 Poisoning by other and unspecified drugs, undetermined intent
Y15 Poisoning by alcohol meant for ingestion, undetermined intent
30
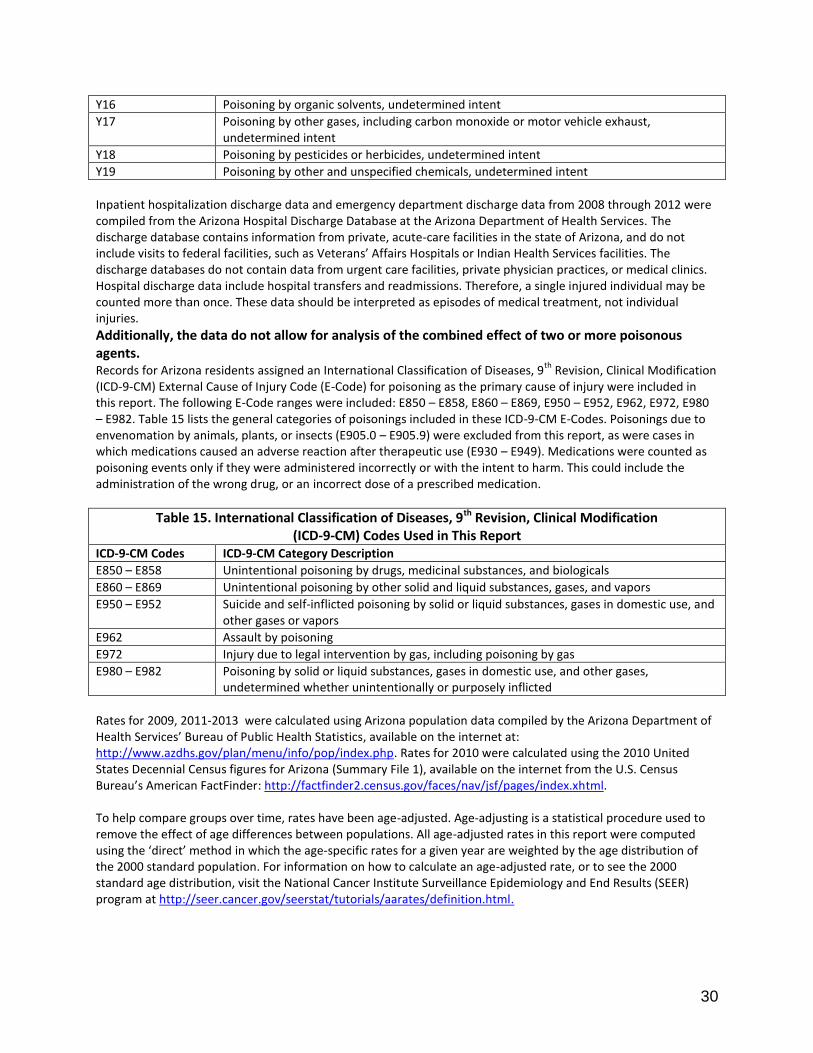
Y16 Poisoning by organic solvents, undetermined intent
Y17 Poisoning by other gases, including carbon monoxide or motor vehicle exhaust, undetermined intent
Y18 Poisoning by pesticides or herbicides, undetermined intent
Y19 Poisoning by other and unspecified chemicals, undetermined intent
Inpatient hospitalization discharge data and emergency department discharge data from 2008 through 2012 were compiled from the Arizona Hospital Discharge Database at the Arizona Department of Health Services. The discharge database contains information from private, acute-care facilities in the state of Arizona, and do not include visits to federal facilities, such as Veterans’ Affairs Hospitals or Indian Health Services facilities. The discharge databases do not contain data from urgent care facilities, private physician practices, or medical clinics. Hospital discharge data include hospital transfers and readmissions. Therefore, a single injured individual may be counted more than once. These data should be interpreted as episodes of medical treatment, not individual injuries.
Additionally, the data do not allow for analysis of the combined effect of two or more poisonous agents. Records for Arizona residents assigned an International Classification of Diseases, 9
th Revision, Clinical Modification
(ICD-9-CM) External Cause of Injury Code (E-Code) for poisoning as the primary cause of injury were included in this report. The following E-Code ranges were included: E850 – E858, E860 – E869, E950 – E952, E962, E972, E980 – E982. Table 15 lists the general categories of poisonings included in these ICD-9-CM E-Codes. Poisonings due to envenomation by animals, plants, or insects (E905.0 – E905.9) were excluded from this report, as were cases in which medications caused an adverse reaction after therapeutic use (E930 – E949). Medications were counted as poisoning events only if they were administered incorrectly or with the intent to harm. This could include the administration of the wrong drug, or an incorrect dose of a prescribed medication.
Table 15. International Classification of Diseases, 9th Revision, Clinical Modification (ICD-9-CM) Codes Used in This Report
ICD-9-CM Codes ICD-9-CM Category Description
E850 – E858 Unintentional poisoning by drugs, medicinal substances, and biologicals
E860 – E869 Unintentional poisoning by other solid and liquid substances, gases, and vapors
E950 – E952 Suicide and self-inflicted poisoning by solid or liquid substances, gases in domestic use, and other gases or vapors
E962 Assault by poisoning
E972 Injury due to legal intervention by gas, including poisoning by gas
E980 – E982 Poisoning by solid or liquid substances, gases in domestic use, and other gases, undetermined whether unintentionally or purposely inflicted
Rates for 2009, 2011-2013 were calculated using Arizona population data compiled by the Arizona Department of Health Services’ Bureau of Public Health Statistics, available on the internet at: http://www.azdhs.gov/plan/menu/info/pop/index.php. Rates for 2010 were calculated using the 2010 United States Decennial Census figures for Arizona (Summary File 1), available on the internet from the U.S. Census Bureau’s American FactFinder: http://factfinder2.census.gov/faces/nav/jsf/pages/index.xhtml. To help compare groups over time, rates have been age-adjusted. Age-adjusting is a statistical procedure used to remove the effect of age differences between populations. All age-adjusted rates in this report were computed using the ‘direct’ method in which the age-specific rates for a given year are weighted by the age distribution of the 2000 standard population. For information on how to calculate an age-adjusted rate, or to see the 2000 standard age distribution, visit the National Cancer Institute Surveillance Epidemiology and End Results (SEER) program at http://seer.cancer.gov/seerstat/tutorials/aarates/definition.html.