Point-in-Time Count/Survey & Homeless Needs Assessment.
22
Point-in-Time Count/Survey Point-in-Time Count/Survey & & Homeless Needs Assessment Homeless Needs Assessment
-
Upload
sophie-striker -
Category
Documents
-
view
217 -
download
1
Transcript of Point-in-Time Count/Survey & Homeless Needs Assessment.
Point-in-Time Count/SurveyPoint-in-Time Count/Survey&&
Homeless Needs AssessmentHomeless Needs Assessment

Point in Time SurveyPoint in Time Survey Regarding this Point In Time Summary Information:
The methodology employed in Orange County’s 2007 Point In Time County used a conservative approach and utilized HUD’s restrictive definition of homelessness. As such, the characteristics of those that because they have no other choice are forced to live doubled and tripled up and those that use motels as de facto shelters are not represented here. Those unsheltered homeless that chose not, could not or were not identified to participate in the count and survey are underrepresented as well. This information is being provided as a snapshot of a subset of Orange County’s homeless population and while it may not represent the actual findings of the broader homeless community, it does provide insight into the challenges faced by those residents with the greatest needs in our community.

3
Point in Time Survey Point in Time Survey • What is it?
• Point in Time Count & Survey is a one night count of unsheltered
homeless as directed by HUD
• A simultaneous count of sheltered homeless
• Survey conducted the next day
• A “point-in-time” snapshot of homeless on the street and in shelters
within one 24-hour period
• Meant to show “bare minimum”- does not include precariously
housed (RV parks, hotel/motel, doubled up, etc)

4
Point in Time SurveyPoint in Time Survey• Why do we count?
• Mandated by HUD to be conducted every other year in January
• Provides information to HUD and Congress ensuring that much needed programs continue to receive adequate funding
• Results are reported in the HUD Continuum of Care application
• Provides information to our community regarding gaps and needs

5
MethodologyMethodology• Sheltered Homeless
– HUD defines sheltered homeless as adults, children and unaccompanied youth who, on the night of the count, are living in shelters for the homeless, including:
• Emergency Shelters
• Transitional Housing
• Domestic Violence Shelters
• Residential programs for runaway/homeless youth
• Any hotel, motel or apartment voucher arrangements paid for by a public or private agency because the person or family is homeless (note: not captured due to limited resources)

6
Point-in-Time Count ResultsPoint-in-Time Count Results
• Only captured homeless in shelters and in previously identified outdoor locations at one point-in-time
• Identified 3,649 unduplicated persons identified as homeless in shelters and on the streets in Orange County on January 25, 2007
• Average incidents per homeless client as reported by shelters was 7.6
• Extrapolation of count resulted in 27,732 incidents of homelessness estimated over a twelve month period

7
2007 Homeless Needs Assessment 2007 Homeless Needs Assessment
Summarizes total homeless persons served and turned away in Orange County shelters over a twelve month period
Total homeless episodes over a twelve month period: 35,065
Total homeless episodes for persons in families with children over a twelve month period: 24,545 (10,227 family units)
Total homeless episodes for unaccompanied individuals over a twelve month period: 10,520

8
Weaknesses in Count MethodologiesWeaknesses in Count Methodologies
• The federally mandated Point-in-Time Count only captures people in shelters and on the streets in a single 24-hour period
• It under-represents families and children because people using homeless services over time is different than the population at a single point in time
• Point-in-time estimates capture a higher share of chronically homeless who use shelters for long periods of time and under-represent persons and families whose homelessness is episodic and who often use motels as de facto shelter
• The Homeless Needs Assessment primary data only captured persons and families seeking shelter and receiving shelter
• Orange County MUST develop a methodology that quantifies the thousands of homeless families and individuals living in motels, cars, and other places not captured in the annual needs assessment or bi-annual count
• Resources are needed to accomplish this goal

9
Households by Shelter TypeHouseholds by Shelter Type
474
808
255
936
360
816
0100200300400500600700800900
1000
E mergenc y Trans itional P ermanent
P ers ons inHous eholds withC hildrenP ers ons inHous eholds withoutC hildren

10
Subpopulation DemographicsSubpopulation Demographics(Sheltered and Unsheltered)(Sheltered and Unsheltered)
36
199 185
419
93
619
43
221170 142
255
53
238
00
100
200
300
400
500
600
700
S heltered
Uns heltered

11
Survey RespondentsSurvey Respondents
Male
Female
Unsheltered
Emergency Shelters
Transitional Shelters
Mixed Shelters
29.2%
70.8%
34.6%
65.4%60.3%
39.7%
67.8%
32.2%
0.0%
10.0%
20.0%
30.0%
40.0%
50.0%
60.0%
70.0%
80.0%
Figure 2. Gender by Shelter Type
Unsheltered
Emergency Shelters
Transitional Shelters
Mixed Shelters
Unsheltered Respondents (24% of survey respondents)•270 surveys completed•79 (32.2%) female•166 (67.8%) male•25 did not report gender
Sheltered Respondents(76% of survey respondents)•855 surveys completed•477 (56.3%) female•370 (43.7%) male•8 did not report gender

12
18 to 2425 to 34
35 to 4445 to 54
55 to 6465 andolder
S1
S2
4.9%
11.6%
25.7%
37.7%
14.9%
5.2%
13.3%
25.3%27.4%
22.0%
10.7%
1.3%
0.0%
5.0%
10.0%
15.0%
20.0%
25.0%
30.0%
35.0%
40.0%
Figure 3. Age Group by Survey Location 2007 Orange County Point-in-Time Survey of the Homeless
Sheltered
Unsheltered
Respondent AgeRespondent Age

13
Unsheltered Respondents by Unsheltered Respondents by Age and GenderAge and Gender
1 25
531
422 7
104
200
100
200
300
400
500
600
C hild Y outh A dult 60+ Y ears
Uns heltered Male
Uns heltered F emale

14
Sheltered Respondents by Sheltered Respondents by Age and GenderAge and Gender
157 189
891
215156 206
741
230
200
400
600
800
1000
C hild Y outh A dult 60+ Y ears
S heltered Male
S heltered F emale

15
Last Known Permanent AddressLast Known Permanent Address(Sheltered Homeless)(Sheltered Homeless)
• 814 respondents• 642 (78.9%) Orange County• 63 (7.7%) Los Angeles County• 9 (1.1%) San Diego County• 100 (12.3%) identified a county
other than OC, LA or SD • San Bernadino-14• Riverside-24• Kern-2• Kings-1• Monterey-1• San Joaquin-1• San Jose-1• Santa Barbara-1• Santa Clara-2• Shasta-2• Sutter-1• Ventura-1
• 49 reported last known permanent address outside of California
16
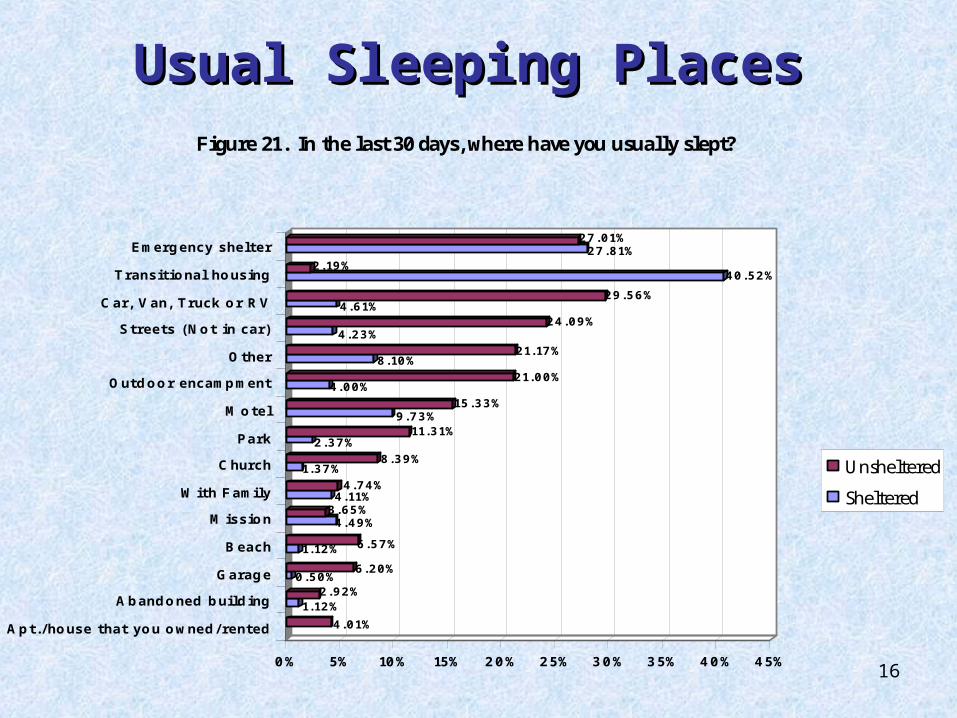
4.01%
1.12%2.92%
0.50%6.20%
1.12% 6.57%
4.49%3.65%4.11%
4.74%1.37%
8.39%2.37%
11.31%9.73%
15.33%4.00%
21.00%8.10%
21.17%4.23%
24.09%4.61%
29.56%
40.52%2.19%
27.81%27.01%
0% 5% 10% 15% 20% 25% 30% 35% 40% 45%
Apt./house that you owned/rented
Abandoned building
Garage
Beach
Mission
With Family
Church
Park
Motel
Outdoor encampment
Other
Streets (Not in car)
Car, Van, Truck or RV
Transitional housing
Emergency shelter
Figure 21. In the last 30 days, where have you usually slept?
Unsheltered
Sheltered
Usual Sleeping PlacesUsual Sleeping Places
17
Length of HomelessnessLength of Homelessness
21.9%
12.3%
17.3%
11.9%
15.4%
11.5%
19.1%
17.9%
12.6%13.4%
4.4%
11.9%
3.8%
8.6%
2.6%
5.6%
2.1%
5.9%
0.4%1.5%
0.0%
5.0%
10.0%
15.0%
20.0%
25.0%
Lessthan 1month
>3 to 6months
>1 yearto 2
years
>3years to5 years
>10years to
20years
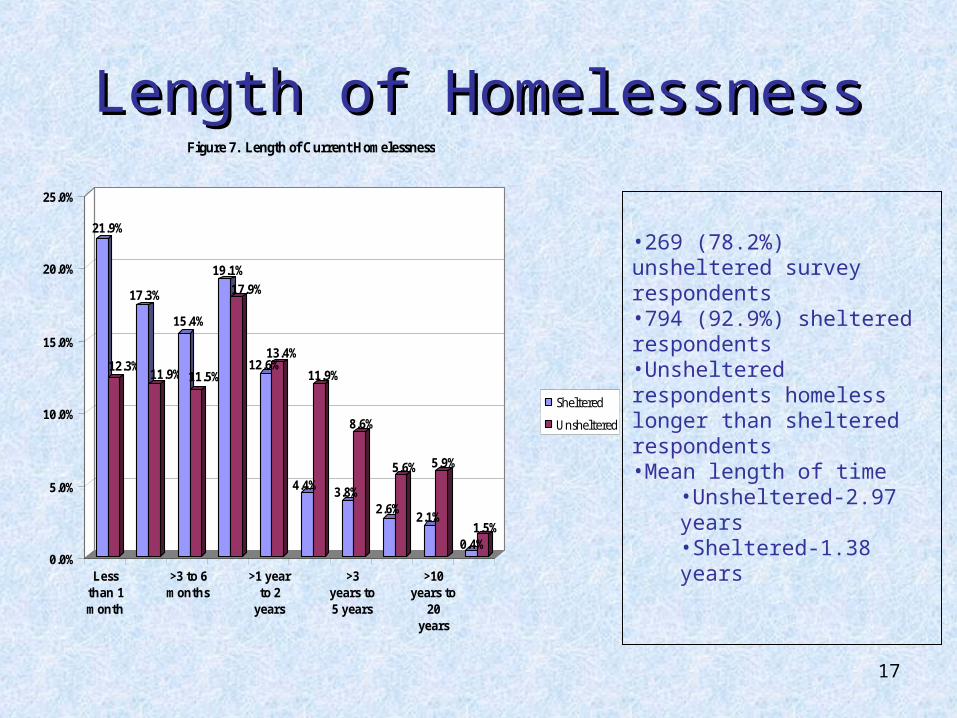
Figure 7. Length of Current Homelessness
Sheltered
Unsheltered
•269 (78.2%) unsheltered survey respondents•794 (92.9%) sheltered respondents•Unsheltered respondents homeless longer than sheltered respondents•Mean length of time
•Unsheltered-2.97 years•Sheltered-1.38 years

18
Reasons for HomelessnessReasons for Homelessness
1.84%1.2%
1.35%2.0%
2.10%5.9%
9.07%3.9%
8.46%8.6%8.70%
10.6%
8.21%11.8%
8.58%11.8%
19.61%5.5%
14.71%22.8%
19.85%26.7%
26.47%22.4%
32.11%18.0%
0.0% 5.0% 10.0% 15.0% 20.0% 25.0% 30.0% 35.0%
A disability related to military service
A learning disability
Loss of government benefits
Credit problems
Mental Illness
Eviction
Physical disability
Health Problems
Domestic violence
Other
Loss of job
Lack of affordable housing
Drug and/or alcohol problem
Figure 17. Which of the following do you feel has contributed MOST to your current homelessness?
Unsheltered
Sheltered

19
Current Monthly Income by Current Monthly Income by Survey LocationSurvey Location
202
5573
91114
97
50 48
122
28 31 2536
10 6 50
50
100
150
200
250
S heltered
Uns heltered

20
Sources of IncomeSources of Income

21
Reasons for Not Receiving Reasons for Not Receiving AssistanceAssistance
7.73%
7.94%
12.02%
16.52%
20.39%
47.64%
0.0% 5.0% 10.0% 15.0% 20.0%
25.0% 30.0%
35.0% 40.0%
45.0% 50.0%
Unable to complete theapplication process
Lack of properidentification
Lack of permanentaddress
Do not want the help
Applied but denied
Did not apply because Idon't think I'm eligible
Figure 15. Reasons for Not Receiving Asssistance

22
Services Needed but Not Services Needed but Not ReceivedReceived
7.33%
15.91%
18.10%
18.10%
19.66%
20.28%
24.65%
32.76%
38.10%
43.84%
67.55%
0.0% 10.0% 20.0% 30.0% 40.0% 50.0% 60.0% 70.0%
Other
Educational
Food
Clothing
Counseling
Job Training
Temporary Shelter
Transportation
Medical
Financial Assistance
Permanent Housing
Figure 19. Have you needed any of the following services and been UNABLE to obtain them?