P.O. Box 1749 Item No. 1
113
P.O. Box 1749 Halifax, Nova Scotia B3J 3A5 Canada Item No. 13.1 Halifax Regional Council October 30, 2018 November 13, 2018 TO: Mayor Savage and Members of Halifax Regional Council SUBMITTED BY: Jerry Blackwood, Acting Director, Finance & Asset Management Jacques Dubé, Chief Administrative Officer DATE: October 22, 2018 SUBJECT: 2018 Citizen Survey - Results INFORMATION REPORT ORIGIN This report stems from the Municipality’s commitment in the 2018/19 business plan to conduct a citizen survey, as outlined in the Information Reports to the Executive Standing Committee of Council of June 27, 2011 and October 31, 2011. LEGISLATIVE AUTHORITY Council and Chief Administrative Officer relationship 34 (1) The Chief Administrative Officer is the head of the administrative branch of the government of the Municipality and is responsible to the Council for the proper administration of the affairs of the Municipality in accordance with the by-laws of the Municipality and the policies adopted by the Council. Executive Standing Committee Priority Areas and Corporate Performance Objectives of the Council 9. The Executive Standing Committee shall: (a) have strategic oversight of progress on HRM’s Corporate Performance Objectives and priority areas of the Council; and (b) perform other Administrative matters as may be determined and directed by the Council. BACKGROUND
Transcript of P.O. Box 1749 Item No. 1

P.O. Box 1749 Halifax, Nova Scotia B3J 3A5 Canada
Item No. 13.1
Halifax Regional Council October 30, 2018
November 13, 2018
TO: Mayor Savage and Members of Halifax Regional Council
SUBMITTED BY:
Jerry Blackwood, Acting Director, Finance & Asset Management
Jacques Dubé, Chief Administrative Officer
DATE: October 22, 2018
SUBJECT: 2018 Citizen Survey - Results
INFORMATION REPORT
ORIGIN
This report stems from the Municipality’s commitment in the 2018/19 business plan to conduct a citizen survey, as outlined in the Information Reports to the Executive Standing Committee of Council of June 27, 2011 and October 31, 2011.
LEGISLATIVE AUTHORITY
Council and Chief Administrative Officer relationship 34 (1) The Chief Administrative Officer is the head of the administrative branch of the government of theMunicipality and is responsible to the Council for the proper administration of the affairs of the Municipalityin accordance with the by-laws of the Municipality and the policies adopted by the Council.
Executive Standing Committee
Priority Areas and Corporate Performance Objectives of the Council 9. The Executive Standing Committee shall:
(a) have strategic oversight of progress on HRM’s Corporate Performance Objectives and priority areas ofthe Council; and
(b) perform other Administrative matters as may be determined and directed by the Council.BACKGROUND
2018 Citizen Survey - Results Council Report - 2 - October 30, 2018
In alignment with Council’s Priority Outcomes of Public Engagement and Fiscal Responsibility, and to support citizen-centred service delivery, the 2018 Citizen Survey was conducted during August and September 2018. The findings help identify municipal priorities and inform future decisions. The Citizen Survey acts as a gauge of the satisfaction of Halifax residents and taxpayers with the services provided by their municipal government, and to help identify the mix of programs and services to best meet their expectations. The results of the survey will guide strategic and business planning and budgeting decisions, and provide provide Regional Council and administration with valuable insight into what matters most to residents.
As an engagement tool the Citizen Survey is an invaluable means of gathering information to inform policy and decision-making and investments in the community.
On June 27, 2011 the Executive Standing Committee endorsed a long-term survey cycle, as per the following table. Due to concerns about survey burnout and costs, the 2013 and 2015 Service Satisfaction surveys were combined into one survey in 2014, and the 2017/2019 service satisfaction surveys were also consolidated into one survey for 2018.
Long Term Survey Cycle
Year Survey Type In-Market Time Frame 2010 Full Priority and Satisfaction April 2011 2012 Community Priority/Expectations April 2013 2014 Community Priority/Service Satisfaction April 2015 2018 Community Priority/ Service Satisfaction August-September 2018 2020 Community Priority August-September 2020
DISCUSSION
The 2018 Citizen Survey was developed in collaboration with municipal business units, and with input from the Halifax Partnership.
PRA Inc., a national research firm, was contracted via standard procurement process to conduct on behalf of the municipality both the invitation-based survey and the open survey available to all residents.
The PRA Inc. report and data from the survey will be made available to the public following the October 30th Regional Council meeting at www.halifax.ca/citizensurvey/.
Methodology:
Like the 2014 survey, the Municipality conducted two surveys (both hosted by PRA Inc.) to gather information – an invitation-based survey (Invitation), and an online-only (Open) version that was open to all residents. The Invitation-based survey was conducted from July 30 to August 19, 2018. Once the Invitation survey closed, the Open survey was made available and was conducted from August 20 to September 16. This was different from 2014, where both the Invitation and Open surveys were conducted at the same time. The Invitation and Open surveys both contained the same questions.
The Invitation survey was a formal, invitation-based scientifically-valid survey giving residents the opportunity to respond online, by paper copy, or by telephone. For the Invitation survey a request to participate was mailed to 12,000 randomly selected households across the municipality. Approximately 500 of the 12,000 mailed letters were returned to the Municipality as undeliverable, meaning that about 11,500 households received the invitation to participate.
2018 Citizen Survey - Results Council Report - 3 - October 30, 2018 A total of 1,097 Invitation surveys were completed, which results in a response rate of 9.5%. Among the 1,097 completed surveys, 980 (89%) were completed online, 48 were completed by telephone (4%), and 69 were completed by mail (6%). The margin of error for this study is of ± 2.9% (19 times out of 20 or at the 95% confidence level). In 2014, 592 invitation-based surveys were completed. For the Open survey, an identical copy of the survey was hosted by PRA Inc. following the close of the Invitation survey. Residents were invited to participate via media and social media announcements, local newspaper advertising, Facebook ads, and a link on the Halifax.ca website. In total, 1,567 respondents completed the Open survey in whole or in part (compared to 1,087 in 2014). The results of the Open survey cannot be considered as scientifically valid due to a lack of control over the sample and the possibility of residents completing multiple copies of the survey and impacting results, however results were similar to the invitation responses, and add value in understanding residents’ perception of municipal service delivery. Results from both surveys will be made available on the municipal website at www.halifax.ca/citizensurvey. The survey contained approximately 200 unique components across 67 questions, ranging in topics from quality of life, value for taxes, customer service satisfaction, satisfaction with and funding for services, community priorities, public safety, recreation and leisure, parks, public libraries, transportation, and key issues of focus for municipal leaders. The official survey also captured a broad range of demographic information that allows the analysis of results by demographic markers. Future surveys will follow this methodology to ensure scientifically-valid results are available, and will include an open version to allow all residents to voice their opinions. Interpreting the Results: This is the 9th survey HRM has conducted since amalgamation in 1996. This survey’s focus was to determine the satisfaction of Halifax residents and taxpayers with the services provided by their municipal government, and to help identify the mix of programs and services to best meet those expectations. Typical municipal or city surveys range from 400 to 1500 respondents. 1,097 HRM residents completed the invitation-based region-wide 2018 survey, representing a completion rate of 9.5%, up from 4.9% in 2014. Conducting the Open survey following the Invitation survey instead of concurrently like in 2014 likely improved response rate as there was no confusion as to which survey to complete since only one option was available at a time. The margin of error reported for the results is ±2.9% This means that, for example, if a result shows that 80% of residents say they receive good value for the property taxes they currently pay, the real result lies between 77.1% and 82.9% (80% + 2.9% = 82.9%, or 80% - 2.9% = 77.1%). This is called the confidence interval, and represents the range within which true sentiment for HRM residents toward value for taxes can be expected to fall, 95% of the time.

2018 Citizen Survey - Results Council Report - 4 - October 30, 2018 Results Analysis: NOTE: For comparison purposes, the results of the Open survey are shown in parentheses beside the Invitation results. If only one number is shown, this will be the 2018 Invitation result. Results for both 2018 and 2014 are shown as Invitation (Open) where available. Numbers have been rounded in this information report, so may vary slightly from the reported figures in the raw data. Results are grouped under the following topics: Quality of Life Value for Taxes Top of Mind Issues Community Priorities Satisfaction with Services and Service Funding Service Quality Access to Information / Public Engagement Public Safety Recreation and Leisure Parks Public Libraries Transportation Demographics Quality of Life 96% of respondents rate the quality of life in Halifax as very good (35%) or good (61%), which is
almost unchanged from 2014 (94%). 91% of respondents to the Open survey rate the quality of life as very good.
Over the past five years, 38% of respondents say the quality of life in Halifax has improved, which is about three times more than those who say it has worsened (13%). The proportion who say it has improved is higher than 2012 (19%) or 2010 (25%), while the proportion who say it has worsened is lower (28% in 2012 and 26% in 2010). In the Open survey, 30% say quality of life has improved, while 19% say it has worsened.
Value for Taxes About 73% (65%) of respondents feel that they receive either very good (7.7%) or good (65.6%) value
for their property taxes, up from 65% (55%) in 2014.
In terms of budgeting, the majority (53%) say they would maintain taxes and fees, even if it means reducing some services to maintain others, followed by 30% who say they would increase municipal services, even if taxes or fees must increase. Open respondents are split between maintain (46%) and increase (38%).
When asked how they would prefer to fund adding or maintaining services and facilities, respondents tend to favour some aspect of user fees - either a standalone increase to user fees (36%), or in combination with a property tax increase (20%) or property tax increase and debt increase (31%).

2018 Citizen Survey - Results Council Report - 5 - October 30, 2018 Top of Mind Issues When combining their responses to the question “In your opinion, what are the top three issues facing
the Halifax region over the next five years that you feel the municipality should invest greater resources?”, the top issues mentioned were Transit (23%), Road conditions / sidewalks / snow removal (22%), Transportation / Traffic (21%), Parking / winter parking (15%), Affordable housing (13%), Active transportation (12%), and crime / policing (10. However, there are several issues all within several percentage points, as shown in Table 1.
When comparing the Invitation and Open results, there is a slight discrepancy in priorities, as respondents to the Open survey prioritized Transit (31%), Transportation/Traffic (22%), Road Conditions / Sidewalks / Snow Removal (18%), and Affordable Housing (15%).
Table 1. Top 3 Issues facing the Municipality over the next 5 years (Total mentions) * Invitation Results (Open Results)
2010 2012 2014 2018 Trend
Transit 24% 26% 15%
(24%) 23%
(31%) ↑
Road conditions / sidewalks / snow removal 15% 12% 13%
(10%) 22%
(18%) ↑
Transportation / Traffic 14% 18% 23%
(21%) 21%
(22%) ↓
Parking / Winter parking - - 6% 15%
(10%) ↑
Affordable housing 4% 7% 5% 13%
(15%) ↑
Active transportation - 3% 4% 12%
(13%) ↑
Crime / Policing 20% 22% 12%
(15%) 10% (8%) ↓
Urban Sprawl / Planning for growth 1% 5% 14% (9%)
9% (6%) ↓
Environment / green belting / clean water 6% 19% 8%
(10%) 9%
(8%) ↑
Recreation opportunities 6% 4% 5% 8%
(9%) ↑
Health / healthcare / hospitals 12% 4% 4% 6%
(5%) ↑
Economic growth * / small business growth 7% 18% 12%
(11%) 6%
(10%) ↓
Commuter rail / light rail / ferry system - - - 6%
(6%) ↑
Taxes* 23% 15% 18%
(22%) 5%
(5%) ↓
Retention / attraction of residents / immigration 2% - 5% 5%
(3%) ↔

2018 Citizen Survey - Results Council Report - 6 - October 30, 2018
Infrastructure renewal 13% 11% 14% (8%)
5% (7%) ↓
Clean up / beautification 2% 4% 2% 5%
(3%) ↑
* Economic growth split from employment and jobs, as economic growth was considered to be broader in context, and include such things as support to small business, tourism, and other economic stimulation actions.
23%
22%
21%
15%
13%
10%
9%
9%
8%
6%
6%
5%
5%
31%
18%
22%
10%
15%
8%
6%
8%
9%
10%
6%
5%
7%
Transit
Roads / Sidewalks / Snow
Transportation / Traffic
Parking / Winter parking
Affordable Housing
Crime / Policing
Urban Sprawl
Environment
Recreation Opportunities
Economic growth
Commuter Rail
Taxes / Taxation
Infrastructure Renewal
Top of Mind Issues ‐ Invitation vs. Open
Invitation Open

2018 Citizen Survey - Results Council Report - 7 - October 30, 2018 Community Priorities Among Council’s six priority areas, almost 9 in 10 respondents say that each of the six priorities are at
least important. however, the differentiator appears to be in the proportion rating each as very important. This seems to indicate that Transportation at 56% and Healthy, Liveable Communities at 54% are most important, and Service Delivery at 22% is least important to respondents. Open results were very comparable.
Respondents ranked their infrastructure priorities according to the capital project groupings used
when presenting the capital project budget to Council. Between Invitation and Open groups, the only significant difference was that Public Transit rated highest among Open respondents, and they rated it Very Important (54%, Important 38%).
22%
32%
42%
43%
54%
56%
65%
55%
48%
45%
40%
40%
12%
12%
8%
10%
4%
3%
Service Delivery
Governance and Engagement
Economic Development
Social Development
Healthy, liveable communities
Transportation
Importance of Council priorities
Very important Important Not important Not at all important
19%
19%
26%
30%
43%
43%
63%
67%
59%
57%
46%
48%
17%
13%
14%
12%
9%
9%
Technology supporting municipal operations
Buildings and facilities
Parks and playgrounds
Emergency and corporate fleet
Public transit
Integrated mobility projects
Importance of infrastructure categories
Very important Important Not important Not at all important

2018 Citizen Survey - Results Council Report - 8 - October 30, 2018 Respondents were asked to rank their top three infrastructure projects for the Municipality to pursue
over the next five years. Table 2 outlines their selections.
Table 2: Top infrastructure priorities % selecting as top
priority % selecting as top
three priority* Maintenance of existing streets and roads 22% 51% Upgrade major roadways to provide increased capacity 16% 36% Commuter rail 12% 33% New active transportation improvements 10% 25% More buses to new areas 6% 17% More buses on existing routes 5% 15% Improved/additional public transit facilities 5% 14% New stadium 5% 12% Maintenance of existing sidewalks, walkways, and trails 3% 22% Arts and cultural facilities 3% 11% New recreation facilities/community centres 3% 9% Improving existing facilities 2% 15% New/repair of outdoor recreation facilities 2% 14% Technology to improve service delivery/customer service/accessibility
2% 12%
New/refurbished community branch libraries 2% 7% Arenas/ice surfaces 1% 3% Other 1% 4% *Note: Respondents could give more than one response; therefore, columns will sum to more than 100%.
Open responses tend to follow the same pattern, with maintenance of existing streets and roads
(16%), commuter rail (15%), active transportation improvements (12%), upgrade major roadways (11%), and more buses to new areas (8%) the top priorities.

2018 Citizen Survey - Results Council Report - 9 - October 30, 2018 Satisfaction with Services and Service Funding Respondents were asked to rate their satisfaction with 23 municipal services. Respondents appear to be most satisfied with garbage, recycling, and organics collection at 88%, with 31% very satisfied. At the lower end, respondents are least satisfied with bike lanes and cycling facilities (41%), which is the only aspect tested where fewer than half of respondents are satisfied.
In almost every instance, the satisfaction with municipal services for Open respondents was about the same for Very Satisfied, but lower for Satisfied, typically by around 10%.
Overall, 81% (68%) of respondents are at least satisfied with the delivery of all the services provided by the Municipality, including 4% who are very satisfied.
2%
4%
4%
5%
5%
6%
6%
6%
6%
6%
6%
6%
7%
8%
9%
10%
10%
12%
12%
12%
13%
14%
31%
50%
47%
64%
58%
60%
35%
65%
66%
66%
66%
67%
67%
55%
55%
71%
52%
54%
73%
73%
73%
75%
58%
57%
32%
33%
24%
26%
24%
38%
19%
20%
23%
22%
21%
21%
27%
26%
15%
26%
26%
12%
13%
12%
10%
15%
8%
16%
15%
8%
11%
11%
21%
11%
9%
6%
7%
6%
6%
12%
12%
5%
12%
11%
4%
3%
2%
2%
13%
4%
Community planning/land use planning
Street/road maintenance
Public/community engagement
Traffic management
Traffic/pedestrian safety
Bike lanes/cycling facilities
Parking enforcement
Community standards
Economic development
Sidewalk maintenance
Environmental protection and sustainability
Overall city maintenance
Overall transit service
Winter maintenance
Business support services
Public transit (bus/ferry)
Litter control/graffiti removal/cleanliness
Emergency preparedness
Recreation facilities
Recreation programming
Arts and cultural facilities and programs
Public transit (Access‐A‐Bus )
Garbage, recycling, and organics collection
Satisfaction with municipal services
Very satisfied Satisfied Dissatisfied Very dissatisfied

2018 Citizen Survey - Results Council Report - 10 - October 30, 2018
Compared to 2014, results show similar levels of satisfaction, with the exception of public transit - Access-A-Bus (88% in 2014 to 72% in 2018) and overall transit service (72% in 2014 to 62% in 2018).
The only service to see a significant increase from 2014 was bike lanes and cycling facilities, from 30% in 2014 to 41% in 2018; however, even with this increase, it still is the service with the lowest satisfaction rating.
When asked about which services should be increased, maintained, or reduced, in all cases the most common answer was maintain service levels. The services respondents would like to see increased most are street/road maintenance (47%) and
public transit – bus/ferry (41%). The only service with more respondents saying to decrease than increase service is parking enforcement, with 11% saying increase and 25% saying decrease.
The service that seems to be the most divisive is bike lanes/cycling facilities, as it is the only service with less than half saying to maintain it, and the second most saying to decrease it (22%).
4% 77% 18% 2%
Overall satisfaction with delivery of municipal services
Very satisfied Satisfied Dissatisfied Very dissatisfied
30%
45%
72%
63%
62%
67%
88%
75%
86%
41%
52%
62%
63%
64%
72%
72%
73%
88%
Bike lanes/cycling facilities
Street/road maintenance
Overall transit service
Winter maintenance
Litter control/graffiti removal/cleanliness
Sidewalk maintenance
Public transit (Access‐A‐Bus )
Overall city maintenance
Arts and cultural facilities and programs
Satisfaction with municipal services: 2014 to 2018
2018 2014

2018 Citizen Survey - Results Council Report - 11 - October 30, 2018
Open respondents were more inclined to increase service levels than Invitation respondents.
Some notable differences include Transit (bus/ferry - 56% increase / 40% maintain / 4% decrease), Traffic / Pedestrian safety (43%/53%/4%), Public Transit (Access-A-Bus – 33%/62%/5%), and Public / Community Engagement (28%/57%/14%).
Service Quality Overall, 46% (41%) of respondents say they have had any contact with a municipal employee, either in-person, in writing, by telephone, email/website, by fax, by social media, or by encounter with a police/by-law officer, over the last 12 months. This is down from 57% in 2014
Among those who had contact in the past year, the most common type of contact was by telephone - calling 311 or 902-490-4000 at 33% (38%).
In the past 12 months, 20% (27%) have accessed the Municipality’s Customer Service Centre in-person. This is down from 30% in 2014.
10%
11%
14%
16%
17%
19%
20%
20%
20%
21%
23%
24%
25%
27%
27%
27%
28%
30%
32%
32%
35%
38%
39%
39%
41%
47%
79%
65%
85%
77%
80%
63%
65%
70%
72%
65%
71%
72%
68%
63%
70%
70%
67%
65%
60%
65%
62%
41%
57%
58%
56%
52%
10%
25%
2%
7%
4%
18%
15%
9%
8%
15%
6%
4%
7%
10%
3%
4%
5%
5%
8%
3%
3%
22%
4%
3%
3%
2%
Business support services
Parking enforcement
Garbage, recycling, and organics collection
Public libraries
Fire services
Arts and cultural facilities and programs
Community beautification
Community standards
Recreation programming
Public/community engagement
Recreation facilities
Public transit (Access‐A‐Bus )
Police services
Community planning/land use planning
Emergency preparedness
Sidewalk maintenance
Litter control/graffiti removal/cleanliness
Traffic management
Economic development
Parks, playgrounds, and greenspaces
Traffic/pedestrian safety
Bike lanes/cycling facilities
Environmental protection and sustainability
Winter maintenance
Public transit (bus/ferry)
Street/road maintenance
Changes to level of service
Increase service levels Maintain service levels Reduce service levels

2018 Citizen Survey - Results Council Report - 12 - October 30, 2018 Among the 20% who have accessed the Customer Service Centre in-person in the last 12 months, the
most common reasons were for property tax payment or inquiry (23%), licence other than a dog licence (18%), transit tickets, pass or schedule (17%), or parking ticket payment (16%). For Open respondents, the most common reason was transit tickets, pass or schedule (26%).
Among those who had any contact with the Municipality in the past year, 81% (78%) are at least satisfied with their contact, including 37% who are very satisfied. This proportion is up from 2014 when 68% were satisfied or very satisfied.
Respondents with any contact with the Municipality in the last year rated their agreement with seven statements. In all cases, approximately 3 in 4 at least agreed with the statement, with respondents most likely to at least agree that they were treated in a friendly, courteous manner (94%) and that they were treated fairly (90%).
Compared to 2014, all the service quality ratings improved, with respondents satisfied with the outcome
of their interaction improving the most, from 61% to 80%. There was minor difference between Invitation and Open responses.
Overall, 78% of respondents have accessed www.halifax.ca (60% in the past year) and 73% have accessed services at www.halifax.ca/home/online-services (43% in the past year), with most using it to
37% 44% 13% 6%
Satisfaction with most recent contactBASE: Contact Municipality in last year (n = 548)
Very satisfied Satisfied Dissatisfied Very dissatisfied
24%
27%
29%
30%
31%
34%
37%
53%
61%
51%
46%
51%
56%
57%
14%
9%
10%
15%
10%
6%
3%
9%
3%
10%
10%
9%
4%
3%
If the person I contacted was unable toassist me, I was directed to the right person
Municipal staff were knowledgeable
I was satisfied with the outcome of myinteraction
I would use this service if it was offeredonline
I was satisfied with the amount of time ittook to get the service
I was treated fairly
I was treated in a friendly, courteousmanner
Ratings of quality of service with most recent contactBASE: Contact Municipality in last year (n = 548)
Strongly agree Agree Disagree Strongly disagree

2018 Citizen Survey - Results Council Report - 13 - October 30, 2018
seek out information or complete an online payment. Approximately 75% of respondents said that they would be likely to use online services in the future.
Access to Information / Public Engagement In the past 12 months, respondents are most likely to have received or accessed information through
calling 311 (45%), viewing or engaging the Municipality’s social media channels (37%), or contacting a Councillor or municipal staff (29%). Fewer have made a Freedom of Information Request (8%) or visited the Municipal Archives or used their online catalogue (13%).
Among those who have accessed online services or information in the past year, the majority rate each as at least easy to access, with calling 311 (97%) and viewing or engaging the Municipality’s social media channels (98%) being rated as very easy. Respondents seem to have the most difficulty making a Freedom of Information Request with 60% rating as at least easy.
Respondents are most likely to have attended an in-person public meeting (39%), completed online surveys from the Municipality (38%), or they spoke directly with their Councillor or municipal staff (27%). However, in most cases these behaviors are rare, with most respondents engaging in them only once or twice in the past 12 months.
When asked for barriers or challenges they have faced accessing information, or participating or engaging with the Municipality, 78% indicate they have not faced any challenges. The most common challenges identified were lack of awareness or notification of engagement opportunities (7%), issues accessing the website (3%), feeling like their opinion won’t be heard or taken seriously (3%), issues contacting their Councillor (2%), or lack of opportunities to engage (2%).
8% 75% 15% 2%
Agreement that the Municipality provides sufficient tools and information to engage with them
Completey agree Agree Disagree Completely disagree

2018 Citizen Survey - Results Council Report - 14 - October 30, 2018
Public Safety Residents are most likely to agree that they would call police to report a crime, call police for assistance,
and help police if asked. In each case, more than 9 in 10 at least agree with each statement.
On the other hand, citizens are least likely to agree that police provide the same quality of service to all citizens, with just under half agreeing or strongly agreeing. In fact, 2 in 10 disagree or strongly disagree, which is the only statement where more than 8% disagree or strongly disagree.
5%
2%
6%
12%
12%
13%
24%
33%
35%
47%
68%
None
Other
Speaking at a board or committee meeting
Telephone
Workshop/conference
Online discussion
In‐person public meeting/Town Hall
Social media
Newsletter/direct mail
Online survey
Preferred method of engaging with the MunicipalityNote: Respondents could provide more than one answer.
13%
13%
14%
16%
18%
20%
39%
46%
50%
33%
49%
42%
48%
51%
55%
50%
45%
45%
32%
29%
35%
24%
24%
18%
8%
6%
4%
17%
7%
6%
8%
4%
5%
6%
3%
3%
3%
Police provide the same quality of service toall citizens
Police understand the issues that affect thiscommunity
Police make decisions based on facts
Police treat people fairly
Police show care and concern for thewelfare of the citizens they deal with
I generally support how the police usuallyact
I would help the police if asked
I would call the police for assistance
I would call the police to report a crime
Agreement with statements about police
Strongly agree Agree Neither agree nor disagree Disagree Strongly disagree

2018 Citizen Survey - Results Council Report - 15 - October 30, 2018 Comparing Invitation to Open results, the Open results tended to be higher for strongly agree, slightly
lower for agree and neither agree nor disagree (which is slightly counter to the general tone of the Open responses being slightly more negative in other questions, or in the 2014 survey).
In the past two years, 39% of residents say the police approached them, stopped them, or made contact with them for any reason. Three quarters of respondents were satisfied with their most recent encounter.
Most citizens say that police in their neighbourhood never or almost never (57%) exceed their
authority, with another 25% saying rarely. Just 2% say the police always or almost always exceed their authority.
Females, younger people, and those with no post-secondary education are more likely than their
counterparts to say they feel unsafe walking alone in their area after dark. In addition, those in the lowest income households are more likely than those in higher income households to say they do not walk alone.
45% 31% 10% 6% 8%
Satisfaction with most recent enounter with policeBASE: Contact with police in past two years (n = 423)
Very satisfied Satisfied Not satisfied or dissatisfied Dissatisfied Very dissatisfied
28% 46% 21% 3%2%
How good of a job the police are doing
Excellent Good Average Poor Very poor
26% 48% 15% 4% 8%
Safe from crime walking alone in their area after dark
Very safe Reasonably safe Somewhat unsafe Very unsafe Do not walk alone

2018 Citizen Survey - Results Council Report - 16 - October 30, 2018
Among victims of crime in the past year, 75% (69%) say they reported the crime to police.
Fire Services and Emergency Management Halifax Regional Fire & Emergency asked a variety of questions to understand resident knowledge of available services and their preparedness for an emergency, and to concurrently build awareness of the services.
Among eight fire services that Halifax Regional Fire & Emergency offers, respondents are very aware
of several, including firefighting and rescue (96%), motor vehicle accident response (95%), medical response (95%), and community/public events (92%). They are least aware that Halifax Regional Fire & Emergency offers technical/water rescue (74%) or public education/information programs (72%).
Respondents are less aware of emergency management services than fire services, with response and recovery (75%) receiving the highest level of awareness.
In the past year, 33% have required or witnessed a response from Halifax Regional Fire & Emergency. Of these, 98% were very satisfied (53%) or satisfied (45%). This compares with 91% in 2014.
96% of respondents said that they were very confident (42%) or confident (54%) that Halifax Regional Fire and Emergency will respond to emergency calls in a timely manner, up from 93% in 2014.
7%1%2%
90%
Victim of crime in past year
Property crime
Violent crime
Other crime
No
49%
18%
8%
21%
4%
Where crime occuredBASE: Victim of crime in past year (n = 108)
At home
Near home
At work
Elsewhere inHalifax
53% 45% 1%
1%
Satisfaction with most services from Halifax Regional Fire & EmergencyBASE: Contact with HRF&E in past year (n = 359)
Very satisfied Satisfied Dissatisfied Very dissatisfied

2018 Citizen Survey - Results Council Report - 17 - October 30, 2018
Respondents were told that “in the event of an emergency or disaster situation, Halifax Regional Fire & Emergency recommends that you have enough supplies to last you for 72 hours, and a plan in case you need to evacuate your home.” Overall, 59% say they meet this guideline.
Recreation and Leisure Overall, 50% of respondents have used a municipally-run recreation facility in the past year, including 11% who use them at least weekly. This is up from 2014, when 40% had used such facilities in the past year; however, the change is primarily due to a higher proportion who used these facilities once or twice a year (21% in 2018 compared to 14% in 2014). Weekly and monthly rates were very similar in 2018 as 2014.
18% of residents have registered for or participated in a municipally-run recreation program over the
past 12 months, about the same as in 2014.
Just 16% (26%) of respondents said they find it difficult to access any municipal facilities or participate in any recreation or leisure programs run by the Municipality – similar to 2014 (13%) and 2010 (21%).
The following chart shows the proportion of total respondents by stated accessibility issue.
42% 54% 4%
<1%
Confidence in Halifax Regional Fire & Emegency
Completely confident Confident Not very confident Not at all confident
0%
2%
4%
6%
8%
10%
12%
fees distance lack of transit facility opentimes
programs notof interest
not disabilityfriendly
other
Accessibility Issue2010
2014
2018
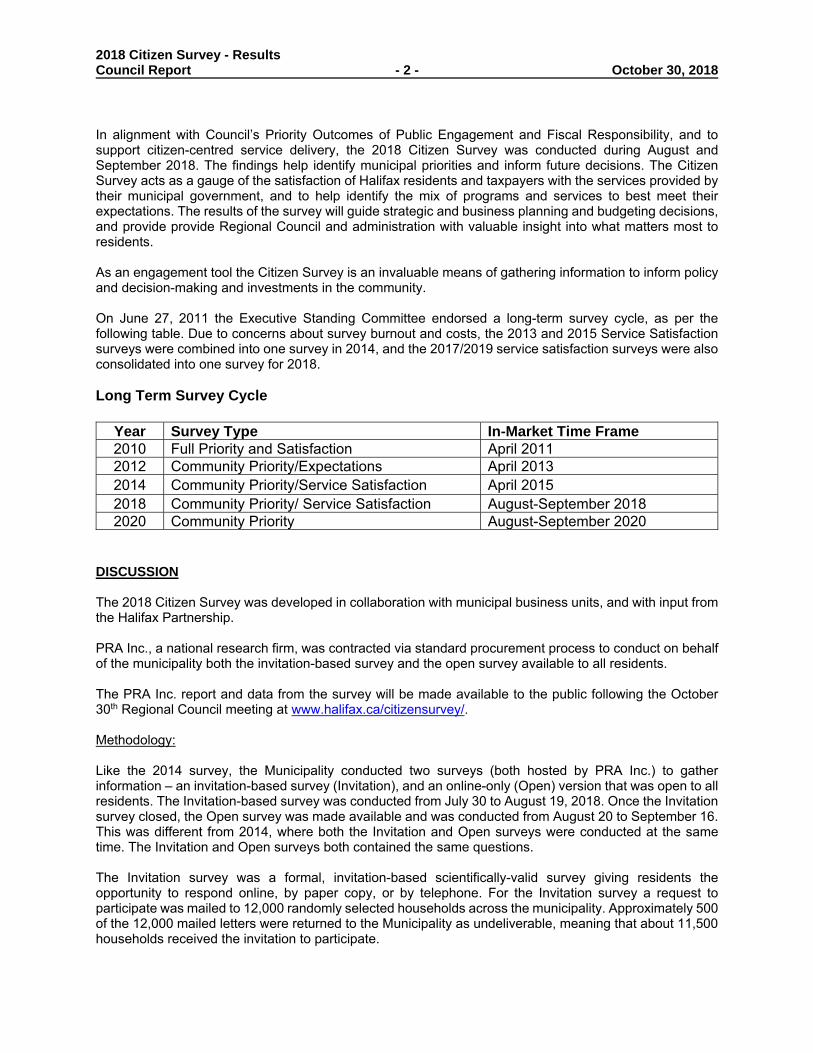
2018 Citizen Survey - Results Council Report - 18 - October 30, 2018 Parks In general, 98% of residents are satisfied with their overall park experience, including 25% who are very satisfied. It is also important to note that, despite differences in use of the parks, there are no statistical differences in the overall rating of park experiences between demographic groups.
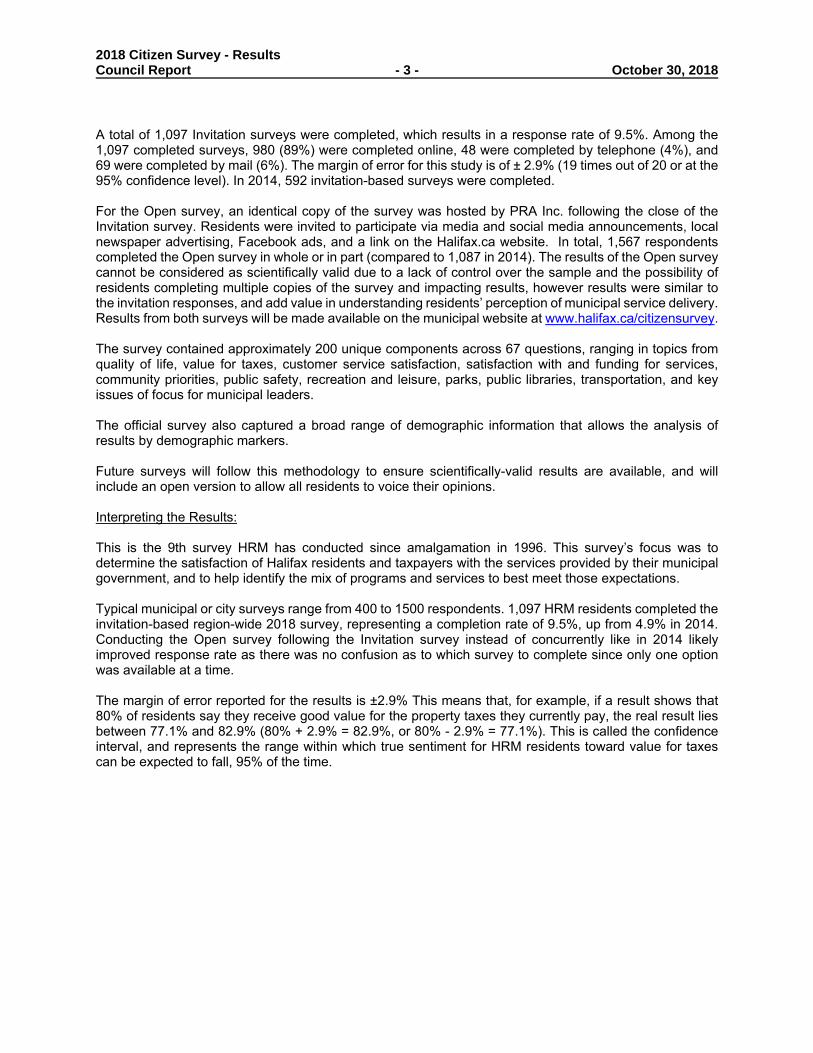
In the past year, respondents’ use of parks and park services varies from 88% who have used parks to 25% who have used off-leash dog parks. In 2012, respondents were asked about their use of parks, playgrounds, and trails, and use is slightly different.
For parks, the biggest change is in frequency of use, as just 19% were using parks weekly in 2012 compared to 34% in 2018. Use in the past year as a whole is up slightly, with 79% having used parks in 2012 compared to 88% in 2018.
For playgrounds, both weekly use (14% in 2018 and 9% in 2012), and total use (41% in 2018 and 49% in 2012) are quite similar. Additionally, for trails, weekly use (20% in 2018 and 25% in 2012) and total use (73% in 2018 and 82% in 2012) are similar.
Satisfaction with cleanliness and maintenance of parks and park services does not tend to be as high as satisfaction with other municipal services; however, more than 7 in 10 are at least satisfied with each included in the survey. Almost all have similar satisfaction ratings, except public washrooms, which 28% are dissatisfied or very dissatisfied with.
25% 73% 2%
<1%
Rating of overall park experience
Very satisfied Satisfied Dissatisfied Very dissatisfied
9%
13%
14%
14%
20%
22%
34%
5%
7%
8%
18%
21%
23%
23%
4%
7%
6%
17%
15%
17%
13%
7%
14%
13%
22%
17%
24%
18%
75%
59%
59%
29%
27%
15%
12%
Off‐leash dog parks
Sports fields/ball fields
Playgrounds
Public washrooms
Wilderness trails
Beaches/waterfront areas
Parks
Use of parks and park services in the past year
Weekly Monthly Every 2 ‐ 3 months 1 ‐ 2 times per year Haven't used

2018 Citizen Survey - Results Council Report - 19 - October 30, 2018
Halifax Public Libraries 64% of respondents have used the services of the Halifax Public Libraries, up from 54% in 2014. Results show younger respondents, those living in Halifax for less time, those with more education, and those with children are most likely to report using library services in the past year. Overall, 99% of respondents who have used libraries in the past 12 months are at least satisfied with them, including 46% who are very satisfied. The total satisfaction is on par with 2014 (98%), although the proportion who are very satisfied is up from 35% to 46%.
For the most part, library users are satisfied with various aspects of libraries, with about 9 in 10 or more reporting they are at least satisfied. However, the proportion who are very satisfied does vary, with 62% of respondents very satisfied with library facilities and 25% of respondents satisfied with open hours.
Table 3 outlines the satisfaction with various Library services over the past 3 surveys. Overall, respondents seem more satisfied with Library services in 2018 than in 2014. Open respondents tend to show lower satisfaction than the Invitation sample.
7%
18%
19%
20%
21%
23%
25%
64%
72%
73%
65%
70%
70%
70%
22%
8%
7%
10%
9%
7%
5%
7%
6%
Public washrooms
Sports fields/ball fields
Beaches/waterfront areas
Off‐leash dog parks
Playgrounds
Parks
Wilderness trails
Satisfaction with cleanliness and maintenanceBASE: Those who have used (n = 339 ‐ 972)
Very satisfied Satisfied Dissatisfied Very dissatisfied
46% 53%
1% <1%
Rating of overall satisfaction with public librariesBASE: Used Halifax Public Library in past 12 months (n = 703)
Very satisfied Satisfied Dissatisfied Very dissatisfied
64%
36%
Used Halifax Public Library services in past 12 months
Yes
No

2018 Citizen Survey - Results Council Report - 20 - October 30, 2018 Table 3. Satisfaction with Library Services (% responding Satisfied or Very Satisfied)
2010 ** 2014
Invitation (Open)
2018 Invitation
(Open)
Library facilities 72%* 97% (96%) 99% (97%)
Library materials 73%* 96% (92%) 95% (94%)
Public technology - 93% (91%) 98% (95%)
Children’s programs - 89% (93%) 96% (90%)
Youth programs - 80% (87%) 94% (84%)
Adult programs - 89% (86%) 94% (88%)
Programs for seniors - 95% (86%) 92% (85%)
Programs for newcomers - 87% (81%) 96% (85%)
Home delivery - 87% (89%) 91% (82%)
Borrow by Mail services - 100% (88%) 96% (89%)
Hours - 90% (79%) 89% (84%)
Overall satisfaction with Halifax Public Libraries - 98% (95%) 99% (96%)
When comparing Library usage between the Invitation and Open groups, there is not much difference. In the Open sample Halifax Central (69%), Alderney Gate (30%), Woodlawn (16%) and Cole Harbour (12%) trend higher.
Respondents tend to say that public libraries and the service they provide to their community are important, as 92% rate them as at least important (including 61% saying very important).
<1%1%1%2%
3%5%5%8%9%9%9%10%14%
19%22%
28%35%
66%
Sheet Harbour
J.D. Shatford (Hubbards)
Home delivery/borrow by mail
In the community
Musquodoboit Harbour
Tantallon
Dartmouth North
Bedford
Sackville
Cole Harbour
Halifax North
Captain William Spry
Woodlawn
Digital collection
Alderney Gate
Keshen Goodman
Website
Halifax Central Library
Public libraries usedBASE: Used Halifax Public Library in past 12 months (n = 703)Note: Respondents could provide more than one answer.

2018 Citizen Survey - Results Council Report - 21 - October 30, 2018 When asked what prevents them from using libraries most often, 59% say nothing or there are no
barriers, about the same as 2014. The most common barriers cited include inconvenient hours/not open 7 days a week (13%), inconvenient locations (7%), no programs/services that they want (7%), or transportation issues (6%). In 2014, hours of operation was also the most cited barrier at 15%.
Transportation Amongst respondents, 59% commute to work or school. For commuters, the primary mode of travel is driving themselves at 69%, with 31% of commuters using public transit. In the Open survey, 64% indicated they commute to work, with 64% driving themselves, 37% using public transit, and 20% walk.
Overall, 59% (66%) have used Halifax Transit in the past 12 months, up from 53% in 2014. Among those who have used transit in the past year, 16% (21%) are daily transit users, while 50% are occasional users (i.e., several times per year or less). When examined as a whole, including those who have not used transit in the past year, about 18% of respondents use transit at least several times week.
When asked what would get them to use transit more or more often, the reasons tend to be different between users and non-users. The most common factors for users are increased service frequency (45%) and reliable/on-time service (45%). For non-users, there are 56% who say nothing would make them use it or use it more often. The most common factors for non-users are more direct or limited stop routes (19%), added service to rural areas (18%), and increased service frequency (18%).
<1%
<1%
2%
9%
12%
21%
31%
69%
Other
Rural transit
Taxi
Bicycle
Passenger
Walk
Public transit
Drive myself
Primary mode of travel for commutingBASE: Commute to work or school (n = 631)
Note: Respondents could provide more than one answer.
16% 15% 20% 50%
Frequency of Halifax Transit useBASE: Used Halifax Transit in past 12 months (n = 645)
Daily Several times per week Several times per month Several times per year or less

2018 Citizen Survey - Results Council Report - 22 - October 30, 2018
Table 4: Encourage to use public transit more often
Used Halifax Transit in past
12 months (n = 645)
Have not used in past 12 months
(n = 4485) Increased service frequency 45% 18% Reliable/on-time service 45% 17% Improved/access to schedule information 32% 13% Improved/electronic fare payment options 31% 13% More direct or limited stop routes/faster 30% 19% App to determine bus arrival times 28% 8% Additional urban core bus routes 23% 6% Added service to rural areas 22% 18% Fewer transfers 22% 14% Stops closer to home or work 22% 14% Additional shelters 20% 7% Additional Park & Ride lots 14% 10% Increased safety 12% 6% Environmental concerns 11% 4% Additional designated fully accessible routes 9% 3% Additional bike rack accessible buses 6% 2% Extend hours 1% 1% Better customer services 1% - When I can’t drive <1% 1% Other 3% 3% Nothing - I don't plan to use transit 4% 47% Nothing - happy with current services 14% 9% Note: Respondents could give more than one response; therefore, columns will sum to more than 100%.
Generally, respondents see a need for more downtown parking, with a greater emphasis on downtown Halifax (74%) than downtown Dartmouth (34%). Just 21% think downtown parking in either area is sufficient, and 4% believe less downtown parking is needed. FINANCIAL IMPLICATIONS The total cost of the 2018 HRM Citizen Survey is $42,424 (net HST included), including consulting fees of $12,318 (net HST included). Funding for this expenditure has been provided for in contract services (6399) in Finance and Asset Management cost centre M351 There are no immediate financial implications resulting from this report. COMMUNITY ENGAGEMENT Citizen Surveys are one way the HRM engages the community. These results in combination with many other engagement approaches help to inform Regional Council and the organization of citizen satisfaction with services and priorities.

2018 Citizen Survey - Results Council Report - 23 - October 30, 2018
ATTACHMENTS
Appendix A - Consultants Report - PRA HRM 2018 Citizen Survey
A copy of this report can be obtained online at halifax.ca or by contacting the Office of the Municipal Clerk at 902.490.4210.
Report Prepared by: Michael Pappas, Planning & Performance Coordinator, Finance & Asset Management 902.490.5534
Report Approved by: ______________________________________________________
Wendy Lines, Acting Manager, Corporate Planning, Finance & Asset Management, 902.490.6470

WINNIPEG | OTTAWA
[email protected] www.pra.ca
September 2018
HALIFAX REGIONAL MUNICIPALITY 2018 CITIZEN SURVEY REPORT

i
EXECUTIVE SUMMARY
The 2018 Citizen Survey is the ninth time the Halifax Regional Municipality has undertaken this
study since the Municipality was formed by the amalgamation of five independent municipal
units. The primary objectives of this research are to determine the satisfaction of Halifax
residents and taxpayers with the services provided by their municipal government and to help
identify the mix of programs and services to best meet expectations of Halifax residents and
taxpayers.
In July 2018, the Municipality randomly selected 12,000 Halifax households to receive an
invitation to complete the survey. Approximately 500 of the 12,000 mailed letters were returned
to the Municipality as undeliverable, meaning that about 11,500 households received the survey.
Over approximately four weeks, a total of 1,097 surveys were completed, which results in a
response rate of 9.5%. The margin of error for this study is of ± 2.9% (19 times out of 20 or at
the 95% confidence level).
Quality of life
Almost all respondents (96%) say that the overall quality of life in the Halifax region is at least
good, which is virtually unchanged from 2012 (94%). Over the past five years, 38% of
respondents say the quality of life in Halifax has improved, which is about three times more than
those who say it has worsened (13%). The proportion who say it has improved is higher in 2018
than 2012 (19%) or 2010 (25%).
Value for taxes
About 73% of respondents say they get at least good value for the level of property taxes they
currently pay relative to the programs and services they receive from the Municipality. The
proportion who say they receive at least good value is slightly higher than 2014 (65%).
In terms of budgeting, the majority (53%) say they would maintain taxes and fees, even if it
means reducing some services to maintain others, followed by 30% who say they would
increase municipal services, even if taxes or fees must increase. When asked how they would
prefer to fund adding or maintaining services and facilities, respondents tend to favour some
aspect of user fees - either a standalone increase to user fees (36%), or in combination with a
property tax increase (20%) or property tax increase and debt increase (31%).
Satisfaction with municipal services
Respondents were asked to rate their satisfaction with 23 municipal services. In general,
respondents appear to be satisfied with services, with all but one service receiving a majority
who are at least satisfied. Respondents are most satisfied with garbage, recycling, and organics
collection at 88% and least satisfied with bike lanes and cycling facilities (41%). Compared to
2014, two aspects saw noticeable drops: public transit - Access-A-Bus (88% in 2014 to 72% in
2018) and overall transit service (72% in 2014 to 62% in 2018), while bike lanes and cycling
facilities increased from 30% in 2014 to 41% in 2018.
The generally positive perception of services leads to 81% who are at least satisfied with the
delivery of all the services provided by the Municipality.

ii
When asked about which services should be increased, maintained, or reduced, in all cases the
most common answer was maintain service levels. The services respondents would like to see
increased most are street/road maintenance (47%) and public transit – bus/ferry (41%).
Community priorities
Among six Council priorities, almost 9 in 10 respondents say that each of the six priorities are at
least important, with Transportation (56% very important) and Healthy, Liveable Communities
(54% very important) identified as most important.
Among six infrastructure priorities, two tend to stand out as being most important — integrated
mobility projects and public transit — with both having 43% of respondents saying they are very
important.
When ranking their top infrastructure projects for the Municipality to pursue over the next five
years, the highest priority was maintenance of existing streets and roads, which 22% selected as
their top priority and 51% selected as one of their top three. This was the only project where at
least half selected it in their top three.
Service quality
Overall, 46% of respondents say they have had any contact with a municipal employee, either in-
person, in writing, by telephone, email/website, by fax, by social media, or by encounter with a
police/by-law officer, over the last 12 months and 20% have accessed the Municipality’s
Customer Service Centre in-person. Among those who had any contact with the Municipality in
the past year, 81% are at least satisfied with their contact, up from 68% in 2014.
Overall, 78% have accessed www.halifax.ca (61% in the past year) and 57% have accessed
services at www.halifax.ca/home/online-services (34% in the past year). Most often, respondents
were searching for information (60%) or completing an online payment (29%).
Among all residents, 76% would be at least likely to access online services in the future,
including 30% who would be very likely.
Access to information and public engagement
In the past 12 months, respondents are most likely to have received or accessed information
through calling 311 (45%), viewing or engaging the Municipality’s social media channels
(37%), or contacting a Councillor or municipal staff (29%). Among those who have accessed the
service or information in the past year, the majority rate each as at least easy to access with
calling 311 (97%) and viewing or engaging the Municipality’s social media channels (98%)
rated highest.
Among other types of engagement respondents have taken part in over the past 12 months,
respondents are most likely to have attended an in-person public meeting (39%), completed
online surveys from the Municipality (38%), or spoken directly with their Councillor or
municipal staff (27%).
About 83% at least agree that the Municipality provides sufficient tools and information to allow
them to meaningfully participate and engage with the Municipality.

iii
For most, their preferred method of engaging with the Municipality tends to be online, either
through an online survey (68%), email (47%), or social media (33%).
Public safety
In the past two years, 39% of residents say the police approached them, stopped them, or made
contact with them for any reason. Among those who had contact with the police in the past two
years, almost 8 in 10 are at least satisfied with the way the police treated them during the last
time they had contact with police. About three-quarters of citizens think the police are doing at
least a good job in their area, with 28% saying the police are doing an excellent job. Most
citizens say that police in their neighbourhood never or almost never (57%) exceed their
authority.
Overall, almost three-quarters of citizens say they feel at least reasonably safe from crime when
walking alone in their area after dark, including 26% who feel very safe.
Overall, 10% of residents say they have been a victim of crime in the past year, with the most
common type of crime reported as property crime at 7%. The proportion who reported a property
crime is down from 17% in 2010, as well as violent crime at 3% in 2010 down to 1% in 2018.
Among victims of crime in the past year, 75% say they reported the crime to police.
Among eight fire services the Halifax Regional Fire & Emergency offers, respondents are very
aware of several, including firefighting and rescue (96%), motor vehicle accident response
(95%), medical response (95%), and community/public events (92%). For emergency
management services, respondents are less aware of these than fire services, with response and
recovery (75%) receiving the highest level of awareness.
In the past year, 33% have required or witnessed a response from Halifax Regional Fire &
Emergency. Among those who had contact with Halifax Regional Fire & Emergency in the past
year, 98% are at least satisfied with the services provided.
Overall, 96% of respondents are at least confident that Halifax Regional Fire & Emergency will
respond to emergency calls in a timely manner, including 42% who are completely confident.
Recreation and leisure
Overall, 50% of respondents have used a municipally-run recreation facility in the past year,
including 11% who use them at least weekly. About 18% have registered or participated in a
municipally-run recreation program over the past 12 months. Just 16% said they find it difficult
to access any municipal facilities or participate in any recreation or leisure programs run by the
Municipality, with no facilities or programs of interest within a reasonable distance from their
home / time it takes to get there being the most common difficulty (47%).

iv
Parks
In the past year, respondents’ use of parks and park services varied from 88% who have used
parks to 25% who have used off-leash dog parks. More than 7 in 10 are at least satisfied with
each park and park service included in the survey. Almost all have similar satisfaction ratings,
with the exception of public washrooms, which 28% are dissatisfied or very dissatisfied with.
Overall, 98% of residents are satisfied with their overall park experience, including 25% who are
very satisfied.
Public libraries
About 64% of respondents have used services of Halifax Public Libraries in the past 12 months
in a branch, in the community, or online. This is up slightly from 57% in 2014. The most
common sources of information for those using the library are the website (72%) and library
staff (52%). Overall, 99% of respondents who have used libraries in the past 12 months are at
least satisfied with them, including 46% who are very satisfied.
Respondents tend to say that public libraries and the service they provide to their community are
important, as 92% rate them as at least important (including 61% who say they are very
important).
Transportation
Amongst respondents, 59% commute to work or school. For commuters, the primary mode of
travel is driving themselves at 69%, with 31% of commuters using public transit.
Overall, 59% have used Halifax Transit in the past 12 months, up from 53% in 2014. Among
those who have used transit in the past year, 16% are daily transit users, while 50% are
occasional users (i.e. once a month or less often). When examined as a whole, including those
who have not used transit in the past year, about 18% of respondents use transit at least several
times week.
Generally, respondents see a need for more downtown parking, with a greater emphasis on
downtown Halifax (74%) than downtown Dartmouth (34%). Just 21% think downtown parking
in either area is sufficient.
Halifax Regional Municipality issues
Respondents were asked to name up to three issues facing the Halifax region over the next five
years in which they feel the Municipality should invest greater resources. Respondents named
many issues, with three being mentioned more often than others, all of which related to
transportation. These included transit (23%), road conditions, sidewalks, and snow removal
(22%), and transportation and traffic (21%).
Table of Contents
EXECUTIVE SUMMARY ............................................................................................................. i
1.0 Background and objectives ................................................................................................. 1
2.0 Methodology ....................................................................................................................... 2
2.1 Questionnaire design ................................................................................................. 2
2.2 Sampling plan ........................................................................................................... 2
2.3 Survey administration ............................................................................................... 2
2.4 Weighting .................................................................................................................. 3
2.5 Non-response ............................................................................................................ 3
2.6 Profile of participants ................................................................................................ 4
2.7 Key differences ......................................................................................................... 5
3.0 Quality of life ...................................................................................................................... 6
4.0 Value for taxes .................................................................................................................... 7
4.1 Value for property taxes ............................................................................................ 7
4.2 Municipal budgets ..................................................................................................... 8
5.0 Satisfaction with municipal services ................................................................................. 10
5.1 Satisfaction with municipal services ....................................................................... 10
5.2 Overall satisfaction with delivery of municipal services ........................................ 12
5.3 Service levels for municipal services ...................................................................... 13
6.0 Community priorities ........................................................................................................ 16
6.1 Council priorities .................................................................................................... 16
6.2 Infrastructure priorities ........................................................................................... 17
7.0 Service quality .................................................................................................................. 19
7.1 In-person contact ..................................................................................................... 19
7.2 Customer Service Centre contact ............................................................................ 20
7.3 Perceptions of most recent contact with the Municipality ...................................... 21
7.4 Online experiences .................................................................................................. 22
8.0 Access to information and public engagement ................................................................. 24
8.1 Frequency of accessing information ....................................................................... 24
8.2 Ease of accessing information ................................................................................ 25
8.3 Frequency of engaging with the Municipality ........................................................ 26
8.4 Engaging with the Municipality .............................................................................. 27
9.0 Public safety ...................................................................................................................... 28
9.1 Perceptions of the police ......................................................................................... 28
9.2 Recent contact with police ...................................................................................... 29
9.3 Perceptions of police ............................................................................................... 30
9.4 Safe from crime ....................................................................................................... 30
9.5 Victim of crime ....................................................................................................... 31
9.6 Fire services ............................................................................................................ 32
9.7 Emergency management ......................................................................................... 33
9.8 Experience with Halifax Regional Fire & Emergency ........................................... 33
9.9 Emergency preparedness ........................................................................................ 34
10.0 Recreation and leisure ....................................................................................................... 35
11.0 Parks .................................................................................................................................. 37
11.1 Use of parks and park services ............................................................................ 37
11.2 Satisfaction with cleanliness and maintenance of parks ..................................... 38
11.3 Overall park experience ...................................................................................... 39
12.0 Public libraries .................................................................................................................. 40
12.1 Use of public libraries ......................................................................................... 40
12.2 Satisfaction with public libraries ......................................................................... 41
12.3 Overall library satisfaction .................................................................................. 42
12.4 Importance of libraries ........................................................................................ 43
13.0 Transportation ................................................................................................................... 44
13.1 Commuting to work or school ............................................................................. 44
13.2 Halifax transit ...................................................................................................... 45
13.3 Downtown parking .............................................................................................. 47
14.0 Halifax Regional Municipality issues ............................................................................... 48
Appendix A – 2018 Halifax Citizen Survey

1
1.0 Background and objectives
In the summer of 2018, the Halifax Regional Municipality (the Municipality) hired PRA Inc. to
conduct its Citizen Survey. The 2018 survey marks the ninth study of this nature since the
Municipality was formed by the amalgamation of five independent municipal units.
This ongoing citizen research plays a key role in the Municipality’s mission to ensure it provides
the programs and services that are required and desired by its citizens. The Municipality has two
main objectives in conducting the 2018 Citizen Survey, which are to:
► determine the satisfaction of Halifax residents and taxpayers with the services provided
by their municipal government; and
► help identify the mix of programs and services to best meet the expectations of Halifax
residents and taxpayers.
The Municipality will use the findings from these questions and answers to implement strategies
to make Halifax vibrant. It is through the analysis of trends in priorities and preferences that the
Municipality can make broad policy decisions to set the stage for the future success of Halifax.
The Citizen Survey will help the Municipality determine the level of emphasis that should be
placed when making decisions about where to allocate efforts and expenditures.

2
2.0 Methodology
2.1 Questionnaire design
The Municipality designed the questionnaire in consultation with various Halifax Regional
Municipality business units and key stakeholders. PRA Inc. reviewed the draft questionnaire and
provided feedback to improve and refine questions to ensure more reliable results were obtained
from the questions.
PRA pretested the survey by telephone using random-digit dialling with eight citizens on
July 17, 2018. This pretest resulted in slight wording changes to questions. The final
questionnaire can be found in Appendix A.
2.2 Sampling plan
In July 2018, the Municipality randomly selected 12,000 Halifax households to receive an
invitation to complete the survey. A sample of households was taken from a comprehensive list
of all households in Halifax using the Municipality’s civic address database. This database was
used to randomly select a proportional representation of households from all 16 districts in
Halifax, including both single-family and multi-unit households. This sampling method ensured
that the proportion of households selected was a close representation of households in Halifax.
This sampling method was used in the 2010, 2012, and 2014 Citizen Surveys.
2.3 Survey administration
The Municipality drafted a letter inviting a member of the household to complete the survey,
either online, by telephone, or by receiving a paper copy by mail. To access the online survey,
each letter contained a passcode, which allowed respondents to complete the survey and
prevented unauthorized completion of the survey.
Two weeks after sending the letter, the Municipality mailed all 12,000 households a reminder
postcard encouraging participation in the research. The postcard also included contact
information for citizens to use if they no longer had their invitation letter.
Approximately 500 of the 12,000 mailed letters were returned to the Municipality as
undeliverable, meaning that about 11,500 households received the survey.
The survey was open from July 30 to August 19, 2018. A total of 1,097 surveys were completed,
which results in a response rate of 9.5%. Among the 1,097 completed surveys, 980 (89%) were
completed online, 48 were completed by telephone (4%), and 69 were completed by mail (6%).
The margin of error for this study is of ± 2.9% (19 times out of 20 or at the 95% confidence
level).

3
2.4 Weighting
In some cases, when the random sample diverges from Canadian census data, PRA corrects for
discrepancies. For this study, the sample is weighted to the general population data of Halifax to
correct for differences in age, gender, and area of residence (urban, suburban, or rural), and
proportions in this report are weighted unless otherwise stated. The table below shows the
overall sample relative to the proportions used for weighting.
Table 1: Weighting profile
(n = 1,097) Population
Gender Man 43% 48%
Woman 51% 52%
Undetermined 6% -
Age 18 to 34 12% 29%
35 to 54 27% 34%
55 and older 56% 36%
Prefer not to say 5% -
Region Urban 82% 82%
Suburban 3% 4%
Rural 15% 14%
Population data is based on 2016 Census information for gender and age, and on information
from Halifax Regional Municipality for region.
Note: Totals may not equal 100% due to rounding.
2.5 Non-response
Throughout this report, only those who have provided a response to a question are included in
the results. Those respondents who did not provide an answer to a question have been removed
from the calculations, unless otherwise shown.

4
2.6 Profile of participants
The table below summarizes the demographic profile of respondents.
Table 2: Profile of respondents
(n = 1,097) Years lived in Halifax Regional Municipality
4 years or less 12%
5 to 9 years 10%
10 to 14 years 10%
15 to 20 years 10%
More than 20 years 58%
Highest level of education High school diploma (equivalent) or lower 16%
Apprenticeship, trades, college, CEGEP, or other non-university certificate or diploma
28%
University graduate (Bachelor’s degree) 32%
University certificate, diploma, or degree above bachelor level 25%
Total household income Less than $50,000 30%
$50,000 to less than $75,000 20%
$75,000 to less than $100,000 18%
$100,000 to less than $125,000 12%
Over $125,000 19%
Rent or own Own home (with or without mortgage) 67%
Rent 30%
Other 3%
People in household
1 23%
2 45%
3 or more 32%
Children or seniors in household*
Children 22%
Seniors 24%
Neither 55%
Annual property tax
Less than $2,000 19%
Between $2,000 and $3,000 21%
Between $3,000 and $4,000 13%
Over $4,000 12%
Don’t know/don’t pay property tax 35%
Ethnicity*
Caucasian 91%
Black (African Nova Scotian) 2%
Chinese 2%
Arab 2%
Métis 1%
Black (African Canadian) 1%
South Asian 1%
First Nations 1%
Acadian 1%
West Asian 1%
Latin American 1%
Other 2%
Note: Totals may not equal 100% due to rounding. *Note: Respondents could provide more than one answer; totals may sum to more than 100%.
5
2.7 Key differences
Large sample sizes may increase the likelihood of obtaining statistical differences between
groups and lead to over identification of differences that are small or not practically different. In
standard research, differences are identified at a probability level below 5% (.05); however, for
this report, the standard has been raised to 0.1% (.001) to identify differences that are practical
and worthy of identification. Throughout this document, any differences reported meet this
criteria, unless otherwise stated. If no key differences are discussed for a given question, it means
no differences between groups met the criteria.

6
3.0 Quality of life
In 2018, almost all respondents (96%) say that the overall quality of life in the Halifax region is
at least good, including 35% who say it is very good. This is almost unchanged from 2012 (the
last time this question was asked) when 94% said it was good or very good.
Key differences. Results show differences in the rating of overall quality of life by two
demographic groups:
► Those in the highest income category (over $125,000 annually) are most likely to rate
their overall quality of life as very good, while those in the two lowest income groups
(less than $50,000 and $50,000 to less than $75,000) are least likely to rate their overall
quality of life as very good.
► Home owners are more likely than renters to rate their quality of life as very good.
Over the past five years, 38% of respondents say the quality of life in Halifax has improved,
which is about three times more than those who say it has worsened (13%). The proportion who
say it has improved is higher than 2012 (19%) or 2010 (25%), while the proportion who say it
has worsened is lower (28% in 2012 and 26% in 2010).
35% 61% 3%
1%Overall quality of life in Halifax region
Very good Good Poor Very poor
38% 49% 13%
Quality of life in past five years in Halifax region
Improved Stayed the same Worsened

7
4.0 Value for taxes
4.1 Value for property taxes
About 73% of respondents say they get at least good value for the level of property taxes they
currently pay relative to the programs and services they receive from the Municipality. This
includes just 8% who say they get very good value. The proportion who say they receive at least
good value is higher than 2014 (65%) and similar to 2012 (72%).
Key differences. Results show differences in the rating of value for property tax by two
demographic groups:
► Those living in suburban/urban areas are much more likely to rate the value for property
tax as good or very good (76%) than those living in rural areas (58%).
► Somewhat surprisingly, those in the lowest income category — less than $50,000
annually (17%) — are more likely to rate the value for property tax as very good than
those in households making $50,000 or more (4% to 11%).
8% 66% 23% 3%
Value for propertyBASE: Those who pay property taxes (n = 835)
Very good value Good value Poor value Very poor value

8
When examining the reason for their rating of value, those who said they received very good
value tend to indicate that they are satisfied with the services they receive, either services in
general (42%) or municipal services (21%). For those who only report good value, many cannot
give a specific reason, with 31% saying they cannot define their reason. For poor value, it is
based on a combination of high cost of taxes (29%), mixed with poor service, specifically road
maintenance (28%) and transportation (25%).
Table 3: Reason for value of property taxes
Very good
value (n = 61)
Good value (n = 539)
Poor or very poor value (n = 222)
Satisfied with services 42% 13% <1%
Satisfied with municipal services 21% 8% 2%
Fair cost for services/good value/fair taxes 18% 10% -
Satisfied with aesthetics 10% 2% -
Satisfied with safety/emergency services 9% 4% 2%
Satisfied with facilities/programs 7% 4% -
High cost for services/poor value for tax dollar/high taxes 6% 8% 29%
Satisfied with transportation 6% 2% -
Dissatisfied with road maintenance 1% 9% 28%
Dissatisfied with services 1% 1% 9%
Dissatisfied with municipal services - 8% 22%
Dissatisfied with transportation - 6% 25%
Always room for improvement - 5% -
Satisfied with road maintenance - 4% 1%
Dissatisfied with use of tax dollar/spending priorities/bowing to developers - 3% 11%
Dissatisfied with safety/emergency services - 2% 8%
Dissatisfied with facilities/programs - 2% 6%
Dissatisfied with aesthetics - 2% 11%
Dissatisfied with lack of sidewalks/curbs/crosswalks - 2% 6%
Dissatisfied with lack of water/septic services - 1% 5%
Dissatisfied with parking issues - 1% 3%
Dissatisfied with property assessment/unfair calculations/condo prices - 1% 5%
Dissatisfied with recycling issues - <1% 2%
Poor value for tax dollar when living in rural areas - <1% 6%
Other 2% 5% 10%
Don’t know 16% 31% 7%
Note: Respondents could give more than one response; therefore, columns will sum to more than 100%.
4.2 Municipal budgets
When asked for their opinion about municipal budgeting, the majority (53%) say they would
maintain taxes and fees, even if it means reducing some services to maintain others, while 30%
say they would increase municipal services, even if taxes or fees must increase. Just 17% say
they would decrease taxes and fees, even if municipal services must decrease.
Key differences. Results show differences in opinion about municipal budgeting among two
demographic groups:
► Those who rent (40%) are more likely to say the Municipality should increase services,
even if taxes or fees must increase than those who own their home (27%).
► Those who pay the most in property taxes — over $4,000 annually (16%) — are much
less likely than their counterparts with lower property taxes (28% to 32%) to say the
Municipality should increase services, even if taxes or fees must increase.
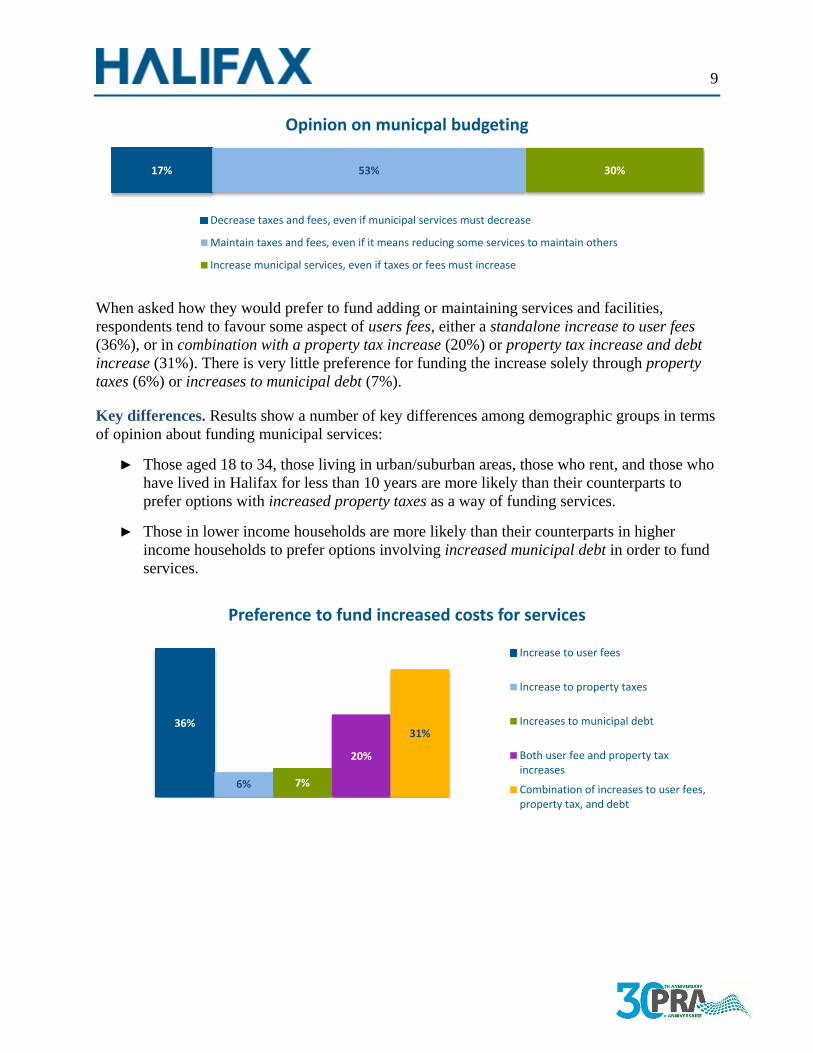
9
When asked how they would prefer to fund adding or maintaining services and facilities,
respondents tend to favour some aspect of users fees, either a standalone increase to user fees
(36%), or in combination with a property tax increase (20%) or property tax increase and debt
increase (31%). There is very little preference for funding the increase solely through property
taxes (6%) or increases to municipal debt (7%).
Key differences. Results show a number of key differences among demographic groups in terms
of opinion about funding municipal services:
► Those aged 18 to 34, those living in urban/suburban areas, those who rent, and those who
have lived in Halifax for less than 10 years are more likely than their counterparts to
prefer options with increased property taxes as a way of funding services.
► Those in lower income households are more likely than their counterparts in higher
income households to prefer options involving increased municipal debt in order to fund
services.
17% 53% 30%
Opinion on municpal budgeting
Decrease taxes and fees, even if municipal services must decrease
Maintain taxes and fees, even if it means reducing some services to maintain others
Increase municipal services, even if taxes or fees must increase
36%
6% 7%
20%
31%
Preference to fund increased costs for services
Increase to user fees
Increase to property taxes
Increases to municipal debt
Both user fee and property taxincreases
Combination of increases to user fees,property tax, and debt

10
5.0 Satisfaction with municipal services
5.1 Satisfaction with municipal services
Respondents were asked to rate their satisfaction with 23 municipal services. Respondents appear
to be most satisfied with garbage, recycling, and organics collection at 88%, with 31% very
satisfied. At the lower end, respondents are least satisfied with bike lanes and cycling facilities
(41%), which is the only aspect tested where fewer than half of respondents are satisfied.
Key differences. Results show that among the 23 services, respondents tended to rate their
satisfaction with services similarly, as there was only one difference for each demographic group
(with the exception of how long residents lived in Halifax; this group had two significant
differences). The statistically significant differences included the following:
► Females are more likely than males to be satisfied with arts and cultural facilities and
programs.
► Those who lived in Halifax the longest tend to be more satisfied with bike lanes/cycling
facilities and less with litter control/graffiti removal. Those who have been living in
Halifax for less than 10 years tend to be more likely to rate their satisfaction with
environmental protection and sustainability as the extremes; that is, more likely to rate as
very satisfied or very dissatisfied.
► Those who are in the lowest income category are more likely to be satisfied with bike
lanes/cycling facilities.
► Those paying the highest property tax are more likely to be satisfied with recreation
programming.
► Those with children under 18 in the household are more like to be satisfied with
street/road maintenance.
► Those in the youngest age group tended to be on the extreme side (more likely to say very
satisfied or very dissatisfied) of rating their satisfaction with business support services
than other age groups.
► Those living in urban/suburban areas are more likely than those living in rural areas to be
satisfied with litter control/graffiti removal and recreation facilities.

11
2%
4%
4%
5%
5%
6%
6%
6%
6%
6%
6%
6%
7%
8%
9%
10%
10%
12%
12%
12%
13%
14%
31%
50%
47%
64%
58%
60%
35%
65%
66%
66%
66%
67%
67%
55%
55%
71%
52%
54%
73%
73%
73%
75%
58%
57%
32%
33%
24%
26%
24%
38%
19%
20%
23%
22%
21%
21%
27%
26%
15%
26%
26%
12%
13%
12%
10%
15%
8%
16%
15%
8%
11%
11%
21%
11%
9%
6%
7%
6%
6%
12%
12%
5%
12%
11%
4%
3%
2%
2%
13%
4%
Community planning/land use planning
Street/road maintenance
Public/community engagement
Traffic management
Traffic/pedestrian safety
Bike lanes/cycling facilities
Parking enforcement
Community standards
Economic development
Sidewalk maintenance
Environmental protection and sustainability
Overall city maintenance
Overall transit service
Winter maintenance
Business support services
Public transit (bus/ferry)
Litter control/graffiti removal/cleanliness
Emergency preparedness
Recreation facilities
Recreation programming
Arts and cultural facilities and programs
Public transit (Access-A-Bus )
Garbage, recycling, and organics collection
Satisfaction with municipal services
Very satisfied Satisfied Dissatisfied Very dissatisfied

12
In the 2014 Citizen Survey, respondents were asked about their satisfaction with nine of the 23
services asked about in 2018. Compared to 2014, results show similar levels of satisfaction, with
the exception of three services. Two services, both transit related, saw significant drops from
2014, including public transit - Access-A-Bus (88% in 2014 to 72% in 2018) and overall transit
service (72% in 2014 to 62% in 2018).
The only aspect to see a significant increase from 2014 was bike lanes and cycling facilities,
from 30% in 2014 to 41% in 2018; however, even with this increase, it still is the service with
the lowest satisfaction ratings.
5.2 Overall satisfaction with delivery of municipal services
Overall, 81% are at least satisfied with the delivery of all the services provided by the
Municipality, including 4% who are very satisfied.
30%
45%
72%
63%
62%
67%
88%
75%
86%
41%
52%
62%
63%
64%
72%
72%
73%
88%
Bike lanes/cycling facilities
Street/road maintenance
Overall transit service
Winter maintenance
Litter control/graffiti removal/cleanliness
Sidewalk maintenance
Public transit (Access-A-Bus )
Overall city maintenance
Arts and cultural facilities and programs
Satisfaction with municipal services: 2014 to 2018
2018 2014
4% 77% 18% 2%
Overall satisfaction with delivery of municipal services
Very satisfied Satisfied Dissatisfied Very dissatisfied

13
5.3 Service levels for municipal services
When asked about which services should be increased, maintained, or reduced, in all cases the
most common answer was maintain service levels. The services respondents would like to see
increased most are street/road maintenance (47%) and public transit – bus/ferry (41%). The only
service with more respondents saying to decrease than increase service is parking enforcement,
with 11% saying increase and 25% saying decrease. The service that seems to be the most
divisive is bike lanes/cycling facilities, as it is the only service with less than half saying to
maintain it, and the second most saying to decrease it (22%).
Key differences. When examining service level preferences, there are a number of statistically
significant differences among demographic groups.
► Females tend to be more likely than males to want increased levels of service for
environmental protection and sustainability, police services, and public transit (Access-
A-Bus), while males tend to be more likely to prefer increased levels of economic
development, but reduced levels of arts and cultural facilities and programs and bike
lanes/cycling facilities.
► Younger residents are more likely to say they want increased levels of a number of
services. These include arts and cultural facilities and programs, bike lanes/cycling
facilities, economic development, parks, playgrounds, and greenspaces, public libraries,
public transit (bus/ferry), recreation facilities, traffic management, and winter
maintenance.
► Home renters were more likely than home owners to want increased levels of arts and
cultural facilities and programs, environmental protection and sustainability, fire
services, public libraries, and sidewalk maintenance.
► Those who have lived in Halifax for over 20 years tend to be more likely to prefer
increased levels of police services and reduced levels of bike lanes/cycling facilities.
Those who have not lived in Halifax as long are more likely to want increased levels of
environmental protection and sustainability, public libraries, and parks, playgrounds,
and greenspaces, but reduced levels of parking enforcement.
► Those with high school education or less are more likely to want increased levels of fire
services, while university graduates tend to prefer increased levels of bike lanes/cycling
facilities, but reduced levels of police services.
► Residents with children are more likely than those without to want reduced levels of
community standards, and increased levels of parks, playgrounds, and greenspaces,
recreation facilities and recreation programming. Those without children in the
household are more likely to want increased levels of traffic management.
► Those in lower income households are more likely than their counterparts to want
increased levels of emergency preparedness, fire services, and public libraries.
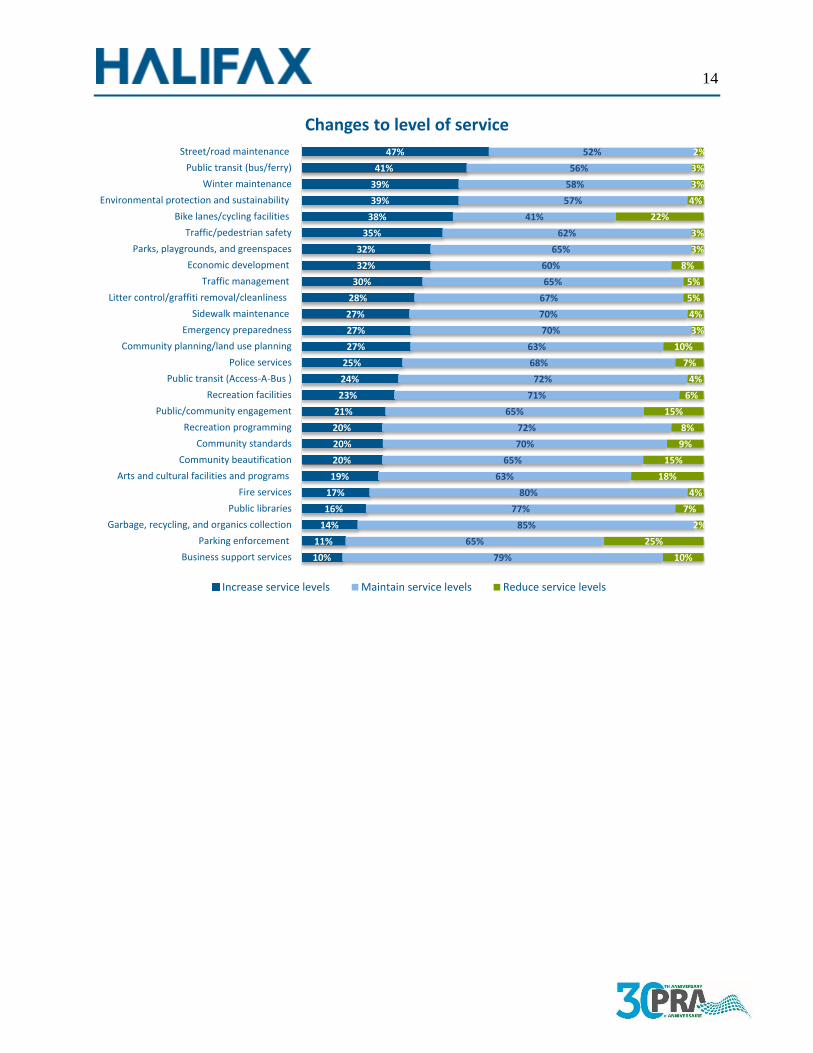
14
10%
11%
14%
16%
17%
19%
20%
20%
20%
21%
23%
24%
25%
27%
27%
27%
28%
30%
32%
32%
35%
38%
39%
39%
41%
47%
79%
65%
85%
77%
80%
63%
65%
70%
72%
65%
71%
72%
68%
63%
70%
70%
67%
65%
60%
65%
62%
41%
57%
58%
56%
52%
10%
25%
2%
7%
4%
18%
15%
9%
8%
15%
6%
4%
7%
10%
3%
4%
5%
5%
8%
3%
3%
22%
4%
3%
3%
2%
Business support services
Parking enforcement
Garbage, recycling, and organics collection
Public libraries
Fire services
Arts and cultural facilities and programs
Community beautification
Community standards
Recreation programming
Public/community engagement
Recreation facilities
Public transit (Access-A-Bus )
Police services
Community planning/land use planning
Emergency preparedness
Sidewalk maintenance
Litter control/graffiti removal/cleanliness
Traffic management
Economic development
Parks, playgrounds, and greenspaces
Traffic/pedestrian safety
Bike lanes/cycling facilities
Environmental protection and sustainability
Winter maintenance
Public transit (bus/ferry)
Street/road maintenance
Changes to level of service
Increase service levels Maintain service levels Reduce service levels
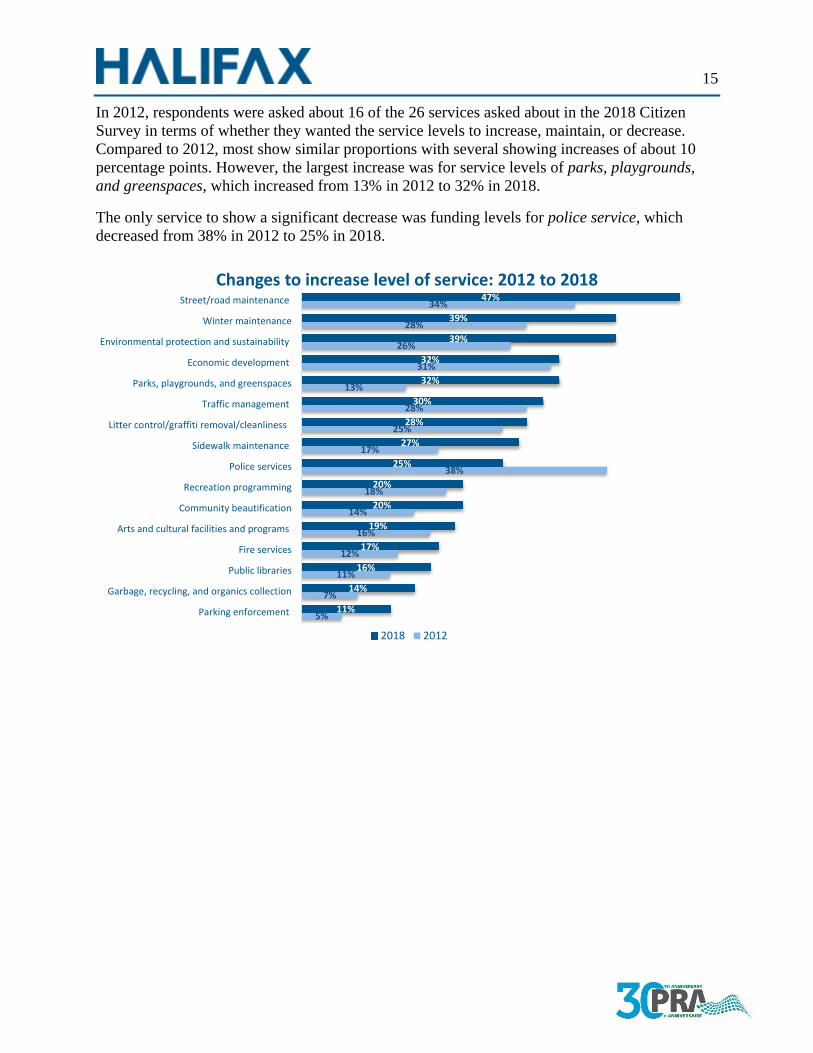
15
In 2012, respondents were asked about 16 of the 26 services asked about in the 2018 Citizen
Survey in terms of whether they wanted the service levels to increase, maintain, or decrease.
Compared to 2012, most show similar proportions with several showing increases of about 10
percentage points. However, the largest increase was for service levels of parks, playgrounds,
and greenspaces, which increased from 13% in 2012 to 32% in 2018.
The only service to show a significant decrease was funding levels for police service, which
decreased from 38% in 2012 to 25% in 2018.
5%
7%
11%
12%
16%
14%
18%
38%
17%
25%
28%
13%
31%
26%
28%
34%
11%
14%
16%
17%
19%
20%
20%
25%
27%
28%
30%
32%
32%
39%
39%
47%
Parking enforcement
Garbage, recycling, and organics collection
Public libraries
Fire services
Arts and cultural facilities and programs
Community beautification
Recreation programming
Police services
Sidewalk maintenance
Litter control/graffiti removal/cleanliness
Traffic management
Parks, playgrounds, and greenspaces
Economic development
Environmental protection and sustainability
Winter maintenance
Street/road maintenance
Changes to increase level of service: 2012 to 2018
2018 2012

16
6.0 Community priorities
6.1 Council priorities
Among six Council priorities, almost 9 in 10 respondents say that each of the six priorities are at
least important; however, the differentiator appears to be in the proportion rating each as very
important. This seems to indicate that Transportation at 56% and Healthy, Liveable Communities
at 54% are most important, and Service Delivery at 22% is least important to respondents.
Key differences. Results show the following differences among demographic groups:
► Females and younger residents are more likely than males and older residents to rate
Healthy, Liveable Communities as very important.
► Younger residents are more likely than older residents to rate Transportation as very
important.
► Females and those in lower income households are more likely than their counterparts to
rate Social Development as very important.
22%
32%
42%
43%
54%
56%
65%
55%
48%
45%
40%
40%
12%
12%
8%
10%
4%
3%
Service delivery
Governance and engagement
Economic development
Social development
Healthy, liveable communities
Transportation
Importance of Council priorities
Very important Important Not important Not at all important

17
6.2 Infrastructure priorities
Among six infrastructure priorities, two tend to stand out as being most important — integrated
mobility projects and public transit — with both receiving 43% of respondents saying they are
very important.
Key differences. Results show the following differences for ratings of infrastructure priorities
among demographic groups:
► Renters are more likely than home owners and those living in urban/suburban areas are
more likely than those living in rural areas to rate integrated mobility projects as very
important.
► Females and those with children are more likely than males and those without children to
rate parks and playgrounds as very important.
► Females and renters are more likely than their counterparts to rate public transit as very
important.
► Females, older residents, those who have lived in Halifax for over 20 years, those with no
post-secondary education, and those in the lowest income category are more likely than
their counterparts to rate emergency and corporate fleet as very important.
► Those in the lowest income category are much more likely than their counterparts to rate
technology supporting municipal operations as very important.
19%
19%
26%
30%
43%
43%
63%
67%
59%
57%
46%
48%
17%
13%
14%
12%
9%
9%
Technology supporting municipal operations
Buildings and facilities
Parks and playgrounds
Emergency and corporate fleet
Public transit
Integrated mobility projects
Importance of infrastructure categories
Very important Important Not important Not at all important

18
Respondents ranked their top three infrastructure projects for the Municipality to pursue over the
next five years. The highest priority was maintenance of existing streets and roads, which 22%
selected as their top priority and 51% selected as one of their top three. This was the only project
where at least half selected it in their top three.
The next two highest ranked projects were upgrade major roadways to provide increased
capacity (16% as top priority and 36% in top three) and commuter rail (12% as top priority and
33% in top three).
Table 4: Top infrastructure priorities
% selecting as top
priority % selecting as top
three priority* Maintenance of existing streets and roads 22% 51%
Upgrade major roadways to provide increased capacity 16% 36%
Commuter rail 12% 33%
New active transportation improvements 10% 25%
More buses to new areas 6% 17%
More buses on existing routes 5% 15%
Improved/additional public transit facilities 5% 14%
New stadium 5% 12%
Maintenance of existing sidewalks, walkways, and trails 3% 22%
Arts and cultural facilities 3% 11%
New recreation facilities/community centres 3% 9%
Improving existing facilities 2% 15%
New/repair of outdoor recreation facilities 2% 14%
Technology to improve service delivery/customer service/accessibility
2% 12%
New/refurbished community branch libraries 2% 7%
Arenas/ice surfaces 1% 3%
Other 1% 4%
*Note: Respondents could give more than one response; therefore, columns will sum to more than 100%.

19
7.0 Service quality
7.1 In-person contact
Overall, 46% of respondents say they have had any
contact with a municipal employee, either in-person,
in writing, by telephone, email/website, by fax, by
social media, or by encounter with a police/by-law
officer, over the last 12 months. This is down from
57% in 2014.
Key differences. Results indicate that as household
income and annual property tax increase, so does the
likeliness of having contact with a municipal
employee in the past 12 months.
Among those who had contact in the past year, the most common type of contact was by
telephone - calling 311 or 902-490-4000 at 33%.
1%
1%
1%
2%
2%
2%
3%
4%
5%
7%
8%
10%
13%
13%
33%
In person - municipal office/police station
In person - in neighbourhood/at home
Posted mail
In person – other
In person - public meeting/community event
Email – general
Telephone (911)
Website
Telephone – direct to an employee
Email – specific person
Elected Official
Police officer/compliance officer
In person – customer service centre
Telephone (311 or 902-490-4000)
Type of in-person contactBASE: Those with contact in past 12 months (n = 502)
Note: Respondents could provide more than one answer.
46%54%
Contact with municipal employee in past 12 months
Yes
No

20
7.2 Customer Service Centre contact
In the past 12 months, 20% have accessed the
Municipality’s Customer Service Centre in-
person. This is down from 30% in 2014.
Among the 20% who have accessed the Customer Service Centre in-person in the last 12
months, the most common reasons were for property tax payment or inquiry (23%), licence other
than a dog licence (18%), transit tickets, pass or schedule (17%), or parking ticket payment
(16%).
1%
2%
3%
4%
5%
5%
5%
6%
7%
9%
10%
16%
17%
18%
23%
Snow removal
Urban forestry
Streets
Parking permits/exemptions
Garbage/recycling collection inquiries
Water/waste management
Parks and recreation
By-law enforcement
Other
Building/development permit application
Dog licence
Parking ticket payment
Transit tickets or pass/transit schedule
Other licence
Property tax payment or inquiry
Customer Service Centre service usedBASE: Those who accessed Customer Service Centre in last 12 months (n = 214)
Note: Respondents could provide more than one answer.
20%
80%
Accessed Customer Service Centre in-person in last 12 months
Yes
No
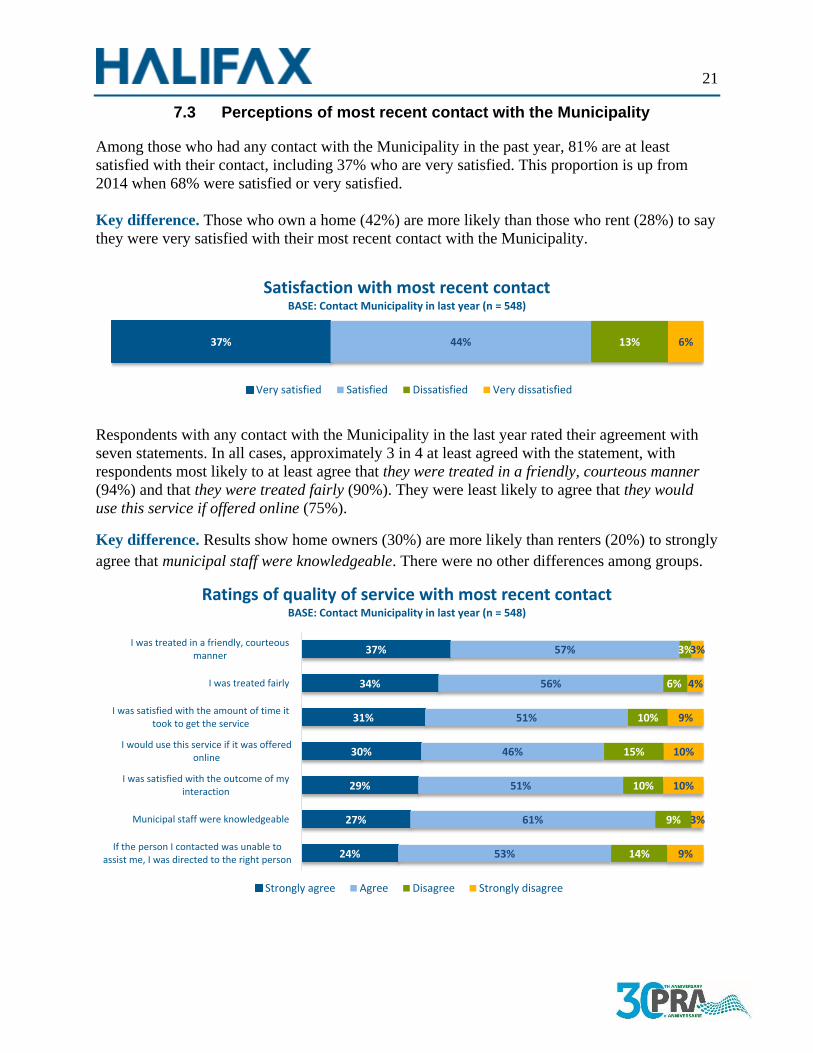
21
7.3 Perceptions of most recent contact with the Municipality
Among those who had any contact with the Municipality in the past year, 81% are at least
satisfied with their contact, including 37% who are very satisfied. This proportion is up from
2014 when 68% were satisfied or very satisfied.
Key difference. Those who own a home (42%) are more likely than those who rent (28%) to say
they were very satisfied with their most recent contact with the Municipality.
Respondents with any contact with the Municipality in the last year rated their agreement with
seven statements. In all cases, approximately 3 in 4 at least agreed with the statement, with
respondents most likely to at least agree that they were treated in a friendly, courteous manner
(94%) and that they were treated fairly (90%). They were least likely to agree that they would
use this service if offered online (75%).
Key difference. Results show home owners (30%) are more likely than renters (20%) to strongly
agree that municipal staff were knowledgeable. There were no other differences among groups.
37% 44% 13% 6%
Satisfaction with most recent contactBASE: Contact Municipality in last year (n = 548)
Very satisfied Satisfied Dissatisfied Very dissatisfied
24%
27%
29%
30%
31%
34%
37%
53%
61%
51%
46%
51%
56%
57%
14%
9%
10%
15%
10%
6%
3%
9%
3%
10%
10%
9%
4%
3%
If the person I contacted was unable toassist me, I was directed to the right person
Municipal staff were knowledgeable
I was satisfied with the outcome of myinteraction
I would use this service if it was offeredonline
I was satisfied with the amount of time ittook to get the service
I was treated fairly
I was treated in a friendly, courteousmanner
Ratings of quality of service with most recent contactBASE: Contact Municipality in last year (n = 548)
Strongly agree Agree Disagree Strongly disagree

22
7.4 Online experiences
Overall, 78% have accessed www.halifax.ca (60% in the past year) and 73% have accessed
services at www.halifax.ca/home/online-services (43% in the past year).
Key differences. Those 55 or older, those who have lived in Halifax for more than 20 years, and
those with no post-secondary education are less likely than their counterparts to say they have
accessed www.halifax.ca or any online services.
For those accessing the Municipality’s website, most often respondents were searching for
information (60%) or completing an online payment (29%).
43%
23%
10%
12%
7%
5%
22%
18%
15%
18%
16%
12%
Never
Not in past 12 months
Within past 12 months
Within past 6 months
Within past month
Within the past week
Accessed online services
Accessed www.halifax.ca Accessed services at halifax.ca/home/online-services
8%
2%
2%
6%
7%
8%
10%
29%
60%
None / did not access
Other
Checked job postings
Made an online request
Registered or made a booking
Contacted the municipality
Reported something
Completed an online payment
Conducted a search for information
Online services accessed in past 12 monthsBASE: Those who accessed online services in last 12 months (n = 680)
Note: Respondents could provide more than one answer.

23
Among all residents, 76% would be at least likely to access online services in the future,
including 30% who would be very likely.
Key differences. Residents under 55 years old, those who have lived in Halifax for less than 10
years, university graduates, and those in higher income households tend to be most likely to use
online services in the future.
When asked for suggestions for improvements to the self-serve online portal, just 17% of
respondents were able to provide a suggestion. The most common suggestions were to improve
design issues (e.g., cluttered, simplify, broken links) (4%), have more or better information on
the portal (3%), have more in-person services available online (2%), or improve navigation
(2%).
30% 47% 16% 7%
Likelihood of using online services in the future
Very likely Likely Unlikely Very unlikely
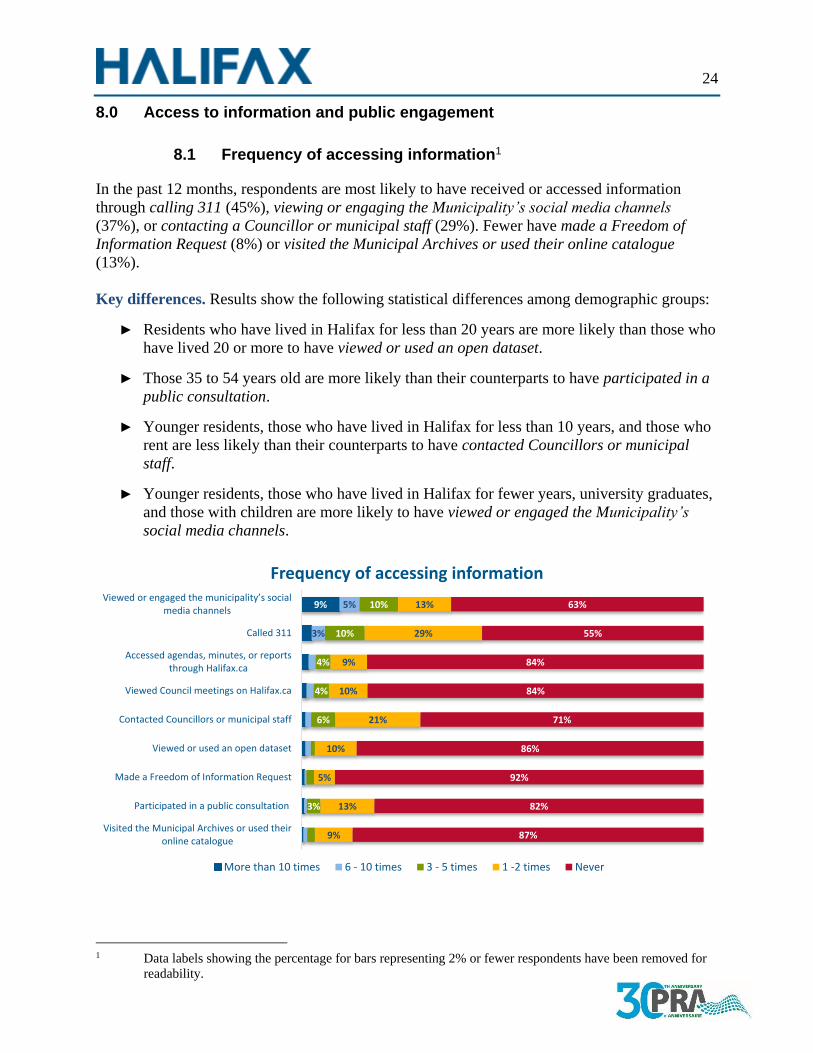
24
8.0 Access to information and public engagement
8.1 Frequency of accessing information1
In the past 12 months, respondents are most likely to have received or accessed information
through calling 311 (45%), viewing or engaging the Municipality’s social media channels
(37%), or contacting a Councillor or municipal staff (29%). Fewer have made a Freedom of
Information Request (8%) or visited the Municipal Archives or used their online catalogue
(13%).
Key differences. Results show the following statistical differences among demographic groups:
► Residents who have lived in Halifax for less than 20 years are more likely than those who
have lived 20 or more to have viewed or used an open dataset.
► Those 35 to 54 years old are more likely than their counterparts to have participated in a
public consultation.
► Younger residents, those who have lived in Halifax for less than 10 years, and those who
rent are less likely than their counterparts to have contacted Councillors or municipal
staff.
► Younger residents, those who have lived in Halifax for fewer years, university graduates,
and those with children are more likely to have viewed or engaged the Municipality’s
social media channels.
1 Data labels showing the percentage for bars representing 2% or fewer respondents have been removed for
readability.
9%
3%
5%
3%
6%
4%
4%
10%
10%
9%
13%
5%
10%
21%
10%
9%
29%
13%
87%
82%
92%
86%
71%
84%
84%
55%
63%
Visited the Municipal Archives or used theironline catalogue
Participated in a public consultation
Made a Freedom of Information Request
Viewed or used an open dataset
Contacted Councillors or municipal staff
Viewed Council meetings on Halifax.ca
Accessed agendas, minutes, or reportsthrough Halifax.ca
Called 311
Viewed or engaged the municipality’s social media channels
Frequency of accessing information
More than 10 times 6 - 10 times 3 - 5 times 1 -2 times Never

25
8.2 Ease of accessing information2
Among those who have accessed online services or information in the past year, the majority rate
each as at least easy to access, with calling 311 (97%) and viewing or engaging the
Municipality’s social media channels (98%) being rated as very easy. Respondents seem to have
the most difficulty making a Freedom of Information Request with 60% rating as at least easy.
Key differences. Results show only one statistically significant difference among demographic
groups. Females are more likely than males to rate viewing or engaging the Municipality’s social
media channels as very easy.
2 Data labels showing the percentage for bars representing 2% or fewer respondents have been removed for
readability.
8%
15%
15%
17%
17%
19%
28%
45%
61%
52%
59%
62%
63%
68%
69%
55%
53%
36%
32%
22%
19%
17%
11%
10%
15%
8%
5%
4%
4%
4%
3%
Making a Freedom of Information Request
Participating in a public consultation
Viewing or using an open dataset
Visiting the Municipal Archives or using theironline catalogue
Accessing agendas, minutes, or reportsthrough Halifax.ca
Viewing Council meetings on Halifax.ca
Contacting Councillors or municipal staff
Viewing or engaging the municipality’s social media channels
Calling 311
Ease of accessing informationBASE: Those who accessed the information in past 12 months (n = 89 - 489)
Very easy Easy Difficult Very difficult

26
8.3 Frequency of engaging with the Municipality3
Among other types of engagement respondents have taken part in during the past 12 months,
respondents are most likely to have attended an in-person public meeting (39%), completed
online surveys from the Municipality (38%), or they spoke directly with their Councillor or
municipal staff (27%). However, in most cases these behaviors are rare, with most respondents
engaging in them only once or twice in the past 12 months.
Key differences. Results show a few differences in engagement among demographic groups:
► Those 55 and older, those with less education, and those without children are less likely
to have completed online surveys from the Municipality.
► Younger residents and those who rent are less likely to have spoken directly to a
Councillor or municipal staff.
► Those 35 to 54 years old are more likely to have contacted the Municipality through
social media than respondents under 35 or 55 and older.
3 Data labels showing the percentage for bars representing 2% or fewer respondents have been removed for
readability.
9%
4%
5%
6%
17%
3%
6%
35%
29%
21%
95%
93%
82%
97%
97%
91%
62%
61%
73%
Participated in a workshop or conference
Participated in an online discussion
Completed email or feedback form
Met with an advisory committee
Spoke at a board or committee meeting
Contacted the municipality through socialmedia
Completed online surveys from themunicipality
Attended an in-person public meeting
Spoke directly with my Councillor ormunicipal staff
Frequency of engaging with the Municipality in past 12 months
More than 10 times 6 - 10 times 3 - 5 times 1 -2 times Never

27
8.4 Engaging with the Municipality
About 83% at least agree that the Municipality provides sufficient tools and information to allow
them to meaningfully participate and engage with the Municipality.
8.4.1 Barriers to engaging
When asked for barriers or challenges they have faced accessing information, or participating or
engaging with the Municipality, 78% indicate they have not faced any challenges. The most
common challenges identified were lack of awareness or notification of engagement
opportunities (7%), issues accessing the website (3%), feeling like their opinion won’t be heard
or taken seriously (3%), issues contacting their Councillor (2%), or lack of opportunities to
engage (2%).
8.4.2 Preferred method of engaging
For most, their preferred method of engaging with the Municipality tends to be online, either
through an online survey (68%), email (47%), or social media (33%). Given that most
respondents completed their survey online, however, this may indicate a bias in preference for
online resources.
8% 75% 15% 2%
Agreement that the Municipality provides sufficient tools and information to engage with them
Completey agree Agree Disagree Completely disagree
5%
2%
6%
12%
12%
13%
24%
33%
35%
47%
68%
None
Other
Speaking at a board or committee meeting
Telephone
Workshop/conference
Online discussion
In-person public meeting/Town Hall
Social media
Newsletter/direct mail
Online survey
Preferred method of engaging with the MunicipalityNote: Respondents could provide more than one answer.

28
9.0 Public safety
This section examines residents’ experiences with Halifax Regional Police and Halifax District
RCMP, and Halifax Regional Fire & Emergency.
9.1 Perceptions of the police4
Residents are most likely to agree that they would call police to report a crime, call police for
assistance, and help police if asked. In each case, more than 9 in 10 at least agree with each
statement.
On the other hand, citizens are least likely to agree that police provide the same quality of service
to all citizens, with just under half agreeing or strongly agreeing. In fact, 2 in 10 disagree or
strongly disagree, which is the only statement where more than 8% disagree or strongly disagree.
Key differences. Results indicate several differences among perceptions of police and
demographic groups.
► Older residents are generally more likely to agree with statements about police than
younger residents. The only statement where there is not a difference by age is agreement
that they would call police to report a crime.
► Likely linked to age, those who have been living in Halifax for longer tend to be more
likely to agree with many statements, including statistical differences for the police treat
people fairly, the police show care and concern for the welfare of the citizens they deal
with, they generally support how the police usually act, and they would call the police to
report a crime.
► Potentially linked to age, those who rent are less likely to agree that the police show care
and concern for the welfare of the citizens they deal with, the police understand the issues
that affect their community, they generally support how the police usually act, and they
would help the police if asked.
► Home owners paying the highest property tax are most likely to strongly agree that they
would help the police if asked.
► As household income increases, respondents are less likely to agree that the police
understand the issues that affect their community.
4 Data labels showing the percentage for bars representing 2% or fewer respondents have been removed for
readability.

29
9.2 Recent contact with police
In the past two years, 39% of residents say the police
approached them, stopped them, or made contact
with them for any reason.
Key differences. Results show that those 55 and
older are less likely than those under 55 to have had
contact with the police in the past two years.
Among those who had contact with the police in the
past two years, about 3 in 4 are at least satisfied with the way the police treated them during the
last time they had contact with police. This includes 45% who are very satisfied.
Key differences. Of those who had contact with police, those 55 and older and those who have
lived in Halifax for more than 20 years were more likely to say they were very satisfied with
their most recent encounter.
13%
13%
14%
16%
18%
20%
39%
46%
50%
33%
49%
42%
48%
51%
55%
50%
45%
45%
32%
29%
35%
24%
24%
18%
8%
6%
4%
17%
7%
6%
8%
4%
5%
6%
3%
3%
3%
Police provide the same quality of service toall citizens
Police understand the issues that affect thiscommunity
Police make decisions based on facts
Police treat people fairly
Police show care and concern for thewelfare of the citizens they deal with
I generally support how the police usuallyact
I would help the police if asked
I would call the police for assistance
I would call the police to report a crime
Agreement with statements about police
Strongly agree Agree Neither agree nor disagree Disagree Strongly disagree
45% 31% 10% 6% 8%
Satisfaction with most recent enounter with policeBASE: Contact with police in past two years (n = 423)
Very satisfied Satisfied Not satisfied or dissatisfied Dissatisfied Very dissatisfied
39%61%
Contact with police in past two years
Yes
No
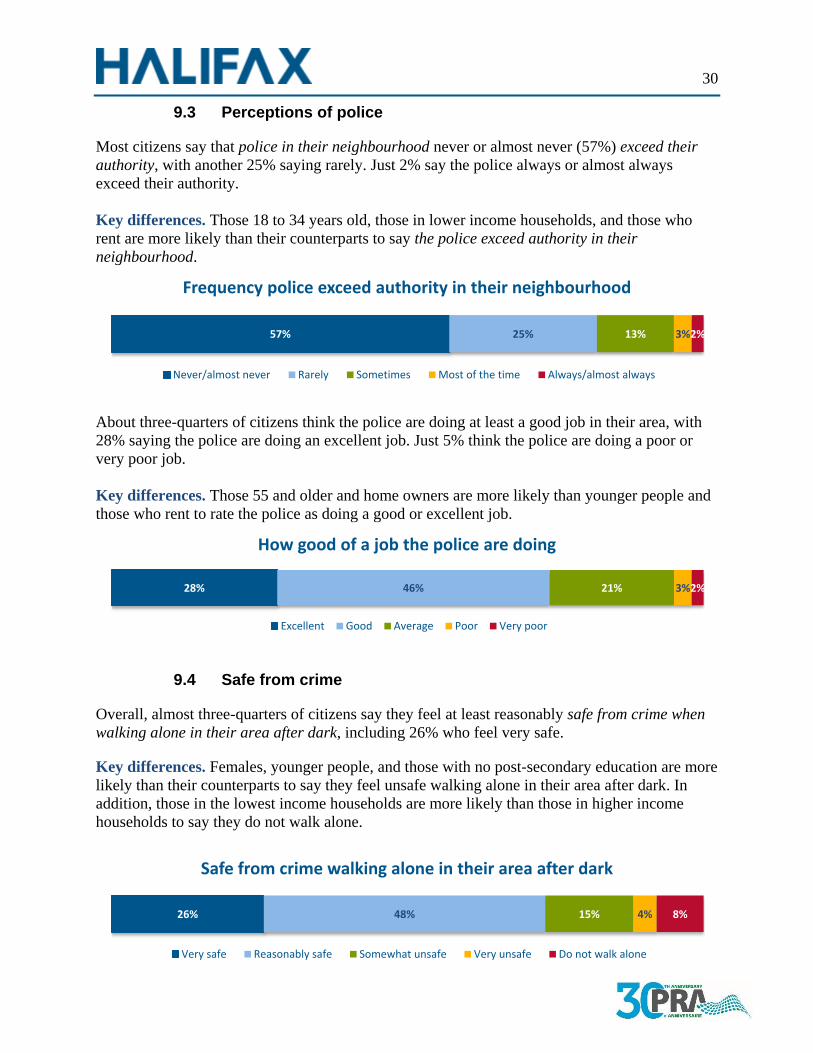
30
9.3 Perceptions of police
Most citizens say that police in their neighbourhood never or almost never (57%) exceed their
authority, with another 25% saying rarely. Just 2% say the police always or almost always
exceed their authority.
Key differences. Those 18 to 34 years old, those in lower income households, and those who
rent are more likely than their counterparts to say the police exceed authority in their
neighbourhood.
About three-quarters of citizens think the police are doing at least a good job in their area, with
28% saying the police are doing an excellent job. Just 5% think the police are doing a poor or
very poor job.
Key differences. Those 55 and older and home owners are more likely than younger people and
those who rent to rate the police as doing a good or excellent job.
9.4 Safe from crime
Overall, almost three-quarters of citizens say they feel at least reasonably safe from crime when
walking alone in their area after dark, including 26% who feel very safe.
Key differences. Females, younger people, and those with no post-secondary education are more
likely than their counterparts to say they feel unsafe walking alone in their area after dark. In
addition, those in the lowest income households are more likely than those in higher income
households to say they do not walk alone.
57% 25% 13% 3%2%
Frequency police exceed authority in their neighbourhood
Never/almost never Rarely Sometimes Most of the time Always/almost always
28% 46% 21% 3%2%
How good of a job the police are doing
Excellent Good Average Poor Very poor
26% 48% 15% 4% 8%
Safe from crime walking alone in their area after dark
Very safe Reasonably safe Somewhat unsafe Very unsafe Do not walk alone

31
9.5 Victim of crime
Overall, 10% of residents say they have been
a victim of crime in the past year, with the
most common type of crime reported is
property crime at 7%. The proportion who
reported a property crime is down from 17%
in 2010, as well as violent crime, which was
at 3% in 2010, now down to 1% in 2018.
Key differences. Results show that younger
Halifax residents and those who rent are
more likely to have been a victim of crime,
or know someone who has been a victim.
Given the fact that the most common type of
crime was property crime, it is not surprising
that residents who were a victim of crime in
the past year most often report it occurring at
home (49%).
Among victims of crime in the past year,
75% say they reported the crime to police.
7%1%2%
90%
Victim of crime in past year
Property crime
Violent crime
Other crime
No
49%
18%
8%
21%
4%
Where crime occuredBASE: Victim of crime in past year (n = 108)
At home
Near home
At work
Elsewhere in Halifax
Outside ofmunicipality
75%
25%
Reported crime to policeBASE: Victim of crime in past year (n = 108)
Yes No

32
9.6 Fire services
Among eight fire services that Halifax Regional Fire & Emergency offers, respondents are very
aware of several, including firefighting and rescue (96%), motor vehicle accident response
(95%), medical response (95%), and community/public events (92%). They are least aware that
Halifax Regional Fire & Emergency offers technical/water rescue (74%) or public
education/information programs (72%).
Key differences. When analyzing awareness of fire services, results show the following
differences between demographic groups:
► Females are more likely than men to be aware of community/public events.
► Older residents, those who have lived in Halifax longer, home owners, and those with a
college diploma or similar level of education are more likely than their counterparts to be
aware of hazardous materials response.
► Older residents of Halifax and those with less education are more likely to be aware of
technical/water rescue.
72%
74%
78%
87%
92%
95%
95%
96%
Public education/Information programs
Technical/water rescue
Hazardous materials response
Fire prevention/inspections and enforcement
Community/public events
Medical response
Motor vehicle accident response
Firefighting and rescue
Awareness of fire servicesNote: Respondents could provide more than one answer.

33
9.7 Emergency management
Respondents are less aware of emergency management services than fire services, with response
and recovery (75%) receiving the highest level of awareness.
Key differences. In terms of awareness of emergency management, results show the following:
► Older residents are more likely than younger people to be aware of response and
recovery.
► Older Halifax residents and those who have lived in Halifax longer are more likely than
their counterparts to be aware of disaster planning and exercises and the Emergency
Operations Centre.
9.8 Experience with Halifax Regional Fire & Emergency
In the past year, 33% have required or witnessed a
response from Halifax Regional Fire & Emergency.
Key differences. Results show that those who rent
their home are more likely than home owners to
have had contact with Halifax Regional Fire &
Emergency in the past year.
44%
60%
64%
75%
Community risk analysis
Manages the municipality’s Emergency Operations Centre (EOC)
Disaster planning and exercises
Response and recovery
Awareness of emergency managementNote: Respondents could provide more than one answer.
33%
67%
Contact with Halifax Regional Fire & Emergency in past year
Yes
No

34
Among those who had contact with Halifax Regional Fire & Emergency in the past year, 98%
are at least satisfied with the services provided, including 53% who are very satisfied. In 2014,
91% were satisfied with their experiences.
Overall, 96% of respondents are at least confident that Halifax Regional Fire & Emergency will
respond to emergency calls in a timely manner, including 42% who are completely confident.
Overall, this result is on par with 2014 when 94% were confident.
Key differences. Results show that those living in urban or suburban areas and those who have
lived in Halifax longer are more likely than those living in a rural area of the Halifax Regional
Municipality, or those who have lived in Halifax for less than 10 years, to say they are confident
that Halifax Regional Fire & Emergency will respond to calls in a timely manner.
9.9 Emergency preparedness
Respondents were told that “in the event of an
emergency or disaster situation, Halifax Regional
Fire & Emergency recommends that you have
enough supplies to last you for 72 hours, and a plan
in case you need to evacuate your home.” Overall,
59% say they meet this guideline.
Key differences. Results show that males, older
Halifax residents, and those who have lived in
Halifax longer are more likely than their
counterparts to say they meet Halifax Regional Fire
& Emergency’s recommended emergency guidelines.
53% 45% 1%
1%
Satisfaction with most services from Halifax Regional Fire & EmergencyBASE: Contact with HRF&E in past year (n = 359)
Very satisfied Satisfied Dissatisfied Very dissatisfied
42% 54% 4%
<1%
Confidence in Halifax Regional Fire & Emegency
Completely confident Confident Not very confident Not at all confident
59%41%
Meet Halifax Regional Fire & Emergency's emergency
guidelines
Yes
No

35
10.0 Recreation and leisure
Overall, 50% of respondents have used a municipally-run recreation facility in the past year,
including 11% who use them at least weekly. This is up from 2014, when 40% had used such
facilities in the past year; however, the change is primarily due to a higher proportion who used
these facilities once or twice a year (21% in 2018 compared to 14% in 2014). Weekly and
monthly rates were very similar in 2018 as 2014.
Key differences. Results show than younger Halifax residents, those with more education, those
in higher income households, and those with children are more likely than their counterparts to
have used municipally-run recreation facilities in the past year.
About 18% have registered or participated in a
municipally-run recreation program over the past
12 months, virtually unchanged from 20% in 2014.
Key differences. Those who are more likely than
their counterparts to have registered or participated
in a municipal recreation program in the past year
are females, those with higher household incomes,
and those with children.
11% 10% 8% 21% 50%
Use of municipally-run recreation facilities in the past year
At least once per week At least once per month Once every 2 -3 months Once or twice a year Never
18%
82%
Registered or participated in municipal recreation program in
past year
Yes
No

36
Just 16% said they find it difficult to access any
municipal facilities or participate in any recreation
or leisure programs run by the Municipality. This is
similar to 2014 (13%) and 2010 (21%). Among the
16% (n = 179) who found it difficult, the most
common reasons were that no facilities or programs
of interest are within a reasonable distance of their
home (47%), fees are too high compared to other
providers (38%), facilities are not open during times
they can use them (35%), no programs of interest
(27%), and no transit service is available to the
locations (21%).5
Key differences. Results show that those in lower income households and those who rent are
more likely than their counterparts to say it is difficult to access municipal facilities or participate
in programs.
When asked if there were other recreational programs the Municipality could offer, 77%
indicated there were no other programs needed. Although many programs were mentioned, the
only type of programming mentioned by more than 1% of respondents was programming for
children and youth (3%).
5 Respondents could give more than one answer.
16%
84%
Difficult to access municipal facilities or participate in
programs
Yes
No

37
11.0 Parks
11.1 Use of parks and park services
In the past year, respondents’ use of parks and park services varies from 88% who have used
parks to 25% who have used off-leash dog parks. In 2012, respondents were asked about their
use of parks, playgrounds, and trails, and use is slightly different.
► For parks, the biggest change is in frequency of use, as just 19% were using parks weekly
in 2012 compared to 34% in 2018. Use in the past year as a whole is up slightly, with
79% having used parks in 2012 compared to 88% in 2018.
► For playgrounds, both weekly use (14% in 2018 and 9% in 2012), and total use (41% in
2018 and 49% in 2012) are quite similar. Additionally, for trails, weekly use (20% in
2018 and 25% in 2012) and total use (73% in 2018 and 82% in 2012) are similar.
Key differences. In terms of use of parks and parks services in the past 12 months, there are
fairly consistent patterns:
► As respondents get older, they are less likely to report using all of the parks and parks
services included in the survey. This pattern is also evident in most cases according to
how long respondents have lived in Halifax (with those living in Halifax longer being
less likely to have used), which is likely because length of time living in the Municipality
may be correlated with age.
► Those with more education are more likely to have used parks, trails, sports fields, and
beaches/waterfront area.
► People with children are more likely than those without children to have used everything
but off-leash dog parks (no difference).
► People who rent are more likely to report using public washrooms.
► Those with a higher annual income are more likely to have used trails and sports fields.
► People living in suburban/urban areas are more likely than those living in rural areas to
use parks (and also tend to use them more often).
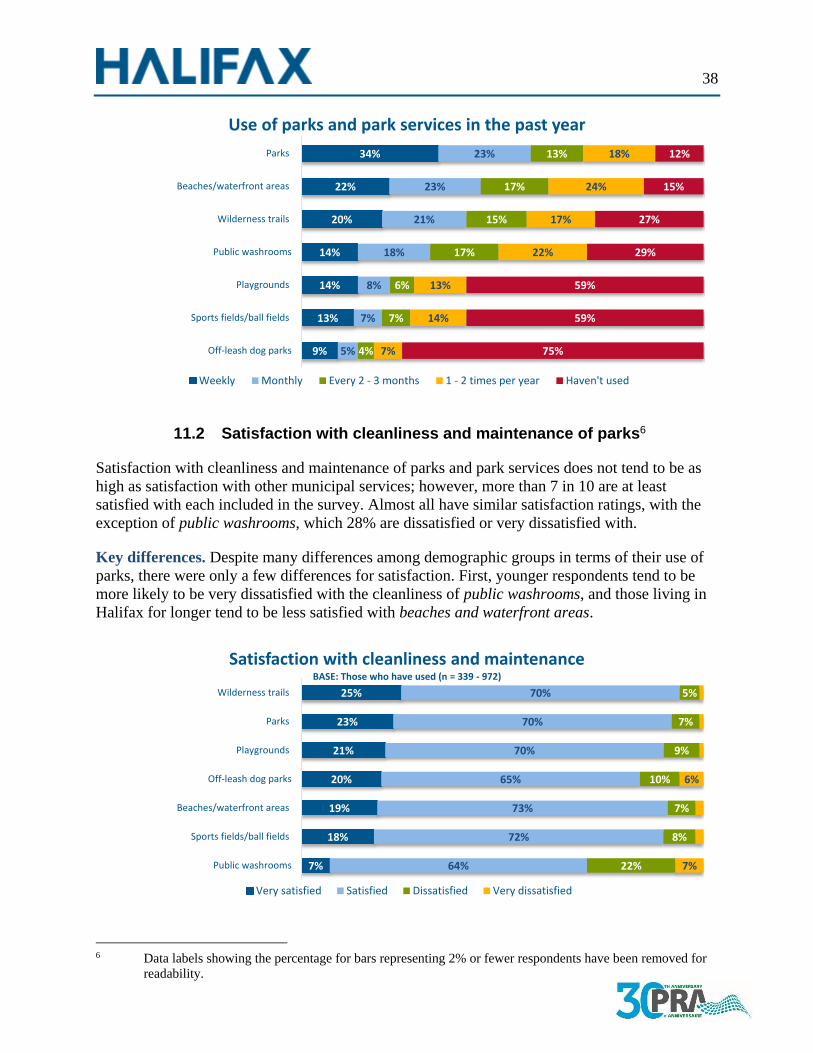
38
11.2 Satisfaction with cleanliness and maintenance of parks6
Satisfaction with cleanliness and maintenance of parks and park services does not tend to be as
high as satisfaction with other municipal services; however, more than 7 in 10 are at least
satisfied with each included in the survey. Almost all have similar satisfaction ratings, with the
exception of public washrooms, which 28% are dissatisfied or very dissatisfied with.
Key differences. Despite many differences among demographic groups in terms of their use of
parks, there were only a few differences for satisfaction. First, younger respondents tend to be
more likely to be very dissatisfied with the cleanliness of public washrooms, and those living in
Halifax for longer tend to be less satisfied with beaches and waterfront areas.
6 Data labels showing the percentage for bars representing 2% or fewer respondents have been removed for
readability.
9%
13%
14%
14%
20%
22%
34%
5%
7%
8%
18%
21%
23%
23%
4%
7%
6%
17%
15%
17%
13%
7%
14%
13%
22%
17%
24%
18%
75%
59%
59%
29%
27%
15%
12%
Off-leash dog parks
Sports fields/ball fields
Playgrounds
Public washrooms
Wilderness trails
Beaches/waterfront areas
Parks
Use of parks and park services in the past year
Weekly Monthly Every 2 - 3 months 1 - 2 times per year Haven't used
7%
18%
19%
20%
21%
23%
25%
64%
72%
73%
65%
70%
70%
70%
22%
8%
7%
10%
9%
7%
5%
7%
6%
Public washrooms
Sports fields/ball fields
Beaches/waterfront areas
Off-leash dog parks
Playgrounds
Parks
Wilderness trails
Satisfaction with cleanliness and maintenanceBASE: Those who have used (n = 339 - 972)
Very satisfied Satisfied Dissatisfied Very dissatisfied

39
11.3 Overall park experience
In general, 98% of residents are satisfied with their overall park experience, including 25% who
are very satisfied. It is also important to note that, despite differences in use of the parks, there
are no statistical differences in the overall rating of park experiences between demographic
groups.
When asked what would improve their overall park experience, 71% did not provide any
suggestions. The most common suggestions are for better clean –up/litter pickup (5%), more
amenities (e.g., benches, water fountains, food) (5%), enforce dogs to be on leashes (4%), better
maintenance (3%), and more public washroom (3%).
25% 73% 2%
<1%
Rating of overall park experience
Very satisfied Satisfied Dissatisfied Very dissatisfied

40
12.0 Public libraries
12.1 Use of public libraries
About 64% of respondents have used services of
Halifax Public Libraries in the past 12 months in a
branch, in the community, or online. This is up
slightly from 57% in 2014.
Key differences. Results show younger respondents,
those living in Halifax for less time, those with more
education, and those with children are most likely to
report using library services in the past year.
Among library users, the most common library used was the Halifax Central Library (66%),
with the Keshen Goodman (28%) and Alderney Gate (22%) libraries second and third. For the
most part, library usage is similar to 2014, with the exception of the Halifax Central Library
since it was not built in 2014.
<1%1%1%
2%3%5%5%
8%9%9%9%10%
14%19%
22%28%
35%66%
Sheet Harbour
J.D. Shatford (Hubbards)
Home delivery/borrow by mail
In the community
Musquodoboit Harbour
Tantallon
Dartmouth North
Bedford
Sackville
Cole Harbour
Spring Garden Road
Captain William Spry
Woodlawn
Digital collection
Alderney Gate
Keshen Goodman
Website
Halifax Central Library
Public libraries usedBASE: Used Halifax Public Library in past 12 months (n = 703)
Note: Respondents could provide more than one answer.
64%
36%
Used Halifax Public Library services in past 12 months
Yes
No

41
The most common sources of information for those using the library are the website (72%) and
library staff (52%). These results are similar to 2014, as both were the most common sources of
information (website at 63% and staff at 44%).
Key differences. Results tend to indicate that younger respondents, those with more education,
and those with higher incomes are more likely to access services through the website and less
likely to rely on library staff.
12.2 Satisfaction with public libraries7
For the most part, library users are satisfied with various aspects of libraries, with about 9 in 10
or more reporting they are at least satisfied. However, the proportion who are very satisfied does
vary, with 62% of respondents very satisfied with library facilities and 25% of respondents
satisfied with open hours.
Key difference. Among the 11 library aspects for which respondents could rate their
satisfaction, there was only one difference among demographic groups — women are more
likely than men to be very satisfied with children’s programs.
7 Data labels showing the percentage for bars representing 2% or fewer respondents have been removed for
readability.
1%
1%
1%
1%
3%
7%
15%
16%
21%
52%
72%
Other
Word of mouth
Media
Printed program listings
Library poster
Digital screen in branch
Library staff
Website
Source for library informationBASE: Used Halifax Public Library in past 12 months (n = 703)
Note: Respondents could provide more than one answer.

42
12.3 Overall library satisfaction
Overall, 99% of respondents who have used libraries in the past 12 months are at least satisfied
with them, including 46% who are very satisfied. The total satisfaction is on par with 2014
(98%), although the proportion who are very satisfied is up from 35% to 46%.
25%
31%
33%
34%
37%
42%
44%
47%
50%
51%
62%
64%
61%
63%
60%
54%
52%
50%
48%
48%
45%
37%
9%
5%
5%
4%
4%
3%
3%
3%
8%
4%
3%
Open hours
Programs for seniors
Programs for newcomers
Adult programs
Home delivery
Borrow by mail services
Youth programs (ages 14-18)
Library materials
Public technology
Children's programs (ages 0-13)
Library facilities
Satisfaction with public librariesBASE: Used Halifax Public Library in past 12 months (n = 703)
Very satisfied Satisfied Dissatisfied Very dissatisfied
46% 53%
1% <1%
Rating of overall satisfaction with public librariesBASE: Used Halifax Public Library in past 12 months (n = 703)
Very satisfied Satisfied Dissatisfied Very dissatisfied

43
12.4 Importance of libraries
Respondents tend to say that public libraries and the service they provide to their community are
important, as 92% rate them as at least important (including 61% saying very important).
Key differences. Women and those with more education are more likely than their counterparts
to say that public libraries and their services are very important to the community.
When asked what prevents them from using libraries most often, 59% say nothing or there are no
barriers. The most common barriers cited include inconvenient hours/not open 7 days a week
(13%), inconvenient locations (7%), no programs/services that they want (7%), or transportation
issues (6%). In 2014, hours of operation was also the most cited barrier at 15%.
61% 31% 6% 2%
Rating of importance of public libraries
Very important Important Not important Not at all important

44
13.0 Transportation
13.1 Commuting to work or school
Amongst respondents, 59% commute to work or
school.
Key differences. Results show those under 55, those
living in Halifax for 20 years or less, those with
higher levels of education, those with children, and
those with higher household incomes are most likely
to report commuting to work or school.
For commuters, the primary mode of travel is driving themselves at 69%, with 31% of
commuters using public transit.
Key differences. Results show differences by two primary modes: walking and biking.
► For walking, younger respondents, those living in urban/suburban Halifax, those living in
Halifax for less time, and renters are most likely to report that walking is their primary
mode of commuting.
► For biking, those under 55 and those with children are most likely to report biking as part
of their commute.
<1%
<1%
2%
9%
12%
21%
31%
69%
Other
Rural transit
Taxi
Bicycle
Passenger
Walk
Public transit
Drive myself
Primary mode of travel for commutingBASE: Commute to work or school (n = 631)
Note: Respondents could provide more than one answer.
59%41%
Commute to work or school
Yes
No

45
13.2 Halifax transit
Overall, 59% have used Halifax Transit in the past
12 months, up from 53% in 2014.
Key differences. Results show that younger
residents, those living in urban/suburban Halifax,
those living in Halifax for fewer years, university
graduates, and renters are more likely than their
counterparts to have used Halifax Transit in the past
year.
Among those who have used transit in the past year, 16% are daily transit users, while 50% are
occasional users (i.e., several times per year or less). When examined as a whole, including those
who have not used transit in the past year, about 18% of respondents use transit at least several
times week.
Key differences. Similar to use in the past year, there are also differences in frequency of use
among demographic groups. Those living in Halifax for less than 10 years, those in lower
income households, and renters are most likely to report using Halifax Transit daily.
16% 15% 20% 50%
Frequency of Halifax Transit useBASE: Used Halifax Transit in past 12 months (n = 645)
Daily Several times per week Several times per month Several times per year or less
59%41%
Used Halifax Transit in past 12 months
Yes
No

46
When asked what would get them to use transit more or more often, the reasons tend to be
different between users and non-users. The most common factors for users are increased service
frequency (45%) and reliable/on-time service (45%). For non-users, there are 56% who say
nothing would make them use it or use it more often. The most common factors for non-users are
more direct or limited stop routes (19%), added service to rural areas (18%), and increased
service frequency (18%).
Table 5: Encourage to use public transit more often
Used Halifax Transit in past
12 months (n = 645)
Have not used in past 12 months
(n = 4485) Increased service frequency 45% 18%
Reliable/on-time service 45% 17%
Improved/access to schedule information 32% 13%
Improved/electronic fare payment options 31% 13%
More direct or limited stop routes/faster 30% 19%
App to determine bus arrival times 28% 8%
Additional urban core bus routes 23% 6%
Added service to rural areas 22% 18%
Fewer transfers 22% 14%
Stops closer to home or work 22% 14%
Additional shelters 20% 7%
Additional Park & Ride lots 14% 10%
Increased safety 12% 6%
Environmental concerns 11% 4%
Additional designated fully accessible routes 9% 3%
Additional bike rack accessible buses 6% 2%
Extend hours 1% 1%
Better customer services 1% -
When I can’t drive <1% 1%
Other 3% 3%
Nothing - I don't plan to use transit 4% 47%
Nothing - happy with current services 14% 9% Note: Respondents could give more than one response; therefore, columns will sum to more than 100%.

47
13.3 Downtown parking
Generally, respondents see a need for more downtown parking, with a greater emphasis on
downtown Halifax (74%) than downtown Dartmouth (34%). Just 21% think downtown parking
in either area is sufficient, and 4% believe less downtown parking is needed.
4%
21%
34%
74%
Less parking is needed
Sufficient parking available
More off-street parking in downtownDartmouth
More off-street parking in downtown Halifax
Opinion on downtown parkingNote: Respondents could provide more than one answer.

48
14.0 Halifax Regional Municipality issues
Respondents were asked to name up to three issues facing the Halifax region over the next five
years in which they feel the Municipality should invest greater resources. Respondents named
many issues, with three being mentioned more often than others, all of which related to
transportation. These included transit (23%), road conditions, sidewalks, and snow removal
(22%), and transportation and traffic (21%). In 2014, the top three issues mentioned were
transportation / traffic (23%), taxes (18%), and employment / jobs (16%). In 2012, the top three
issues mentioned were public transit (26%), public safety (22%), and the environment (19%).
Table 6: Top issues facing Halifax region over next five years
% selecting as top three priority Transit 23%
Road conditions/sidewalks/snow removal 22%
Transportation/traffic 21%
Parking/winter parking 15%
Affordable housing 13%
Active transportation 12%
Crime/policing 10%
Urban sprawl/planning for growth 9%
Environment/green belting/clean water 9%
Recreation opportunities 8%
Health/healthcare/hospitals 6%
Economic growth/small business growth 6%
Commuter rail/light rail/ferry system 6%
Taxes 5%
Retention/attraction of residents/immigration 5%
Infrastructure renewal 5%
Clean up/beautify 5%
Upgrade roads/road system 4%
Size of Municipality/expenditures/salaries 4%
Development process 4%
Build a stadium 4%
Senior services 3%
Schools/education 3%
Employment 3%
Downtown development 3%
Climate change 3%
Attract business 3%
Waste management 2%
Emergency services 2%
Youth/young professional retention 1%
Programming for youth/children 1%
Preserve buildings/historical sites 1%
Cost of living 1%
Renewable energy <1%
Other 25%
None 2% Note: Respondents could give more than one response; therefore, columns will sum to more than 100%.
Appendix A – 2018 Halifax Citizen Survey

Page 1 of 34
2018 Citizen Survey Welcome to the 2018 Citizen Survey! Thank you in advance for taking the time to participate in this survey. Your responses will help guide the Halifax Regional Municipality with its immediate and long-term planning. The results from this survey will be available on the municipality’s website at www.halifax.ca/citizensurvey. The survey should take approximately 25 minutes to complete, and for your participation, you will be eligible to win one of 10 VISA or Mastercard gift cards valued at $100. The deadline for completing this survey is August 19, 2018. Responses will be kept strictly confidential and the results of the survey will not be used in any way that will allow anyone to identify you or your responses. Your participation is voluntary and you can discontinue your participation at any time.
To conduct this survey, the municipality has hired PRA Inc., a national research firm. If you require any assistance completing the survey, please contact PRA Inc. at 1-888-877-6744 (toll free) or at [email protected].
Thank you in advance for your participation.

Page 2 of 34
PASSCODE (see invitation letter): _________________
Quality of Life Q1. How would you rate the overall quality of life in the Halifax region?
Please check only one
Very Good
Good
Poor
Very Poor
Q2. In the past five years, the quality of life in the Halifax region has …
Please check only one
Improved
Stayed the same
Worsened
Value for Taxes Q3. The municipality provides a wide range of services, including police and fire protection,
garbage collection and disposal, recreation facilities and programming, transit, road and street maintenance, etc.
Thinking about all the programs and services you receive from the municipality, please
indicate the degree to which you believe you receive good or poor value for the level of property taxes that you currently pay?
Please check only one
Very good value
Good value
Poor value
Very poor value
No opinion / Don’t know (skip to question Q5)
Do Not Pay Property Tax (e.g. rent, live with parents) (skip to question Q5)

Page 3 of 34
Q4. Can you share the reason(s) why you feel this way about the value for your property
taxes? ________________________________________________________________________________________________________________________________________________________________________________________________________________________
Q5. When the municipality is creating the municipal budget, please indicate which of the
statements comes closest to your point of view. The municipality should: Please check only one
Decrease taxes and fees, even if municipal services must decrease
Maintain taxes and fees, even if it means reducing some services to maintain others
Increase municipal services, even if taxes or fees must increase
Q6. If adding services and facilities, or maintaining existing service levels meant an increased
cost to provide those services, which would you prefer most as a way to fund this increase?
Please check only one
Increases to user fees
Increases to property taxes
Increases to municipal debt
Both user fee and property tax increases
A combination of increases to user fees, property tax increases, and debt
Don’t know

Page 4 of 34
Satisfaction with Services SI1. Please tell us how satisfied you are with each of the following services provided by the
municipality. If you don’t know, or have not had any experience with the service to provide a rating, please choose Don’t Know / No Opinion.
Service Very
Satisfied Satisfied Dissatisfied
Very Dissatisfied
Don’t Know / No Opinion
Arts and cultural facilities and programs
Bike lanes / Cycling facilities
Business support services (e.g. licenses, permits)
Community planning / Land use planning and approvals
Community standards (e.g. by-law enforcement, animal control)
Economic development
Emergency preparedness
Environmental protection and sustainability
Garbage, recycling, and organics collection
Litter control / Graffiti removal / Cleanliness
Overall city maintenance
Parking enforcement
Public / Community engagement (e.g. consultations on projects like Cogswell District, Centre Plan, etc.)
Public transit (bus / ferry)
Public transit (Access-A-Bus)
Overall transit service
Recreation facilities (e.g. community centres, sports fields)
Recreation programming
Sidewalk maintenance
Street / Road maintenance
Traffic management (e.g. signals, road widening, etc.)
Traffic / Pedestrian safety
Winter maintenance (snow and ice control)

Page 5 of 34
SI2. Overall, how satisfied are you with the delivery of all the services provided by the
municipality?
Very satisfied
Satisfied
Dissatisfied
Very dissatisfied
Don’t know/No opinion
SI3. The cost of delivering municipal services is rising, and even the cost of maintaining some
service levels is increasing. Maintaining or increasing some service levels without additional revenues may require reducing other services.
For each of the following service areas, please indicate whether you believe the
municipality should increase the level of service, maintain the level of service, or reduce the level of service.
Please check the box that corresponds with your response
Service Increase
service levels Maintain
service levels Reduce
service levels
Arts and cultural facilities and programs
Bike lanes / Cycling facilities
Business support services (e.g. licenses, permits)
Community beautification (e.g. landscaping, floral displays)
Community planning / Land use planning and approvals
Community standards (e.g. by-law enforcement, animal control)
Economic development
Emergency preparedness
Environmental protection and sustainability
Fire services
Garbage, recycling, and organics collection

Page 6 of 34
Service Increase
service levels Maintain
service levels Reduce
service levels
Litter control / Graffiti removal / Cleanliness
Parking enforcement
Parks, playgrounds, and green spaces
Police services
Public / Community engagement (e.g. consultations on projects like Cogswell District, Centre Plan, etc.)
Public libraries
Public transit (bus / ferry)
Public transit (Access-A-Bus)
Recreation facilities (e.g. community centres, sports fields)
Recreation programming
Sidewalk maintenance
Street / Road maintenance
Traffic management (e.g. signals, road widening, etc.)
Traffic / Pedestrian safety
Winter maintenance (snow and ice control)

Page 7 of 34
Community Priorities CP1. In 2017, Regional Council approved six Council priorities. Please rate them in terms of
their importance to you.
Council Priorities Very
Important Important
Not Important
Not at all Important
Governance and Engagement through improved management of municipal resources, clear communications with the public, and opportunities to participate in municipal policy and planning.
Economic Development through attracting investment and keeping and growing business and talent in the municipality.
Healthy Liveable Communities through investments in public safety, recreation and leisure programming and facilities, considerations for the environment, and supporting the health of the community.
Transportation improvements through investments in public transit, active transportation, traffic congestion reduction, and maintaining our roadways and sidewalks.
Service Delivery improvements focused on making service to people and businesses better.
Social Development through investments to make it easier for all persons to be able to afford or access programs and services they need to participate fully in life.

Page 8 of 34
CP2. The municipality invests in various infrastructure projects, including buying or building new assets, or investing in existing ones (e.g. new 4-pad rink / a new roof on a recreation facility / new sidewalks / pothole repairs). Please rate them in terms of their importance to you?
Infrastructure Categories Very
Important Important
Not Important
Not at all Important
Buildings and facilities
Integrated mobility projects such as streets, sidewalks, Active Transportation projects (cycling, walking), and traffic improvements
Parks and playgrounds
Public transit, including buses, ferries, and their facilities
Equipment and corporate fleet (e.g. fire and police vehicles, ice resurfacers, fire equipment)
Technology supporting municipal operations

Page 9 of 34
CP3. The municipality spends a portion of its yearly budget on infrastructure to meet both growth requirements and community expectations. Please rank the top three (3) infrastructure projects that you would like to see the municipality pursue over the next 5 years.
Please place a: 1 beside your top priority 2 beside your second highest priority 3 beside your third highest priority
Arenas / Ice surfaces
Arts and cultural facilities
Commuter rail
Improved / Additional public transit facilities
Improving existing facilities
Maintenance of existing sidewalks, walkways, and trails
Maintenance of existing streets and roads (e.g. fill potholes, patching, crack sealing)
More buses on existing routes
More buses so that service can be expanded to new areas
New / Refurbished community branch libraries
New / Repair of outdoor recreation facilities (e.g. playgrounds, skate parks, sports fields)
New active transportation improvements (e.g. new sidewalks, bike lanes, walkways, and trails)
New recreation facilities / Community centres
New stadium
Technology to improve service delivery / Customer service / Accessibility
Upgrade major roadways to provide increased capacity (e.g. road widening, reversing lanes)
Other (please describe): _________________________________________

Page 10 of 34
Service Quality CS1. Have you had any contact with a municipal employee either in-person, in writing, by
telephone, email / web site, by fax, by social media, or by encounter with a police / by-law officer over the last 12 months?
Yes
No (please skip to CS7)
CS2. How did you contact the municipality during your most recent interaction?
In person – Customer Service Centre
In person – Other __________________________________ (please indicate)
Telephone (311 or 902-490-4000)
Telephone (911)
Telephone – Direct to an employee
Website (www.halifax.ca)
Twitter (e.g. @hfxgov, @hfxcivicevents, etc.)
Posted mail
Email – Specific person
Email – General
Elected Official (Councillor / Mayor)
Police officer / Compliance officer (e.g. parking, by-law)
CS3. Have you accessed the municipality’s Customer Service Centre in-person in the last 12
months?
Yes
No (please skip to CS5)
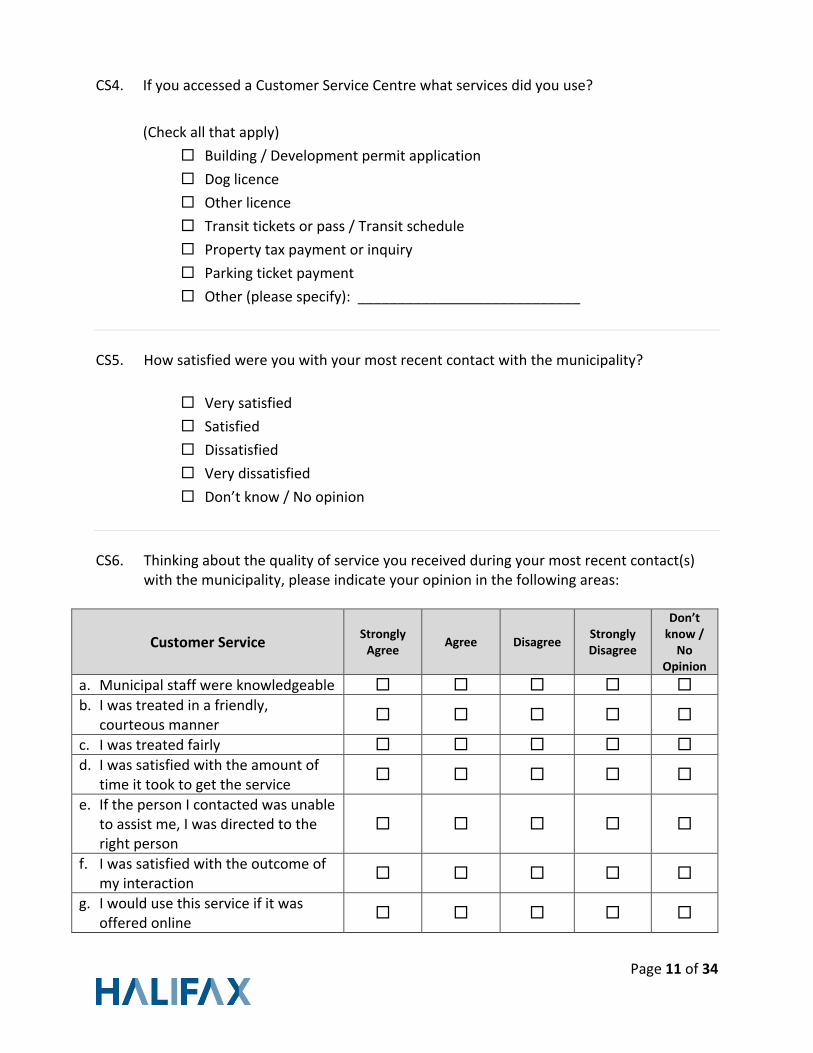
Page 11 of 34
CS4. If you accessed a Customer Service Centre what services did you use?
(Check all that apply)
Building / Development permit application
Dog licence
Other licence
Transit tickets or pass / Transit schedule
Property tax payment or inquiry
Parking ticket payment
Other (please specify): ____________________________
CS5. How satisfied were you with your most recent contact with the municipality?
Very satisfied
Satisfied
Dissatisfied
Very dissatisfied
Don’t know / No opinion
CS6. Thinking about the quality of service you received during your most recent contact(s)
with the municipality, please indicate your opinion in the following areas:
Customer Service Strongly
Agree Agree Disagree
Strongly Disagree
Don’t know /
No Opinion
a. Municipal staff were knowledgeable
b. I was treated in a friendly, courteous manner
c. I was treated fairly
d. I was satisfied with the amount of time it took to get the service
e. If the person I contacted was unable to assist me, I was directed to the right person
f. I was satisfied with the outcome of my interaction
g. I would use this service if it was offered online

Page 12 of 34
The municipality would like to identify key areas of action to improve customers’ online experience by making services more convenient, intuitive, and easier to use.
CS7. How recently have you accessed the www.halifax.ca website?
Within the last week
Within the past month
Within the past six months
Within the past 12 months
Have not accessed in the past 12 months
Have never accessed www.halifax.ca website
CS8. How recently have you accessed any of the municipal services offered online at
https://www.halifax.ca/home/online-services?
Within the last week
Within the past month
Within the past six months
Within the past 12 months
Have not accessed in the past 12 months
Have never accessed any online services?
CS9. Which online service(s) did you access in the past 12 months?
Check all that apply
Made an online request
Completed an online payment
Conducted a search for information
Registered or made a booking
Reported something
Contacted the municipality
Other (please specify): _____________________________________
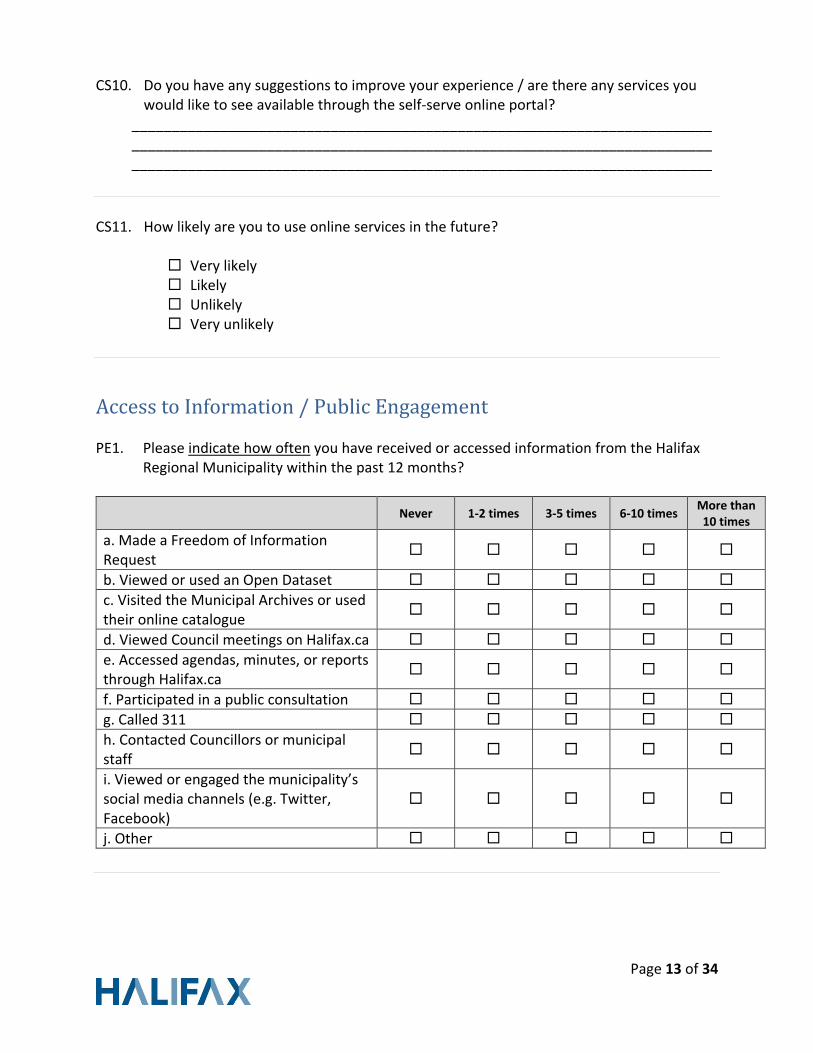
Page 13 of 34
CS10. Do you have any suggestions to improve your experience / are there any services you would like to see available through the self-serve online portal?
___________________________________________________________________________________________________________________________________________________________________________________________________________________________
CS11. How likely are you to use online services in the future?
Very likely Likely Unlikely Very unlikely
Access to Information / Public Engagement PE1. Please indicate how often you have received or accessed information from the Halifax
Regional Municipality within the past 12 months?
Never 1-2 times 3-5 times 6-10 times More than 10 times
a. Made a Freedom of Information Request
b. Viewed or used an Open Dataset
c. Visited the Municipal Archives or used their online catalogue
d. Viewed Council meetings on Halifax.ca
e. Accessed agendas, minutes, or reports through Halifax.ca
f. Participated in a public consultation
g. Called 311
h. Contacted Councillors or municipal staff
i. Viewed or engaged the municipality’s social media channels (e.g. Twitter, Facebook)
j. Other

Page 14 of 34
PE2. Overall, how easy or difficult do you find doing the following from the municipality?
Have not tried to access
Very easy Easy Difficult Very
difficult
a. Making a Freedom of Information Request
b. Viewing or using an Open Dataset
c. Visiting the Municipal Archives or using their online catalogue
d. Viewing Council meetings on Halifax.ca
e. Accessing agendas, minutes, or reports through Halifax.ca
f. Participating in a public consultation
g. Calling 311
h. Contacting Councillors or municipal staff
i. Viewing or engaged the municipality’s social media channels (e.g. Twitter, Facebook)
j. Other (please specify) ________________________
PE3. Please indicate how frequently you have participated or engaged with the Halifax
Regional Municipality over the past 12 months.
Never 1-2 times 3-5 times 6-10 times More than 10 times
a. Completed online surveys from the municipality
b. Spoke directly with my Councillor or municipal staff
c. Completed email or feedback form
d. Contacted the municipality through social media (e.g. Twitter, Facebook)
e. Attended an in-person public meeting
f. Participated in an online discussion
g. Participated in a workshop or conference
h. Spoke at a board or committee meeting
i. Met with an advisory committee
j. Other (please specify) ____________________

Page 15 of 34
PE4. Do you agree or disagree that the municipality provides sufficient tools and information to allow you to meaningfully participate and engage with the municipality?
Completely Agree
Agree
Disagree
Completely Disagree
PE5. What barriers or challenges, if any, have you encountered in accessing Halifax Regional
Municipality information or participating or engaging with the municipality? ________________________________________________________________________________________________________________________________________________________________________________________________________________________
PE6. What is your preferred method(s) of being engaged by the Halifax Regional Municipality?
Check all that apply Online survey In-person public meeting / Town Hall Workshop / Conference Social media (e.g. Twitter, Facebook) Speaking at a board or committee meeting Online discussion Newsletter / Direct mail Email Telephone (via automated calling service) Other (please specify): _______________________________________________ None

Page 16 of 34
Public Safety Please note: The Halifax Regional Municipality includes Halifax Regional Police and Halifax District RCMP. In your responses, please focus on your overall experience with police in the municipality. PS1. When you think about police in Halifax, to what extent do you agree or disagree with
each of the following statements.
Police Strongly
Agree Agree
Neither agree nor disagree
Disagree Strongly Disagree
a. The police treat people fairly
b. The police show care and concern for the welfare of the citizens they deal with
c. The police make decisions based on facts
d. The police provide the same quality of service to all citizens
e. The police understand the issues that affect this community
f. I generally support how the police usually act
g. I would help the police if asked
h. I would call the police to report a crime
i. I would call the police for assistance
PS2. In the past 2 years, did the police approach you, stop you, or make contact with you for any reason?
Yes
No (Skip to PS4)

Page 17 of 34
PS3. How satisfied or dissatisfied were you with the way the police treated you the last time this happened?
Very satisfied
Satisfied
Neither satisfied nor dissatisfied
Dissatisfied
Very dissatisfied
PS4. About how often would you say that the police in your neighbourhood exceed their authority?
Never / Almost never
Rarely
Sometimes
Most of the time
Always / Almost always
PS5. Taking everything into account, how good a job do you think the police in this area are doing?
Excellent
Good
Average
Poor
Very poor
PS6. How safe from crime do you feel walking alone in your area after dark?
Please check only one
Very safe
Reasonably safe
Somewhat unsafe
Very unsafe
Do not walk alone
Page 18 of 34
PS7. Have you, or someone in your household been a victim of a crime in the past year?
Yes
No (please skip to PS11)
PS8. The last time this happened, where did this incident happen?
At your home
Near your home
At your work
Elsewhere in the Halifax region
Outside of the municipality
PS9. What type of crime was it?
Property crime (e.g. break and enter, theft, arson, fraud, mischief)
Violent crime (e.g. robbery, assault, attempted murder, murder, abduction)
Other kind of crime (e.g. indecent acts, harassment, hate speech, cybercrime)
PS10. Did you or anyone else report it to the police?
Yes
No

Page 19 of 34
Halifax Regional Fire & Emergency (HRFE) provides Fire and Emergency Management services throughout the Halifax Regional Municipality. These services are delivered by career and volunteer personnel.
PS11. Fire services are based on three lines of defence: Public Education, Fire Prevention, and Emergency Response. Are you or are you not aware that HRFE provides the following fire services / activities?
Fire Services Aware Not Aware
Public Education / Information programs Fire prevention / Fire code inspections and enforcement Fire fighting and rescue Medical response Motor vehicle accident response
Technical / Water rescue Hazardous Materials response
Community / Public events (e.g. parades / festivals)
PS12. Emergency Management ensures readiness in the event of a natural or man-made
disaster. Are you or are you not aware that HRFE provides the following services?
Emergency Management Aware Not Aware
Community risk analysis Disaster planning and exercises Response and recovery Manages the municipality’s Emergency Operations Centre (EOC)
PS13. Have you required or witnessed a response from Halifax Regional Fire & Emergency in
the past year?
Yes
No (if no, please skip to question PS15)

Page 20 of 34
PS14. How satisfied were you with the services provided by Halifax Regional Fire & Emergency?
Please check only one
Very satisfied
Satisfied
Dissatisfied
Very dissatisfied
Don’t know / No opinion
PS15. How confident are you that Halifax Regional Fire & Emergency will respond to
emergency calls in a timely manner?
Please check only one
Completely confident
Confident
Not very confident
Not at all confident
Don’t know / No opinion
PS16. In the event of an emergency or disaster situation, Halifax Regional Fire & Emergency
recommends that you have enough supplies to last you for 72 hours, and a plan in case you need to evacuate your home. Do you meet this recommended guideline?
Please check only one
Yes
No

Page 21 of 34
Recreation and Leisure RL1. How frequently have you used a municipally-run recreation facility in the past year?
(Example: Captain William Spry, Gordon R. Snow, North Preston Community Centre)
At least once per week
At least once per month
Once every 2-3 months
Once or twice per year
Never
RL2. Have you registered for or participated in a municipally-run recreation program over the
past 12 months?
Yes
No
RL3. Do you find it difficult to access any municipal facilities or participate in any recreation
or leisure programs run by the municipality? (Access meaning: Affordability / The ease of getting to and from the facility or activity / Whether the facility or program is built to accommodate persons with physical, emotional or intellectual disabilities)
Yes
No (skip to Question RL5)

Page 22 of 34
RL4. What are some of the reasons why you find it difficult to access municipal facilities or recreation and leisure programs run by the municipality? Check all that apply
Registration / User fees are too high compared to other recreation service providers / Athletic associations
No facilities or programs of interest are within a reasonable distance from my home / Takes too long to get there
No transit service to local facilities
Facilities are not open during times I can use them
No recreation programming of interest to me
Recreation facilities are not accessible to me (not disabled-friendly)
Other (please specify): _____________________________________________
RL5. Is there any additional recreation, arts, culture, and leisure programming that you would
like to see the municipality offer? ___________________________________________________________________________________________________________________________________________________________________________________________________________________________
Page 23 of 34
Parks PR1. How frequently have you used the following over the past year?
Parks Weekly Monthly Every 2-3 Months
1-2 times per year
Haven’t used
a. Parks
b. Playgrounds
c. Wilderness trails
d. Sports fields / Ballfields
e. Off-leash dog parks
f. Public washrooms
g. Beaches / Waterfront areas
PR2. How satisfied are you with the cleanliness / maintenance of the following?
Parks Very
Satisfied Satisfied Dissatisfied
Very Dissatisfied
Haven’t used / No Opinion
a. Parks
b. Playgrounds
c. Wilderness trails
d. Sports fields / Ballfields
e. Off-leash dog parks
f. Public washrooms
g. Beaches / Waterfront areas
PR3. How would you rate your overall park experience?
Very satisfied
Satisfied
Dissatisfied
Very dissatisfied
Don’t know / No opinion
PR4. Is there anything that would enhance the overall park experience for you?
___________________________________________________________________________________________________________________________________________________________________________________________________________________________

Page 24 of 34
Public Libraries LIB1. Have you used the services of Halifax Public Libraries in the past 12 months in a branch,
in the community, or online?
Yes
No (please skip to LIB5)
LIB2. Which of the following libraries have you used in the past 12 months?
Check all that apply
Alderney Gate
Bedford
Captain William Spry
Cole Harbour
Dartmouth North
Halifax Central Library
Halifax North Memorial
J.D. Shatford (Hubbards)
Keshen Goodman
Musquodoboit Harbour
Sackville
Sheet Harbour
Tantallon
Woodlawn
Home Delivery / Borrow by Mail
Website (halifaxpubliclibraries.ca)
Digital Collection (ebooks, streaming, emagazines, etc.)
In the community (service delivered outside a library)

Page 25 of 34
LIB3. Please rate your satisfaction with the programs and services provided by the library /
libraries you have used in the past 12 months?
Public Libraries Very
Satisfied Satisfied Dissatisfied
Very Dissatisfied
Don’t Know / No
Opinion
a. Library facilities
b. Library materials (books, CDs, DVDs, ebooks, etc.)
c. Public technology (Wi-Fi, computers, iPads, printers, gaming, etc.)
d. Children’s programs (ages 0-13)
e. Youth programs (ages 14-18)
f. Adult programs
g. Programs for seniors
h. Programs for newcomers
i. Home delivery
j. Borrow by Mail services
k. Open hours
l. Overall satisfaction with Halifax Public Libraries
LIB4. Where do you most often get your information about library services?
(Check all that apply)
Library staff
Digital screen in branch
Website
Library poster
Printed program listings
Other (please specify): ________________

Page 26 of 34
LIB5. How important are public libraries and the services they provide to your community?
Very important
Important
Not Important
Not at all Important
Don’t know / No opinion
LIB6. What, if anything, prevents you from using the library more often?
(Check all that apply)
Inconvenient open hours Inconvenient location Overdue fines Transportation issues No programs / Services / Books I want Too noisy / Crowded
Too difficult to register for a card
Accessibility issues
Not enough computers
Nothing. I like the library the way it is
Other (please specify):

Page 27 of 34
Transportation If you do not regularly commute to work or school, then please skip to Question T3. T1. Do you commute to work or school?
Yes
No (Skip to Question T3)
T2. What is your primary mode of travel to get to work / school (mode used for the longest
distance)?
If you use more than one mode, please check all that apply. Walk Bicycle Public transit (including bus, ferry, or Access-A-Bus) Rural transit (e.g. MusGo Rider) Taxi Drive myself by car or motorcycle Am a passenger in a car, or on a motorcycle
Other: _______________________________________________
T3. Have you used Halifax Transit in the past 12 months?
Yes
No (Skip to question T5)
T4. If you answered Yes to Question T3, how frequently do you use Halifax Transit?
Daily
Several times per week
Several times per month
Several times per year

Page 28 of 34
T5. What would encourage you to use public transit services more often than you do now?
Please check all that apply
Added service to rural areas (e.g. Fall River)
Improved / Electronic fare payment options
Additional designated fully accessible routes
Improved schedule information / Access to schedule information
Additional bike rack accessible buses Increased safety on board, at terminals & stops
Additional Park & Ride lots Increased service frequency Additional shelters More direct or limited stop routes
Additional urban core bus routes Reliable / On-time service
Environmental concerns Stops closer to home or work
Fewer transfers App to determine bus arrival times
Nothing. Happy with current services. Nothing. I don’t plan to use transit.
Other (please specify):
T6. Please indicate your thoughts about parking downtown: Check all that apply
I feel that more off-street parking (e.g. parkade / parking lot) is needed in downtown Halifax
I feel that more off-street parking (e.g. parkade / parking lot) is needed in downtown Dartmouth
I feel that there is sufficient parking available
I feel that less parking is needed
Page 29 of 34
FINAL THOUGHTS: F1. In your opinion, what are the top three issues facing the Halifax region over the next five
years that you feel the municipality should invest greater resources?
1. _______________________________________________________________ 2. _______________________________________________________________ 3. _______________________________________________________________

Page 30 of 34
DEMOGRAPHIC QUESTIONS Our last questions are about you and your household. As a reminder, your responses to this survey are anonymous, and the results of the survey will be reported in aggregate only. D1. What are the first three characters of your postal code? _____________
D2. How many years have you lived in the Halifax Regional Municipality?
(Please include years prior to amalgamation)
0 - 4 Years
5 - 9 Years
10 – 14 Years
15 - 20 Years
More than 20 Years
D3. What gender identity do you most associate with?
Man
Woman
Non-binary
Prefer not to say
D4. How old are you?
18 – 34 years old
35 – 54 years old
55 and older
Prefer not to say

Page 31 of 34
D5. What is the highest level of education you have completed?
No certificate, diploma, or degree
Secondary (high) school diploma or equivalency certificate
Apprenticeship or trades certificate or diploma
College, CEGEP or other non-university certificate or diploma
University graduate (Bachelor’s degree)
University certificate, diploma, or degree above bachelor level
Prefer not to say
D6. What was your 2017 total household income, before taxes? Your best estimate is fine.
Less than $30,000
$30,000 to less than $50,000
$50,000 to less than $75,000
$75,000 to less than $100,000
$100,000 to less than $125,000
$125,000 to less than$150,000
Over $150,000
Prefer not to say
D7. Do you own or rent your home?
Own home (with or without mortgage)
Rent
Live in parent’s / relative’s home
Other (group home / retirement facility / university residence)
Prefer not to say

Page 32 of 34
D8. Number of people in household?
1
2
3
4
5
6 or more
D9. Are there children (under the age of 18) or seniors (age 65+, including yourself) living in
your household? Please check all that apply
Children
Seniors
Neither
D10. How much was your most recent annual property tax bill?
Less than $1,000
Between $1,000 and $2,000
Between $2,000 and $3,000
Between $3,000 and $4,000
Between $4,000 and $5,000
Over $5,000
Don’t Know / Don’t pay property tax
Prefer not to say

Page 33 of 34
The Halifax Regional Municipality has identified valuing diversity and inclusion as a corporate priority. To support this, we are asking you to please self-identify based on the ethnicity categories of the Canadian Census. D11. What is your ethnic identity? Check all that apply
White
South Asian (e.g. East Indian, Pakistani, Sri Lankan, etc.)
Chinese
Black (African Nova Scotian)
Black (African Canadian)
Filipino
Latin American
Arab
Southeast Asian (e.g. Vietnamese, Cambodian, Laotian, Thai, etc.)
West Asian (e.g. Iranian, Afghan, etc.)
Korean
Japanese
First Nations (North American Indian; includes Status and Non-Status Indians)
Metis
Inuk (Inuit)
Other
Prefer not to say

Page 34 of 34
COMMENTS OR FEEDBACK
Do you have any final comments about this survey? ______________________________________________________________________________ ______________________________________________________________________________
PRIZE DRAW: Please enter your contact information to be eligible to win one of 10 VISA/Mastercard prepaid credit cards valued at $100. To be eligible for the contest, you must answer all the questions on the survey. Name: _________________________ Tel. #: __________________________ Thank you very much for your participation. Your time and effort is appreciated, and we will take every effort to ensure that your input is reflected in the decision-making efforts for the municipality. Results will be presented to Regional Council once analyzed, and a full report on the results will be available on the municipality’s website. In accordance with Section 485 of the Municipal Government Act (MGA), any personal information collected in this survey will only be used by municipal staff and, if necessary, individuals under service contract with the Halifax Regional Municipality for purposes relating to the 2018 Citizen Survey and for prize selection; the information will not be presented or compiled in a manner that could potentially identify any respondent. If you have any questions about the collection and use of this personal information, please contact the Access and Privacy Office at 490-7460 or [email protected]. Thank you very much for taking the time to provide your opinions and feedback.