The complete lithostratigraphic section of the geothermal ...
6 Outram Street, West Perth WA 6005
PO Box 1227, West Perth WA 6872
Phone: +61 8 9324 1053
Fax: +61 8 9324 3366
1
ASX Code: MCT
24 February 2016
Admiral Bay Zinc Project Resource Upgrade by 15%
• Admiral Bay confirmed as Australia’s largest zinc deposit at 111.3 Mt at 5.7% ZnEq
• Admiral Bay confirmed as one of the largest undeveloped zinc projects in the world
• Geological work on newly modelled zones supports Mineral Resource upgrade by 15%
• Additional Inferred Resources:
o SS6 area, 4.6 Mt at 7.6% ZnEq (4.6% Zn, 2.0% Pb, 27 g/t Ag)
o SS17 area, 1.4 Mt at 5.5% ZnEq (4.1% Zn, 0.8% Pb, 20 g/t Ag)
• Comprehensive lithostratigraphic and structural interpretation, re-logging all drill core, re-
processing 2D seismic data and compilation of a new geological model
• New geological model and Scoping Study on track for completion in March 2016.
Metalicity Limited (ASX:MCT) (“MCT” or “the Company”) is pleased to report the completion of a
Mineral Resource Estimate for the two extra zones announced on 17 December 2015 (“Significant new
mineralised zones identified at Admiral Bay”). The new estimates are for two zones of significant zinc
and lead mineralisation within the project area that have not previously had resources estimated. This
work was completed as part of the development of a new geological model being undertaken for the
100% owned Admiral Bay Zinc Project, located in the northwest of Western Australia (Figure 1).
The extra resource zones increase the total project resource by 15%. Both of these new zones remain
open along strike, and there is good potential to increase these resources with step out drilling.
Furthermore, the new geological work suggests that a number of the sub-economic intersections away
from the known resources along the Admiral Bay Fault zone may be “near misses” close to higher-grade
mineralised zones rather than indicating low potential.
Past reporting of Admiral Bay resources has focused on zinc-rich zones. Although a lead-dominated
zone, ‘Zone 3’, was reported, it was not emphasised in the general discussion of the total tonnes in the
deposit. Recent geological work has confirmed the presence of Zone 3 lead-dominated mineralisation
in the main deposit as well as in these two new areas. The proximity of Zone 3 to the other mineralised
zones at Admiral Bay is such that it would be potentially economically extractable as part of a large
integrated project. To enable the PFS mining work to address a full range of resource permutations at
Admiral Bay, it is considered appropriate to include Zone 3 in the Admiral Bay Mineral Resources,
classified as Inferred.
The Inferred Mineral Resource at Admiral Bay is now 111.3 Mt at 5.7% ZnEq1 (2.3% Zn, 2.7% Pb, 15 g/t
Ag). The strike lengths of the resources and new zones are limited to 2.1 km for the main zone, 200 m
for the SS6 zone and 200m for the SS17 zone, out of an 18 km drill-tested mineralised corridor within a
55 km prospective corridor along the Admiral Bay Fault Zone (as announced by PLD on 25/11/2014).
Details of the resource estimation are provided below.
1 Zinc Equivalent calculated as ZnEq=Zn+1.06*Pb+0.03*Ag; full details are presented below
For
per
sona
l use
onl
y

6 Outram Street, West Perth WA 6005
PO Box 1227, West Perth WA 6872
Phone: +61 8 9324 1053
Fax: +61 8 9324 3366
2
The Company is working through a program of comprehensive structural interpretation, re-logging of
all drill core and re-processing of 2D seismic data, with teams recently on site at Admiral Bay re-logging
both the mineralised and non-mineralised drill core. Integration of the geological and geophysical work
will result in the creation of a new 3D geological model.
This model will enhance the understanding of the mineralisation, its continuity and controls, and will be
used to identify discrete drill targets with the potential to further upgrade the MRE in both size and
classification. This work is being undertaken by industry leading consultants and is due for completion
as part of the Scoping Study in March 2016.
Admiral Bay is a carbonate-hosted zinc-lead-silver deposit and classified as a Mississippi Valley-type
(MVT) deposit. The deposit, however, does not demonstrate all the characteristics of a typical MVT,
notably having greater continuity of stratabound mineralisation, providing further support for the
potential of additional resources extending and linking the existing resources in the project area.
Commenting on the MRE Upgrade Managing Director Matt Gauci said:
“The MRE upgrade confirms Admiral Bay as Australia’s largest undeveloped zinc deposit and the world’s
5th largest undeveloped zinc deposit. The new geological model in particular is a critical step in
understanding the high-grade zones that occur within the system so they may be targeted for future
drilling and resource upgrades. The scale of already 5.25 Mt contained zinc from only 2.1 km of an 18 km
mineralised corridor, and location in the world class jurisdiction of West Australia, ensures Admiral Bay
is of significant interest to the base metals industry, and discussions are ongoing with potential
partners.”
New Geological Model
The geological model being compiled is an innovative and modern approach to assessing the Admiral
Bay deposit, and consists of the acquisition, compilation and interpretation of data previously
unavailable and evaluated for the first time by experts with substantial experience in MVT systems. The
process involves:
• Structural, lithofacies and mineralisation interpretation based on re-logging drill core and
integration of all data dating back to 1981
• Re-processing historical 2D seismic data to optimises 3D modelling of the horizons that host
mineralisation and confirm continuity from drill hole to drill hole
• Re-assess the current resource estimate using all available data including seismic data
• Assess potential for 3D seismic to image structures and mineralisation and provide discrete drill
targets
This will result in the compilation of a maiden 3D Geological Model to enhance the understanding of the
mineralisation, its continuity and generate discrete drill targets. This work has also identified significant
thick higher-grade zones of zinc and lead mineralisation within the existing Mineral Resource Estimate
(MRE). For
per
sona
l use
onl
y

6 Outram Street, West Perth WA 6005
PO Box 1227, West Perth WA 6872
Phone: +61 8 9324 1053
Fax: +61 8 9324 3366
3
Figure 1. Drill core logging
Figure 2. Example of seismic interpretation (not Admiral Bay)
Mineral Resource Additions
Following re-logging and interpretation of the main Admiral Bay deposit, the mineralisation in the SS6 zone
and in SS17 was re-interpreted using the same criteria as used in the main area. This re-interpretation was
then used to create wireframes for these two zones, and resource estimation was undertaken using the same
approach as in the main deposit.
A summary of the information and methodology of the resource estimation is as follows:
Drilling techniques
The deposit was sampled using diamond core drilling (DD) over several drilling campaigns undertaken by CRA
Exploration Pty Ltd (CRAE) and Kagara Ltd. Five CRAE surface diamond drill holes were used for the resource
estimation of these additional zones; four in the SS6 zone and the single intersection of SS17. All drill holes
were vertical. Mud rotary pre-collars were used to drill the cover sequence and manage zones of artesian
water and gas kicks. CRAE holes were predominantly NQ is size, with limited HQ core.
Sampling and Sub-sampling techniques
The entire length of the drill core was sampled; for CRAE core half core was sampled. The core was routinely
sampled on 1 m intervals, with a minimum interval of 0.25 m. Sample sizes are considered appropriate to
For
per
sona
l use
onl
y

6 Outram Street, West Perth WA 6005
PO Box 1227, West Perth WA 6872
Phone: +61 8 9324 1053
Fax: +61 8 9324 3366
4
accurately represent the mineralisation at Admiral Bay based on the thickness and consistency of the
intersections, the sampling methodology, and the percent value assay ranges for the primary elements.
The mud rotary pre-collars were collected as 10 m composite samples by the contract mud loggers. These
samples were not analysed.
Geological Interpretation
Drill-hole data spacing is variable. The SS6 section comprises four holes averaging 200 m apart. SS17 is a
single drill-hole intersection.
The zones are currently interpreted to be coincident with a bioherm associated with the Admiral Bay Fault
Zone (ABFZ). Mineralisation appears to be relatively continuous along the axis of the bioherm, but lower
grade and less well developed on its flanks. However, the flank areas are poorly defined or tested by drilling.
While mineralisation trend continuity appears to be predictable, grade continuity within the mineralised
zones remains relatively uncertain for some of the defined zones and is not adequately defined or constrained
by the current drill hole spacing.
Drill-hole intercept logging, wireline interpretation, and assay results have formed the basis for the geological
interpretation. The precise limits and geometry cannot be absolutely defined due to the limitations of the
current drill coverage. Further work is required to better define the geometry and limits of the mineralised
zones. The grade and lithological interpretation forms the basis for the modelling.
Sample Analysis Methods
CRAE samples were processed by Analabs and a four acid digest with AAS finish for Cu, Fe, Pb, Zn, Ag, Ca, Mg;
pressed powder XRF for Ba, Sr; and Fusion/Specific ion electrode) for F. A total of 224 samples for SS17 zone
and 1,078 samples for SS6 zone were analysed for Zn and Pb.
Wireline logging data including gamma, calliper, density, neutron, resistivity, SP, temperature, sonic and
magnetic deviation was collected from all drill holes.
Estimation Methodology
Four individual mineralised envelopes for each zone were interpreted based on the drill-hole sample data
using approximate 1.5-2% Zn and/or Pb cut-offs to define coherent zones of sulphide mineralisation.
SS6 and SS17 zones were interpreted using one cross-section for each zone. Each section was displayed in
Micromine’s Vizex display environment together with drill-hole traces colour-coded according to the sample
grades and sample grade values.
The following techniques were employed while interpreting the mineralisation:
• All interpreted strings were snapped to the corresponding drill-hole intervals, i.e. the interpretation
was constrained in the 3rd dimension
• The mineralised zones were extended approximately 100m from the drill-hole section to both sides
resulting in 200m length along strike
• The interpretation along dip direction was extended 50m from the peripheral drill holes on a section
and 100m from the internal drill holes.
The thickness of the mineralised envelopes varies from 3m to 14m for the SS6 zone and from 3m to 29m for
the SS17 zone. The mineralised zones extend from a depth of 1,315 m to a depth of 1,570m below the surface.
For
per
sona
l use
onl
y

6 Outram Street, West Perth WA 6005
PO Box 1227, West Perth WA 6872
Phone: +61 8 9324 1053
Fax: +61 8 9324 3366
5
All Zn, Pb, Cu, Ag, and Ba variables estimated in the Admiral Bay resource model mineralised zones were
generated using Inverse Distance (ID) using a power of 2. The ID estimates have been completed using
Micromine software. Block discretisation of 2x2x2 points (for X x Y x Z respectively) was used for block
estimation. Composite length and bulk density weighting was used in the estimation process.
The block model was constructed using a 25mE x 25mN x 5mRL parent block size, with subcelling to 6.25mE
x 6.25mN x 1.25mRL for domain volume resolution. The parent cell size was chosen on the basis of the general
morphology of mineralised bodies and in order to avoid the generation of too-large block models. The
subcelling size was chosen to maintain the resolution of the mineralised bodies.
A two-pass estimation strategy was applied for all variables estimated (Zn, Pu, Cu, Ag, Sr, and Ba), with
progressively expanded sample searches applied to successive estimation passes only considering blocks not
previously assigned. First pass searches used an anisotropic range of 600m x 300m x 300m with major axis
oriented horizontally along strike. If a block was not estimated in the first pass, a second pass search utilised
a maximum range of 1200m x 600m x 600m.
The use of similar search radii for the semi-major and minor axis orientations considered the narrow zones
being modelled, the variable orientations and curvature of the zones, and erratic distribution of data within
the mineralised zones.
The maximum number of composites used for any estimate was restricted to 20 composites for all estimated
variables. The minimum number of composites used for any first pass estimate was 10 composites for all
estimated variables. The minimum number of composites used for any second pass estimate was two
composites for all estimated variables.
All mineralised zone divisions were treated as hard boundaries for data and parameters used in the
estimation process.
The block model size was selected largely as a compromise for adequate volume definition of the narrow
mineralised zones in an underground mining scenario.
Classification Criteria
The Inferred Mineral Resource classification is based on the evidence from the available drill sampling and
seismic interpretation. This evidence is sufficient to imply but not verify geological and grade continuity.
Cut-off Grades
Four individual mineralised zones were interpreted based on the drill-hole sample data using approximate
1.5–2% Zn and/or Pb cut-offs to define coherent zones of sulphide mineralisation. The resource was reported
using a Zinc Equivalent lower cut-off grade of 2%.
Metal Equivalence
Zinc equivalent (ZnEq) calculation parameters are presented in Table 1. The metallurgical recoveries are
derived from metallurgical testwork completed by CRAE and Kagara. It is Metalicity’s opinion that all elements
included in the metal equivalent calculation have a reasonable potential to be recovered and sold. The
calculation formula is ZnEq=Zn+1.06Pb+0.03Ag
For
per
sona
l use
onl
y

6 Outram Street, West Perth WA 6005
PO Box 1227, West Perth WA 6872
Phone: +61 8 9324 1053
Fax: +61 8 9324 3366
6
Table 1 Zinc Equivalence Parameters
Metal Metal
Price
US$
Price in Assay
units
US$
Concentrate
Recovery
%
Recovered Unit
Pricing
US$
ZnEq
Factor1
Zinc 1.00/lb 22.04 per % 90 19.84 1.0
Lead 1.00/lb 22.04 per % 95 20.94 1.06
Silver 19/oz 0.61 per ppm 95 0.58 0.03 1 Approximating to head grade
Metal equivalents are highly dependent on the metal prices used to derive the equivalence formula. Metalicity notes that
the metal equivalence method taken above is a simplified approach. Only preliminary metallurgical recoveries are
available. The metal prices are assumed indicative LME prices and do not reflect the metal prices that a smelter would
pay for concentrate nor are any smelter penalties or charges included in the calculation.
Table 2 Admiral Bay Project Inferred Mineral Resources
AREA Tonnage
Mt
Zn
%
Pb
%
Ag
ppm
Ba
%
ZnEq
%
SS06 Zone 1 2.1 3.3 0.5 15 3 4.2
SS06 Zone 2 2.5 5.8 3.4 38 10 10.5
SS06 Zone 3 0.6 0.2 3.7 8 9 4.3
SS06 Total 5.3 4.1 2.2 25 7 7.2
SS17 Zone 1 1.2 4.4 0.7 21 3 5.7
SS17 Zone 2 0.3 2.6 1.1 18 23 4.3
SS17 Zone 3 0.2 0.2 4.9 29 14 6.2
SS17 Total 1.7 3.5 1.4 22 7 5.6
Central Zone 1 21.9 3.8 0.9 14 7 5.2
Central Zone 2 35.1 4.0 2.1 20 13 6.9
Central Zone 3 32.2 0.1 2.6 7 28 3.1
Central Zone 6 15.2 0.1 7.5 21 15 8.7
Coffey Total 104.4 2.2 2.8 15 17 5.6
Global Zone 1 25.2 3.8 0.9 14 6 5.1
Global Zone 2 37.9 4.2 2.2 21 13 7.1
Global Zone 3 33.1 0.1 2.6 8 28 3.1
Global Zone 6 15.2 0.1 7.5 21 15 8.7
Global Total 111.3 2.3 2.7 15 16 5.7
NOTES:
• ZONE 1 (CFM/NFM contact zone – high Zn/low Pb)
• ZONE 2 (NFM-hosted zone – high Zn/high Pb)
• ZONE 3 (NFM-hosted zone – high Pb/low Zn
• ZONE 6 (NFM/GFM contact zone – low Zn/high Pb)
CFM = Cudalgarra Formation, NFM=Nita Formation, GFM=Goldwyer Formation
• Inverse Distance (Power=2) Whole Block Estimates using 25mE x 25mN x 5mRL Parent Block Dimensions
• Reported using a Zinc Equivalent lower cut-off grade of 2% where ZNEQ=ZN+(1.06*PB)+(0.03*AG)
• Unconstrained and using ROUNDED figures
• Past reporting of the Admiral Bay Mineral Resources (e.g. PLD ASX release of 25/11/2014, Kagara release of
22/8/2008) included all the zones of the Central resource reported in this release, but chose to emphasise
resources that excluded Zone 3. As discussed above, the proximity of Zone 3 to the other mineralised zones in
most areas justifies their classification as Inferred Resources and consideration in the mining studies as part of
the current Admiral Bay Scoping Study.
• The 2008 and 2014 Mineral Resource reports used a slightly different formula to calculate ZnEq compared with
this report.
For
per
sona
l use
onl
y

6 Outram Street, West Perth WA 6005
PO Box 1227, West Perth WA 6872
Phone: +61 8 9324 1053
Fax: +61 8 9324 3366
7
Figure 3. Plan view of tenements and drill-hole locations over the 18 km Admiral Bay mineralised corridor
Main Zone 104.4 Mt SS17 Zone 1.44 Mt
SS6 Zone 4.62 Mt
For
per
sona
l use
onl
y

6 Outram Street, West Perth WA 6005
PO Box 1227, West Perth WA 6872
Phone: +61 8 9324 1053
Fax: +61 8 9324 3366
8
Competent Person Statement
The Australasian Code for Reporting of Exploration Results, Mineral Resources and Ore Reserves (the ‘JORC Code’)
sets out minimum standards, recommendations and guidelines for Public Reporting in Australasia of Exploration
Results, Mineral Resources and Ore Reserves. The Information contained in this announcement has been
presented in accordance with the JORC Code and references to “Measured, Indicated and Inferred Resources” are
to those terms as defined in the JORC Code.
The information in this report that relates to Geology and Exploration Results is based, and fairly reflects,
information compiled by Dr Neal Reynolds, who is a Member of the Australian Institute of Geoscientists. Dr
Reynolds is employed by CSA Global Pty Ltd, independent resource industry consultants. Dr Reynolds has
sufficient experience which is relevant to the style of mineralisation and type of deposit under consideration
and to the activity which he is undertaking to qualify as a Competent Person as defined in the 2012 Edition of
the ‘Australasian Code for Reporting of Exploration Results, Mineral Resources and Ore Reserves’. Dr Reynolds
consents to the inclusion in the report of the matters based on his information in the form and context in
which it appears.
The information in this report that relates to the Admiral Bay Mineral Resources is based on information compiled
by Serikjan Urbisinov, a Competent Person who is a Member of the Australian Institute of Geoscientists. Mr
Urbisinov is a full time employee of independent, resource industry consultancy CSA Global Pty Ltd. Mr Urbisinov
has sufficient experience that is relevant to the style of mineralisation and type of deposit under consideration
and to the activity being undertaken to qualify as a Competent Person as defined in the 2012 Edition of the
‘Australasian Code for Reporting of Exploration Results, Mineral Resources and Ore Reserves’. Mr Urbisinov
consents to the inclusion in the report of the matters based on his information in the form and context in which it
appears.
All parties have consented to the inclusion of their work for the purposes of this announcement. The
interpretations and conclusions reached in this report are based on current geological theory and the best
evidence available to the authors at the time of writing. It is the nature of all scientific conclusions that they are
founded on an assessment of probabilities and, however high these probabilities might be, they make no claim
for absolute certainty. Any economic decisions that might be taken on the basis of interpretations or conclusions
contained in this report will therefore carry an element of risk.
About Metalicity Limited
Metalicity Limited is an Australian mining exploration company with a primary focus on base metals sector
and the development of the world class Admiral Bay Zinc Project, located in the north west of Australia. The
company is currently undertaking a scoping study on Admiral Bay due to be completed by March 2016. The
Company’s secondary focus is the rare metals sector with the recent addition of the Pilgangoora South
Lithium Project and the Munglinup Graphite Project where early stage exploration has commenced. The
Company is supported by a management team with collective experience of over 200 years in the resources
sector and a cornerstone investor in Resource Capital Funds, who manage over $2B in resource related funds.
For More Information:
Matt Gauci
Managing Director
T: +61 9324 1053
David Tasker
Professional Public Relations
T: +61 8 9388 0944
For
per
sona
l use
onl
y

6 Outram Street, West Perth WA 6005
PO Box 1227, West Perth WA 6872
Phone: +61 8 9324 1053
Fax: +61 8 9324 3366
9
JORC Code, 2012 Edition – Table 1
Section 1 Sampling Techniques and Data
Criteria JORC Code explanation Commentary
Sampling
techniques
• Nature and quality of sampling (eg cut channels, random chips, or specific
specialised industry standard measurement tools appropriate to the
minerals under investigation, such as down hole gamma sondes, or
handheld XRF instruments, etc). These examples should not be taken as
limiting the broad meaning of sampling.
• Include reference to measures taken to ensure sample representivity and the
appropriate calibration of any measurement tools or systems used.
• Aspects of the determination of mineralisation that are Material to the
Public Report.
• In cases where ‘industry standard’ work has been done this would be
relatively simple (eg ‘reverse circulation drilling was used to obtain 1 m
samples from which 3 kg was pulverised to produce a 30 g charge for fire
assay’). In other cases more explanation may be required, such as where
there is coarse gold that has inherent sampling problems. Unusual
commodities or mineralisation types (eg submarine nodules) may warrant
disclosure of detailed information.
• The deposit was sampled using diamond core drilling (DD) over several
drilling campaigns undertaken by CRA Exploration Pty Ltd (CRAE) and by
Kagara Ltd (11 holes) and one oil-well, Cudalgarra-1. A total of 21 surface
diamond drill holes were used for the resource estimation, of which 18 are
within the wireframe, together with oil well Cudalgarra-1. All drill holes were
vertical.
Drilling
techniques
• Drill type (eg core, reverse circulation, open-hole hammer, rotary air blast,
auger, Bangka, sonic, etc) and details (eg core diameter, triple or standard
tube, depth of diamond tails, face-sampling bit or other type, whether core
is oriented and if so, by what method, etc).
• The deposit was sampled using diamond core drilling (DD) over several
drilling campaigns by CRAE and Kagara Limited using a UDR5000.
• Mud-rotary pre-collars were completed to depths of up to 1300m with HQ
and NQ diamond core tails through the mineralised zones.
• All drill holes were vertical and core was not oriented.
• Cudalgarra 1 is a mud rotary petroleum well that intersected the deposit
Drill sample
recovery
• Method of recording and assessing core and chip sample recoveries and
results assessed.
• Measures taken to maximise sample recovery and ensure representative
• Logged core recovery is only available for the Kagara drill holes. The data
indicates excellent average recoveries of 99% of cored portions of the drill
holes.
For
per
sona
l use
onl
y

6 Outram Street, West Perth WA 6005
PO Box 1227, West Perth WA 6872
Phone: +61 8 9324 1053
Fax: +61 8 9324 3366
10
Criteria JORC Code explanation Commentary
nature of the samples.
• Whether a relationship exists between sample recovery and grade and
whether sample bias may have occurred due to preferential loss/gain of
fine/coarse material.
• Sample recovery is generally very high (99%) within the mineralised zones.
No significant bias is expected, and any potential bias is not considered
material at this stage of resource development.
Logging • Whether core and chip samples have been geologically and geotechnically
logged to a level of detail to support appropriate Mineral Resource
estimation, mining studies and metallurgical studies.
• Whether logging is qualitative or quantitative in nature. Core (or costean,
channel, etc) photography.
• The total length and percentage of the relevant intersections logged.
• All drill core was geologically logged by CRAE and Kagara, and has most
holes have been re-logged my Metallicity; the drill hole database contains
adequate geological detail to construct a basic resource model.
• A wireline suite comprising gamma, calliper, density, neutron, resistivity, SP,
temperature, sonic and magnetic deviation was collected from all drill holes
• Diamond core was geotechnically logged for recovery and RQD for drill
holes. Information on structure type and orientation are recorded in the
database.
• All drill core was logged in full; summary chip logs of the rotary mud
sections of the holes are also available.
Sub-sampling
techniques
and sample
preparation
• If core, whether cut or sawn and whether quarter, half or all core taken.
• If non-core, whether riffled, tube sampled, rotary split, etc and whether
sampled wet or dry.
• For all sample types, the nature, quality and appropriateness of the sample
preparation technique.
• Quality control procedures adopted for all sub-sampling stages to maximise
representivity of samples.
• Measures taken to ensure that the sampling is representative of the in situ
material collected, including for instance results for field duplicate/second-
half sampling.
• Whether sample sizes are appropriate to the grain size of the material being
sampled.
• CRAE HQ core was sampled as half core using a diamond core saw.
• Kagara HQ core sampled as quarter core, NQ as half core, using a diamond
core saw.
• 10m composites of rotary mud chips were also collected.
• The Kagara samples sample preparation process used was PRP88 whereby
up to 3.5kg of sample is dried, crushed, then pulverised to 90% passing
75µm
• Sample preparation procedures for CRAE samples are not documented.
• No sampling QA/QC data by CRAE is documented
• Most QA/QC data pertains to Kagara’s samples; there is no documentation
of sample duplicates.
• Considering the style of mineralisation, sampling of HQ core as quarter core
and NQ core as half core is adequate
• Although half-core sampling would be preferred for HQ, sample sizes are
For
per
sona
l use
onl
y

6 Outram Street, West Perth WA 6005
PO Box 1227, West Perth WA 6872
Phone: +61 8 9324 1053
Fax: +61 8 9324 3366
11
Criteria JORC Code explanation Commentary
considered to be appropriate to accurately represent the mineralisation at
Admiral Bay based on the thickness and consistency of the intersections,
the sampling methodology and the percent value assay ranges for the
primary elements
• For Kagara core, the entire core section was sampled; for CRAE core most of
the core was sampled and adequately defines the mineralised intervals
Quality of
assay data
and
laboratory
tests
• The nature, quality and appropriateness of the assaying and laboratory
procedures used and whether the technique is considered partial or total.
• For geophysical tools, spectrometers, handheld XRF instruments, etc, the
parameters used in determining the analysis including instrument make and
model, reading times, calibrations factors applied and their derivation, etc.
• Nature of quality control procedures adopted (eg standards, blanks,
duplicates, external laboratory checks) and whether acceptable levels of
accuracy (ie lack of bias) and precision have been established.
• CRAE samples were analysed by Analabs using methods: 103-AAS
(perchloric, nitric, hydrochloric and hydrofluoric acid digest with AAS finish)
for Cu, Fe, Pb, Zn, Ag; 104-AAS (perchloric, nitric, hydrochloric and
hydrofluoric acid digest with AAS finish) for Ca, Mg; XRF (pressed powder)
for Ba, Sr; Fusion (Fusion/Specific ion electrode) for F
• Kagara samples were analysed by SGS Mineral Services using methods:
AAS43B (4 acid digestion with AAS finish) for Cu, Fe, Pb, Zn; ICP40Q (4 acid
digest with ICPOES finish) for Ag, Ca, Mg, As, Bi, Co Cd, Sb; CSA06V (Leco
analyser) for S; DP/OES specific fusion with OES finish for Ba and Sr
• QAQC procedures included the insertion of commercial standards (one
standard for every 25 samples) by Kagara
• CRAE included a limited number of field duplicates of ¼ core but there is no
record that standards or blanks were submitted.
• Subsequent re-analysis by Kagara concluded that Overall the data quality is
good but some standard values exceeded the three standard deviation
control limit. This is attributed to carry over from the very high grade
samples found in the jobs
• Subsequent check analysis in 2000 concluded that the data showed that
there is very close agreement between the routine and check analyses for
Zn, Pb and Ag
• Most QA/QC data pertains to Kagara samples submitted to Genalysis.
• Blanks
• Kagara – no blank samples submitted
For
per
sona
l use
onl
y

6 Outram Street, West Perth WA 6005
PO Box 1227, West Perth WA 6872
Phone: +61 8 9324 1053
Fax: +61 8 9324 3366
12
Criteria JORC Code explanation Commentary
• Laboratory – Genalysis assayed 34 control blanks. Genalysis review of
Ba and Sr assays of blank material at the approximate detection limits
of the assays. No details of Pb, Zn, Cu and Ag results are given.
• Standards
• Kagara – One standard was included for every 25 samples in the
sample run. Kagara used Gannet standards.
• Laboratory – Genalysis analysed approximately 47 standard samples
comprising 3 different reference materials. Only Ba and Sr assay are
referenced, with no details on any analyses for Pb, Zn, Cu and Ag
elements.
• Coarse reject duplicates - none
• Pulp Duplicates - none
• Repeat Assays (same pulp)
• Laboratory – Genalysis documented that 30 pulp repeats were
analysed – re-assayed at a later time than the original samples
• Repeat Assays (AAS Respray)
• Laboratory- Genalysis documented that 44 pulp repeats were analysed
– re-assayed at the same time as the original samples.
• Genalysis QA/QC documentation (Genalysis, 2008) covers only Ba and Sr
assays. Apparent lack of review of Pb, Zn, Cu, and Ag results is a major
omission
• Available QA/QC results suggest the data quality is suitable for supporting
an Inferred Resource
Verification of
sampling and
assaying
• The verification of significant intersections by either independent or
alternative company personnel.
• The use of twinned holes.
• Documentation of primary data, data entry procedures, data verification,
data storage (physical and electronic) protocols.
• Discuss any adjustment to assay data.
• All mineralised drill intersections in the Central resource area have been
reclogged; visual examination supports reported assay results
• The drill core from the SS16 Zone has not been examined, but core
photographs have been reviewed and support the reported assay results
• One hole has been twinned, by wedging, Repeatability between ABRD011
and ABRD011D2 was reasonable
For
per
sona
l use
onl
y

6 Outram Street, West Perth WA 6005
PO Box 1227, West Perth WA 6872
Phone: +61 8 9324 1053
Fax: +61 8 9324 3366
13
Criteria JORC Code explanation Commentary
• Kagara logging and analytical data were validated and stored in a relational
database. Kagara completed data capture and validation of previous CRAE
drill data and integrated these data into the same relational database
• Comparison of database results with original CRAE paper logs was
completed during re-logging and supported the validity of the data capture
• No adjustments have been made to original assay data
Location of
data points
• Accuracy and quality of surveys used to locate drill holes (collar and down-
hole surveys), trenches, mine workings and other locations used in Mineral
Resource estimation.
• Specification of the grid system used.
• Quality and adequacy of topographic control.
• CRAE drill-hole collar locations were recorded from the CRAE exploration
reports and checked by Survey North. Although only one collar could be
located, the rehabilitated drill-hole pads were easily located. This survey
confirmed the approximate locations of the drill holes (±10m) and also the
surface RL values (±1m).
• The CRAE drill holes were down-hole surveyed every 50-100m using a single
shot survey tool which recorded the deviation from vertical only with no
assigned azimuth. Because of the lack of azimuth data, the CRAE drill holes
were assumed to be vertical.
• Kagara drill holes were downhole surveyed in 3 phases.
• As part of a larger geophysical logging exercise, downhole surveys
were completed by Weatherford using a magnetic deviation tool.
• The diamond tail of hole ABRD009 was also surveyed using a Keeper
Gyro System. A comparison of both surveys reveals only minimal
variation in the northing coordinate and confirms the validity of the
magnetic deviation surveys.
• A third phase of directional surveying was completed by Downhole
Surveys of Kalgoorlie using a SPT north–seeking gyro tool
• The grid system is GDA94 Zone 51. Earlier CRAE work used AGD84 Zone 51,
but Kagara converted all data to GDA94
For
per
sona
l use
onl
y
6 Outram Street, West Perth WA 6005
PO Box 1227, West Perth WA 6872
Phone: +61 8 9324 1053
Fax: +61 8 9324 3366
14
Criteria JORC Code explanation Commentary
• All Kagara collar locations have been picked up by means of DGPS, with
vertical and horizontal accuracy of around 10cm. Apart from drill hole collar
surveys, survey definition of surface topography was not essential as a
constraint for the top of the resource model given the depth of the
mineralisation
Data spacing
and
distribution
• Data spacing for reporting of Exploration Results.
• Whether the data spacing and distribution is sufficient to establish the
degree of geological and grade continuity appropriate for the Mineral
Resource and Ore Reserve estimation procedure(s) and classifications
applied.
• Whether sample compositing has been applied.
• Along the mineralised Admiral Bay Fault Zone trend, drill spacing is variable
from less than 100 m to more than 4 km.
• In the Central 2.7km mineralised zone within M4/249, Kagara drill holes
were drilled on nominally 400m spaced sections, 150m apart, infilling
previous CRAE drilling.
• Although the data spacing and distribution is very limited, geological
evidence is sufficient to imply but not verify continuity of mineralisation
• Lithological packages hosting the mineralisation are discernible on seismic
imagery and provide further support for evidence of geological continuity
• Grade continuity is less well established and given the nature of MVT-style
mineralisation is expected to be complex
• It is considered that available data is sufficient to demonstrate spatial and
grade continuity of the mineralised horizon to support the classification of
Inferred Mineral Resources under the 2012 JORC code
Orientation of
data in
relation to
geological
structure
• Whether the orientation of sampling achieves unbiased sampling of possible
structures and the extent to which this is known, considering the deposit
type.
• If the relationship between the drilling orientation and the orientation of key
mineralised structures is considered to have introduced a sampling bias, this
should be assessed and reported if material.
• The mineralised zones are broadly stratabound and generally appropriate
for sampling by vertical drill holes, especially for Zones1 & 2.
• A significant proportion of mineralisation in Zones 3 & 6 occurs within veins
which are often steeply dipping and where drilling may have introduced a
degree of sampling bias, although correlation between drill holes indicates
that the mineralised envelope as a whole is shallowly dipping For
per
sona
l use
onl
y

6 Outram Street, West Perth WA 6005
PO Box 1227, West Perth WA 6872
Phone: +61 8 9324 1053
Fax: +61 8 9324 3366
15
Criteria JORC Code explanation Commentary
Sample
security
• The measures taken to ensure sample security. • No information is available regarding sample security, but it is assumed that
normal industry-standard practice was followed
Audits or
reviews
• The results of any audits or reviews of sampling techniques and data. • No audit has been completed and there has been no detailed validation of
assay data against laboratory certificates
Section 2 Reporting of Exploration Results
Criteria JORC Code explanation Commentary
Mineral
tenement and
land tenure
status
• Type, reference name/number, location and ownership including
agreements or material issues with third parties such as joint ventures,
partnerships, overriding royalties, native title interests, historical sites,
wilderness or national park and environmental settings.
• The security of the tenure held at the time of reporting along with any
known impediments to obtaining a licence to operate in the area.
• The Admiral Bay deposit is located within two granted Mining Leases
(ML04/244 and ML04/249), which are valid until 20/3/2033 and one
granted Exploration Licence (EL04/1610), which is valid until 3/9/2017.
• The Company acquired the project on 15/9/2015
• The tenement is located wholly within Vacant Crown Land and is covered by
the Native Title Determined Area of the Karajarri People (Area A)
• The tenements are in good standing with the WA Department of Mines and
Petroleum (DMP) subject to a minimum annual expenditure commitment of
$248,100 and annual rents are $46,910.
Exploration
done by other
parties
• Acknowledgment and appraisal of exploration by other parties. • The Admiral Bay deposit was discovered in 1981 by Meridian Oil NL during
petroleum exploration, and was subsequently acquired by CRA Exploration
(the exploration arm of CRA Limited, now Rio Tinto Ltd), who undertook
substantial exploration from 1986 to 1992.
• Kagara Ltd acquired the deposit from CRA Exploration in 2004 and
completed an exploration programme that lead to an initial Inferred
Resource, as well as a pre-feasibility study to test the viability of the project.
Kagara Ltd entered into Administration in 2012 and subsequently
Liquidation in 2013.
• Past work has been of a high standard and is considered suitable for
resource estimation
For
per
sona
l use
onl
y

6 Outram Street, West Perth WA 6005
PO Box 1227, West Perth WA 6872
Phone: +61 8 9324 1053
Fax: +61 8 9324 3366
16
Criteria JORC Code explanation Commentary
Geology • Deposit type, geological setting and style of mineralisation. • Admiral Bay lies within the Admiral Bay Fault Zone, which separates the
Broome Platform and Willara Sub-basin of the Canning Basin.
• Admiral Bay is carbonate-hosted zinc-lead-silver-barium deposit, with
mineralisation hosted in Ordovician carbonate sediments over a
mineralised strike extent of at least 18km.
• Nominally the deposit is classified as a Mississippi Valley Type deposit
(MVT), however Admiral Bay is not a typical MVT, being strongly
stratabound, dominated by replacement and veining over open-space fill,
and characterised by very continuous mineralisation over long strike
lengths.
• Within the project area, the surface geology is dominated by Quaternary
Aeolian sand. Sand sheets in the northwest grade into 2–10m high dunes
towards the southeast.
• The Ordovician stratigraphy is overlain by a thick sequence of Cretaceous-
Jurassic-Permian sandstones/siltstones (up to 1,200m thick)
• The mineralised zones occur at depths of around 1,250m to 1,700m. The
upper higher-grade Zn-rich zone is up to 20m thick, whilst the lower higher-
grade Pb zone is up to 15m thick. These high-grade zones described above
are hosted within a broad, moderately Zn-Pb mineralised, zone up to 110-
120m thick.
• The Nita Formation hosts the main Zn-rich Zone 2 in a clean limestone unit,
while Zn-rich Zone 1 occurs on the contact with the overlying Carribuddy
Formation.
• The Pb-barite rich mineralisation encompassing Zones 3 and 6 occurs in
dolomitised limestones in the lower Nita Formation and underlying
Goldwyer Formations.
• Zn-rich sulphide mineralisation is characterised by replacement, small-scale
cavity fill, and minor veining and dissolution. Pb-rich mineralisation
includes replacive and vein styles. For
per
sona
l use
onl
y

6 Outram Street, West Perth WA 6005
PO Box 1227, West Perth WA 6872
Phone: +61 8 9324 1053
Fax: +61 8 9324 3366
17
Criteria JORC Code explanation Commentary
Drill hole
Information
• A summary of all information material to the understanding of the
exploration results including a tabulation of the following information for all
Material drill holes:
o easting and northing of the drill hole collar
o elevation or RL (Reduced Level – elevation above sea level in metres) of
the drill hole collar
o dip and azimuth of the hole
o down hole length and interception depth
o hole length.
• If the exclusion of this information is justified on the basis that the
information is not Material and this exclusion does not detract from the
understanding of the report, the Competent Person should clearly explain
why this is the case.
• Drilling data is addressed in the Resource estimation Section of this table
Data
aggregation
methods
• In reporting Exploration Results, weighting averaging techniques, maximum
and/or minimum grade truncations (eg cutting of high grades) and cut-off
grades are usually Material and should be stated.
• Where aggregate intercepts incorporate short lengths of high grade results
and longer lengths of low grade results, the procedure used for such
aggregation should be stated and some typical examples of such
aggregations should be shown in detail.
• The assumptions used for any reporting of metal equivalent values should
be clearly stated.
• Results were weighted by sample intervals, no top or bottom cuts were
applied.
• Intersections are length-weighted average grades for zones wider than or
equal to 2m and greater than 2% Zn or Pb, including up to 2m of internal
waste
Zinc equivalent (ZnEq) calculation parameters are presented in below. The
metallurgical recoveries are derived from metallurgical testwork completed by
CRAE and Kagara. It is Metalicity’s opinion that all elements included in the metal
equivalent calculation have a reasonable potential to be recovered and sold. The
calculation formula is ZnEq=Zn+1.06Pb+0.03Ag
Metal Metal
Price
US$
Price in
Assay units
US$
Concentrat
e Recovery
%
Recovered
Unit
Pricing
US$
ZnEq
Factor1
Zinc 1.00/lb 22.04 per
%
90 19.84 1.0 For
per
sona
l use
onl
y

6 Outram Street, West Perth WA 6005
PO Box 1227, West Perth WA 6872
Phone: +61 8 9324 1053
Fax: +61 8 9324 3366
18
Criteria JORC Code explanation Commentary
Lead 1.00/lb 22.04 per
%
95 20.94 1.06
Silver 19/oz 0.61 per
ppm
95 0.58 0.03
1 Approximating to head grade Metal equivalents are highly dependent on the metal prices used to derive the equivalence
formula. Metalicity notes that the metal equivalence method taken above is a simplified
approach. Only preliminary metallurgical recoveries are available. The metal prices are
assumed indicative LME prices and do not reflect the metal prices that a smelter would
pay for concentrate nor are any smelter penalties or charges included in the calculation.
• Metallurgical testwork has predicted recoveries in excess of 95% for
Pb, 90% for Zn and from 46–54% for Ag; consequently a Ag recovery of
50% was selected (however it should be noted that the highly variable
grades Ag and unknown smelter thresholds mean the significance of
silver is minor).
• After review of the historical metallurgical testwork it is the
Company’s opinion that there is a reasonable potential for both zinc,
lead and silver to be recovered and sold.
Relationship
between
mineralisatio
n widths and
intercept
lengths
• These relationships are particularly important in the reporting of Exploration
Results.
• If the geometry of the mineralisation with respect to the drill hole angle is
known, its nature should be reported.
• If it is not known and only the down hole lengths are reported, there should
be a clear statement to this effect (eg ‘down hole length, true width not
known’).
• The mineralised zones at Admiral Bay are approximately tabular and flat
lying to shallowly dipping.
• Mineralisation is generally intersected with near true width down-hole
lengths.
Diagrams • Appropriate maps and sections (with scales) and tabulations of intercepts
should be included for any significant discovery being reported These should
include, but not be limited to a plan view of drill hole collar locations and
• Refer to Figures in the body of the report
For
per
sona
l use
onl
y

6 Outram Street, West Perth WA 6005
PO Box 1227, West Perth WA 6872
Phone: +61 8 9324 1053
Fax: +61 8 9324 3366
19
Criteria JORC Code explanation Commentary
appropriate sectional views.
Balanced
reporting
• Where comprehensive reporting of all Exploration Results is not practicable,
representative reporting of both low and high grades and/or widths should
be practiced to avoid misleading reporting of Exploration Results.
• All data was used in the resource estimation
Other
substantive
exploration
data
• Other exploration data, if meaningful and material, should be reported
including (but not limited to): geological observations; geophysical survey
results; geochemical survey results; bulk samples – size and method of
treatment; metallurgical test results; bulk density, groundwater,
geotechnical and rock characteristics; potential deleterious or
contaminating substances.
• Wireline logging data comprising gamma, calliper, density, neutron,
resistivity, self-potential, temperature, compensated sonic and magnetic
deviation are available for all drill holes.
• Extensive 2D seismic data both from dedicated surveys at Admiral Bay and
from regional petroleum exploration work are available for the project area.
• Metallurgical, geotechnical, hydrogeological and mining studies have been
completed on the project.
Further work • The nature and scale of planned further work (eg tests for lateral extensions
or depth extensions or large-scale step-out drilling).
• Diagrams clearly highlighting the areas of possible extensions, including the
main geological interpretations and future drilling areas, provided this
information is not commercially sensitive.
• PLD aims to design exploration and resource evaluation programmes to test
the controls on and continuity of mineralisation at Admiral Bay. Work to
increase the understanding of the continuity of geology and mineralisation
are fundamental to advancing the project. Planned work includes additional
drilling as well as application of suitable geophysical techniques.
• Work is not yet sufficiently advanced to enable delineation of new target
areas and zones of potential extensions to mineralisation.
For
per
sona
l use
onl
y

6 Outram Street, West Perth WA 6005
PO Box 1227, West Perth WA 6872
Phone: +61 8 9324 1053
Fax: +61 8 9324 3366
20
Section 3 Estimation and Reporting of Mineral Resources
Criteria JORC Code explanation Commentary
Database
integrity
Measures taken to ensure that data has not been corrupted by, for example,
transcription or keying errors, between its initial collection and its use for Mineral
Resource estimation purposes.
• Data used in the Mineral Resource estimate of SS6 and SS17 zones was
provided in the CSV format and imported into Micromine software.
Data validation procedures used. • Database information was validated against previous data supplied for
Admiral Bay, imported and desurveyed. Validation of the data import
include checks for overlapping intervals, missing survey data, missing
and incorrectly recorded assay data, missing lithological data, and
missing collars.
Site visits Comment on any site visits undertaken by the Competent Person and the
outcome of those visits.
• The Competent Person Neal Reynols has visited the site to investigate
the core material from previous drilling campaigns.
• Also a CSA geologist was present in 1988 during drilling and seismic
acquisition activities by CRAE
If no site visits have been undertaken indicate why this is the case. • CSA Global conducted a desktop review on the basis of the reports
prepared by Digirock, Coffey, Kagara, RSV Australia. Currently, no
exploration and drilling activities are being carried out at the deposit to
be observed.
Geological
interpretation
Confidence in (or conversely, the uncertainty of) the geological interpretation of
the mineral deposit.
• The zones are currently interpreted to be coincident with an antiformal
structure associated with the Admiral Bay Fault Zone (ABFZ).
Mineralisation appears to be relatively continuous along the strike of
the anticline, but lower grade / less well developed on the limbs.
However, the limbs areas are poorly defined or tested by drilling.
• While structural continuity appears to be predictable, grade continuity
within the mineralised zones remains relatively uncertain for some of
the defined zones and is not adequately defined / constrained by the
current drillhole spacing.
• 224 samples for SS17 zone and 1,078 samples for SS6 zone were
analysed for Zn, Pb, Ag and Ba.
For
per
sona
l use
onl
y

6 Outram Street, West Perth WA 6005
PO Box 1227, West Perth WA 6872
Phone: +61 8 9324 1053
Fax: +61 8 9324 3366
21
Criteria JORC Code explanation Commentary
Nature of the data used and of any assumptions made. • Drillhole intercept logging and assay results have formed basis for the
geological interpretation.
The effect, if any, of alternative interpretations on Mineral Resource estimation. • The precise limits and geometry cannot be absolutely defined due to
the limitations of the current drill coverage. Further work is required to
better define the geometry and limits of the mineralised zones.
The use of geology in guiding and controlling Mineral Resource estimation. • Drill hole intercept logging, wireline interpretation and assay results
form the basis for the modelling. Coffey Mining developed a geological
and mineralisation framework suitable for grade estimation based on a
review of the available geological and geochemical data.
The factors affecting continuity both of grade and geology. • The Mississippi Valley Type Lead-Zinc mineralisation is interpreted to
be coincident with an antiformal structure associated with the Admiral
Bay Fault Zone. Mineralisation appears to be broadly continuous along
the strike of the anticline, but lower grade / less well developed on the
limbs, however the local distribution of grade is potentially less
continuous.
Dimensions The extent and variability of the Mineral Resource expressed as length (along
strike or otherwise), plan width, and depth below surface to the upper and lower
limits of the Mineral Resource.
• Four individual mineralised envelopes in each zone were interpreted
based on the drillhole sample data using approximate 1.5-2% Zn and/or
Pub cut-offs to define coherent zones of sulphide mineralisation.
• The mineralised zones were extended approximately 100 m from the
drill hole section to both sides resulting in 200 m length along strike.
• The interpretation along dip direction was extended 50m from the
peripheral drill holes on a section and 100m from the internal drill
holes.
• The thickness of the mineralised envelopes varies from 3m to 14m for
SS6 zone and from 3m to 29m for SS17 zone. The mineralised zones
extend from the depth of 1,315 m to the depth of 1,570m below the
surface.
The nature and appropriateness of the estimation technique(s) applied and key
assumptions, including treatment of extreme grade values, domaining,
• All Zn, Pb, Ag, and Ba variables estimated in the Admiral Bay resource
model mineralised zones SS6 and SS17 were generated using Inverse
For
per
sona
l use
onl
y

6 Outram Street, West Perth WA 6005
PO Box 1227, West Perth WA 6872
Phone: +61 8 9324 1053
Fax: +61 8 9324 3366
22
Criteria JORC Code explanation Commentary
Estimation and
modelling
techniques
interpolation parameters and maximum distance of extrapolation from data
points. If a computer assisted estimation method was chosen include a
description of computer software and parameters used.
Distance (ID) using a power of 2. The ID estimates have been completed
using Datamine software. Block discretisation of 2x2x2 points (for X x Y
x Z respectively) was used for block estimation. Composite length and
bulk density weighting was used in the estimation process.
The availability of check estimates, previous estimates and/or mine production
records and whether the Mineral Resource estimate takes appropriate account
of such data.
• No previous estimates have been completed for these zones, and no
mining has taken place. The grade estimates were validated against the
data used to create them, both visually and statistically.
The assumptions made regarding recovery of by-products. • No assumption have been made
Estimation of deleterious elements or other non-grade variables of economic
significance (e.g. sulphur for acid mine drainage characterisation).
• Ag, Ba
In the case of block model interpolation, the block size in relation to the average
sample spacing and the search employed.
• The block model was constructed using a 25mE x 25mN x 5mRL parent
block size, with subcelling to 6.25mE x 6.25mN x 1.25mRL for domain
volume resolution. The parent cell size was chosen on the basis of the
general morphology of mineralised bodies and in order to avoid the
generation of too large block models. The subcelling size was chosen to
maintain the resolution of the mineralised bodies.
• For all variables estimated (Zn, Pb, Ag, and Ba), a two-pass estimation
strategy has been applied, with progressively expanded sample
searches applied to successive estimation passes only considering
blocks not previously assigned.
o First pass searches used an anisotropic range of 600x300x300
metres with major axis oriented horizontally along strike
o If a block was not estimated in the first pass, a second pass
search utilised a maximum range of 1200x600x600 metres.
• The use of similar search radii for the semi-major and minor axis
orientations considered the narrow structures being modelled, the
variable orientations and curvature of the structures, and erratic
distribution of data within the mineralised zones. For
per
sona
l use
onl
y

6 Outram Street, West Perth WA 6005
PO Box 1227, West Perth WA 6872
Phone: +61 8 9324 1053
Fax: +61 8 9324 3366
23
Criteria JORC Code explanation Commentary
• The maximum number of composites used for any estimate was
restricted to 20 composites for all estimated variables.
• The minimum number of composites used for any first pass estimate
was 10 composites for all estimated variables.
• The minimum number of composites used for any second pass estimate
was 2 composites for all estimated variables.
• All mineralised zone divisions were treated as hard boundaries for data
and parameters used in the estimation process.
Any assumptions behind modelling of selective mining units. • The block model size was selected largely as a compromise for
adequate volume definition of the narrow mineralised zones in an
underground mining scenario.
Any assumptions about correlation between variables. • Metal zonation occurs vertically through the mineralised zones and has
the following characteristics:
o Higher Zn grades in upper zones
o Higher Pb grades in lower zones
o Ag grades are anomalous throughout all mineralised zones,
but increase with depth.
o Ba grades tend to be higher in the lower mineralised zones.
Description of how the geological interpretation was used to control the resource
estimates.
• Four individual mineralised envelopes were interpreted based on the
drillhole sample data using approximate 1.5-2% Zn and/or Pb cut-offs
to define coherent zones of sulphide mineralisation. The zones are
currently interpreted to be coincident with an antiformal structure
associated with the Admiral Bay Fault Zone
Discussion of basis for using or not using grade cutting or capping. • Assessment of the composite data was completed to determine the
requirement for high grade cutting. No topcuts were applied.
The process of validation, the checking process used, the comparison of model
data to drill hole data, and use of reconciliation data if available.
• Validation of the block model consisted of comparison of the block
model volume to the wireframe volume. Grade estimates were
validated by statistical comparison with the drill data, visual For
per
sona
l use
onl
y
6 Outram Street, West Perth WA 6005
PO Box 1227, West Perth WA 6872
Phone: +61 8 9324 1053
Fax: +61 8 9324 3366
24
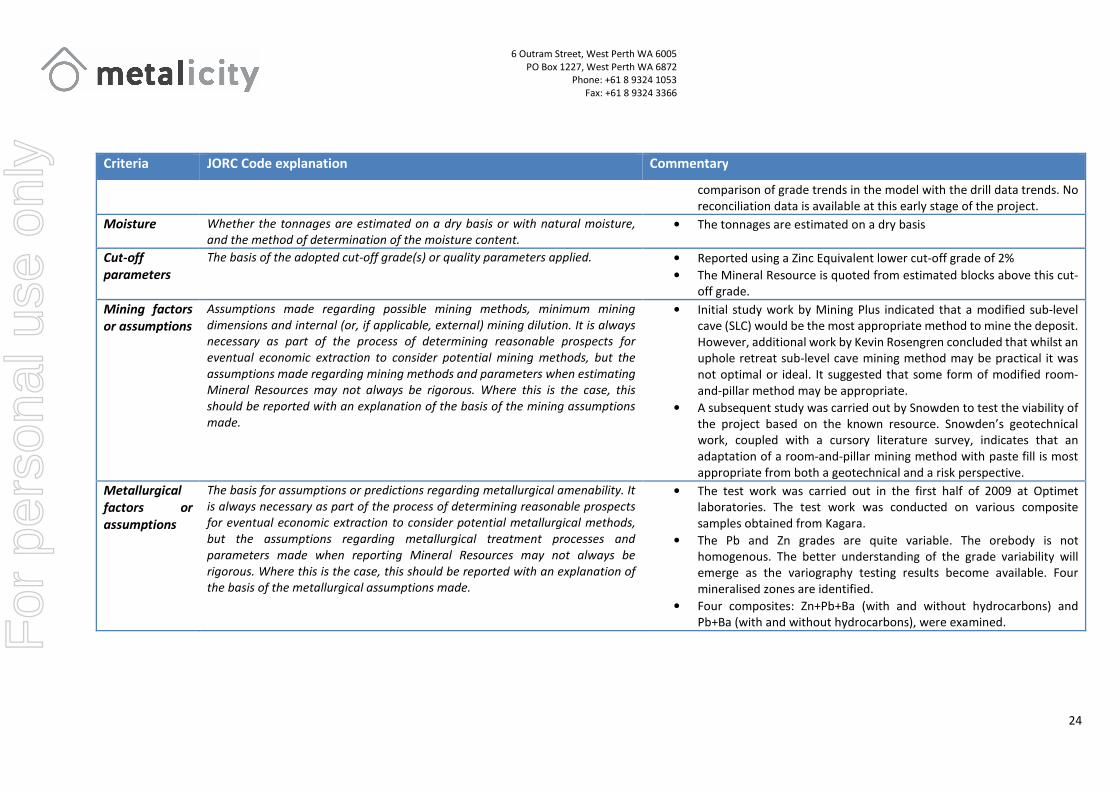
Criteria JORC Code explanation Commentary
comparison of grade trends in the model with the drill data trends. No
reconciliation data is available at this early stage of the project.
Moisture Whether the tonnages are estimated on a dry basis or with natural moisture,
and the method of determination of the moisture content.
• The tonnages are estimated on a dry basis
Cut-off
parameters
The basis of the adopted cut-off grade(s) or quality parameters applied. • Reported using a Zinc Equivalent lower cut-off grade of 2%
• The Mineral Resource is quoted from estimated blocks above this cut-
off grade.
Mining factors
or assumptions
Assumptions made regarding possible mining methods, minimum mining
dimensions and internal (or, if applicable, external) mining dilution. It is always
necessary as part of the process of determining reasonable prospects for
eventual economic extraction to consider potential mining methods, but the
assumptions made regarding mining methods and parameters when estimating
Mineral Resources may not always be rigorous. Where this is the case, this
should be reported with an explanation of the basis of the mining assumptions
made.
• Initial study work by Mining Plus indicated that a modified sub-level
cave (SLC) would be the most appropriate method to mine the deposit.
However, additional work by Kevin Rosengren concluded that whilst an
uphole retreat sub-level cave mining method may be practical it was
not optimal or ideal. It suggested that some form of modified room-
and-pillar method may be appropriate.
• A subsequent study was carried out by Snowden to test the viability of
the project based on the known resource. Snowden’s geotechnical
work, coupled with a cursory literature survey, indicates that an
adaptation of a room-and-pillar mining method with paste fill is most
appropriate from both a geotechnical and a risk perspective.
Metallurgical
factors or
assumptions
The basis for assumptions or predictions regarding metallurgical amenability. It
is always necessary as part of the process of determining reasonable prospects
for eventual economic extraction to consider potential metallurgical methods,
but the assumptions regarding metallurgical treatment processes and
parameters made when reporting Mineral Resources may not always be
rigorous. Where this is the case, this should be reported with an explanation of
the basis of the metallurgical assumptions made.
• The test work was carried out in the first half of 2009 at Optimet
laboratories. The test work was conducted on various composite
samples obtained from Kagara.
• The Pb and Zn grades are quite variable. The orebody is not
homogenous. The better understanding of the grade variability will
emerge as the variography testing results become available. Four
mineralised zones are identified.
• Four composites: Zn+Pb+Ba (with and without hydrocarbons) and
Pb+Ba (with and without hydrocarbons), were examined. For
per
sona
l use
onl
y
6 Outram Street, West Perth WA 6005
PO Box 1227, West Perth WA 6872
Phone: +61 8 9324 1053
Fax: +61 8 9324 3366
25
Criteria JORC Code explanation Commentary
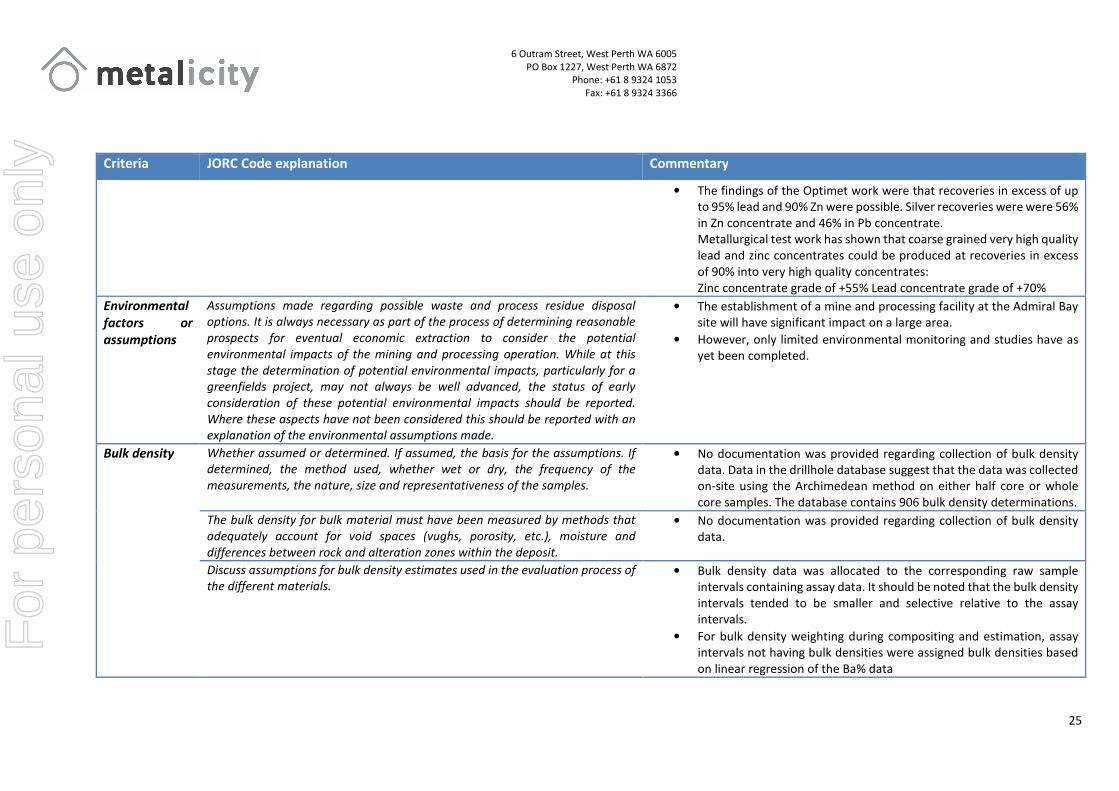
• The findings of the Optimet work were that recoveries in excess of up
to 95% lead and 90% Zn were possible. Silver recoveries were were 56%
in Zn concentrate and 46% in Pb concentrate.
Metallurgical test work has shown that coarse grained very high quality
lead and zinc concentrates could be produced at recoveries in excess
of 90% into very high quality concentrates:
Zinc concentrate grade of +55% Lead concentrate grade of +70%
Environmental
factors or
assumptions
Assumptions made regarding possible waste and process residue disposal
options. It is always necessary as part of the process of determining reasonable
prospects for eventual economic extraction to consider the potential
environmental impacts of the mining and processing operation. While at this
stage the determination of potential environmental impacts, particularly for a
greenfields project, may not always be well advanced, the status of early
consideration of these potential environmental impacts should be reported.
Where these aspects have not been considered this should be reported with an
explanation of the environmental assumptions made.
• The establishment of a mine and processing facility at the Admiral Bay
site will have significant impact on a large area.
• However, only limited environmental monitoring and studies have as
yet been completed.
Bulk density Whether assumed or determined. If assumed, the basis for the assumptions. If
determined, the method used, whether wet or dry, the frequency of the
measurements, the nature, size and representativeness of the samples.
• No documentation was provided regarding collection of bulk density
data. Data in the drillhole database suggest that the data was collected
on-site using the Archimedean method on either half core or whole
core samples. The database contains 906 bulk density determinations.
The bulk density for bulk material must have been measured by methods that
adequately account for void spaces (vughs, porosity, etc.), moisture and
differences between rock and alteration zones within the deposit.
• No documentation was provided regarding collection of bulk density
data.
Discuss assumptions for bulk density estimates used in the evaluation process of
the different materials.
• Bulk density data was allocated to the corresponding raw sample
intervals containing assay data. It should be noted that the bulk density
intervals tended to be smaller and selective relative to the assay
intervals.
• For bulk density weighting during compositing and estimation, assay
intervals not having bulk densities were assigned bulk densities based
on linear regression of the Ba% data
For
per
sona
l use
onl
y

6 Outram Street, West Perth WA 6005
PO Box 1227, West Perth WA 6872
Phone: +61 8 9324 1053
Fax: +61 8 9324 3366
26
Criteria JORC Code explanation Commentary
• For bulk density weighting during compositing and estimation, assay
intervals not having bulk densities were assigned bulk densities based
on linear regression of the Ba% data
Classification The basis for the classification of the Mineral Resources into varying confidence
categories.
• The Inferred Mineral Resource classification is based on the evidence
from the available drill sampling and seismic interpretation. This
evidence is sufficient to imply but not verify geological and grade
continuity.
Whether appropriate account has been taken of all relevant factors (i.e. relative
confidence in tonnage/grade estimations, reliability of input data, confidence in
continuity of geology and metal values, quality, quantity and distribution of the
data).
• The Inferred classification has taken into account all available
geological and sampling information, and the classification level is
considered appropriate for the current stage of this project.
Whether the result appropriately reflects the Competent Person’s view of the
deposit.
• The Mineral Resource estimate appropriately reflects the view of the
Competent Person
Audits or
reviews
The results of any audits or reviews of Mineral Resource estimates. • CSA completed an internal audit of the Resource model.
Discussion of
relative
accuracy/
confidence
Where appropriate a statement of the relative accuracy and confidence level in
the Mineral Resource estimate using an approach or procedure deemed
appropriate by the Competent Person. For example, the application of statistical
or geostatistical procedures to quantify the relative accuracy of the resource
within stated confidence limits, or, if such an approach is not deemed
appropriate, a qualitative discussion of the factors that could affect the relative
accuracy and confidence of the estimate.
• The relative accuracy of the Mineral Resource estimate is reflected in
the reporting of the Mineral Resource to an Inferred classification as
per the guidelines of the 2012 JORC Code
The statement should specify whether it relates to global or local estimates, and,
if local, state the relevant tonnages, which should be relevant to technical and
economic evaluation. Documentation should include assumptions made and the
procedures used.
• The statement refers to global estimation of tonnes and grade
These statements of relative accuracy and confidence of the estimate should be
compared with production data, where available.
• No production data is available; this is an advanced exploration project
For
per
sona
l use
onl
y