PNWER NAFTA Modernization Survey · PNWER NAFTA Submission - Appendix A: ... Agriculture/Food...
57
PNWER NAFTA Modernization Survey
Transcript of PNWER NAFTA Modernization Survey · PNWER NAFTA Submission - Appendix A: ... Agriculture/Food...

PNWER NAFTA Modernization Survey

PNWER NAFTA Submission - Appendix A: Survey Results. June 12, 2017.
Survey Overview
Viewed
1564
Started
225
Completed
225
Completion Rate
100%
Drop Outs (After Starting)
0
Average Time to Complete Survey
7 minutes

PNWER NAFTA Submission - Appendix A: Survey Results. June 12, 2017.
Q1. Where is your organization based?
Answer Count Percent
1. Canada 129 57.33%
2. Mexico 3 1.33%
3. U.S.A. 91 40.44%
4. Other 2 0.89%
Total 225 100%
Mean
: 1.849
Confidence Interval @ 95% : [1.719 -
1.979] Standard Deviation : 0.997
Standard
Error
: 0.066

PNWER NAFTA Submission - Appendix A: Survey Results. June 12, 2017.
Q2. In which state is your organization based?
Answer Count Percent
1. Alabama 0 0.00%
2. Alaska 1 1.11%
3. Arizona 0 0.00%
4. Arkansas 0 0.00%
5. California 0 0.00%
6. Colorado 1 1.11%
7. Connecticut 0 0.00%
8. Delaware 0 0.00%

PNWER NAFTA Submission - Appendix A: Survey Results. June 12, 2017.
9. District of
Columbia 1 1.11%
10. Florida 1 1.11%
11. Georgia 0 0.00%
12. Hawaii 0 0.00%
13. Idaho 26 28.89%
14. Illinois 0 0.00%
15. Indiana 0 0.00%
16. Iowa 0 0.00%
17. Kansas 0 0.00%
18. Kentucky 0 0.00%
19. Louisiana 0 0.00%
20. Maine 0 0.00%
21. Maryland 0 0.00%
22. Massachusetts 0 0.00%
23. Michigan 0 0.00%
24. Minnesota 0 0.00%
25. Mississippi 0 0.00%
26. Missouri 0 0.00%
27. Montana 31 34.44%
28. Nebraska 0 0.00%
29. Nevada 0 0.00%
30. New Hampshire 0 0.00%
31. New Jersey 0 0.00%
32. New Mexico 0 0.00%
33. New York 0 0.00%
34. North Carolina 0 0.00%

PNWER NAFTA Submission - Appendix A: Survey Results. June 12, 2017.
35. North Dakota 0 0.00%
36. Ohio 0 0.00%
37. Oklahoma 0 0.00%
38. Oregon 5 5.56%
39. Pennsylvania 0 0.00%
40. Rhode Island 0 0.00%
41. South Carolina 0 0.00%
42. South Dakota 0 0.00%
43. Tennessee 0 0.00%
44. Texas 0 0.00%
45. Utah 6 6.67%
46. Vermont 0 0.00%
47. Virginia 2 2.22%
48. Washington 16 17.78%
49. West Virginia 0 0.00%
50. Wisconsin 0 0.00%
51. Wyoming 0 0.00%
Total 90 100%
Mean
: 28.044
Confidence Interval @ 95% : [25.182 -
30.907] Standard Deviation : 13.854
Standard
Error
: 1.460

PNWER NAFTA Submission - Appendix A: Survey Results. June 12, 2017.
Q3. In which province or territory is your organization based?
Answer Count Percent
1. Alberta 26 20.47%
2. British Columbia 54 42.52%
3. Manitoba 3 2.36%
4. New Brunswick 0 0.00%
5. Newfoundland and
Labrador 0 0.00%
6. Nova Scotia 0 0.00%
7. Ontario 12 9.45%
PNWER NAFTA Submission - Appendix A: Survey Results. June 12, 2017.
8. Prince Edward
Island 0 0.00%
9. Quebec 0 0.00%
10. Saskatchewan 17 13.39%
11. Northwest
Territories 1 0.79%
12. Nunavut 0 0.00%
13. Yukon 14 11.02%
Total 127 100%
Mean : 4.646 Confidence Interval @ 95% : [3.902
- 5.389] Standard Deviation : 4.275
Standard
Error
: 0.379
PNWER NAFTA Submission - Appendix A: Survey Results. June 12, 2017.
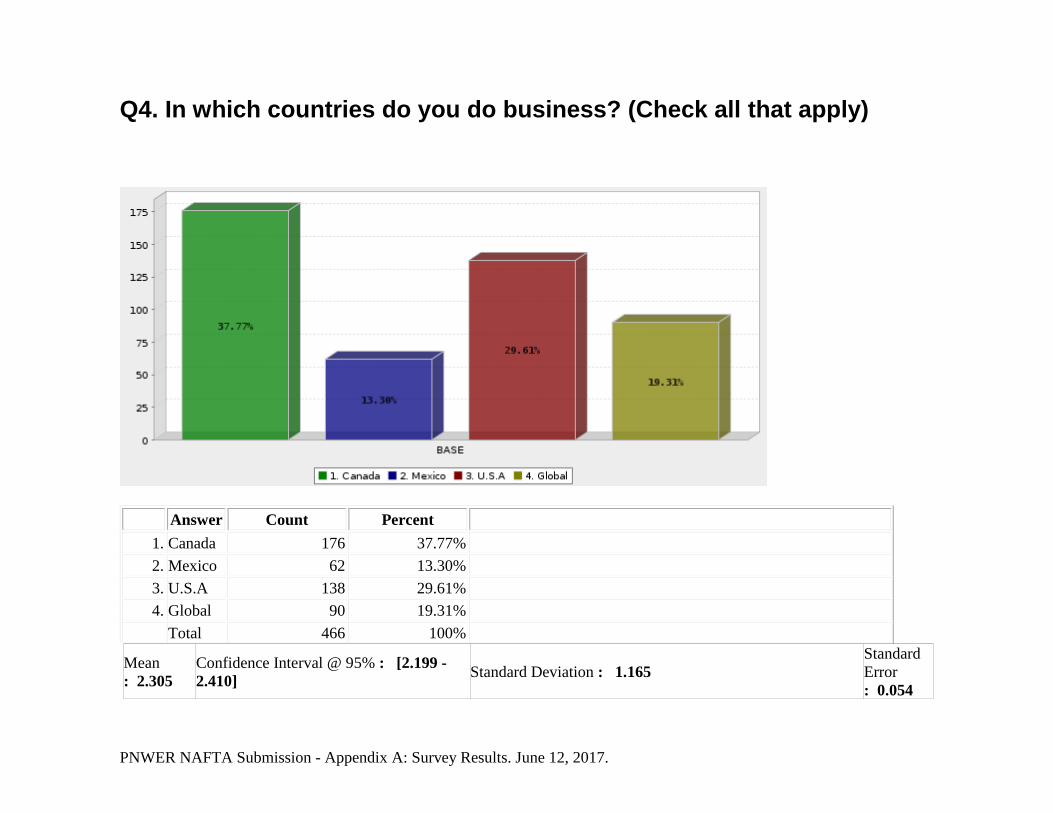
Q4. In which countries do you do business? (Check all that apply)
Answer Count Percent
1. Canada 176 37.77%
2. Mexico 62 13.30%
3. U.S.A 138 29.61%
4. Global 90 19.31%
Total 466 100%
Mean
: 2.305
Confidence Interval @ 95% : [2.199 -
2.410] Standard Deviation : 1.165
Standard
Error
: 0.054

PNWER NAFTA Submission - Appendix A: Survey Results. June 12, 2017.
Q5. In which Canadian provinces or territories, do you do the majority of your business? (To select multiple options, hold down the Control/Command key and make your selections. Selection is not required.)
Answer Count Percent
1. ALBERTA 28 15.05%
2. BRITISH COLUMBIA 54 29.03%
3. MANITOBA 12 6.45%
4. NEW BRUNSWICK 1 0.54%

PNWER NAFTA Submission - Appendix A: Survey Results. June 12, 2017.
5. NEWFOUNDLAND
AND LABRADOR 2 1.08%
6. NORTHWEST
TERRITORIES 4 2.15%
7. NOVA SCOTIA 3 1.61%
8. NUNAVUT 0 0.00%
9. ONTARIO 32 17.20%
10. PRINCE EDWARD
ISLAND 0 0.00%
11. QUEBEC 17 9.14%
12. SASKATCHEWAN 18 9.68%
13. YUKON 15 8.06%
Total 186 100%
Mean : 6.005 Confidence Interval @ 95%
: [5.356 - 6.655] Standard Deviation : 4.518
Standard
Error
: 0.331
PNWER NAFTA Submission - Appendix A: Survey Results. June 12, 2017.
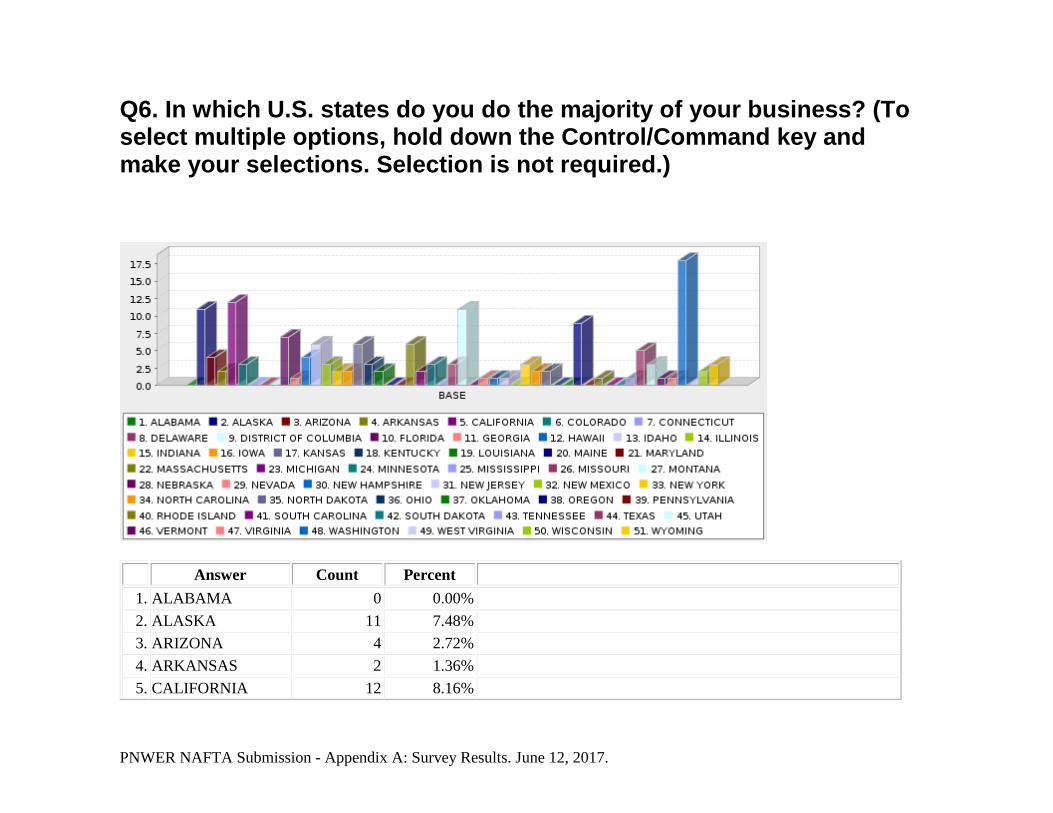
Q6. In which U.S. states do you do the majority of your business? (To select multiple options, hold down the Control/Command key and make your selections. Selection is not required.)
Answer Count Percent
1. ALABAMA 0 0.00%
2. ALASKA 11 7.48%
3. ARIZONA 4 2.72%
4. ARKANSAS 2 1.36%
5. CALIFORNIA 12 8.16%

PNWER NAFTA Submission - Appendix A: Survey Results. June 12, 2017.
6. COLORADO 3 2.04%
7. CONNECTICUT 0 0.00%
8. DELAWARE 0 0.00%
9. DISTRICT OF
COLUMBIA 0 0.00%
10. FLORIDA 7 4.76%
11. GEORGIA 1 0.68%
12. HAWAII 4 2.72%
13. IDAHO 6 4.08%
14. ILLINOIS 3 2.04%
15. INDIANA 2 1.36%
16. IOWA 2 1.36%
17. KANSAS 6 4.08%
18. KENTUCKY 3 2.04%
19. LOUISIANA 2 1.36%
20. MAINE 0 0.00%
21. MARYLAND 0 0.00%
22. MASSACHUSETTS 6 4.08%
23. MICHIGAN 2 1.36%
24. MINNESOTA 3 2.04%
25. MISSISSIPPI 0 0.00%
26. MISSOURI 3 2.04%
27. MONTANA 11 7.48%
28. NEBRASKA 0 0.00%
29. NEVADA 1 0.68%
30. NEW HAMPSHIRE 1 0.68%
31. NEW JERSEY 1 0.68%

PNWER NAFTA Submission - Appendix A: Survey Results. June 12, 2017.
32. NEW MEXICO 0 0.00%
33. NEW YORK 3 2.04%
34. NORTH
CAROLINA 2 1.36%
35. NORTH DAKOTA 2 1.36%
36. OHIO 0 0.00%
37. OKLAHOMA 0 0.00%
38. OREGON 9 6.12%
39. PENNSYLVANIA 0 0.00%
40. RHODE ISLAND 1 0.68%
41. SOUTH
CAROLINA 0 0.00%
42. SOUTH DAKOTA 0 0.00%
43. TENNESSEE 1 0.68%
44. TEXAS 5 3.40%
45. UTAH 3 2.04%
46. VERMONT 1 0.68%
47. VIRGINIA 1 0.68%
48. WASHINGTON 18 12.24%
49. WEST VIRGINIA 0 0.00%
50. WISCONSIN 2 1.36%
51. WYOMING 3 2.04%
Total 147 100%
Mean : 24.265 Confidence Interval @ 95% : [21.636
- 26.895] Standard Deviation : 16.265
Standard
Error
: 1.341
PNWER NAFTA Submission - Appendix A: Survey Results. June 12, 2017.
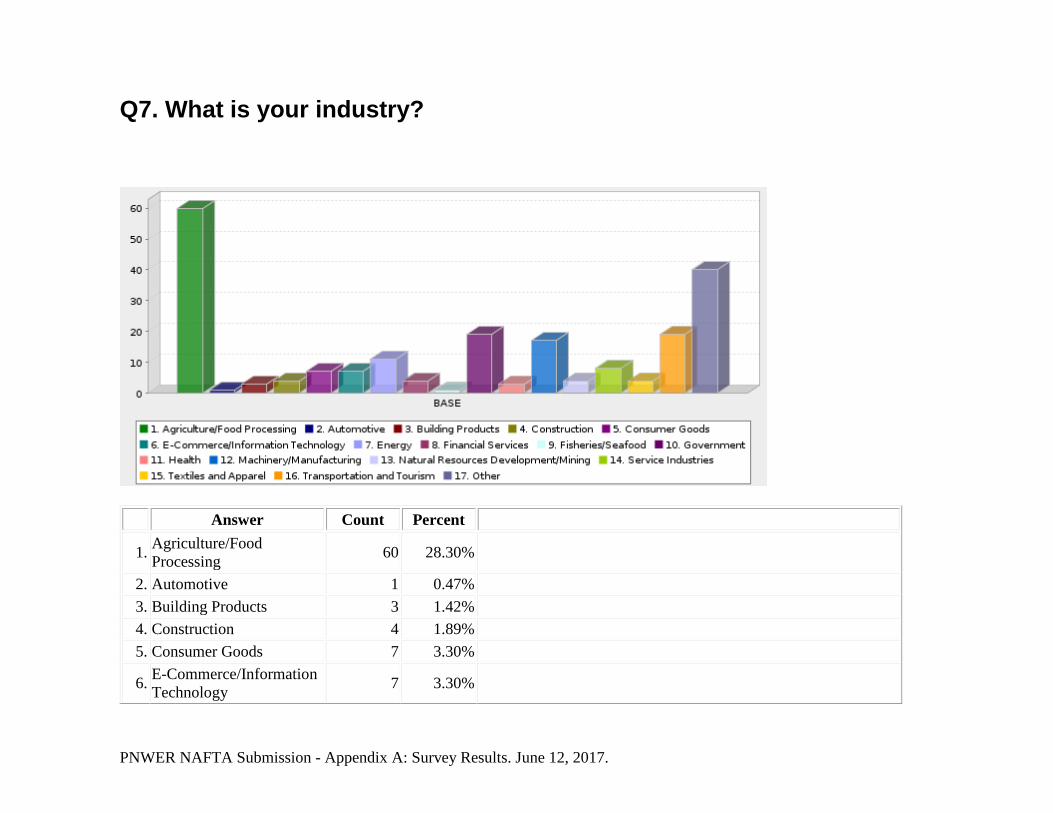
Q7. What is your industry?
Answer Count Percent
1. Agriculture/Food
Processing 60 28.30%
2. Automotive 1 0.47%
3. Building Products 3 1.42%
4. Construction 4 1.89%
5. Consumer Goods 7 3.30%
6. E-Commerce/Information
Technology 7 3.30%

PNWER NAFTA Submission - Appendix A: Survey Results. June 12, 2017.
7. Energy 11 5.19%
8. Financial Services 4 1.89%
9. Fisheries/Seafood 1 0.47%
10. Government 19 8.96%
11. Health 3 1.42%
12. Machinery/Manufacturing 17 8.02%
13. Natural Resources
Development/Mining 4 1.89%
14. Service Industries 8 3.77%
15. Textiles and Apparel 4 1.89%
16. Transportation and
Tourism 19 8.96%
17. Other 40 18.87%
Total 212 100%
Mean : 9.042 Confidence Interval @ 95%
: [8.193 - 9.892] Standard Deviation : 6.311
Standard
Error
: 0.433

PNWER NAFTA Submission - Appendix A: Survey Results. June 12, 2017.
Q8. Approximately how many people are employed in your organization?
Answer Count Percent
1. 0-10 87 40.28%
2. 10-50 49 22.69%
3. 50-200 27 12.50%
4. 200-1000 22 10.19%
5. 1000+ 31 14.35%
Total 216 100%

PNWER NAFTA Submission - Appendix A: Survey Results. June 12, 2017.
Mean
: 2.356
Confidence Interval @ 95% : [2.163 -
2.550] Standard Deviation : 1.452
Standard
Error
: 0.099
PNWER NAFTA Submission - Appendix A: Survey Results. June 12, 2017.
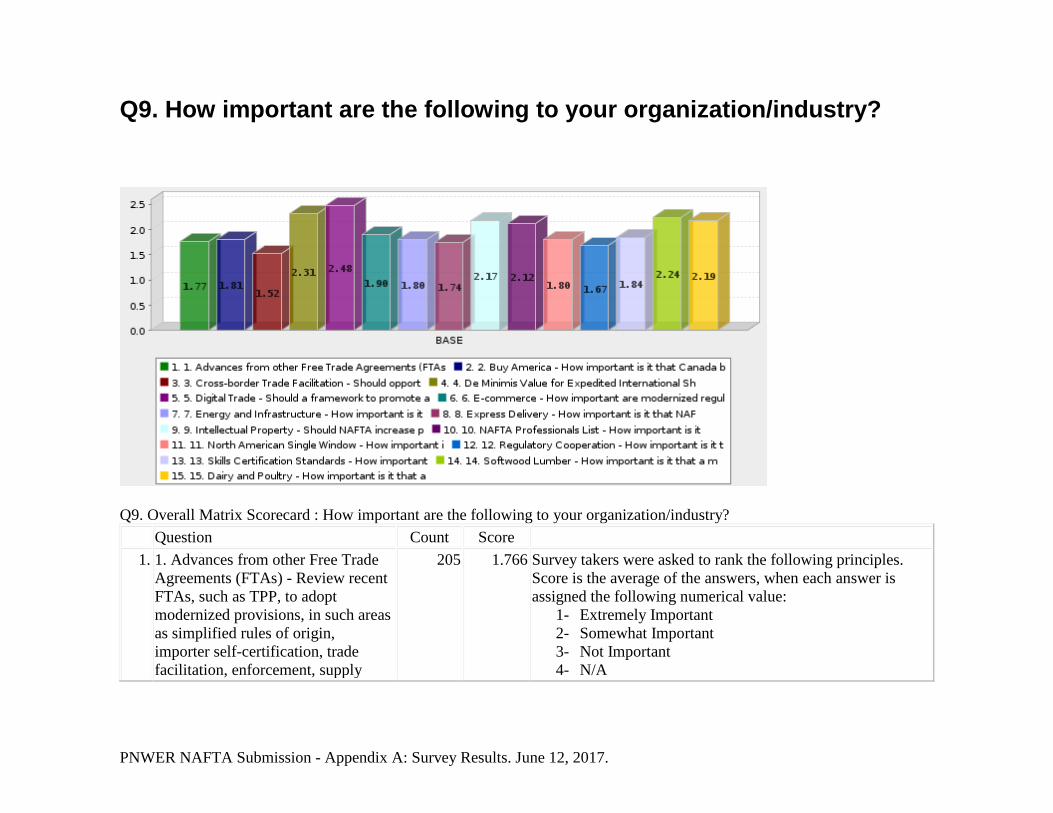
Q9. How important are the following to your organization/industry?
Q9. Overall Matrix Scorecard : How important are the following to your organization/industry?
Question Count Score
1. 1. Advances from other Free Trade
Agreements (FTAs) - Review recent
FTAs, such as TPP, to adopt
modernized provisions, in such areas
as simplified rules of origin,
importer self-certification, trade
facilitation, enforcement, supply
205 1.766 Survey takers were asked to rank the following principles.
Score is the average of the answers, when each answer is
assigned the following numerical value:
1- Extremely Important
2- Somewhat Important
3- Not Important
4- N/A

PNWER NAFTA Submission - Appendix A: Survey Results. June 12, 2017.
chain security, non-tariff trade
barriers, etc.
2. 2. Buy America - How important is
it that Canada be considered
"domestic" for the purpose of U.S.
federal procurement, as it currently
is in the defense sector?
206 1.806
3. 3. Cross-border Trade Facilitation -
Should opportunities for trade
facilitation and cross-border
movement of goods through such
efforts as preclearance, expanded
border crossing capacity, etc. be
encouraged?
210 1.519
4. 4. De Minimis Value for Expedited
International Shipment - The de
minimis threshold for the U.S. is
$800, $20 for Canada, and $300 for
Mexico. How important is it that
these thresholds be aligned?
205 2.312
5. 5. Digital Trade - Should a
framework to promote and govern
digital trade (digital goods and
services, for example, software,
music, films, games, etc.) be
established?
205 2.478
6. 6. E-commerce - How important are
modernized regulations on e-
commerce?
204 1.897
7. 7. Energy and Infrastructure - How
important is it that NAFTA support
further integration of North
206 1.801

PNWER NAFTA Submission - Appendix A: Survey Results. June 12, 2017.
American energy markets and the
infrastructure needed to connect
them?
8. 8. Express Delivery - How important
is it that NAFTA includes modern
provisions to facilitate cross-border
express delivery for small
shipments?
211 1.744
9. 9. Intellectual Property - Should
NAFTA increase protection of
intellectual property?
204 2.172
10. 10. NAFTA Professionals List -
How important is it to update
NAFTA labor categories to reflect
modern classifications of
employment?
204 2.118
11. 11. North American Single Window
- How important is it to finalize
cross-border data sharing and
harmonization into a single window
for import/export?
207 1.797
12. 12. Regulatory Cooperation - How
important is it to encourage
expansion and permanent adoption
of the Regulatory Cooperation
Council, to align product standards,
testing and certification?
206 1.675
13. 13. Skills Certification Standards -
How important is it to encourage
mutual recognition of skills
certifications standards across
borders?
208 1.837
PNWER NAFTA Submission - Appendix A: Survey Results. June 12, 2017.
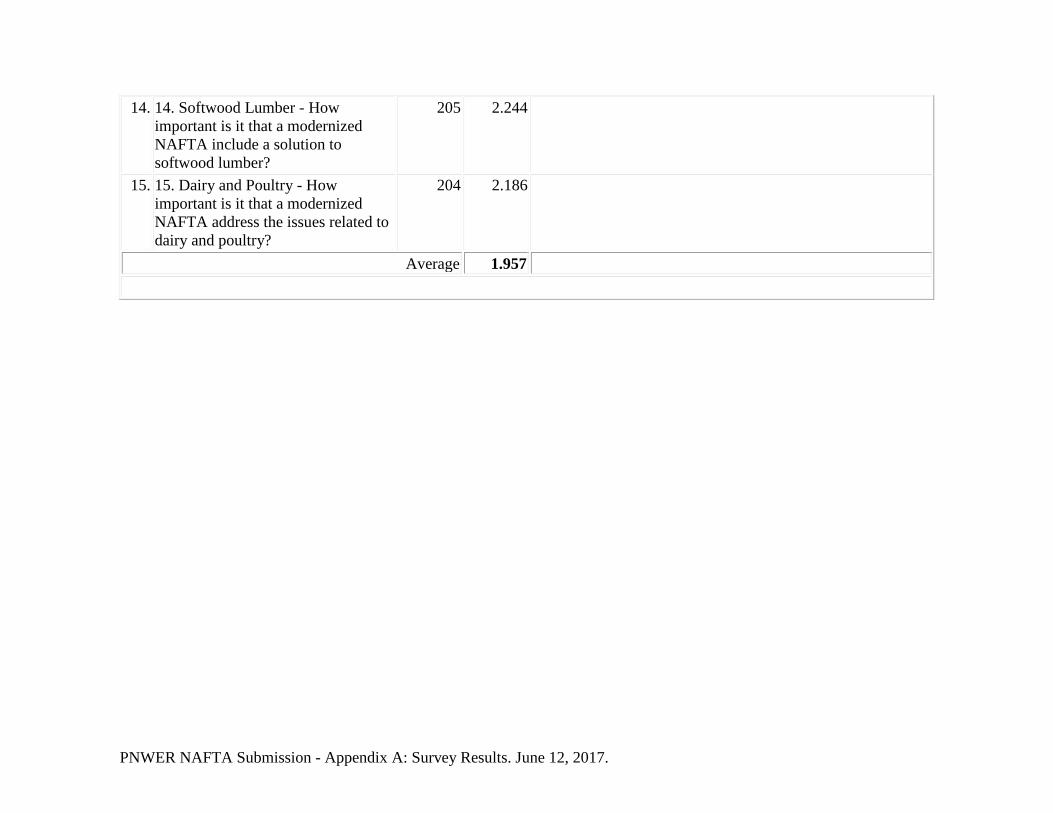
14. 14. Softwood Lumber - How
important is it that a modernized
NAFTA include a solution to
softwood lumber?
205 2.244
15. 15. Dairy and Poultry - How
important is it that a modernized
NAFTA address the issues related to
dairy and poultry?
204 2.186
Average 1.957

PNWER NAFTA Submission - Appendix A: Survey Results. June 12, 2017.
Q9. 1. Advances from other Free Trade Agreements (FTAs) - Review recent FTAs, such as TPP, to adopt modernized provisions, in such areas as simplified rules of origin, importer self-certification, trade facilitation, enforcement, supply chain security, non-tariff trade barriers, etc.
Answer Count Percent
1. Extremely
important 105 51.22%

PNWER NAFTA Submission - Appendix A: Survey Results. June 12, 2017.
2. Somewhat
important 62 30.24%
3. Not important 19 9.27%
4. N/A 19 9.27%
Total 205 100%
Mean
: 1.766
Confidence Interval @ 95% : [1.634 -
1.898] Standard Deviation : 0.962
Standard
Error
: 0.067

PNWER NAFTA Submission - Appendix A: Survey Results. June 12, 2017.
Q9. 2. Buy America - How important is it that Canada be considered "domestic" for the purpose of U.S. federal procurement, as it currently is in the defense sector?
Answer Count Percent
1. Extremely
important 108 52.43%
2. Somewhat
important 49 23.79%
3. Not important 30 14.56%
4. N/A 19 9.22%

PNWER NAFTA Submission - Appendix A: Survey Results. June 12, 2017.
Total 206 100%
Mean
: 1.806
Confidence Interval @ 95% : [1.669 -
1.943] Standard Deviation : 1.003
Standard
Error
: 0.070

PNWER NAFTA Submission - Appendix A: Survey Results. June 12, 2017.
Q9. 3. Cross-border Trade Facilitation - Should opportunities for trade facilitation and cross-border movement of goods through such efforts as preclearance, expanded border crossing capacity, etc. be encouraged?
Answer Count Percent
1. Extremely
important 138 65.71%
2. Somewhat
important 50 23.81%

PNWER NAFTA Submission - Appendix A: Survey Results. June 12, 2017.
3. Not important 7 3.33%
4. N/A 15 7.14%
Total 210 100%
Mean
: 1.519
Confidence Interval @ 95% : [1.402 -
1.636] Standard Deviation : 0.865
Standard
Error
: 0.060

PNWER NAFTA Submission - Appendix A: Survey Results. June 12, 2017.
Q9. 4. De Minimis Value for Expedited International Shipment - The de minimis threshold for the U.S. is $800, $20 for Canada, and $300 for Mexico. How important is it that these thresholds be aligned?
Answer Count Percent
1. Extremely
important 50 24.39%
2. Somewhat
important 81 39.51%
3. Not important 34 16.59%
4. N/A 40 19.51%

PNWER NAFTA Submission - Appendix A: Survey Results. June 12, 2017.
Total 205 100%
Mean
: 2.312
Confidence Interval @ 95% : [2.169 -
2.456] Standard Deviation : 1.048
Standard
Error
: 0.073

PNWER NAFTA Submission - Appendix A: Survey Results. June 12, 2017.
Q9. 5. Digital Trade - Should a framework to promote and govern digital trade (digital goods and services, for example, software, music, films, games, etc.) be established?
Answer Count Percent
1. Extremely
important 52 25.37%
2. Somewhat
important 57 27.80%
3. Not important 42 20.49%
4. N/A 54 26.34%

PNWER NAFTA Submission - Appendix A: Survey Results. June 12, 2017.
Total 205 100%
Mean
: 2.478
Confidence Interval @ 95% : [2.323 -
2.634] Standard Deviation : 1.136
Standard
Error
: 0.079

PNWER NAFTA Submission - Appendix A: Survey Results. June 12, 2017.
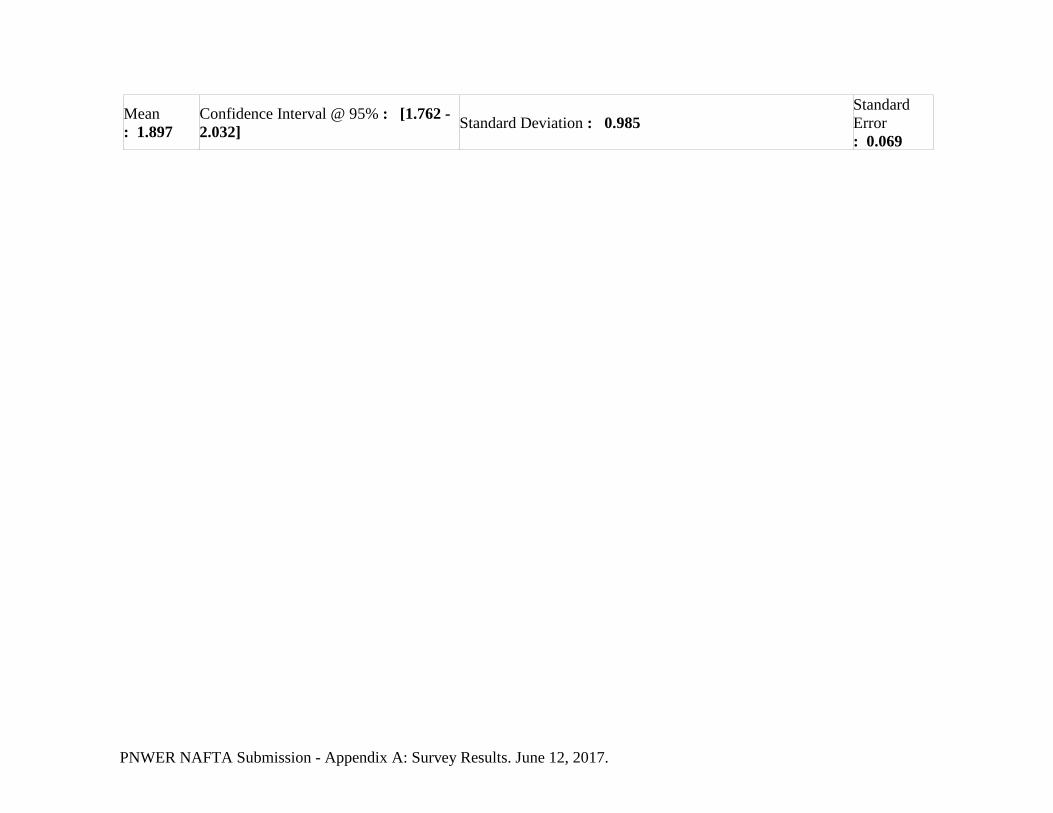
Q9. 6. E-commerce - How important are modernized regulations on e-commerce?
Answer Count Percent
1. Extremely
important 86 42.16%
2. Somewhat
important 77 37.75%
3. Not important 17 8.33%
4. N/A 24 11.76%
Total 204 100%
PNWER NAFTA Submission - Appendix A: Survey Results. June 12, 2017.
Mean
: 1.897
Confidence Interval @ 95% : [1.762 -
2.032] Standard Deviation : 0.985
Standard
Error
: 0.069

PNWER NAFTA Submission - Appendix A: Survey Results. June 12, 2017.
Q9. 7. Energy and Infrastructure - How important is it that NAFTA support further integration of North American energy markets and the infrastructure needed to connect them?
Answer Count Percent
1. Extremely
important 108 52.43%
2. Somewhat
important 56 27.18%
3. Not important 17 8.25%
4. N/A 25 12.14%

PNWER NAFTA Submission - Appendix A: Survey Results. June 12, 2017.
Total 206 100%
Mean
: 1.801
Confidence Interval @ 95% : [1.661 -
1.941] Standard Deviation : 1.028
Standard
Error
: 0.072

PNWER NAFTA Submission - Appendix A: Survey Results. June 12, 2017.
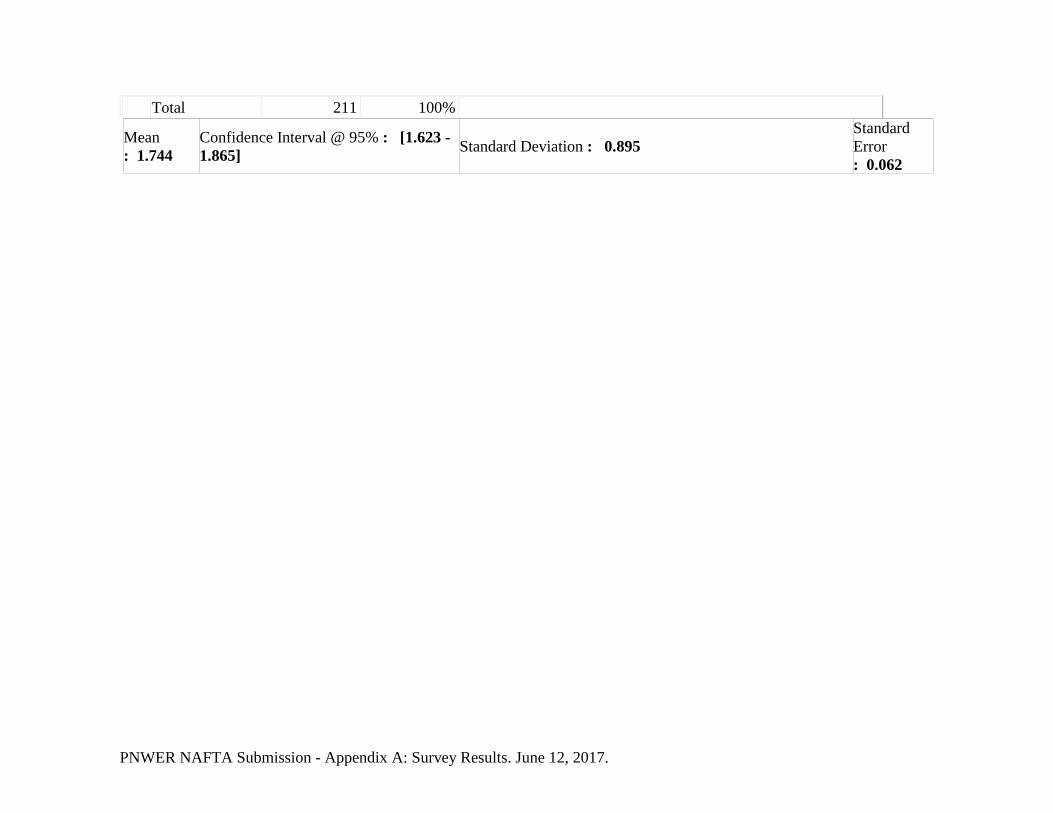
Q9. 8. Express Delivery - How important is it that NAFTA includes modern provisions to facilitate cross-border express delivery for small shipments?
Answer Count Percent
1. Extremely
important 105 49.76%
2. Somewhat
important 68 32.23%
3. Not important 25 11.85%
4. N/A 13 6.16%
PNWER NAFTA Submission - Appendix A: Survey Results. June 12, 2017.
Total 211 100%
Mean
: 1.744
Confidence Interval @ 95% : [1.623 -
1.865] Standard Deviation : 0.895
Standard
Error
: 0.062
PNWER NAFTA Submission - Appendix A: Survey Results. June 12, 2017.
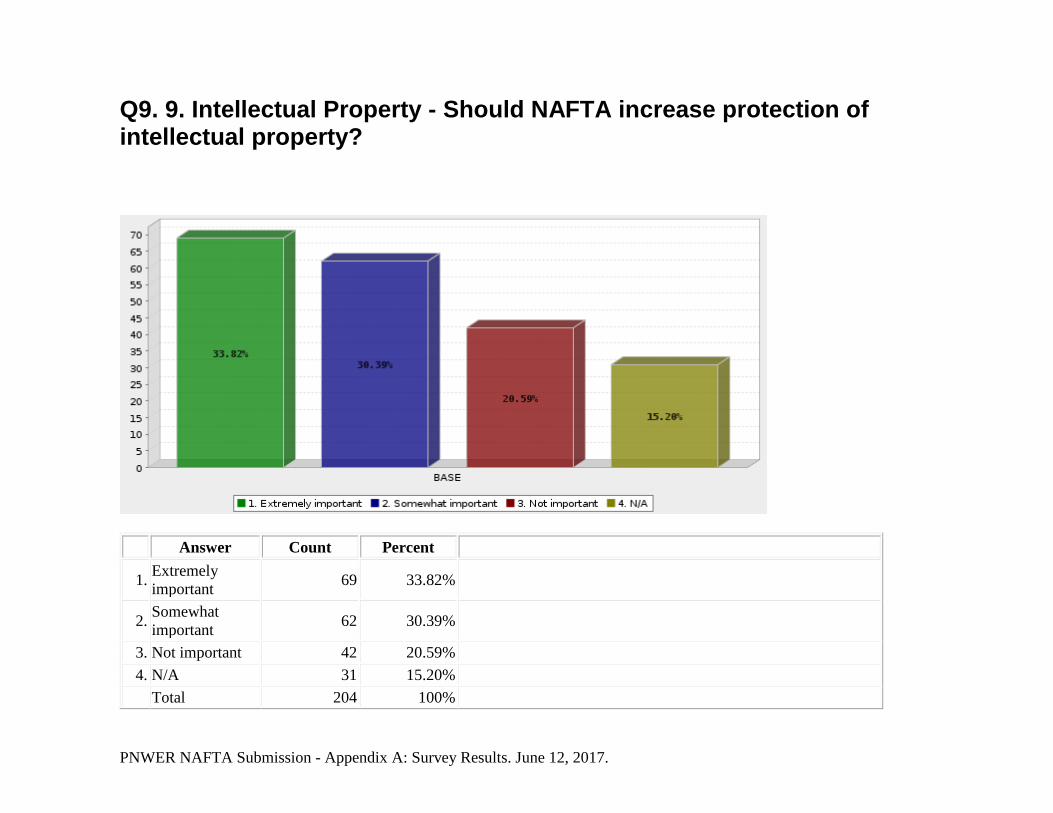
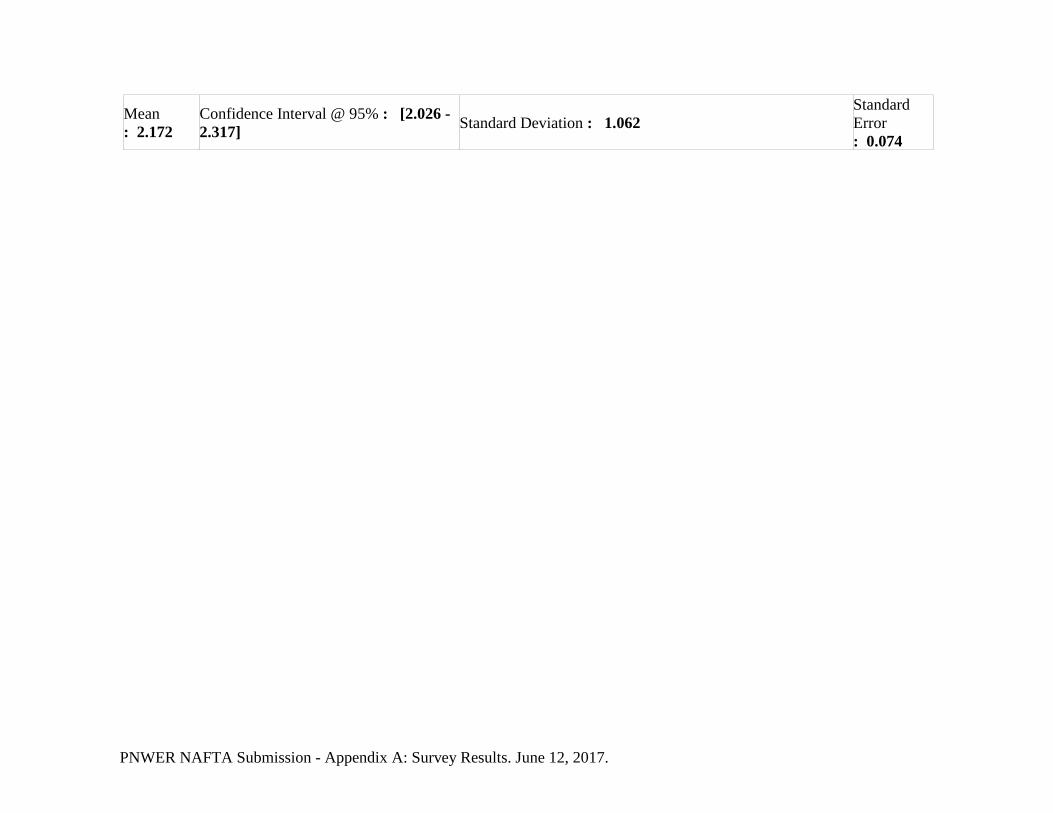
Q9. 9. Intellectual Property - Should NAFTA increase protection of intellectual property?
Answer Count Percent
1. Extremely
important 69 33.82%
2. Somewhat
important 62 30.39%
3. Not important 42 20.59%
4. N/A 31 15.20%
Total 204 100%
PNWER NAFTA Submission - Appendix A: Survey Results. June 12, 2017.
Mean
: 2.172
Confidence Interval @ 95% : [2.026 -
2.317] Standard Deviation : 1.062
Standard
Error
: 0.074

PNWER NAFTA Submission - Appendix A: Survey Results. June 12, 2017.
Q9. 10. NAFTA Professionals List - How important is it to update NAFTA labor categories to reflect modern classifications of employment?
Answer Count Percent
1. Extremely
important 70 34.31%
2. Somewhat
important 72 35.29%
3. Not important 30 14.71%
4. N/A 32 15.69%

PNWER NAFTA Submission - Appendix A: Survey Results. June 12, 2017.
Total 204 100%
Mean
: 2.118
Confidence Interval @ 95% : [1.973 -
2.262] Standard Deviation : 1.053
Standard
Error
: 0.074

PNWER NAFTA Submission - Appendix A: Survey Results. June 12, 2017.
Q9. 11. North American Single Window - How important is it to finalize cross-border data sharing and harmonization into a single window for import/export?
Answer Count Percent
1. Extremely
important 100 48.31%
2. Somewhat
important 71 34.30%
3. Not important 14 6.76%
4. N/A 22 10.63%

PNWER NAFTA Submission - Appendix A: Survey Results. June 12, 2017.
Total 207 100%
Mean
: 1.797
Confidence Interval @ 95% : [1.665 -
1.929] Standard Deviation : 0.969
Standard
Error
: 0.067

PNWER NAFTA Submission - Appendix A: Survey Results. June 12, 2017.
Q9. 12. Regulatory Cooperation - How important is it to encourage expansion and permanent adoption of the Regulatory Cooperation Council, to align product standards, testing and certification?
Answer Count Percent
1. Extremely
important 116 56.31%
2. Somewhat
important 58 28.16%
3. Not important 15 7.28%
4. N/A 17 8.25%

PNWER NAFTA Submission - Appendix A: Survey Results. June 12, 2017.
Total 206 100%
Mean
: 1.675
Confidence Interval @ 95% : [1.548 -
1.802] Standard Deviation : 0.930
Standard
Error
: 0.065

PNWER NAFTA Submission - Appendix A: Survey Results. June 12, 2017.
Q9. 13. Skills Certification Standards - How important is it to encourage mutual recognition of skills certifications standards across borders?
Answer Count Percent
1. Extremely
important 95 45.67%
2. Somewhat
important 74 35.58%
3. Not important 17 8.17%
4. N/A 22 10.58%
Total 208 100%

PNWER NAFTA Submission - Appendix A: Survey Results. June 12, 2017.
Mean
: 1.837
Confidence Interval @ 95% : [1.705 -
1.968] Standard Deviation : 0.969
Standard
Error
: 0.067

PNWER NAFTA Submission - Appendix A: Survey Results. June 12, 2017.
Q9. 14. Softwood Lumber - How important is it that a modernized NAFTA include a solution to softwood lumber?
Answer Count Percent
1. Extremely
important 79 38.54%
2. Somewhat
important 51 24.88%
3. Not important 21 10.24%
4. N/A 54 26.34%
Total 205 100%

PNWER NAFTA Submission - Appendix A: Survey Results. June 12, 2017.
Mean
: 2.244
Confidence Interval @ 95% : [2.077 -
2.411] Standard Deviation : 1.220
Standard
Error
: 0.085
PNWER NAFTA Submission - Appendix A: Survey Results. June 12, 2017.
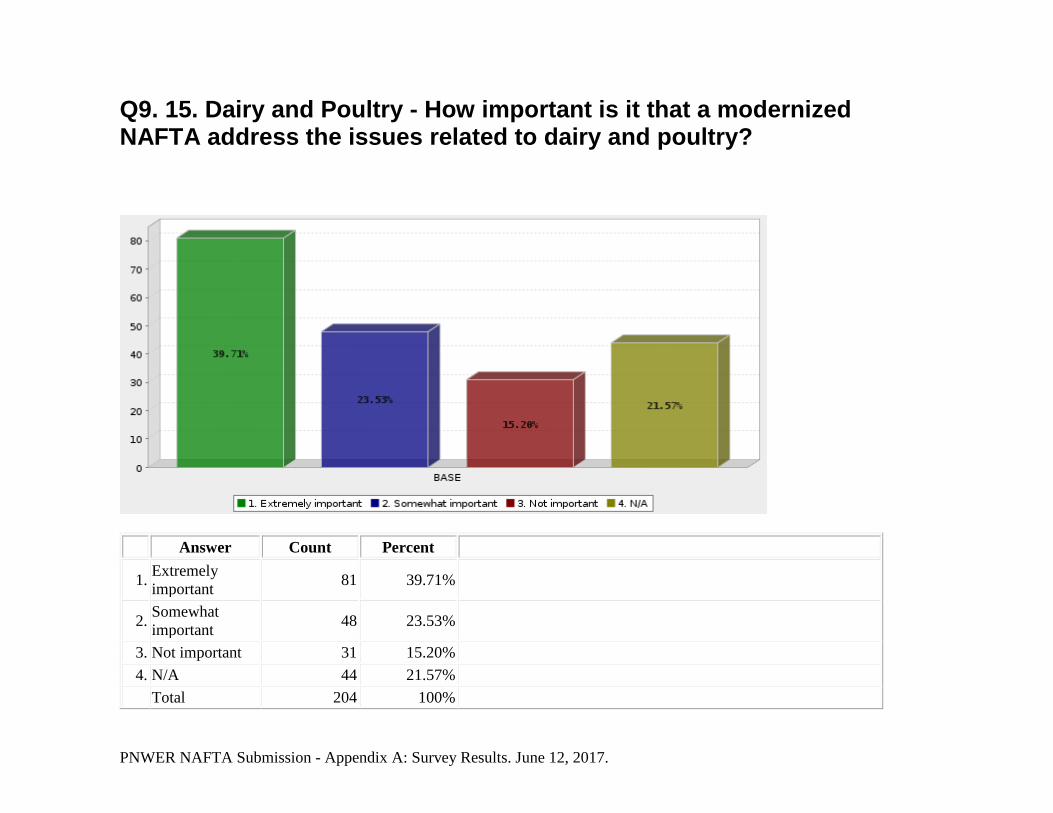
Q9. 15. Dairy and Poultry - How important is it that a modernized NAFTA address the issues related to dairy and poultry?
Answer Count Percent
1. Extremely
important 81 39.71%
2. Somewhat
important 48 23.53%
3. Not important 31 15.20%
4. N/A 44 21.57%
Total 204 100%

PNWER NAFTA Submission - Appendix A: Survey Results. June 12, 2017.
Mean
: 2.186
Confidence Interval @ 95% : [2.025 -
2.348] Standard Deviation : 1.176
Standard
Error
: 0.082

PNWER NAFTA Submission - Appendix A: Survey Results. June 12, 2017.
Q15. Do you employ any foreign workers?
Answer Count Percent
1. Yes 52 24.41%
2. No 161 75.59%
Total 213 100%
Mean
: 1.756
Confidence Interval @ 95% : [1.698 -
1.814] Standard Deviation : 0.431
Standard
Error
: 0.030

PNWER NAFTA Submission - Appendix A: Survey Results. June 12, 2017.
Q17. Does your organization depend on bi-national supply chains between Canada, Mexico, or the U.S.?
Answer Count Percent
1. Yes 104 49.52%
2. No 106 50.48%
Total 210 100%
Mean
: 1.505
Confidence Interval @ 95% : [1.437 -
1.573] Standard Deviation : 0.501
Standard
Error
: 0.035

PNWER NAFTA Submission - Appendix A: Survey Results. June 12, 2017.
Q20. Would your organization be interested in reviewing and potentially endorsing a list of NAFTA recommendations developed by the Taskforce?
Answer Count Percent
1. Yes 101 51.01%
2. No 97 48.99%
Total 198 100%
Mean
: 1.490
Confidence Interval @ 95% : [1.420 -
1.560] Standard Deviation : 0.501
Standard
Error
: 0.036
PNWER NAFTA Submission - Appendix A: Survey Results. June 12, 2017.
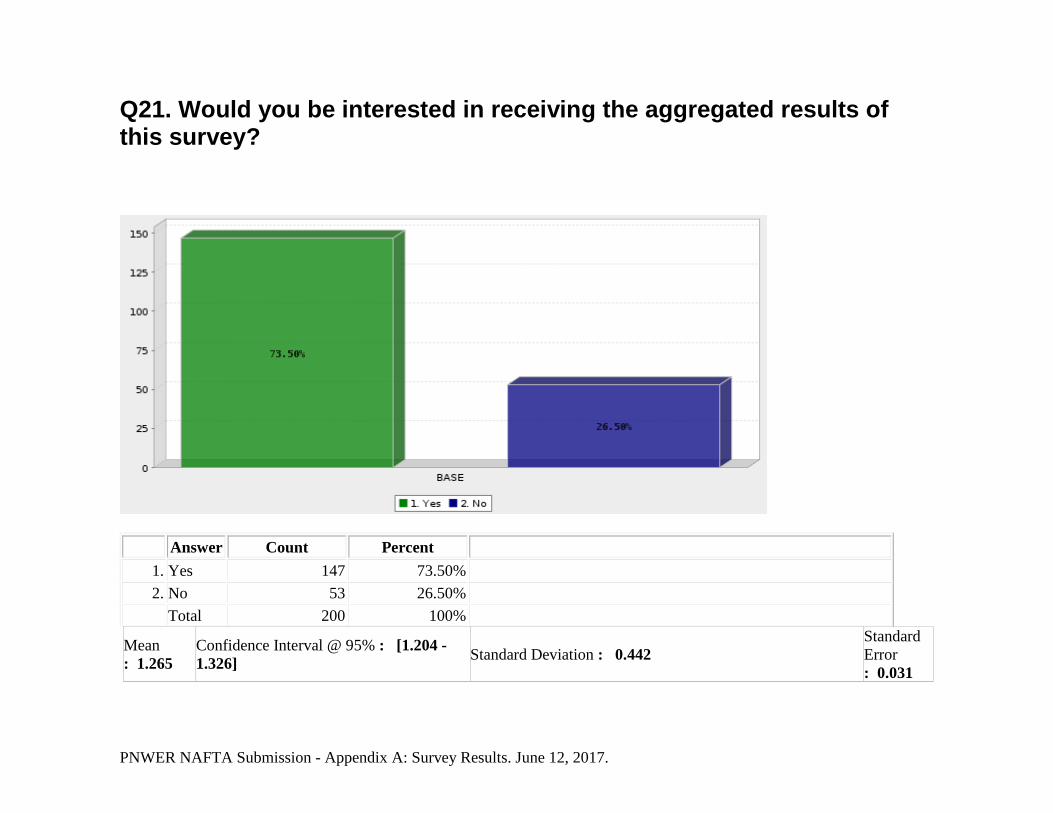
Q21. Would you be interested in receiving the aggregated results of this survey?
Answer Count Percent
1. Yes 147 73.50%
2. No 53 26.50%
Total 200 100%
Mean
: 1.265
Confidence Interval @ 95% : [1.204 -
1.326] Standard Deviation : 0.442
Standard
Error
: 0.031

PNWER NAFTA Submission - Appendix A: Survey Results. June 12, 2017.