
PMP Training in Bangalore | PMP Certification in Bangalore | PMP

Registered Office:
PMP LIMITED 39 050 148 644
Level 1267 Albert AvenueChatswoodNew South Wales 2067Tel: 02 9412 6000Fax: 02 9413 3939
www.pmplimited.com.au
PMP
LIM
ITED
ABN
39
050
148
644
| 20
11 A
NNUA
L RE
PORT
A N N U A L
R E P O R T
2 0 1 1

PMP L imi ted – Bus iness Ac t i v i t i esPMP Limited is one of Australasia’s leading media and marketing services companies, providing a range of services from concept right
through to fulfilment. PMP operates in the areas of data-driven market and customer analytics, creative advertising solutions, premedia,
creative and photographic services, printing, letterbox distribution, magazine and book distribution through its Pacific Micromarketing,
Dimension Studios, Dimension Solutions, Pinpoint (NZ), Maxum (NZ), PMP Digital, PMP Print, PMP Distribution, Gordon and Gotch,
treeet, Catalogues4U, PMP Directories and Griffin Press businesses.
The Annual General Meeting will be held at 11am on Friday 18 November 2011 at
Mantra Chatswood 10 Brown Street Chatswood NSW 2067
Details of the business of the meeting are contained in the separate Notice of Meeting.
ANNUAL|GENERAL|MEETING|
Shareholders requiring information should contact the share registry or Chief Financial Officer Geoff Stephenson
Telephone 02 9412 6000
Facsimile 02 9413 3942
Email [email protected]
ASX Code PMP
INVESTOR|INFORMATION|Computershare Investor Services
Pty Limited
Level 5, 115 Grenfell Street Adelaide SA 5000 GPO Box 1903 Adelaide SA 5001
Enquiries within Australia 1300 556 161
Enquiries outside Australia +61 3 9415 4000
Email [email protected]
Website www.computershare.com
ShARE|REGISTRy|
Graham J ReaneyChairman
Richard AllelyCEO and Managing Director
Peter GeorgeNon-Executive Director
Ian L FraserNon-Executive Director
Matthew Bickford-SmithNon-Executive Director
Naseema SparksNon-Executive Director
Goh Sik NgeeNon-Executive Director
PMP L IMITED|D IRECTORS|
2 | Chairman’s Review
6 | CEO’s Review
10 | Operation Reports
15 | People and Culture
18 | Products and Services
20 | Directors’ Biographies
22 | Corporate Governance
26 | Sustainability Report
30 | Directors’ Report
32 | Remuneration Report
45 | Independent Auditor’s Declaration
46 | Commentary on the Accounts
48 | Statement of Comprehensive Income
49 | Statement of Financial Position
50 | Statement of Cash Flows
51 | Statement of Changes in Equity
52 | Notes to and forming part of the Financial Statements
97 | Independent Audit Report
98 | Five year Summary
99 | Share Register Information
100 | Shareholder Information
SAFETy protection | security | safeguards | wellbeing | assurance
The safety and security of our staff are of paramount importance to PMP. Our staff work for a profitable business that invests in their
careers and looks after them in a safe working environment.
REliABil iTy trusted | responsible | measured | answerable | dependable
PMP can be relied upon to deliver on its promises. We accept responsibility for our actions and the products and services we deliver. Our success depends on being answerable to each other, our customers and our business partners and we ensure our stakeholders can always measure us against our performance.
lEAdERShiP visionary | innovative | challenging | knowledge | expertise
We are recognised as true leaders in our industry and have been for more than 150 years. Our success is driven by the courage to promote and embrace innovative and visionary thinking and by challenging the status quo in the delivery of media services.
hoNESTy integrity | truthful | ethical | transparent | responsible
The success of PMP, our staff and our customers depends on honesty, responsibility and integrity. We do not compromise our high ethical standards, mislead others or hide from our responsibilities.
TEAMWoRk proactive | energetic | committed | cooperative | supportive
With a ‘One Team’ ethos, every PMP team member works, supports and defends each other to achieve the company’s goals. We see ourselves as integral partners to our clients and deliver products and services through teamwork and the development of trusted relationships.
PRoFESSioNAliSM expert | skilled | proficient | qualified | excellence
Professionalism with excellence is the cornerstone of PMP and is what we are judged against by every stakeholder. Our success relies upon skilled, knowledgeable professionals who strive to exceed the expectations of our stakeholders every day.
V A l u E S
PMP L IMITED ABN 39 050 148 644
Level 12 67 Albert Avenue Chatswood New South Wales 2067Tel: 02 9412 6000 Fax: 02 9413 3939
www.pmplimited.com.au
i N d E X
310720_PMPAR2011_IFC_1.indd 1-2 8/9/11 2:07:22 PM

To the shareholders of PMP LimitedIn 2010/11, PMP continued to benefit from the substantial restructuring that began in early 2009. EBIT levels (before significant items) were higher, up from $52.2M to $56.7M while net profit (before significant items) increased from $24.5M to $28.7M up 17.1%. Revenues stabilised from large falls in previous years, dropping by just 1.5%.
Higher profits came from another strong result at Print Australia and an improved outcome at Print NZ. A pleasing feature of the year was that the second half EBIT (before significant items) result of $24.5M was 9.4% above the prior year of $22.4M, with the positive momentum forecast to continue into the current year.
After significant items of $52.2M, PMP recorded a loss of $11.3M. These items included $26.5M of one-off costs from the Australia and New Zealand transformation, mostly relating to site relocations, redundancies and lease obligations at existing sites in Auckland and the impairment of plant and equipment. The remainder came from the Scribo impairment of $25.7M.
2
CHAIRMAN’S REV IEW
Graham ReaneyChairman, PMP Limited
A summary of results follows:
$M 2011 2010
Print Australia Distribution Australia Gordon and Gotch Digital New Zealand Corporate
55.4 1.1 3.7 0.1 4.8
(8.4)
47.7 (2.2) 7.5 3.5 5.5
(9.8)
EBIT (before significant items) Borrowing costs Mark to market adjustment
56.7 (15.0)
0.5
52.2 (17.6)
2.3
EBT (before significant items) Income Tax
42.2 (13.5)
36.9 (12.4)
Net profit (before significant items) Significant items Tax on significant items
28.7 (52.2) 12.2
24.5 (5.5) 1.6
Net (loss)/profit (11.3) 20.6
During the year, the Group made progress in driving the next stage of our transformation plan announced at the 2010 AGM. In terms of planned restructuring in New Zealand, we are consolidating four existing sites onto a new site in Auckland. The new site has been secured in Auckland, transition has commenced and full commissioning is expected by January 2012, some 3-4 months later than originally planned because of delays in plant arriving in New Zealand. Given the rapidly changing market, we are delaying the planned capital investment in equipment for our Western Australia operations until we get clarity around customer needs. This will delay both the fiscal 2012 spend and savings previously announced for Australia. Total transformation capital expenditure will be within the previously announced $30M. On a positive note, fiscal 2013 savings are still forecast in line with expectations of $28 million but the current year’s savings will be reduced from $20M to $17M because of the above timing delays.
CHAIRMAN’SREVIEW
Graham ReaneyChairman, PMP Limited
310720_PMPAR2011_1-29.indd 2 6/9/11 4:53:15 PM
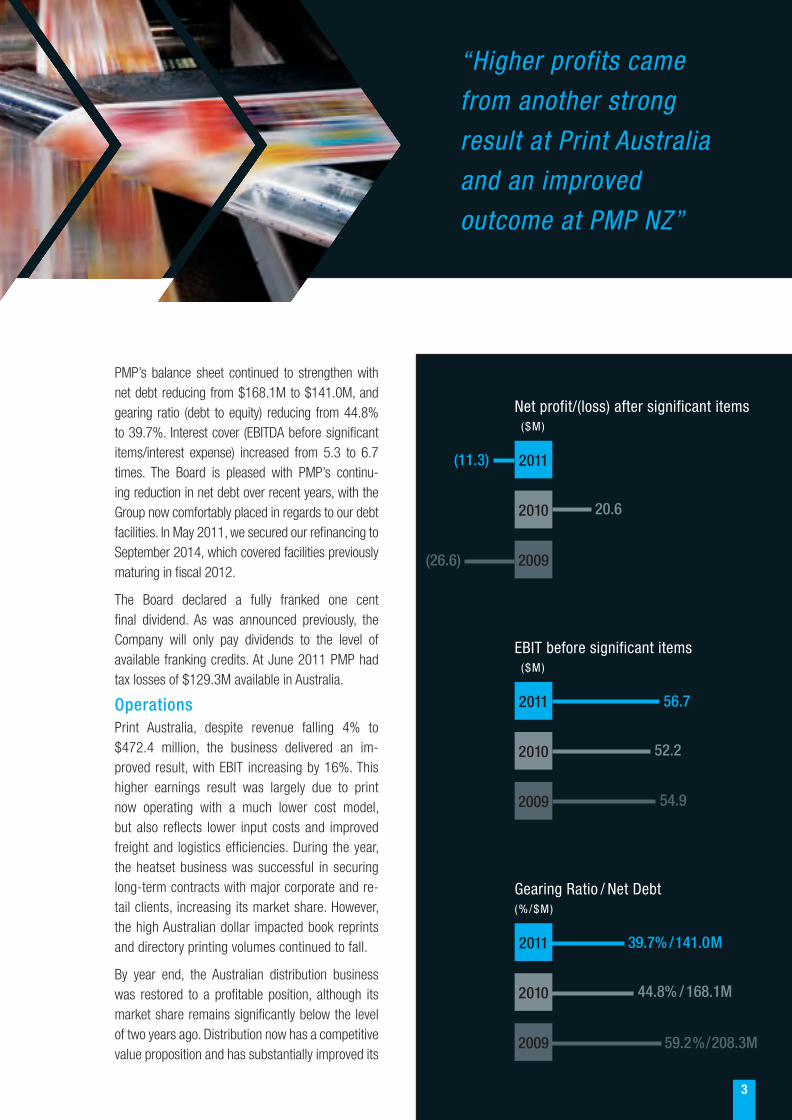
PMP’s balance sheet continued to strengthen with net debt reducing from $168.1M to $141.0M, and gearing ratio (debt to equity) reducing from 44.8% to 39.7%. Interest cover (EBITDA before significant items/interest expense) increased from 5.3 to 6.7 times. The Board is pleased with PMP’s continu-ing reduction in net debt over recent years, with the Group now comfortably placed in regards to our debt facilities. In May 2011, we secured our refinancing to September 2014, which covered facilities previously maturing in fiscal 2012.
The Board declared a fully franked one cent final dividend. As was announced previously, the Company will only pay dividends to the level of available franking credits. At June 2011 PMP had tax losses of $129.3M available in Australia.
OperationsPrint Australia, despite revenue falling 4% to $472.4 million, the business delivered an im-proved result, with EBIT increasing by 16%. This higher earnings result was largely due to print now operating with a much lower cost model, but also reflects lower input costs and improved freight and logistics efficiencies. During the year, the heatset business was successful in securing long-term contracts with major corporate and re-tail clients, increasing its market share. However, the high Australian dollar impacted book reprints and directory printing volumes continued to fall.
By year end, the Australian distribution business was restored to a profitable position, although its market share remains significantly below the level of two years ago. Distribution now has a competitive value proposition and has substantially improved its
3
EBIT before significant items ($M)
2011 56.7
2010 52.2
2009 54.9
Net profit/(loss) after significant items ($M)
2011(11.3)
2010 20.6
2009(26.6)
“Higher profits came
from another strong
result at Print Australia
and an improved
outcome at PMP NZ”
Gearing Ratio / Net Debt (%/$M)
2011 39.7% /141.0M
2010 44.8% / 168.1M
2009 59.2% / 208.3M
310720_PMPAR2011_1-29.indd 3 6/9/11 4:05:23 PM

4
network efficiency. Revenue increased by 7.5%, and further gains are predicted.
In Gordon and Gotch EBIT fell, largely due to adverse trading conditions experienced by its book distribution business, Scribo. Taking into account the move from retail to online sales, the dearth of new titles and the emergence of e-readers, at half year, the Board booked a full write-down of the intangible value of this business of $19.2M. Following a subsequent strategic review, the Board decided to close the business at 30 June 2011. The closure affected approximately 50 employees, with the cost to close accounted for as a significant item, in 2010/11.
In its magazine distribution business, Gordon and Gotch re-signed a ten year Pacific Magazines distribu-tion contract and secured more international product. These wins, together with the closure of a competitor, should stabilise the industry. However, with magazine circulations continuing to decline, the Board is cautious in its outlook for this business.
In PMP Digital, EBIT (before significant items) de-clined to $0.1M down by $3.3M on lower revenues. This was partly due to a deferral of license renew-als in Pacific Micromarketing, and also because of marketing and establishment costs associated with the new DMarketer system. Revenue genera-tion commenced in the second half and is showing encouraging trends for fiscal 2012.
For PMP New Zealand, EBIT decreased by 13.1%, due to the foreign exchange translation, weaker eco-nomic conditions and extreme price competition in magazine distribution. However, the Print business performed better year on year. With a new printing contract from APN and consolidated heatset opera-tions, this business will continue to improve, despite the ongoing challenges of the local economy. Dis-tribution in New Zealand also had a pleasing year, with an uplift in volumes and revenue.
SustainabilityOn pages 26 to 29 of the Report, we have outlined and explained the Group’s approach to sustainability
and the environment. I encourage share-holders to read this section: it demon-strates the Group’s commitment to these issues and the substantial progress that has been achieved.
Board MattersPMP has three long serving Directors who are due to retire in the next three to four years.
To facilitate a smooth transition I have decided as the longest serving director to retire at this year’s AGM, and Mr Ian Fraser will take over as Chairman.
CHAIRMAN’S REV IEW cont inued…
Print now operates with a much lower cost model, together with lower input costs and improved freight and logistics efficiencies.
310720_PMPAR2011_1-29.indd 4 6/9/11 4:08:38 PM

A search for a replacement director has been initi-ated and an appointment is expected to be made before the end of the year.
Changes were made to sub-committee member-ship with Mr Goh Sik Ngee joining the Audit and Risk Management Committee, and Ms Naseema Sparks joining the Appointments and Compensa-tion Committee.
The board also updated the Company Constitution and certain amendments will be put to shareholders at this year’s AGM.
Corporate GovernanceIt is the responsibility of the Board to ensure the company operates within a governance framework that fosters high ethical standards and links the performance of the company with the remuneration of senior executives. The remuneration report outlines the Group remuneration policies and reward structure.
OutlookBy early 2012 PMP will have completed its major restructuring in both Australia and New Zealand and no significant items are forecast for the current year.
Management is embedding into the organisation a culture of continuous improvement via productivity and efficiency gains to help offset cost increases and continuing pricing pressure.
Although PMP maintained its print tonnage in 2010/11 the print industry generally is regarded as being in decline and this is added pressure to maintain competitiveness and margins in the face of a reducing total market.
Notwithstanding these difficulties PMP is aiming to enhance its position in the digital and marketing services sectors so as to be able to offer a full range of services to a broad spectrum of customers.
With the Group restructure largely completed and with reduced gearing giving a strong balance sheet, PMP’s significant free cash flow is expected to continue.
As with prior years, PMP will provide guidance on current half earnings at the AGM.
Finally I would like to recognise the contribution of Richard Allely and the senior management team for their dedicated contribution over the last year. The company is now well positioned to reward share-holders and this would not have been possible with-out the commitment of both management and non executive directors through what has been at times extremely difficult and challenging circumstances.
Graham J Reaney Chairman, PMP Limited
5
CHAIRMAN’S REV IEW cont inued…
310720_PMPAR2011_1-29.indd 5 9/9/11 7:17:08 AM

Dear ShareholderI am pleased to report ongoing benefits from our transformation program announced last year to re-energise PMP. As a result of very hard work by PMP’s executive team and the entire workforce, the business is in good shape. Our divisions are being run by some of the industry’s most experienced operators. We have major, long-term contracts locked in, supportive customers, high employee engagement and excellent relationships with our suppliers.
In 2010/11, our bottom line was affected by sig-nificant one-off items and our support, alongside most of corporate Australia, for the people affected by this year’s numerous natural disasters. However, behind these extraordinary events, PMP continued to generate excellent free cash flows, which we used largely to retire debt. As a result, our balance sheet is the strongest it has been in over a decade, with debt continuing to fall.
Looking at the strength of our order books, efficient cost structure and seasoned team, I have no doubt that PMP is now well positioned to generate significant free cash flows for the medium-term and will be able to reward shareholders appropriately in the future.
6
CEO’S REV IEW
Richard AllelyCEO, PMP Limited
A new growth agenda for PMPThe board and executive team are mindful that a number of PMP’s traditional markets are in decline and that, because of this, PMP’s stock is currently priced at a substantial discount. We therefore devoted our strategic planning this year to developing a growth agenda for PMP, beyond our traditional markets, to ensure a sustainable future for your company.
While we intend to continue to maximise the value creation in the heatset print industry, we plan to extend our print services footprint into the short run digital print markets.
At the same time, we have also started to build a strong capability in marketing services. Our high profile marketing conference in April this year – the largest event of its kind – launched the PMP brand and our analytics and segmentation capabilities to the marketing sector.
The rise of the internet and digital media has led to an explosion in marketing channels. Faced with so much choice, today’s marketers are struggling to understand the most effective mix of channels, or how to efficiently re-purpose content, while retaining brand integrity, from one to another.
PMP already has the experience and technology to answer these questions. Because we process thousands of different marketing campaigns, we have invested in sophisticated products – Express, Mosaic, PacMicro, DMarketer – to help our clients deliver the best results.
CEO’SREVIEW
Richard AllelyCEO, PMP Limited
310720_PMPAR2011_1-29.indd 6 6/9/11 4:56:58 PM
Today, we are often involved in every phase of a campaign. We can take a campaign right from cre-ative through to production and fulfilment, whether a mail out, door-to-door or digital delivery. We can tell our clients their market penetration, the suc-cess of an offer, and the response rates of an email campaign. Moreover, we have technology that can automatically re-purpose marketing content across multiple channels.
These are the high value services that empower fact-based marketing decisions. They will enable PMP to become the trusted advisor to marketers: we are building our brand in this sector as a company that deals in facts and has the technology to deliver better across all channels – not just print.
To support this agenda, in the last two years, we have made good progress in integrating our existing offerings, so we can present our clients with an end-to-end marketing campaign service. The next step is to identify the growth areas where we can move quickly and decisively to introduce new products and services. I expect, within a few years, that marketing services will represent a much more significant part of PMP’s revenue.
7
“PMP’s balance sheet is the
strongest in over a decade
with debt continuing to fall”
A high performance culture with a focus on safetyDuring the year, we continued to support our commitment to safety and build a ‘One Team’, High Performance culture.
This included updating PMP’s Safety Management System and introducing a Health and Safety Busi-ness Operation Plan. The new plan expands our safety performance focus beyond negative lag indi-cators, to include positive measures such as safety walks, inspections, hazards identification and risk assessments, safety toolbox talks and training.
Risk minimisation initiatives included print site assess-ments, a new near miss and hazard reporting program and an online incident and injury reporting system. This online system has reduced the time required to report an incident and allowed the sites to take action and minimise risk in a timely manner.
To help embed our company values, we launched two CEO Awards. This year, the ‘OH&S Individual Achievement’ Award was presented to an employee whose efforts will improve hearing protection and awareness in the press rooms. The ‘One Team’ Award, was presented to an Australian team that engineered an innovative solution for replacing ink ducts, improving the efficiency and safety in print maintenance, and a New Zealand team that devel-oped an integrated market offering drawing on our cross-Tasman capabilities.
310720_PMPAR2011_1-29.indd 7 9/9/11 7:17:46 AM

We also continued to support our 25 Year Club, which now boasts 172 employees, representing the diver-sity, capability and bench-strength of our business across all sites and occupations.
When the year’s natural disasters hit, PMP respond-ed, initiating industry support to the Queensland flood appeal, and donating substantially to both this and the New Zealand earthquake appeal. Both of these company initiatives were supported by per-sonal contributions (both financial and in kind) from our employees.
In these difficult times, the spirit of One Team was evident in the selfless giving of our employees to their colleagues and their commitment to ensure customer service was maintained, despite very challenging circumstances.
CEO’S REV IEW cont inued…
I am very proud of their response to these and all the challenges of the year, and of their achieve-ments in the business.
Individuals on their own can influence change and outcomes, but the delivery can only be effectively achieved through a team of people working together. To that end, I want to extend my sincere thanks to the executive team of PMP, which has both created the enabling environment for a strong future, while also delivering excellent results in the short-term.
Richard Allely CEO
“During the year, PMP continued to support the
commitment to safety and build a ‘One Team’
High Performance culture”
8
310720_PMPAR2011_1-29.indd 8 9/9/11 7:18:17 AM

9
As the digital world evolves, so does the diversity of communication and publishing channels available within it.
“PMP can take a campaign from creative through
to production and fulfilment, whether in a mail
out, door-to-door or digital delivery”
310720_PMPAR2011_1-29.indd 9 6/9/11 4:10:22 PM

10
AUSTRALIAN PRINT AND DISTRIBUTION
Andrew WilliamsExecutive General Manager
PrintPrint had a very positive year,
delivering a major lift in EBIT for the second year running, in a flat market. The
combined Heatset, Books and Directories business delivered EBIT (before significant items) growth of $7.7M or 16%, year on year. This was particularly pleasing given revenue excluding paper was relatively flat.
This excellent EBIT performance demonstrates the effectiveness of PMP’s previous restructur-ing and transformation programs, which have enabled us to substantially reduce operating costs. Just as importantly, thanks to our reward and recognition programs and investment in upgrading work facilities, the year ended with very high employee morale.
We look forward to an even stronger year, with new growth driven by PMP’s digital strategy.
HeatsetThe vast majority of Print’s EBIT and revenue is currently generated by our heatset opera-tions. Despite an across the board drop in client
publishing, leading to lower revenues, Heatset EBIT (before significant items) rose by 45.2%, or $14.4M year on year.
Our goal at the beginning of the year was to fur-ther simplify operations, with a view to reducing production costs without taking additional head-count out of the business. We also re-signed our Enterprise Bargaining Agreement for four years, including introducing a productivity-based bonus scheme that benefits all parties. The results can be seen in our EBIT performance and PMP’s strong competitive position.
These metrics have also improved due to our transformation from a commodity manufac-turer to selling a value proposition. PMP Print has moved from simply competing on price to offering solutions that can increase the return on our clients’ investment. This new strategic approach, together with our integrated offer-ing across the group, is already showing in the bottom line and has enabled us to steadily take market share throughout the year. Several large wins in the last quarter were particularly valu-able, giving us solid, contracted volumes to take into fiscal 2012 and beyond.
Books Book printing had a turbulent year, with the REDGroup Retail falling into administration, result-ing in the closure of the Angus & Robertson and the Borders businesses. Unusually, the year also lacked a single blockbuster, which typically accounts for 10% of book volumes. The result was an anom-aly year of pure reprints, and considerable market uncertainty, with volumes down 15.9%.
PMP Print delivered a major lift in EBIT for a second year running.
OPERATION REPORTS
AUSTRALIAN PRINTAND DISTRIBUTION
Andrew Williams
310720_PMPAR2011_1-29.indd 10 7/9/11 11:30:23 AM

Looking ahead, we expect the market to stabi-lise, albeit in the different shape of on-demand printing. PMP is adapting to this worldwide shift. In July, we commissioned a new HP350 state-of-the-art digital press to enable us to compete effectively for smaller print runs.
Directories Directory volumes fell even further, by 11.7% year on year, dragging EBIT with them. We expect volumes to rebound somewhat next year, although, given the increase in consumers using online searches, this is never likely to be a growth business.
DistributionFor Distribution, fiscal 2011 was about rebuild-ing the network, getting the right technology in place, and regaining customer confidence. We ended the year with a stabilised and reconfig-ured network model, a smarter tracking system operational and a vertical sales model, enabling strong collaboration with Print and leading to numerous new business wins.
The result was an increase in revenues of 7.5%, in a declining market and the business meeting its modest EBIT targets to get back in the black.
The floods in Queensland disrupted business for Distribution and its clients. Our priority was to look after our clients and staff affected by the disaster. While PMP staff in Victoria gave up their Christmas bonuses to send to their colleagues in Queensland, the business made substantial donations to support flood victims. The short-term loss to our bottom line was a
small price to pay for looking after our staff and cementing stronger relationships with our Queensland clients.
With many of Distribution’s new business wins coming online in fiscal 2012, we expect to see a substantial increase in EBIT in the coming year.
GORDON AND GOTCH Craig DavisonExecutive General Manager
Gordon and Gotch delivered an EBIT (before significant items) of $3.7M, down from $7.5M on the previous year primarily due to the adverse trading condi-tions experienced by the Scribo book distribu-tion business, which was closed at the end of the year. Profitability was also hampered by higher freight costs.
Notwithstanding declining magazine circulation, the business benefited from securing nearly all of the imported magazine distribution following the closure of a competitor. In addition, while Scribo has closed, its ancillary business Brumby Books and Music will continue.
11
Gordon and Gotch strengthened its position by acquiring the
distribution of nearly all imported magazines.
With many of Distribution’s new business wins coming online in fiscal 2012, we expect to see a substantial increase in EBIT in the coming year.
310720_PMPAR2011_1-29.indd 11 6/9/11 4:16:01 PM

12
The new online entertainment retailer, treeet.com.au, had a good second year. The service currently makes available over two million products in 600 different categories, from romance books to Wii games, making it one of the most comprehensive online entertainment providers in Australia. Its launch of digital magazines in March 2011 has seen take-up growing faster than expected.
Looking ahead, with magazine circulations continuing to decline, the outlook is flat for fiscal 2012.
PMP DIGITAL & PACIFIC MICROMARKETING
Graham PlantExecutive General Manager
PMP DigitalPMP Digital had a challenging year on
the back of declining demand and reduced work from major clients still suffering from the
global financial crisis. EBIT (before significant items) declined due to lower revenues and the amortisation of costs associated with investing in the new DMarketer system.
However, the business ended the year in far more robust shape, having secured several long-term accounts with major corporates.
In addition, fiscal 2011 saw the completion of Digital’s 18 month project to consolidate all services in purpose-fitted premises. This has enabled significant restructuring, improved workflow, substantial efficiencies and reduced operating costs – all of which will contribute to an improved EBIT result for fiscal 2012.
Most significantly, the move was a concrete reflection of our strategy to incorporate all of PMP’s marketing services under the PMP Digital Brand. This is a vital building block in the Group’s future growth agenda to evolve PMP into a major marketing services provider. It has helped us to create strong linkages between digital, print and distribution – allowing us to offer clients a value proposition across the entire value chain, from creative briefing to door-to-door delivery.
In April 2011, we held the first Schmart Market-ing Conference in Sydney and Melbourne – one of the best attended marketing events of the year, with 500 delegates. With international and local celebrity speakers, and a focus on bridg-ing the gap between social and traditional me-dia, the conference hit the trending twitter list for two days in a row, repositioning PMP in the marketing solutions space. To continue devel-oping our brand in the marketing industry, we will run Schmart again in 2012.
Pacific MicromarketingLooking within Digital to its major brands, Pacific Micromarketing’s results were down on revenue and EBIT, due to a drop off in corporate demand, but still delivered a strong EBIT result. However, it finished the
OPERATION REPORTS cont inued…
DMarketer is one of several sophisticated products that help clients deliver the best results.
fiscal 2012.
PMP DIGITAL & PACIFIC MICROMARKETING
310720_PMPAR2011_1-29.indd 12 6/9/11 4:19:54 PM

year on a high, with its most successful month, locking away a number of long-term contracts.
Momentum is continuing to grow, as the market becomes increasingly aware of the power of Mo-saic, Australia’s leading geo-demographic seg-mentation classification dataset, and Micromar-keter Generation3, our new, powerful geographical analysis software. Micromarketer Generation3 enables clients to target communications more effectively and make better informed location deci-sions by profiling customers, evaluating sales ver-sus market potential and measuring the potential of local advertising areas.
Dimension Studios and SolutionsOur digital photography and premedia brands performed below expectations. A significant re-structuring of these businesses has been con-cluded and the outcome will deliver an increase in EBIT. This has been partially achieved by the consolidation of sites and realignment of resourc-ing into higher margin product and service lines.
We are also very optimistic about the earnings potential of our new smart marketing automation solution, DMarketer, which launched this year, attracting strong interest from the retail space. We ended the year with several key signings and a strong pipeline of opportunities. DMarketer is a powerful solution that helps our clients to manage, control and automate market-ing content across multiple channels, including print, web, email and mobile applications. It also provides automated workflow, enabling marketing, mer-chandising and legal teams to collabo-rate via one centralised system.
We also expect our public image asset bank, dLibrary, to extend into new vertical markets which are able to leverage the benefits already demonstrated in the FMCG space. Used by Aus-tralia’s leading retailers as the source for all their imaging requirements, dLibrary contains more than 30,000 images. The service ensures the marketplace has quick and easy access to approved product images, while giving retailers access to a quality asset management system for their own internal use.
PMP NEW ZEALANDCraig AmosExecutive General Manager
PMP New Zealand had a challenging year in a tough trading environment. On the back of the two Christchurch earthquakes, the local economy remained very soft with continued weak consumer spending and patchy retail sales. As a result, top line revenues (in local currency) remained flat year on year, and EBIT was down 13.1%.
During the year, PMP began a transformation project to rationalise operations, reduce our cost base, improve efficiency and enhance customer service. This included re-locating
13
Despite the soft New Zealand retail market, letterbox
distribution had a record year in both volume and profit.
OPERATION REPORTS cont inued…
310720_PMPAR2011_1-29.indd 13 6/9/11 4:20:25 PM

14
sales and operations resulting in two sites in the North Island and one in the South Island, streamlining our footprint down from the previous seven sites. The majority of the changes were in our heatset business, which remains in the process of rationalising three sites to two, reducing headcount and installing more efficient equipment. The transformation project, which is scheduled for completion by the end of January 2012, is expected to deliver the full cost savings by FY13.
In November 2010, the heatset business secured a 10 year agreement with New Zealand Maga-zines, after APN exited the printing market. PMP also picked up the majority of APN’s remaining customers and, as part of the agreement, acquired a press and finishing equipment, which have been installed at our new site in Auckland.
Our Christchurch plant was fortunate not to be damaged by the earthquake, although our staff were affected, including many who lost their houses. Like all local companies, we have en-deavoured to look after these individuals and provide ongoing support.
Despite the soft retail market, letterbox distribu-tion had a record year in terms of both volume and
profit, with volumes driven by New Zealand’s GST change in October 2010, the Auckland city coun-cil elections and continued strong support for the catalogue medium by large retailers.
By contrast, magazine distribution remained challenging, impacted by the ongoing lack of consumer discretionary spending and competi-tive pressures reducing margins. Digital maga-zines fared better, with significant growth in the take up of product from our Zinio platform. We expect this to continue in the coming year, and see future gains from the addition of New Zea-land magazines as a client from July 2011.
Our sheetfed operations went through a big year of change, including integrating with heatset in the South Island, which was completed in June 2011. Local trading was impacted by the earthquakes, with volumes slightly down on the previous year. In the North Island, sheetfed set up a new site, concluded an acquisition and integrated the resulting new equipment in the new site, setting it up well for fiscal 2012. Given the market was down 20-30%, flat volumes reflected a satisfactory result for this business.
Looking ahead, PMP’s New Zealand business will continue to contend with uncertain external fac-tors, including: the state of the local economy; a hopefully positive impact from the Rugby World Cup; the result of the coming national election; and the speed of Christchurch’s recovery. Gener-ally, we are not expecting many benefits from the trading environment – with all gains likely to be driven by our own continued transformation.
OPERATION REPORTS cont inued…
Although our Christchurch Plant weathered the recent earthquake, many of our staff were affected. Like most local businesses, we have endeavoured to look after these individuals and provide ongoing support.
310720_PMPAR2011_1-29.indd 14 13/9/11 3:16:51 PM
OPERATION REPORTS cont inued… PEOPLE AND CULTURE
Providing a safe work environment and safe systems of work
Safety is PMP’s number one value. PMP strives to ensure that everyone working on or visiting PMP sites is protected by a safe working envi-ronment and safe system of work.
During the year, we continued to make strong overall progress towards our goal of Zero Harm. Not withstanding this, the Lost Time Injury Frequency Rate increased slightly from 7.1 to 7.7. The target set for management remains unaltered from last year and was not met.
In spite of all the good work done in safety, unfortunately a fatal accident occurred at our Magazine Distribution Centre in Sydney, where a transport contractor died as a result of injuries sustained as a consequence of a traffic accident with another contractor. Such a devastating event rests heavily with the company and our sincere condolences are with the family. As a result the site Safety
Management System for contractors, including traffic management, was reviewed and updated.
Also, the overall PMP Safety Manage-ment System was reviewed, updated and implemented on all other PMP sites. Following internal audits, all PMP Print sites are working towards addressing the recommendations of the auditor.
New OHS performance measures were introduced through the Health and Safety Business Operation Plan (HSBOP). The HSBOP focuses on positive and proactive indicators, such as safety walks, inspections, hazards identification and risk assessments, rather than just negative lag indicators.
The OH&S program was enhanced by an inspection process, which involves employees in hazard identification and risk management processes. In 2010/11 all our site Occupational Health and Safety (OHS) Committee and the senior managers conducted audits every month. These leaders are encouraged to provide positive feedback about safety practices that are working well and identify opportunities for improvement when they visit PMP operation sites.
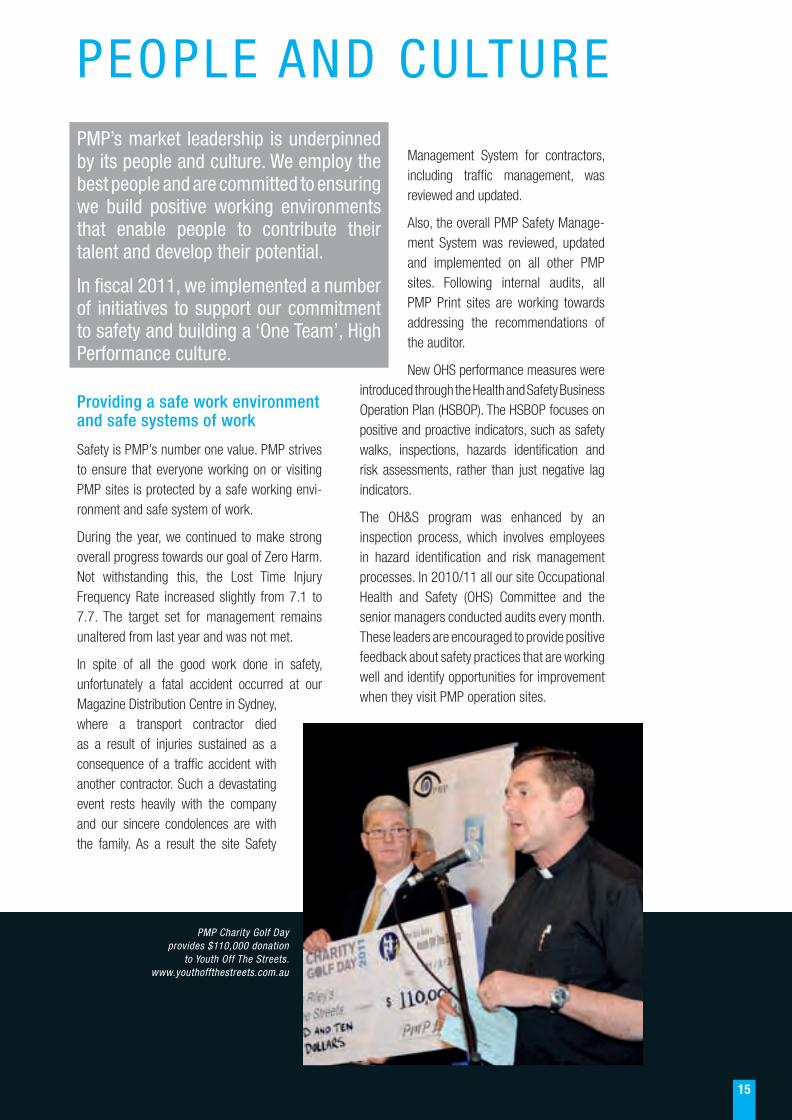
PMP Charity Golf Day provides $110,000 donation
to Youth Off The Streets.www.youthoffthestreets.com.au
15
PMP’s market leadership is underpinned by its people and culture. We employ the best people and are committed to ensuring we build positive working environments that enable people to contribute their talent and develop their potential.
In fiscal 2011, we implemented a number of initiatives to support our commitment to safety and building a ‘One Team’, High Performance culture.
310720_PMPAR2011_1-29.indd 15 9/9/11 7:19:50 AM

16
PEOPLE AND CULTURE cont inued…
The profile of OHS was raised throughout the organisation by making the entire safety manage-ment system accessible via the PMP intranet.
During the year, operational risk assessments for all our Print sites were conducted, assessing com-pliance, risk minimisation and maintaining a focus on safety. The company also improved its near miss and hazard reporting, with the implementa-tion of an online incident and injury reporting system. This system has helped sites to identify and respond to safety risks.
Encouraging health and well-beingIn December 2010, we launched the ‘Live Well’ program to assist employees with their overall health and well-being. The program provides our people with the opportunity to:
•Improvetheirknowledgeandawareness of their current health and well-being;
•Makeinformedchoicesrelatingtotheirlifestyle; and
•Receiveon-goingsupporttoachievetheirhealth and well-being goals.
To enable ongoing access to relevant health and wellness information and to promote staff conversations around health, a customised health portal was introduced. This facility is strongly promoted to all staff and can be accessed by family members at home, extending the reach of the Live Well program beyond the confines of the work environment.
Anecdotal evidence suggests the PMP Live Well program has boosted employees morale and provided a more supportive and positive work environment overall.
Recognising Long ServiceOur 25 Year Club membership of 172 employees represents our diverse workforce and talent across the entire Australian and New Zealand business. They hold a special place in the company and are looked to as stewards of knowledge and experience who can add special support to all employees as PMP implements a new growth strategy and expands its capabilities into new business opportunities.
PMP’s ‘Hall of Fame’ title holders continue to be held by John Bermingham from the pre-press area in our Directories business in Australia with 51 years service and Eric Parker from our Maxum business in New Zealand, with 46 years service.
Building a High Performance CultureIn fiscal 2011 the Australian business implemented the first full business cycle using the Team Connect performance management system. This tool enables people to agree their yearly objectives in alignment with the strategy and have the opportunity to create their development plan with their manager.
Two premier Chief Executive Officer Awards
were launched to recognise employees’ efforts
in applying our company Values. The number
and quality of the nominations received re-
flected the depth of talent and capability within
our business. These awards also assisted our
people to raise their awareness that our Values
and culture are influenced by each and every
individual and that all of their contributions
have the potential for having positive, lasting
impacts on each other and the business.
The Chief Executive Officer ‘OH&S Individual
Achievement’ Award is the pinnacle of recogni-
tion for efforts in Safety and complements the
significant range of programs which encourage
and reward the right safety culture. The 2010
award was presented to an employee who in-
dependently initiated an approach which will
improve hearing protection and awareness for
all colleagues working in press-rooms.
The Chief Executive Officer ‘One Team’
Award is the highest recognition in PMP for
a team who apply all of the Values (Safety,
Leadership,Reliability,Honesty,Teamworkand
Professionalism) and deliver an outstanding
outcome in their team-effort. A maintenance
team from our Clayton print operations were
the 2010 winners with their innovative engi-
neering solution to replacing ink ducts in a
more safe, efficient and effective manner. Their
RECOGNISING PEOPLE WHO LIVE OUR VALUES
310720_PMPAR2011_1-29.indd 16 9/9/11 7:20:08 AM

PEOPLE AND CULTURE cont inued…
A positive working environmentTo maintain positive working environments, our Fair Workplace and Grievance Management Policies were reviewed, reaffirming our commitment to equal opportunities and fair process for addressing complaints. In addition, a Contact Officer network was established to provide a resource to employees requiring information or assistance in addressing difficult work issues.
Supporting a diverse workforcePMP’s leadership in the market and growth agenda depends on our ability to truly harness diversity. Ensuring PMP has inclusive working environments that encourage each individual’s ideas and contributions will help the company to achieve its potential for the benefit of our people, and all stakeholders of PMP.
In 2010/11 a Diversity Executive Committee was formed to oversee the introduction of diversity policies and initiatives. PMP will continue to provide opportunities for all employees to reach their potential and be included in the life of our business.
innovation has proven to be ground-breaking
in the industry.
Our New Zealand winners drew on our
significant cross-Tasman talent to develop an
impressive, end-to-end market offering for a
significant customer and in doing so devel-
oped a model for future offerings. This cross-
functional team collaborated with a One-Team
spirit with a keen interest on drawing on what
only we can offer the market.
Left to right: PMP CEO Richard Allely, Australian ‘One Team’ Award winners 2010
and the Hon. John Brown, AO.
17
310720_PMPAR2011_1-29.indd 17 6/9/11 4:21:59 PM

18
PRODUCTS & SERVICES
PRODUCTS AND SERVICES• Magazines
• Catalogues
• Directories
• Books
• Financial documents
• Corporate documents
• Government material
• Newspapers
• Digital printing
• Catalogues 4U
MARKET• Corporate
• Financial services
• Government
• International & local book publishers
• Marketing, advertising & media buying agencies
• Newspaper, magazine & directory publishers
• Retail
OVERVIEW• The market leader with
plants across Australia and New Zealand
PRODUCTS AND SERVICES• Targeted delivery
• Addressed delivery
• Newspaper delivery
• Product sample delivery
MARKET• Advertising agencies
& media buyers
• Corporate
• Direct marketing
• Fast moving consumer goods
• Government
• Mail houses
• Manufacturers
• Newspapers & magazine publishers
• Retail
OVERVIEW• One of the two market leaders in
nationwide letterbox distribution
PRODUCTS AND SERVICES• Market knowledge & experience
• Established retail relationships
• Sales & market analysis
• National merchandising solutions
• Range & display management
• Distribution solutions to multiple retail channels including newsagents, grocery chain, petrol /convenience and specialty outlets
• Online: www.treeet.com.au
• Distribution of digital magazines.
MARKET• Mail house (NZ)
• Domestic publishers
• International publishers
• Diverse product clients
OVERVIEW• The largest independent
distributor of magazines and books in Australia and New Zealand
PRINTMAGAZINE AND BOOK DISTRIBUTION
LETTERBOX DISTRIBUTION
310720_PMPAR2011_1-29.indd 18 6/9/11 4:22:56 PM

19
Products and services• Magazine, catalogue
& sheetfed printing
• Digital and variable data printing, plastic wrapping and mailhouse services
• Letterbox delivery
• Targeted letterbox delivery
• Newspaper home delivery
• Product sample delivery
• Magazine merchandising solutions
• Magazine channel management
• Magazine subscriptions management
• Customer insights and analytics
• Customer acquisition
Market• Retail
• Advertising agencies
• Local magazine and newspaper publishers
• Fast Moving Consumer Goods
• Utilities
• Financial Services
• Real Estate Agents
overview• The only printer/distributor
with integrated operations
• The only printer with North and South Island heatset operations
• The only independent magazine distributor
• One of Australasia’s largest lifestyle and demographic data sources
Products and services• Direct marketing list sale
and rental
• Database Services
• BrandLeaders – lifestyle insights
• Geodemographic data and solutions
• CRM and loyalty strategies
Market• Direct marketing
• Telecommunications
• Utilities
• Financial Services
• Fundraising
• Retail
• Publishing
• Government
• Fast Moving Consumer Goods
overview• Strategic insights from
transactional and customer information, which optimise customer value and profitability
• Intelligent micromarketing solutions to improve clients’ marketing effectiveness
• Australia and NZ’s leading consumer database marketing services and consumer data
• One of Australasia’s largest lifestyle and demographic data sources
Products and servicesPMP diGitaL• Premedia services
• Digital Asset management
• Image Libraries
• Managed onsite studios
• Consulting & professional services
• Marketing Automation
diMension studios• Photographic Services
• Creative Services
Market• Retail
• Advertising Agencies
• Fast Moving Consumer Goods
• Government
• Corporate
• Packaging
• Publishers
overview• Market leader in premedia solutions
• Deliver competitive edge to organisations by providing premedia workflows that automate production for advertising, marketing, communications, images and media
• Australasia’s largest photography studios
• Combines project management and creative services for exchange-to-exchange advertising and marketing media.
• Coverage across Australia & New Zealand
new ZeaLand
PMP diGitaL and diMension studios
MarketinG services
310720_PMPAR2011_1-29.indd 19 9/9/11 7:21:33 AM

20
DIRECTORS’ B IOGRAPHIES
Mr Reaney’s business experience
spans more than 30 years during
which time he has held a number
of senior corporate appointments,
including Managing Director of National
Foods Limited and Managing Director
and Operations Director of Industrial
Equity Limited.
Mr Reaney is also a Director of
Westpac Banking Corporation and
Holcim Australia Pty Ltd.
Mr Reaney was a Director of St. George
Bank Ltd 1996 to 2008, and AGL
Energy Limited from 2006 to 2009.
Mr Allely has been Chief Executive
Officer of PMP Limited since the start of
April 2009. Prior to this appointment Mr
Allely was Chief Financial Officer
(appointed in 2002).
Mr Allely has over 30 years experience
in senior management roles with leading
companies, including Tenix Pty Limited
(formerly Transfield Pty Limited), John
Fairfax Holdings Limited, Boral Limited,
James Hardie Industries Limited and
Fanner PLP Pty Limited.
Previously, Mr Allely held an advisory
position with the Workcover Authority
of NSW – Audit Committee. Mr Allely
is an Independent Director on the Board
of the Professional Golfers Association
(PGA) of Australia Limited.
Mr George is an experienced Executive
and Non-Executive Director with an
extensive background in
telecommunications, media and
corporate finance including four years
on the Board of Australia’s second
largest telecommunications carrier,
Optus Communications.
Mr George is currently also a Non-
Executive Director of Asciano Limited.
He was also Executive Director, Strategy
and Policy Development Cable and
Wireless Optus Ltd from 1998 to 2001,
and the Executive Chairman of Nylex
Limited 2006 to 2008.
Graham J Reaney B Com, CPA
Chairman
Appointed 13.09.02
Age 68
Richard Allely DipCM, MBA, FCPA, FCIS, FAICD
CEO and Managing Director
Appointed 07.04.09
Age 57
Peter George B Com, LLB
Non-Executive Director
Appointed 19.12.02
Age 58
310720_PMPAR2011_1-29.indd 20 6/9/11 4:25:22 PM

21
Ms Sparks has a background in strategic
consulting, pharmaceutical marketing,
and over 20 years experience in the
advertising industry. She has held senior
positions in leading agencies in Australia
and UK, her most recent being
Managing Director of M&C Saatchi.
She is currently a professional
non-executive director and brand/
corporate reputation consultant.
Ms Sparks is currently a Director of
Blackmores Ltd, Director of Sydney
Dance Company and is also consulting
as Managing Director to IdeaWorks, a
division of Y&R Brands, Australia.
Mr Fraser qualified as an accountant
but gained significant operational
experience in positions such as MD
of Pioneer Sugar Mills Limited, MD
Clyde Industries Limited, MD Australia
Chemical Holdings Limited and MD
TNT Australia Pty Limited.
Mr Fraser also has substantial
international experience having worked
and lived in South East Asia and the
United States.
He is currently a Non-Executive Director
of Forest Place Group Limited, Structural
Systems Limited and Legend
Corporation Limited.
Mr Fraser was previously a Director of
Lighting Corporation Limited 2006 to
2008 and Nylex Limited 2007 to 2008.
Mr Fraser is chair of the Audit and Risk
Committee of the Board.
Mr Bickford-Smith was CEO of Ridley
Corporation Limited until December
2007. He was previously with the
Man Group and was MD of the
Australian operations.
Before moving to Australia Mr
Bickford-Smith was based in Hong Kong
with responsibility for managing risk
relating to the Man Group’s sugar
business within the region. Before moving
to the Man Group he spent five years with
Phibro the commodity trading arm of
Salomon Brothers.
Mr Bickford-Smith is a Director of Eastern
Agricultural Australia, Lanyon Asset
Management Pty Ltd and The Julian
Burton Burns Trust.
Mr Bickford-Smith was previously a
Director of Reclaim Industries Limited
2008 to 2009.
Mr Bickford-Smith is chair of the
Appointment and Compensation
Committee of the Board.
Ian L Fraser FCPA, FAICD
Non-Executive Director
Appointed 04.04.03
Age 66
Naseema Sparks BPharm, MPharm (Pharmacol), MBA, GAICD
Non-Executive Director
Appointed 17.08.10
Age 58
Goh Sik Ngee B Eng(Hons), MSc, EMSF, BBM, PBM, PPA(P)
Non-Executive Director
Appointed 17.08.10
Age 58
Matthew Bickford-Smith
Non-Executive Director
Appointed 20.07.09
Age 51
Mr Goh Sik Ngee was appointed Chief
Executive Officer of Times Publishing
Group on 1 July 2010. He is a member
of the Board of Fung Choi Media Group
Ltd, a listed company on the Singapore
Stock Exchange (“SGX”).
Mr Goh has 35 years of varied
experience, including publishing, retail
and education. He held appointments at
the helm of a number of organisations
which included CEO of Yellow Pages
(Singapore) Limited, a listed company on
the SGX, and CEO of MediaCorp
Publishing Pte Ltd.
He started his career with the Ministry of
Defence with the last appointment as
Director of Manpower. He has been
awarded several honours by the
President of the Republic of Singapore in
recognition of his contributions in
Community Service and Civil Service.
310720_PMPAR2011_1-29.indd 21 9/9/11 7:23:48 AM

22
OverviewPMP’s corporate governance is based on the belief that the creation of value is intrinsically linked with good governance practices.
The core principles of good corporate governance that PMP has based the Corporate Governance Framework on are:
• Ethicalbusinessconduct;
• Responsiblemanagementandremuneration;
• Soundfinancialreportingandriskmanagement;and
• Appropriatecommunicationanddisclosure.
PMP’s corporate governance framework is designed and implemented to ensure compliance with best practice recommendationssetbytheASXCorporateGovernanceCouncilasupdatedinAugust2007.
Ethical Business Conduct Code of Conduct* The Code of Conduct is PMP’s cornerstone corporate governance policy. The Code of Conduct provides a consistent understanding of the expected behaviour towards each stakeholder. It stipulates that:
• PMPistoconductitsbusinesswithhonesty,integrityandrespectfor the interests of its stakeholders.
• PMPemployeeswillavoidanypersonal,financialorotherrealor apparent conflicts of interest that could compromise the performance of their duties.
• PMPwillcontinuallystrivetobeagoodcorporatecitizen,includingcomplyingwithlawsandregulationsofAustraliaandNew Zealand and in each state and territory in which it operates.
• PMPemployeeswillensurethatresourcesofPMPareusedfortheir intended use.
• PMPistorespecttheprivacyofprivateinformation,includingcustomer,businesspartnerandfellowemployeeinformation.
• PMPistocontinuallystrivetoprovideasafeandhealthyworkenvironment for all employees.
• PMPistorecogniseandactuponitsresponsibilitytolimitnegative impacts on the environment and the communities within which it operates.
• PMPistoensurethatthereisaclearcommunicationprocessformaterial items of concern between employees and the Board via open and non-hierarchical communications including whistle-blower provisions that:
-encourageemployeestoreport,ingoodfaith,anyviolationsofthestandards,requirementsandexpectationsdescribedintheCodeofConduct,and
-requireappropriateactionbetakeninresponsetoanysuchviolations,and
-requirethatwhereanemployeereports,ingoodfaith,anactualorsuspectedviolationofthisCodeofConduct,thepositionofthereportingofficerwillbeprotectedandremainconfidentialunlessdisclosureisrequiredbylaw.
Director and Executive Share Purchasing Policy*Underitssharepurchasingpolicy,PMPDirectorsandExecutivesarepermitted to buy and sell shares in the company during a period of one month,commencingtwenty-fourhoursaftertheinterimandfinalprofitannouncements and the annual general meeting provided they are not awareofanypricesensitiveinformation.Atallothertimestheseofficersare not permitted to buy and sell shares in the company.
Responsible Management and Remuneration Board Charter* Directorsareselectedtoachieveabroadrangeofskills,experienceandexpertisecomplimentarytotheGroup’sactivities.DetailsofindividualDirectorsareincludedonpages20-21.TheBoardcomprisessevenDirectors,being;theNon-ExecutiveChairman,theChiefExecutiveOfficerandfiveotherNon-ExecutiveDirectors.
TherolesofChairmanandChiefExecutiveOfficerarenotexercisedby the same individual.
PMP’sBoardChartersetsouttherole,responsibilitiesandpowersoftheBoardofDirectors.Thecompany’sBoardisresponsiblefor:
• Overseeingthecompany,includingreviewing,ratifyingandmonitoringsystemsofriskmanagement,internalcontrol,codeofconductandlegalcompliance,thataredesignedtoensurecompliancewithregulatoryandprudentialrequirements;
• AppointingandremovingtheChiefExecutiveOfficerandratifyingtheappointmentand,whereappropriate,theremovaloftheChiefFinancialOfficerandtheCompanySecretary;
• Providinginputintoandfinalapprovalofmanagement’sdevelopmentofcorporatestrategyandperformanceobjectives;
• MonitoringperformanceagainstBoardapprovedobjectives,targetsandstrategies;
• SuccessionplanningfortheChiefExecutiveOfficerandseniorexecutives;
• Approvingtheprogressofmajorcapitalexpenditure,capitalmanagement,acquisitionsanddivestitures;
• Approvingandmonitoringfinancialandotherreporting;and
• Approvingdelegatedauthoritylimitsforseniorexecutives.
TheCharterrequiresthatPMP’sBoardmustconsistofamajorityofindependentNon-ExecutiveDirectorswhohaveabroadrangeof commercial expertise and experience and/or appropriate professionalqualifications.Theymustalsodemonstrateaprovenability and capacity to monitor company performance and participate in strategy development. The Board regularly assesses the independenceofeachDirectorwithregardtointerestsdisclosedbythem.UndertheCharter,DirectorsareencouragedtoownsharesinPMP,however,thereisaminimumshareholdingrequirementforindependentNon-ExecutiveDirectorsof100,000shares,whichmaybe obtained over a two year period.
CORPORATE GOVERNANCE
310720_PMPAR2011_1-29.indd 22 9/9/11 7:24:02 AM

23
Access to Information and Advice The Charter provides for Directors to have access to all relevant information and employees within PMP. It also gives them authority to seek independent professional or legal advice, from a firm of their choice at PMP’s expense, on any matter before the Board or any other matter affecting their duties as a Director, conditional only on the Chairman’s approval.
Board Performance Evaluation The Appointment and Compensation Committee is responsible for, amongst other things, evaluating the performance of the Board and individual Directors.
Board Independence When determining the independent status of a Director the Board considers whether the Director:
• Isasubstantialshareholderofthecompanyoranofficerof,orotherwise associated directly with, a substantial shareholder of the company;
• Isemployed,orhaspreviouslybeenemployedinanexecutivecapacity by the company or another group member, and there has not been a period of at least three years between ceasing such employment and serving on the Board;
• Haswithinthelastthreeyearsbeenaprincipalofamaterialprofessional adviser or a material consultant to the company or another Group member, or an employee materially associated with the service provided;
• Isamaterialsupplierorcustomerofthecompanyorothergroupmember, or an officer of or otherwise associated directly or indirectly with a material supplier or customer; or
• Hasamaterialcontractualrelationshipwiththecompanyoranother group member other than as a Director.
All Non-Executive Directors of PMP are considered independent with the exception of:
• GohSikNgee,whoisdirectlyassociatedwithFraser&NeaveLtd,a substantial shareholder of the company.
• PeterGeorge,whotemporarilyfilledtheroleasExecutiveGeneralManagerPrintAustraliaduringFY10.Mr.Georgecontinuestoprovide consulting services to PMP Print.
Sound Financial Reporting and Risk Management Risk Oversight and Management of Material RisksPMP views risk management as a continuous process and a fundamental driver of effective corporate governance and value generation.
PMP’s policy is to apply a common framework across all businesses to identify material risks and implement appropriate mitigation processes. To this end, PMP maintains a Risk Management Frameworkthatprovidesaconsistentandsystematicviewofthe risks faced by the company. The risk identification, analysis, treatment and monitoring procedures follow Risk Management StandardISO:31000andPrinciple7oftheASXCorporateGovernance Principles and Recommendations
The Board has responsibility for the design and implementation of an effective system of risk management and internal control. The Audit and Risk Management Committee provides assistance to the Board by reviewing, assessing and making recommendations in relation
totheRiskManagementFramework,supportingsystemsandtheinternal control structure.
Management,throughtheChiefExecutiveOfficer,isresponsiblefordesigning, implementing and reporting on the adequacy of PMP’s risk management and internal control system.
Management, with the assistance of the Group Risk and Assurance Manager, reports to the Audit and Risk Management Committee on the company’s key risks and the extent to which it believes these risks are being managed. This is performed on a quarterly basis or more frequently as required by the Board or relevant subcommittee.
The Audit and Risk Management Committee receives biannual assurance, or more frequently as required, that the system of risk management and internal control are sound and operating effectively through reports presented to the Audit and Risk Management Committee, including management representations and Internal Audit.
Risk Management Framework SummaryA standardised approach to risk assessment is used across the group to ensure that risks are consistently assessed and reported to an appropriate level of management, and to the Board if required.
Risks are reviewed at least annually by all operating divisions as part of the annual strategic planning, business planning, forecasting and budgeting process. Divisional risk profiles are also reviewed as part of the quarterly due diligence process within these divisions, with a positive assurance being provided by executive management that their risk profiles are complete, accurate and current.
Significantbusinessrisksarerequiredtobeownedbyamemberof the Executive Management Team. These risks are specifically reported on at each of the four scheduled Audit and Risk Management Committee meetings. Executive Management Team members may be required to attend these meetings to assist the Audit and Risk Management Committee assess the risks and management’s planned response to these.
Management committees also meet regularly to deal with specific areasofrisksuchasOccupational,HealthandSafety(OHS)risk.
The Audit and Risk Management Committee also receives reports on thestatusoftheimplementationoftheRiskManagementStrategyand supporting framework.
Delegation of Authority Policy*PMP’s Delegation of Authority Policy aims to ensure transparency in decision making and protect individuals and the company from any suggestion of impropriety. It requires managers to confer up the management chain when making significant decisions and prevents conflicts of interest from interfering with termination or hiring decisions. The Policy also prevents any contract or arrangement being authorised, or approved by delegation, by any employee with a conflict of interest.
Management RepresentationDetailed and comprehensive questionnaires are completed by all business units and functional management on a six monthly basis. These questionnaires include managements’ assessment of risk management, financial reporting and the internal control environment operating within each business unit. The questionnaires are reviewed by executive management and external audit as part of the half-yearly reporting to the market and to achieve compliance withsection295AoftheCorporationsActandRecommendation7.3oftheASXCorporateGovernanceCouncil’sCorporateGovernancePrinciples and Recommendations.
310720_PMPAR2011_1-29.indd 23 9/9/11 7:24:19 AM

24
Based on the questionnaires, the Board receives written assurance from the Chief Executive Officer and the Chief Financial Officer that, to the best of their knowledge and belief, the declaration provided to them is founded on a sound system of risk management and internal control and that the system is operating effectively in relation to financial reporting risks. The assurance provided is reasonable rather than absolute as it is based on judgment, the use of sample testing, the inherent limitations in internal control and much of the evidence is persuasive rather than conclusive.
Internal AuditThe internal audit function conducts a series of risk-based reviews based on a plan agreed with management and the Audit and Risk Management Committee. In order to ensure the independence of the internal audit function, the Audit and Risk Management Committee review and endorse the planned internal audit activities. The Risk Management and Internal Audit Frameworks are independently reviewed to provide assurance as to the adequacy of the framework. Such assurance was provided by an internal audit conducted by PKF Chartered Accountants and Business Advisors, with no adverse findings being identified.
Inherent Operational RisksThe company believes there are a number of operational risks which are inherent in the industry in which it operates. These include:
• Strainedeconomicenvironment;
• Relianceoncontinuityofsupplyfromutilities(electricityandgas);
• Relianceoncontinuityofsupplyofrawmaterialinputs (e.g.paperandink).
• Fluctuationsindemandvolume;and
• Changingoperatingandmarketenvironments.
These risks are provided to assist stakeholders understand better the nature of risks faced by PMP and the industry in which it operates. It is not necessarily an exhaustive list.
Audit and Risk Management Committee*#The Audit and Risk Management Committee provides assistance to the Board in relation to its corporate governance and oversight responsibilities by reviewing, assessing and making recommendations in relation to:
• EthicalconsiderationsandcompliancewiththeCodeofConduct;
• Financialreporting;
• Internalcontrolstructure;
• Riskmanagementframeworkandsystems;
• Policiestoreduceexposuretofraud;
• Health,safetyandtheenvironment;and
• Internalandexternalauditfunctions.
Under its Charter, the Audit and Risk Management Committee consists of at least three Non-Executive Directors, a majority of whom are required to be independent. The Committee must include memberswhoarefinanciallyliterate;atleastonemembershallhaverelevantqualificationsandexperience(qualifiedaccountantorotherfinancial professional with experience of financial and accounting matters);andsomemembersshallhaveanunderstandingofthe industry in which PMP operates. The Chairman must be an independent Non-Executive Director who is not the Chairman of the Board.ThecurrentmembersareIanFraser(Chairman),MatthewBickford-Smith and Goh Sik Ngee.
The Audit and Risk Management Committee has direct and unlimited access to the external auditors. The external auditor and the Group Risk and Assurance Manager have direct and unlimited access to the Audit and Risk Management Committee.
Committee member** Meetings attended (out of 5)
ILFraser(Chairman) 5(outofapossible5)
Goh S N 4(outofapossible4)
M Bickford-Smith 5(outofapossible5)
Ng J S 1(outofapossible1)
Appointment and Compensation Committee*# The ASX Corporate Governance Council has amended the commentary in relation to diversity and the Board and Executive Management selection process.
Via the Appointment and Compensation Committee, the Board engages the services of an external agency to locate suitable candidates for appointment as a Director. The brief is based on the strategic direction of the business and seeks to appoint Directors from as broad a pool of candidates as possible and to incorporate diversity protocols within the brief.
Theselectionprocesstakesgenderdiversityintoaccount(inadditionto previous Board and leadership experience, candidates’ skills and experienceinavarietyofspecifiedfields)tofitandenhancetheBoard skills matrix.
The Board must be satisfied that the recruitment and selection process was thorough in its sourcing of female candidates and their assessment and that there are objective reasons to support its decisions.
Refer to the Remuneration report for further detail on the role of the Appointment and Compensation Committee.
Committee member** Meetings attended (out of 4)
MBickford-Smith(Chairman) 4(outofapossible4)
N Sparks 4(outofapossible4)
*# The record of attendance for all Board Meetings and Board Committees, are included in the Directors’ Report – page 30 ‘Directors Meetings’.
** The qualifications of Committee members are included in their Director biographies on pages 20-21.
Appropriate Communication and Disclosure PMP recognises the importance of open and effective communication with all stakeholders. Therefore, PMP requires its officers and employees to act at all times with integrity and in accordance with the law, including the disclosure requirements of the ASX Listing Rules, ASX Guidance Notes, the ASX Corporate Governance Council Recommendations and the Corporations Act. During the 2011 financial year, PMP had a Disclosure Committee comprising the Chief Executive Officer, Chief Financial Officer and Company Secretary, which met as and when required.
External auditor independencePMP firmly believes that the external auditor must be, and must be seen to be, independent. The external auditor confirms its independence in relation to the 31 December and 30 June financial reports and the audit committee confirms this by separate enquiry.
310720_PMPAR2011_1-29.indd 24 9/9/11 7:24:40 AM

25
Disclosure and Shareholder Communication Policy* PMP’s Disclosure Policy requires any price sensitive information concerning PMP to be disclosed to the market and to be communicated to the ASX before any other person. The policy prevents selective disclosure by: ensuring only authorised spokespeople comment on behalf of PMP; providing a process for issuing any external statement or press release that has been previously channelled through the Chief Executive Officer.
It also sets out protocols for handling trading halts, responding to market speculation and avoiding inadvertent disclosure. The Policy ensures shareholders can make informed decisions about their investment in PMP by providing them with:
• Theannualandhalfyearreports;
• DisclosuresmadetoASX;
• NoticesandexplanatorymemorandaofGeneralMeetings;
• TheAGM,wheretheexternalauditorwillbeavailabletoanswerquestions about the audit;
• OccasionallettersfromtheChairman;and
• Itswebsitewww.pmplimited.com.au.
DiversityOur leadership position in the marketing and print media industry is dependent on our ability to nurture workforce diversity, drawing on a broad range of perspectives, experience and talent.
PMP will strive to provide industry leadership for workforce diversity by implementing the following strategic objectives, as measured by the operational objectives set out in PMPs Workplace Diversity Policy:
• integratingdiversityprinciplesinallaspectsofhumanresourcesmanagement policies such as recruitment, selection and training
• consideringoptionstoenableflexibleworkingpractices
• conductingpayequityreviews
• facilitatingequalemploymentopportunitiesbasedonmerit,and
• strivingtobuildsafeworkingenvironmentsbytakingactionagainst inappropriate workplace and business behaviour that does not value diversity including discrimination, harassment, bullying, victimisation and vilification.
Our managers will be trained on how to create inclusive working environments, to understand the benefits of workforce diversity and their role in administering people management policies in the spirit of our ‘One Team, High Performance’ culture. Our intention is to ensure that our working environments are conducive to collaboration and where diversity is not a barrier to career success in PMP.
We will address impediments to achieving gender diversity and meet or exceed relevant industry benchmarks.
Whilst the key focus for FY2012 is gender diversity PMP recognises that other forms of diversity are also important and will seek to promote a broader range of diversity initiatives.
PMP’s Gender Profile As a diverse business PMP employs a broad range of occupational groups to staff its creative, analytic, print and distribution businesses. Consequently we seek to attract talent from different labour markets, tradesandprofessions.Ourcurrentgenderprofilereflectsourreliance on trades and engineering for our print business and the associated lack of gender balance in that sector.
June 2011 – Australia – Gender Participation
Board of Directors 14%
PMP Executive Management Team 10%
PMPGroupEmployees(Australia) 28%
Compliance NotesThe Chief Executive Officer and Chief Finance Officer assured the Board that:
• Theconsolidatedentity’sfinancialreportspresentatrueandfairview, in all material respects, of the company’s financial condition and operating results and are in accordance with relevant accounting standards and the Corporations Act 2001 and are founded on a sound system of risk management and internal compliance and control which implements the policies adopted by the Board.
• Thefinancialrecordsofthelistedentityfortheyearhavebeenproperly maintained in accordance with section 286 of the Corporations Act 2001.
• Thecompany’sriskmanagementandinternalcomplianceandcontrol system is operating efficiently and effectively in all aspects.
• Thegroup-wideriskmanagementstrategy,implementationplanand supporting processes have been developed and reviewed by the Audit and Risk Management Committee. Management’s actions to embed and continuously improve the risk management processesareon-going.
• Basedontheoutcomesoftheriskreviewprocessasatyearend and representations from line management, it appears that there are no significant risks that are likely to result in a material misstatement to the financial statements.
• ManagementhascontinuedtocloselymonitorthesystemofbudgetingandforecastingacrosstheGroupwiththeintentionofmitigating any future exposure.
• Theabovedeclarationsandstatementsaremadetothebestoftheir knowledge and belief based on enquiries during the year and on a review of the Financial Statement Due Diligence Compliance Packages, completed by line management.
TheASXCorporateGovernanceCouncil’sCorporateGovernancePrinciples and Recommendations recommend the establishment ofaNominationsCommitteeandaRemunerationCommittee.PMPcombines the roles and responsibilities of these committees in its Appointment and Compensation Committee. The ASX Corporate GovernanceprinciplesandRecommendationssuggestthattheRemuneration Committee should be structured so that it has at least three members. PMP’s Appointment and Compensation Committee currently has two members, however the Chairman of the Board attended all meetings held during the year.
* Summaries of these documents are publicly available in the CorporateGovernancesectionofthePMPLimitedwebsite: www.pmplimited.com.au
310720_PMPAR2011_1-29.indd 25 9/9/11 7:24:56 AM

ReportingPlatform
Energy, Emissions and WaterFootprint
Supply Chain and
Procurement
Renewable Energy and
Carbon Offsets
Information Technology Initiatives
Targets
Customer Programmes
Industry Engagement and Research
Environmental Reporting
Recycling
Environmental Accreditation
26
Our VisionPMP strives to be a sustainable business which meets our responsibilities to the environment through long-term objectives of reducing emissions, preventing pollution, minimising waste and conserving and renewing natural resources.
We will achieve these goals by applying the “four R’s” principle in all areas of our operations – reduce, reuse, recycle and replenish.
With growing customer, employee, government and public awareness on environmental issues, PMP acknowledges its responsibility to remain transparent on the current and emerging exposures that the company faces. PMP have identified the key risks and opportunities and have devised strategic programmes in response to these exposures.
Data and information for this report has been compiled with reference to the GRI Sustainability Reporting Guidelines G3.1.
Key Risks•Paperpurchasing
•Electricityandnaturalgasconsumption
•Greenhouseemissionsarisingfromtheignitionofinkvapours
•Transportofrawmaterialsandfinishedproduct
Key Opportunities•Buildingoncostsavingsalreadyachievedingasbyfocusingon
improving electricity efficiency and productivity
•Transportsavingsduetomultisiteprinting
•Carbonsequestrationthroughimprovedforestry practises by suppliers
•Awiderproductofferingintheformof environmentally-driven products
SUSTAINABILITY AT PMP
The PMP sustainability tree was
created to formally convey the
initiatives and programmes
undertaken by PMP in response
to the current and emerging
environmental issues identified
within the reporting period.
PMP’s long term objective is to “grow” this tree as we seek to address
the environmental and sustainability issues relevant to our businesses.
The initiatives and programmes are represented by the branches of the
tree. The branch framework provides our stakeholders with a reference
point of our activities together with the progress, performance and
achievements resulting from these activities.
PMP SUSTAINABILITY TREE Energy andWater Efficiency Programmes
310720_PMPAR2011_1-29.indd 26 9/9/11 7:25:25 AM

27
PMP’s 12 Branch InitiativesPMP’s sustainability tree demonstrates the initiatives and programmes undertaken by PMP in response to the current and emerging environmental issues identified within the reporting period. Each initiative is represented by a new branch of the tree:
1. Reporting PlatformUnderpinning PMP’s sustainability activities is the recently-completed rollout of an online reporting tool which enables us to manage and report on environmental data at site, business unit and group level. The platform streamlines reporting and provides greater access to valuable information covering energy, water, waste and emissions to a wider range of employees. This information is used to monitor and track performance, reduce costs and inform business decisions.
2. Energy and Water Efficiency ProgrammesPMP has maintained its focus on energy and water efficiency during FY11 with the completion of projects and through sharing findings across sites. New technology including voltage optimisation and lighting has shown significant savings on one site and is been extended across the group. New pre-press technology is being trialled which will enable significant reductions in energy, water and chemical consumption.
PMP’s progress on energy efficiency has reduced costs for the business and minimised exposure to a future carbon pricing mechanism. Savings achieved through previous energy efficiency measures continue to be re-invested, with the 3 year energy efficiency plan containing a number of major projects.
3. Energy, Emissions and Water FootprintPMP’s energy, emissions and water footprint is presented below (energy and water have been included for the first time this year). All facilities under the operational control of PMP Limited and its subsidiaries have been included in this footprint. Australian energy and emissions figures have been audited by Banarra as part of PMP’s NGER reporting requirements.
Scope 1 emissions include combustion of natural gas, LPG, diesel, gasoline and heatset ink VOCs. Scope 2 emissions are those associated with the purchase of electricity from the grid.
Group FY11
Group FY10
Aus FY11
Aus FY10
NZ FY11
NZ FY10
Energy (TJ) 922 N/R 727 N/R 195 N/R
Scope 1 Emissions (ktCO2-e)
28 27 21 20 7 7
Scope 2 Emissions (ktCO2-e)
97 98 95 95 2 3
Water (ml) N/A N/R 106 106 N/A N/R
N/R: not reported
A breakdown of PMP’s emissions sources is given below.
Electricity
Natural Gas
Ink VOCs
LPG
Petrol/Diesel
4. Environmental AccreditationPMP is continuing its certification programme with Forest Stewardship Council (FSC) and Programme for the Endorsement of Forest Certification (PEFC). FSC and PEFC Chain-of-Custody accreditations are in place in all Australian states and at all New Zealand sites, except for the new Wiri site which will be certified once full construction is finalised.
Salisbury, Moorebank and Clayton have all achieved ISO14001 certification, while all NZ offset sites have environmental management systems which are currently working towards ISO certification.
5. Renewable Energy and Carbon OffsetsPMP’s renewable energy and carbon offset activities during FY11 include the following:
•Gordon&GotchAustraliapurchased50%GreenPower
•PMPLimitedretired1,500VerifiedEmissionReductioncertificates(equivalent to 1,500t CO
2-e)
•Allpetrolanddieselemissionswereoffsetbyplantingtreesthrough Greenfleet Australia
•ProductionofthisAnnualReportoffsetthroughVerifiedCarbonStandard (VCS) credits
6. RecyclingPMPrecyclesover99%ofthewastegeneratedintheprintingprocess, providing net revenue streams for the company. PMP has targets in place to reduce waste to landfill and paper waste. PMP is actively focused on reducing waste to landfill by improving our systems and auditing the supplier’s disposal process activities. PMP’s main recycling streams are paper, aluminium, cardboard, plastics, steel and timber.
7. Industry Engagement and ResearchPMP works with a number of industry bodies to develop research projects into the environmental sustainability of printed products. Current projects include the environmental impact of printed books vs e-books, print media vs digital media, recycling rates of catalogues, and a freight footprint optimisation tool.
PMP is a member of the following industry boards and associations:
•AustralianCataloguesAssociation
•PublishersNationalEnvironmentalBureau
•PrintIndustryWorkingGroup
•Paper–PartofEveryDay
•AustralasianPaperIndustryAssociation
310720_PMPAR2011_1-29.indd 27 6/9/11 4:27:46 PM
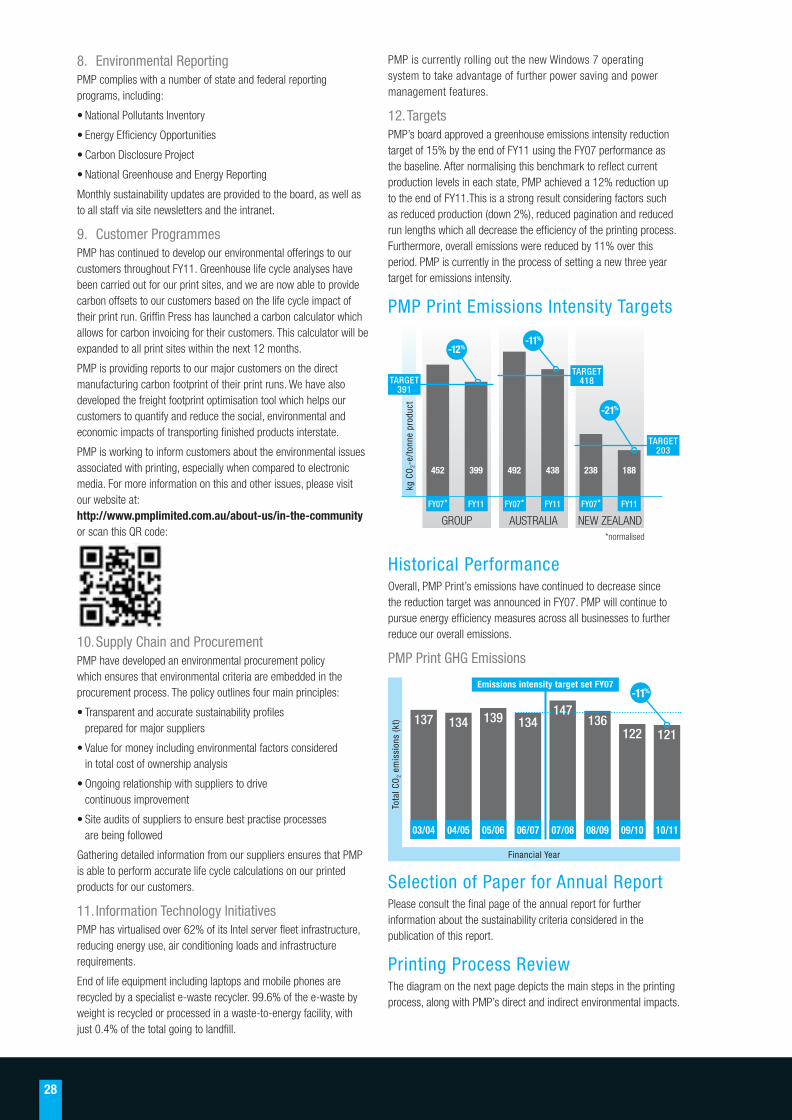
28
8. Environmental ReportingPMP complies with a number of state and federal reporting programs, including:
•NationalPollutantsInventory
•EnergyEfficiencyOpportunities
•CarbonDisclosureProject
•NationalGreenhouseandEnergyReporting
Monthlysustainabilityupdatesareprovidedtotheboard,aswellastoallstaffviasitenewslettersandtheintranet.
9. Customer ProgrammesPMPhascontinuedtodevelopourenvironmentalofferingstoourcustomersthroughoutFY11.Greenhouselifecycleanalyseshavebeencarriedoutforourprintsites,andwearenowabletoprovidecarbonoffsetstoourcustomersbasedonthelifecycleimpactoftheirprintrun.GriffinPresshaslaunchedacarboncalculatorwhichallowsforcarboninvoicingfortheircustomers.Thiscalculatorwillbeexpandedtoallprintsiteswithinthenext12months.
PMPisprovidingreportstoourmajorcustomersonthedirectmanufacturingcarbonfootprintoftheirprintruns.Wehavealsodevelopedthefreightfootprintoptimisationtoolwhichhelpsourcustomerstoquantifyandreducethesocial,environmentalandeconomicimpactsoftransportingfinishedproductsinterstate.
PMPisworkingtoinformcustomersabouttheenvironmentalissuesassociatedwithprinting,especiallywhencomparedtoelectronicmedia.Formoreinformationonthisandotherissues,pleasevisitour website at: http://www.pmplimited.com.au/about-us/in-the-community orscanthisQRcode:
10. Supply Chain and ProcurementPMPhavedevelopedanenvironmentalprocurementpolicywhichensuresthatenvironmentalcriteriaareembeddedintheprocurementprocess.Thepolicyoutlinesfourmainprinciples:
•Transparentandaccuratesustainabilityprofiles preparedformajorsuppliers
•Valueformoneyincludingenvironmentalfactorsconsidered intotalcostofownershipanalysis
•Ongoingrelationshipwithsupplierstodrive continuousimprovement
•Siteauditsofsupplierstoensurebestpractiseprocesses are being followed
GatheringdetailedinformationfromoursuppliersensuresthatPMPisabletoperformaccuratelifecyclecalculationsonourprintedproductsforourcustomers.
11. Information Technology InitiativesPMPhasvirtualisedover62%ofitsIntelserverfleetinfrastructure,reducingenergyuse,airconditioningloadsandinfrastructurerequirements.
Endoflifeequipmentincludinglaptopsandmobilephonesarerecycledbyaspecialiste-wasterecycler.99.6%ofthee-wastebyweightisrecycledorprocessedinawaste-to-energyfacility,withjust0.4%ofthetotalgoingtolandfill.
PMPiscurrentlyrollingoutthenewWindows7operatingsystemtotakeadvantageoffurtherpowersavingandpowermanagementfeatures.
12. TargetsPMP’sboardapprovedagreenhouseemissionsintensityreductiontargetof15%bytheendofFY11usingtheFY07performanceasthebaseline.Afternormalisingthisbenchmarktoreflectcurrentproductionlevelsineachstate,PMPachieveda12%reductionuptotheendofFY11.Thisisastrongresultconsideringfactorssuchasreducedproduction(down2%),reducedpaginationandreducedrunlengthswhichalldecreasetheefficiencyoftheprintingprocess.Furthermore,overallemissionswerereducedby11%overthisperiod.PMPiscurrentlyintheprocessofsettinganewthreeyeartargetforemissionsintensity.
PMP Print Emissions Intensity Targets
kg C
O2-
e/to
nne
prod
uct
AUSTRALIA NEWZEALANDGROUP
452 399 492 438 238 188
TARGET 418TARGET
391
TARGET 203
FY07* FY11 FY07* FY11 FY07* FY11
*normalised
-12%-11%
-21%
Historical PerformanceOverall,PMPPrint’semissionshavecontinuedtodecreasesincethereductiontargetwasannouncedinFY07.PMPwillcontinuetopursueenergyefficiencymeasuresacrossallbusinessestofurtherreduceouroverallemissions.
PMP Print GHG Emissions
137 134 139 134 136122 121
Tota
l CO
2 em
issi
ons
(kt)
Financial Year
04/05 05/06 06/07 07/08 08/09 09/10 10/11
Emissions intensity target set FY07
03/04
147-11%
Selection of Paper for Annual ReportPleaseconsultthefinalpageoftheannualreportforfurtherinformationaboutthesustainabilitycriteriaconsideredinthepublicationofthisreport.
Printing Process ReviewThediagramonthenextpagedepictsthemainstepsintheprintingprocess,alongwithPMP’sdirectandindirectenvironmentalimpacts.
310720_PMPAR2011_1-29.indd 28 6/9/11 4:28:36 PM

TARGET SHOOT CREATE
DELIVER
DIRECT IMPACTS
FORESTRY
RECYCLINGPARTNERS
INDIREC
T IMPA
CTS
PULP ING PAPER RECYCL ING
CU
STO
ME
R PA
PER
MA
KIN
G
PRINTING TRANSPORT
29
O U T P U T S
I N P U T SEnergy (electricity, natural gas, LPG, gasoline, diesel). Energy (electricity, natural gas, LPG, gasoline, diesel). Energy Electricity and natural gas make up over 95% of the energy consumption in the heat set printing process, while cold set printing at Salisbury and Chullora require no natural gas and are much less energy intensive. Electricity generation in Australia relies heavily on coal and is therefore carbon intensive, while our New Zealand operations source electricity mainly from renewable sources including hydro and geothermal.
Paper is the biggest input into the printing process and is sourced from around the world. Paper is a renewable and recyclable resource, and PMP is focussed on ensuring that our paper suppliers source fibre from responsible sources including plantation forestry and recovered paper.
Ink contains mineral and organic (soy-based) solvents; Ink contains mineral and organic (soy-based) solvents; Ink Aluminiumplates are used in the printing process; Chemicals including developers and solvents are used in the pre-press and printing process; Packaging materials (including cardboard and plastic) are recyclable or biodegradable.
Water is a critical component of the lithographic process and the majority Water is a critical component of the lithographic process and the majority Waterof water used is drawn from town water. In some locations this water is treated via reverse osmosis to improve print quality and runnability.
Waste & Recycling Over 99% of the waste generated by PMP is recycled. Our main waste streams are as follows: Paper offcuts and trimmings Paper offcuts and trimmings Paperfrom the printing process are extracted from the press hall and baled before being transported to a de-inking plant. After the ink is removed, the pulp is then ready for conversion back into recycled paper; Aluminium plates are collected and sold to recyclers for reprocessing. Aluminium does not degrade over time and is infinitely recyclable; Cardboard & Plastics are collected and recycled into new products; General Waste (less than 1%) is sent to landfill, where it breaks down and releases greenhouse gases including methane; Hazardous Waste including ink and chemical residues is collected by licensed contractors for disposal. This waste can be incinerated, providing energy for other industrial processes such as brick kilns. Hazardous waste is a very minor portion of total waste in the printing process.
CO2 The combustion of natural gas, fuels and ink solvents gives off carbon dioxide (CO The combustion of natural gas, fuels and ink solvents gives off carbon dioxide (CO2
The combustion of natural gas, fuels and ink solvents gives off carbon dioxide (CO2
The combustion of natural gas, fuels and ink solvents gives off carbon dioxide (CO ), which is one of the main greenhouse gases (GHGs) responsible ), which is one of the main greenhouse gases (GHGs) responsible for global warming. PMP is committed to reducing these emissions through continuing investment in new technology and by increasing efficiency.for global warming. PMP is committed to reducing these emissions through continuing investment in new technology and by increasing efficiency.
310720_PMPAR2011_1-29.indd 29 9/9/11 7:25:50 AM

30
DIRECTORS’ REPORT
The Board of Directors of PMP Limited (“PMP”) has pleasure in submitting the consolidated Statement of Financial Position of the economic entity (“PMP Group”) at 30 June 2011, and related Statement of Comprehensive Income, Statement of Cash Flows and Statement of Changes in Equity for the year (“the Period”) then ended and report as follows:
DirectorsThe names of the Directors of PMP in office during or since the end of the financial year and particulars of their qualifications, experience, other directorships (including listed company Boards for the last 3 financial years) and special responsibilities including memberships of Committees of the Board are featured on pages 20-21 and in the table below.
Directors’ and Executives’ disclosuresThe disclosures required for Director shareholdings and Director and Executive remuneration are included within the Remuneration Report.
Company Secretary – qualifications and experienceThe company secretary is Alistair Clarkson (B.Com LLB, MBA(distn), ACIS, GradDipACG,GAICD). He was appointed Company Secretary of PMP Limited in 2009. Alistair is an associate of the Institute of Chartered Secretaries and a graduate of the Australian Institute of Company Directors. Age 47, he has been Corporate Counsel for PMP since 2001 and prior to that worked as a solicitor in New Zealand.
Directors’ meetingsThe number of Directors’ meetings (including meetings of committees of the Board) and the number of meetings attended by each of the Directors of PMP during the financial year were:
Board of Directors Audit & Risk Management Appointment & Compensation
Attended
Maximum possible attended Attended
Maximum possible attended Attended
Maximum possible attended
G J Reaney 11 11 - - - -
R I Allely 11 11 - - - -
M Bickford-Smith 10 11 5 5 4 4
I L Fraser <b> 9 11 5 5 - -
P George 11 11 - - - -
Goh S N <c> 7 10 4 4 - -
Ng J S <d> 1 1 1 1 - -
N Sparks <e> 11 11 - - 4 4
<a> Directors may attend Committee meetings but where not Committee members, their attendance is not recorded.
<b> I L Fraser retired as a member of the Appointment and Compensation Committee on 17/08/10. N Sparks replaced I L Fraser on 17/08/10.
<c> Goh S N was appointed Non-Executive Director of the PMP Board on 17/08/10.
<d> Ng J S retired as Non-Executive Director of the PMP Board on 17/08/10.
<e> N Sparks was appointed Non-Executive Director of the PMP Board on 17/08/10.
Remuneration policyThe Group’s remuneration policies for Directors and management are detailed in the Remuneration Report included in this report. Non-Executive Directors’ fees are within the limits set by shareholders at the 2004 Annual General Meeting, and are set at levels which fairly represent the responsibilities of, and time spent by, the Non-Executive Directors on Group matters.
Principal activitiesThe principal activities of the PMP Group are commercial printing, digital premedia, letterbox delivery, and magazine distribution services.
ResultsThe consolidated result after income tax of the PMP Group for the financial year ended 30 June 2011 was a $11.3 million loss (2010: $20.6 million profit).
DividendsDividends paid to members during the financial year were as follows:
2 0 1 1 2 0 1 0
$’000 $’000
Final dividend for the year ended 30 June 2010 of 1 cent, 100% franked paid on 21 October 2010
3,353 -
3,353 -
Since year end, the Directors have declared a final dividend which was not recognised at 30 June 2011 of 1 cent, expected to be 100% franked.
2011_financials f.indd 30 9/6/2011 4:29:21 PM

31
Review of operationsDuring the year the PMP Group delivered earnings before interest, tax and significant items of $56.7 million. This represents a 8.5% increase compared to the prior year.
Net result after tax fell to $11.3 million loss from the prior year $20.6 million profit. Interest expense decreased 15.1% to $15.0 million. Significant items amounted to $52.2 million and included one-off restructuring costs from the transformation program of $26.5 million and expenses of $25.7 million from the impairment and closure of the book distribution business of Scribo.
Operating sales revenue was $1,194.3 million, representing a 1.5% decrease from the prior year. Capital expenditure (before proceeds from asset sales totalling $0.7 million) was $39.7 million which includes the cash paid for the business and assets of International Print Limited.
Net assets decreased by $19.6 million to $355.3 million.
PMP Group finished the year with interest cover of 6.7 times compared to 5.3 times in the prior period and gearing of 39.7% from 44.8% in June 2010.
Significant changes in the state of affairsOn 12 November 2010, PMP announced Stage II of its Transformation Plan. The plan will result in the restructure and rationalisation of operations in New Zealand and will build on the process of continuous improvement implemented in Australia during Stage I. The initial costs associated with the commencement of the Transformation Plan have been recorded as a significant item as at 30 June 2011.
During the year, the book distribution business of Scribo was adversely affected by difficult trading conditions, growing transition to digital platforms, the appreciation of the Australian dollar and lack of new titles by local and overseas publishers resulting in a strategic review of the business. Consequently the business was closed on 30 June 2011 incurring impairment charges and closure costs of $25.7 million. The carrying amount of the goodwill and intangibles in the book distribution business after the impairment charge was nil as at 30 June 2011. These costs have been recorded as a significant item as at 30 June 2011. The Brumby Books and Music business will continue normal operations.
Refer below for details in respect to the on market share buy-back.
Future developmentsCertain developments in the operations of the PMP Group are referred to elsewhere in the annual report. The Directors have excluded from this report any further information on the likely developments in the operations of the PMP Group and the expected results of those operations in future years, as the Directors have reasonable grounds to believe that it would likely result in unreasonable prejudice to the company.
Environmental regulation performancePMP is committed to conducting its business activities with respect for the environment, while continuing to meet its obligations to its shareholders, employees, customers and suppliers. PMP believes its operations are in compliance with all environmental regulations to the extent material to its financial position or results of its continuing operations. As of the date of this report, there were no material legal proceedings concerning environmental matters pending against PMP or against any of its properties. Refer to pages 26-29 for PMP’s Sustainability Report for a more detailed review of PMP’s environmental practices with a particular emphasis on its carbon footprint.
Share issues and on-market buy-backThere were no shares issued during the year ended 30 June 2011.
Under the buy-back announced in June 2010, 10,000 shares were bought-back during the period from 1 July 2010 to 21 December 2010.
On 24 March 2011, PMP announced its intention to undertake an on market share buy-back. The buy-back duration was from 8 April 2011 to 30 June 2011. The maximum number of shares that could be bought back was 9.9 million. The number of shares purchased was 5,459,271.
On 2 August 2011, PMP announced its intention to undertake an on market share buy-back. The buy-back duration is from 17 August 2011 to 30 June 2012. The maximum number of shares that can be bought back is 20 million.
Share options/rightsThe names of the persons who currently hold options/rights are entered in the register of options and rights kept by the Company pursuant to Section 168 of the Corporations Act 2001. Pursuant to an Australian Securities and Investments Commission Class Order, the Directors have taken advantage of relief available from the requirement to disclose the names of executives not being Directors (other than the key management personnel executives of the Group) to whom options/rights are issued, and the number of options/rights issued to each person.
Non-audit servicesThe Audit and Risk Management Committee reviewed the non-audit services provided by Deloitte Touche Tohmatsu. These non-audit services include tax compliance and consulting and due diligence sevices. The following non-audit services were provided during the 12 months to 30 June 2011.
Description of non-audit services <a> $
- Due diligence 25,203
- Taxation compliance and consulting 246,079
271,282
<a> Unless otherwise specified all amounts have been paid or are due and payable to a member firm of Deloitte Touche Tohmatsu or its affiliates.
In accordance with advice provided by the Audit and Risk Management Committee, the Directors are satisfied that – based on the approval procedures required for the external auditors to provide non-audit services to PMP and from a review of actual services provided – the non-audit services provided by Deloitte Touche Tohmatsu met the standards of independence.
Auditor’s independence declarationIn accordance with the Audit Independence requirements of the Corporations Act 2001, the Directors have received and are satisfied with the “Audit Independence Declaration” provided by the PMP Group external auditors, Deloitte Touche Tohmatsu. The Audit Independence Declaration has been attached to the Directors’ Report on page 45.
Directors’ and Officers’ liability insurance and indemnityPMP has liability insurance policies for all Directors and Officers of the PMP Group.
The policy agreement prohibits disclosure of the policy terms and the premium paid. Directors and officers are also indemnified by the company against all liabilities to another person (other than PMP or a related body corporate) that may arise from their position as Directors or Officers of PMP and the PMP Group. The insurance cover and indemnity is not applicable where the liability arises out of conduct involving a lack of good faith.
Significant events after balance dateSince the balance date, the Directors have declared a final dividend of 1 cent per fully paid ordinary share, expected to be fully franked based on a corporate tax rate of 30%.
Following a change to the Corporations Law and consequent change to Tax Law, the Australian Taxation Office (ATO) expressed a preliminary view in some fact sheets prior to year end which would prohibit companies franking a dividend if the company debits the dividend to its accumulated losses account. The fact sheets do not address PMP Limited’s circumstances, being the payment of dividends from the parent’s current year profits. It is the view of PMP that this payment should not be affected by the preliminary view expressed in the fact sheets and is consistent with accepted past practice. PMP has been informed that the ATO is currently considering this matter. Refer to Note 4 for further details.
The aggregate amount of the proposed dividend expected to be paid on 20 October 2011, but not recognised as a liability at 30 June 2011, is $3.3 million.
On 2 August 2011, PMP announced its intention to undertake an on market share buy-back from 17 August 2011 to 30 June 2012. The maximum number of shares that can be bought during this period is 20 million.
Other than the matters disclosed above, the Directors are not aware of any matter or circumstance post balance date not otherwise dealt with in this report or the consolidated financial statements that has significantly affected or may significantly affect the operations of the PMP Group, the results of those operations or the state of affairs of the Group in subsequent years.
2011_financials f.indd 31 9/6/2011 4:29:21 PM

32
Rounding of amountsPursuant to class order 98/0100 made by the Australian Securities and Investments Commission, the Company has rounded amounts in this report and the accompanying financial statements to the nearest thousand dollars unless specifically stated to be otherwise.
Remuneration ReportThis Remuneration Report outlines the Director and executive remuneration arrangements in accordance with the requirements of the Corporations Act 2001 and its Regulations. It covers the Directors of PMP, including the Chief Executive Officer (CEO), and other key management personnel with the authority and responsibility for planning, directing and controlling the activities of PMP, including the five executives of PMP receiving the highest remuneration. The report also contains information about the broader remuneration practices applying to management below the executive level.
1 Appointment and Compensation Committee (the Committee)
1.1 Role of the CommitteeThe Committee operates under the delegated authority of the Board of Directors of PMP Limited, with ultimate authority for executive remuneration policy. In relation to appointments, the Committee reviews Director competence standards and Board succession plans, evaluates the Board’s performance and makes recommendations for appointing or removing Directors. In relation to compensation, the Committee makes recommendations to the Board on: executive remuneration and incentive policies, senior management remuneration packages, PMP’s recruitment, retention and termination policies for senior management, incentive schemes, superannuation arrangements and the remuneration framework for Directors.
The Committee is also responsible for evaluating potential candidates for executive positions, including the role of CEO, and overseeing the development of executive succession plans.
The CEO has the authority to employ and remunerate executives within the scope of the policy established by the Committee. In carrying out its duties, the Committee is committed to providing sound remuneration policies and practices that enable PMP to:
• Attract and retain high quality executives and Directors who are dedicated to the interests of PMP shareholders; and
• Fairly and responsibly reward executives, while taking into account the interests of shareholders, PMP’s performance, the performance of the relevant executive and market conditions.
1.2 AdvisorsIn executing its responsibilities, the Committee has unlimited access to senior management. It also has the Board’s authority to seek information it requires from employees and external parties and obtain outside legal or other professional advice at the expense of PMP Limited.
1.3 Membership and meetingsThe Committee may only comprise Non-Executive Directors and its Chairman may not be the Chairman of the Board. Its members and their record of attendance in the last financial year are listed below.
Committee members Meetings attended Meetings held
M Bickford-Smith (Chairman) 4 4
N Sparks <a> 4 4
<a> I L Fraser retired as a member of the Appointment and Compensation Committee on 17/08/10. N Sparks replaced I L Fraser on 17/08/10.
2 Remuneration principlesPMP’s Remuneration Policy provides a direct link between remuneration and corporate performance by:
• Offering sufficiently competitive rewards to attract and retain high calibre executives;
• Putting a significant portion of executive remuneration at risk against pre-determined performance benchmarks;
• Setting appropriate stretch performance hurdles to variable executive remuneration;
• Linking short term incentives to both company and personal performance;
• Linking long term incentives (including options and rights) to shareholder value measures and performance hurdles;
• Limiting severance payments for executives to pre-established contractual arrangements to avoid any unjustified termination payments; and
• Providing full legal compliance and disclosure of executive remuneration.
The Board also recognises that, although remuneration is a major factor in recruiting and retaining talented and effective people, other factors play a substantial role in attracting suitable candidates, including: PMP’s business operations, corporate reputation, ethical culture and other human resources’ policies and practices.
Combined with its policies, PMP’s remuneration principles ensure that:
• Executive remuneration packages are appropriately benchmarked against the market for comparative roles in similar sized entities;
• Executive remuneration packages for key middle and senior personnel include an at risk variable component that is developed in line with the PMP Short Term Incentive program;
• Variable pay schemes are expressed in the form of a balanced scorecard that details a variety of criterion that align to key areas of focus for the business. Current standard performance criterion includes: EBIT; safety performance (measured by the lost time injury frequency rate); and personal objectives that align personal behaviours and professional development with the overall goals of the company.
3 Remuneration structureThe Board believes well designed and managed short and long term incentive plans are important elements of employee remuneration, providing tangible incentives for employees to strive to improve PMP’s short term and long term performance, and giving them a community of interest with shareholders.
The three tiers of the structure are:
1. Fixed remuneration made up of base salary including statutory superannuation and other incidental benefits;
2. Short term performance incentives (STI) / other accepted variable pay schemes; and
3. Longer term equity-based incentives through employee share rights plan (LTI), which usually pertain to the senior leadership.
This three-tier structure results in management having more of their total remuneration and reward package at risk, linked to individual performance and business results and, in the case of longer term incentives, to the long term performance of the company.
The structure links remuneration management and outcomes to organisational performance through PMP’s Performance Management System. This system aligns goals, strategies and actions for the Group with business unit and department goals and actions. PMP measures progress against these goals through individual reviews and monthly and quarterly business reviews.
To ensure executives are sufficiently motivated and aligned with PMP company performance objectives, executives are expected to have at least 25% of their maximum potential remuneration at risk.
2011_financials f.indd 32 9/6/2011 4:29:22 PM

33
3.1 Base salaryPMP generally sets salaries based on a classification structure referenced to the market median, while also allowing flexibility from this reference point where it is warranted by individual performance levels.
PMP’s remuneration structure and market position are benchmarked annually through Hewitt Associates, PMP’s preferred remuneration and benefits provider.
The remuneration structure is managed by the Human Resources function, leveraging tools such as: job evaluation, career level benchmarking and an automated salary review software application.
PMP’s remuneration system allows flexible packaging of benefits via salary sacrifice at no additional Total Employment Cost (TEC) to the company.
3.2 SuperannuationPMP complies with all relevant statutory superannuation obligations to its employees. The standard company superannuation plan is primarily an accumulation plan, providing a lump sum benefit equal to the balance of a member’s account, which includes contributions made by the member and the relevant PMP group entity, together with net fund earnings. A few longer serving executives remain in a legacy defined benefit plan, which is closed to new members.
Relevant superannuation contributions for all senior executives form part of the executive’s total remuneration package, which is calculated on a total cost to company basis. All such amounts are included in the fixed remuneration disclosed for the CEO and members of the senior executive team in this report. PMP offers employees the opportunity to participate in the superannuation choice of fund arrangements.
3.3 Other benefitsPMP does not provide senior executives or Directors with benefits such as life insurance, vehicle allowance, club memberships or retirement benefits other than the superannuation benefits previously discussed.
3.4 Variable remunerationPMP links all variable remuneration to performance. The proportion of variable remuneration increases with job responsibility, with senior executives having a greater proportion of their remuneration at risk.
3.4.1 Short term incentives - STIsThe STI plan applies to key middle and senior personnel roles, directly linking variable remuneration to PMP’s corporate strategy.
The employee’s STI percentage is the maximum amount that will be paid for achieving performance goals. Results above the target goal will not increase the incentive payment above the STI percentage, unless authorised by the CEO. As a general rule, no discretionary bonuses outside the STI program will
be approved. Proposals for discretionary bonuses outside the STI program must be authorised by the CEO and have a supporting business case.
Performance is assessed on a balanced scorecard approach.
Target achieved
Percentage of STI target achieved
Percentage of base TEC achieved
EMT Other (EMT example)
Below threshold None None -
Target 100% 100% 25%
Exceptional CEO discretion CEO discretion
Table 1. STI percentages.
STI entitlements are formalised after the end of year accounts have been finalised and paid in September. STI payments to the CEO and other specified executives satisfying the definition of Key Management Personnel are disclosed in this report.
3.4.2 STIs - Performance conditionsPMP’s primary measure for STIs is EBIT - Earnings Before Interest and tax (before significant items) - a commonly used financial indicator of operating performance. Other non-financial performance conditions focus management and executive activities on operating performance and employee safety and align individual behaviours with company strategy. Non-financial performance criteria of executives are set by the CEO in consultation with individual executives.
3.4.3 Long term incentives – LTIsThe LTI plan aligns an element of executive rewards with the creation of shareholder wealth. LTIs apply to executive managers with the greatest authority and most strategic influence over PMP’s direction, profitability and growth.
Under the LTI plan, participants are granted performance rights, which entitle them to receive PMP shares after a vesting period, if the performance conditions are satisfied. The rights are granted annually (following the announcement of the Group’s results) to each participant to the value of between 25% and 50% of that person’s TEC. The number of rights granted is based on the Company’s weighted average share price for the one week period up to and including the grant date. These rights only vest if the Group achieves the long-term performance conditions detailed in Table 3.
The Executive Share Purchasing Policy prohibits executives from hedging pre-vested awards under the LTI plan.
2011Fixed annual
remuneration <a>STI <a> Total
Performance related remuneration
$ $ $ %
R I Allely CEO and MD <b> 855,750 401,185 1,256,935 32%
C Amos EGM - PMP (NZ) Limited <c> 24,916 - 24,916 -
P Browne EGM - PMP (NZ) Limited <d> 348,204 37,088 385,292 10%
A Clarkson Company Secretary and General Counsel 269,516 13,750 283,266 5%
C Davison EGM - Gordon and Gotch and Scribo Group 380,000 14,250 394,250 4%
G Plant EGM - PMP Digital & Pacific Micromarketing 281,190 10,647 291,837 4%
G Stephenson CFO 382,500 19,250 401,750 5%
A Williams EGM - Print and Distribution 487,498 84,984 572,482 15%
Table 2. Take home pay of the Executive Director and continuing Executives for the year ended 30 June 2011.
<a> Fixed annual remuneration based on current gross salary package, which includes base salary, annual leave, superannuation contributions and the value of non-salary benefits provided to the executive (inclusive of all applicable taxes). The STI represents the actual STI paid based on performance over the 2011 year.
<b> Includes cash incentives of (operational and external comparative) $347,327 and shares of $53,858.
<c> C Amos appointed EGM of PMP (NZ) Limited on 01/06/11 after completion of P Browne’s secondment.
<d> STI includes cash transformation plan incentive of $25,500. Remuneration paid in New Zealand and Australian dollars. New Zealand dollar remuneration converted into Australian dollars at the average profit and loss exchange rate prevailing during the year. P Browne completed his New Zealand secondment as EGM of PMP (NZ) Limited on 31/05/11 and has been transferred within the business.
2011_financials f.indd 33 9/6/2011 4:29:22 PM

34
Ref Options / Rights Performance Hurdles Assessment Method Vesting
A Rights - $0 EMT and Senior Managers Issued 30 Sept 07 Expiry 31 Aug 12
The performance hurdles are: Total Shareholder Return (TSR) and Return on Capital Employed (ROCE).
50% of Rights granted are to be subject to each hurdle.
Will be determined on TSR and ROCE result for FY08, FY09 and FY10.
0% vested on 19 Aug 10
Total Shareholder Return
If PMP’s TSR over the three year period comprising financial years 08, 09 and 10 exceeds the change in the ASX All Ordinaries Accumulation Index over the same period, all of the Rights (being 50% of Rights granted) will vest and become exercisable.
Return on Capital Employed
ROCE = EBIT / Capital Employed
- EBIT = Earnings Before Interest and Tax as per the audited accounts
- Capital employed = Equity plus net debt
ROCE performance over a 3-year performance period will be determined as the simple average of ROCE achieved in each of the 3 relevant financial years. If ROCE over the 3-year performance period is at least equal to the target average ROCE set by the Board on commencement (being 16%), all of the Rights (being 50% of Rights granted) will vest and become exercisable.
The Board retains discretion to include/exclude from the calculation of ROCE, items which the Board considers are for example unusual or non-recurring.
B Rights - $0 EMT and Senior Managers Issued 01 Oct 08 Expiry 31 Aug 13
The performance hurdles are: Total Shareholder Return (TSR) and Return on Capital Employed (ROCE).
50% of Rights granted are be subject to each hurdle.
Will be determined on TSR and ROCE result for FY09, FY10 and FY11.
0% vested on 18 Aug 11
Total Shareholder Return
If PMP’s TSR over the three year period comprising financial years 09, 10 and 11 exceeds the change in the ASX All Ordinaries Accumulation Index over the same period, all of the Rights (being 50% of Rights granted) will vest and become exercisable.
Return on Capital Employed hurdle detail as in “A” above.
C Rights - $0 EMT and Senior Managers Issued 01 Oct 09 Expiry 31 Aug 14
The performance hurdles are: Total Shareholder Return (TSR) and Return on Capital Employed (ROCE).
50% of Rights granted are be subject to each hurdle.
Will be determined on TSR and ROCE result for FY10, FY11 and FY12.
N/A
Total Shareholder Return
If PMP’s TSR over the three year period comprising financial years 10, 11 and 12 exceeds the change in the ASX All Ordinaries Accumulation Index over the same period, all of the Rights (being 50% of Rights granted) will vest and become exercisable.
Return on Capital Employed hurdle
ROCE over the performance period is at least equal to the target average ROCE set by the Board on commencement of the Performance Period.
The target ROCE is the greater of the average budgeted ROCE or the average weighted average cost of capital over the performance period.
The Board retains discretion to include/exclude from the calculation of ROCE, items which the Board considers are for example unusual or non-recurring.
D Rights - $0 EMT and Senior Managers Issued 01 Oct 10 Expiry 31 Aug 15
The performance hurdles are: Total Shareholder Return (TSR) and Return on Capital Employed (ROCE).
50% of Rights granted are be subject to each hurdle.
Will be determined on TSR and ROCE result for FY11, FY12 and FY13.
N/A
Total Shareholder Return
If PMP’s TSR over the three year period comprising financial years 11, 12 and 13 exceeds the change in the ASX All Ordinaries Accumulation Index over the same period, all of the Rights (being 50% of Rights granted) will vest and become exercisable.
Return on Capital Employed hurdle detail as in "C" above.
Table 3. LTI Performance Hurdles and Assessment Methods.
2011_financials f.indd 34 9/6/2011 4:29:22 PM

35
3.4.4 LTIs - Performance conditionsTable 3 summarises the Key Management Personnel LTIs, including their performance conditions and achievement assessment methods.
3.5 Senior Executive Performance EvaluationPMP rewards executives for performance. At the beginning of each new financial year, the CEO sets objectives with each direct report. This includes corporate goals (such as EBIT excluding significant items and safety), and personal objectives, including activities to drive the development of business
opportunities across the Group. The CEO formally reviews performance against objectives twice annually, at the mid-year and financial year-end, with the outcomes used to determine overall performance and STI payments.
3.6 Senior Executive DevelopmentThe CEO also ensures the ongoing professional development of the Executive Team through the creation of agreed development plans.
3.7 Company performanceTables 4a and 4b show PMP’s performance over the last five years with regard to earnings and shareholder returns.
Table 4a. PMP Share Price Performance against ASX All Ords Index.
July 06 July 07 July 08 July 09 July 10 July 11
Perc
enta
ge c
hang
e
200 -
150 -
100 -
50 -
0 -
ASX All Ordinaries
PMP
- - - - - -
July 06 July 07 July 08 July 09 July 10 July 11
- - - - - -
Table 4b. PMP Actual Share Price performance.
200 -
150 -
100 -
50 -
0 -Sh
are
pric
e (c
ents
)
Earnings performance indicators 2007 2008 2009 2010 2011
Earnings per ordinary share (basic) cents 15.5 23.9 (7.9) 6.2 (3.4)
Earnings per ordinary share (diluted) cents 15.3 23.9 (7.9) 6.1 (3.4)
Dividend per share cents <a> 3.0 <b> 4.5 - <c> 1.0 <d> 1.0
External sales revenue A$ mill 1,288.1 1,347.3 1,345.6 1,212.1 1,194.3
Total EBIT (before significant items) A$ mill 91.3 84.7 54.9 52.2 56.7
Table 4c. PMP earnings performance indicators.
<a> Final dividend FY07, paid FY08.
<b> 1.5 cent interim FY08 dividend, paid FY08 and 3.0 cent final FY08 dividend, paid FY09.
<c> Final dividend FY10, paid FY11.
<d> Final dividend FY11, paid FY12.
4 Chief Executive remunerationIt is the Board’s intention to enter into a new employment agreement with Mr Richard Allely provided that terms can be agreed, which are consistent with contemporary remuneration principles and reflect current market conditions.
The following section details the remuneration arrangement for Mr Richard Allely, the CEO of PMP.
4.1 Employment contractMr Richard Allely is employed under a 3 year contract which expires on 31 March 2012. The notice period for termination is 12 months by the employer or 6 months notice by the employee (12 months in the event of a significant change in duties or responsibilities or a successful takeover). Leave entitlements are 20 days annual leave per annum, and long service leave as per legislation.
4.2 Summary of remuneration structure
Fixed Remuneration:Base salary including superannuation is $855,750 per annum.
Short Term Incentive: Operational
Mr Allely has an STI of up to 100% of his fixed remuneration for the 2010/11 financial year, dependent on achieving a number of targets including EBIT and safety:
• Budgeted EBIT (70% of STI);
• Improved safety (15% of STI); and
• Personal objectives (15% of STI)
Any STI achieved will be paid 66.7% in cash and 33.3% in PMP shares. The number of shares acquired as a result of achievement of this STI is dependent upon the share price at the time of the acquisition as the STI dollar value is fixed. The PMP shares will be purchased on market and will not vest with Mr Allely until 12 months after the year end to which they relate.
Budgeted EBIT was not achieved for the 2010/11 financial year and no STI payment was made on this component.
For the 2009/10 financial year Mr Allely was awarded 386,433 shares. The shares were purchased on market during 2010/2011 and vested with Mr Allely on 1 July 2011 (refer Table 11).
External ComparativeSubject to PMP Group achieving a total shareholder return (TSR) that is at or above the 51% of TSR for the 151st to 200th (inclusive) largest companies by market capitalisation listed on the ASX for the financial year (“External Comparative Index”), a maximum of 50% base salary will be paid. Where this is achieved payment is calculated on the basis of 25% of remuneration plus 1% remuneration for each % that PMP is above the 51st% on the External Comparative Index. The Group was ranked 22nd on that index for 2010/11.
Long Term Incentive:All options and rights held by the CEO are disclosed in Note 25(b) to the accounts. All options and rights were issued to Mr Allely under the LTI plan, when he was Chief Financial Officer.
2011_financials f.indd 35 9/6/2011 4:29:22 PM

36
4.3 Remuneration summaryThe remuneration paid to Mr Allely for the year ended 30 June 2011 is set out in the table below:
Salary Component 2011
- Base Salary $840,551
- Superannuation $15,199
- LSL $13,883
- STI: Operational and external comparative $347,327
- STI: Shares <a> $53,858
- LTI <b> $51,835
Total $1,322,653
Table 5. Richard Allely remuneration.
<a> Shares do not vest with Mr Allely until 01/07/12.
<b> This is based on the accrued accounting value in accordance with AASB 2 Share-based Payment and relates to amounts granted to Mr Allely under the Employee Long Term Incentive Plan prior to his appointment to CEO. All options valued in accordance with AASB 2 have been independently valued using the Binomial Option Pricing Model or Monte Carlo Model. In accordance with AASB 2 the non-market conditions associated with these options were not taken into account when estimating the fair value at grant date. Instead, the number of options expected to eventually vest is re-assessed at the end of each reporting period.
5 Key Management Personnel and highest paid officers (other than Directors)PMP’s Key Management Personnel (as defined by AASB 124: Related Party Disclosures) and highest paid officers during the financial year are:
R I Allely Chief Executive Officer and Managing Director. Refer section 4 for remuneration details.
C Amos Executive General Manager - PMP (NZ) Limited <a>
P Browne Executive General Manager - PMP (NZ) Limited <a>
A Clarkson Company Secretary and General Counsel
C Davison Executive General Manager - Gordon and Gotch and Scribo Group
G Plant Executive General Manager - PMP Digital & Pacific Micromarketing
G Stephenson Chief Financial Officer
A Williams Executive General Manager - Print and Distribution
<a> C Amos appointed Executive General Manager of PMP (NZ) Ltd on 01/06/11 after completion of P Browne’s secondment on 31/05/11. 5.1 Employment contractsPMP does not include termination or severance payments for PMP executives in their employment contracts in addition to agreed notice provisions.
Name Notice Period PMP Notice Period Employee Termination Payments
C Amos 6 Months 6 Months No specific termination payment provided for
P Browne 6 Months 6 Months No specific termination payment provided for
A Clarkson 6 Months 6 Months No specific termination payment provided for
C Davison 6 Months 3 Months No specific termination payment provided for
G Plant 6 Months 6 Months No specific termination payment provided for
G Stephenson 6 Months 6 Months No specific termination payment provided for
A Williams 6 Months 6 Months No specific termination payment provided for
Table 6. Executive Employment Contracts.
2011_financials f.indd 36 9/6/2011 4:29:22 PM

37
5.2 RemunerationThe table below outlines the remuneration packages of key management personnel (excluding Directors). All rights are valued in accordance with AASB 2 which have been independently valued in accordance with the Binomial Option Pricing Model or the Monte Carlo Simulation Model. The value of rights awarded to executives during the year are disclosed in Table 8 in the column headed “Actual LTI”. This value is based on the intrinsic value of rights on vesting date.
Key management personnelShort term
Post employment
superannuationLong term
Total excluding
options/ rights
Equity options/
rightsGrand
total
Options/rights as a
percentage of total
remuneration
Salary STI LSL <g>
$ $ $ $ $ $ $ %
C Amos <a> 2011 22,859 - 2,057 - 24,916 - 24,916 -
P Browne <b> 2011 303,637 37,088 44,567 4,754 390,046 47,638 437,684 11%
2010 327,977 75,000 40,467 3,940 447,384 35,772 483,156 7%
D Chesser <c> 2011 102,255 - 9,203 - 111,458 (10,132) 101,326 -
<e> 2010 161,004 42,568 13,773 - 217,345 10,132 227,477 4%
A Clarkson 2011 247,326 13,750 22,190 7,765 291,031 35,486 326,517 11%
2010 240,130 62,500 20,642 3,810 327,082 23,104 350,186 7%
C Davison 2011 354,240 14,250 25,760 33,664 427,914 67,645 495,559 14%
2010 360,428 95,000 25,760 - 481,188 59,567 540,755 11%
P Elbourne <d> 2011 64,950 - 5,983 - 70,933 (12,811) 58,122 -
2010 261,961 68,750 14,461 4,256 349,428 12,811 362,239 4%
G Plant 2011 265,991 10,647 15,199 - 291,837 38,176 330,013 12%
2010 267,397 68,250 14,461 - 350,108 25,805 375,913 7%
G Stephenson 2011 367,301 19,250 15,199 - 401,750 29,983 431,733 7%
<f> 2010 34,059 - 1,205 - 35,264 1,114 36,378 3%
A Williams 2011 447,246 84,984 40,252 - 572,482 39,247 611,729 6%
2010 365,760 105,000 31,831 - 502,591 15,839 518,430 3%
Total Remuneration 2011 2,175,805 179,969 180,410 46,183 2,582,367 235,232 2,817,599
2010 2,018,716 517,068 162,600 12,006 2,710,390 184,144 2,894,534
Table 7. Key management personnel remuneration and other executives of the company and the group.
<a> Appointed EGM of PMP (NZ) Limited on 01/06/11 after completion of P Browne’s secondment. P Browne completed his New Zealand secondment as EGM of PMP (NZ) Limited on 31/05/11 and has been transferred within the business.
<b> Includes relocation housing allowance of 2011: $57,891 (2010: $61,205). STI includes cash transformation plan incentive of $25,500. Remuneration paid in New Zealand and Australian dollars. New Zealand dollar remuneration converted into Australian dollars at the average profit and loss exchange rate prevailing during the year.
<c> Retired 19/01/11.
<d> Completion 30/09/10 (Termination payment of $158,234 excluded. Payment made on 05/10/10).
<e> Appointed 16/11/09. Retired 19/01/11.
<f> Appointed Chief Financial Officer on 31/05/10.
<g> Where completion dates are during the period - options have been forfeited (AASB 2 Share-based Payment)
- Options/rights that had not vested prior to being forfeited have been credited back to the income statement.
2011_financials f.indd 37 9/6/2011 4:29:22 PM

38
Fixed annual
remuneration
Maximum STI
<f>
Actual STI
<a>
Actual STI percentage
of maximum STI
<b>
Maximum LTI
<c>
Actual LTI
<d> <e>
Actual LTI percentage
of maximum LTI
<b> <e>
Maximum potential
rewardActual
reward
At risk remuneration
(of potential total)
$ $ $ % $ $ % $ $ %
R I Allely 855,750 1,283,625 401,185 31% 118,550 - - 2,257,925 1,256,935 62%
C Amos 24,916 - - - - - - 24,916 24,916 -
P Browne <g> 348,204 77,250 37,088 48% 109,589 - - 535,043 385,292 35%
A Clarkson 269,516 68,750 13,750 20% 81,834 - - 420,100 283,266 36%
C Davison 380,000 95,000 14,250 15% 155,466 - - 630,466 394,250 40%
G Plant 281,190 70,980 10,647 15% 87,857 - - 440,027 291,837 36%
G Stephenson 382,500 96,250 19,250 20% 69,891 - - 548,641 401,750 30%
A Williams 487,498 127,500 84,984 67% 90,890 - - 705,888 572,482 31%
Table 8. Key management personnel achievement of performance hurdles.
<a> Group EBIT targets were not met in the 2011 financial year. STIs were paid if divisional EBIT targets and personal objectives were achieved.
<b> The difference between the Actual and Maximum value is the forfeited value.
<c> All long term incentives (LTIs) are composed of “options/rights”. The value attributed to the “2011 Maximum LTI” amount is based on the accrued accounting value in accordance with AASB 2 ‘Share-based Payment’. Options/rights have been independently valued.
<d> The value attributed to the 2011 “Actual LTI” amount is the “intrinsic value” of options exercised during the year. Intrinsic value is calculated as the difference between the share price and exercise price on the date exercised.
<e> Management notes that the method used in this table will result in reporting anomalies in any given period, to the extent that the “Actual LTI” is based on actual exercised options (intrinsic value), which is being compared to an accrued accounting value.
<f> Based on ‘target’ goals (100%) being achieved. Achievement of ‘exceptional’ goals are at CEO discretion.
<g> STI includes cash transformation plan incentive of $25,500. Remuneration paid in New Zealand and Australian dollars. New Zealand dollar remuneration converted into Australian dollars at the average profit and loss exchange rate prevailing during the year.
2011_financials f.indd 38 9/6/2011 4:29:23 PM

39
5.3 Share options/rightsThe table below shows remuneration share rights granted and vested to key management personnel during the year. No Directors (excluding R I Allely) were granted or hold options or rights over shares of PMP Limited.
Terms & Conditions for each grant of share options/rights during the year ending 30 June 2011 30 June 2011
Granted number Grant date
Value per option/right at
grant date $Exercise price
per share $
First exercise
date
Last exercise
dateVested
number
R I Allely - - - N/A - - Nil
C Amos - - - N/A - - Nil
P Browne 220,714 1/10/2010 <a> N/A <b> 31/08/2015 Nil
A Clarkson 196,429 1/10/2010 <a> N/A <b> 31/08/2015 Nil
C Davison 271,429 1/10/2010 <a> N/A <b> 31/08/2015 Nil
G Plant 195,000 1/10/2010 <a> N/A <b> 31/08/2015 Nil
G Stephenson 275,000 1/10/2010 <a> N/A <b> 31/08/2015 Nil
A Williams 300,000 1/10/2010 <a> N/A <b> 31/08/2015 Nil
Total 1,458,572 Nil
Terms & Conditions for each grant of share options/rights during the year ending 30 June 2010 30 June 2010
Granted number Grant date
Value per option/right at
grant date $Exercise price
per share $
First exercise
date
Last exercise
dateVested
number
R I Allely 423,173 1/10/2009 <c> N/A <d> 1/07/2011 Nil
P George - N/A N/A N/A N/A N/A N/A
P Browne 217,391 1/10/2009 <e> N/A <f> 31/08/2014 Nil
D Chesser 157,609 16/11/2009 <e> N/A <f> 31/08/2014 Nil
A Clarkson 181,159 1/10/2009 <e> N/A <f> 31/08/2014 Nil
C Davison 275,362 1/10/2009 <e> N/A <f> 31/08/2014 Nil
P Elbourne 199,275 1/10/2009 <e> N/A <f> 31/08/2014 Nil
G Plant 197,826 1/10/2009 <e> N/A <f> 31/08/2014 Nil
G Stephenson 120,283 31/05/2010 <e> N/A <f> 31/08/2014 Nil
A Williams 246,377 1/10/2009 <e> N/A <f> 31/08/2014 Nil
Total 2,018,455 Nil
Table 9. Key management personnel options/rights granted.
<a> Valuation in accordance with AASB 2 Share-based Payment. Fair value per right - TSR hurdle - $0.47 (50% of granted rights). Fair value per right - ROCE hurdle - $0.66 (50% of granted rights).
<b> Following the announcement of the 2012-13 results.
<c> Valuation in accordance with AASB 2 Share-based Payment. Fair value per right - $0.65.
<d> 12 months after announcement of 30 June 2010 results.
<e> Valuation in accordance with AASB 2 Share-based Payment Fair value per right - TSR hurdle - $0.50 (50% of granted rights). Fair value per right - ROCE hurdle - $0.62 (50% of granted rights).
<f> Following the announcement of the 2011-12 results.
2011_financials f.indd 39 9/6/2011 4:29:23 PM

40
Balance 1 July 2010
Granted as remuneration
Options/rights
exercised
Options/rights
lapsed
Options/ rights
cancelled
Balance 30 June
2011 Not
exercisable
Value at exercise
date $
Share price at
lapse date
$
Value at lapse date
$
2011 <a>
R I Allely <b> 918,804 - (423,173) (216,334) - 279,297 279,297 275,063 0.63 136,290
C Amos - - - - - - - - - -
P Browne 368,671 220,714 - (67,043) - 522,342 522,342 - 0.63 42,237
D Chesser <c> 157,609 196,429 - (354,038) - - - - 0.89 315,094
A Clarkson 261,262 196,429 - (36,852) - 420,839 420,839 - 0.63 23,217
C Davison 543,781 271,429 - (119,982) - 695,228 695,228 - 0.63 75,589
P Elbourne <c> 199,275 - - (199,275) - - - - 0.70 139,493
G Plant 288,545 195,000 - (39,938) - 443,607 443,607 - 0.63 25,161
G Stephenson 120,283 275,000 - - - 395,283 395,283 - - -
A Williams 246,377 300,000 - - - 546,377 546,377 - - -
Total 3,104,607 1,655,001 (423,173) (1,033,462) - 3,302,973 3,302,973
Balance 1 July 2009
Granted as remuneration
Options/rights
exercised
Options/rights
lapsed
Options/ rights
cancelled
Balance 30 June
2010 Not
exercisable
Value at exercise
date $
Share price at
lapse date
$
Value at lapse date
$
2010 <a>
R I Allely 713,752 423,173 - (218,121) - 918,804 918,804 - 0.55 119,967
P George - - - - - - - - - -
C Davison 385,869 275,362 - (117,450) - 543,781 543,781 - 0.55 64,598
P Elbourne - 199,275 - - - 199,275 199,275 - - -
A Clarkson 80,103 181,159 - - - 261,262 261,262 - - -
G Plant 90,719 197,826 - - - 288,545 288,545 - - -
P Browne 151,280 217,391 - - - 368,671 368,671 - - -
A Williams - 246,377 - - - 246,377 246,377 - - -
D Chesser - 157,609 - - - 157,609 157,609 - - -
G Stephenson - 120,283 - - - 120,283 120,283 - - -
Total 1,421,723 2,018,455 - (335,571) - 3,104,607 3,104,607
Table 10. Option/rights holdings key management personnel.
<a> No options/rights are exercisable at 30 June 2011 (2010: nil).
<b> Exercise represents short term incentive 2009/2010. One-third of Mr R I Allely’s STI is a fixed dollar value which is required to be converted to shares. 386,433 shares were purchased by the company on market in the current financial year. The number of shares purchased differed from the 423,173 per above due to movements in the share price from the estimate made on issue and the purchase dates.
<c> Options/rights lapsed on termination of employment.
2011_financials f.indd 40 9/6/2011 4:29:23 PM

41
2011Balance
1 July 2010On exercise of options/rights Purchases Sales Other
Balance 30 June 2011
Directors
G J Reaney 281,740 - 18,260 - - 300,000
R I Allely <a> 285,000 - - - 386,433 671,433
M Bickford-Smith - - 150,000 - - 150,000
I L Fraser 118,797 - 41,203 - - 160,000
P George 92,619 - - - - 92,619
Goh S N <b> - - - - - -
Ng J S <c> 35,000 - - - (35,000) -
N Sparks <b> - - - - - -
Total 813,156 - 209,463 - 351,433 1,374,052
Executives
C Amos - - - - - -
P Browne - - - - - -
A Clarkson - - - - - -
C Davison - - - - - -
G Plant - - - - - -
G Stephenson 50,000 - - - - 50,000
A Williams - - - - - -
Total 50,000 - - - - 50,000
Table 11. Share holdings key management personnel.
<a> Short term incentive 2009/2010. One-third of Mr R I Allely’s STI is a fixed dollar value which is required to be converted to shares. 386,433 shares were purchased by the company on market in the current financial year. The number of shares purchased differed from the 423,173 per Table 10 due to movements in the share price from the estimate made on issue and the purchase dates.
<b> Appointed 17/08/10.
<c> Retired 17/08/10.
2011_financials f.indd 41 9/6/2011 4:29:23 PM

42
6 Non-Executive Director RemunerationThe remuneration of Non-Executive Directors is determined by the full Board, within a maximum amount approved by shareholders in a general meeting and with regard to the level of fees paid to Non-Executive Directors by other companies of similar size.
The maximum allowance for the aggregate amount of fees has remained unchanged since 2004 at $750,000 per annum. In the last financial year, the Board allocated $647,756 of this amount for Non-Executive Director remuneration - as shown in Table 12.
Non-Executive Directors are not entitled to retirement benefits other than statutory superannuation or other statutory required benefits. Director fees (excluding superannuation) are comprised as follows:
• Chairman of the Board $170,550
• Non-Executive Director $75,000
• Chair of Audit and Risk Management Committee $20,000
• Member of Audit and Risk Management Committee $12,000
• Chair of Appointment and Compensation Committee $13,000
• Member of Appointment and Compensation Committee $8,000
• Statutory superannuation 9%
There is no element of Non-Executive Director salaries contingent on performance.
6.1 Performance AssessmentThe Board evaluates its performance every two years with performance assessments facilitated by an external party.
6.2 Retirement BenefitsNon-Executive Directors receive cash remuneration plus statutory superannuation contributions only. Payments for Directorship services provided by Dató Ng Jui Sia and Goh Sik Ngee do not include provisions for statutory superannuation contributions. Directors do not receive any retirement benefits.
2011_financials f.indd 42 9/6/2011 4:29:23 PM

43
Specified DirectorsSalary
and fees STI Share
purchases
Post employment
superannuation
Long term employment
LSL
Total excluding
share-basedEquity
share-basedGrand
total
$ $ $ $ $ $ $ $
G J Reaney (Board Chair) <a> 2011 170,701 - - 15,199 - 185,900 - 185,900
<a> 2010 171,439 - - 14,461 - 185,900 - 185,900
M Bickford-Smith 2011 100,000 - - 9,000 - 109,000 - 109,000
<g> 2010 81,349 - - 7,321 - 88,670 - 88,670
I L Fraser <b> 2011 96,030 - - 8,643 - 104,673 - 104,673
<h> 2010 105,301 - - 9,477 - 114,778 - 114,778
P George <c> 2011 72,227 - - 6,500 - 78,727 - 78,727
<i> 2010 20,102 - - 1,809 - 21,911 - 21,911
Goh S N <d> 2011 75,795 - - - - 75,795 - 75,795
M A Griffin 2011 N/A N/A N/A N/A N/A N/A N/A N/A
<j> 2010 34,305 - - 3,088 - 37,393 - 37,393
Ng J S <e> 2011 14,500 - - - - 14,500 - 14,500
2010 87,000 - - - - 87,000 - 87,000
N Sparks <f> 2011 72,625 - - 6,536 - 79,161 - 79,161
Total Remuneration:
- Non-Executive Directors 2011 601,878 - - 45,878 - 647,756 - 647,756
2010 499,496 - - 36,156 - 535,652 - 535,652
R I Allely (CEO) <k> 2011 840,551 347,327 - 15,199 13,883 1,216,960 105,693 1,322,653
2010 810,726 888,451 - 14,461 18,714 1,732,352 352,722 2,085,074
P George 2011 N/A N/A N/A N/A N/A N/A N/A N/A
<i> 2010 436,731 - - 12,051 - 448,782 - 448,782
Total Remuneration:
- Executive Directors 2011 840,551 347,327 - 15,199 13,883 1,216,960 105,693 1,322,653
2010 1,247,457 888,451 - 26,512 18,714 2,181,134 352,722 2,533,856
Total Remuneration:
- Directors 2011 1,442,429 347,327 - 61,077 13,883 1,864,716 105,693 1,970,409
2010 1,746,953 888,451 - 62,668 18,714 2,716,786 352,722 3,069,508
Table 12. Specified Director remuneration.See next page for notes applying to this Table.
2011_financials f.indd 43 9/6/2011 4:29:23 PM

44
<a> G J Reaney’s superannuation represents 9% of his fee up to the maximum superannuation contribution base of $168,880 for the 2011 financial year (2010: $160,680). The maximum superannuation contribution for the 2011 financial year was $15,199 (2010: $14,461).
<b> I L Fraser retired as a member of the Appointments and Compensation Committee on 17/08/10.
<c> P George received additional fees for consulting services. Refer to Note 24 for further information.
<d> Goh S N appointed Non-Executive Director of the Board and a member of the Audit and Risk Management Committee on 17/08/10. Payments made for Directorship services provided by Goh S N are made to Fraser & Neave (Singapore) Pte Ltd.
<e> Dató Ng Jui Sia retired as Non-Executive Director of the PMP Board and a member of the Audit and Risk Management Committee on 17/08/10. Payments made for Directorship services provided by Dató Ng Jui Sia are made to Fraser & Neave (Singapore) Pte Ltd.
<f> N Sparks appointed Non-Executive Director of the Board and a member of the Appointments and Compensation Committee on 17/08/10.
<g> M Bickford-Smith appointed on 20/07/09. He was appointed Chairman of the Appointment and Compensation Committee on 17/12/09.
<h> I L Fraser was the Chairman of the Appointment and Compensation Committee. He ceased being Chairman on 17/12/09. He is Chairman of the Audit and Risk Management Committee.
<i> On 7/04/10 P George stepped down from Executive General Manager (EGM) of the Print business. While EGM of the Print business he did not receive directors fees. Amounts received in his position as Non-Executive Director amounted to $21,911, made up of salary fees $20,102 and post employment superannuation $1,809. Amounts received in his position as Executive Director amounted to $448,782, made up of salary and fees $436,731 and post employment superannuation $12,051. P George received additional fees April 2010 to June 2010 for consulting services in relation to development and negotiation of the Enterprise Bargaining Agreement for PMP’s print operations. Refer to Note 24 for further information.
<j> M A Griffin retired 10/11/09.
<k> Equity share-based remuneration includes share-based STI of $53,858 and LTI of $51,835. One-third of R I Allely’s STI is a fixed dollar value which is required to be converted to shares. LTI relates to rights granted to R I Allely prior to his appointment as CEO.
This report has been made in accordance with a resolution of Directors.
Graham J Reaney Richard I Allely Chairman Managing Director and Chief Executive Officer
Sydney, 2 September 2011
Richard I Allely
2011_financials f.indd 44 9/6/2011 4:29:24 PM

45
INDEPENDENT AUDITOR’S DECLARATION
Deloitte Touche TohmatsuA.B.N. 74 490 121 060
Grosvenor Place225 George StreetSydney NSW 2000PO Box N250 Grosvenor PlaceSydney NSW 1220 Australia
DX 10307SSETel: +61 (0) 2 9322 7000Fax: +61 (0) 2 9322 7001www.deloitte.com.au
Liability limited by a scheme approved under Professional Standards Legislation. Member ofDeloitte Touche Tohmatsu
The Board of Directors
PMP Limited
Level 12
67 Albert Avenue
Chatswood NSW 2067
2 September 2011
Dear Directors,
PMP Limited
In accordance with section 307C of the Corporations Act 2001, I am pleased to provide the following declaration of independence to the directors of PMP Limited.
As lead audit partner for the audit of the financial statements of PMP Limited for the financial year ended 30 June 2011, I declare that to the best of my knowledge and belief, there have been no contraventions of:
(i) the auditor independence requirements of the Corporations Act 2001 in relation to the audit; and
(ii) any applicable code of professional conduct in relation to the audit.
Yours sincerely
DELOITTE TOUCHE TOHMATSU
G Couttas
Partner
Chartered Accountants
2011_financials f.indd 45 9/6/2011 4:29:25 PM

46
COMMENTARY ON THE ACCOUNTS
Geoff Stephenson B.Bus CPA GAICD
Chief Financial Officer, PMP Limited
As CFO of PMP, Geoff is responsible for all finance and support functions in the Company, leading a corporate team covering financial accounting and management reporting, treasury, taxation and investor relations.
Geoff has over 30 years of experience with a range of blue chip companies including Iplex Pipelines, Fairfax Media and Goodman Fielder. He has held a range of senior commercial and financial roles at both a divisional and head office level working in Australia and also offshore.
$M 2011 2010 % Change
EBITDA (before significant items) 100.1 92.8 7.8%
Depreciation and amortisation (43.4) (40.6) -
EBIT (before significant items) 56.7 52.2 8.5%
Finance costs (14.5) (15.3) -
Income tax expense (13.5) (12.4) -
Net profit (before significant items) 28.7 24.5 17.1%
Significant items (52.2) (5.5) -
Income tax benefit (on significant items) 12.2 1.6 -
Net (loss)/profit (11.3) 20.6 -
Operating Sales RevenueOperating sales revenue for fiscal 2011 was $1,194.3 million, a 1.5% decrease on the prior year, as higher revenues at Gordon and Gotch and Distribution were offset by reductions in other divisions. Print Australia’s revenue fell 4.0% or $19.8 million, with Heatset volumes flat vs fiscal 2010 while Directories and Griffin Press declined 12.7% year on year. Distribution Australia volumes increased by 7.9%, resulting in revenues increasing by 7.5%, or $6.3 million due to new contracts. For magazine distributor Gordon and Gotch, revenue increased 1.1%, or $4.5 million, on the back of new contracts. Revenue in the PMP Digital business decreased by
$2.5 million, or 8.0%, due to soft market conditions. Finally, revenue at PMP New Zealand fell by 3.3%, or $6.5 million, as higher Print and Distribution sales were offset by lower sales at Gordon & Gotch and sheetfed printing.
Earnings Before Interest and Tax (EBIT) The full-year EBIT (before significant items) was $56.7 million, up 8.5% or $4.4 million on the prior year. Despite falling revenue, Print Australia’s EBIT increased 16.0%, or $7.7 million on improved product mix and a continuation of tight cost controls around freight, logistics and outside work. Distribution Australia business posted a $3.3 million increase in operating earnings on higher volumes and network efficiencies, and Gordon and Gotch’s EBIT fell by $3.8 million mainly due to lower profits at Scribo book distribution. Corporate costs decreased by $1.3 million.
Net Profit After Tax (NPAT) NPAT reduced dramatically, with a loss of $11.3 million, compared to a profit of $20.6 million in the previous year due to $52.2 million of significant items that related to the transformation plan and impairment and closure of Scribo book distribution business. Interest expense on bank loans decreased by $2.6 million to $15.0 million as strong operating cashflows reduced average debt levels year on year.
Cash Flow The Groups’ net free cash flow was $27.1 million compared to $40.2 million in fiscal 2010. Higher EBITDA and lower interest expense were offset by transformation cashflows, dividends and the share buyback programme. This resulted in a net bank debt of $141.0 million, down from $168.1 million in the previous year.
Balance Sheet At year end, net assets for the group stand at $355.3 million, down from $374.9 million in the previous year. The Group’s gearing remains strong, with net debt / equity now standing at 39.7%, down from 44.8% last year, and interest cover improving from 5.3 to 6.7 times.
2011_financials f.indd 46 9/6/2011 4:29:26 PM

47
Segment Revenue
$M 2011 2010 VARIANCE
Sales revenue
Print Australia 472.4 492.1 (4.0%)
Distribution Australia 90.9 84.5 7.5%
Gordon and Gotch 413.4 408.9 1.1%
Digital Premedia 28.6 31.1 (8.0%)
New Zealand 189.0 195.5 (3.3%)
Total 1,194.3 1,212.1 (1.5%)
Segment EBIT before significant items
$M 2011 2010 VARIANCE
EBIT before significant items
Print Australia 55.4 47.7 16.0%
Distribution Australia 1.1 (2.2) -
Gordon and Gotch 3.7 7.5 (51.0%)
Digital Premedia 0.1 3.5 (96.0%)
New Zealand 4.8 5.5 (13.1%)
Corporate (8.4) (9.8) 13.7%
Total 56.7 52.2 8.5%
Cash Flow
$M 2011 2010
EBITDA before cash significant items 100.1 92.8
Cash significant items (7.8) (5.0)
EBITDA - cash 92.3 87.8
Borrowing costs (16.5) (17.1)
Income tax (paid)/refunds (1.0) 1.8
Net movement in working capital (4.6) 2.2
Cash flow from operating activities 70.2 74.7
Cash flow applied to investing activities (39.0) (32.5)
Dividends paid (3.4) -
Share buy-back (3.7) -
Gain/(loss) on New Zealand debt revaluation 3.0 (2.0)
Free cash flow 27.1 40.2*
* The 2010 financial year comparative has been restated to be consistent with the basis applied in the calculation in the 2011 financial year of free cash flow, where free cash flow reconciles to the movement in net debt year on year.
Balance SheetYear ended 30 June
$M 2011 2010
Current assetsCurrent assets 237.3 252.0
Non-current assetsNon-current assets 500.7 540.8
Total assetsTotal assets 738.0 792.8
Current liabilitiesCurrent liabilities 262.9 226.3
Non-current liabilitiesNon-current liabilities 119.8 191.6
Total liabilities 382.7 417.9
Net assets 355.3 374.9
2011_financials f.indd 47 9/6/2011 4:29:26 PM

48
PMP GROUP ($’000)
2 0 1 1 2 0 1 0
NOTES
Continuing operations
Sales revenue 2(a),21 1,194,261 1,212,139
Other revenue 2(a),21 11,705 9,283
Raw materials and consumables used (269,338) (294,242)
Cost of finished goods sold (404,007) (396,533)
Employee expenses (317,626) (308,746)
Outside production services (27,021) (30,728)
Freight (29,785) (28,276)
Repairs and maintenance (17,379) (23,492)
Occupancy costs (22,629) (22,540)
Other expenses (70,310) (29,511)
Depreciation and amortisation 2(e), 21 (43,401) (40,629)
Finance costs 3 (14,443) (15,359)
(Loss)/profit before income tax 2(c) (9,973) 31,366
Income tax expense:
Current tax (expense) in respect of the current period (11,612) (6,474)
Deferred tax benefit/(expense) relating to the current period 10,276 (4,254)
Total tax expense 4 (1,336) (10,728)
Net (loss)/profit after income tax (11,309) 20,638
Other comprehensive (expense)/income
Exchange differences arising on translation of foreign operations 82 (12)
(Loss)/gain on cash flow hedges taken to equity (1,380) 4,619
Defined benefit plan actuarial losses (732) (1,910)
Income tax relating to components of other comprehensive income 592 (809)
Other comprehensive (expense)/income for the period (net of tax) (1,438) 1,888
Total comprehensive (expense)/income for the year (12,747) 22,526
Basic earnings per share (cents) 27 (3.4) 6.2
Diluted earnings per share (cents) 27 (3.4) 6.1
Weighted average number of ordinary shares outstanding
during the period used in the calculation of basic earnings
per share ('000) 27(a) 334,405 335,349
* Revenue of $15.7 million (2010: $21.3 million), expenses of $45.1 million (2010: $23.5 million), loss before income tax of $29.4 million (2010: loss of $2.2 million), loss after income tax of $24.7 million (2010: loss of $2.0 million), significant items of expense of $25.7 million (2010: expenses of $0.2 million) and loss before interest and tax excluding significant items of $3.7 million (2010: loss of $2.0 million) are attributable to the book distribution business of Scribo. This business was closed on 30 June 2011.
The above statement of comprehensive income should be read in conjunction with the accompanying notes.
STATEMENT OF COMPREHENSIVE INCOMEYEAR ENDED 30 JUNE 2011
2011_financials f.indd 48 9/6/2011 4:29:26 PM

49
PMP GROUP ($’000)
2 0 1 1 2 0 1 0NOTES
Current assets
Cash and cash equivalents 28(b) 12,097 29,744
Receivables 5 132,794 119,374
Inventories 6 84,494 86,336
Other 7 7,946 8,708
237,331 244,162
Non-current assets classified as held for sale 8 - 7,878
Total current assets* 237,331 252,040
Non-current assets
Property, plant and equipment 9 334,703 349,113
Deferred tax assets 11 64,269 69,620
Goodwill and intangible assets 10 100,359 120,066
Other 7 1,398 1,951
Total non-current assets 500,729 540,750
Total assets 738,060 792,790
Current liabilities
Payables 12 172,373 170,297
Interest bearing liabilities - financial institutions 13(a) 45,166 25,037
Income tax payable 2,545 603
Financial liabilities 15 4,023 945
Provisions 14 38,770 29,400
Total current liabilities* 262,877 226,282
Non-current liabilities
Interest bearing liabilities - financial institutions 13(b) 107,911 172,768
Deferred tax liabilities 11 5,611 13,144
Financial liabilities 15 1,529 2,558
Provisions 14 4,797 3,153
Total non-current liabilities 119,848 191,623
Total liabilities 382,725 417,905
Net assets 355,335 374,885
Equity
Contributed equity 16 622,361 626,049
Reserves 18 960 1,648
Accumulated losses (267,986) (252,812)
Total equity 355,335 374,885
* As at 30 June 2011, the PMP Group has current liabilities in excess of current assets by $25.5 million. This is primarily as a result of loan facilities of $45.1 million due to mature on 4 May 2012. PMP has completed its refinancing to ensure that the Group has sufficient committed debt facilities out of which to meet this repayment. Refer to Note 13 for further details.
The above statement of financial position should be read in conjunction with the accompanying notes.
STATEMENT OF FINANCIAL POSITIONYEAR ENDED 30 JUNE 2011
2011_financials f.indd 49 9/6/2011 4:29:26 PM

50
STATEMENT OF CASH FLOWSYEAR ENDED 30 JUNE 2011
PMP GROUP ($’000)
2 0 1 1 2 0 1 0
NOTES
Cash flows from operating activities
Receipts from customers 1,312,965 1,362,573
Payments to suppliers and employees (1,225,793) (1,272,879)
Interest received 547 411
Interest and other costs of finance paid (16,493) (17,171)
Income tax (paid)/refund (992) 1,785
Net cash flow from/(used in) operating activities 28(a) 70,234 74,719
Cash flows from investing activities
Payments for acquisition of controlled entities/business operations 26 (2,248) (2,116)
Payments for property, plant and equipment (33,448) (30,538)
Proceeds from sale of property, plant and equipment 684 515
Payments for development costs and licences (4,035) (387)
Net cash flow (used in)/from investing activities (39,047) (32,526)
Cash flows from financing activities
Net (repayments of)/proceeds from borrowings (41,139) (45,327)
Payment of finance lease liabilities (57) (902)
Dividends paid to company's shareholders 17 (3,353) -
Payment for share buy-back 16 (3,688) -
Net cash flow (used in)/from financing activities (48,237) (46,229)
Net (decrease)/increase in cash and cash equivalents (17,050) (4,036)
Cash and cash equivalents at the beginning of the financial year 29,744 33,582
Effects of exchange rate changes on cash and cash equivalents (597) 198
Cash and cash equivalents at end of the financial year 28(b) 12,097 29,744
The above statement of cash flows should be read in conjunction with the accompanying notes.
2011_financials f.indd 50 9/6/2011 4:29:26 PM

51
STATEMENT OF CHANGES IN EQUITYYEAR ENDED 30 JUNE 2011
Attributable to equity holders of PMP Limited
Contributed equity
Accumulated losses
Foreign currency
translation reserve
Share-based payment reserve
Cash flow hedge
reserve
Total equity
$’000 $’000 $’000 $’000 $’000 $’000
PMP Group
At 1 July 2009 626,049 (272,113) 1,134 485 (3,833) 351,722
Currency translation differences - - (12) - - (12)
Cash flow hedges (net of tax) - - - - 3,237 3,237
Defined benefit plan (net of tax) - (1,337) - - - (1,337)
Total income/(expense) recognised directly in equity - (1,337) (12) - 3,237 1,888
Profit for the year - 20,638 - - - 20,638
Total comprehensive income/(expense) for the year - 19,301 (12) - 3,237 22,526
Share-based payments - - - 637 - 637
At 30 June 2010 626,049 (252,812) 1,122 1,122 (596) 374,885
At 1 July 2010 626,049 (252,812) 1,122 1,122 (596) 374,885
Currency translation differences - - 82 - - 82
Cash flow hedges (net of tax) - - - - (1,008) (1,008)
Defined benefit plan (net of tax) - (512) - - - (512)
Total (expense)/income recognised directly in equity - (512) 82 - (1,008) (1,438)
Loss for the year - (11,309) - - - (11,309)
Total comprehensive (expense)/income for the year - (11,821) 82 - (1,008) (12,747)
Dividends - (3,353) - - - (3,353)
Share buy-back (3,688) - - - - (3,688)
Share-based payments - - - 238 - 238
At 30 June 2011 622,361 (267,986) 1,204 1,360 (1,604) 355,335
The above statement of changes in equity should be read in conjunction with the accompanying notes.
2011_financials f.indd 51 9/6/2011 4:29:26 PM

5252
F I N A N C I A L I N D E X
1 Summary of significant accounting policies
Basis of preparationThe financial report is a general-purpose financial report, which has been prepared in accordance with the requirements of the Corporations Act 2001, Accounting Standards and Interpretations, and complies with other mandatory professional reporting requirements.
The financial report comprises the financial statements of the consolidated entity (PMP Group) consisting of PMP Limited (parent) and its controlled entities.
Historical cost convention
The financial statements have been prepared in accordance with the historical cost convention, except for the revaluation of derivative financial instruments and non-current assets classified as held for sale that have been measured at fair value and fair value less costs to sell respectively. Cost is based on the fair values of the consideration given in exchange for assets.
Statement of complianceCompliance with IFRS
The financial statements comply with Australian Accounting Standards, which include Australian Equivalents to International Financial Reporting Standards (‘AIFRS’). Compliance with AIFRS ensures that the financial statements, comprising the financial statements and notes, thereto comply with International Financial Reporting Standards (‘IFRS’).
Working capitalAs at 30 June 2011, the PMP Group has current liabilities in excess of current assets by $25.5 million. This is primarily as a result of loan facilities of $45.1 million due to mature on 4 May 2012. PMP has completed its refinancing to ensure that the Group has sufficient committed debt facilities out of which to meet this repayment. Refer to Note 13 for further details.
The Directors and management regularly monitor the Group’s working capital position, including forecast working capital requirements and have ensured that there are appropriate refinancing strategies and adequate committed facilities in place to accommodate debt repayments as and when they fall due.
Adoption of new and revised accounting standardsIn the current year, PMP Group has adopted all of the new and revised Standards and Interpretations issued by the Australian Accounting Standards Board (AASB) that are relevant to its operations and effective for the year ended 30 June 2011. The adoption of these amendments has not resulted in any changes to the Group’s accounting policies and has had no effect on the amounts reported in current or prior periods.
In accordance with the Corporate Reporting Reform Act 2010, the Group has streamlined parent entity reporting by no longer disclosing separate financial information relating to the parent. A note disclosure containing summary parent entity financial information has been included instead. Prior year comparatives have been restated. Refer to Note 32 for further details.
At the date of authorisation of the financial statements, the following
1 | Summary of significant accounting policies
2a | Revenue
2b | Significant items
2c | (Loss)/profit before income tax
2d | Auditors’ remuneration
2e | Depreciation and amortisation
3 | Finance costs
4 | Income tax
5 | Receivables
6 | Inventories
7 | Other assets
8 | Non-current assets classified as held for sale
9 | Property, plant and equipment
10 | Goodwill and intangible assets
11 | Deferred tax
12 | Payables
13 | Interest bearing liabilities
14 | Provisions
15 | Financial liabilities
16 | Contributed equity
17 | Dividends
18 | Reserves
19 | Commitments
20 | Controlled entities
21 | Segmental information
22 | Pension plans
23 | Share-based payment plans
24 | Related parties
25 | Key management personnel
26 | Business combinations
27 | Earnings per share
28 | Cash flow statement notes
29 | Financial instruments
30 | Contingent liabilities
31 | Subsequent events
32 | Parent
Directors’ declaration
Independent audit report
2011_financials f.indd 52 9/6/2011 4:29:27 PM
53
Standards and Interpretations relevant to the Group were in issue but not yet effective.
• AASB 124: Related Party Disclosures (2009), AASB 2009-12 Amendments to Australian Accounting Standards simplifies and clarifies the intended meaning of the definition of a related party and includes an explicit requirement to disclose commitments involving related parties.
• IAS 19: Employee Benefits (2011) revises the requirements for pensions, other post retirement benefits and termination benefits. It requires enhanced disclosures about defined benefit plans, recognition of changes in the net defined benefit liability (asset), modifies accounting for termination benefits and clarifies various miscellaneous issues.
• IFRS 13: Fair Value Measurement replaces the guidance on fair value measurement with a single standard defining and providing guidance on how to determine fair value and the disclosures for fair value measurements.
• IFRS 10: Consolidated Financial Statements introduces a single consolidation model for all entities based on control. Control is based on whether the investor has power over the investee, exposure or rights, to variable returns from its involvement with the investee, and the ability to use its power over the investee to affect the amount of the returns.
• IFRS 12: Disclosure of interest in other entities enables users to evaluate the nature of and risks associated with interests in other entities.
• AASB 9: Financial Instruments, AASB 2009-11 Amendments to Australian Accounting Standards includes requirements for the classification and measurement of financial assets.
The above standards and interpretations have been identified as those which may impact PMP Group in the period of initial application. They are operative in future financial years and have not been applied in preparing this report. The potential effect of the revised standards on the Group’s financial statements has not yet been determined.
Basis of consolidationThe consolidated financial statements are those of the economic entity (PMP Group) comprising PMP Limited (the head entity ‘PMP’) and its controlled entities.
The consolidated financial statements include the information contained in the financial statements of PMP and each of its subsidiaries as from the date PMP obtains control until such time as control ceases.
The financial statements of controlled entities are prepared for the same reporting period as PMP using consistent accounting policies.
All intercompany balances, transactions, and unrealised profits arising on transactions between Group companies have been eliminated in full.
Use of estimates and judgementsThe preparation of financial statements requires management to make judgements, estimates and assumptions that affect the application of accounting policies and the reported amounts of assets, liabilities, income and expenses. Actual results may differ from these estimates.
Estimates and underlying assumptions are reviewed on an ongoing basis. Revisions to accounting estimates are recognised in the period in which the estimate is revised and in any future periods affected.
In particular, information about significant areas of estimation uncertainty and critical judgements in applying accounting policies that have the most significant effect on the amount recognised in the financial statements are described in the following notes:
• Note 10: Impairment testing of goodwill and intangibles with indefinite useful lives
• Note 22: Pension plans actuarial assumptions
• Note 29: Financial instruments
Recoverable amount of assetsAt each reporting date, the PMP Group assesses whether there is any indication that an asset may be impaired. Where an indicator of impairment exists, the PMP Group makes a formal estimate of recoverable amount. Where the carrying amount of an asset exceeds its recoverable amount the asset is considered impaired and is written down to its recoverable amount.
Recoverable amount is the greater of fair value less costs to sell and value in use. It is determined for an individual asset, unless it does not generate inflows that are largely independent of those from other assets or groups of
assets, in which case, the recoverable amount is determined for the cash generating unit to which the asset belongs.
In assessing value in use, the estimated future cash flows are discounted to their present value using a pre-tax discount rate that approximates the weighted average cost of capital for that cash generating unit.
The assumptions used in the assessment of recoverable amount are discussed in Note 10.
Foreign currenciesBoth the functional and presentation currency of PMP Limited and its Australian subsidiaries is Australian dollars. The functional currencies of the overseas operations equates to their local currency.
Transactions in foreign currencies are converted to functional currency at the rate of exchange ruling at the date of the transaction.
Monetary amounts payable to and by the entities within the PMP Group that are outstanding at the balance date and are denominated in foreign currencies have been converted to functional currency using rates of exchange at the end of the year.
Non-monetary amounts that are measured at historical cost in a foreign currency are translated using the exchange rate as at the date of the initial transaction.
The assets and liabilities of the controlled entities incorporated overseas are translated into the PMP Group presentation currency at the rates of exchange ruling at balance date. The statements of comprehensive income are translated at an average rate for the year.
Exchange differences arising on translation are taken directly to the foreign currency translation reserve.
On the disposal of a foreign operation, a proportionate share of the amount recognised in the foreign currency translation reserve relating to that particular foreign operation is recognised in the statement of comprehensive income, as part of the gain or loss on sale.
Cash and cash equivalentsFor the purposes of the cash flow statement, cash includes cash on hand and in banks. Cash on hand and in banks is stated at nominal amount.
Trade receivablesTrade debtors are recognised and carried at original invoice amount less a provision for any uncollectible debts. An estimate for doubtful debts is made when collection of the full amount is no longer probable. Bad debts are written-off as incurred.
Receivables from related parties are recognised and carried at the nominal amount due less provision for amounts not receivable.
Inventories Inventories are valued at the lower of cost and net realisable value.
Costs incurred in bringing each product to its present location and condition are accounted for as follows:
• Raw materials: cost is determined by the average cost method; and
• Finished goods and work-in-progress: cost of direct material and labour and an appropriate proportion of fixed and variable manufacturing overheads based on normal operating capacity.
Property, plant and equipmentProperty, plant and equipment is stated at cost less accumulated depreciation and any impairment in value. Subsequent costs are included either in the asset’s carrying value or as a separate asset only when it is probable that future economic benefits will flow to the Group and the cost can be reliably measured.
Depreciation
Property, plant and equipment, excluding freehold land, is depreciated or amortised at rates based upon their expected useful lives using the straight line method. Major depreciation periods are consistent with the prior period and are as follows:
• Freehold buildings: 40 years
• Leasehold improvements: to the lease term
• Printing presses: 7.5 to 20 years
• Computer equipment: 3 to 4 years
2011_financials f.indd 53 9/6/2011 4:29:27 PM

54
Useful lives are reviewed, and adjusted, if appropriate at each reporting date.
Non-current assets (or disposal groups) held for sale
Non-current assets (or disposal groups) are classified as held for sale if their carrying value will be recovered principally through a sale transaction rather than through continuing use. They are measured at the lower of their carrying amount and fair value less costs to sell. An impairment loss is recognised for any initial or subsequent write-down of the asset. Non-current assets classified as held for sale are not depreciated while they are classified as held for sale.
Where subsequently the decision has been made not to sell an asset classified as held for sale, the asset is valued at the lower of its carrying amount before it was classified as held for sale, adjusted for depreciation that would have been recognised had the asset not been classified held for sale, and its recoverable amount.
PayablesLiabilities for trade creditors and other amounts are carried at cost which is the fair value of the consideration to be paid in the future for goods and services received, whether or not billed to the consolidated entity.
Payables to related parties are carried at the principal amount.
LeasesFinance leases, which transfer to the Group substantially all the risks and benefits incidental to ownership of the leased item, are capitalised at the lower of present value of the minimum lease payments or the fair value of the leased property, disclosed as leased property, plant and equipment, and amortised over the shorter of the lease term and useful life of the asset.
The cost of improvements to leasehold property related to these finance leases is capitalised and amortised over the unexpired period of the lease or the estimated useful lives of the improvements, whichever is the shorter.
Operating leases, which do not transfer to the Group substantially all the risks and benefits of the leased item, are not capitalised and rental payments are included in the determination of the operating profit in equal installments over the lease term.
In the event that lease incentives are received to enter into operating leases, such incentives are initially recorded as a liability and are then recognised as a reduction in rental expense on a straight line basis over the lease term.
Intangible assetsGoodwill
Goodwill represents the excess of the purchase consideration plus incidental expenses over the fair value of identifiable net assets and contingent liabilities acquired at the date of acquisition of a business.
Following initial recognition, goodwill is measured at cost less any accumulated impairment losses. Goodwill is not amortised, but is reviewed for impairment each reporting date, or more frequently if events or changes indicate that the carrying amount may be impaired.
At the date of any acquisition, goodwill acquired is allocated to the cash generating unit or groups of cash generating units expected to benefit from the acquisition.
Where the recoverable amount of the cash generating unit is less than the carrying amount of goodwill, an impairment loss is recognised.
Where goodwill forms part of a cash generating unit and part of the operation within that unit is disposed of, the goodwill associated with the operation disposed of is included within the carrying amount of the operation when determining the gain or loss on disposal of the operation.
Database and software development
Costs incurred in developing or acquiring products or systems that will generate future benefits are capitalised.
Amortisation is charged on a straight-line basis, the expense is taken to the statement of comprehensive income through the ‘amortisation’ line item as follows:
Database development costs: 3 years
Software development costs: 3 - 7 years
Useful lives are examined on an annual basis and adjustments, where applicable, are made on a prospective basis.
Customer contract
The PMP Group has a significant intangible asset which was acquired as part of a business combination relating to the directory printing contract.
Change in accounting estimate
From 1 July 2010, PMP Group commenced amortisation of the contract. The contract is being amortised over its remaining contractual life. Earnings before interest and tax for the year ended 30 June 2011 included contract amortisation of $2.5 million.
Brand/trademark
Brand and trademarks acquired as part of a business combination are recognised separately from goodwill. Brand and trademarks are carried at fair value at date of acquisition and are not amortised but are reviewed for impairment at each reporting date, or more frequently if events or changes indicate that the carrying amount may be impaired. At 30 June 2011 the Scribo brand/trademark was fully impaired.
Supplier and customer relationships
Supplier and customer relationships acquired as part of a business combination are recognised separately from goodwill. Supplier and customer relationships are carried at fair value at date of acquisition less accumulated amortisation. Amortisation is recognised over the remaining useful life of the asset although the pattern of benefits may not necessarily be received equally over the useful life. Estimated useful lives are as follows:
• Supplier relationships: 10 years
• Customer relationships: 5.75 years
At 30 June 2011 the Scribo supplier and customer relationships were fully impaired.
Revenue recognitionRevenues are recognised at the fair value of consideration received or receivable net of the amount of goods and services tax (GST).
Revenue is recognised to the extent that it is probable that the economic benefits will flow to the entity and the revenue can be reliably measured. Revenue is recognised net of returns, discounts and allowances.
When rendering services under contract and both the contract outcome can be reliably measured and control of the right to be compensated for the services and the stage of completion can be reliably measured, revenue is recognised on a progressive basis as the costs to complete the service contract are performed.
Dividend revenue is recognised when the Group’s right to receive payment is established.
Rental income is recognised as income in the periods in which it is earnt.
TaxesIncome tax
The income tax expense or benefit for the year is the tax payable on the current year’s taxable income based on the notional income tax rate for each jurisdiction adjusted by changes in deferred tax assets and liabilities attributable to temporary differences between the tax bases of assets and liabilities and their carrying amounts in the financial statements, and unused tax losses.
Deferred tax assets and liabilities are recognised for temporary differences at the rates expected to apply when the assets are recovered or liabilities are settled, based on the tax rates for each jurisdiction. The relevant tax rates are applied to the cumulative amounts of deductible and taxable temporary differences to measure the deferred tax asset or liability.
Deferred tax assets are recognised for deductible temporary differences and unused tax losses only if it is probable that future taxable amounts will be available to utilise those temporary differences and losses.
Tax consolidation legislation
PMP Limited and its wholly-owned Australian controlled entities have implemented tax consolidation legislation.
The head entity, PMP Limited, and the controlled entities in the tax consolidated group account for their own current and deferred amounts. These are measured as if each entity continued to be a stand alone taxpayer in its own right.
2011_financials f.indd 54 9/6/2011 4:29:27 PM
55
In addition to its own current and deferred tax amounts, PMP Limited also recognises the current tax liabilities (or assets) and the deferred tax assets rising from unused tax losses and unused tax credits assumed from controlled entities in the tax consolidated group. Assets or liabilities arising are accounted for in accordance with the tax funding agreement, details of which are disclosed in Note 4.
PMP’s 100% owned subsidiaries operating in New Zealand also adopt the same approach, with PMP (NZ) Limited heading up the consolidated tax group in New Zealand.
Goods and services tax (GST)
Revenues, expenses and assets are recognised net of the amount of GST except where:
• the GST incurred on purchase of goods and services is not recoverable from the taxation authority, in which case, the GST is recognised as part of the cost of acquisition of the asset or as part of the expense item applicable; and
• receivables and payables are stated with the GST amount included.
The net amount of GST recoverable from, or payable to, the taxation authority is included as part of receivables or payables in the balance sheet.
Cash flows are included in the cash flow statement on a gross basis and the GST component of cash flows arising from investing and financing activities, which is recoverable from, or payable to, the taxation authority are classified as operating cash flows.
Employee benefitsWages and salaries, annual leave, sick leave, workers’ compensation and long service leave
Provision has been made in the financial statements for benefits accruing to employees in relation to sick leave (where mandatory obligation exists), annual leave, long service leave and workers’ compensation. All on-costs, including superannuation, payroll tax, workers’ compensation premiums and fringe benefits tax are included in the determination of provisions.
Liabilities arising in respect of wages and salaries, annual leave, sick leave and any other employee benefits expected to be settled within twelve months of the reporting date are measured at their nominal amounts based on remuneration rates which are expected to be paid when the liability is settled. All other employee benefit liabilities are measured at the present value of the estimated future cash outflow to be made in respect of services provided by employees up to the reporting date. In determining the present value of future cash outflows, the market yield as at the reporting date on national government bonds, which have terms to maturity approximating the terms of the related liability, are used.
Employee benefit expenses and revenues arise in respect of the following categories:
• wages and salaries, non-monetary benefits, annual leave, long service leave, sick leave and other leave benefits; and
• other types of employee benefits are recognised against profits on a net basis in respective categories.
Superannuation
The PMP Group has a defined benefit fund that provides defined benefits based on years of membership and final average salary and accumulation benefits (defined contribution fund). Employees contribute to the plan at various percentages of their wages and salaries.
An asset or liability in respect of the defined benefit fund is recognised in the balance sheet, and is measured as the present value of the defined benefit obligation plus unrecognised actuarial gains/losses less the fair value of the superannuation fund’s assets at that date and any unrecognised past service cost. The present value of the defined benefit fund has been determined using the projected unit credit actuarial valuation method. Various assumptions are required when determining the Group’s benefit obligation. These assumptions and the related carrying amounts are discussed in Note 22.
Contributions to the defined contribution fund are recognised as an expense as they become payable.
Share-based payment transactions
Share-based payment transactions are provided to employees via the
PMP employee long term incentive plan and the CEO share rights scheme. Information relating to these schemes is set out in Note 23.
The fair value of rights/options is recognised as an employee benefit expense with a corresponding increase in equity. The fair value is measured at grant date and recognised over the period during which the employees become unconditionally entitled to the rights/options. The fair value is determined by an external valuer taking into account the terms and conditions upon which the instruments were granted as discussed in Note 23.
The fair value of the rights/options excludes the impact of any non-market based vesting conditions. Non-market based vesting conditions are included in assumptions about the number of rights/options that are expected to ultimately vest. At each balance sheet date, the PMP Group revises its estimate of the number of rights/options that are expected to become exercisable. The employee benefit expense recognised each period takes into account the most recent estimate.
No expense is recognised for rights/options that do not ultimately vest, except for rights/options where vesting is conditional upon a market condition.
Interest bearing liabilitiesAll loans are measured at the principal amount, being the fair value of the consideration received net of issue costs associated with the borrowing.
After initial recognition, loans are subsequently measured at amortised cost using the effective interest method. Amortised cost is calculated by taking into account any issue costs, and any discount or premium on settlement.
Finance costsInterest costs on funds invested in qualifying assets are recorded as a capitalised cost of the project until commercial production commences. Thereafter, the capitalised interest is amortised over the period that the benefits are expected to be received. Other finance costs are expensed.
ProvisionsProvisions are recognised when the PMP Group has a legal, equitable or constructive obligation to make a future sacrifice of economic benefits to other entities as a result of past transactions or other past events, it is probable that a future sacrifice of economic benefits will be required and a reliable estimate can be made of the amount of the obligation.
If the effect of the time value of money is material, provisions are determined by discounting the expected future cash flows at a pre-tax rate that reflects current market assessments of the time value of money and, where appropriate, the risks specific to the liability. Where discounting is used, the increase in the provision due to the passage of time is recognised as a finance cost.
Financial instrumentsThe PMP Group uses derivative financial instruments such as forward exchange contracts and interest rate swaps to hedge its risks associated with interest rate and foreign currency fluctuations. Derivative financial instruments are initially recognised at cost on the date a derivative contract is entered into and are subsequently re-measured to their fair value.
The fair value of forward exchange contracts is calculated by reference to current forward contracts with similar maturity profiles. The fair value of interest rate swap contracts is determined by reference to market values for similar instruments.
The method of recognising the resulting gain or loss depends on whether the derivative is designated as a hedging instrument, and if so, the nature of the hedge relationship. The PMP Group policy is to undertake hedging in respect of certain recognised assets or liabilities or a firm commitment (fair value hedge relationships); and for highly probable forecast sales or purchases (cash flow hedge relationships).
The PMP Group documents at the inception of the transaction the relationship between hedging instruments and hedged items, as well as its risk management objective and strategy for undertaking various hedge transactions. The PMP Group also documents its assessment, both at hedge inception and on an ongoing basis, of whether the derivatives that are used in the hedging relationship have been and will continue to be highly effective in offsetting changes in fair values and cash flows of hedged items.
(i) Fair value hedge
Changes in fair value of derivatives that are designated and qualify as fair value hedges are recorded in the statement of comprehensive income,
2011_financials f.indd 55 9/6/2011 4:29:27 PM

56
together with any changes in the fair value of the hedged asset or liability that are attributable to the hedged risk.
(ii) Cash flow hedge
The effective portion of changes in the fair value of derivatives that are designated and qualify as cash flow hedges is recognised in equity in the hedging reserve. The gain or loss relating to the ineffective portion is recognised immediately in the statement of comprehensive income.
Amounts accumulated in equity are recycled in the statement of comprehensive income in the periods when the hedged item will affect the profit and loss. However, when the forecast purchase or sale transaction that is hedged results in the recognition of a non-financial asset, the gains and losses previously deferred in equity are transferred from equity and included as a basis adjustment to the initial cost or carrying amount of the asset.
Hedge accounting is discontinued when the hedging instrument expires or is sold, terminated or exercised, or no longer qualifies for hedge accounting. At that point in time, any cumulative gain or loss on the hedging instrument recognised in equity is kept in equity until the forecasted transaction occurs. If a hedged transaction is no longer expected to occur, the net cumulative gain or loss recognised in equity is transferred to net profit or loss for the year.
(iii) Derivatives that do not qualify for hedge accounting
Certain derivatives do not qualify for hedge accounting. Changes in the fair value of any derivative instrument that does not qualify for hedge accounting are recognised immediately in the statement of comprehensive income.
Earnings per shareBasic EPS is calculated as net result attributable to members, adjusted to exclude costs of servicing equity (other than dividends), divided by the weighted average number of ordinary shares, adjusted for any bonus element.
Diluted EPS is calculated as net result attributable to members, adjusted for:
- costs of servicing equity (other than dividends);
- the after tax effect of dividends and interest associated with dilutive potential ordinary shares that have been recognised as expenses; and
- other non-discretionary changes in revenues or expenses during the period that would result from the dilution of potential ordinary shares;
divided by the weighted average number of ordinary shares and dilutive potential ordinary shares, adjusted for any bonus element.
Contributed equityIssued and paid up capital is recognised at the fair value of the consideration received by the company. Any transaction costs arising on the issue of the ordinary shares are recognised directly in equity as a reduction of the share proceeds received. Transaction costs arising on the buy-back of ordinary shares is also recognised directly in equity as an increase in the cost of the buy-back.
DividendsProvision is made for the amount of any dividend declared, being properly authorised and no longer at the discretion of the entity, on or prior to the financial year end but not distributed at balance date.
Segment reportingOperating segments are reported in a manner consistent with the internal reporting provided to the chief operating decision maker. The chief operating decision maker is responsible for allocating resources and assessing performance of the operating segments. Segment information is presented on the same basis as that used for internal reporting purposes.
Business combinationsThe purchase method of accounting is used to account for all business combinations. Cost is measured at fair value of the assets given, equity instruments issued or liabilities incurred plus costs directly attributable to the acquisition.
Identifiable assets acquired and liabilities and contingent liabilities assumed in a business combination are measured initially at fair value at acquisition date. The excess of cost over the fair value of net assets acquired is recorded as goodwill. If the cost of acquisition is less than the fair value of the net assets acquired, the difference is recognised directly in the statement of
comprehensive income.
Contingent consideration is measured at its acquisition date at fair value. Changes in the fair value of the contingent consideration that qualify as measurement period adjustments are adjusted retrospectively, with corresponding adjustments against goodwill. Measurement period adjustments are adjustments that arise from additional information obtained during the “measurement period’ (which cannot exceed one year from the acquisition date) about facts and circumstances that existed at the acquisition date. The subsequent accounting for changes in the fair value of contingent consideration that do not qualify as measurement period adjustments and are classified as an asset or liability are remeasured at subsequent reporting dates through profit or loss.
Acquisition related costs are expensed as incurred.
Comparative amountsWhere necessary, comparatives have been reclassified and repositioned for consistency with current year disclosures.
2011_financials f.indd 56 9/6/2011 4:29:27 PM

57
Notes to and forming part of the financial statements
PMP GROUP ($’000)
2 0 1 1 2 0 1 0YEAR ENDED 30 JUNE 2011 NOTES
2a Revenue
Sales revenue 1,194,261 1,212,139
Included in (loss)/profit before income tax are the following items of other revenue:
Other income - external 5,017 5,595
Rental income 3,710 3,277
Interest
Bank interest 3 547 411
Gain on sale of land and buildings 2(b) 2,431 -
Total other revenue 11,705 9,283
Total revenue 21 1,205,966 1,221,422
Revenue of $15.7 million (2010: $21.3 million) is attributable to the book distribution business of Scribo which was closed on 30 June 2011.
2b Significant items
Included in net (loss)/profit after income tax are the following significant items of income and expense:
Significant income and expenses
Loss on closure of Scribo excluding fixed asset impairments 4,414 -
Loss on closure of Scribo - fixed asset impairments 1,827 -
Gain on sale of land and buildings (2,431) -
Restructure initiatives and other one off costs 16,030 5,129
Impairment of plant, equipment and goodwill due to restructure initiatives 5,487 378
Impairment of plant and equipment held for sale to fair value less costs to sell 7,628 -
Impairment of Scribo goodwill, intangibles and plant and equipment 19,240 -
Total significant items (included in (loss)/profit before finance costs and income tax) 52,195 5,507
Tax benefit associated with significant items 12,175 1,652
Loss on closure of Scribo comprises the following: redundancies of $1.0 million, write down of inventory of $1.6 million, write down of fixed assets of $1.8 million, additional provision for expected returns of stock in market net of recoveries of $1.3 million and other costs of $0.5 million.
Significant items of expense have been recorded under cost of finished goods sold, employee expenses, occupancy costs and other expenses. The significant item of revenue has been recorded under other income.
2011_financials f.indd 57 9/6/2011 4:29:28 PM

58
Notes to and forming part of the financial statements
PMP GROUP ($’000)
2 0 1 1 2 0 1 0YEAR ENDED 30 JUNE 2011 NOTES
2c (Loss)/profit before income tax
(Loss)/profit before income tax is arrived at after charging/(crediting) the following items:
Cost of goods sold 938,257 963,396
Lease rental expenses - operating leases 22,403 20,779
Net foreign exchange loss 201 128
Share-based payment plans 18 513 637
Net loss on disposal of property, plant and equipment 10 183
Impairment of goodwill, intangibles, plant and equipment 2(b) 34,182 378
Loss on closure of Scribo excluding fixed asset impairments 2(b) 4,414 -
Provisions (net movement):
Doubtful debtors 5 525 667
2d Auditors’ remuneration2 0 1 1 2 0 1 0
($) ($)
Auditing the accounts
Chief entity auditors: Deloitte Touche Tohmatsu 392,825 402,767
Other services
Deloitte Touche Tohmatsu: - Due diligence 25,203 -
- Taxation compliance and consulting 246,079 303,319
- Verification services - 5,250
Total auditors’ remuneration 664,107 711,336
2e Depreciation and amortisation2 0 1 1 2 0 1 0($’000) ($’000)
Depreciation
Freehold buildings 9(a) 2,201 2,063
Leasehold improvements 9(a) 989 889
Plant and equipment 9(a) 36,350 36,475
Leased plant and equipment 9(a) 44 30
Total depreciation 39,584 39,457
Amortisation
Development and licence costs 10(a) 993 526
Supplier relationships 10(a) 267 533
Customer relationships 10(a) 57 113
Contract intangible 10(a) 2,500 -
Total amortisation 3,817 1,172
Total depreciation and amortisation * 43,401 40,629
* Depreciation and amortisation of $0.6 million (2010: $0.9 million) is attributable to the book distribution business of Scribo which was closed on 30 June 2011.
3 Finance costs
Interest expense
Bank loans and overdraft 14,956 17,583
Finance lease charges 19 60
Total interest expense 14,975 17,643
Interest rate swaps (gains) (532) (2,284)
Total finance costs 14,443 15,359
Interest income 2(a) (547) (411)
Net finance costs 13,896 14,948
2011_financials f.indd 58 9/6/2011 4:29:28 PM

59
Notes to and forming part of the financial statements
PMP GROUP ($’000)
2 0 1 1 2 0 1 0YEAR ENDED 30 JUNE 2011
4 Income tax
(a) Reconciliation of income tax expense/(benefit)
(Loss)/profit before income tax (9,973) 31,366
Prima facie income tax (benefit)/expense thereon at 30% (2010: 30%) (2,992) 9,410
Tax effect of timing and other differences:
Non assessable income (590) -
Investment allowance (51) (620)
Recognition of increased deferred tax liability on New Zealand buildings due to change in legislation - 1,093
Change in tax rate in New Zealand 505 -
Income tax (over)/under provided in previous year (6) 408
Non deductible items for tax purposes 6,546 437
Derecognition of deferred tax liabilities due to sale of assets and closure of business (2,076) -
Income tax expense attributable to (loss)/profit 1,336 10,728
Major component of income tax expense:
Current tax expense 11,612 6,474
Deferred tax (benefit)/expense (10,276) 4,254
Income tax expense attributable to (loss)/profit 1,336 10,728
(b) Deferred tax assets and deferred tax liabilities
At 30 June 2011 there is no recognised or unrecognised deferred tax liability for taxes that would be payable on the unremitted earnings of PMP’s wholly owned subsidiaries, as the PMP Group has no liability for additional taxation should such amounts be remitted (2010: $nil).
(c) Franking credits
The amount of franking credits available are:
Franking account balance as at the end of the financial year at 30% (2010: 30%) 1,500 1,973
Franking credits that will arise from the payment of income tax payable as at the end of the financial year
2,516 603
Franking debits that will arise from the dividends declared subsequent to balance date but not recognised as a distribution to equity holders during the period*
(1,414) (1,437)
Franking account balance 2,602 1,139
* The ATO has expressed a preliminary view in two draft fact sheets released on 21 June 2011 that following a change to the Corporations Law and consequent change to Tax Law, broadly, where a company’s net assets are less than its share capital and it debits the dividend to its accumulated losses account, the dividend is not frankable. However, the ATO’s draft fact sheets do not address PMP Limited’s circumstances being the distribution of dividends from the parent entity’s current year profits, which should not be affected by the change to Tax Law, and has been accepted practice in the past. PMP has been informed that the ATO is currently considering this matter. If the matter remains uncertain, PMP will seek a binding private ruling on its ability to distribute a fully franked dividend prior to the dividend distribution date and will inform the market accordingly.
(d) Tax consolidation and tax effect accounting by members of the tax consolidated group
Effective 1 July 2003, for the purposes of income taxation, PMP Limited and its 100% owned Australian subsidiaries formed a tax consolidated group. Members of the group have entered into a tax sharing arrangement in order to allocate income tax expense to the wholly owned subsidiaries on a pro-rata basis. The agreement also provides for the allocation of income tax liabilities between the entities should the head entity default on its obligations. At the balance date the possibility of default is remote. The head entity of the tax consolidation group is PMP Limited.
Members of the Australian tax consolidated group have entered into a tax funding agreement. The tax funding agreement provides for the allocation of current tax assets and liabilities between wholly owned group members. Each group member of the PMP tax group calculates its current year tax liability on the basis of the stand alone approach. Once each member has calculated its own current year tax liability/tax loss the head entity will then assume these current year tax liabilities/tax losses and be paid/pay compensation for this assumption by way of an intercompany receivable/payable. Allocations under the tax funding agreement are made on a yearly basis.
All 100% owned PMP entities operating in New Zealand are members of the PMP (NZ) Limited tax consolidated group. Although there is no NZ tax funding agreement, PMP (NZ) Limited and its group members have also calculated their current year tax liabilities/tax losses, and PMP (NZ) Limited is paid/pays compensation for this assumption by way of an intercompany receivable/payable on a yearly basis, in the same manner as the Australian tax funding agreement operates.
2011_financials f.indd 59 9/6/2011 4:29:28 PM

60
Notes to and forming part of the financial statements
PMP GROUP ($’000)
2 0 1 1 2 0 1 0YEAR ENDED 30 JUNE 2011 NOTES
5 Receivables
Trade debtors* 127,949 121,024
Provision for doubtful debts 5(a) (2,547) (3,046)
Net trade debtors 125,402 117,978
Other debtors 5(c) 7,392 1,396
Total current receivables 132,794 119,374
* Trade debtors are non-interest bearing and are on commercial terms. There were no material unhedged foreign currency receivables.
(a) Impaired trade receivables
PMP Group:At 30 June 2011 $3,952,000 (2010: $3,613,000) nominal value trade receivables have been identified as either fully or partially impaired. As a result, a provision of $2,547,000 (2010: $3,046,000) has been recognised. The individually impaired receivables relate to a variety of customers who are in unexpectedly difficult economic situations. It was assessed that a portion of the receivable is expected to be recovered.
Movements in the provision for doubtful debts are as follows:
Balance as at 1 July 3,046 2,771
Provision for doubtful debts recognised 1,121 898
Amounts written off (1,024) (392)
Amounts recovered (70) (114)
Unused amount reversed (512) (108)
Net foreign currency translation difference (14) (9)
Balance at 30 June 2,547 3,046
In determining the recoverability of trade receivables the Group will consider any change in the credit quality of the receivable from the date credit was originally granted up to the reporting date. The creation and release of the provision for impaired receivables has been included in “other expenses” in the statement of comprehensive income. Amounts due are generally written off when there is no expectation of recovering additional cash.
(b) Past due but not impaired
At 30 June 2011 there were $18,923,000 (2010: $13,174,000) of trade receivables in the PMP Group past due but not impaired.
The aging analysis of these trade receivables is as follows:
Past due 1 - 30 days 14,590 10,388
Past due 31 - 60 days 2,175 1,809
Past due 61 - 90 days 794 400
Past due greater than 90 days 1,364 577
18,923 13,174
There are no receivables that have had renegotiated terms that would otherwise, without that renegotiation, have been past due or impaired.
(c) Other debtors
Other debtors generally arise from transactions outside of usual operating activities of the Group. Other debtors does not contain impaired assets and are not past due. Collateral is not usually obtained.
2011_financials f.indd 60 9/6/2011 4:29:28 PM

61
Notes to and forming part of the financial statements
PMP GROUP ($’000)
2 0 1 1 2 0 1 0YEAR ENDED 30 JUNE 2011 NOTES
6 Inventories
Raw materials, spare parts and stores at cost 45,666 40,952
Less: provision for diminution (1,470) (1,208)
Net raw materials, spare parts and stores 44,196 39,744
Finished goods at cost 35,853 37,859
Work in progress at cost 4,445 8,733
Total current inventories 84,494 86,336
7 Other assets
Current other assets
Prepayments 7,946 8,708
Total current other assets 7,946 8,708
Non-current other assets
Shares in other entities - unlisted at cost 280 280
Write-down to realisable value (40) (40)
Other assets 531 1,007
Pension asset 22(b) 627 704
Total non-current other assets 1,398 1,951
8 Non-current assets classified as held for sale
Plant and equipment 8(a) - 7,878
Total non-current assets classified as held for sale - 7,878
(a) Reconciliation
Carrying amount at beginning of year 7,878 7,878
Impairment on remeasurement to fair value less costs to sell (7,628) -
Removal of assets no longer classified as held for sale (250) -
Carrying amount at end of year - 7,878
The impairment has been recognised in the statement of comprehensive income within “other expenses” and has arisen due to the depressed global market for such assets.
2011_financials f.indd 61 9/6/2011 4:29:28 PM

62
Notes to and forming part of the financial statements
PMP GROUP ($’000)
2 0 1 1 2 0 1 0YEAR ENDED 30 JUNE 2011 NOTES
9 Property, plant and equipment
Land
At cost 9(a) 16,098 16,936
Freehold buildings
At cost 59,793 56,849
Accumulated depreciation (20,946) (20,323)
Net freehold buildings 9(a) 38,847 36,526
Leasehold improvements
At cost 7,790 7,900
Accumulated amortisation (3,751) (4,487)
Impairment 9(b) (321) -
Net leasehold improvements 9(a) 3,718 3,413
Plant and equipment
At cost 734,184 696,928
Accumulated depreciation (451,870) (404,502)
Impairment 9(b) (6,420) (378)
Net plant and equipment 9(a) 275,894 292,048
Leased plant and equipment
At cost 220 220
Accumulated depreciation (74) (30)
Net leased plant and equipment 9(a) 146 190
Total net property, plant and equipment 9(a) 334,703 349,113
2011_financials f.indd 62 9/6/2011 4:29:28 PM
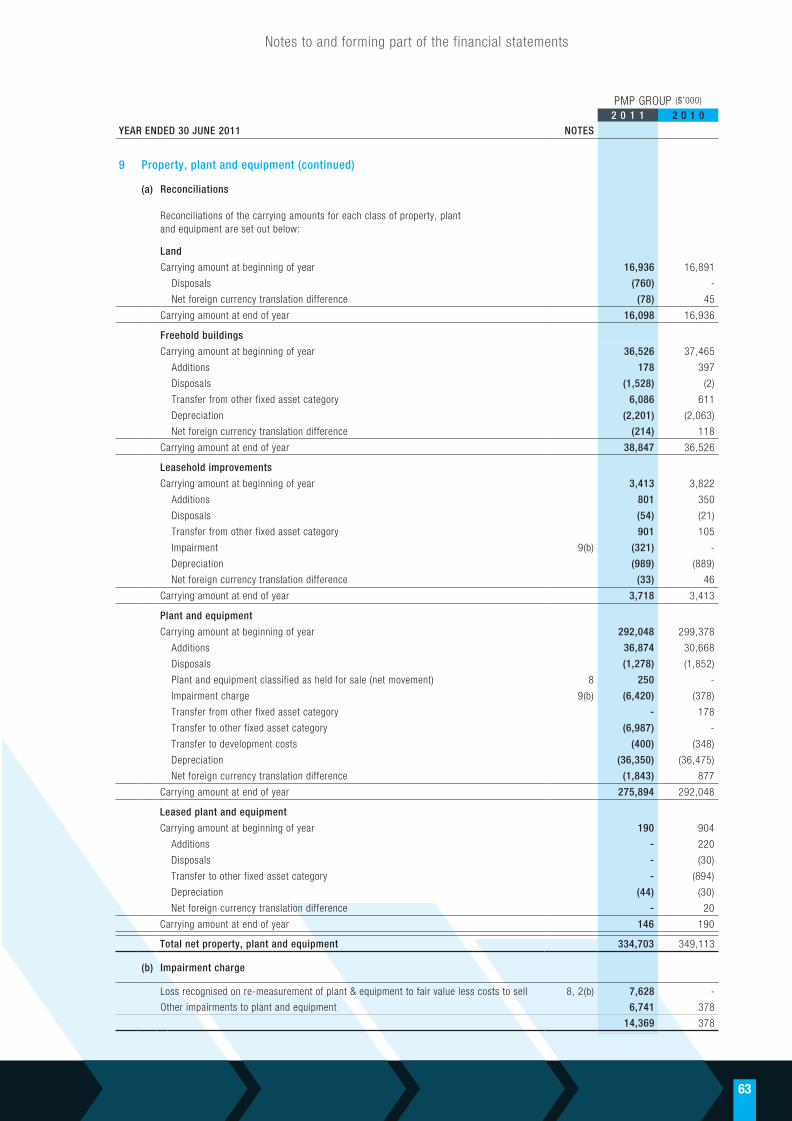
63
Notes to and forming part of the financial statements
PMP GROUP ($’000)
2 0 1 1 2 0 1 0YEAR ENDED 30 JUNE 2011 NOTES
9 Property, plant and equipment (continued)
(a) Reconciliations
Reconciliations of the carrying amounts for each class of property, plant and equipment are set out below:
Land
Carrying amount at beginning of year 16,936 16,891
Disposals (760) -
Net foreign currency translation difference (78) 45
Carrying amount at end of year 16,098 16,936
Freehold buildings
Carrying amount at beginning of year 36,526 37,465
Additions 178 397
Disposals (1,528) (2)
Transfer from other fixed asset category 6,086 611
Depreciation (2,201) (2,063)
Net foreign currency translation difference (214) 118
Carrying amount at end of year 38,847 36,526
Leasehold improvements
Carrying amount at beginning of year 3,413 3,822
Additions 801 350
Disposals (54) (21)
Transfer from other fixed asset category 901 105
Impairment 9(b) (321) -
Depreciation (989) (889)
Net foreign currency translation difference (33) 46
Carrying amount at end of year 3,718 3,413
Plant and equipment
Carrying amount at beginning of year 292,048 299,378
Additions 36,874 30,668
Disposals (1,278) (1,852)
Plant and equipment classified as held for sale (net movement) 8 250 -
Impairment charge 9(b) (6,420) (378)
Transfer from other fixed asset category - 178
Transfer to other fixed asset category (6,987) -
Transfer to development costs (400) (348)
Depreciation (36,350) (36,475)
Net foreign currency translation difference (1,843) 877
Carrying amount at end of year 275,894 292,048
Leased plant and equipment
Carrying amount at beginning of year 190 904
Additions - 220
Disposals - (30)
Transfer to other fixed asset category - (894)
Depreciation (44) (30)
Net foreign currency translation difference - 20
Carrying amount at end of year 146 190
Total net property, plant and equipment 334,703 349,113
(b) Impairment charge
Loss recognised on re-measurement of plant & equipment to fair value less costs to sell 8, 2(b) 7,628 -
Other impairments to plant and equipment 6,741 378
14,369 378
2011_financials f.indd 63 9/6/2011 4:29:29 PM

64
Notes to and forming part of the financial statements
PMP GROUP ($’000)
2 0 1 1 2 0 1 0YEAR ENDED 30 JUNE 2011 NOTES
10 Goodwill and intangible assets
Development and licence costs
At cost 11,166 6,627
Accumulated amortisation (6,719) (5,771)
Impairment* (33) -
Closing net book amount 10(a) 4,414 856
Supplier relationships
At cost 5,331 5,331
Accumulated amortisation (1,244) (977)
Impairment* (4,087) -
Closing net book amount 10(a) - 4,354
Customer relationships
At cost 652 652
Accumulated amortisation (264) (207)
Impairment* (388) -
Closing net book amount 10(a) - 445
Contract intangible
At cost 15,011 15,011
Accumulated amortisation (2,500) -
Closing net book amount** 10(a) 12,511 15,011
Goodwill (indefinite useful life)
At cost 98,760 97,825
Impairment* (14,255) -
Net foreign currency translation difference (1,071) 525
Closing net book amount 10(a) 83,434 98,350
Brand/trademark (indefinite useful life)
At cost 1,050 1,050
Impairment* (1,050) -
Closing net book amount 10(a) - 1,050
Total net intangibles 10(a) 100,359 120,066
2011_financials f.indd 64 9/6/2011 4:29:29 PM

65
Notes to and forming part of the financial statements
PMP GROUP ($’000)
2 0 1 1 2 0 1 0YEAR ENDED 30 JUNE 2011 NOTES
10 Goodwill and intangible assets (continued)
(a) Reconciliations
Development and licence costs
Carrying amount at beginning of year 856 1,034
Additions 4,184 -
Transfer from plant and equipment 400 348
Impairment* (33) -
Amortisation (993) (526)
Carrying amount at end of year 4,414 856
Supplier relationships
Carrying amount at beginning of year 4,354 4,887
Impairment* (4,087) -
Amortisation (267) (533)
Carrying amount at end of year - 4,354
Customer relationships
Carrying amount at beginning of year 445 558
Impairment* (388) -
Amortisation (57) (113)
Carrying amount at end of year - 445
Contract intangible
Carrying amount at beginning of year 15,011 15,011
Amortisation** (2,500) -
Carrying amount at end of year 12,511 15,011
Goodwill (indefinite useful life)
Carrying amount at beginning of year 98,350 95,726
Additions via acquisition 26 310 2,484
Adjustment to prior acquisition 100 (385)
Impairment* (14,255) -
Net foreign currency translation difference (1,071) 525
Carrying amount at end of year 83,434 98,350
Brand/trademark (indefinite useful life)
Carrying amount at beginning of year 1,050 1,050
Impairment* (1,050) -
Carrying amount at end of year - 1,050
Total net intangibles 100,359 120,066
* The book distribution business of Scribo was adversely affected by difficult trading conditions, growing transition to digital platforms, the appreciation of the Australian dollar and lack of new titles by local and overseas publishers. This has resulted in a decline in sales. In line with the changing economic conditions, the long term cash flow forecasts associated with the book distribution business were revised and a decision was made to close this business on 30 June 2011. This resulted in an impairment charge of $19.1 million being recorded against the goodwill and intangibles in the book distribution business. The carrying amount of the goodwill and intangibles in the book distribution business after the impairment charge was nil. Goodwill also includes an impairment of $0.7 million resulting from restructuring activities in New Zealand.
** From 1 July 2010, PMP Group commenced amortisation of a long term print customer contract. Previously no amortisation was provided against this contract on the basis that it had an indefinite life. With declines in revenues due to growth of the digital advertising market, management has revised this treatment. The contract is now being amortised over its remaining contractual life. Earnings before interest and tax included contract amortisation of $2.5 million.
2011_financials f.indd 65 9/6/2011 4:29:29 PM

66
Area of judgement Assumption used in value in use calculation
Budgeted EBITDA The Group prepares three year plans which are internally approved by senior management and the Board of Directors. These plans are the basis of its impairment testing.
Budgeted EBITDA is calculated as operating profit before depreciation and amortisation, based upon past experience and future outlook. Adjustments are made to budgeted EBITDA as follows: - removal of benefits from future uncommitted restructuring - inclusion of working capital movements - recognition of foreign exchange movements from budgeted rates
Long term growth rate Management’s plan is used for the first three years of the Group’s value in use calculations. An annual growth rate is assumed for years four and five of 2.5% except where markets are forecast to grow ahead of the long term growth rate and where management have identified specific reasons for growth e.g. product mix and efficiency savings. After year five, growth is annualised at 2.5% to perpetuity.
Budgeted capital expenditure The cash flow forecasts for capital expenditure are based on past experience and include the ongoing capital expenditure required to maintain current fixed asset levels after taking into account budgeted repairs and maintenance.
Pre-tax discount rate The pre-tax discount rate applied to the cash flows of each of the Group’s cash generating units in Australia and New Zealand are 16.65% and 16.09% respectively (2010: 16.03% & 16.28%). The discount rate is based on the risk free rate for ten year government bonds adjusted for a risk premium to reflect the increased risk of investing in equities (“equity market risk premium”) and the systematic risk adjustment (“beta”) to reflect the risk of the Company relative to the market as a whole.
Notes to and forming part of the financial statements
PMP GROUP ($’000)
2 0 1 1 2 0 1 0YEAR ENDED 30 JUNE 2011 NOTES
10 Goodwill and intangible assets (continued)
(b) Impairment testing of goodwill and intangibles with indefinite lives (continued)
Carrying amount of goodwill and intangibles with indefinite useful lives allocated to each cash generating unit:
Heat set web printing - Australia 56,034 56,034
Directory printing - Australia 2,643 17,654
Griffin Press printing - Australia 5,015 5,015
Maxum and heat set web printing - New Zealand* 15,405 16,198
Scribo Group - Australia** - 14,532
Other - New Zealand 4,337 4,978
Total goodwill and intangibles (indefinite useful life) 83,434 114,411
Goodwill (indefinite useful life) 83,434 98,350
Contract (indefinite useful life)*** - 15,011
Trademark/brand (indefinite useful life)** - 1,050
Total goodwill and intangibles (indefinite useful life) 83,434 114,411
* The goodwill associated with the acquisitions of the Cebury Group and Saxon Print is tested for impairment by combining the cash generating units of heat set web printing-New Zealand and Maxum (formerly Cebury Group and Saxon Print) as these units together represent the lowest level that goodwill is monitored for internal management purposes.
** The book distribution business of Scribo was adversely affected by difficult trading conditions, growing transition to digital platforms, the appreciation of the Australian dollar and lack of new titles by local and overseas publishers. The intangibles and goodwill were impaired and the business was closed on 30 June 2011.
*** During the year PMP Group commenced amortisation of a long term print customer contract of $15 million allocated to the Directory Printing Australia cash generating unit. Previously no amortisation was provided against this contract on the basis that it had an indefinite life.
Key assumptions:
Management judgement is required in assessing whether the carrying value of assets can be supported by the net present value of future cash flows. The following are the key estimates and assumptions used in determining the net present value of future cash flows:
2011_financials f.indd 66 9/6/2011 4:29:29 PM

67
Notes to and forming part of the financial statements
PMP GROUP ($’000)
2 0 1 1 2 0 1 0YEAR ENDED 30 JUNE 2011 NOTES
11 Deferred tax
Deferred tax assets
Temporary differences:
- Provisions/accruals 20,733 17,388
- Cash flow hedges 851 546
Tax losses 42,685 51,686
Total deferred tax assets 64,269 69,620
Deferred tax liabilities
Temporary differences:
- Property, plant and equipment 4,844 9,132
- Other assets 531 1,272
- Intangible assets 236 2,740
Total deferred tax liabilities 5,611 13,144
Movements in deferred tax assets
Provisions/ Cash flow Tax losses TotalAccruals hedges
$’000 $’000 $’000 $’000
At 1 July 2009 19,767 3,049 57,393 80,209
(Charged)/credited
- to profit or loss (1,845) (716) (59) (2,620)
- to other comprehensive income - (1,382) - (1,382)
Adjustment for prior period (534) (405) - (939)
Utilisation of tax losses - - (5,648) (5,648)
At 30 June 2010 17,388 546 51,686 69,620
(Charged)/credited
- to profit or loss 3,345 (67) (316) 2,962
- to other comprehensive income - 372 - 372
Utilisation of tax losses - - (8,685) (8,685)
At 30 June 2011 20,733 851 42,685 64,269
Movements in deferred tax liabilities
Property, Other Intangible TotalPlant and Assets Assets
Equipment$’000 $’000 $’000 $’000
At 1 July 2009 (7,874) (1,564) (2,619) (12,057)
(Charged)/credited
- to profit or loss (1,258) (255) (121) (1,634)
- to other comprehensive income - 573 - 573
Adjustment for prior period - (26) - (26)
At 30 June 2010 (9,132) (1,272) (2,740) (13,144)
(Charged)/credited
- to profit or loss 4,288 522 2,504 7,314
- to other comprehensive income - 219 - 219
At 30 June 2011 (4,844) (531) (236) (5,611)
2011_financials f.indd 67 9/6/2011 4:29:29 PM
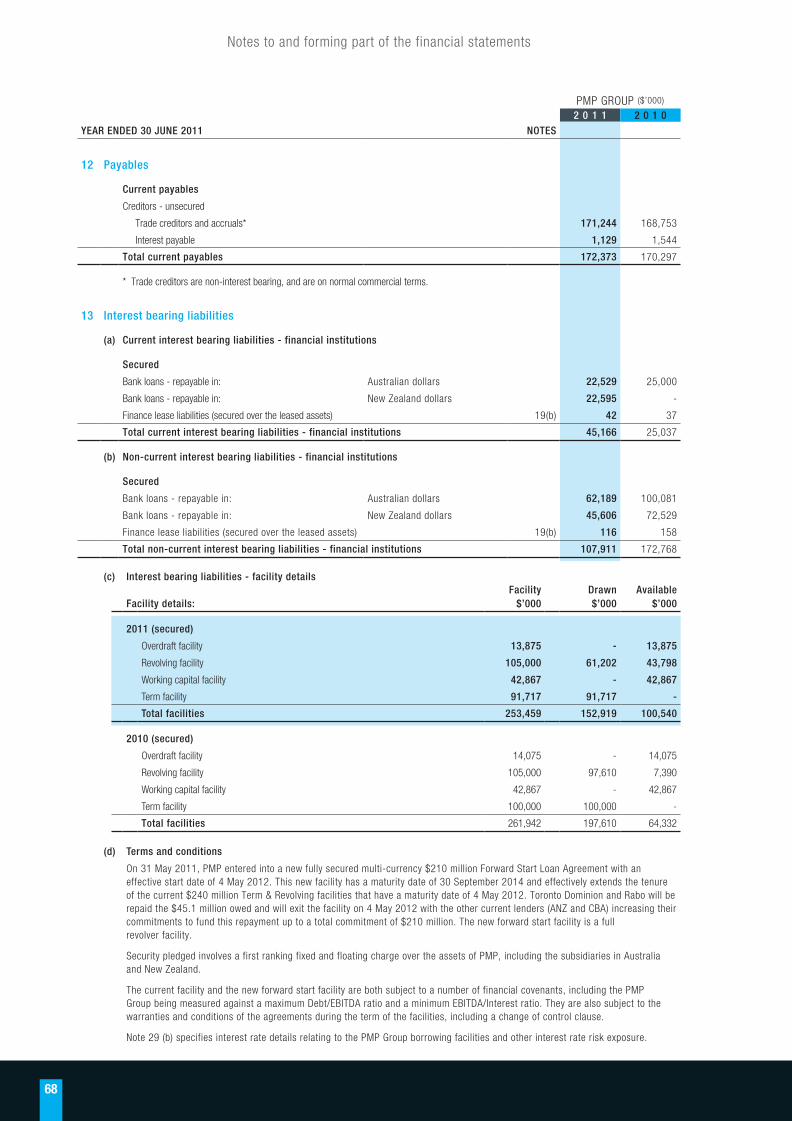
68
(c) Interest bearing liabilities - facility detailsFacility Drawn Available
Facility details: $’000 $’000 $’000
2011 (secured)
Overdraft facility 13,875 - 13,875
Revolving facility 105,000 61,202 43,798
Working capital facility 42,867 - 42,867
Term facility 91,717 91,717 -
Total facilities 253,459 152,919 100,540
2010 (secured)
Overdraft facility 14,075 - 14,075
Revolving facility 105,000 97,610 7,390
Working capital facility 42,867 - 42,867
Term facility 100,000 100,000 -
Total facilities 261,942 197,610 64,332
(d) Terms and conditions
On 31 May 2011, PMP entered into a new fully secured multi-currency $210 million Forward Start Loan Agreement with an effective start date of 4 May 2012. This new facility has a maturity date of 30 September 2014 and effectively extends the tenure of the current $240 million Term & Revolving facilities that have a maturity date of 4 May 2012. Toronto Dominion and Rabo will be repaid the $45.1 million owed and will exit the facility on 4 May 2012 with the other current lenders (ANZ and CBA) increasing their commitments to fund this repayment up to a total commitment of $210 million. The new forward start facility is a full revolver facility.
Security pledged involves a first ranking fixed and floating charge over the assets of PMP, including the subsidiaries in Australia and New Zealand.
The current facility and the new forward start facility are both subject to a number of financial covenants, including the PMP Group being measured against a maximum Debt/EBITDA ratio and a minimum EBITDA/Interest ratio. They are also subject to the warranties and conditions of the agreements during the term of the facilities, including a change of control clause.
Note 29 (b) specifies interest rate details relating to the PMP Group borrowing facilities and other interest rate risk exposure.
Notes to and forming part of the financial statements
PMP GROUP ($’000)
2 0 1 1 2 0 1 0YEAR ENDED 30 JUNE 2011 NOTES
12 Payables
Current payables
Creditors - unsecured
Trade creditors and accruals* 171,244 168,753
Interest payable 1,129 1,544
Total current payables 172,373 170,297
* Trade creditors are non-interest bearing, and are on normal commercial terms.
13 Interest bearing liabilities
(a) Current interest bearing liabilities - financial institutions
Secured
Bank loans - repayable in: Australian dollars 22,529 25,000
Bank loans - repayable in: New Zealand dollars 22,595 -
Finance lease liabilities (secured over the leased assets) 19(b) 42 37
Total current interest bearing liabilities - financial institutions 45,166 25,037
(b) Non-current interest bearing liabilities - financial institutions
Secured
Bank loans - repayable in: Australian dollars 62,189 100,081
Bank loans - repayable in: New Zealand dollars 45,606 72,529
Finance lease liabilities (secured over the leased assets) 19(b) 116 158
Total non-current interest bearing liabilities - financial institutions 107,911 172,768
2011_financials f.indd 68 9/6/2011 4:29:29 PM

69
Notes to and forming part of the financial statements
PMP GROUP ($’000)
2 0 1 1 2 0 1 0YEAR ENDED 30 JUNE 2011 NOTES
14 Provisions
(a) Current provisions
Employee entitlements 28,241 26,087
Other 10,529 3,313
Total current provisions 38,770 29,400
Non-current provisions
Employee entitlements 1,977 2,458
Other 2,820 695
Total non-current provisions 4,797 3,153
Total provisions 43,567 32,553
(b) Movements in provisions
Movements in each class of provision during the financial year, other than employee benefits, are set out below:
Restructure Make good Onerous Other Totallease
$’000 $’000 $’000 $’000 $’000
Current
Carrying amount at start of year 46 472 594 2,201 3,313
Charged/(credited) to profit or loss
- additional provisions recognised 13,678 231 80 1,926 15,915
- unused amounts reversed (1,180) (272) - (768) (2,220)
Amounts used during the period (4,132) (165) (372) (1,810) (6,479)
Carrying amount at end of year 8,412 266 302 1,549 10,529
Deferred Make good Other Totalconsideration
$’000 $’000 $’000 $’000
Non-Current
Carrying amount at start of year - 379 316 695
Charged/(credited) to profit or loss
- additional provisions recognised 821 40 1,614 2,475
- unused amounts reversed - (33) (317) (350)
Amounts used during the period - - - -
Carrying amount at end of year 821 386 1,613 2,820
2011_financials f.indd 69 9/6/2011 4:29:30 PM
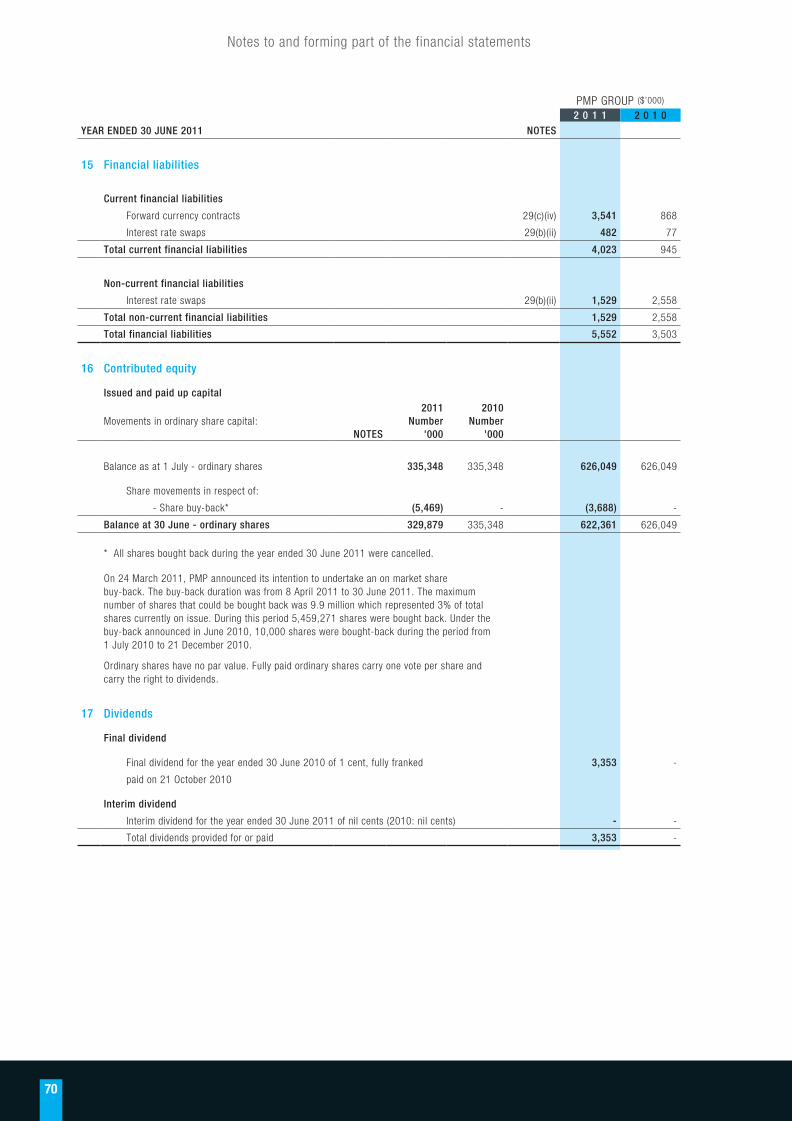
70
Notes to and forming part of the financial statements
PMP GROUP ($’000)
2 0 1 1 2 0 1 0YEAR ENDED 30 JUNE 2011 NOTES
15 Financial liabilities
Current financial liabilities
Forward currency contracts 29(c)(iv) 3,541 868
Interest rate swaps 29(b)(ii) 482 77
Total current financial liabilities 4,023 945
Non-current financial liabilities
Interest rate swaps 29(b)(ii) 1,529 2,558
Total non-current financial liabilities 1,529 2,558
Total financial liabilities 5,552 3,503
16 Contributed equity
Issued and paid up capital2011 2010
Movements in ordinary share capital: Number NumberNOTES '000 '000
Balance as at 1 July - ordinary shares 335,348 335,348 626,049 626,049
Share movements in respect of:
- Share buy-back* (5,469) - (3,688) -
Balance at 30 June - ordinary shares 329,879 335,348 622,361 626,049
* All shares bought back during the year ended 30 June 2011 were cancelled.
On 24 March 2011, PMP announced its intention to undertake an on market share buy-back. The buy-back duration was from 8 April 2011 to 30 June 2011. The maximum number of shares that could be bought back was 9.9 million which represented 3% of total shares currently on issue. During this period 5,459,271 shares were bought back. Under the buy-back announced in June 2010, 10,000 shares were bought-back during the period from 1 July 2010 to 21 December 2010.
Ordinary shares have no par value. Fully paid ordinary shares carry one vote per share and carry the right to dividends.
17 Dividends
Final dividend
Final dividend for the year ended 30 June 2010 of 1 cent, fully franked 3,353 -
paid on 21 October 2010
Interim dividend
Interim dividend for the year ended 30 June 2011 of nil cents (2010: nil cents) - -
Total dividends provided for or paid 3,353 -
2011_financials f.indd 70 9/6/2011 4:29:30 PM

71
Notes to and forming part of the financial statements
PMP GROUP ($’000)
2 0 1 1 2 0 1 0YEAR ENDED 30 JUNE 2011 NOTES
18 Reserves
Foreign currency translation reserve
Opening balance 1,122 1,134
Movement in reserve relating to:
- Exchange fluctuation on translation of overseas controlled entities 82 (12)
Total foreign currency translation reserve 1,204 1,122
Share-based payment reserve
Opening balance 1,122 485
Movement in reserve relating to:
- Share-based payment expense 2(c) 513 637
- Purchase of shares (275) -
Total share-based payment reserve 1,360 1,122
Cash flow hedge reserve
Opening balance (596) (3,833)
Movement in reserve relating to:
- Cash flow hedge (1,380) 4,619
- Tax effect of cash flow hedge net (gain)/loss 372 (1,382)
Total cash flow hedge reserve (1,604) (596)
Total reserves 960 1,648
2011_financials f.indd 71 9/6/2011 4:29:30 PM

72
Notes to and forming part of the financial statements
PMP GROUP ($’000)
2 0 1 1 2 0 1 0YEAR ENDED 30 JUNE 2011 NOTES
19 Commitments
The following commitments are not reflected in the balance sheet and are payable/receivable as follows:
(a) Capital expenditure (i):
- not later than one year 9,047 1,613
Total capital expenditure 9,047 1,613
(b) Finance lease rentals - Group as lessee (ii):
- not later than one year 56 56
- later than one year but not later than five years 132 188
Total finance lease rentals 188 244
Future finance charges (30) (49)
Net finance lease liability 158 195
Reconciled to:
Current finance lease liability 13(a) 42 37
Non-current finance lease liability 13(b) 116 158
Finance lease liability 158 195
(c) Operating lease rentals - Group as lessee (iii):
not later than one year 17,108 17,420
later than one year but not later than five years 41,880 39,942
later than five years 14,766 10,334
Total operating lease rentals (lessee) 73,754 67,696
(d) Operating lease rentals - Group as lessor (iv):
not later than one year 3,658 2,606
later than one year but not later than five years 7,367 7,575
later than five years - -
Total operating lease rentals (lessor) 11,025 10,181
Total net commitments for expenditure 71,934 59,323
(i) At 30 June 2011 and 30 June 2010 the Group capital expenditure commitments relate to the acquisition of new plant and equipment.
(ii) The Group has finance leases for various items of plant and machinery. The weighted average interest rate implicit in the leases is 10.68% (2010: 10.68%). These leases have terms of renewal, but no escalation clauses. Certain leases contain purchase options.
(iii) Operating leases are entered into in the normal course for land and buildings, motor vehicles, computer equipment and plant and machinery. Rental payments are generally fixed, however some agreements contain inflation escalation clauses. No operating leases contain restrictions on financing or other leasing activities.
(iv) Operating leases are entered to sub-lease surplus office space. Rental payments include fixed and inflation escalation clauses.
(v) The company has a number of bank guarantees in place that support various property leases in the name of either PMP Limited or its subsidiaries. The company has not issued any guarantees for properties where it is not the lessee.
2011_financials f.indd 72 9/6/2011 4:29:30 PM
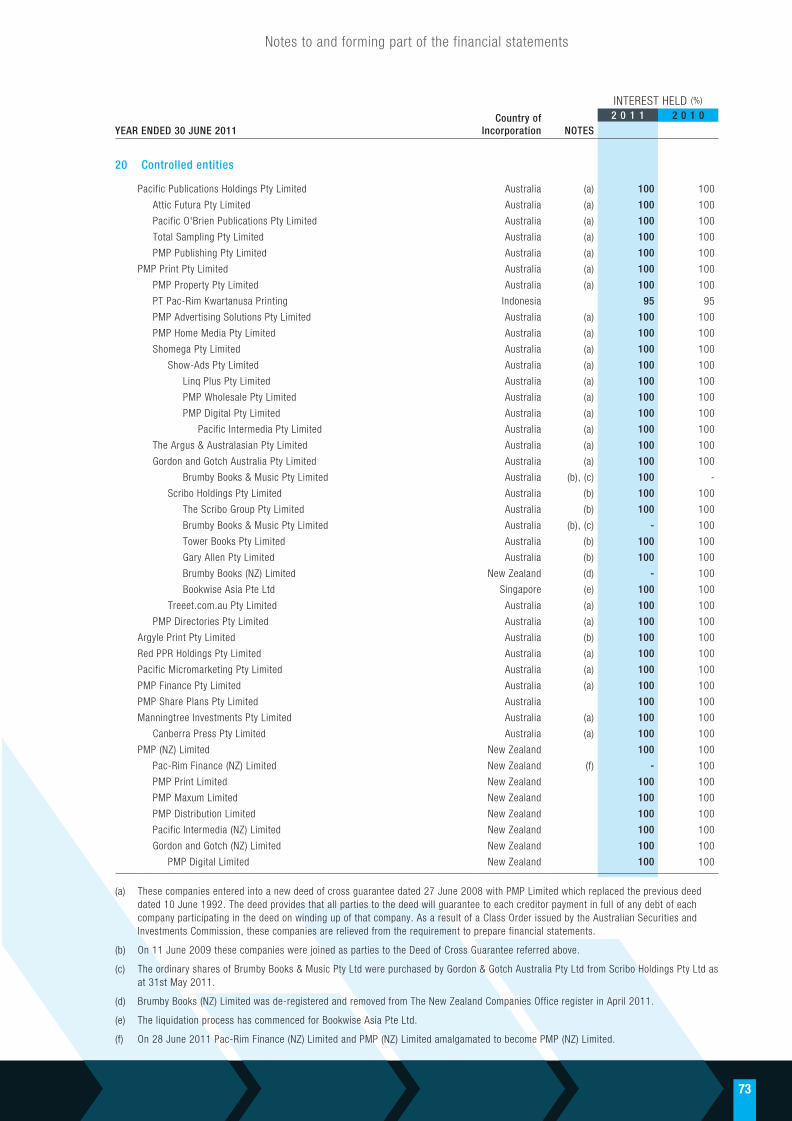
73
INTEREST HELD (%)
Country of 2 0 1 1 2 0 1 0YEAR ENDED 30 JUNE 2011 Incorporation NOTES
20 Controlled entities
Pacific Publications Holdings Pty Limited Australia (a) 100 100
Attic Futura Pty Limited Australia (a) 100 100
Pacific O'Brien Publications Pty Limited Australia (a) 100 100
Total Sampling Pty Limited Australia (a) 100 100
PMP Publishing Pty Limited Australia (a) 100 100
PMP Print Pty Limited Australia (a) 100 100
PMP Property Pty Limited Australia (a) 100 100
PT Pac-Rim Kwartanusa Printing Indonesia 95 95
PMP Advertising Solutions Pty Limited Australia (a) 100 100
PMP Home Media Pty Limited Australia (a) 100 100
Shomega Pty Limited Australia (a) 100 100
Show-Ads Pty Limited Australia (a) 100 100
Linq Plus Pty Limited Australia (a) 100 100
PMP Wholesale Pty Limited Australia (a) 100 100
PMP Digital Pty Limited Australia (a) 100 100
Pacific Intermedia Pty Limited Australia (a) 100 100
The Argus & Australasian Pty Limited Australia (a) 100 100
Gordon and Gotch Australia Pty Limited Australia (a) 100 100
Brumby Books & Music Pty Limited Australia (b), (c) 100 -
Scribo Holdings Pty Limited Australia (b) 100 100
The Scribo Group Pty Limited Australia (b) 100 100
Brumby Books & Music Pty Limited Australia (b), (c) - 100
Tower Books Pty Limited Australia (b) 100 100
Gary Allen Pty Limited Australia (b) 100 100
Brumby Books (NZ) Limited New Zealand (d) - 100
Bookwise Asia Pte Ltd Singapore (e) 100 100
Treeet.com.au Pty Limited Australia (a) 100 100
PMP Directories Pty Limited Australia (a) 100 100
Argyle Print Pty Limited Australia (b) 100 100
Red PPR Holdings Pty Limited Australia (a) 100 100
Pacific Micromarketing Pty Limited Australia (a) 100 100
PMP Finance Pty Limited Australia (a) 100 100
PMP Share Plans Pty Limited Australia 100 100
Manningtree Investments Pty Limited Australia (a) 100 100
Canberra Press Pty Limited Australia (a) 100 100
PMP (NZ) Limited New Zealand 100 100
Pac-Rim Finance (NZ) Limited New Zealand (f) - 100
PMP Print Limited New Zealand 100 100
PMP Maxum Limited New Zealand 100 100
PMP Distribution Limited New Zealand 100 100
Pacific Intermedia (NZ) Limited New Zealand 100 100
Gordon and Gotch (NZ) Limited New Zealand 100 100
PMP Digital Limited New Zealand 100 100
(a) These companies entered into a new deed of cross guarantee dated 27 June 2008 with PMP Limited which replaced the previous deed dated 10 June 1992. The deed provides that all parties to the deed will guarantee to each creditor payment in full of any debt of each company participating in the deed on winding up of that company. As a result of a Class Order issued by the Australian Securities and Investments Commission, these companies are relieved from the requirement to prepare financial statements.
(b) On 11 June 2009 these companies were joined as parties to the Deed of Cross Guarantee referred above.
(c) The ordinary shares of Brumby Books & Music Pty Ltd were purchased by Gordon & Gotch Australia Pty Ltd from Scribo Holdings Pty Ltd as at 31st May 2011.
(d) Brumby Books (NZ) Limited was de-registered and removed from The New Zealand Companies Office register in April 2011.
(e) The liquidation process has commenced for Bookwise Asia Pte Ltd.
(f) On 28 June 2011 Pac-Rim Finance (NZ) Limited and PMP (NZ) Limited amalgamated to become PMP (NZ) Limited.
Notes to and forming part of the financial statements
2011_financials f.indd 73 9/6/2011 4:29:30 PM

74
PMP GROUP ($’000)
2 0 1 1 2 0 1 0YEAR ENDED 30 JUNE 2011 NOTES
20 Controlled entities (continued)
The aggregate assets, liabilities and net result after income tax of the companies which are parties to the Deed of Cross Guarantees are as follows (g):
Statements of comprehensive income of the closed group
Sales revenue 1,005,187 1,016,591
Other revenue 9,097 8,898
Revenue 1,014,284 1,025,489
Raw materials and consumables used (208,976) (231,719)
Cost of finished goods sold (353,047) (343,175)
Employee expenses (265,325) (259,269)
Outside production services (22,255) (26,572)
Freight (26,231) (24,534)
Repairs and maintenance (14,420) (20,188)
Occupancy costs (17,091) (19,522)
Other expenses (56,141) (25,013)
Profit before depreciation, amortisation, finance costs and income tax 50,798 75,497
Depreciation and amortisation (37,270) (34,099)
Profit/(loss) before finance costs and income tax 13,528 41,398
Finance costs (9,027) (9,895)
Profit/(loss) before income tax 4,501 31,503
Income tax (expense)/benefit (5,975) (9,625)
Net (loss)/profit attributable to members of the parent entity (1,474) 21,878
(g) Notes on the closed group:
- PMP Limited is the ultimate parent company of the PMP Group.
- All companies have ordinary share capital.
- On 11 June 2009 the Australian entities within Scribo Holdings Pty Ltd and Argyle Print Pty Limited joined as parties to the Deed of Cross Guarantee as identified on page 73.
Notes to and forming part of the financial statements
2011_financials f.indd 74 9/6/2011 4:29:30 PM

75
PMP GROUP ($’000)
2 0 1 1 2 0 1 0YEAR ENDED 30 JUNE 2011
20 Controlled entities (continued)
Balance sheet of the closed group
Current assets
Cash and cash equivalents 6,151 22,091
Receivables 106,194 101,041
Inventories 66,975 71,136
Other 7,515 8,163
Non-current assets classified as held for sale - 7,878
Total current assets 186,835 210,309
Non-current assets
Property, plant and equipment 289,178 307,364
Goodwill and intangible assets 80,619 98,890
Deferred tax assets 57,079 66,571
Other 32,748 14,092
Total non-current assets 459,624 486,917
Total assets 646,459 697,226
Current liabilities
Payables 138,217 139,615
Interest bearing liabilities - financial institutions 22,571 25,037
Income tax payable 2,516 603
Provisions 29,516 26,652
Financial liabilities 1,575 1,475
Total current liabilities 194,395 193,382
Non-current liabilities
Interest bearing liabilities - financial institutions 62,304 100,240
Deferred tax liabilities 5,504 11,852
Provisions 4,526 3,153
Financial liabilities 158 1,021
Total non-current liabilities 72,492 116,266
Total liabilities 266,887 309,648
Net assets 379,572 387,578
Equity
Contributed equity 622,361 626,049
Reserves 1,048 27
Accumulated losses (243,837) (238,498)
Total equity 379,572 387,578
Notes to and forming part of the financial statements
2011_financials f.indd 75 9/6/2011 4:29:31 PM

76
Not
es to
and
form
ing
part
of t
he fi
nanc
ial s
tate
men
tsYE
AR E
ND
ED 3
0 JU
NE
2011
21Se
gmen
tal i
nfor
mat
ion
Des
crip
tion
of s
egm
ents
Man
agem
ent h
as d
eter
min
ed th
e op
erat
ing
segm
ents
bas
ed o
n th
e m
anne
r th
e G
roup
is s
truc
ture
d an
d m
anag
ed b
y th
e Ex
ecut
ive
Man
agem
ent T
eam
(EM
T). A
ll re
port
s re
gula
rly r
evie
wed
by
the
Chie
f Exe
cutiv
e O
ffice
r an
d th
e EM
T ar
e pr
esen
ted
on th
is b
asis
whi
ch g
roup
s si
mila
r ge
ogra
phic
loca
tions
.
Prin
t Aus
tral
ia in
clud
es a
ll of
the
Prin
t bus
ines
ses
in A
ustr
alia
nam
ely
Heat
set,
Dire
ctor
ies
and
Grif
fin P
ress
. Gor
don
and
Got
ch in
clud
es m
agaz
ine
and
book
dis
trib
utio
n bu
sine
sses
in A
ustr
alia
. New
Zea
land
seg
men
t inc
lude
s al
l bu
sine
sses
in N
ew Z
eala
nd.
The
book
dis
trib
utio
n bu
sine
ss o
f Scr
ibo
was
clo
sed
on 3
0 Ju
ne 2
011.
It is
ant
icip
ated
that
all
oper
atio
ns w
ill c
ease
in S
epte
mbe
r 20
11. T
he r
even
ue a
nd r
esul
ts o
f thi
s bu
sine
ss h
ave
been
dis
clos
ed u
nder
the
Gor
don
and
Got
ch
segm
ent a
nd a
re s
epar
atel
y di
sclo
sed
in th
e fo
otno
te to
the
Stat
emen
t of C
ompr
ehen
sive
Inco
me.
The
Bru
mby
Boo
ks a
nd M
usic
bus
ines
s w
ill c
ontin
ue n
orm
al o
pera
tions
and
is r
efle
cted
und
er th
e G
ordo
n an
d G
otch
seg
men
t.
Tran
sact
ions
bet
wee
n se
gmen
ts a
re c
arrie
d ou
t at a
rm’s
leng
th a
nd a
re e
limin
ated
on
cons
olid
atio
n.
Segm
ent
reve
nues
and
res
ults
The
follo
win
g is
an
anal
ysis
of t
he G
roup
’s r
even
ue a
nd r
esul
ts b
y re
port
able
seg
men
t for
the
perio
ds p
rese
nted
:
(a)
Ope
ratin
g Se
gmen
tsPr
int
Aust
ralia
Dis
trib
utio
n Au
stra
liaGo
rdon
and
Got
chD
igita
l Pre
med
iaN
ew Z
eala
ndCo
rpor
ate
Cons
olid
ated
20
11
20
10
20
11
20
10
20
11
20
10
20
11
20
10
20
11
20
10
20
11
20
10
20
11
20
10
($’0
00)
($’0
00)
($’0
00)
($’0
00)
($’0
00)
($’0
00)
($’0
00)
($’0
00)
($’0
00)
($’0
00)
($’0
00)
($’0
00)
($’0
00)
($’0
00)
Reve
nue
Sale
s re
venu
e47
2,36
7 49
2,14
1 90
,854
84
,513
41
3,37
0 40
8,85
1 28
,595
31
,087
18
9,07
5 19
5,54
7 -
-
1,
194,
261
1,21
2,13
9
Oth
er r
even
ue19
6 37
0 2,
080
1,61
4 4,
613
4,54
5 50
4 50
4 17
7 38
2 1,
704
1,86
8 9,
274
9,28
3
Sign
ifica
nt it
ems
-
-
-
-
-
-
-
-
2,43
1 -
-
-
2,
431
-
Tota
l rev
enue
472,
563
492,
511
92,9
34
86,1
27
417,
983
413,
396
29,0
99
31,5
91
191,
683
195,
929
1,70
4 1,
868
1,20
5,96
6 1,
221,
422
EBIT
DA
befo
re s
igni
fican
t ite
ms
87,5
63
76,9
15
1,72
5 (1
,430
)4,
867
9,35
6 2,
211
4,89
4 10
,963
12
,094
(7
,263
)(8
,968
)10
0,06
6 92
,861
Dep
reci
atio
n an
d am
ortis
atio
n(3
2,15
9)(2
9,17
3)(6
21)
(762
)(1
,203
)(1
,871
)(2
,072
)(1
,434
)(6
,129
)(6
,533
)(1
,217
)(8
56)
(43,
401)
(40,
629)
EBIT
bef
ore
sign
ifica
nt it
ems
55,4
04
47,7
42
1,10
4 (2
,192
)3,
664
7,48
5 13
9 3,
460
4,83
4 5,
561
(8,4
80)
(9,8
24)
56,6
65
52,2
32
Sign
ifica
nt it
ems
befo
re in
com
e ta
x(3
,460
)(1
,761
)(5
,560
)(2
,868
)(2
6,47
3)11
4 (1
,833
)(7
48)
(14,
087)
(193
)(7
82)
(51)
(52,
195)
(5,5
07)
Segm
ent
EBIT
aft
er s
igni
fican
t ite
ms
51,9
44
45,9
81
(4,4
56)
(5,0
60)
(22,
809)
7,59
9 (1
,694
)2,
712
(9,2
53)
5,36
8 (9
,262
)(9
,875
)4,
470
46,7
25
Fina
nce
cost
s(1
4,44
3)(1
5,35
9)
Cons
olid
ated
ent
ity (l
oss)
/pro
fit b
efor
e in
com
e ta
x(9
,973
)31
,366
Inco
me
tax
(exp
ense
)/be
nefit
(1,3
36)
(10,
728)
Net
(los
s)/p
rofit
aft
er in
com
e ta
x(1
1,30
9)20
,638
* EB
ITD
A -
Prof
it/(lo
ss) b
efor
e de
prec
iatio
n, a
mor
tisat
ion,
fina
nce
cost
s an
d in
com
e ta
x
Re
venu
e of
$15
.7 m
illio
n (2
010:
$21
.3 m
illio
n), e
xpen
ses
of $
45.1
mill
ion
(201
0: $
23.5
mill
ion)
, los
s be
fore
inco
me
tax
of $
29.4
mill
ion
(201
0: lo
ss o
f $2.
2 m
illio
n), l
oss
afte
r in
com
e ta
x of
$24
.7 m
illio
n (2
010:
loss
of $
2.0
mill
ion)
, si
gnifi
cant
item
s of
exp
ense
of $
25.7
mill
ion
(201
0: e
xpen
ses
of $
0.2
mill
ion)
and
loss
bef
ore
inte
rest
and
tax
excl
udin
g si
gnifi
cant
item
s of
$3.
7 m
illio
n (2
010:
loss
of $
2.0
mill
ion)
are
attr
ibut
able
to th
e bo
ok d
istr
ibut
ion
busi
ness
of
Scrib
o. T
his
busi
ness
was
clo
sed
on 3
0 Ju
ne 2
011.
2011_financials f.indd 76 9/6/2011 4:29:31 PM

77
Not
es to
and
form
ing
part
of t
he fi
nanc
ial s
tate
men
tsYE
AR E
ND
ED 3
0 JU
NE
2011
21Se
gmen
tal i
nfor
mat
ion
(con
tinue
d)
(b)
Oth
er s
egm
ent
info
rmat
ion
i) Ge
ogra
phic
Seg
men
ts
Aust
ralia
New
Zea
land
Cons
olid
ated
20
11
20
10
20
11
20
10
20
11
20
10
($’0
00)
($’0
00)
($’0
00)
($’0
00)
($’0
00)
($’0
00)
Sale
s re
venu
e1,
005,
186
1,01
6,59
2 18
9,07
5 19
5,54
7 1,
194,
261
1,21
2,13
9
Oth
er r
even
ue9,
097
8,90
1 17
7 38
2 9,
274
9,28
3
Sign
ifica
nt it
ems
-
-
2,43
1 -
2,
431
-
Tota
l rev
enue
1,01
4,28
3 1,
025,
493
191,
683
195,
929
1,20
5,96
6 1,
221,
422
Non
-cur
rent
ass
ets
(exc
ludi
ng d
efer
red
tax
asse
ts a
nd p
ost
empl
oym
ent
bene
fit a
sset
s)37
0,56
4 40
7,90
8 65
,269
62
,518
43
5,83
3 47
0,42
6
The
Scrib
o bo
ok d
istr
ibut
ion
busi
ness
is r
efle
cted
und
er th
e Au
stra
lian
geog
raph
ic s
egm
ent.
ii) M
ajor
pro
duct
and
ser
vice
off
erin
gs
The
Gro
up’s
ext
erna
l rev
enue
from
eac
h gr
oup
of s
imila
r pr
oduc
ts a
nd s
ervi
ces
wer
e as
follo
ws:
Prin
tD
istr
ibut
ion
Gord
on a
nd G
otch
Dig
ital P
rem
edia
Cons
olid
ated
20
11
20
10
20
11
20
10
20
11
20
10
20
11
20
10
20
11
20
10
($’0
00)
($’0
00)
($’0
00)
($’0
00)
($’0
00)
($’0
00)
($’0
00)
($’0
00)
($’0
00)
($’0
00)
Reve
nue
Sale
s re
venu
e58
2,25
6 58
8,58
4 10
6,44
2 99
,146
47
6,96
8 47
6,11
7 28
,595
48
,292
1,
194,
261
1,21
2,13
9
Tota
l sal
es r
even
ue58
2,25
6 58
8,58
4 10
6,44
2 99
,146
47
6,96
8 47
6,11
7 28
,595
48
,292
1,
194,
261
1,21
2,13
9
2011_financials f.indd 77 9/6/2011 4:29:31 PM

78
YEAR ENDED 30 JUNE 2011
22 Pension plans
The PMP Group contributes to accumulation plans as a consequence of legislation or Trust Deeds. Legal enforceability is dependent upon the terms of the legislation and the Trust Deeds.
Accumulation and defined benefit member accounts are held within the PEP Superannuation Plan which is a sub-plan of the AMP SuperSignature Plan.
PMP manages superannuation commitments through a Superannuation Policy Committee in conjunction with the trustees of the AMP Superannuation Savings Trust, within which is the AMP SuperSignature Plan. This master trust provides defined benefits based on years of membership and final average salary and accumulation benefits. Employees contribute to the plan at various percentages of their wages and salaries.
Employer contributions to superannuation plans in the year ended 30 June 2011 totalled $12,566,733 (2010: $12,216,730).
Accumulation funds
Contribution obligations in respect of each accumulation fund for the year to 30 June 2011 was 9% (2010: 9%) of members’ wages or as defined by the Trust Deed.
Defined benefit funds
Defined benefit members receive lump sum benefits on retirement, death, disablement and withdrawal. The defined benefit section of the plan is closed to new members. All new members receive accumulation only benefits.
During the year ended 30 June 2011, PMP Limited contributed at rates between 11.0% and 23.5% (2010: between 11.0% and 23.5%).
PMP expects to contribute $0.8 million to its defined benefit pension plan in the year ending 30 June 2012 (2011: $0.8 million).
(a) Amount recognised in statement of comprehensive income
Recognised in employee expenses
PMP GROUP ($’000)
2 0 1 1 2 0 1 0NOTES
Service cost 460 477
Interest cost 966 1,121
Expected return on assets (1,069) (1,117)
Superannuation expense 357 481
(b) Amount recognised in balance sheets
Defined benefit obligation 22(c) (16,472) (14,805)
Less: fair value of plan assets 22(d) 17,099 15,509
Net superannuation asset 627 704
If a surplus exists in the plan, PMP Limited expect to be able to take advantage of it in the form of a reduction in the required contribution rate, depending on the advice of the plan’s actuary.
PMP Limited may at any time by notice to the Trustee terminate its contributions. PMP Limited has a liability to pay the contributions due prior to the effective date of the notice, but there is no requirement for it to pay any further contributions, irrespective of the financial condition of the plan.
(c) Defined benefit obligation
Present value of defined benefit obligation at beginning of the year 14,805 14,206
Current service cost 460 477
Interest cost 966 1,121
Contributions by plan participants 272 269
Actuarial loss/(gain) 513 1,360
Benefits paid (399) (2,376)
Taxes, premiums and expenses paid (145) (252)
Present value of defined benefit obligation at end of the year 16,472 14,805
Experience adjustments loss on plan liabilities for the year ended 30 June 2011 is $0.06 million (2010: loss $0.6 million).
Notes to and forming part of the financial statements
2011_financials f.indd 78 9/6/2011 4:29:31 PM

79
PMP GROUP ($’000)
2 0 1 1 2 0 1 0YEAR ENDED 30 JUNE 2011 NOTES
22 Pension plans (continued)
(d) Fair value of plan assets
Fair value of plan assets at beginning of the year 15,509 16,285
Expected return on plan assets 1,069 1,117
Actuarial loss (219) (550)
Employer contributions 1,012 1,016
Contributions by plan participants 272 269
Benefits paid (399) (2,376)
Taxes, premiums and expenses paid (145) (252)
Fair value of plan assets at end of the year 17,099 15,509
The fair value of plan assets includes no amounts relating to any of PMP’s own financial instruments or any property occupied or used by PMP.
The major categories of plan assets as a percentage of the fair value of plan assets are as follows:
PMP GROUP (%)
2 0 1 1 2 0 1 0NOTES
Australian equity 30 28
International equity 29 27
Fixed income 14 19
Property 7 7
Alternatives 17 14
Cash 3 5
The expected return on assets assumption is determined by weighting the expected long-term return for each asset class by the target allocation of assets to each asset class. The returns used for each asset class are net of investment tax and investment fees. PMP Group’s actual return on plan assets during the year ended 30 June 2011 was a gain of $0.9 million (2010: $0.6 million gain).
Experience adjustments loss on plan assets for the year ended 30 June 2011 is $0.2 million (2010: $0.6 million).
(e) Actuarial assumptions
The principal actuarial assumptions used in determining PMP pension obligations are as follows (expressed as weighted averages):
PMP GROUP (%)
2 0 1 1 2 0 1 0NOTES
Discount rate 6.10 6.80
Expected rate of return on plan assets 7.00 7.00
Expected salary increase rate 3.50 3.50
(f) Amounts recognised in other comprehensive income
PMP GROUP ($’000)
2 0 1 1 2 0 1 0NOTES
Actuarial loss recognised in the year (732) (1,910)
Cumulative actuarial (losses)/gains recognised in other comprehensive income (750) (18)
Notes to and forming part of the financial statements
2011_financials f.indd 79 9/6/2011 4:29:31 PM

80
YEAR ENDED 30 JUNE 2011
23 Share-based payment plans
(a) Employee long term incentive plan
Ordinary shares up to 5.0% (2010: 5.0%) of the total number of ordinary shares on issue may be allotted under the PMP long term incentive plan.
Total number of employee options/performance rights issued since commencement: 51,473,227
Total number of employee options/performance rights issued as at balance date: 5,982,611
Options/rights on issue (as a percentage of total shares on issue) as at 30 June 2011: 1.81%
Total number of employee options/performance rights issued during the year: 2,911,129
Total number of employee options/performance rights issued post balance date: nil
(i) Employee options
All options have lapsed as the earnings per share hurdles were not met.
(ii) Performance rights
Allotment Date 30/09/07 (i) 01/10/08 (ii) 1/10/09 (iii) 1/10/10 (iv) Total Number
On issue at beginning of year 638,643 909,126 2,715,669 - 4,263,438
Issued during the year - - - 2,911,129 2,911,129
Lapsed during the year (638,643) - (356,884) (196,429) (1,191,956)
On issue at end of year - 909,126 2,358,785 2,714,700 5,982,611
Lapsed subsequent to balance date* - (909,126) (196,898) (199,908) (1,305,932)
Outstanding at date of Directors’ report - - 2,161,887 2,514,792 4,676,679
Number of participants (at balance date) - 12 17 19
Vesting date (Following the announcement of the) FY10 results FY11 results FY12 results FY13 results
Fair value per right - TSR hurdle (v) $0.64 $1.00 $0.50 $0.47
Fair value per right - ROCE hurdle (v) $1.38 $1.21 $0.62 $0.66
* 502,946 performance rights lapsed due to the termination of an employee subsequent to balance date. 802,986 rights lapsed due to performance hurdles not being met over the performance period.
(i) September 2007, granted rights to the value of between 25% - 50% of each participant’s total employment cost. The number of rights granted was determined based on the Company’s weighted average share price on the day of grant ($1.51).
Performance rights entitle participants to receive PMP shares for nil cost after vesting. Rights will only vest if relevant performance hurdles are achieved across the following three years FY08, FY09 and FY10 as follows:
- PMP’s Total Shareholder Return (TSR) exceeds the change in the ASX All Ordinaries Accumulation Index over the three year performance period, all rights subject to the TSR hurdle (being 50% of rights granted) will vest and be exercisable;
- Return on Capital Employed (ROCE) performance over the three year performance period is at least equal to the target average ROCE set by the Board on commencement of the performance period, all rights subject to the ROCE hurdle (being 50% of rights granted) will vest and be exercisable.
These performance rights lapsed on 19 August 2010, following the announcement of the results for the year ended 30 June 2010. Neither the TSR nor the ROCE performance hurdles were met over the three year performance period.
(ii) October 2008, granted rights to the value of between 15% - 50% of each participant’s total employment cost. The number of rights granted was determined based on the weighted average share price for the one week period up to grant date ($1.28).
Performance rights entitle participants to receive PMP shares for nil cost after vesting. Rights will only vest if relevant performance hurdles described in (i) above are achieved across the following three years FY09, FY10 and FY11.
These performance rights lapsed on 18 August 2011, following the announcement of the results for the year ended 30 June 2011. Neither the TSR nor the ROCE peformance hurdles were met over the three year performance period.
Notes to and forming part of the financial statements
2011_financials f.indd 80 9/6/2011 4:29:31 PM
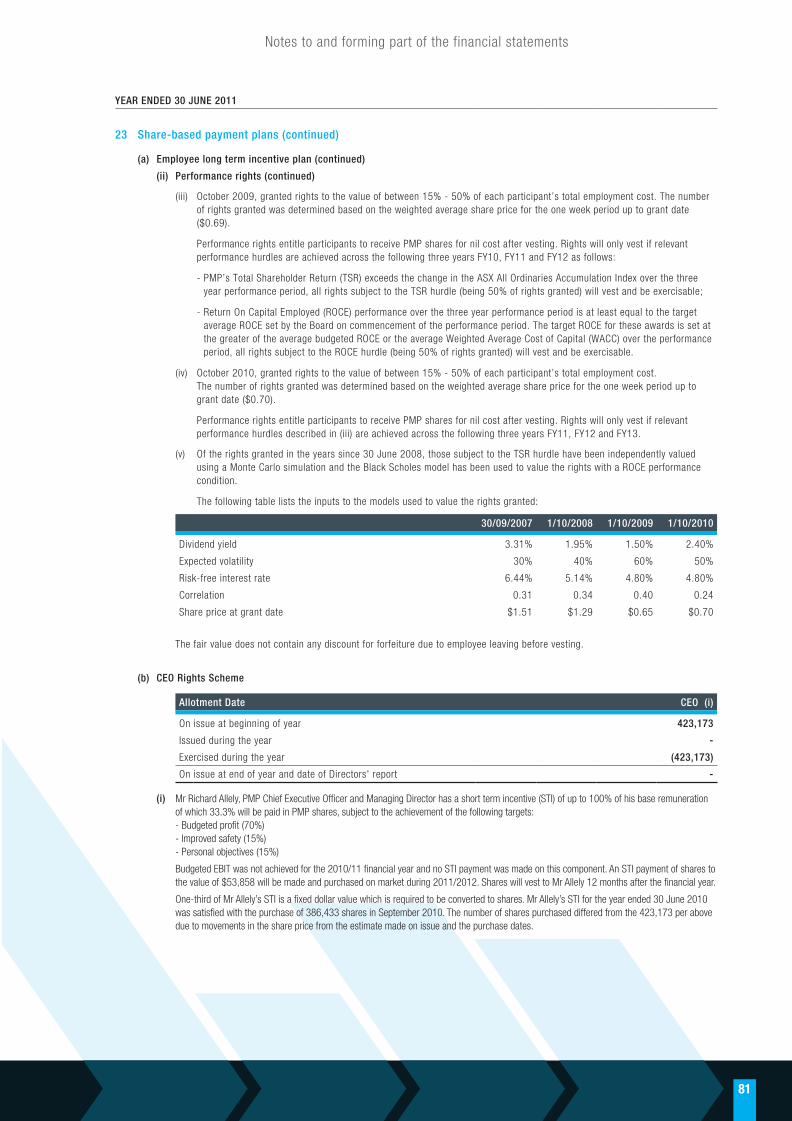
81
YEAR ENDED 30 JUNE 2011
23 Share-based payment plans (continued)
(a) Employee long term incentive plan (continued)
(ii) Performance rights (continued)
(iii) October 2009, granted rights to the value of between 15% - 50% of each participant’s total employment cost. The number of rights granted was determined based on the weighted average share price for the one week period up to grant date ($0.69).
Performance rights entitle participants to receive PMP shares for nil cost after vesting. Rights will only vest if relevant performance hurdles are achieved across the following three years FY10, FY11 and FY12 as follows:
- PMP’s Total Shareholder Return (TSR) exceeds the change in the ASX All Ordinaries Accumulation Index over the three year performance period, all rights subject to the TSR hurdle (being 50% of rights granted) will vest and be exercisable;
- Return On Capital Employed (ROCE) performance over the three year performance period is at least equal to the target average ROCE set by the Board on commencement of the performance period. The target ROCE for these awards is set at the greater of the average budgeted ROCE or the average Weighted Average Cost of Capital (WACC) over the performance period, all rights subject to the ROCE hurdle (being 50% of rights granted) will vest and be exercisable.
(iv) October 2010, granted rights to the value of between 15% - 50% of each participant’s total employment cost. The number of rights granted was determined based on the weighted average share price for the one week period up to grant date ($0.70).
Performance rights entitle participants to receive PMP shares for nil cost after vesting. Rights will only vest if relevant performance hurdles described in (iii) are achieved across the following three years FY11, FY12 and FY13.
(v) Of the rights granted in the years since 30 June 2008, those subject to the TSR hurdle have been independently valued using a Monte Carlo simulation and the Black Scholes model has been used to value the rights with a ROCE performance condition.
The following table lists the inputs to the models used to value the rights granted:
30/09/2007 1/10/2008 1/10/2009 1/10/2010
Dividend yield 3.31% 1.95% 1.50% 2.40%
Expected volatility 30% 40% 60% 50%
Risk-free interest rate 6.44% 5.14% 4.80% 4.80%
Correlation 0.31 0.34 0.40 0.24
Share price at grant date $1.51 $1.29 $0.65 $0.70
The fair value does not contain any discount for forfeiture due to employee leaving before vesting.
(b) CEO Rights Scheme
Allotment Date CEO (i)
On issue at beginning of year 423,173
Issued during the year -
Exercised during the year (423,173)
On issue at end of year and date of Directors' report -
(i) Mr Richard Allely, PMP Chief Executive Officer and Managing Director has a short term incentive (STI) of up to 100% of his base remuneration of which 33.3% will be paid in PMP shares, subject to the achievement of the following targets: - Budgeted profit (70%) - Improved safety (15%) - Personal objectives (15%)
Budgeted EBIT was not achieved for the 2010/11 financial year and no STI payment was made on this component. An STI payment of shares to the value of $53,858 will be made and purchased on market during 2011/2012. Shares will vest to Mr Allely 12 months after the financial year.
One-third of Mr Allely’s STI is a fixed dollar value which is required to be converted to shares. Mr Allely’s STI for the year ended 30 June 2010 was satisfied with the purchase of 386,433 shares in September 2010. The number of shares purchased differed from the 423,173 per above due to movements in the share price from the estimate made on issue and the purchase dates.
Notes to and forming part of the financial statements
2011_financials f.indd 81 9/6/2011 4:29:32 PM

82
YEAR ENDED 30 JUNE 2011
24 Related parties
(a) Key management personnel
Details of key management personnel, including remuneration, are included in the section titled “Remuneration Report” included in the Directors’ report.
No key management personnel received or are entitled to receive a benefit, other than a benefit included in the aggregate amount of emoluments.
Any transactions with key management personnel are made on normal commercial terms and conditions.
(b) Key management personnel shareholdings
This information is disclosed in Note 25 and within the “Remuneration Report” included in the Directors’ Report.
(c) Transactions with key management personnel and their related parties
Non-Executive Director, P George, received fees for consulting services of $175,502 (2010: $69,230) in relation to the transformation plan and the conduct of efficiency reviews in PMP Print and PMP New Zealand. This encompassed identification and analysis of structural and operational improvement opportunities.
(d) Transactions with related parties in the wholly owned group
Details of controlled entities are set out in Note 20. The entities and PMP conduct business transactions between themselves.
Such transactions include the purchase and sale of goods, services, plant and equipment and the receipt and payment of management fees, dividends and interest. All such transactions are conducted on the basis of normal commercial terms and conditions. PMP Limited has made a $412.7 million allowance for the provision of doubtful debts regarding related parties (2010: $373.9million).
(e) Transactions with other related parties
There were no transactions with any other related parties of the PMP Group.
25 Key management personnel(a) Compensation of key management personnel
PMP GROUP ($)
2 0 1 1 2 0 1 0
Short-term employee benefits 4,145,530 5,171,188
Other long-term employee benefits 60,066 30,720
Post employment benefits 241,487 225,268
Termination payments 158,234 -
Share-based payment* 340,925 536,866
Total compensation 4,946,242 5,964,042
* This is based on the accrued accounting value in accordance with AASB 2 Share-based payments. All options/rights valued in accordance with AASB 2 have been independently valued. In accordance with AASB 2 the non-market conditions associated with these options/rights were not taken into account when estimating the fair value at grant date. Instead, the number of options/rights expected to eventually vest is re-assessed at the end of each reporting period.
The company has applied the exemption under Amendment to Australian Accounting Standard - Key Management Personnel Disclosures by Disclosing Entities which exempts disclosing companies from the application of AASB 124 paragraphs AUS 25.2 to AUS25.6 and AUS 25.7.1 and AUS 25.7.2 as the requirements are now incorporated into the Corporations Law and are provided in the section titled "Remuneration Report" included in the Directors' Report designated as audited.
Notes to and forming part of the financial statements
2011_financials f.indd 82 9/6/2011 4:29:32 PM

83
Not
es to
and
form
ing
part
of t
he fi
nanc
ial s
tate
men
tsYE
AR E
ND
ED 3
0 JU
NE
2011
25Ke
y m
anag
emen
t pe
rson
nel (
cont
inue
d)
(b)
Opt
ion/
righ
ts h
oldi
ng o
f ke
y m
anag
emen
t pe
rson
nel
2011
Bala
nce
1 Ju
ly 2
010
Gran
ted
as
rem
uner
atio
nO
ptio
ns/r
ight
s ex
erci
sed
<a>
Laps
edCa
ncel
led
Bala
nce
30
June
201
1N
ot
exer
cisa
ble
Exer
cisa
ble
Shar
e Pr
ice
at e
xerc
ise
date
$
Valu
e at
ex
erci
se
date
$
Shar
e Pr
ice
at e
xerc
ise/
laps
e da
te $
Valu
e at
la
pse
date
$
R Al
lely
<b>
918,
804
-
(423
,173
)(2
16,3
34)
-
279
,297
2
79,2
97
-
-
275,
063
0.6
3 1
36,2
90
C Am
os <
c> -
-
-
-
-
-
-
-
-
-
-
-
P
Brow
ne36
8,67
1 22
0,71
4 -
(6
7,04
3) -
5
22,3
42
522
,342
-
-
-
0
.63
42,
237
D C
hess
er <
d>15
7,60
9 19
6,42
9 -
(3
54,0
38)
- -
-
-
-
-
0.8
9 3
15,0
94
A Cl
arks
on26
1,26
2 19
6,42
9 -
(3
6,85
2) -
4
20,8
39
420
,839
-
-
-
0
.63
23,
217
C D
avis
on54
3,78
1 27
1,42
9 -
(1
19,9
82)
-
695
,228
6
95,2
28
-
-
-
0.6
3 7
5,58
9 P
Elbo
urne
<d>
199,
275
-
-
(199
,275
) -
-
-
-
-
-
0
.70
139
,493
G
Pla
nt28
8,54
5 19
5,00
0 -
(3
9,93
8) -
4
43,6
07
443
,607
-
-
-
0
.63
25,
161
G S
teph
enso
n 12
0,28
3 27
5,00
0 -
-
-
3
95,2
83
395
,283
-
-
-
-
-
A
Will
iam
s24
6,37
7 30
0,00
0 -
-
-
5
46,3
77
546
,377
-
-
-
-
-
Tota
l3,
104,
607
1,65
5,00
1 (4
23,1
73)
(1,0
33,4
62)
-
3,3
02,9
73
3,3
02,9
73
-
2010
Bala
nce
1 Ju
ly 2
009
Gran
ted
as
rem
uner
atio
nO
ptio
ns/r
ight
s ex
erci
sed
<a>
Laps
edCa
ncel
led
Bala
nce
30
June
201
0N
ot
exer
cisa
ble
Exer
cisa
ble
Shar
e Pr
ice
at e
xerc
ise
date
$
Valu
e at
ex
erci
se
date
$
Shar
e Pr
ice
at e
xerc
ise/
laps
e da
te $
Valu
e at
la
pse
date
$
R Al
lely
713,
752
423,
173
-
(218
,121
) -
91
8,80
4 91
8,80
4 -
-
-
0.
5511
9,96
7P
Geo
rge
-
-
-
-
-
-
-
-
-
-
-
-
C D
avis
on38
5,86
9 27
5,36
2 -
(1
17,4
50)
-
543,
781
543,
781
-
-
-
0.55
64,5
98
P El
bour
ne
-
199,
275
-
-
-
199,
275
199,
275
-
-
-
-
-
A Cl
arks
on80
,103
18
1,15
9 -
-
-
26
1,26
2 26
1,26
2 -
-
-
-
-
G
Pla
nt90
,719
19
7,82
6 -
-
-
28
8,54
5 28
8,54
5 -
-
-
-
-
P
Brow
ne15
1,28
0 21
7,39
1 -
-
-
36
8,67
1 36
8,67
1 -
-
-
-
-
A
Will
iam
s -
24
6,37
7 -
-
-
24
6,37
7 24
6,37
7 -
-
-
-
-
D
Che
sser
-
15
7,60
9 -
-
-
15
7,60
9 15
7,60
9 -
-
-
-
-
G S
teph
enso
n -
12
0,28
3 -
-
-
12
0,28
3 12
0,28
3 -
-
-
-
-
Tota
l1,
421,
723
2,01
8,45
5 -
(3
35,5
71)
-
3,10
4,60
7 3,
104,
607
-
<a>
N
o op
tions
/rig
hts
are
exer
cisa
ble
at 3
0 Ju
ne 2
011
(201
0: n
il).
<b>
Ex
erci
se r
epre
sent
s sh
ort t
erm
ince
ntiv
e 20
09/2
010.
One
-thi
rd o
f R I
Alle
ly’s
STI
is a
fixe
d do
llar
valu
e w
hich
is r
equi
red
to b
e co
nver
ted
to s
hare
s. 3
86,4
33 s
hare
s pu
rcha
sed
by th
e co
mpa
ny (T
able
25(
c)) o
n m
arke
t in
the
curr
ent f
inan
cial
yea
r. T
he n
umbe
r of
sha
res
diffe
rs fr
om th
e 42
3,17
3 pe
r ab
ove
due
to
mov
emen
ts in
the
shar
e pr
ice
from
the
estim
ate
mad
e on
issu
e an
d th
e pu
rcha
se d
ates
.
<c>
Ap
poin
ted
EGM
of P
MP
(NZ)
Lim
ited
on 0
1/06
/11
afte
r co
mpl
etio
n of
P B
row
ne’s
sec
ondm
ent.
P
Brow
ne c
ompl
eted
his
New
Zea
land
sec
ondm
ent a
s EG
M o
f PM
P (N
Z) L
imite
d on
31/
05/1
1 an
d
has
been
tran
sfer
red
with
in th
e bu
sine
ss.
<d>
O
ptio
ns/r
ight
s la
psed
on
term
inat
ion
of e
mpl
oym
ent.
2011_financials f.indd 83 9/6/2011 4:29:32 PM

84
Not
es to
and
form
ing
part
of t
he fi
nanc
ial s
tate
men
tsYE
AR E
ND
ED 3
0 JU
NE
2011
25Ke
y m
anag
emen
t pe
rson
nel (
cont
inue
d)(c
)Sh
are
hold
ing
of k
ey m
anag
emen
t pe
rson
nel
2011
Bala
nce
1 Ju
ly 2
010
On
exer
cise
of
opt
ions
/ri
ghts
Purc
hase
sSa
les
Oth
erBa
lanc
e 30
Ju
ne 2
011
Bala
nce
1 Ju
ly 2
010
On
exer
cise
of
opt
ions
/ri
ghts
Purc
hase
sSa
les
Oth
erBa
lanc
e 30
Ju
ne 2
011
Dir
ecto
rsEx
ecut
ives
G J
Rea
ney
281,
740
<a>
18,2
60
-
-
300
,000
C
Amos
<e>
-
-
-
-
-
-
R I A
lley
<b>
285,
000
-
-
-
386,
433
671
,433
P
Brow
ne -
-
-
-
-
-
M
Bic
kfor
d-Sm
ith
-
<a>
150,
000
-
-
150
,000
A
Clar
kson
-
-
-
-
-
-
I L F
rase
r11
8,79
7 <
a>41
,203
-
-
1
60,0
00
D C
hess
er <
f> -
-
-
-
-
-
P
Geo
rge
92,6
19
<a>
-
-
-
92,
619
C D
avis
on -
-
-
-
-
-
G
oh S
N <
c> -
<
a> -
-
-
-
P
Elbo
urne
<g>
-
-
-
-
-
-
Ng
J S
<d>
35,0
00
<a>
-
-
(35,
000)
-
G P
lant
-
-
-
-
-
-
N S
park
s <
c> -
<
a> -
-
-
-
G
Ste
phen
son
50,0
00
-
-
-
-
50,
000
A W
illia
ms
-
-
-
-
-
-
Tota
l81
3,15
6 20
9,46
3 -
35
1,43
3 1
,374
,052
To
tal
50,0
00
-
-
-
-
50,
000
<a>
No
Dire
ctor
s, o
ther
than
R I
Alle
ly, h
ave
been
issu
ed w
ith a
ny o
ptio
ns/r
ight
s pr
ior
to o
r du
ring
th
e cu
rren
t fin
anci
al y
ear.
<b>
Sho
rt te
rm in
cent
ive
2009
/201
0. O
ne-t
hird
of R
I Al
lely
’s S
TI is
a fi
xed
dolla
r va
lue
whi
ch is
req
uire
d to
be
conv
erte
d to
sha
res.
386
,433
sha
res
wer
e pu
rcha
sed
on m
arke
t by
the
com
pany
in a
ccor
danc
e
with
R I
Alle
y’s
empl
oym
ent c
ontr
act.
The
num
ber
of s
hare
s di
ffers
from
the
423,
173
per
Tabl
e 25
(b) d
ue to
m
ovem
ents
in th
e sh
are
pric
e fr
om th
e es
timat
e m
ade
on is
sue
and
the
purc
hase
dat
es.
<c>
App
oint
ed 1
7/08
/10.
<d>
Ret
ired
17/0
8/10
.
<e>
App
oint
ed E
GM
of P
MP
(NZ)
Lim
ited
on 0
1/06
/11
afte
r co
mpl
etio
n of
P B
row
ne’s
sec
ondm
ent.
P
Brow
ne c
ompl
eted
his
New
Zea
land
sec
ondm
ent a
s EG
M o
f PM
P (N
Z) L
imite
d on
31/
05/1
1
and
has
been
tran
sfer
red
with
in th
e bu
sine
ss.
<f>
Ret
ired
19/0
1/11
.
<g>
Ret
ired
30/0
9/10
.
2010
Bala
nce
1 Ju
ly 2
009
On
exer
cise
of
opt
ions
/ri
ghts
Purc
hase
sSa
les
Oth
erBa
lanc
e 30
Ju
ne 2
010
Bala
nce
1 Ju
ly 2
009
On
exer
cise
of
opt
ions
/ri
ghts
Purc
hase
sSa
les
Oth
erBa
lanc
e 30
Ju
ne 2
010
Dir
ecto
rsEx
ecut
ives
I L F
rase
r11
8,79
7 <
a> -
-
-
11
8,79
7 C
Dav
ison
-
-
-
-
-
-
M A
Grif
fin <
b>19
6,73
3 <
a> -
-
(1
96,7
33)
-
P El
bour
ne -
-
-
-
-
-
N
g J
S15
,000
<
a>20
,000
-
-
35
,000
A
Clar
kson
-
-
-
-
-
-
G J
Rea
ney
281,
740
<a>
-
-
-
281,
740
G P
lant
-
-
-
-
-
-
P G
eorg
e92
,619
<
a> -
-
-
92
,619
P
Brow
ne -
-
-
-
-
-
M
Bic
kfor
d-Sm
ith <
c> -
<
a> -
-
-
-
A
Will
iam
s -
-
-
-
-
-
R
I Alle
y -
-
28
5,00
0 -
-
28
5,00
0 D
Che
sser
<d>
-
-
-
-
-
-
G S
teph
enso
n <
e> -
-
-
-
50
,000
50
,000
To
tal
704,
889
305,
000
-
(196
,733
)81
3,15
6 To
tal
-
-
-
-
50,0
00
50,0
00
<a>
No
Dire
ctor
s, o
ther
than
R I
Alle
ly, h
ave
been
issu
ed w
ith a
ny o
ptio
ns/r
ight
s pr
ior
to o
r du
ring
th
e cu
rren
t fin
anci
al y
ear.
<b>
M A
Grif
fin r
etire
d 10
/11/
09.
<c>
M B
ickf
ord-
Smith
app
oint
ed 2
0/07
/09.
<d>
D C
hess
er a
ppoi
nted
16/
11/0
9. R
etire
d 19
/01/
11.
<e>
G S
teph
enso
n ap
poin
ted
31/0
5/10
. Sha
res
held
prio
r to
com
men
cem
ent o
f em
ploy
men
t.
2011_financials f.indd 84 9/6/2011 4:29:32 PM

85
YEAR ENDED 30 JUNE 2011
26 Business combinations
2011
During the year ended 30 June 2011, the PMP Group made the following acquisition:
Acquisition of the business and assets of International Print Limited
On 6 May 2011, the PMP Group, via PMP Maxum Limited, acquired the business and assets of International Print Limited, a New Zealand based sheetfed printing business.
The purchase price includes cash consideration of $2.1 million on acquisition, $0.1 million on the relocation and recommissioning of plant and equipment acquired during the 2011 financial year and contingent consideration. The fair value of contingent consideration at acquisition date has been recognised as goodwill and a provision of $0.3 million. The consideration is deferred between twelve months and two years from acquisition date and is dependent upon sales revenue targets and the completion of continuous employment by a key employee. The balance of the purchase price of $1.9 million represents acquisition of plant and equipment.
2010
During the year ended 30 June 2010, the PMP Group made the following acquisition:
Acquisition of the Independent Magazine Distributor business
On 28 August 2009, the PMP Group, via Gordon & Gotch (NZ) Limited, acquired the Independent Magazine Distributors business which specialises in the business of magazine distribution in New Zealand.
The purchase price included cash and contingent consideration. A provision was made for the fair value of contingent consideration. No assets or liabilities were acquired in the business combination. Goodwill arose on the acquisition. It is attributable to the benefit expected from synergies, revenue growth and workforce. These benefits have not been separately identified from goodwill as their value cannot be reliably measured.
Notes to and forming part of the financial statements
2011_financials f.indd 85 9/6/2011 4:29:32 PM
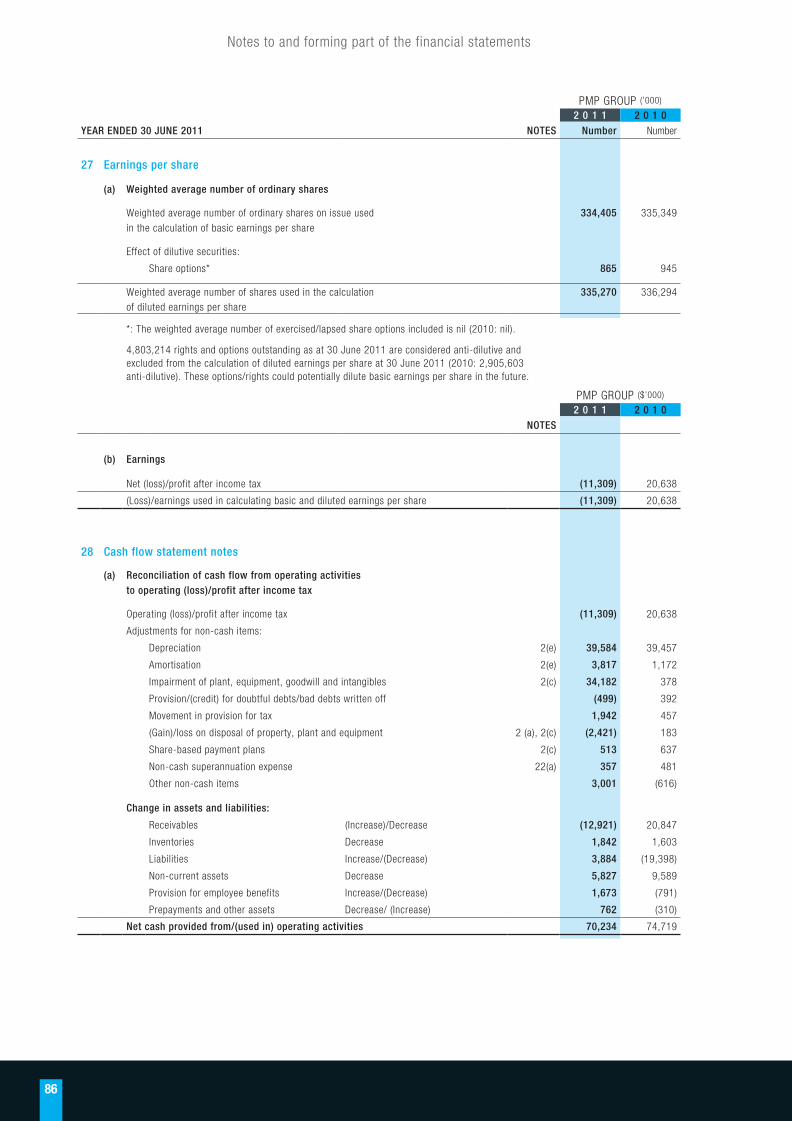
86
PMP GROUP (’000)
2 0 1 1 2 0 1 0YEAR ENDED 30 JUNE 2011 NOTES Number Number
27 Earnings per share
(a) Weighted average number of ordinary shares
Weighted average number of ordinary shares on issue used 334,405 335,349
in the calculation of basic earnings per share
Effect of dilutive securities:
Share options* 865 945
Weighted average number of shares used in the calculation 335,270 336,294 of diluted earnings per share
*: The weighted average number of exercised/lapsed share options included is nil (2010: nil).
4,803,214 rights and options outstanding as at 30 June 2011 are considered anti-dilutive and excluded from the calculation of diluted earnings per share at 30 June 2011 (2010: 2,905,603 anti-dilutive). These options/rights could potentially dilute basic earnings per share in the future.
PMP GROUP ($’000)
2 0 1 1 2 0 1 0NOTES
(b) Earnings
Net (loss)/profit after income tax (11,309) 20,638
(Loss)/earnings used in calculating basic and diluted earnings per share (11,309) 20,638
28 Cash flow statement notes
(a) Reconciliation of cash flow from operating activities to operating (loss)/profit after income tax
Operating (loss)/profit after income tax (11,309) 20,638
Adjustments for non-cash items:
Depreciation 2(e) 39,584 39,457
Amortisation 2(e) 3,817 1,172
Impairment of plant, equipment, goodwill and intangibles 2(c) 34,182 378
Provision/(credit) for doubtful debts/bad debts written off (499) 392
Movement in provision for tax 1,942 457
(Gain)/loss on disposal of property, plant and equipment 2 (a), 2(c) (2,421) 183
Share-based payment plans 2(c) 513 637
Non-cash superannuation expense 22(a) 357 481
Other non-cash items 3,001 (616)
Change in assets and liabilities:
Receivables (Increase)/Decrease (12,921) 20,847
Inventories Decrease 1,842 1,603
Liabilities Increase/(Decrease) 3,884 (19,398)
Non-current assets Decrease 5,827 9,589
Provision for employee benefits Increase/(Decrease) 1,673 (791)
Prepayments and other assets Decrease/ (Increase) 762 (310)
Net cash provided from/(used in) operating activities 70,234 74,719
Notes to and forming part of the financial statements
2011_financials f.indd 86 9/6/2011 4:29:32 PM

87
Notes to and forming part of the financial statements
PMP GROUP ($’000)
2 0 1 1 2 0 1 0YEAR ENDED 30 JUNE 2011 NOTES
28 Cash flow statement notes (continued)
(b) Reconciliation of cash and cash equivalents
Cash and cash equivalents 12,097 29,744
Total cash and cash equivalents 12,097 29,744
29 Financial instruments
The Group’s activities expose it to a variety of financial risks: market risk (including currency and interest rate risk), credit risk and liquidity risk. The Group’s overall risk management programme focuses on the unpredictability of financial markets and seeks to minimise potential adverse effects on the financial performance of the group.
Categories of financial instrument:
The Group holds the following categories of financial instruments:
Financial assets
Cash and cash equivalents 28(b) 12,097 29,744
Trade and other receivables 5, 7 133,325 120,381
Other 7 240 240
145,662 150,365
Financial liabilities
Trade and other payables 12 172,373 170,297
Interest bearing liabilities 13 153,077 197,805
Derivative financial instruments 15 5,552 3,503
331,002 371,605
2011_financials f.indd 87 9/6/2011 4:29:33 PM

88
YEAR ENDED 30 JUNE 2011
29 Financial instruments (continued)Details of the accounting policies and methods adopted, including the criteria for recognition, the basis of measurement and the basis on which income and expenses are recognised, in respect of each class of financial asset and financial liability are disclosed in Note 1.
(a) Hedging policy - overviewThe economic entity trades internationally, giving rise to exposure to market risks from changes in foreign currency exchange rates and interest rates. Derivative financial instruments are utilised to reduce those risks, principally interest rate swaps and contracts for forward currency. The economic entity has adopted certain principles in relation to derivative financial instruments:
a) It does not trade in derivatives that are not used in hedging the underlying business exposure of the economic entity;
b) All hedging is undertaken through the Group’s central treasury operation and is in accordance with Board approved policies.
(b) Interest Rate ManagementThe Group enters into fixed rate instruments to manage the cash flow risks associated with the interest rates on borrowings that are floating. Interest rate instruments allow the Group to swap floating rate borrowings into fixed rate borrowings in accordance with the PMP Group policy. These activities are regularly evaluated to ensure that the Group is not exposed to interest rate movements that could adversely impact its ability to meet financial obligations and to ensure compliance with borrowing covenants.
i) Interest rate risk exposure
The following tables set out the carrying amount by maturity of the financial instruments exposed to interest rate risk for the Group:
2011 FloatingFixed Interest maturing in
Non-interest
rate1 year or less
1 to 2 years
2 to 5 years
interest bearing Total
Note $’000 $’000 $’000 $’000 $’000 $’000
Financial assetsCash and deposits 28(b) 12,097 - - - - 12,097 Receivables 5,7 - - - - 133,325 133,325 Other financial assets 7 - - - - 240 240
Total financial assets 12,097 - - - 133,565 145,662 Weighted average interest rate 4.5% - - -
Financial liabilitiesPayables 12 - - - - (172,373) (172,373)Bank loans 13 (152,919) - - - - (152,919)Finance lease liabilities 13 - (42) (116) - - (158)
Total recognised financial liabilities (152,919) (42) (116) - (172,373) (325,450)Hedging instruments* 116,000 (71,625) (10,000) (34,375) - - Financial liabilities including hedging activities (36,919) (71,667) (10,116) (34,375) (172,373) (325,450)Weighted average interest rate - Australia 6.2% 6.0% 5.7% 5.2%Weighted average interest rate - New Zealand 4.6% 6.7% 6.2% 5.1%Net financial liabilities including hedging activities (24,822) (71,667) (10,116) (34,375) (38,808) (179,788)
2010 FloatingFixed Interest maturing in
Non-interest
rate1 year or less
1 to 2 years
2 to 5 years
interest bearing Total
Note $’000 $’000 $’000 $’000 $’000 $’000
Financial assetsCash and deposits 28(b) 29,744 - - - - 29,744 Receivables 5,7 - - - - 120,381 120,381 Other financial assets 7 - - - - 240 240
Total financial assets 29,744 - - - 120,621 150,365 Weighted average interest rate 4.3% - - -
Financial liabilitiesPayables 12 - - - - (170,297) (170,297)Bank loans 13 (197,610) - - - - (197,610)Finance lease liabilities 13 - (37) (158) - - (195)
Total recognised financial liabilities (197,610) (37) (158) - (170,297) (368,102)Hedging instruments* 148,396 (30,000) (55,523) (62,873) - - Financial liabilities including hedging activities (49,214) (30,037) (55,681) (62,873) (170,297) (368,102)Weighted average interest rate - Australia 6.4% 5.2% 5.9% 5.7%Weighted average interest rate - New Zealand 5.5% - 6.6% 5.1%Net financial liabilities including hedging activities (19,470) (30,037) (55,681) (62,873) (49,676) (217,737)
* Notional value of interest rate swaps.
PMP Limited’s receivables and payables are non-interest bearing. Cash and overdraft amounts are at the floating interest rate applicable to the PMP Group.
Notes to and forming part of the financial statements
2011_financials f.indd 88 9/6/2011 4:29:33 PM

89
PMP GROUP ($’000)
2 0 1 1 2 0 1 0YEAR ENDED 30 JUNE 2011 NOTES
29 Financial instruments (continued)
(b) Interest Rate Management (continued)
ii) Fair value of interest rate swaps
Australian Dollar interest rate swaps (372) (1,097)
New Zealand Dollar interest rate swaps (1,639) (1,538)
Total fair value of interest rate swaps 15 (2,011) (2,635)
At 30 June 2011, $0.5 million of income has been recorded in the statement of comprehensive income (2010: $2.3 million income).
iii) Interest rate sensitivity analysis - Fair Value Interest Rate Risk
If interest rates had changed +/- 1% from the year end rate with all other variables held constant, the impact on net profit/(loss) for the year including the impact on the fair value of interest rate swaps would have been:
Net (loss)/profit impact at 30 June
Interest rates increase 1% 1,506 2,733
Interest rates decrease 1% (1,542) (2,809)
iv) Interest rate sensitivity analysis - Cashflow Interest Rate Risk
If interest rates had changed +/- 1% from the year end rate with all other variables held constant, the impact on net profit/(loss) for the year would have been:
Net (loss)/profit impact at 30 June
Interest rates increase 1% (354) (533)
Interest rates decrease 1% 354 533
The Group’s sensitivity to interest rate has decreased during the current period mainly due to the reduction in variable rate debt instruments.
(c) Foreign exchange management
Foreign currency risk refers to the risk that the value of a financial commitment, recognised asset or liability will fluctuate due to changes in foreign currency rates. The Group’s foreign currency exchange risk arises primarily from where the Group has firm commitments or highly probable forecast transactions for receipts and payments that are to be settled in foreign currencies, or where the price is dependant on foreign currencies and also the risk that arises on translation of net investments in foreign operations.
The Group is exposed to foreign exchange risk from various currency exposures, primarily with respect to the New Zealand Dollar, the US Dollar, the Euro and the Great British Pound.
Foreign exchange risk that arises from firm commitments or highly probable transactions are managed primarily through the use of forward foreign currency derivatives. A portion of these transactions are hedged (such as the purchase of paper from various foreign suppliers) in each currency in accordance with the Group’s risk management policy.
Foreign currency risk also arises on translation of the net assets of PMP’s non-Australian controlled entities which have a different functional currency. The foreign currency gains or losses arising from this risk are recorded through the foreign currency translation reserve on translation to Australian Dollars on consolidation. This translation foreign currency risk is managed with borrowings denominated in the currency of the entity concerned.
Where a subsidiary hedges foreign exchange transactions it designates hedging instruments as cash flow hedges as appropriate.
Notes to and forming part of the financial statements
2011_financials f.indd 89 9/6/2011 4:29:33 PM

90
Notes to and forming part of the financial statements
Average exchange rate PMP GROUP
2 0 1 1 2 0 1 0 2 0 1 1 2 0 1 0YEAR ENDED 30 JUNE 2011 $ $ $’000 $’000
29 Financial instruments (continued)
(c) Foreign exchange management (continued)
i) Australian entity contracts to exchange foreign currency - relating to receipts and payments
United States Dollars - less than one year 0.994 0.859 12,054 35,944
UK Pounds - less than one year 0.610 0.576 164 3,205
Euro - less than one year 0.727 0.650 40,520 45,502
52,738 84,651
ii) New Zealand entity contracts to exchange foreign currency - relating to receipts and payments
NZ Dollars Australian Dollar EquivalentAverage exchange rate Average fixed rate PMP GROUP
2 0 1 1 2 0 1 0 2 0 1 1 2 0 1 0 2 0 1 1 2 0 1 0$ $ NZD $’000 NZD $’000 $’000 $’000
United States Dollars - less than one year 0.757 0.700 35,099 27,755 27,202 22,618
UK Pounds - less than one year 0.464 0.432 580 754 449 614
35,679 28,509 27,651 23,232
iii) Australian entity contracts to exchange foreign currency - relating to capital expenditure
Average exchange rate PMP GROUP
2 0 1 1 2 0 1 0 2 0 1 1 2 0 1 0$ $ $’000 $’000
US Dollars - less than one year 0.974 0.879 956 404
Euros - less than one year 0.730 0.592 668 629
Swiss Francs - less than one year 0.933 - 1,003 -
2,627 1,033
The capital expenditure includes the purchase and installation of printing presses and associated equipment across Australia.
iv) Fair value of forward exchange contracts
PMP GROUP
2 0 1 1 2 0 1 0NOTES $’000 $’000
Australian entity - foreign exchange contracts relating to receipts and payments (1,319) (1,447)
Australian entity - foreign exchange options relating to receipts and payments - 119
New Zealand entity - foreign exchange contracts relating to receipts and payments (2,180) 530
Australian entity - foreign exchange contracts relating to capital expenditure (42) (70)
Total fair value of forward exchange contracts (3,541) (868)
Comprised of:
Financial liabilities - current 15 (3,541) (868)
Total fair value of forward exchange contracts (3,541) (868)
2011_financials f.indd 90 9/6/2011 4:29:33 PM

91
YEAR ENDED 30 JUNE 2011
29 Financial instruments (continued)
(c) Foreign currency management (continued)
iv) Fair value of forward exchange contracts (continued)
At 30 June 2011, a $0.7 million debit (2010: $1.2 million credit) has been recognised within the statement of comprehensive income and a $2.2 million debit, excluding tax effect (2010: $0.8 million debit) is included within the cash flow hedge reserve in equity.
$1.1 million was transferred to inventory during the financial year ended 30 June 2011 (2010: $0.3 million).
v) Foreign currency sensitivity risk
The following table shows the effect on equity excluding tax effect as at 30 June from a 10 percent adverse / favourable movement in exchange rates at that date on a total portfolio basis with all other variables held constant, taking into account all underlying exposures and related hedges.
Adverse versus favourable movements are determined relative to the underlying exposure. An adverse movement in exchange rates implies an increase in the Group’s foreign currency risk exposure and a worsening in financial position. A favourable movement in exchange rates implies a reduction in foreign currency risk exposure and an improvement in financial position.
A sensitivity of 10 percent has been selected as this is considered reasonable given the current level of exchange rates and the volatility observed both on a historical basis and market expectations for future movement. Comparing the Australian dollar exchange rate against the United States dollar and the Euro and the New Zealand dollar against the United States dollar year end rates would give the following adverse and favourable rates:
Year end rate
10% rate
increase
10% rate
decrease
Australia dollar to:
United States dollar 1.070 1.177 0.973
Euro 0.739 0.813 0.672
New Zealand dollar to:
United States dollar 0.829 0.912 0.754
The net gain/(loss) in the cash flow hedge reserve reflects the result of exchange rate movements on the derivatives held in cash flow hedges which will be released to the statement of comprehensive income in the future as the underlying hedged item affects profit and loss.
PMP GROUP ($’000)
2 0 1 1 2 0 1 0Equity (cash flow hedge reserve) at 30 June
If there was a 10% increase in exchange rates with all other variables held constant - increase / (decrease)
(5,169) (7,383)
If there was a 10% decrease in exchange rates with all other variables held constant - increase / (decrease)
5,686 8,336
The impact on PMP Limited would be $nil as the entity does not hold forward exchange contracts.
For the PMP Group, foreign currency translation risk associated with PMP’s foreign investments results in some volatility to the foreign currency translation reserve. The impact on the foreign currency translation reserve relates to the translation of the net assets of foreign currency controlled entities on consolidation.
Notes to and forming part of the financial statements
2011_financials f.indd 91 9/6/2011 4:29:33 PM

92
YEAR ENDED 30 JUNE 2011
29 Financial instruments (continued)
(d) Liquidity risk management
Liquidity risk is the risk that funds may be insufficient to settle a transaction on the due date, and the Group may be forced to sell financial assets at a value which is below what they are worth.
PMP manages liquidity risk by maintaining adequate reserves, banking facilities and borrowing facilities by continually monitoring actual and forecast cash flows and matching the maturity profiles of financial assets and liabilities.
The table below shows the Group’s financial liabilities and derivative instruments in relevant maturity groupings based on the remaining period at the reporting date to the contractual maturity date. The amounts shown in the table are the contractual, undiscounted cash flows and include both principal and interest.
PMP Group
30 June 2011
Weighted Avg effective interest rate
Carrying amount
Contractual cash flows
Less than one year
1 to 2 years
2 to 5 years
Interest bearing liabilities % $’000 $’000 $’000 $’000 $’000
Bank Loans - Australia 6.2% 84,718 98,561 23,693 - 74,868
Bank Loans - New Zealand 4.6% 68,201 76,313 23,352 - 52,961
Finance lease liabilities 10.7% 158 188 56 56 76
Interest Rate Swaps - Aust* 5.8% 372 366 201 105 60
Interest Rate Swaps - NZ* 6.1% 1,639 2,768 715 1,012 1,041
Forward FX Contracts
- inflows - (20) (824) # (824) - -
- outflows - 3,561 84,545 # 84,545 - -
Payables - 172,373 172,373 172,373 - -
Total 331,002 434,290 304,111 1,173 129,006
30 June 2010
Weighted Avg effective interest rate
Carrying amount
Contractual cash flows
Less than one year
1 to 2 years
2 to 5 years
Interest bearing liabilities % $’000 $’000 $’000 $’000 $’000
Bank Loans - Australia 6.0% 125,081 137,637 26,485 111,152 -
Bank Loans - New Zealand 5.2% 72,529 75,697 - 75,697 -
Finance lease liabilities 10.7% 195 244 56 56 132
Interest Rate Swaps - Aust* 5.6% 1,097 1,293 27 404 862
Interest Rate Swaps - NZ* 5.8% 1,538 2,030 - 1,198 832
Forward FX Contracts
- inflows - - (734) # (734) - -
- outflows - 868 109,650 # 109,650 - -
Payables - 170,297 170,297 170,297 - -
Total 371,605 496,114 305,781 188,507 1,826
* Net amounts for interest rate swaps for which net cash flows are exchanged.
# This represents the gross payment under the forward contract.
Notes to and forming part of the financial statements
2011_financials f.indd 92 9/6/2011 4:29:34 PM

93
YEAR ENDED 30 JUNE 2011
29 Financial instruments (continued)
(e) Credit RiskCredit risk is the risk that a counterparty will default on their financial obligations resulting in financial loss to the Group. Credit risk exists from cash and cash equivalents, trade and other receivables and derivative financial instruments. The Group’s exposure to credit risk arises from the potential default of the counter party, with a maximum exposure equal to the carrying value of these assets net of any provision for doubtful debts (refer to Note 5).
The credit risk on cash and cash equivalents and financial instruments is limited as the counterparties are financial institutions with credit ratings of A- or higher. Also, PMP has policies that limit the amount of credit exposure to any one financial institution.
PMP has an approved Credit Policy Manual which provides guidelines for the management of credit risk. This provides guidance for the way in which the credit risk of customers is assessed, and the use of credit risk rating and other information in order to set appropriate trading limits with customers.
In some instances security may be required to be supplied to PMP from customers to minimise risk. The security is either in the form of Director guarantees for their business which is secured over a residential property or may be an upfront payment of between 75% - 50% of the trade before executing the sale.
(f) Capital management
PMP Limited’s capital management plan over the medium term is to achieve a target capital structure and to optimise financial returns to shareholders based on the following considerations:
- Delivering the most efficient capital structure and reducing the Group’s weighted average cost of capital (WACC); - The capability to service debt and meet financial covenant constraints consistent with an investment grade rating; - Listed comparables and market expectations; - Retaining flexibility for PMP to pursue attractive investment opportunities including acquisitions, organic growth and share buy-
backs.
The group has target gearing levels in the range of: - Debt to equity of between 50% to 75%, and at 30 June 2011 was slightly below this range at 39.7% - Debt to EBITDA below 2 times, and at 30 June 2011 was at 1.4 times - EBITDA to borrowing costs of greater than 3.5 times, and at 30 June 2011 was at 6.7 times
With financial markets remaining volatile, the company currently seeks to retain flexibility through maintaining a gearing ratio that is either at the bottom end of or below the range taking into account the earnings of the business over the next 12-24 months. Due to the markets volatility we believe that the investors expect PMP to maintain maximum flexibility by retaining capital for various opportunities.
On 24 March 2011, PMP announced its intention to undertake an on market share buy-back. The buy-back duration was from 8 April 2011 to 30 June 2011. The maximum number of shares that could be bought back was 9.9 million. The number of shares purchased was 5,459,271. Under the buy-back announced in June 2010, 10,000 shares were bought-back during the period from 1 July 2010 to 21 December 2010.
On 2 August 2011, PMP announced its intention to undertake an on market share buy-back. The buy-back duration is from 17 August 2011 to 30 June 2012. The maximum number of shares that can be bought back is 20 million.
PMP announced on 18 August 2011 a final dividend of 1 cent per share for the year ended 30 June 2011, expected to be fully franked based on a corporate tax rate of 30%. No interim dividend was paid.
(g) Fair values
The fair value of all financial assets and liabilities equates to the carrying value.
Notes to and forming part of the financial statements
2011_financials f.indd 93 9/6/2011 4:29:34 PM
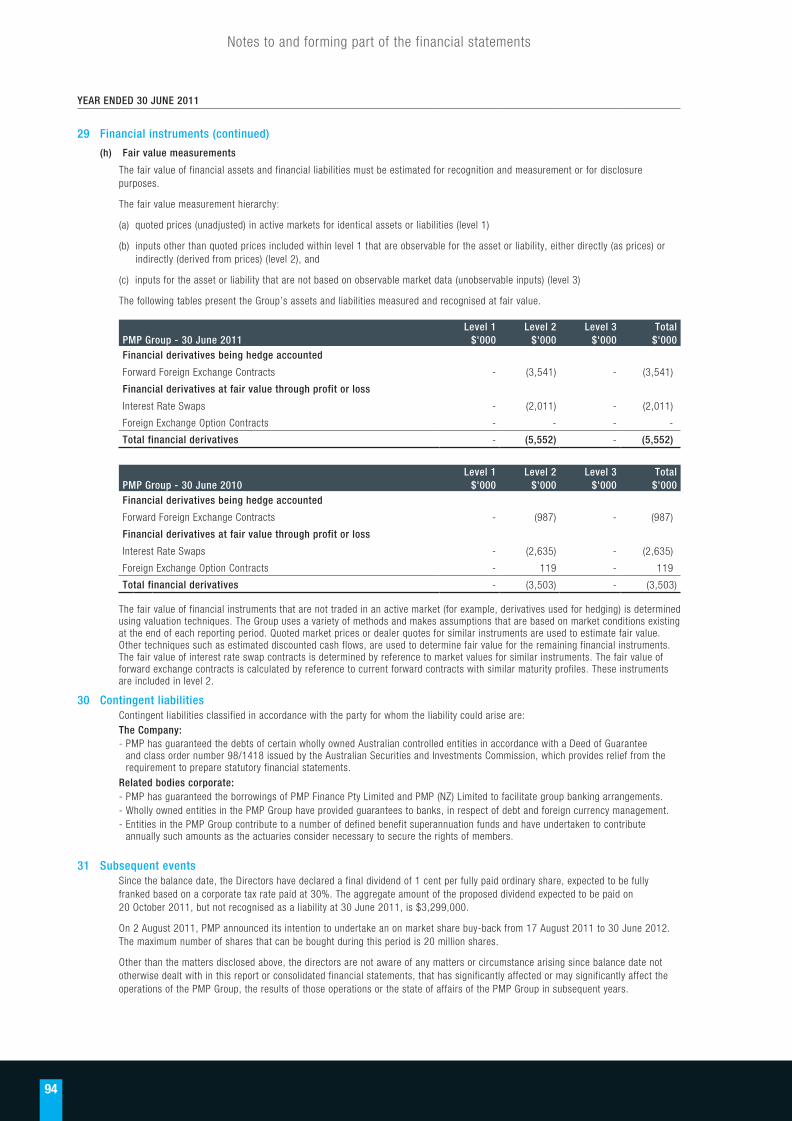
94
YEAR ENDED 30 JUNE 2011
29 Financial instruments (continued)
(h) Fair value measurements
The fair value of financial assets and financial liabilities must be estimated for recognition and measurement or for disclosure purposes.
The fair value measurement hierarchy:
(a) quoted prices (unadjusted) in active markets for identical assets or liabilities (level 1)
(b) inputs other than quoted prices included within level 1 that are observable for the asset or liability, either directly (as prices) or indirectly (derived from prices) (level 2), and
(c) inputs for the asset or liability that are not based on observable market data (unobservable inputs) (level 3)
The following tables present the Group’s assets and liabilities measured and recognised at fair value.
Level 1 Level 2 Level 3 TotalPMP Group - 30 June 2011 $'000 $'000 $'000 $'000Financial derivatives being hedge accounted
Forward Foreign Exchange Contracts - (3,541) - (3,541)
Financial derivatives at fair value through profit or loss
Interest Rate Swaps - (2,011) - (2,011)
Foreign Exchange Option Contracts - - - -
Total financial derivatives - (5,552) - (5,552)
Level 1 Level 2 Level 3 TotalPMP Group - 30 June 2010 $'000 $'000 $'000 $'000Financial derivatives being hedge accounted
Forward Foreign Exchange Contracts - (987) - (987)
Financial derivatives at fair value through profit or loss
Interest Rate Swaps - (2,635) - (2,635)
Foreign Exchange Option Contracts - 119 - 119
Total financial derivatives - (3,503) - (3,503)
The fair value of financial instruments that are not traded in an active market (for example, derivatives used for hedging) is determined using valuation techniques. The Group uses a variety of methods and makes assumptions that are based on market conditions existing at the end of each reporting period. Quoted market prices or dealer quotes for similar instruments are used to estimate fair value. Other techniques such as estimated discounted cash flows, are used to determine fair value for the remaining financial instruments. The fair value of interest rate swap contracts is determined by reference to market values for similar instruments. The fair value of forward exchange contracts is calculated by reference to current forward contracts with similar maturity profiles. These instruments are included in level 2.
30 Contingent liabilitiesContingent liabilities classified in accordance with the party for whom the liability could arise are:The Company:- PMP has guaranteed the debts of certain wholly owned Australian controlled entities in accordance with a Deed of Guarantee
and class order number 98/1418 issued by the Australian Securities and Investments Commission, which provides relief from the requirement to prepare statutory financial statements.
Related bodies corporate:- PMP has guaranteed the borrowings of PMP Finance Pty Limited and PMP (NZ) Limited to facilitate group banking arrangements.- Wholly owned entities in the PMP Group have provided guarantees to banks, in respect of debt and foreign currency management.- Entities in the PMP Group contribute to a number of defined benefit superannuation funds and have undertaken to contribute
annually such amounts as the actuaries consider necessary to secure the rights of members.
31 Subsequent eventsSince the balance date, the Directors have declared a final dividend of 1 cent per fully paid ordinary share, expected to be fully franked based on a corporate tax rate paid at 30%. The aggregate amount of the proposed dividend expected to be paid on 20 October 2011, but not recognised as a liability at 30 June 2011, is $3,299,000.
On 2 August 2011, PMP announced its intention to undertake an on market share buy-back from 17 August 2011 to 30 June 2012. The maximum number of shares that can be bought during this period is 20 million shares.
Other than the matters disclosed above, the directors are not aware of any matters or circumstance arising since balance date not otherwise dealt with in this report or consolidated financial statements, that has significantly affected or may significantly affect the operations of the PMP Group, the results of those operations or the state of affairs of the PMP Group in subsequent years.
Notes to and forming part of the financial statements
2011_financials f.indd 94 9/6/2011 4:29:34 PM
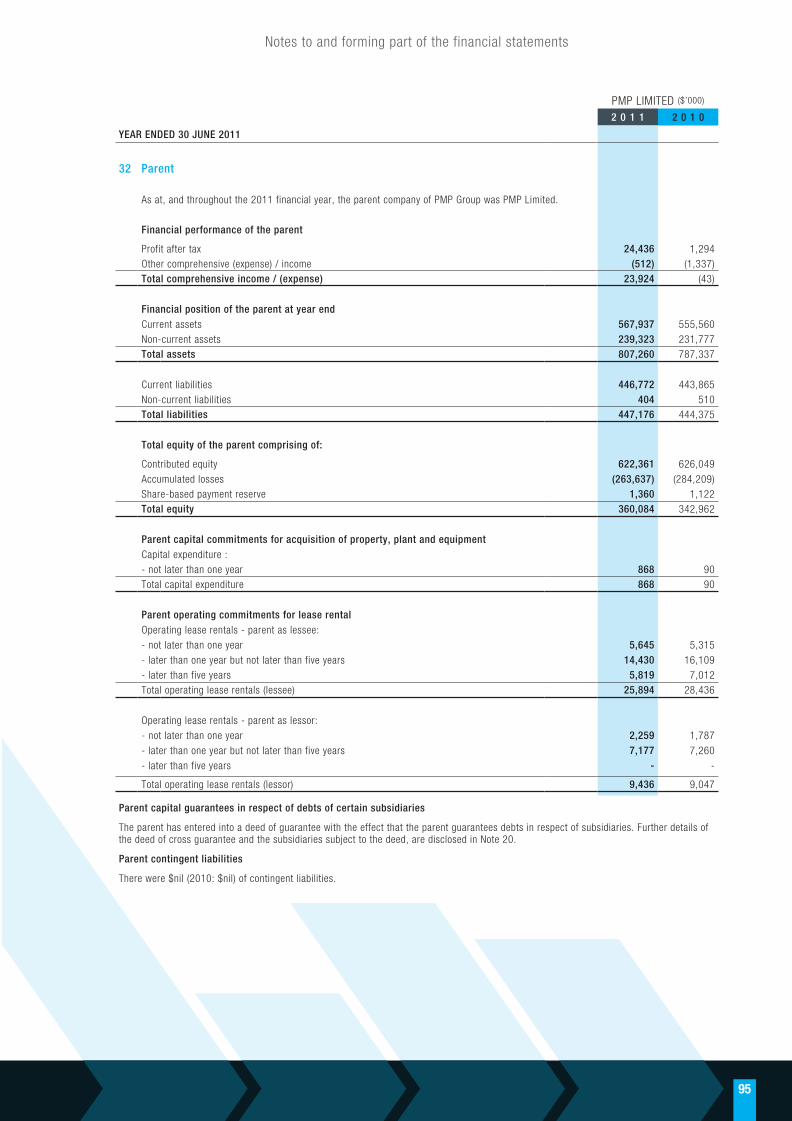
95
Notes to and forming part of the financial statements
PMP LIMITED ($’000)
2 0 1 1 2 0 1 0
YEAR ENDED 30 JUNE 2011
32 Parent
As at, and throughout the 2011 financial year, the parent company of PMP Group was PMP Limited.
Financial performance of the parent
Profit after tax 24,436 1,294 Other comprehensive (expense) / income (512) (1,337)Total comprehensive income / (expense) 23,924 (43)
Financial position of the parent at year endCurrent assets 567,937 555,560 Non-current assets 239,323 231,777 Total assets 807,260 787,337
Current liabilities 446,772 443,865 Non-current liabilities 404 510 Total liabilities 447,176 444,375
Total equity of the parent comprising of:
Contributed equity 622,361 626,049
Accumulated losses (263,637) (284,209)Share-based payment reserve 1,360 1,122 Total equity 360,084 342,962
Parent capital commitments for acquisition of property, plant and equipmentCapital expenditure :- not later than one year 868 90 Total capital expenditure 868 90
Parent operating commitments for lease rentalOperating lease rentals - parent as lessee:
- not later than one year 5,645 5,315
- later than one year but not later than five years 14,430 16,109 - later than five years 5,819 7,012 Total operating lease rentals (lessee) 25,894 28,436
Operating lease rentals - parent as lessor:
- not later than one year 2,259 1,787
- later than one year but not later than five years 7,177 7,260
- later than five years - -
Total operating lease rentals (lessor) 9,436 9,047
Parent capital guarantees in respect of debts of certain subsidiaries
The parent has entered into a deed of guarantee with the effect that the parent guarantees debts in respect of subsidiaries. Further details of the deed of cross guarantee and the subsidiaries subject to the deed, are disclosed in Note 20.
Parent contingent liabilities
There were $nil (2010: $nil) of contingent liabilities.
2011_financials f.indd 95 9/6/2011 4:29:34 PM

96
In accordance with a resolution of the Directors of PMP Limited, we state that:
(a) in the Directors’ opinion, there are reasonable grounds to believe that the company will be able to pay its debts as and when they become due and payable;
(b) in the Directors’ opinion, the attached financial statements are in compliance with the Financial Reporting Standards, as stated in Note 1 to the financial statements;
(c) in the Directors’ opinion, the attached financial statements and notes thereto are in accordance with the Corporations Act 2001, including compliance with accounting standards and giving a true and fair view of the financial position and performance of the consolidated entity; and
(d) the Directors have been given the declarations required by section 295A of the Corporations Act 2001
At the date of this declaration, the company is within the class of companies affected by ASIC Class Order 98/1418. The nature of the deed of cross guarantee is such that each company which is party to the deed guarantees to each creditor payment in full of any debt in accordance with the deed of cross guarantee.
In the Directors’ opinion there are reasonable grounds to believe that the company and the companies to which the ASIC Class Order applies, as detailed in Note 20 to the financial statements will, as a group, be able to meet any obligations or liabilities to which they are, or may become liable, subject by virtue of the deed of cross guarantee.
Signed in accordance with a resolution of the Directors made pursuant to section 295(5) of the Corporations Act 2001.
On behalf of the Directors
Graham J. Reaney Chairman
Richard I. Allely Chief Executive Officer and Managing Director
Sydney, 2 September 2011
DIRECTORS’ DECLARATION
2011_financials f.indd 96 9/6/2011 4:29:35 PM

97
Liability limited by a scheme approved under Professional Standards Legislation. Member ofDeloitte Touche Tohmatsu
Independent Auditor’s Report to the Members of PMP LimitedReport on the Financial Report We have audited the accompanying financial report of PMP Limited, which comprises the statement of financial position as at 30 June 2011, the statement of comprehensive income, the statement of cash flows and the statement of changes in equity for the year ended on that date, notes comprising a summary of significant accounting policies and other explanatory information, and the directors’ declaration of the consolidated entity, comprising the company and the entities it controlled at the year’s end or from time to time during the financial year as set out on pages 48 to 96.
Directors’ Responsibility for the Financial ReportThe directors of the company are responsible for the preparation of the financial report that gives a true and fair view in accordance with Australian Accounting Standards and the Corporations Act 2001 and for such internal control as the directors determine is necessary to enable the preparation of the financial report that is free from material misstatement, whether due to fraud or error. In Note 1, the directors also state, in accordance with Accounting Standard AASB 101 Presentation of Financial Statements, that the consolidated financial statements comply with International Financial Reporting Standards.
Auditor’s ResponsibilityOur responsibility is to express an opinion on the financial report based on our audit. We conducted our audit in accordance with Australian Auditing Standards. Those standards require that we comply with relevant ethical requirements relating to audit engagements and plan and perform the audit to obtain reasonable assurance whether the financial report is free from material misstatement.
An audit involves performing procedures to obtain audit evidence about the amounts and disclosures in the financial report. The procedures selected depend on the auditor’s judgement, including the assessment of the risks of material misstatement of the financial report, whether due to fraud or error. In making those risk assessments, the auditor considers internal control, relevant to the entity’s preparation of the financial report that gives a true and fair view, in order to design audit procedures that are appropriate in the circumstances, but not for the purpose of expressing an opinion on the effectiveness of the entity’s internal control. An audit also includes evaluating the appropriateness of accounting policies used and the reasonableness of accounting estimates made by the directors, as well as evaluating the overall presentation of the financial report.
We believe that the audit evidence we have obtained is sufficient and appropriate to provide a basis for our audit opinion.
Auditor’s Independence DeclarationIn conducting our audit, we have complied with the independence requirements of the Corporations Act 2001. We confirm that the independence declaration required by the Corporations Act 2001, which has been given to the directors of PMP Limited, would be in the same terms if given to the directors as at the time of this auditor’s report.
OpinionIn our opinion:
(a) the financial report of PMP Limited is in accordance with the Corporations Act 2001, including:
(i) giving a true and fair view of the consolidated entity’s financial position as at 30 June 2011 and of its performance for the year ended on that date; and
(ii) complying with Australian Accounting Standards and the Corporations Regulations 2001; and
(b) the consolidated financial statements also comply with International Financial Reporting Standards as disclosed in Note 1.
Report on the Remuneration Report We have audited the Remuneration Report included in pages 32 to 44 of the directors’ report for the year ended 30 June 2011. The directors of the company are responsible for the preparation and presentation of the Remuneration Report in accordance with section 300A of the Corporations Act 2001. Our responsibility is to express an opinion on the Remuneration Report, based on our audit conducted in accordance with Australian Auditing Standards.
Opinion
In our opinion the Remuneration Report of PMP Limited for the year ended 30 June 2011, complies with section 300A of the Corporations Act 2001.
DELOITTE TOUCHE TOHMATSU
G Couttas Partner Chartered Accountants
Sydney, 2 September 2011
INDEPENDENT AUDIT REPORT
2011_financials f.indd 97 9/6/2011 4:29:37 PM

98
2007 2008 2009 2010 2011 % change<b> <a>
SALES REVENUE <c>Print Australia A$ mill 579.2 568.5 492.1 472.4 (4.0%)
Printing A$ mill 675.2
Distribution Australia A$ mill 109.5 105.7 84.5 90.9 7.6%
Distribution A$ mill 131.9
Gordon and Gotch Australia A$ mill 386.3 428.4 408.9 413.4 1.1%
Gordon and Gotch A$ mill 431.8
Digital Premedia A$ mill 49.2 41.1 33.9 31.1 28.6 (8.0%)PMP New Zealand A$ mill 231.2 209.1 195.5 189.0 (3.3%)Total Sales Revenue A$ mill 1,288.1 1,347.3 1,345.6 1,212.1 1,194.3 (1.5%)
PROFITABILITY <c>EBITDA A$ mill 128.3 125.9 96.7 92.8 100.1 7.9%EBITPrint Australia A$ mill 54.7 34.3 47.7 55.4 16.1%
Printing A$ mill 81.1
Distribution Australia A$ mill 4.1 4.9 (2.2) 1.1 -
Distribution A$ mill 5.3
Gordon and Gotch Australia A$ mill 13.2 13.0 7.5 3.7 (51.0%)
Gordon and Gotch A$ mill 8.2
Digital Premedia A$ mill 7.5 6.0 4.6 3.5 0.1 (97.1%)
PMP New Zealand A$ mill 14.9 9.0 5.5 4.8 (12.7%)Corporate A$ mill (10.8) (8.2) (10.9) (9.8) (8.4) 14.3%Total EBIT A$ mill 91.3 84.7 54.9 52.2 56.7 8.5%
Print Australia EBIT/sales % 9.4 6.0 9.7 11.7 20.6%
Printing EBIT/sales % 12.0
Distribution Australia EBIT/sales % 3.7 4.6 (2.6) 1.2 -
Distribution EBIT/sales % 4.0
Gordon and Gotch Australia EBIT/sales % 3.4 3.0 1.8 0.9 (50.0%)
Gordon and Gotch EBIT/sales % 1.9
Digital Premedia EBIT/sales % 15.2 14.6 13.7 11.1 0.5 (95.5%)Print New Zealand EBIT/sales % 6.4 4.3 2.8 2.6 (7.1%)Total EBIT/sales % 7.1 6.3 4.1 4.3 4.7 9.3%
OTHER Net cash provided by operating activities A$ mill 104.4 83.7 43.3 74.7 70.2 (6.0%)
Earnings per ordinary share (basic) cents 15.5 23.9 (7.9) 6.2 (3.4) -
Earnings per ordinary share (diluted) cents 15.3 23.9 (7.9) 6.1 (3.4) -
Dividend per share (paid) cents - <d> 4.5 <e> 3.0 - <f> 1.0 -
Total assets A$ mill 773.2 835.5 838.0 792.8 738.1 (6.9%)
Total net debt A$ mill 255.1 199.6 208.3 168.1 141.0 16.1%
Total shareholders equity A$ mill 271.7 395.2 351.7 374.9 355.3 (5.2%)
Debt/Equity Ratio % 93.9 50.5 59.2 44.8 39.7 11.4%
Interest Cover times 5.4 6.5 5.1 5.3 6.7 26.4%
Depreciation A$ mill 36.0 40.1 40.6 39.5 39.6 (0.3%)
Amortisation A$ mill 1.0 0.8 1.2 1.2 3.8 -
Capital Expenditure A$ mill 47.4 91.8 23.4 30.9 <g> 39.7 (28.5%)Employees Full Time No. 3,074 3,010 2,762 2,678 2,622 (2.1%)
Note: EBIT - Earnings before significant items, finance costs and income tax.
<a> During 2010 PMP changed its segment reporting structures in accordance with the adoption from 1 July 2009 of AASB 8: Operating Segments; and revised its accounting policy for its defined benefit plan. Comparatives have been restated for 2009 and 2008.
<b> Comparatives have not been restated for change in accounting policy on defined benefit superannuation plan.
<c> 2006/2007 - Sales and EBIT are shown based on product segmentation.
<d> Final dividend for the year ended 30 June 2007 of 3.0 cents and interim dividend for the year ended 30 June 2008 of 1.5 cents both fully franked.
<e> Final dividend for the year ended 30 June 2008 of 3.0 cents (60% franked).
<f> Final dividend for the year ended 30 June 2010 of 1.0 cent, fully franked.
<g> Includes the cash paid for the business and assets of International Print Limited.
FIVE YEAR SUMMARY
2011_financials f.indd 98 9/6/2011 4:29:37 PM

99
as at 18 August 2011
Shares and options / rights
Shares on issue 329,879,212
Rights/options on issue
Employee rights 4,676,679
Total rights/options 4,676,679
Distribution of shareholders Number of
shareholders Number of shares Percentage
1 - 1,000 766 460,391 0.14%
1,001 - 5,000 2,227 6,377,979 1.93%
5,001 - 10,000 536 4,286,348 1.30%
10,001 - 100,000 416 11,034,160 3.34%
100,001 and over 34 307,720,334 93.29%
Total number 3,979 329,879,212 100.00%
Holdings of less than a marketable parcel 476 173,929
Name of Substantial Shareholder Number of Securities Voting Power
Orbis Group 65,092,105 19.73%
Hunter Hall Investment Management Ltd 62,828,907 19.05%
Lazard Asset Management Pacific Company 40,002,258 12.13%
Fraser & Neave Ltd 39,020,117 11.83%
PM CAPITAL Limited 37,665,124 11.42%
DFA Australia Ltd 20,131,721 6.10%
Twenty largest shareholders Number of shares % of total issued
J P Morgan Nominees Australia Limited 125,052,396 37.91%
Citicorp Nominees Pty Limited 86,083,798 26.10%
National Nominees Limited 50,231,842 15.23%
HSBC Custody Nominees (Australia) Limited 20,730,630 6.28%
UBS Nominees Pty Ltd 9,106,596 2.76%
Weresyd Proprietary Limited 3,828,718 1.16%
Citicorp Nominees Pty Ltd (Cwlth Bank Off Super A/C) 3,186,291 0.97%
IWPE Nominees Pty Limited 2,130,266 0.65%
Queensland Investment Corporation 1,198,188 0.36%
Mr Mark Herdman & Mrs Heather Fletcher Herdman 700,000 0.21%
Mr Anthony Charles Patrick Cotterell 500,000 0.15%
Mr Vincent Paul Godfrey Cotterell 500,000 0.15%
Mr Richard Ivan Allely 386,433 0.12%
Tristyn Pty Ltd 380,000 0.12%
Success Advisors Pty Ltd 356,600 0.11%
Mr Richard Ivan Allely & Mrs Kim Ann Allely 285,000 0.09%
ABN AMRO Clearing Sydney Nominees Pty Ltd 260,026 0.08%
Summerview Management Pty Ltd 250,000 0.08%
Wales Corporation Pty Ltd 240,000 0.07%
JP Morgan Nominees Australia Limited 222,289 0.07%
Total Holding 305,629,073 92.65%
SHARE REGISTER INFORMATION
2011_financials f.indd 99 9/6/2011 4:29:37 PM

100
Shareholder Details PMP shareholders who:
• havechangedtheirnameoraddress
• wishtoconsolidatetwoormoreseparateholdings
• wishtolodgetheirtaxfilenumbers
• donotwishtoreceiveanAnnualReport
should advise PMP’s share registry by completing the relevant forms available from www.computershare.com or by telephoning 1300 556 161 to request the appropriate forms.
Shareholders accessing the Computershare website will need to key in their Holder Identification Number (HIN) if their securities are broker-sponsored and held in CHESS, while shareholders with securities held in an issuer-sponsored sub-register will need to key in their Security Reference Number (SRN).
Tax File Numbers It is important that Australian resident shareholders have their tax file number or exemption details noted by the share registry. While it is not compulsory to provide a tax file number or exemption details, PMP is required by law to deduct tax at the top marginal rate from the unfranked part of any dividend paid to Australian resident shareholders who have not supplied these details.
Receive Information by Email Shareholders can receive notifications about company announcements, annual and periodic reports and other company information by email.
By registering for this service, shareholders can be kept up to date with significant company announcements as they happen.
To Register Electronically:visit www.pmplimited.com.au and follow these easy steps:
• ClickonRegisterYourEmailAddressfor shareholder information
• Thenenteryourpersonalsecurityinformation:
– Holder Identification Number (HIN) or Security Reference Number (SRN)
– Postcode
• Clickon“Submit”andfollowtheprompts
• Thenjustclickon‘reply’toconfirmyourdetails,then‘send’.
Share Registry Computershare Investor Services Pty Limited Level 5, 115 Grenfell Street Adelaide SA 5000 GPO Box 1903 Adelaide SA 5001
Enquiries within Australia: 1300 556 161
Enquiries outside Australia: +61 3 9415 4000
Email: [email protected]
Website: www.computershare.com
Chief Entity Auditors Deloitte Touche Tohmatsu
Lead Bankers ANZ
Commonwealth Bank of Australia
Toronto-Dominion Bank
Rabobank
Investor Information Shareholders requiring information should contact the share registry, or Geoff Stephenson - Chief Financial Officer:
Telephone: 02 9412 6000
Facsimile: 02 9413 3942
Email: [email protected]
Alistair Clarkson BComm LLB MBA(distn) ACIS GradDipACG GAICD
Company Secretary
SHAREHOLDER INFORMATION
The PMP Limited Annual General Meeting
will be held at 11:00am on Friday 18 November 2011 at
Mantra Chatswood 10 Brown Street, Chatswood NSW 2067
Details of the business of the meeting are contained in the separate Notice of Meeting sent to shareholders.
2011_financials f.indd 100 9/6/2011 4:29:38 PM

PrintPMP Maxum (NZ) Ltd
15c Vestey Drive, Mount Wellington Auckland New Zealand
Telephone: +64 09 377 9322
Design, Photography and IllustrationDimension Studios
Units 14-17 32 Ralph Street Alexandria NSW 2015 Australia
Telephone: 02 9490 7200
Environmentally Friendly PaperPMP required that certain criteria be met when deciding what paper would be used for its annual report. This decision process highlights the new criteria that PMP’s customers are evaluating in order to satisfy their readers and advertisers that an environmentally-driven product has been published. PMP’s criteria were as follows:
• Supportpapersupplierswhoarestrivingtoachievethehighestsustainability programmes;
• InsistonFSCorPEFCaccreditedpaper;
• UseaPMPsheetfedprintoperationwhichconsumesminimalgas;
• Aligntheprintingandpaperproductionwithoperationswhichuseahighlevel of renewable energy; and
• Offsetallcarbonemissions.
The paper used in this annual report is an environmentally responsible paper manufacturedundertheenvironmentalmanagementsystemISO14001,usingElementChlorineFree,FSCCertifiedMixedSourcepulp,sourcedfromwell managed and legally harvested forests.
Full Carbon Emission OffsetsPMP’s sheetfed printing plant in New Zealand, PMP Maxum, purchases electricity from a supplier which sources its energy from hydro, geothermal and natural gas. PMP offers its clients a full range of options to offset their printing carbon footprint through its Green Blueprint marketing programme.
A full life cycle emissions analysis was carried out on the production of this annual report. Greenhouse emission offsets through the Greenfleet programme have been transacted to offset a conservative 125% of the estimated full life cycle emissions from the Report.
ANNUAL REPORT 2011The 2011 Annual Report was produced by PMP Limited companies
310720_PMPAP2011_IBC.indd 1 13/9/11 1:33:54 PM

Registered Office:
PMP LIMITED 39 050 148 644
Level 1267 Albert AvenueChatswoodNew South Wales 2067Tel: 02 9412 6000Fax: 02 9413 3939
www.pmplimited.com.au
PMP
LIM
ITED
ABN
39
050
148
644
| 20
11 A
NNUA
L RE
PORT
A N N U A L
R E P O R T
2 0 1 1
310720_PMPAR2011_Covers.indd 1 8/9/11 2:26:42 PM