Plumas County Community Health Assessment 2011-2012
35
The Plumas County Community Health Improvement Plan Is posted online at www.countyofplumas.com Community Health Improvement Plan (CHIP) December 2012 Prepared by Plumas County Public Health Agency Quincy, California
Transcript of Plumas County Community Health Assessment 2011-2012

Plumas County Community Health Improvement Plan (CHIP) 2012
Page 1
The Plumas County Community Health Improvement Plan
Is posted online at www.countyofplumas.com
Community Health Improvement Plan
(CHIP)
December 2012
Prepared by
Plumas County
Public Health Agency
Quincy, California

Plumas County Community Health Improvement Plan (CHIP) 2012
Page 2
The Plumas County Community Health Improvement Plan, December 2012, is the
culmination of an 18-month process led by the Plumas County Public Health Agency,
the Local Health Department (LHD) located in the county seat of Quincy, California, with
jurisdiction countywide. With suppport and funding from the National Association of
County and City Health Officials (NACCHO) and the Robert Wood Johnson Foundation
(RWJ), Plumas County Public Health Agency and its partners - Plumas District Hospital
based in Quincy, the Greenville Rancheria Tribal Clinic based in Greenville, Eastern
Plumas Health Care based in Portola, Seneca Healthcare District based in Chester, and
the Sierra Institute for Community and Environment based in Taylorsville – completed a
collaborative, countywide Community Health Assessment (CHA) and Community Health
Improvement Plan (CHIP). Both documents are accessible to agencies, organizations,
and the general public on the county website at www.countyofplumas.com.
Completion of the CHIP marks the beginning of the Action or Implementation Phase of
the community health improvement process starting in January 2013. All health delivery
partners made commitments in writing to the ongoing collaborative partnership and to
accountability for the CHIP Action Plan.

Plumas County Community Health Improvement Plan (CHIP) 2012
Page 3
Acknowledgements
Plumas County Residents
More than 400 residents participated in project activities including
Town Hall Meetings in Fall 2011 and 2012
Eastern Plumas Heath Care
Tom Hayes, CEO; Mark Schweyer, Director of Clinical Operations and Telemedicine
Greenville Rancheria
Margaret Alspaugh, MD, Executive Director; Lee Brooks, FNP
Plumas County Mental Health
Michael Gunter, MFT
Plumas County Public Health
Karla Burnworth, Health Education Chief; Dana Cash, Health Education Specialist; Mimi Hall, MPH, Director; Louise Steenkamp, MBA, Assistant Director;
Tina Venable, RN, PHN, Director of Nursing
Plumas Crisis Intervention and Resource Center
Dennis Thibeault, Executive Director
Plumas District Hospital
Dan Brandes, MPH, Facilities Director; Douglas Lafferty, CEO
Denise Lauffer, RN
Seneca Healthcare District
Linda Wagner, RN, CEO
Plumas County Social Services
Elliott Smart, Director
The Sierra Institute for Community and Environment
Jonathan Kusel, PhD, Executive Director; Rachel McDowell, Health Intern
Zach Revene, Health Associate
And Special Thanks to the Supporting Work of:
Plumas Alcohol Tobacco and Other Drug Coalition
Plumas County Community Corrections Partnership
Plumas County Community Health Improvement Plan (CHIP) 2012
Page 4
Table of Contents
Project Participants 2
Acknowledgements 3
Letter to the Community 5
Executive Summary 6
Health Issue #1: Increase Access to Health Care 7
Health Issue #2: Improve Health Behaviors 8
Health Issue #3: Optimize Current Resources 9
Methodology 10
Issue Prioritization and Strategy Development 12
CHIP Action Phase 16
Appendix 1: Results from Community Issue Prioritization 17
Appendix 2: Plumas County Health Indicators 19
Appendix 3: Community Health Partnership Description 29
Appendix 4: Definitions and Terminology 31
Appendix 5: Letters of Support 33

Plumas County Community Health Improvement Plan (CHIP) 2012
Page 5
Letter to the Community
Dear Plumas County Residents,
The 2012 Plumas County Community Health Improvement Plan (CHIP) is the result of a robust Community Health Assessment process in which data was collected regarding the community health issues that are most important to Plumas County residents.
The CHIP is an action-oriented, living document to mobilize the community in areas where we can be most impactful on improving the health of all Plumas County residents, particularly those most vulnerable. It serves as a comprehensive set of policy and program recommendations for our community based on the most current information we have regarding the health status of our communities.
Clearly, health is influenced by things such as individual behaviors, age, genetics, and medical care. However, social and economic factors such as education, health insurance, employment and income, and living and working conditions all shape the overall health and vitality of our communities.
Our goal is to make Plumas County a healthier community. We envision a place where everyone has access to health care and preventative services, where we’re celebrated for embracing healthy lifestyles and where our communities and neighborhoods are string and vibrant. As partners in the local health system, we recognize we can only achieve this goal through partnerships and positive changes at the individual, school, workplace, and community level.
This plan not only informs the community about the health status of county residents, it also serves as a living document that guides the health department, hospitals and clinics and our community partners, in aligning our program development, activities, and resources to collectively improve community health status over the next three years and beyond.
The Plumas County Community Health Improvement Plan provides a common vision and shared approach for local partners to carry out our work. More importantly, it is a foundation to stimulate strategic new partnerships towards a broad agenda to collectively influence a healthier Plumas County. Implementation of the Community Health Improvement Plan strategies and activities will commence beginning in the spring of 2013. We invite you to visit the county public health department website at www.countyofplumas.com to view information about the Community Health Improvement Process. After May 1, 2013, you may also visit www.healthyplumas.org where we will post regular updates and annual reports.
Sincerely, Dr. Margaret Alspaugh, Executive Director Mimi Hall, Public Health Director, Greenville Rancheria Plumas County
Tom Hayes, CEO, Eastern Plumas Health Care Doug Lafferty, CEO, Plumas District Hospital Jonathan Kusel, Executive Director, Sierra Institute Linda Wagner, CEO, Seneca Healthcare District

Plumas County Community Health Improvement Plan (CHIP) 2012
Page 6
Executive Summary
The Plumas County Community Health Improvement Plan (CHIP) is a living document that will be updated regularly as new information, resources, and emergent issues are identified. The CHIP is a component of Mobilizing for Action Through Planning and Partnership (MAPP), a countywide community health assessment and improvement process led by the Public Health Agency in partnership with the county’s three hospital districts - Plumas District Hospital, Eastern Plumas Health Care, and Seneca Healthcare District - and the Greenville Rancheria Tribal Clinic and the Sierra Institute for Community and Environment.
More than 400 Plumas residents participated in MAPP assessment and improvement activities as listed below:
9 Town Hall meetings
10 focus groups
15 key informant interviews
a Strategic Visioning process
an Issues Prioritization training
9 in-person health care partnership meetings
4 Data Indicator Group (DIG) meetings
4 Improvement-Measures-Planning-Accountability-Team (IMPACT) meetings
2 Strategic Planning Kick-Offs
2 selected public viewings of Unnatural Causes, the award winning documentary, and
one countywide, two-day Public Health Summit on the Power of Prevention
Community-Driven Priorities
One hundred and thirty-two Plumas residents participated in the Issues Prioritization component of the process and
rated Access to Health Care as the top priority. Effective Quality Care and Addressing Alcohol and Drug were the 2nd and 3rd priorities identified by residents (Appendix 1). Project partners synthesized the community-ranked priorities with assessment findings and, using a Multi-voting quantitative process, arrived at three overarching health priorities. The result is a 3-year, action-oriented Health Priorities Plan on the following pages that lays out goals and objectives, strategies, lead roles and outcome measures for the following three health priorities:
1. Increase access to health care 2. Improve health behaviors, and 3. Optimize existing resources.
Public health, and hospital and clinic partners are accountable for the implementation of the CHIP and have lead roles in improvement activities. Their commitment to improving health outcomes and leadership in the county’s health care delivery system are evidenced in letters of support provided at the end of this report (Appendix 5).
Vision
Healthy Plumas County has a sustainable and equitable continuum of care, vibrant residents, and communities that are connected through collaborations and partnerships.
Plumas County Community Health Improvement Plan (CHIP) 2012
Page 7
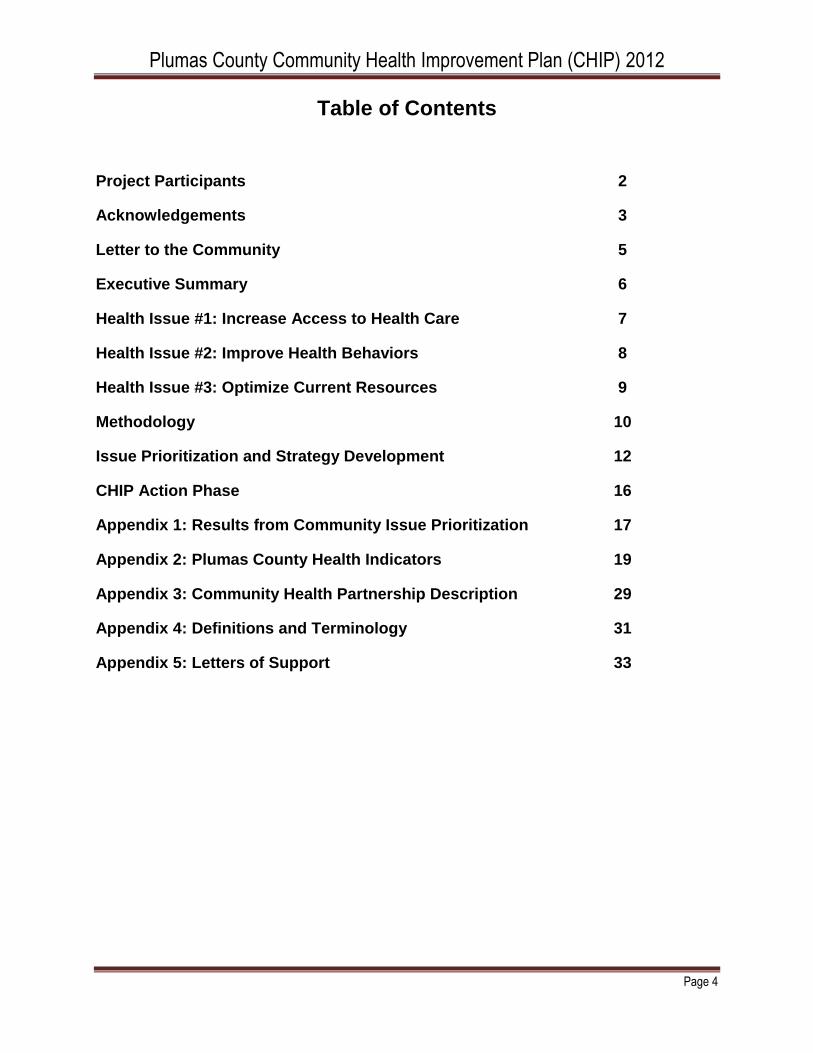
CHIP Action Plan 2013-2015
Health Priority #1: Increase Access to Health Care
Timeframe: Years 1,2 and 3 - January 2013 through December 2015
Goals
Objectives Strategies Lead Role and Community Partners
Health Status Outcomes and Indicators
Goal 1 Insurance
Objective 1.1 Increase percent covered by Medi-Cal, CMSP/LIHP
Provide assistance in enrollment and eligibility
Public Health, Social Services, PCIRC Application Assisters, WIC
-Enrollment data -Assister trainings -School EE -pursue Blue Shield Fund
Objective 1.2 Enroll eligible applicants for Health Benefits Exchange (138% to 400% FPL)
Educate community and business organizations about available opportunities to expand coverage (SHOP and Covered California)
Public Health, School District, PCIRC, Hospitals and Clinics, Greenville Rancheria, County Board of Supervisors, Chambers of Commerce, Hospital Boards
-Information materials distributed and posted on websites -Town Hall meetings -Hospital Board mtgs -School In-service presentations -Covered California Grant
Goal 2 Clinical Services
Objective 2.1 Establish medical and dental home
Work with hospitals and Social Services to identify target/at- risk populations
Hospitals and Clinics, Social Services, Public Health Clinic and home visitation program, dental providers
-Hospital patient discharge information/ flyer -Medical and dental provider brochure
Objective 2.2 Continuity of Care
Provide coordination and case management follow through
Hospitals, clinics, primary care providers, In-Home Support Services, Home Health, SNFs
-MOU with medical and support service partners -Referral Flow Chart and information
Objective 2.3 Timely preventive care
Coordinate with hospitals and community-based partners for outreach and education
Hospitals, clinics, Career and Business, Forest Service, major employers, Public Health, Social Services
-Health Summit during National Public Health Month -Hospital Prevention Screenings in Spring and Fall
Goal 3 Social and economic barriers
Objective 3.1 Culture and language
Implement Culturally and Linguistically Appropriate (CLAS) training and CLAS activities
County Literacy program, Public Health bilingual/interpreter services, hospitals, clinics, CBOs,
-Policy -Conduct trainings -Spanish translator assistance -Language phone line
Objective 3.2 Income
Career/Business, Social Services, PCIRC, Public Health, major employers
-Job training summits -Literacy program
Objective 3.3 Social support network
Increase coordination and referral to community organizations and support
Food bank, career and business network, transportation assistance, community development
-Food Vouchers -Transportation Vouchers -Job training
Objective 3.4 Cycle of poverty
Increase advocacy and coordination of support services including dental care, job training, housing
Housing, Social Services, PCIRC, Hospitals, Clinics, Public Health
-Public viewing events (Un-natural Causes, Poor Kid/PBS, etc) -social determinants education at Health Summit

Plumas County Community Health Improvement Plan (CHIP) 2012
Page 8
Health Priority #2: Improve Health Behaviors
Timeframe: Years 1,2 and 3 - January 2013 through December 2015
Goals
Objectives Strategies Lead Role and Community Partners
Health Status Outcomes and Indicators
Goal 1
Sexual and reproductive health
Objective 1.1
Address teen pregnancy
Engage young girls in leadership and goal-oriented activities including education
Hospitals, clinics, Public Health, schools, Round House Council and other community organizations
-Health education brochures -Health education curriculum in schools -County data
Objective 1.2
Address single motherhood
Coordinate a campaign to raise awareness of challenges of single parenting
Hospitals, clinics, Public Health, schools, CBOs, Greenville Rancheria, youth groups, housing, social services, FRC
-Speakers bureau on positive parenting, socio-economic factors in raising families -Press release -Brochures
Goal 2
Address alcohol, tobacco and other drug (ATOD) use
Objective 2.1
Reduce adolescent use of tobacco and chew
Coordinate youth activities/ATOD prevention activities across the county
Schools, Plumas County Tobacco and ATOD Prevention Coalition, County Tobacco Use Reduction Program, Feather River College
-California Healthy Kids Data -County Tobacco Reduction Program Data -Youth Prevention Summit
Objective 2.2
Focus on use in sports and high school activities
Work with school district in high school sports and other youth programs/activities
PUSD, Indian Valley Recreation District, community youth programs, Fair Ground/rodeos, FRC
-California Healthy Kids Data -Survey among Rodeo youth
Objective 2.3
Use of ATOD and related chronic disease
Develop standard policy statements, information, and change social norms/acceptance
ATOD Coalition, FRC, Hospitals, Clinics, Dental Providers, Primary Care Providers, Public Health, Public Housing
-Cessation Programs -Internet/Cell phone coaching -Provider Patient Questions -Discharge Follow-up
Goal 3
Address mental health issues
Objective 3.1
Focus on adolescents early identification
Work with schools, parents and providers to engage youth, support activities and leadership
School Nurses/ Teachers, Public Health, Hospitals, Clinics, PCPs, Youth Programs/Activities, Parent Engagement
-School In-service Training on Early ID -Provider Workshop; UCSF/other Expertise -County Health Summit -Youth leadership activities
Objective 3.2
Address specific issues including suicide, depression, feelings of hopelessness among high school students
Raise awareness about mental well-being, reduce stigma of mental disorders, and offer coping techniques
Indian Valley Summit Coalition, Roundhouse Council, Greenville Rancheria, Hospitals, Clinics, Schools, ATOD Coalition, Public Health
-California Healthy Kids Survey -Coping techniques workshop for children and parents -Mental health education in schools

Plumas County Community Health Improvement Plan (CHIP) 2012
Page 9
Health Priority #3: Optimize Current Resources Timeframe: Project Year 2 and 3 – January 2014 through December 2015
Goals
Objectives Strategies Lead Role and Community Partners
Health Status Outcomes and Indicators
Goal 1 Achieve systems improvement to broaden and deepen the involvement of multiple stakeholders on planning, policy, service and coordination issues across local health system partners
Objective 1.1 Efficiently and effectively leverage multiple resources across the system of services and partners so that there is broad and collective actions towards priorities and goals
Increase the number of agencies and organizations that are formal partners in the ongoing Community Health Improvement process
Local Health Connection Partners, Community Corrections Partnership, Oral Health Coalition, community organizations and business stakeholders, hospitals, clinics, tribal clinic, hospital board members, criminal justice system, district attorney’s office, sheriff’s office
-Memorandum of Understanding for institutional sustainability -Additional resources funding from grant applications
Objective 1.2
Establish standards and practices for quality improvement across all partners and stakeholders (health care, law enforcement, mental health providers, business community)
Regularly train a diverse workforce across system partners on Plan Do Study Act and other QI tools and establish quality standards to provide quality, client and community centered services
Implement effective, evidence based best practices across the continuum of services which includes multiple sector public and private partners
Public Health, Local Health Connection Partners, social services, mental health, probation, district attorney’s office, Plumas Crisis Intervention and Resource Centers, hospitals, clinics, tribal clinic
-Policy and Common Framework for Quality Improvement
- Standard Measures and agreed upon common set of tools, data gathering, results
-Dissemination of reports and results on partner and county websites
Objective 1.3 Move beyond a historic reliance on formal health system resources for health improvement efforts towards a model of multiple public and private community resources
Negotiate agreements with key implementation partners that clearly outline financing arrangement, roles and responsibilities and shared accountability, blending funds to work towards system outcomes
Local Health Connection Partners, Community Corrections Partnership, Oral Health Coalition, community organizations and business stakeholders, hospitals, clinics, tribal clinic, hospital board members, school district, community, law enforcement, Veteran’s Services, Roundhouse Council, Greenville Rancheria
-MOU that articulates commitment of staff, resources, activities of the organization -Presentations to Boards of hospitals and organizations -Participation in Health Summit via informational display -Town Hall meetings
Objective 1.4
Align outreach and
communication efforts
Collectively plan education and marketing efforts from an “issue” perspective, rather than organizational or program specific approach
Local Health Connection Partners, Community Corrections Partnership, Oral Health Coalition, CBOs, businesses, hospitals, clinics, tribal clinic, hospital board members, school district, community
--MOU -Written Policy, Procedures and Standards - Countywide Health Summit

Plumas County Community Health Improvement Plan (CHIP) 2012
Page 10
Methodology
The Plumas County Public Health Agency and partners used components of Mobilizing for Action through Planning and Partnerships (MAPP), a strategic approach to community health improvement. The tool helps communities improve health and quality of life through community-wide and community-driven strategic planning. Through MAPP, communities seek to achieve optimal health by identifying and using their resources wisely, taking into account their unique circumstances and needs and forming effective partnerships for strategic action. The MAPP approach brings four assessments together to gather information and to drive the identification of strategic issues.
The Community Themes and Strengths Assessment provides an understanding of the issues that residents feel are important by answering the questions: “What is important to our community?” “How is quality of life perceived in our community?” and “What assets do we have that can be used to improve community health?”
The Local Public Health System Assessment focuses on all of the organizations and entities that contribute to the public’s health and answers the questions: “What are the components, activities, competencies, and capacities of our local public health system?” and “How are the Essential Services being provided to our community?”
The Community Health Status Assessment identifies priority community health and quality of life issues. Questions answered include: “How healthy are our residents?” and “What does the health status of our community look like?”
The Forces of Change Assessment focuses on identifying forces such as legislation, technology, and other impending changes that affect the context in which the community and its public health system operate. This answers the questions: “What is occurring or might occur

Plumas County Community Health Improvement Plan (CHIP) 2012
Page 11
that affects the health of our community or the local public health system?” and “What specific threats or opportunities are generated by these occurrences?”
The 10 Essential Public Health Services are:
1. Monitor health status to identify community health problems. 2. Diagnose and investigate health problems and health hazards in the community 3. Inform, educate and empower people about health issues. 4. Mobilize community partnerships to identify and solve health problems. 5. Develop policies and plans that support individual and community health efforts. 6. Enforce laws and regulations that protect health and ensure safety. 7. Link people to needed personal health services and assure the provision of health care
when otherwise unavailable. 8. Assure a competent public health and personal health care workforce. 9. Evaluate effectiveness, accessibility, and quality of personal and population-based
health services. 10. Research for new insights and innovative solutions to health problems.

Plumas County Community Health Improvement Plan (CHIP) 2012
Page 12
Issue Prioritization and Strategy Development
Project partners formed a data sub-committee called the Data Indicators Group (DIG) that met 6 times in January-February 2012. The role of the DIG was to review county data and community feedback, analyze available data and sources for identifying health inequities, and compare local data with state and national indicators and sources (see sources in Appendix 2). A key goal was to examine and identify racial/ethnic disparities given the growing Latino population in the community of Portola, and particular health issues for Native American/Maidu families in Greenville. Through focus groups and interviews, health issues of diabetes, obesity and depression/suicide have been identified; however, there is no local data or research to date that quantifies these disparities. Health disparities tied to cross-generational ties to poverty and ties to poorer health are evidenced through key informant interviews with safety-net and housing agencies. A cross-generational culture of poverty exists in Plumas County. Particularly alarming is the high rate of children living in poverty (24%) and the number of single, female-headed households with children under 18 comprise almost 36% of the county’s households. The team anticipates collecting new data and developing indicators to measure outcomes. Key findings are summarized below: 1. Socio-economic factors
Plumas County has double the proportion of seniors as compared to the rest of California, the majority lives on social security
Single female-headed households with children under 18 comprise almost 36% of the county’s households
Plumas County has a smaller proportion of children compared to the rest of California but the percentage of children living in poverty (24%) has steadily increased and exceeds the state rate
Employment in Plumas County is timber-based and seasonal in nature. As a result, the unemployment ranges from about 11% to double that rate during winter months. This has a major impact on the social and economic landscape
43% of housing units in Plumas County are vacant, compared to 8% in California and 12.8% in the United States
2. Health Behaviors and Mental Well-Being
Alcohol, tobacco and substance use rates are alarming in the County as evidenced in ATOD Needs Assessment conducted by Plumas County in November 2011 and the California Healthy Kids Survey among high school students
Self-inflicted intentional injuries and the suicide rate among Native Americans exceed state rates
Diabetes and obesity are also concerns but local data are not currently available (anecdotal information from focus groups with Native American/Maidu families and the Greenville Rancheria Tribal Clinic)
3. Local Public Health System Infrastructure
With less funding, county health and human services departments are operating in silos
The county’s three critical access hospitals are fiscally vulnerable and challenged to meet the requirements for electronic medical records, system and technological improvements, and leadership and management
Health reform will require system improvements to broaden and deepen the involvement of multiple stakeholders on policy, service and assessment issues

Plumas County Community Health Improvement Plan (CHIP) 2012
Page 13
Action Plan Leverages Assets and Resources
As part of the Community Health Assessment and Improvement process, partners recognized that existing resources within the county could be maintained, leveraged and enhanced to better impact positive health outcomes for the Plumas County population. Local Public Health System partners also acknowledge that building a partnership of key private and public community partners is a vital step in successfully addressing barriers to community wide health and wellness. Formal collaborations designed to address the specific issues of prevention, wellness, and access to health care would enable sustainable system wide changes across major community institutions.
In June of 2010, Plumas County Public Health Agency, Plumas County Department of Social Services and Plumas Unified School district signed a Memorandum of Understanding (MOU) to launch the Express Enrollment project. Express Enrollment (EE) expedites Medi-Cal and Healthy Families enrollment for uninsured children who receive free school meals, using the school lunch application to also serve as an Express Enrollment for Medi-Cal and Healthy Families, since the income eligibility guidelines for free and reduced school lunch are the same as those for Medi-Cal and Healthy Families, respectively.
These efforts were expanded when ten key stakeholders, including county health and human service agencies, law enforcement, local hospitals and clinics and local non-profits, signed the Local Health Connections MOU in February 2011. This was a natural expansion of the Express Enrollment effort and driven by the group’s common vision to improve health outcomes for individuals with complex medical and/or social support issues.
In September 2011, the Plumas County Community Corrections Partnership (CCP) first convened. Members of the Executive Committee include the Superior Court Judges, District Attorney, Public Health Director, Probation Chief, Public Defender, and Sheriff. This group worked with county health and human service agencies, housing and community development, non-governmental organizations and the Career and Business Network (formerly Alliance for Work Force Development) to plan and implement activities targeting individuals in the criminal justice system with an overall goal of rehabilitation and reducing recidivism. These partners have leveraged funds from a variety of sources to provide health care, mental health and substance use disorder treatment services to inmates and individuals on post release community supervision. In addition, organizations work together to provide education, job training, Medi-Cal and County Medical Services Program enrollment assistance, and other ancillary services. The group developed the Plumas County Community Corrections Plan in January 2012, which marked the first major planning and implementation project to span across the criminal justice system, courts, health and human services, community organizations and the community at large.
In the fall of 2010, Plumas County’s three district hospitals joined Plumas County Public Health Agency and the Sierra Institute for Community and Environment to form the Northern Sierra Collaborative Health Network. In the spring of 2011, the Greenville Rancheria joined the group. This partnership serves as a foundation for new and deeper partnerships to address health care delivery, access to and coordination of care, and quality of care while working towards a more integrated model of health care service delivery. Two major goals of the Collaborative are to improve community health outcomes and to increase the effectiveness of the local health care system though strengthened financial stability of our hospitals and clinics.

Plumas County Community Health Improvement Plan (CHIP) 2012
Page 14
For the past 7 years, the Oral Health Coalition has worked with a broad group of partners to collaboratively reduce childhood tooth decay rates in all Plumas County communities. The Coalition members are partnering to implement county wide outreach, education and referral activities, Medi-Cal eligibility and enrollment assistance, school based screenings and preventative treatments, pro-bono and sliding fee dentistry, and case manage children with urgent or severe decay or in need of hospitalized dentistry.
Community and Partners Prioritize Key Issues
In fall 2012, community residents participated in five Town Hall meetings as part of the CHIP prioritization process to rate aspects of a healthy service delivery system. The 127 participating residents were asked to respond to questions based on dimensions in The Commonwealth Fund’s National Scorecard on U.S. Health System Performance 2011. The priorities below are in rank order of the highest percentage of rating a particular dimension as “very important.”
Project partners formed the Improvement, Measures, Planning and Action Team (IMPACT). IMPACT members met over four planning sessions to prioritize issues by reviewing county health data, findings from the assessments, and other primary data from Town Hall Listening Sessions and Key Informant Interviews. The IMPACT team used a Multi-Voting Technique to narrow down the list of health issues and included the factors that affect health, the social determinants of health, and other considerations unique to Plumas County. The goal of the first planning session was to establish priorities for actionable areas of improvement and propose specific strategies to that would result in meaningful improvement in priority areas. The IMPACT group noted that the community expressed ongoing interest in all nine Town Hall meetings; county prevention activities are essential as indicated in public health priorities as well as state and national guidelines for improving health outcomes; and health care providers are instrumental as indicated by facility priorities, capabilities and resources. Subsequent sessions were focused on finalizing strategies and outlining specific activities and deliverables to support each area of improvement.
Evidence-based Practices Drive Health Action Plan
The IMPACT team identified and used the best available evidence for making informed public health practice decisions in the CHIP Action Plan. Public health evidence-based practice requires health departments to use the best available evidence in making decisions and in
Community Issue Prioritization 1. Access – 90% 2. Effective Quality Care – 88% 3. Addressing AOD and Mental Well-Being
– 87% 4. Quality of Care – 83% 5. Healthy Lives – 77% 6. Tobacco Use and Related Disease –
75% 7. Poverty and Households – 73%
8. Equity – 72%

Plumas County Community Health Improvement Plan (CHIP) 2012
Page 15
ensuring the effectiveness of processes, programs, and interventions. The IMPACT team began using The Guide to Community Preventive Services to help identify evidence-based and promising practices for developing strategies in the CHIP Action Plan. The Guide provides a host of interventions for tobacco, physical activity, chronic diseases and social environment, to name a few. As appropriate, practices will be incorporated into the design of new or revised processes, programs, and interventions. For interventions that involve Native American/Maidu families, evidence-based or promising practices will be adapted to integrate cultural values and beliefs.
The use of research results, evaluations, and evidence-based practices were used to develop data indicators and outcomes and the IMPACT team was mindful of aligning community priorities with the Healthy People 2020 Indicators, National Prevention Strategy Indicators and the California Department of Health Services Strategic Plan and Indicators. In addition, IMPACT members reviewed the 2009 Greenville Rancheria’s Needs Assessment and worked with Dr. Alspaugh, Executive Director of the tribal clinic, to ensure that Indian health priorities and local Maidu family needs were included. The three action areas or Health Priorities are to improve access to health care, improve health behaviors, and to optimize current resources

Plumas County Community Health Improvement Plan (CHIP) 2012
Page 16
CHIP Action Phase
The Community Health Improvement process is an ongoing effort to be revisited every three years based on changing needs and health status of the community, progress made towards existing priority areas changes in assets and resources. Public health and health care partners are scheduled to meet in January 2013 to review and refine the strategies in the CHIP Action Plan and develop a more detailed plan for developing standard data collection tools, monitoring and ongoing evaluation efforts. Project partners plan on addressing each of the three priority health issues more in depth with each of their organizations, partners and respective communities through the spring of 2013. As part of National Public Health Week, partners will work with community and business members to convene a Plumas County Health Improvement Summit. Each of the four major Plumas County communities and their respective hospital districts expressed the importance of engaging both community members and nontraditional partners specific to each community to more fully develop community specific measurable objectives and strategies to reach them.
As the CHIP project partners move into the Action Phase we will focus our efforts on each of the three priority issues. The Plumas County Health Assessment will be updated annually and will form the basis by which improvement may be measured in the priority areas.
CHIP project partners will work to implement and evaluate each Priority Area and related Objectives for success and impact. Implementation of the action plans will ultimately strengthen the public health infrastructure, enhance the planning and development of community health partnerships, and promote and support the health, well-being, and quality of life of Plumas County residents. CHIP partners have agreed to review the implementation on an annual basis to update the information and to continually, and collaboratively, improve the health of Plumas County.
In completing this phase of the Community Health Improvement Plan, project partners gained a great deal of insight directly from the communities we serve. Community members and new partners demonstrated a great deal of enthusiasm for engaging with their local health system. This certainly provided great motivation to move the process forward and remains a constant reminder of the commitment across multiple sectors of the community to improve the health and well-being of Plumas County residents through collaboration with others.

Plumas County Community Health Improvement Plan (CHIP) 2012
Page 17
Appendix 1: Results from Community Issue Prioritization
DIMENSION OF A HEALTH SYSTEM:
Equity Greenville Chester Quincy Portola A Portola B
1% Not important at all 3% 1 0% 0 0% 0 0% 0 0% 0
0% Not important 0% 0 0% 0 0% 0 0% 0 0% 0
2% Neither important or Unimportant 0% 0 0% 0 2% 1 0% 0 3% 1
26% Somewhat important 25% 8 17% 2 27% 12 30% 3 28% 8
72% Very important 72% 23 83% 10 70% 31 70% 7 69% 20
127
32
12
44
10
29
Access
1% Not important at all 0% 0 0% 0 2% 1 0% 0 0% 0
0% Not important 0% 0 0% 0 0% 0 0% 0 0% 0
2% Neither important or Unimportant 0% 0 0% 0 2% 1 0% 0 3% 1
8% Somewhat important 3% 1 0% 0 11% 5 10% 1 10% 3
90% Very important 97% 29 100% 10 85% 40 90% 9 87% 26
127
30
10
47
10
30
Effective, Quality Care
2% Not important at all 0% 0 0% 0 4% 2 0% 0 3% 1
0% Not important 0% 0 0% 0 0% 0 0% 0 0% 0
0% Neither important or Unimportant 0% 0 0% 0 0% 0 0% 0 0% 0
10% Somewhat important 17% 5 9% 1 2% 1 10% 1 14% 4
88% Very important 83% 25 91% 10 93% 42 90% 9 83% 24
125
30
11
45
10
29
AOD & Mental Health
1% Not important at all 0% 0 0% 0 0% 0 0% 0 3% 1
0% Not important 0% 0 0% 0 0% 0 0% 0 0% 0
1% Neither important or Unimportant 0% 0 0% 0 0% 0 0% 0 3% 1
12% Somewhat important 7% 2 0% 0 13% 6 10% 1 20% 6
87% Very important 93% 28 100% 10 87% 41 90% 9 73% 22
127
30
10
47
10
30
Tobacco use and related disease
1% Not important at all 0% 0 0% 0 2% 1 0% 0 0% 0
2% Not important 0% 0 0% 0 2% 1 0% 0 3% 1
4% Neither important or Unimportant 13% 4 0% 0 0% 0 0% 0 3% 1
19% Somewhat important 31% 10 0% 0 14% 6 10% 1 20% 6
75% Very important 56% 18 100% 9 81% 35 90% 9 73% 22
124
32
9
43
10
30

Plumas County Community Health Improvement Plan (CHIP) 2012
Page 18
Poverty & Households
1% Not important at all 0% 0 0% 0 2% 1 0% 0 0% 0
2% Not important 0% 0 0% 0 4% 2 10% 1 0% 0
5% Neither important or Unimportant 0% 0 0% 0 2% 1 0% 0 16% 5
20% Somewhat important 24% 8 0% 0 11% 5 50% 5 26% 8
73% Very important 76% 26 100% 9 81% 38 40% 4 58% 18
131
34
9
47
10
31
Quality of Care
0% Not important at all 0% 0 0% 0 0% 0 0% 0 0% 0
1% Not important 3% 1 0% 0 0% 0 0% 0 0% 0
3% Neither important or Unimportant 3% 1 0% 0 2% 1 0% 0 6% 2
13% Somewhat important 18% 6 0% 0 2% 1 30% 3 23% 7
83% Very important 76% 26 100% 12 96% 43 70% 7 71% 22
132
34
12
45
10
31
Healthy Lives
1% Not important at all 3% 1 0% 0 0% 0 0% 0 0% 0
0% Not important 0% 0 0% 0 0% 0 0% 0 0% 0
4% Neither important or Unimportant 6% 2 0% 0 2% 1 0% 0 6% 2
18% Somewhat important 18% 6 0% 0 16% 7 20% 2 26% 8
77% Very important 73% 24 100% 10 82% 36 80% 8 68% 21
128
33
10
44
10
31

Plumas County Community Health Improvement Plan (CHIP) 2012
Page 19
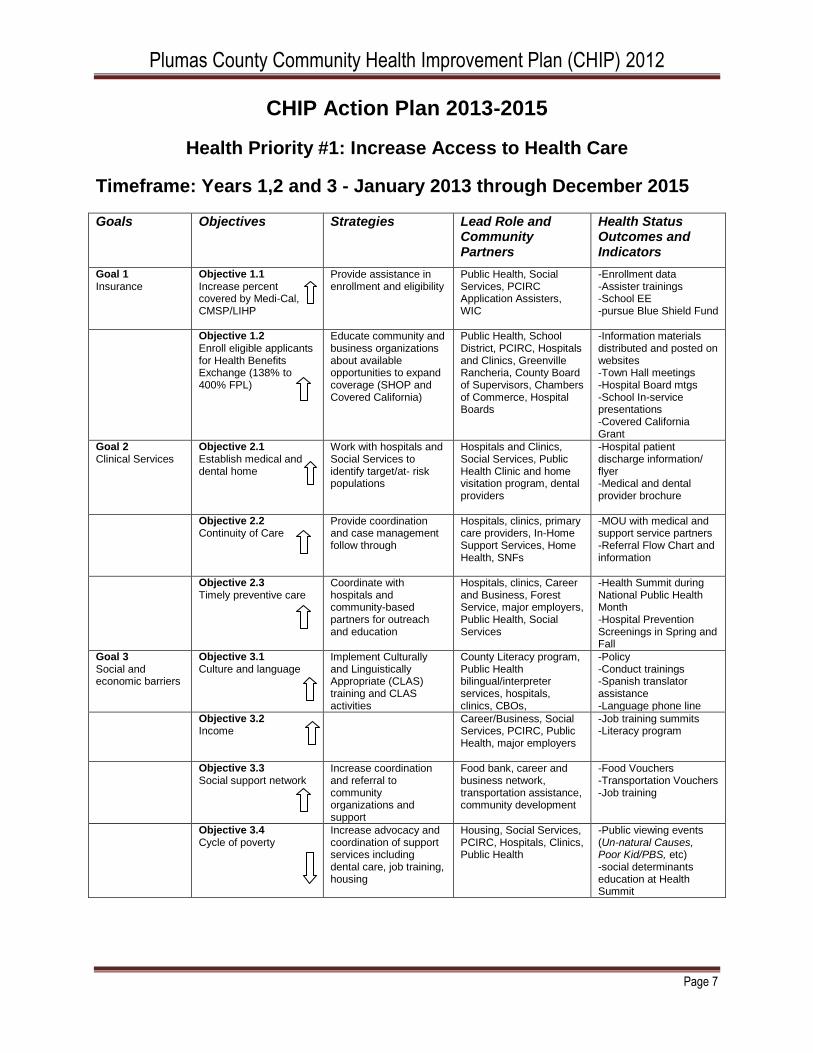
Appendix 2: Health Indicators
INDICATORS MEASURES DATA SOURCE
Be
ha
vio
rs a
nd
Ph
ys
ica
l a
nd
Me
nta
l C
on
dit
ion
He
alt
h B
eh
av
iors
Alc
oh
ol U
se
1. The percentage of adolescents who report ever using alcohol
Plumas: 7th Grade: 32% 9th Grade: 65% 11th Grade: 77%
California Healthy Kids Survey, California Department of Education, 2008
California: 7th Grade: 24% 9th Grade: 47% 11th Grade: 66%
2. The percentage of adolescents who report drinking alcohol in the past 30 days
Plumas: 7th Grade: 19% 9th Grade: 37% 11th Grade: 52%
California: 7th Grade: 15% 9th Grade: 24% 11th Grade: 42%
3. The percentage of adolescents who report ever being sick or "drunk" from drinking
Plumas: 7th Grade: 11% 9th Grade: 45% 11th Grade: 60%
4. Number of driving under the influence (DUI) arrests
Plumas: 243 DUIs for drugs or alcohol
Plumas County Sheriff's Department, 2010
Ora
l H
ea
lth
1. The proportion of young children aged 3-5 with untreated dental decay in primary and permanent teeth
Plumas: 27% of preschoolers
Plumas County Public Health Oral Health Sceenings
USA: 23.8% of children ages 3-5
National Health and Nutrition Exam. Survey (NHANES), CDC, NCHS, 1999-2004
Fit
nes
s
1. The percentage of students who were in the "Healthy Fitness Zone" for body composition during physical fitness testing
Plumas: 5th Grade: 64.8% 7th Grade: 62.3% 9th Grade: 58.0%
California Department of Education
California: 5th Grade: 52.1% 7th Grade: 55.5% 9th Grade: 59.4%

Plumas County Community Health Improvement Plan (CHIP) 2012
Page 20
INDICATORS MEASURES DATA SOURCE
Be
ha
vio
rs a
nd
Ph
ys
ica
l a
nd
Me
nta
l C
on
dit
ion
He
alt
h B
eh
av
iors
To
bac
co
Use
1. The percentage of adults who are current smokers
Plumas: 18.7% California: 13.2% The California County and
statewide archive of tobacco statistics, The California Tobacco Survey, 2008
2. The percentage of adults who are daily smokers
Plumas: 14.1% California: 9.2%
3. The percentage of adults who use smokeless tobacco
Plumas: 3.2% California: 1.7%
4. The percentage of adolescents who report ever smoking a cigarette in their lifetime
Plumas: 7th Grade: 10% 9th Grade: 31% 11th Grade: 44%
California Healthy Kids Survey, the California Department of Education, 2008
California: 7th Grade: 7% 9the Grade: 20% 11th Grade: 34%
5. The percentage of adolescents who report smoking a cigarette in the past 30 days
Plumas: 7th Grade: 5% 9th Grade: 15% 11th Grade: 21%
California: 7th Grade: 6% 9th Grade: 11% 11th Grade: 17%
6. The percentage of adolescents who report ever using chew or snuff
Plumas: 7th Grade: 7% 9th Grade: 22% 11th Grade: 41%
7. The percentage of adolescents who report using chew or snuff in the past 30 days
Plumas: 7th Grade: 4% 9th Grade: 12% 11th Grade: 16%
Plumas County Community Health Improvement Plan (CHIP) 2012
Page 21
INDICATORS MEASURES DATA SOURCE
Be
ha
vio
rs a
nd
Ph
ys
ica
l a
nd
Me
nta
l C
on
dit
ion
Cli
nic
al
Ca
re
Acc
ess
to
Care
1. The proportion of the population with health insurance
Plumas: 80.9% of people 18 years and older have health insurance
American Community Survey, US Census Bureau, 2008-2010 estimates
California: 85.5% of Californians 18-65 have health insurance
California Health Information Survey, UCLA, 2009
USA: 83.2% of people under 65 years old have health Insurance
National Health Information Survey, CDC, 2008
2.The proportion of children under 19 years old who have no health insurance
Plumas: 9.7% Small Area Health Insurance Estimates, US Census Bureau, 2009 California: 10%
USA: 9.7% of people under 18 years old have no health insurance
US Census Bureau, 2009
3. The proportion of Emergency Room visits which are self-pay
Plumas: 7.9% paid out-of-pocket in 2010
OSHPD 2010
4. Number of Primary Care Providers per 100,000 population
Plumas: 84 (approx. 37 total PCPs)
HRSA Area resource file, 2008
California: 116 HRSA Area resource file, 2009
5. The rate of Emergency Room visits due to non-fatal, unintentional injuries per 100,000 population
Plumas: 10,481 (2,279 total incidents)
The California Department of Public Health, California Injury Data Online, 2009
California: 5,143
USA: 9,219.3 in 2008 (age adjusted to the year 2000 standard population)

Plumas County Community Health Improvement Plan (CHIP) 2012
Page 22
INDICATORS MEASURES DATA SOURCE
Be
ha
vio
rs a
nd
Ph
ys
ica
l a
nd
Me
nta
l C
on
dit
ion
Me
nta
l C
on
dit
ion
Me
nta
l H
ea
lth
1. Rate of suicides per 100,000 population
Plumas: 18.4 between 2005-2007
National Vital Statistics System (NVSS), CDC, NCHS, 2007, The California Department of Public Health, 2007-2009
California: 9.4 in 2007
USA: 11.3 in 2007
2. The percentage of adolescents who in the past 12 months felt so sad or hopeless every day for two weeks or more that they stopped doing some usual activities
Plumas: 7th Grade: 32% 9th Grade: 30% 11th Grade: 26%
California Healthy Kids Survey, the California Department of Education, 2008
California: 7th Grade: 29% 9th Grade: 32% 11th Grade: 33%
3. The rate of non-fatal Emergency Room visits due to self-inflicted injury per 100,000 population
Plumas: 128.8 for non-fatal intentional self-harm
The California Department of Public Health, 2009
California: 72.0 for non-fatal intentional self harm
USA: 125.3 for nonfatal intentional self-harm injuries per 100,000 in 2008 in the US (age adjusted to the year 2000 standard population)
National Electronic Injury Surveillance System—All Injury Program (NEISS-AIP), CDC, NCIPC, US Consumer Product Safety Commission (CPSC)
Su
bsta
nc
e A
bu
se
1. The rate of non-fatal Emergency Room visits due to alcohol or other drugs per 100,000 population
Plumas: 620.9 ER visits per 100,000 (135 total events) California Department of
Public Health, Safe and Active Communities Branch with assistance from California Department of Alcohol and Drug Programs, Office of Applied Research and Analysis, 2009 and 2010
California: 335.9 ER visits per 100,000
2. The rate of non-fatal hospitalizations due to alcohol or other drugs per 100,000 population
Plumas: 193.2 hospitalizations per 100,000 (42 total events)
California: 145.8 hospitalizations per 100,000

Plumas County Community Health Improvement Plan (CHIP) 2012
Page 23
INDICATORS MEASURES DATA SOURCE
So
cia
l, E
co
no
mic
, a
nd
En
vir
on
me
nta
l F
ac
tors
So
cia
l a
nd
Ec
on
om
ic F
ac
tors
Ed
uca
tio
n
1. Educational attainment of persons 25 years and older
Plumas: 90.7% have at least a high school diploma, and 20.5% have a bachelor's degree or higher
The California Department of Finance (Originally American Community Survey, US census bureau, estimates, 2008 - 2010)
California: 80.6% have at least a high school diploma, and 30% have a bachelor's degree or higher
USA: 84.6% have at least a high school diploma and 27.9% have a bachelor's degree or higher
The US Census Bureau, 2012
2. High school graduation rate (the percentage of ninth graders who graduate in four years)
Plumas: 90.4% The American Community Survey, 2009 and 2010 California: 80.5%
Em
plo
ym
en
t
1. Unemployment rate Plumas: 16.4% The State of California Employment Development Department, EDD, 2010 California: 12%
USA: 9.6% U.S. Bureau of Labor and Statistics BLS, 2012
Po
ve
rty
1. The percentage of all people living below the federal poverty level
Plumas: 13.9% The California Department of Finance (Originally American Community Survey, US Census Bureau, estimates, 2008 -2010) California: 14.5%
USA: 15.1% The US Census Bureau, 2010
2. The percentage of families living below the federal poverty level
Plumas: 9.4% The California Department of Fiance (Originally American Community Survey, US census bureau, estimates, 2008- 2010)
State: 10.8%
USA: 13.2% The US Census Bureau, 2010
3. The percentage of Individuals 18 years of age or younger living below the federal poverty level
Plumas: 24.3% The California Department of Fiance (Originally American Community Survey, US census bureau, estimates, 2008- 2010) California: 20.3%
USA: 22% The US Census Bureau, 2012
Inc
om
e
1. The annual median household income
Plumas: $41,520 The California Department of Finance, 2010 California: $54,459
USA: $49,445 The US Census Bureau 2010
2. The annual median family income
Plumas: $47,019 The California Department of Finance, 2010 The US Census Bureau 2010 California: $67,874
USA: $60,395 The US Census Bureau 2010
1 P
are
nt
Ho
use
ho
lds
1. The percentage of single parent households with children under 18 years old
Plumas: 35.7% The California Department of Finance (Originally from the American Community Survey 3 year estimates 2008-2010)
California: 29.1%

Plumas County Community Health Improvement Plan (CHIP) 2012
Page 24
INDICATORS MEASURES DATA SOURCE
So
cia
l, E
co
no
mic
, a
nd
En
vir
on
me
nta
l F
ac
tors
En
vir
on
me
nta
l F
ac
tors
Air
Qu
ali
ty
1. The number of days during the year which the air quality was unhealthy for sensitive groups, generally unhealthy or very unhealhty (Air Quality Index or AQI >100)
Plumas: 9 days exceeded the AQI of 100 in in 2008 (4 days unhealthy for sensitive groups and 5 days unhealthy for the general public)
Air Quality System (formerly the Aerometric Information Retrieval System), EPA, 2008 http://www.epa.gov/airdata/
USA: 11 days in 2008
2. Air pollution particulate matter days
Plumas: 2 unhealthy air quality days due to particulate matter annually
County Health Rankings (originally the US EPA )
California: 16 unhealthy air quality days due to particulate matter annually
3. Air pollution ozone days Plumas: 0 unhealthy air quality days due to ozone annually
County Health Rankings (originally the US EPA )
California: 51 unhealthy air quality days due to ozone annually
Bu
ilt
En
vir
on
me
nt
1. The percentage of housing units which are vacant
Plumas: 43% The California Department of Fiance (Originally American Community Survey, US census bureau, estimates, 2008 - 2010 )
California: 8%
USA: 12.8% US Census Bureau, 2012
2. Housing ownership rate of occupied housing units
Plumas: 65.6%
US Census Bureau 2006 - 2011
California: 57.4%
USA: 66.6%

Plumas County Community Health Improvement Plan (CHIP) 2012
Page 25
INDICATORS MEASURES DATA SOURCE
He
alt
h O
utc
om
es
Mo
rbid
ity
Can
ce
r
1. Age adjusted rate of all cancers per 100,000 population
Plumas: 428.8 persons per 100,000
California Health Collaborative 2005-2009
California: 474.7 persons per 100,000
2. Age adjusted rate of lung cancer per 100,000 population
Plumas: 62.9 persons per 100,000
California: 52.5 persons per 100,000
3. Age adjusted rate of other respiratory cancers per 100,000 population
Plumas: 66 persons per 100,000
California: 56.2 persons per 100,000
Asth
ma
1. The age adjusted rate per 100,000 population of hospitalizations due to asthma
Plumas: 6.94 hospitalizations per 100,000 in 2009 (17 total events)
The California Department of Public Health Environmental Health Tracking Program, 2009 and 2010
California: 9.42 hospitalizations per 100,000 in 2009
USA: 11.1 hospitalizations of persons 5-64 years old per 100,000 in 2007
The National Hospital Ambulatory Medical Care Survey, NHAMCS, CDC, NCHS
2. The age adjusted rate per 100,000 population of Emergency Room visits due to asthma
Plumas: 56.61 ER visits per 100,000 in 2009 (110 total events)
The California Department of Public Health Environmental Health Tracking Program, 2010
California: 47.99 ER visits per 100,000 in 2009
USA: 57 ER visits of persons 5-64 years old per 100,000 population in 2007
The National Hospital Ambulatory Medical Care Survey, NHAMCS, CDC, NCHS
Plumas County Community Health Improvement Plan (CHIP) 2012
Page 26
INDICATORS MEASURES DATA SOURCE
He
alt
h O
utc
om
es
Mo
rbid
ity
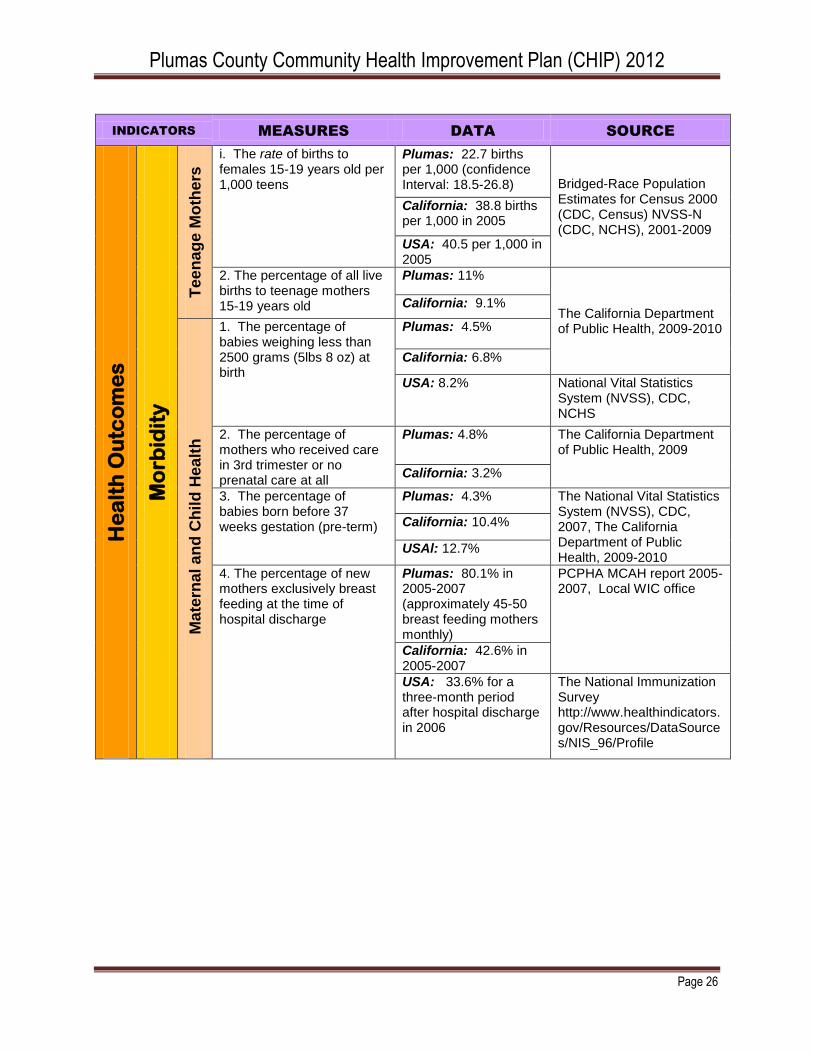
Tee
nag
e M
oth
ers
i. The rate of births to females 15-19 years old per 1,000 teens
Plumas: 22.7 births per 1,000 (confidence Interval: 18.5-26.8) Bridged-Race Population
Estimates for Census 2000 (CDC, Census) NVSS-N (CDC, NCHS), 2001-2009
California: 38.8 births per 1,000 in 2005
USA: 40.5 per 1,000 in 2005
2. The percentage of all live births to teenage mothers 15-19 years old
Plumas: 11%
The California Department of Public Health, 2009-2010
California: 9.1%
Ma
tern
al a
nd
Ch
ild
He
alt
h
1. The percentage of babies weighing less than 2500 grams (5lbs 8 oz) at birth
Plumas: 4.5%
California: 6.8%
USA: 8.2% National Vital Statistics System (NVSS), CDC, NCHS
2. The percentage of mothers who received care in 3rd trimester or no prenatal care at all
Plumas: 4.8% The California Department of Public Health, 2009
California: 3.2%
3. The percentage of babies born before 37 weeks gestation (pre-term)
Plumas: 4.3% The National Vital Statistics System (NVSS), CDC, 2007, The California Department of Public Health, 2009-2010
California: 10.4%
USAl: 12.7%
4. The percentage of new mothers exclusively breast feeding at the time of hospital discharge
Plumas: 80.1% in 2005-2007 (approximately 45-50 breast feeding mothers monthly)
PCPHA MCAH report 2005-2007, Local WIC office
California: 42.6% in 2005-2007
USA: 33.6% for a three-month period after hospital discharge in 2006
The National Immunization Survey http://www.healthindicators.gov/Resources/DataSources/NIS_96/Profile

Plumas County Community Health Improvement Plan (CHIP) 2012
Page 27
INDICATORS MEASURES DATA SOURCE
He
alt
h O
utc
om
es
Mo
rta
lity
Cau
se
s o
f D
ea
th
1. The rate of deaths due to cancer per 100,000 population (age - adjusted rate)
Plumas: 131.14 per 100,000 in Plumas, Lassen and Modoc counties in 2007 (48 total deaths due to cancer in 2009; deaths due to cancer were the number one cause of death in 2009)
The California Cancer Registry, 2007
California: 164 per 100,000 in 2007
National Vital Statistics System (NVSS), CDC, NCHS USA: 178.4 per
100,000 in 2007
2. The rate of deaths due to digestive system cancers per 100,000 population (age-adjusted rate)
Plumas: 43.69 in 2009 (39.67 for the period 2005-2009)
The California Cancer Registry 2009, 2005-2010
California: 42.02 in 2009 (42.66 for the period 2005-2009)
3. The rate of deaths due to respiratory cancers per 100,000 population
Plumas: 30.94, in 2009 (42.69 for the period 2005-2009)
California: 38.98 in 2009 (40.95 for the period 2005-2009)
4. The rate of deaths due to lung cancers per 100,000 population
Plumas:30.94 in 2009 (42.25 for the period 2005-2009; 53.9 in 2007)
California: 37.81 in 2009 (39.76 for the period 2005-2009; 39.4 in 2007)
USA: 50.6 in 2007 (age-adjusted to the 2000 population)
National Vital Statistics System (NVSS), CDC, NCHS
5. Rate of deaths due to coronary heart disease per 100,000 population
Plumas: 73.6
National Vital Statistics Surveillance - Mortality NVSS-M (CDC, NCHS), 2007-2009
California: 136.2
USA: 135.5

Plumas County Community Health Improvement Plan (CHIP) 2012
Page 28
6. The rate of deaths due to motor vehichle crashes per 100,000 population
Plumas: 19.9 (12.6 - 27.1 Confidence Interval)
Bridged-Race Population Estimates for Census 2000 (CDC, Census) , NVSS-M (CDC, NCHS) 2001-2009
California: 12.2 (12-12.3 Confidence Interval)
USA: 15.3 (15.2-15.3 Confidence Interval)
7. The rate of deaths due to unintentional injury per 100,000 population
Plumas: 41.1 in 2009 (9 total events)
The California Department of Public Health, California Injury Data Online, 2009-2010
California: 26.8 in 2009
USA: 40.0 in 2007 (age-adjusted to the year 2000 population)
National Vital Statistics System–Mortality (NVSS–M), CDC, NCHS

Plumas County Community Health Improvement Plan (CHIP) 2012
Page 29
Appendix 3: Community Health Partnership Description
July 2009 Project Outline Closing the Gap: Building a Multi-sector Community Partnership to Improve Health Outcomes Building a partnership of key private and public community partners is a vital step in successfully addressing barriers to community wide health and wellness. A formal collaboration designed to address the specific issue of prevention, wellness, access to health care would enable sustainable system wide changes across major community institutions. These changes would improve access to preventive and primary health services by 1) increasing enrollment, utilization and retention in public health insurance programs (Coverage Initiative), 2) provide diverse community momentum and resources to obtain affordable private health insurance for the uninsured, and 3) build capacity to sustain community wide prevention efforts, the Coverage Initiative, and increased timely utilization of health care services.
Issue: Rural areas experience unique set of challenges in eliminating health disparities, with one of the key barriers being access to health care coverage. Poor health outcomes are directly related to numbers of uninsured, underinsured and those disenrolled in eligible programs as well as significant impacts to health care providers in uncompensated care, bad debt and charity care. A successful response to these challenges requires a collaborative approach that engages multiple sectors of the community that, collectively, have the power to affect change across the spectrum of the local health care system. Local planning for increasing access to preventive and primary health care must be brought into sync across the organizations that impact the local health care system so that the solutions for implementation will be supported, institutionalized and sustained by all partners.
Assessment Findings: The Sierra Institute for Community and Environment partnered with the Plumas County Public Health Agency to conduct an assessment of the Plumas healthcare system and how it manages the needs of the uninsured and underserved. Key findings from this assessment that will be addressed by this project are:
1. A significant percentage of patients are underinsured or uninsured. 2. There are multiple and complex reasons why people eligible for Medi-Cal, Healthy
Families, and CMSP are not enrolled. 3. Under-enrollment and underutilization of patients eligible for state and county health care
coverage can be a major factor in district solvency and financial stability. 4. Enrolling more people and keeping them enrolled in public programs will reduce bad
debt by shifting payment responsibility from individuals and providers to state and federal agencies.
5. The uninsured face a different set of medical options - typically receive inadequate preventative care; they lack a medical home

Plumas County Community Health Improvement Plan (CHIP) 2012
Page 30
Building Community Partnerships: A collaborative effort engaging key partners across community sectors (health and human service agencies, non-profits, schools, health care providers and practitioners, large employers, small businesses, community members) will produce partnerships that reflect the needs and available resources of the health care system as well as the values, concerns and interests of the community. Both are essential for an effective response to access to health care. Strategies should focus on three key issues:
1. Engage and convene partners to identify the factors that drive their decisions in policy and protocol within their own “system” that affect access to preventative care and a medical home.
2. Provide diverse community momentum and resources to obtain health care coverage 3. Build community wide organizational capacity to sustain high levels of access to
timely and local health care services.
The process: To be successful, partnerships must lead to visible action by those in a position to make critical decisions. The following steps constitute the main components of the process from inception to action:
1. Establish formal collaborations with organizations that have the capacity to affect the community’s health and wellness. Convene an ongoing conversation among citizens, hospitals, practitioners, and other community institutions about the nature of the community’s response to the issue of access to health and come to specific recommendations for actions that will be effective and the partners will embrace.
2. Increase the knowledge, expertise and capability of the collaborative through training, network building and education geared towards availability of health care coverage for diverse populations and needs and enrollment, utilization and retention.
3. Project staff and coalition partners should identify a core team with representation from each sector, to arrive at a set of strategies to increase health care coverage availability, enrollment, utilization and retention that will effectively meet the needs of the community members.
4. Pilot, Assess, Implement, Evaluate Resources in Place:
MAA Program partners – PUSD, PCIRC, PRS, Round House Council. These organizations can coordinate Outreach Enrollment Retention and Utilization in health programs as MAA reimbursable activities
Family Resource Center County Funding – County General Fund dollars have been granted again to family resource centers to support health and wellbeing. This originated as the PCN project and supported Community Health Outreach Workers.
Public Health Agency – has resources in terms of staff, training, and technical assistance
Sierra Institute – has resources of staff, training, TA.

Plumas County Community Health Improvement Plan (CHIP) 2012
Page 31
Appendix 4: Definitions and Terminology
Federal and state requirements Federal law and laws in many states require tax-exempt hospitals to conduct periodic community health needs assessments and adopt plans to meet assessed needs. In order to comply with federal tax-exemption requirements in the Affordable Care Act, a tax-exempt hospital facility must:
conduct a community health needs assessment every three years. The assessment must
o take into account input from persons who represent the broad interests of the community served by the hospital facility, including those with special knowledge of or expertise in public health.
o be made widely available to the public.
adopt an implementation strategy to meet the community health needs identified through the assessment.
report how it is addressing the needs identified in the community health needs assessment and a description of needs that are not being addressed with the reasons why such needs are not being addressed.
In addition to these new federal requirements, many states require tax-exempt hospitals to conduct community needs assessments and develop community benefit plans, in varying degrees of specifications. Check the Advocacy and Public Policy section of CHA ’s community benefit website (www.chausa.org/communitybenefit) for the status of federal regulations and instructions and a description of state requirements.
What is a Community Health Needs Assessment and an Implementation Strategy? A community health needs assessment is a systematic process involving the community, to identify and analyze community health needs and assets in order to prioritize these needs, and to plan and act upon unmet community health needs. An implementation strategy is the hospital’s plan for addressing community health needs, including health needs identified in the community health needs assessment. The implementation strategy is also known as the hospital’s overall community benefit plan.
Mobilizing for Action through Planning & Partnership (MAPP) MAPP is a community-wide strategic planning process for improving community health and strengthening the local public health system. By engaging in MAPP, hospitals build new partnerships and benefit from the community’s strengthened public health infrastructure and improved ability to anticipate and manage change. United with a common framework and shared values, non profit hospitals, local health departments, and local public health system partners can collectively move communities closer to the ultimate goal of improving the public’s health (wwww.naccho.org/topics/infrastructure/mapp/index.cfm). Source: National Association of County and City Health Officials FACT SHEET

Plumas County Community Health Improvement Plan (CHIP) 2012
Page 32
Evidence-based Program An evidence-based program has been:
Implemented within a specific population.
Critically appraised for its validity and relevance.
Found to be effective. Zul Surani, USC Norris Comprehensive Cancer Center From: http://healthequity.ucla.edu/docs/identifying_accessing_data_sources.pdf The Guide to Community Preventive Services
Objectives According to the Centers for Disease Control and Prevention, objectives should be SMART:
Specific
Measurable
Achievable
Realistic
Time specific
Social Determinants of Health The social determinants of health are the circumstances in which people are born, grow up, live, work, and age, as well as the systems put in place to deal with illness. These circumstances are in turn shaped by a wider set of forces: economics, social policies, and politics. World Health Organization

Plumas County Community Health Improvement Plan (CHIP) 2012
Page 33
Appendix 5: Letters of Support (partial list)

Plumas County Community Health Improvement Plan (CHIP) 2012
Page 34

Plumas County Community Health Improvement Plan (CHIP) 2012
Page 35