Plugging In: A Feasibility Study on Public Plug-In Vehicle
41
Plugging In: A Feasibility Study on Public Plug-In Vehicle Charging Infrastructure Investment James W. May Dr. Lincoln Pratson, Advisor December, 2009 Masters Project submitted in partial fulfillment of the requirements for the Master of Environmental Management degree in the Nicholas School of the Environment of Duke University 2009
Transcript of Plugging In: A Feasibility Study on Public Plug-In Vehicle

Plugging In: A Feasibility Study on Public Plug-In Vehicle Charging Infrastructure Investment
James W. May
Dr. Lincoln Pratson, Advisor
December, 2009
Masters Project submitted in partial fulfillment of the requirements for the Master of Environmental Management degree in the Nicholas School of the Environment
of Duke University
2009

2
Abstract Radical changes to our transportation sector could have positive impacts on our economy,
security, health, and natural environment. Of the available options to address fossil fuel
dependency in the transportation sector, vehicle electrification stands as an exciting option with a
number of appealing benefits. Plug-in vehicles can reduce operating costs, air pollutants and
greenhouse gas emissions, as well as dependence on fossil fuels, but their successful penetration
will depend greatly on the thorough build-out of both residential and public charging
infrastructure.
Much has been made in the media and academic literature about the environmental benefits of
vehicle electrification. Rather than focus on these “green” issues again, this project uses a
spreadsheet-based investment model to examine the possibilities of the profitable deployment of
public plug-in vehicle charging infrastructure by doing two things:
1. Determining ways that potential buyers can make profitable investment decisions based
on their specific needs, and
2. Evaluating the market penetration of plug-in hybrid electric vehicles (PHEVs) that would
be required for that investment to be profitable.
Our results indicate that public electric infrastructure build-out can be profitable for any
stakeholder, depending on the assumptions made. Focusing in on retailer stakeholders, I reveal
that profitability will be quite sensitive to retailer size. Larger retailers will likely be able to
invest profitably in limited infrastructure right away, but retailers with smaller parking lots will
want to wait for deeper plug-in penetration, or rely on sources of revenue from their installed
infrastructure other than direct user fees.
3
Table of Contents List of Terms and Definitions ......................................................................................................... 4 Introduction: A Different Look at Charging Station Investment .................................................... 5 Background/Literature Review ....................................................................................................... 8
Approaches to Reducing the Carbon Intensity of the Transportation Sector .............................. 8 Reduced Vehicle Miles Traveled (VMT)................................................................................ 8 Vehicle Efficiency ................................................................................................................... 9 Technology Substitution ......................................................................................................... 9
The Case for Public Infrastructure Investment: Aid in Our Transition to Plug-in Vehicles ..... 10 Building an Investment Modeling Tool to Generate Real Cash Flow Scenarios...................... 11 This Report Offers a Path Forward for Stakeholders to Invest in Charging Stations ............... 11
Summary of Costs and Benefits of Charging Stations .................................................................. 13 Charging Station Build-out Costs ............................................................................................. 13 Benefits of Building Charging Stations .................................................................................... 15
Methodology ................................................................................................................................. 20 Part I: Analyzing Scenarios Using the Investment Tool ........................................................... 20
Investment Tool Output from Representative Stakeholder: Retailers Business Case .......... 20 Part II: EV Penetration Scenarios.............................................................................................. 22
Setting Up the Penetration Scenarios for the Retailer Stakeholder ....................................... 23 Results ........................................................................................................................................... 26
Part I: All Stakeholders Can Be Profitable ............................................................................... 26 Sensitivity of User-Defined Benefits .................................................................................... 26 Analysis of Other Stakeholders ............................................................................................. 27
Part II: Profitability Not Likely For All Stakeholders Yet ........................................................ 29 Potential Profitability is Extremely Sensitive to Retailer Size .............................................. 31
Concluding Thoughts .................................................................................................................... 33 Appendix: Assumptions for Investment Tool Runs ...................................................................... 34 Acknowledgements ....................................................................................................................... 36 Bibliography .................................................................................................................................. 37
Sources ...................................................................................................................................... 37 Interviews .................................................................................................................................. 39 Presentations.............................................................................................................................. 40

4
List of Terms and Definitions
Alternative Fuel Vehicle (AFV): Alternative fuel vehicles may run on compressed natural gas (CNG), liquified natural gas (LNG), liquified petroleum gas (LPG), methanol, ethanol, or electricity. Vehicles running on other fuels that meet or exceed federal clean air standards may also be classified as AFVs.
Charging Station: Charging stations are any installed physical infrastructure that can charge electric vehicles. They may or may not include communications capabilities, and can be Level I at 120v, or Level II at 240v. Level III chargers require more extensive infrastructure, and carry additional impact implications for the electric power grid.
Electric Vehicle (EV): An electric vehicle is one that can only operate on battery-stored power; there is no internal combustion engine drive or hybrid mode possible (e.g., Tesla Roadster).
Hybrid-Electric Vehicle (HEV): A hybrid-electric vehicle is a conventional “hybrid” vehicle with no plug-in capability (e.g.,: Toyota Prius).
Internal Combustion Engine (ICE): Internal combustion engines are conventionally powered by gasoline or diesel fuel, but can also run on biofuels such as corn-based ethanol or biodiesel.
Leadership in Energy and Environmental Design Certification (LEED): LEED is a green building rating system developed by the U.S. Green Building Council to provide a suite of standards for environmentally sustainable construction and operation.
Light-Duty Vehicle (LDV): United States legislation defines LDVs as all vehicles of less than 8,500 lbs. gross vehicle weight. LDVs are sub-divided into passenger cars, light light-duty trucks, and heavy light-duty trucks.
Neighborhood Electric Vehicle (NEV): This U.S. Department of Transportation classification refers to speed-limited (or “low-speed”) and street-legal battery electric vehicles. These vehicles must have a gross weight of less than 3,000 lbs and a top speed of no greater than 25 miles per hour. Due to their low speeds, they are not subject to crash-test requirements.
Plug-in Hybrid Electric Vehicle (PHEV): A vehicle whose wheels are driven by either an electric motor with ICE (or fuel cell) backup to charge the battery (series design) or by either an electric motor or an ICE directly (parallel design) (e.g., Chevy Volt).
Plug-in vehicle (PEV): Any vehicle that uses an electrical charge as fuel, including PHEVs and EVs.
Stakeholder: Any party potentially interested in investing in electric-vehicle charging infrastructure.
Vehicle-Miles Traveled (VMT): A commonly used indication of how much motorists are using their cars. VMT is typically presented as the average number of miles traveled per registered vehicle.

5
Introduction: A Different Look at Charging Station Investment It has long been recognized that major changes to the transportation sector could have positive
impacts on our economy, security, health, and natural environment. Of the four major sectors of
energy usage in the United States: transportation, industry, residential/commercial, and electric
power, dependence on fossil fuels is the greatest for transportation. Indeed, as of 2006, 98% of
our transportation energy comes from crude oil and natural gas.1 Of the available options to
address fossil fuel dependency in the transportation sector, technology substitution in the form of
vehicle electrification stands as an exciting option with a number of appealing benefits.
The reality of vehicle electrification has gained significant momentum as of late, thanks to its
economic feasibility and implementation-ready status, and it even seems to be pulling away from
other low-carbon transportation technologies, such as hydrogen fuel cells.2 Electric vehicles can
be new or converted conventional hybrid vehicles, and they run wholly or partially on electricity.
They reduce operating costs, air pollutants and greenhouse gas emissions, and dependence on
fossil fuels. In the future, these vehicles can help enable renewable energy generation and
actually become cleaner as they age.3
Early models are already hitting roads in the U.S., including both factory-made and converted
vehicles. Tens of thousands of factory-made plug-ins are expected to be available in the U.S. in
the next few years. The success of plug-ins has been bolstered by timely investments of
governments worldwide, which serves to spur technological research and progress even more.
1 EIA Annual Energy Review, 2007. 2 Biello, 2009. 3 “Federal Energy and Fleet Management,” 2009.

6
But even with all of this progress, the successful penetration of plug-in vehicles will depend
greatly on the thorough build-out of both residential and public charging infrastructure.4
Much has been made in the media and academic literature about the environmental benefits of
vehicle electrification. This project is designed to examine the possibilities of the profitable
deployment of public plug-in vehicle charging infrastructure by doing two things:
1. Determining ways that potential buyers can make profitable investment decisions based
on their specific needs, and
2. Evaluating the market penetration of plug-in hybrid electric vehicles (PHEVs) that would
be required for that investment to be profitable.
This paper explores these possibilities using a spreadsheet-based model with a simple user-
interface that takes key cost elements as well as potential revenue streams into consideration and
presents relevant financial outputs to stakeholders. Users of this investment tool can enter unique
stakeholder information; the tool will then map likely future cash flows. The results generated by
this investment tool are the subject of the discussion and analysis in this paper.
Some investors are comfortable buying charging infrastructure simply because it is the “green”
thing to do (for marketing benefits), or even just because infrastructure is required to support the
penetration of plug-in vehicles. But for those stakeholders who need to understand the bottom
line on infrastructure build-out, this report puts forward a business analysis and pathway to
profitability for plug-in vehicle charging station investment. The day where carbon dioxide
legislation allows clean-technologies to compete with fossil fuels may indeed be coming; but for
4 “Federal Energy and Fleet Management,” 2009.

7
the time being, investment opportunities in plug-in vehicles and infrastructure must be evaluated
based on current policy and business conditions.
The results of the first section reveal that public electric infrastructure build-out can be profitable
for any stakeholder, depending on assumptions made. When I explore the retailer stakeholder in
more depth, a few factors stand out as particularly critical to successful investment. It will
benefit stakeholders to investigate thoroughly hardware installation costs, as these vary greatly
depending on the chosen installation site. Hardware choice is also critical, especially if the
investor expects charging fee revenue to help offset high capital costs. Federal, state, and local
incentives can help reduce the burden of high initial capital costs, and incentives may also serve
to lower operating costs as well, such as providing discounted electricity rates.
The second section reveals that profitability is quite sensitive to retailer size. Specifically,
infrastructure investors with small public parking lots may have to wait for deeper PHEV
penetration in order to be profitable in their build-out. However, some large retailers could
profitably build charging infrastructure early on, and likely be able to build several profitable
charging stations before PHEV fleet penetration even reaches 1%.
The success of plug-in vehicles will depend on many interdependent factors, such as the strength
of the economy, the price of gas, the continuation of federal and state subsidies, and the
existence of public and residential charging infrastructure. Preparing for plug-in vehicles now
carries a degree of risk; the cars may never come, or they may eventually lose out to competing
technologies, such as hydrogen fuel cells or widespread use of biofuels. Building charging
infrastructure now cannot guarantee the success of plug-ins. But it is my hope that information
and preparation will both increase the chances of successful plug-in vehicle penetration, as well
as the profitability of electric charging infrastructure as a business opportunity.

8
Background/Literature Review
Approaches to Reducing the Carbon Intensity of the Transportation Sector
There are three distinct strategies for reducing CO2 emissions in our transportation sector. These
strategies have formed the bedrock of the Rocky Mountain Institute’s three-decade long
approach towards reducing the carbon footprint of transportation, and are worth briefly
examining as a general approach to this problem.5
Reduced Vehicle Miles Traveled (VMT)
A world in which no technological changes are made to our vehicles whatsoever can still be a
cleaner world, if we just drive less. In order to convey a shifting focus on our “need” for energy,
scientist and clean energy advocate Amory Lovins thirty years ago coined the now commonly-
understood ideology of “soft energy paths,”6 where rather than focusing on finding ways to
secure more sources of energy for our lifestyles, Lovins suggested that we should instead
recognize that energy is not an end in itself, but rather a means to an end. For example, rather
than needing a car and gasoline, what we really need is transportation. Going even one level
deeper, rather than needing transportation, what we really need are the benefits that convenient
transportation provide for us, like accessing supplies, recreating, or being able to live miles away
from our jobs, friends, and family. Thus, a large part of tackling the problem of CO2 emissions is
addressing the needs that require us to transport goods and people the way we do. Reducing
VMT is therefore a multi-dimensional problem that has complicated implications on public
policy, urban design, and American culture.
5 The Rocky Mountain Institute is an independent non-profit think tank that focuses on innovating and driving the efficient and restorative use of natural resources. http://www.rmi.org/ 6 Lovins, 1977.

9
Vehicle Efficiency
Another emissions reducing strategy focuses on lowering the carbon intensity of the miles that
we do drive, either reducing the fuel consumed per unit of transportation, or the carbon
emissions emitted per unit of fuel consumed. In the automotive industry today, the focus of
vehicle efficiency is improving the platform fitness of our vehicles, or the technologies that deal
with aerodynamics and light-
weighting. Reducing the
weight of our vehicles as well
as the amount of their surface
drag, increases their efficiency
by improving their fuel
economy (mpg). Over the past
30 years, automotive engineers
have been wildly successful in
improving the platform fitness of our LDV fleet. However, most of the technological progress, or
efficiency “dividend” has been used in making vehicles more powerful rather than more fuel
efficient, due to market demands and relatively cheap fuel costs.
Technology Substitution
The last strategy focuses on the complete replacement of the relevant technology in an
automobile. In the application of cars, technology substitution specifically refers to the
replacement of the internal combustion engine with an electric drive-train including electric
motor and battery storage system (can be PHEV or pure EV). Battery-electric drive-trains offer
the opportunity to eliminate or lower vehicle emissions by running on electricity produced from
renewable sources of energy.
Figure 1: Fuel efficiency and the performance of light-duty vehicles. Note the great improvements in vehicle acceleration have been made since 1980 while fuel economy improvements have been stagnant. (Graph is from Heavenrich, 2006.)

10
While reducing VMT and improving vehicle efficiency are essential strategies in reducing the
carbon intensity of our transportation sector, neither one, alone or combined with the other, is
capable of eliminating our dependency on fossil fuels. It is for this reason that technology
substitution must be an integral part of the process. Of course, it is important to point out that the
three above-mentioned strategies have synergistic effects when combined together. For example,
improving the efficiency (particularly platform fitness) of vehicles lowers the cost of technology
substitution (allows for smaller batteries), and technology substitution (drive-train electrification)
automatically improves the energy efficiency of vehicles (due to electric motors being more
energy efficient than ICEs).
The Case for Public Infrastructure Investment: Aid in Our Transition to Plug-in Vehicles
Basic research on driving habits indicates that most plug-in vehicle owners will do the bulk of
their electric charging at home, perhaps overnight.7 However, widespread public charging
infrastructure (including that in workplace or retail parking spaces) will help facilitate the
penetration of plug-in vehicles and help address consumer range anxiety.
Specifically, strategically well placed public infrastructure will:
1. Allow plug-in drivers to operate reduced range electric vehicles, which require smaller
battery packs increasing the efficiency and lowering the overall cost of vehicles (longer-
range plug-ins require heavier and more expensive batteries), 8
2. Increase the visibility of plug-ins, making them more appealing to a general public that is
concerned about finding a convenient place to charge once they commit to driving a plug-in
vehicle,
7 “Driving the Solution: The Plug-In Hybrid Electric Vehicle,” 2005. 8 Morrow, Karner & Francfort, 2008.

11
3. Support plug-in vehicle ownership for those who may not have a dedicated parking space or
private garage at home, and
4. Facilitate the adoption of other electric power transportation technologies available now,
including neighborhood electric vehicles (NEVs), bikes, motorcycles, and scooters.
Building an Investment Modeling Tool to Generate Real Cash Flow Scenarios
In order to evaluate how relevant stakeholders can make profitable investments in charging
station infrastructure and what PHEV penetration is required for that to happen, I created a user-
friendly investment tool into which investors can enter cost and benefit information, as well as
baseline data for each unique stakeholder; the tool then maps likely future cash flows. The results
generated by the investment tool drive the discussion and analysis in this paper. To a very real
degree, interested stakeholders can use the tool to explore the results of various investment
scenarios. For information on the assumptions behind of the investment tool, please see the
Appendix.
This Report Offers a Path Forward for Stakeholders to Invest in Charging Stations
I have worked with industry leaders to catalog the costs and benefits of installing charging
infrastructure in public places. This project outlines the business case for charging stations, and
evaluates strategic options for various stakeholders to use in pushing forward with infrastructure
investments. Key stakeholders include:
• Parking garages and office parks where plug-in drivers park at work,
• Retail facilities where plug-in drivers spend time shopping,
• Municipalities and local governments which have an interest in serving the plug-in
driving public, and,

12
• Electric utilities, which provide the needed power (and possibly charging stations) for
vehicle electrification.
This report is not a black-and-white checklist; different stakeholders need different approaches,
and different degrees of customer adoption of the technology. Rather, this document is a
feasibility study of what makes financial sense, and what needs to happen for investment in
charging stations to get off the ground. In the investment tool, as well as the main body of this
document, I estimate the costs and potential revenues for each actor based on various
assumptions (for more information on my assumptions, see the Appendix). Where I could not
make estimates, I used sensitivity analyses to explore what investments—in terms of size and
type—would break even or make a profit.

13
Summary of Costs and Benefits of Charging Stations Charging Station Build-out Costs
Hardware Equipment: Hardware options range from building a basic charging station with
weatherproof cable and an electric meter to purchasing a network of pre-built charging stations
that communicate with a central monitoring station that can remotely control charging services.
The former scenario would offer limited capabilities, but also the lowest cost—as little as $500
(including professional installation) per station, assuming that an appropriate electrical
connection exists. Investors could also spend up to $7,000 per charging station for models with
the capability to monitor electricity usage remotely (smart metering), capture customer
information, communicate information to a central monitoring station, and perhaps, most
importantly, have the ability to generate revenue for the hardware owner. The hardware selection
should be based on an investor’s specific situation, and investors should consider their
communications, billing, security, and other needs. Research suggests that contracting with a
third party and taking advantage of revenue raising will be more popular.
Hardware Installation and Maintenance: Charging station installation costs vary significantly
depending on whether or not an appropriate electric connection is available, among other things.9
Based on labor, construction, and permitting cost estimates from electricians, as well as estimates
from hardware providers and charging station installers, the investment tool calculates
installation costs according to the hardware chosen by the user. The cost of charging station
installation also varies significantly by location. In some locations installation can even cost as
much as or more than the original hardware. Interested investors need to consider seriously these
uncertain installation costs when exploring the economics of investing in charging stations.
9 Electrical information is from a series of phone interviews conducted with Boulder, CO area electricians in June 2009.

14
Electricity: Interested investors can install chargers with different levels of charge, which has
different implications on electricity costs. Level I chargers are assumed to deliver 120 volts at 15
amps, for a battery charge of 1.8 kW, while Level II chargers deliver a charge of 240 volts at 30
amps, for a battery charge of 7.2 kW.10 The 2009 national average electricity price is 11.2
Figure 2: A visual explanation of the third-party charging hardware and services model, including direct monetary costs and benefits. Motorists pay a charging (or subscription) fee to the service provider (or possibly the hardware owner directly), who passes on the majority of these fees to the hardware owner to help offset equipment, installation, maintenance, and electricity costs. Hardware and service providers profit from hardware sales and subscription fees. Utilities’ ability to profit from increased electricity sales depends on the degree to which their revenues and profits are decoupled.
cents/kWh. Some charging stations are likely to draw more electricity than others: plug-in
drivers in parking garages and at charging stations in multi-unit residential complexes will likely
charge for several uninterrupted hours, whereas drivers at, say, retail facilities may plug in for a
much shorter time. Thus, depending on hardware choices and somewhat unpredictable consumer
charging behavior, electricity costs for the hardware owners can vary considerably but, in
10 Level I and II charging parameters vary depending on the hardware manufacturer. Level III chargers are even stronger, but have more electric grid impacts, and are not likely to be necessary for most charging applications. Electricity costs are from EIA. www.eia.doe.gov/cneaf/electricity/epm/table5_3.html
Plug-in Driver
Utility
Hardware owner
3rd party hardware and service provider
Costs: Subscription/ charging fee Benefits: Range, convenience
Costs: Network, hardware, real estate Benefits: Subscription and hardware revenue
Costs: Hardware, installation, maintenance, electricity Benefits: Fee collection from drivers/service providers
Costs: Electricity production Benefits: Electricity sales, potential future grid services
Money flow
Subscription revenue
Hardware purchase

15
general, are less than hardware and installation costs. Please see Figure 2 for an explanation of
how transactions between third-party service providers, owners of charging infrastructure, and
plug-in driving consumers will be structured.
Benefits of Building Charging Stations
Some benefits of installing charging stations are transparent, or at least somewhat predictable,
such as user charging fees (for some charging station models), government incentives, and the
value of avoided carbon emissions. Other benefits are more difficult to conceptualize and
calculate. The investment tool allows the user to enter values for some or all of these less
tangible benefits so that the user can explore what these values would need to be in order for the
chosen hardware to break even, or become profitable. Benefits of charging stations include:
User Charging Fees: Hardware owners may choose to charge plug-in drivers a charging fee.
However, interviews with stakeholders reveal that some hardware investors are more interested
in offering charging services to plug-in drivers at no charge. Other hardware installers, through
the use of more technologically advanced charging stations with built-in revenue generating
functionality, would be able to draw a monthly income, the size of which would depend on how
frequently plug-in drivers use their equipment. The investment tool assumes that the “do-it-
yourself” charging hardware is not capable of revenue generation; however, the scenarios that
utilize third-party hardware can include revenue generation capabilities if the hardware design
accommodates it. Some stakeholders suggested billing customers for premium parking spots.
Customer Attraction & Retention: Several large retailers have commented that the primary
value of charging stations as they see them is the increased customer throughput that they could
provide. Specifically, retailers such as Wal-Mart and Best Buy have expressed interest in
forming relationships with customers that they are not currently reaching. While estimating how

16
many new customers charging stations would help attract is tricky, large retailers are well-
prepared to calculate the corresponding value added to their businesses once the number of new
customers has been established. Recent research suggests that 57 percent of consumers feel that
it is important to purchase products with environmental benefits, even in a tough economy, and
51 percent are willing to pay more for them. More than 25 percent of consumers strongly agree
that it is important to avoid purchases from companies that they disagree with.11
Employee Attraction & Retention: Office parking lot owners, and perhaps some retail
facilities, can benefit from installing charging stations due to the services that they offer to
current and potential employees. It is likely that plug-in owners would prefer to charge their
vehicles more than once per day, making the workplace an obvious choice for daytime charging.
Charging stations therefore offer real financial benefits to employers who can retain and perhaps
attract employees who drive plug-ins (or would like to drive plug-ins). Even for employees who
don’t drive plug-ins, research suggests that almost 50 percent of Americans feel that it is at least
“very important” that their employers are environmentally responsible.12
Corporate Branding Opportunities: My interviews indicate that stakeholders are not likely to
pursue branding opportunities directly; rather, charging station investors are conscious of
avoiding visible “greenwashing” efforts. Nonetheless, they are aware that their bottom line
benefits from the public observing their investments in “green” technologies. And rightly so –
charging station installation is something real that any retail facility with adjacent parking can
pursue that will hasten the penetration of plug-in vehicles. While several retailers commented
that good corporate public relations has benefits, those benefits are generally not specifically
included in any kind of calculus that is required to approve of charging station investment.
11 BBMG Conscious Consumer Report, 2009. 12 2009 BBMG Conscious Consumer Report.

17
Government Funding & Incentives13: A federal tax credit offers up to 50 percent of
infrastructure and installation costs, not to exceed $50,000, for charging station equipment that
goes into service after January 1, 2009. Furthermore, this credit is available by site, so that an
interested investor can elect to take advantage of multiple $50,000 credits. This credit, as written,
expires on December 31, 2010. In addition to generous federal incentives, state incentives may
apply, and several states have state-wide incentive programs that piggyback on federal
incentives. Other states have city, county, and regional incentives.
Fleet Cost Savings: Big-box retailers and other companies that own parking lots could be
interested in installing charging stations so they can charge their own plug-in fleets. This on-site
charging capability will help these firms reduce fuel costs, which will in turn help offset the
capital costs of acquiring plug-in vehicles. For a rough point of reference, estimates suggest that
the cost of driving a gasoline-powered car are $0.14/mile, while only $0.03/mile for an EV.14
Advertising & Customer Information Opportunities: Some third-party hardware can capture
and store customer information, while some can also offer electronic advertising opportunities
for the hardware owner. Both of these capabilities offer potential value to stakeholders,
particularly retailers, although how much value is difficult to quantify. Privacy concerns may
limit the ability of charging station operators to capture plug-in vehicle user information, but it
should still be a consideration.
Contributions to LEED Certification: According to LEED guidelines, charging station
installation counts for one credit, called the LEED-NC Sustainable Sites Credit 4.3 for
Alternative Transportation: Low Emission & Fuel-Efficient Vehicles. Research indicates that
13 While not really considered benefits of the stations themselves, state and federal incentives greatly increase the potential profitability of charging station investment, so they are included in the discussion about benefits. 14 Assuming a gas price of $2.50/gallon and electricity price of $0.09/kWh. DOE estimate: www1.eere.energy.gov/vehiclesandfuels/avta/light_duty/fsev/fsev_gas_elec2.html

18
facilities that invest in LEED certification profit from it.15 However, quantifying how much a
charging station contributes not only to LEED certification, but also to likely profit is, of course,
challenging.
Figure 3: The large size ranges of various expected costs and benefits of installing one charging station and operating it for ten years. See the Appendix for more details on these estimated values.
Value of Avoided Carbon Emissions: There is uncertainty about when the U.S. Congress will
adopt a carbon accounting system, and also how saved carbon will offer value—and to which
parties. Nonetheless, the investment tool calculates carbon saved (in tons) and allows charging
station hardware investors to include the revenue from the value of offset carbon emissions. Due
to the aforementioned uncertainties, the default carbon price in the model is zero, but users may
specify a price of their own. Interestingly, the future profitability of charging stations is not
particularly sensitive to the price of carbon. Please see the Appendix for technical information
concerning carbon accounting in the investment tool.
15 Kats, 2003.

19
Public Health Benefits: Reductions of tailpipe criteria air pollutants due to vehicle
electrification surely benefit everyone, regardless of who invests in charging infrastructure. But
in my analysis, only municipalities/government stakeholders are able to quantitatively benefit
from cleaner air, as the government is uniquely positioned to represent public interests and
consider cleaner air as a possible benefit of their own infrastructure investments.
Increased Energy Independence: Vehicle electrification will likely prompt a greater reliance
on domestic fuel sources (renewable or otherwise), and help to reduce oil imports, strengthen
investment in domestic energy resources and jobs, lower national defense spending, and perhaps
even mitigate national security risks. These benefits are, of course, difficult to quantify, and, in
the investment tool, only municipalities/government stakeholders can reap them.

20
Methodology
Part I: Analyzing Scenarios Using the Investment Tool
Our investment tool helps forecast future cash flows of various user-selected charging
infrastructure build-out scenarios. Model users can specify from pull-down menus or fill in
values for the following variables:
• Stakeholder status: retailers, parking garages, office parks, utilities, homeowners
associations, and municipalities.
• Build-out scenario: self build out or contract with third parties, such as Coulomb,
Shorepower, eTec (Minit-Charger), Avcon, and Brusa.
• Various measures affecting investment: annual hardware maintenance cost, hourly
charging fees, discount and inflation rates, federal and state incentives, price of offset
carbon, charging time per user, number of Level I and II units to be built, and expected
users per day per charging station.
• Value of expected benefits: customer attraction/retention, employee attraction/retention,
corporate branding, fleet cost savings, advertising opportunities, LEED certification
contributions, public health benefits, and increased energy independence.
While investment tool users can select their own inputs, this section of the report presents the
results of one relatively conservative series of investment choices. Following the presentation
and discussion of model outputs is a brief explanation for how these results can vary depending
on stakeholders’ choices.
Investment Tool Output from Representative Stakeholder: Retailers Business Case
Large retailers have much to gain from installing charging infrastructure. Of the benefits
mentioned above, my research and interviews with retailers indicated that in addition to potential

21
charging fee revenues, retailers are especially interested in expanding their relationships to
include more diverse customers. To the extent that vehicle chargers could increase a store’s
traffic, retailers might be willing to make infrastructure investments, and even strategically offer
free charging to plug-in users as a strategic loss-leader. Retailers are also likely to benefit from
the corporate branding opportunities of green investments and, perhaps, from cost savings due to
their ability to charge electric fleet vehicles, as well as the charging stations’ contribution
towards LEED certification for buildings. For the purpose of this demonstration, the only
revenue-positive factor considered is charging fee revenue. All other benefits are set to $0 but
can be included by users of the investment tool for sensitivity analysis.
Costs incurred by the retailers and entered into the investment tool include hardware purchase
and installation costs for both Level I and II chargers, annual maintenance costs for each
installed unit, and electricity costs for all installed units. The costs of all of the above increase
annually by an inflation rate, and are discounted to the present 2009 using a discount rate.
In scenario presented here, I assume that this particular retailer chooses to build one Level 1
station in 2009 and one in 2010, followed by one Level II charger in 2011, and two Level II
chargers in 2012. The model includes a 10 percent discount rate, a 3 percent rate of inflation, a
50 percent federal subsidy for hardware and installation, no additional state incentives, an
average user charging time of one hour, and no price for offset carbon emissions (the model
default). In addition, I assume the following number of expected users per day per charging
station:

22
2010 2011 2012 2013 2014 2015 2016 2017 2018 2019
1 2 3 3 4 4 5 5 6 6
Figure 4: These numbers reflect a reasonable estimation. A more thorough forecast would require estimated ranges of future plug-in vehicle and charging station penetration, consumer subscription fees, average vehicle-miles traveled (VMT), as well as an evaluation of public vs. residential charging frequency. However, my research suggests that charging fee revenue may not be critical to stakeholders interested in investment.
The graphs in the following results section outline the net costs to a retailer of a feasible build-
out and the ongoing operation of charging stations for ten years. The graphs map out the annual
and cumulative cash flows of three building scenarios, discounted to US$2009:
1. The retailer builds its own infrastructure at the lowest possible cost (orange)
• Annual maintenance cost per unit is assumed to be $25
• Charging station users are not charged hourly charging fees
2. The retailer contracts with Coulomb Technologies to build the infrastructure (blue)
• Annual maintenance cost per unit is assumed to be $50
• Hourly charging revenue for Level I chargers is assumed to be $0.75
• Hourly charging revenue for Level II chargers is assumed to be $1.00
3. The retailer contracts with eTec Minit-Charger to build the infrastructure (green)16
• Annual maintenance cost per unit is assumed to be $50
• Charging station users are not charged hourly charging fees
Part II: EV Penetration Scenarios
The modeling tool in Part I has explored the profitability of charging station investment for the
relevant stakeholders, pending certain assumptions discussed above. In the demonstrated
example of retailer stakeholders, we will see that charging station build-out can be profitable by
16 Model users have the option of choosing the same third-party manufacturer for both Scenarios 2 and 3 in order to test the sensitivity of changing projected charging revenue.

23
the end of the ten year investment period when the only revenue considered is hourly charging
revenue when using 3rd party infrastructure with revenue generating capabilities. Indeed while
investors in infrastructure will expect to benefit in many other ways, such as increased customer
throughput or corporate branding, it is important to show that the investment in charging
infrastructure can stand by itself as a profitable investment without including any of the difficult-
to-define benefits discussed in the sections above.
However, the projection of charging revenue is difficult, and relies on a number of critical
assumptions about consumer behavior and EV adoption. It is the purpose of the analysis in Part
II to address the following questions: Will enough retail customers charge at installed public
charging infrastructure for the retailers to break even? If so, what does that breaking-even point
suggest about the EV penetration that is required in the automobile market? Are different
penetration levels required for different sized retailers to break even?
Setting Up the Penetration Scenarios for the Retailer Stakeholder
In order to examine the needed EV penetration for a retailer stakeholder to make a successful
investment, I must first set some boundaries and assumptions straight. For my analysis here:
• Retailers will expect to break even on their infrastructure investment in 5 years,
• Retailers contract with a 3rd party hardware manufacturer (Coulomb Technologies) to
build one Level 1 charger in their parking lot,
• The only revenue source considered is hourly charging fees,17
• All other model options are set to their default values as explained above.
17 As mentioned above, interviews with retailers suggests that they are not counting on charge station revenue alone to make infrastructure investments profitable. However, due to the extremely difficult and possibly unreliable nature of estimating the sizes of these other benefits, it is the purpose of this analysis to attempt to prove that charging revenue alone is enough to allow stakeholders to at least break even.

24
The goal of this analysis is to arrive at a “required EV penetration” estimate for a selection of
retailer types. The types chosen for this analysis, from largest to smallest, will be a Wal-Mart
Supercenter, a Best Buy store, a McDonalds restaurant, and a Starbucks coffee shop. A number
of inputs must first be calculated, the steps for which are as follows:
1. Using the investment tool, a simple solver function allows for the binding of all
constraints except for the Users-Per-Day variable. For each stakeholder, I can execute
model runs such that an estimate of Users-Per-Day is outputted for each year into the
future, from one to ten (Ex: more charge station users per day are required to break even
in less time).
2. At the end of the analysis, once an implied PHEV penetration figure is calculated, I will
need some way to decide if it is a reasonable number. For comparison’s sake, I shall
calculate a proxy PHEV fleet penetration figure by examining the penetration of HEVs
over the last decade. To do this, I will use HEV sales data, compiled by the National
Renewable Energy Laboratory (NREL), as well as registered LDV fleet data for the
entire U.S., compiled by the Research and Innovative Technology Administration's
Bureau of Transportation Statistics.
3. In order to calculate the required EV penetration for my four chosen retailers, I compile
the above mentioned data into a programmed calculator interface that makes the
following assumptions:
§ A Wal-Mart Supercenter has 800 parking spots, a Best Buy has 500, a
McDonalds has 50, and a Starbucks has 30;
§ Each of these retailers is open for 16 hours a day and has a parking space
utilization of 50% for all open hours;

25
§ Shoppers average 60 minutes per visit at Wal-Mart, 45 at Best Buy, 30 at
McDonalds, and 15 at Starbucks;
§ 50% of PHEV owning shoppers at all retailers will decide to use the provided
charging infrastructure while parking; and
§ PHEV penetration rates among shoppers at all of these retailers is the same as the
national penetration rate.
26
Results
Part I: All Stakeholders Can Be Profitable
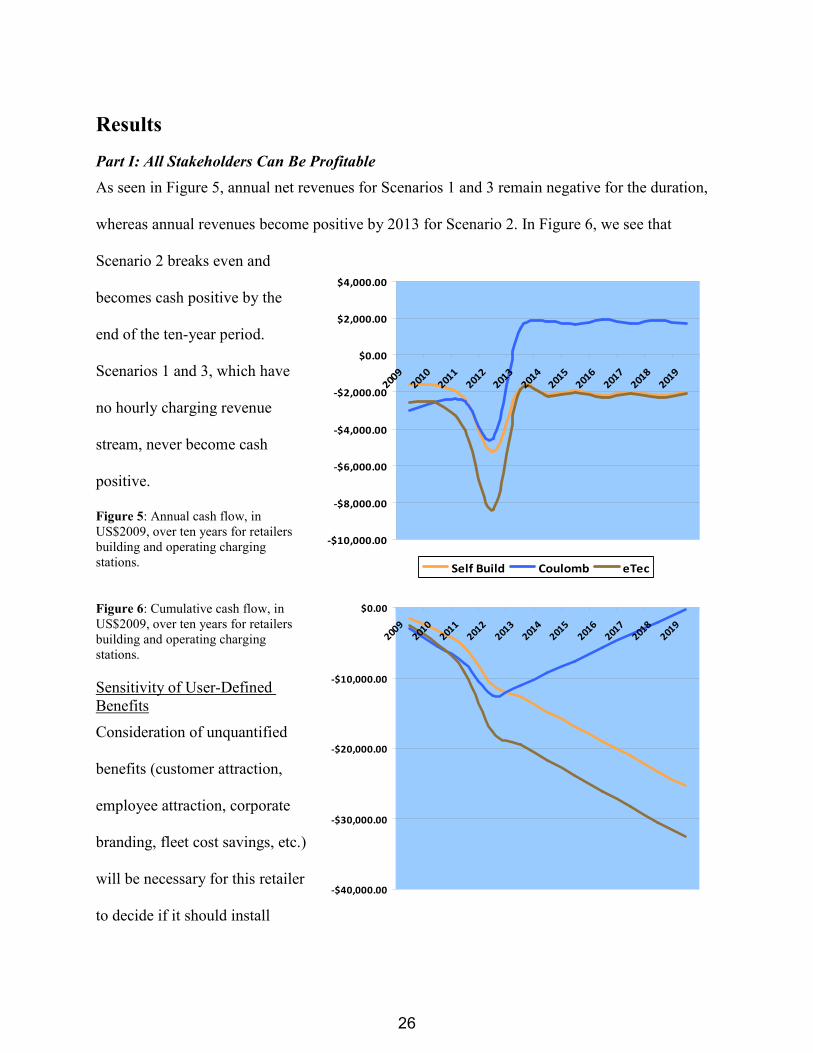
As seen in Figure 5, annual net revenues for Scenarios 1 and 3 remain negative for the duration,
whereas annual revenues become positive by 2013 for Scenario 2. In Figure 6, we see that
Scenario 2 breaks even and
becomes cash positive by the
end of the ten-year period.
Scenarios 1 and 3, which have
no hourly charging revenue
stream, never become cash
positive.
Figure 5: Annual cash flow, in US$2009, over ten years for retailers building and operating charging stations.
Figure 6: Cumulative cash flow, in US$2009, over ten years for retailers building and operating charging stations.
Sensitivity of User-Defined Benefits
Consideration of unquantified
benefits (customer attraction,
employee attraction, corporate
branding, fleet cost savings, etc.)
will be necessary for this retailer
to decide if it should install
-$40,000.00
-$30,000.00
-$20,000.00
-$10,000.00
$0.00
2009
2010
2011
2012
2013
2014
2015
2016
2017
2018
2019
-$10,000.00
-$8,000.00
-$6,000.00
-$4,000.00
-$2,000.00
$0.00
$2,000.00
$4,000.00
2009
2010
2011
2012
2013
2014
2015
2016
2017
2018
2019
Self Build Coulomb eTec

27
charging stations. For example, by year ten in Scenario 1, the retailer would need to assume that
the value of these above-mentioned benefits of their infrastructure build-out will be $25,000 in
order for the project to at least break even by the end of the ten-year period. Once stakeholders
are in a position to estimate these unquantified benefits, this investment tool will let them to
determine if a particular investment strategy will become cash positive, and when it will become
cash positive.
Although several retailers said that charging plug-in driving customers a fee was not a priority,
other stakeholders may be more receptive to charging fees. And as Figures 5 and 6 demonstrate,
hourly charging fees of just $1 per hour (or less) can make an enormous difference in future cash
flow, especially as expected charging station use increases with greater plug-in vehicle
penetration. The results of this investment tool run seem to illustrate the benefit of having simple
and effective revenue-generating capabilities built-in to charging infrastructure. However, even
without this revenue, the other benefits mentioned in this report would need only to generate
$25,000 cumulatively by the end of the ten-year period in Scenario 1, or just under $33,000 for
Scenario 3, for the investments to break even.
Analysis of Other Stakeholders
The results of the investment tool run described above apply only to a retailer. While the results
don’t differ drastically for the other stakeholders (parking garages, office parks, utilities,
homeowners associations, municipalities, etc.), it is important to note some of the factors that
change the perspectives of each of these other groups.18
18 The investment tool can be downloaded and used to run any desired scenarios. You can find the tool at: http://projectgetready.com/resources/plugging-in-a-stakeholder-investment-guide-for-public-electric-vehicle-charging-infrastructure

28
Parking Garages: Parking garages are in the business of making money from customers parking
their cars, so they are likely to be interested in charging infrastructure with built-in revenue-
generating capacity. They may also be more likely to position charging stations strategically in
order to charge higher fees for premium parking spaces. According to interviews with
electricians, parking garages may have lower infrastructure installation costs for stations because
garages are often already wired for daytime electricity use. In addition, garages’ physical
infrastructure (walls, low ceilings, etc.) facilitate the easy installation of equipment and may
preclude the need for expensive items such as charging station pedestals or wiring.
Office Parks: Office parks/employers will likely be interested in installing charging stations in
order to offer a service to current employees, or in an attempt to appeal to future employees.
They are also in a position to benefit from corporate branding and savings associated with
lowered fleet costs, should they decide to operate electric vehicles. In addition, these investors
may be interested in the contribution to LEED certification that charging stations offer. Also,
unlike the situation with parking garages or retail facilities, employees will likely plug in for
several uninterrupted hours while they work. This would decrease user turnover and increase
drivers’ time of use, perhaps allowing for more predictable revenue forecasts should employers
elect to charge a user-fee.
Utilities: Interviews with utilities reveal that, for the most part, they are not currently interested
in investing in public charging infrastructure, despite a desire to be a part of—and, to a degree,
control—developments in this industry. Utilities that are not subject to decoupling requirements
will already benefit from the additional sales of electricity that vehicle electrification will most
certainly spur. Perhaps a more developed electric-vehicle market in the future will encourage
utilities to make infrastructure investments themselves. In an interview with an American

29
hardware provider, I learned that European utilities are already contracting to purchase charging
hardware directly from manufacturers for installation in public places.
Home Owners Associations: Research suggests that there are 247 million cars on the road in the
U.S. but only 53 million garages.19 Multi-family housing units thus stand as an intuitive place for
charging infrastructure to stimulate plug-in vehicle penetration. As with the case of office parks,
plug-in drivers are likely to charge for long periods, perhaps overnight. This long charging time
may allow homeowners’ associations (HOAs) to invest in cheaper Level I infrastructure, as fast
charges may not be required. However, given that not all residents would benefit from electric
charging stations, it remains unclear whether or not HOAs would levy assessments on residents
to build infrastructure. Research in the Boulder, Colo. area suggests that developers building
environmentally progressive multi-family communities could invest in charging stations in order
to appeal to environmentally conscious residents.
Municipalities/Government: Much of the charging station infrastructure that has already been
installed in the U.S. in recent years has been built by city and county governments. Some
charging stations have been designated for free charging, while other infrastructure—such as the
Coulomb Technology stations being built by Sonoma County, California—will use Coulomb’s
service network and charge users service fees. Municipalities differ from other stakeholders in
that they are not usually in a position to benefit financially from user charging fees. However,
this does not seem to have inhibited their interest in public charging station installation.
Part II: Profitability Not Likely For All Stakeholders Yet
I have discussed earlier how each stakeholder interested in charging station deployment has
different costs and opportunities for revenue. Thus, each stakeholder must expect a slightly
19 Presentation by Richard Lowenthal of Coulomb Technologies. University of Colorado, May 6, 2009.

30
0
2
4
6
8
10
12
14
16
18
1 2 3 4 5 6 7 8 9 10
Years
Users Per Day
Retailers Office Parks / Employers Utilities
`
different intensity of customer adoption should they desire to break even on their investment
within a five year period. Please see Figure 7.
The next step for this
analysis was to calculate
and evaluate an HEV fleet
penetration number that
could be reasonably
compared with the
determined required
PHEV penetration
figures. NREL publishes
HEV sales data that goes
back to 1999 with the
introduction of the Honda
Insight. The Toyota Prius
followed in 2000, and 17
other models as well from
2002-2008.20 By 2005,
HEV sales numbered
20 http://www.nrel.gov/vehiclesandfuels/hev/hevs.html
0.0%
0.2%
0.4%
0.6%
0.8%
1.0%
1.2%
1 2 3 4 5 6 7 8 9 10
Years of HEV Sales in Marketplace
Total U.S. LDV Fleet Penetration
Figure 7: Retailers will require four users per day for each of their Level 1 charging stations to break even on their investment. Due to other revenue opportunities and longer charge times, other stakeholders will require fewer.
Figure 8: HEV penetration in the U.S. LDV fleet has been steadily rising since HEV introduction in 1999. By 2008, year 10 of HEV sales, total fleet penetration reached 1%.

31
209,711, which represented 1.2% of the total new LDV sales in the United States, and by 2008,
352,274 HEVs were sold, making up 2.1% of new cars sold. By 2008, the 10th year of HEV sales
in the U.S., HEVs made up roughly 1% of the total registered U.S. LDV fleet.21 Please see
Figure 8.
Potential Profitability is Extremely Sensitive to Retailer Size
The above described assumptions can be entered into a simple calculator where I reverse
engineer the required PHEV penetration that is required for each retailer to break even on their
charging station investment. The results are as follows:
Type of Retailer: Wal-Mart Supercenter Best Buy McDonalds Starbucks
Number of parking spots: 800 500 50 30 Parking lot utilization: 50% 50% 50% 50% Length of shopping (min.) 60 45 30 15 Number of cars per day 6400 5333 800 960 EV drivers willing to charge: 50% 50% 50% 50% EVs needed to break even: 8 8 8 8
Hour factor adjustment 8.0 11 16 32
Implied PHEV penetration: 0.1% 0.2% 2.0% 3.3% HEV Penetration in Year 5 0.1% 0.1% 0.1% 0.1%
HEV Penetration in Year 10 1.0% 1.0% 1.0% 1.0% Figure 9: Larger retailers require a much smaller PHEV penetration in order to recoup their investment in building one charger. For smaller retailers, they require much deeper vehicle penetration. As a benchmark, I have shown actual HEV market penetrations in years 5 and 10 since their introduction to the marketplace (2003 & 2008).
As demonstrated above, super-large retailers with hundreds of parking spaces should be
expected, in a five year period, to barely recoup their investment in building one PHEV charging
station, relying only on hourly charging revenue collected from the 3rd party services provider
(Coulomb). Smaller retailers, such as fast-food restaurants and coffee shops will need to wait for
much deeper PHEV penetration before they can safely invest profitably, or rely on some of the
other revenue streams discussed in detail above. Mid-sized big-box retailers, such as Best Buy in
21 http://www.bts.gov/publications/national_transportation_statistics/html/table_01_11.html

32
this example, are right on the edge of not quite being able to recoup their investment in charging
infrastructure in five years, but easily being able to by ten years.
It further complicates the investment in charging infrastructure that it may be against the best
interests of small retailers to possibly slow down their customer turnover by installing charging
infrastructure. Larger retailers like Best Buy or Wal-Mart would likely benefit from the
opportunity of keeping customers shopping for as long as they are willing to stay. But fast food
restaurants and coffee shops may decide against large-scale investment in charging infrastructure
if it is determined that such investment is likely to increase the length of each customer visit
beyond desirable limits.

33
Concluding Thoughts Our investment tool shows that charging station build-out can be profitable for any stakeholder,
but a few factors are particularly critical to successful investment. Stakeholders should
thoroughly investigate hardware installation costs, as these can vary greatly depending on the
site. Hardware choice is also critical, especially if charging revenues are required to offset initial
capital costs. Federal, state, and local incentives can help reduce the burden of high initial capital
costs, and may also lower operating costs as well, such as providing discounted electricity rates.
The most crucial unknown variable that will impact investment is simply the penetration of
electric vehicles in the next decade. Automotive companies are introducing PHEV models into
the U.S. market in 2010–2011, but these are mostly pre-production launches. The success of
these vehicles will depend on the strength of the economy, the price of gasoline, the continuation
of federal and state subsidies, and the existence of public and residential charging infrastructure.
Our analysis shows that the success of retailer stakeholders investing in public infrastructure will
depend greatly on the depth of PHEV penetration. If PHEV penetration depth is similar to the
success of HEV over their first 10 years, larger retailers will be able to invest profitably in
infrastructure right away. Smaller retailers will likely need to wait for deeper penetration, or
depend on sources of revenue from their installed infrastructure other than direct user fees.
Preparing for electric vehicles now carries a degree of risk – plug-ins may never come, or they
might eventually lose out to competing technologies. More likely, our transition away from fossil
fuels will depend on many technology alternatives being successful. Building charging
infrastructure now will not necessarily guarantee the success of plug-ins. But more information
and preparation will both increase the likelihood of plug-in vehicle penetration, and also the
profitability of plug-in charging infrastructure when that penetration does occur.

34
Appendix: Assumptions for Investment Tool Runs • Level I chargers run at 120V and 15A for a total charge of 1.8 kW, while level II chargers are
240V and 30A for a total charge of 7.2 kW. Level III chargers are not included in the model as options for stakeholder investment.
• Electricity price forecasts are from the EIA’s Annual Energy Outlook 2009. Emissions data to calculate offset carbon (equivalent) emissions from PHEV use are from Argonne’s GREET model. The investment tool assumes that all PHEV use is PHEV-40, or PHEVs with a 40 mile all-electric range.
• All installed infrastructure is assumed to remain functional over the course of the 10 year period forecasted in the model. It is likely that charge equipment would become technologically obsolete before its product lifetime ran out.
• All costs in the model, such as installation, hardware, and maintenance are increased annually by a measure of inflation, which is set at a default value of 3%. All future revenue streams are discounted to 2009 using a discount rate that is set at a default of 10%. Both inflation and discount rates are variable by the model user.
• Offset carbon emissions are measured by comparing tailpipe emissions of plug-in and conventional vehicles. As of now, the model does not include the added GHG emissions associated with increased electricity production required to power the plug-ins.
• The model is set up to assume that charging infrastructure built in the year 2009 will only come online by the year 2010. Specifically, Level I and II chargers built out in 2009 in the model do not accumulate benefits for the builders, nor incur electricity costs, until 2010. From 2010 on, any stations built in a particular year are assumed to be installed and operational instantly on January 1 of that year.
• Some charging hardware has the capability to charge more than 1 car. Some of these will require additional hardware purchases in order to do this. This factor will only affect the model runs when a non-zero hourly charging fee is selected. My model assumes, perhaps conservatively, that all hardware chargers only charge one vehicle at a time. Please check with the menu of hardware options below to see which hardware options have the capability of charging more than one vehicle simultaneously, and what additional equipment is required to do this. For these hardware options, my model may underestimate revenue generation.
• Coulomb Technologies’ infrastructure requires that at least one unit at each location be a “gateway” unit that is in charge of cellular communication with a service center. These units cost about $1000 more than a standard non-Gateway model. The investment tool assumes that the cost of Coulomb charge stations includes a portion of this additional capital cost.
• Federal incentives in support of charge station hardware and installation is set at 50% in the model. Additional state incentives, where available, are assumed to piggyback directly on top of this 50% federal incentive.
• Avcon does not currently offer a Level I charger, while Shorepower does not currently offer a Level II charger. Thus users should be aware when using the investment tool that no Level I chargers should be built-out when using Avcon products, or Level II chargers when using Shorepower products.

35
• Estimated costs and benefits from Figure 3 are as follows: • Electricity cost range is the cost of running a Level I station for 1 hour per day (minimum)
ranging to the cost of running a Level 2 station at 8 hours per day. • Installation, station hardware, and maintenance costs come from interviews with hardware
providers, as well as publicly available cost data. • Advertising benefits are assumed to be equivalent to running one small advertisement in a
local paper. • Employee retention benefits are estimated as the value of one employee taking a job for
one dollar less per hour. • Corporate branding benefits are assumed to equal 1% of a $500,000 budget. • Government incentives are calculated by taking 50% of a high priced charging station
combined with standard installation costs. • Fleet cost savings are assumed to be the value of one car using no gas for ten years where
gas is $3 per gallon. • User fees assumes that hardware owners charge $0.50 per hour for charging. • Customer attraction is assumed to be the value of five extra customers per day, each of
whom buys an $8 item at a 20% profit margin for the seller.
36
Acknowledgements I would like to thank all the members of RMI’s Mobility+Vehicle Efficiency team in Boulder, Colorado for their help in developing the modeling tool and written analysis for this project. In particular, Matt Mattila was of great help to me while at RMI. I would also like to thank Dr. Lincoln Pratson for advising me on the writing of this Master’s Project at The Nicholas School. Dr. Pratson stepped in at the last minute and shared an appreciated portion of his valuable time with me this fall semester brainstorming. Also, for their contributions of time and information in moving this project along, I would like to thank a number participating companies and organizations. These organization shown below contributed to my research, but do not necessarily endorse the findings of this report:

37
Bibliography
Sources • 2009 BBMG Conscious Consumer Report. • Biello, David. “R.I.P. hydrogen economy? Obama cuts hydrogen car funding.” Scientific
American. May 8, 2009. http://www.scientificamerican.com/blog/60-second-science/post.cfm?id=rip-hydrogen-economy-obama-cuts-hyd-2009-05-08
• Boschert, Sherry. “The Cleanest Cars: Well-to-Wheel Emissions Comparisons.” Updated
May, 2008.
• California Public Utilities Commission, Policy and Planning Division. “Light-Duty Vehicle Electrification in California: Potential Barriers and Opportunities.” May 22, 2009.
• Cheah, Lynette; Evans, Christopher; Bandivadekar, Anup & Heywood, John. “Factor of
Twp: Halving the Fuel Consumption of New U.S. Automobiles by 2035.” Massachusetts Institute of technology, October 2007.
• “Driving the Solution: The Plug-In Hybrid Electric Vehicle.” EPRI Journal, Fall 2005. • Electric Power Research Institute. “Environmental Assessment of Plug-In Hybrid Electric
Vehicles, Volume 1:National Greenhouse Gas Emissions & Volume 2: United States Air Quality Analysis Based on AEO-2006 Assumptions for 2030.” July 2007.
• “Federal Energy and Fleet Management,” GAO Report to Congressional Requesters,
June 2009.
• Freund, Ron. “On availability of public EV charging.” Electric Auto Association / PlugInAmerica. April 3, 2009.
• Gao, Paul; Wang, Arthur & Wu, August. “China Charges Up: The Electric Vehicle
Opportunity.” McKinsey&Company. October 2008.
• Greenemeier, Larry. “The Great Electric Car Quandary: How to Build a Charging Infrastructure Before Demand Grows.” Scientific American. August 14, 2009. http://www.scientificamerican.com/article.cfm?id=electric-car-quandary&page=2
• Hadley, Stanton W. & Tsvetkova, Alexandra. “Potential Impacts of Plug-in Hybrid
Electric Vehicles on Regional Power Generation.” Oak Ridge National Laboratory, U.S. Department of Energy. January, 2008.
• Hawken, Paul; Lovins, Amory & Lovins, L. Hunter. Natural Capitalism: Creating the
Next Industrial Revolution. Little, Brown and Company Publishers, NY, NY. 1999.

38
• Heavenrich, Robert. “Light-Duty Automotive Technology and Fuel Economy Trends:
1975 through 2006,” U.S. Environmental Protection Agency EPA420-R-06-011 (July 2006).
• Hensley, Russell; Knupfer, Stefan & Pinner, Dickon. “Electrifying cars: How three
industries will evolve.” McKinsey Quarterly, Climate Change Special Initiative. Number 3, 2009.
• Hill Briefing: Plug-In Hybrid Vehicles. “Plug-In Electric Vehicles – Affordable,
Convenient, and Green?” May 28, 2009.
• Jaramillo, Paulina; Samaras, Constantine; Wakeley, Heather & Meisterling, Kyle. “Greenhouse gas implications of using coal for transportation: Life cycle assessment of coal-to-liquids, plug-in hybrids, and hydrogen pathways. Energy Policy, 37 (2009).
• Kats, Gregory H. “Green Building Costs and Financial Benefits,” Capital E. 2003.
www.cap-e.com/ewebeditpro/items/O59F3481.pdf
• Kintner-Meyer, Michael; Schneider, Kevin & Pratt, Robert. “Impacts Assessment of Plug-In Hybrid Vehicles on Electric Utilities and Regional U.S. Power Grids, Part I: Technical Analysis. Pacific Northwest National Laboratory, November 2007.
• Kromer, Matthew A. & Heywood, John B. ”Electric Powertrains: Opportunites and
Challenges in the U.S. Light-Duty Vehicle Fleet.” Laboratory for Energy and the Environment, MIT. May 2007.
• Lovins, Amory B. Soft Energy Paths: Towards a Durable Peace. Harper Collins
Publishers, 1979.
• Lovins, Amory B., et al. Winning the Oil Engame: Innovation for Profits, Jobs, and Security. Rocky Mountain Institute Publishers, Snowmass, CO. 2005.
• Lovins, Amory B. Soft Energy Paths: Toward a Durable Peace. Penguin Books, NY, NY.
1977.
• Meredith, Lauren & Crowfoot, Wade. “Current State of Electric Vehicle Products, Infrastructure and Policy in the San Francisco Bay Area.” Office of Mayor Gavin Newsom. February 10, 2009.
• Morrow, Kevin; Karner, Donald & Francfort, James. United States Department of
Energy, Energy Efficiency and Renewable Energy, Vehicle Technologies Program – Advanced Vehicle Testing Activity. “Plug-in Hybrid Electric Vehicle Charging Infrastructure Review.” November, 2008.

39
• National Renewable Energy Laboratories: Hybrid Electric Vehicles. http://www.nrel.gov/vehiclesandfuels/hev/hevs.html. Accessed October 25, 2009.
• Sanna, Lucy. “Driving the Solution: The Plug-In Hybrid Vehicle.” EPRI Journal. Fall,
2005.
• Scott, Michael J.; Kintner-Meyer, Michael; Elliot, Douglas B. & Warwick, William M. “Impacts Assessment of Plug-In Hybrid Vehicles on Electric Utilities and Regional U.S. Power Grids, Part II: Economic Assessment. Pacific Northwest National Laboratory, November 2007.
• Shiau, Ching-Shin Norman; Samaras, Constantine; Hauffe, Richard & Michalek, Jeremy
J. “Impact of battery weight and charging patterns on the economic and environmental benefits of plug-in hybrid vehicles.” Energy Policy, 37 (2009).
• United States Department of Energy, Energy Efficiency and Renewable Energy,
Alternative Fuels and Advanced Vehicles Data Center, State and Federal Incentives and Laws. www.afdc.energy.gov/afdc/progs/view_ind_mtx.php/tech/ELEC/US/0
• United States Department of Energy, Energy Efficiency and Renewable Energy, Vehicle
Technologies Program, Advanced Vehicle Testing Activity. www1.eere.energy.gov/vehiclesandfuels/avta/light_duty/fsev/fsev_gas_elec2.html
• United States Department of Energy, Energy Information Administration (EIA),
www.eia.doe.gov/cneaf/electricity/epm/table5_3.html
• United States Government Accountability Office, Report to Congressional Requesters, Federal Energy and Fleet Management. “Plug-in Vehicles Offer Potential Benefits, but High Costs and Limited Information Could Hinder Integration into the Federal Fleet.” June, 2009.
• Ward’s Automotive: U.S. Vehicle Sales.
http://wardsauto.com/keydata/historical/UsaSa01summary.xls. Accessed October 25, 2009.
• Williams, Eric. “Plug-in and regular hybrids: A national and regional comparison of costs
and CO2 emissions.” Climate Change Policy Partnership, Nicholas Institute for Environmental Policy Solutions. November 2008.
Interviews • AAA Electric Co. Inc. Phone interview June 18, 2009.
• Alexander, Marcus: Electric Power Research Institute (EPRI). Phone interview June 4,
2009.
• Baldwin, Paula: Best Buy. Phone interview May 29, 2009.
40
• Clipper Creek: Phone interview June 10, 2009.
• Egbert, Jill & Ornelas, Efrain: Pacific Gas & Electric (PG&E). Phone interview June 8,
2009.
• Gilbert, Marty: Wal-Mart. Phone interview June 1, 2009.
• Hall, Greg: Better-Way Electric and Data Comm, Inc. Phone interview June 18, 2009.
• Helsel, Kristen: AeroVironment. Phone interview June 12, 2009.
• Iofis, Bob: DC Feeders. Phone interview July 9, 2009.
• JT Electric. Phone interview June 18, 2009.
• Kim, Jeff: Shorepower Technologies. Phone interview June 15, 2009.
• Levinn, Jason: Better Place. Phone interview June 5, 2009.
• Mandal, Praveen: Coulomb Technologies. Phone interview June 1, 2009.
• Pollard, Stephan: Throttle 6 Wind Energy Development. Phone interview June 10, 2009.
• Rolfsen, Rob: Cisco. Phone interview June 5, 2009.
• Schieren, David G. & Howland, Alexis: NABCEP Certified PV Installer. Phone interview June 10, 2009.
• Simon, Sandy: Xcel Energy. Phone interview May 28, 2009.
• Windward Electric. Phone interview June 18, 2009.
• Worthington, David: Sonoma Country. Phone interview May 27, 2009.
Presentations • Alford, Larry: Austin Energy. “Maximizing Renewable Energy with EVs in the Utility of
the Future.” May 18, 2009. • Evans, Cynthia: Xcel Energy. “SmartGridCity: A blueprint for a connected, intelligent
grid community.” Presentation at University of Colorado, May 6, 2009. • Kjaer, Edward T.: The Impact of Plug in Vehicles on Utilities.” Presentation at
University of Colorado, May 6, 2009.

41
• Lowenthal, Richard: Coulomb Technologies. Presentation at University of Colorado, May 6, 2009.
• Stern, Frank: Summit Blue Consulting, LLC. “Carbon Emissions: Will Utilities Be Able
to Capitalize on the Emissions Reduction that Will Come with EVs?” Presentation at University of Colorado, May 6, 2009.
• Zambrano, Saul: Pacific Gas & Electric (PG&E). “Transportation Challenges in the 21st
Century: Can the SmartGrid Solve the Issues?” May 18, 2009.