Plug-in vs. wireless charging: Life cycle energy and ... · Wireless charging, as opposed to...
9
Plug-in vs. wireless charging: Life cycle energy and greenhouse gas emissions for an electric bus system Zicheng Bi a , Lingjun Song b,a , Robert De Kleine a , Chunting Chris Mi c , Gregory A. Keoleian a,⇑ a Center for Sustainable Systems, School of Natural Resources and Environment, University of Michigan, 440 Church St., Ann Arbor, MI 48109, United States b School of Transportation Science and Engineering, Beihang University, Beijing 100191, China c Department of Electrical and Computer Engineering, University of Michigan-Dearborn, 4901 Evergreen Road, Dearborn, MI 48128, United States highlights Compared life cycle energy and GHG emissions of wireless to plug-in charging. Modeled a transit bus system to compare both charging methods as a case study. Contrasted tradeoffs of infrastructure burdens with lightweighting benefits. The wireless battery can be downsized to 27–44% of a plug-in charged battery. Explored sensitivity of wireless charging efficiency & grid carbon intensity. graphical abstract In this study, plug-in and wireless charging for an all-electric bus system are compared from the life cycle energy and greenhouse gas (GHG) emissions perspectives. The comparison of life cycle GHG emissions is shown in the graph below. The major differences between the two systems, including the charger, battery and use-phase electricity consumption, are modeled separately and compared aggregately. In the base case, the wireless charging system consumes 0.3% less energy and emits 0.5% less greenhouse gases than plug-in charging system in the total life cycle. To further improve the energy and environmental perfor- mance of the wireless charging system, key parameters including grid carbon intensity and wireless charging efficiency are analyzed and discussed in this paper. article info Article history: Received 25 August 2014 Received in revised form 6 February 2015 Accepted 8 February 2015 Keywords: Wireless charging abstract Wireless charging, as opposed to plug-in charging, is an alternative charging method for electric vehicles (EVs) with rechargeable batteries and can be applicable to EVs with fixed routes, such as transit buses. This study adds to the current research of EV wireless charging by utilizing the Life Cycle Assessment (LCA) to provide a comprehensive framework for comparing the life cycle energy demand and green- house gas emissions associated with a stationary wireless charging all-electric bus system to a plug-in charging all-electric bus system. Life cycle inventory analysis of both plug-in and wireless charging hard- ware was conducted, and battery downsizing, vehicle lightweighting and use-phase energy consumption http://dx.doi.org/10.1016/j.apenergy.2015.02.031 0306-2619/Ó 2015 Elsevier Ltd. All rights reserved. ⇑ Corresponding author. Tel.: +1 734 764 3194. E-mail address: [email protected] (G.A. Keoleian). Applied Energy 146 (2015) 11–19 Contents lists available at ScienceDirect Applied Energy journal homepage: www.elsevier.com/locate/apenergy
Transcript of Plug-in vs. wireless charging: Life cycle energy and ... · Wireless charging, as opposed to...
Applied Energy 146 (2015) 11–19
Contents lists available at ScienceDirect
Applied Energy
journal homepage: www.elsevier .com/locate /apenergy
Plug-in vs. wireless charging: Life cycle energy and greenhouse gasemissions for an electric bus system
http://dx.doi.org/10.1016/j.apenergy.2015.02.0310306-2619/� 2015 Elsevier Ltd. All rights reserved.
⇑ Corresponding author. Tel.: +1 734 764 3194.E-mail address: [email protected] (G.A. Keoleian).
Zicheng Bi a, Lingjun Song b,a, Robert De Kleine a, Chunting Chris Mi c, Gregory A. Keoleian a,⇑a Center for Sustainable Systems, School of Natural Resources and Environment, University of Michigan, 440 Church St., Ann Arbor, MI 48109, United Statesb School of Transportation Science and Engineering, Beihang University, Beijing 100191, Chinac Department of Electrical and Computer Engineering, University of Michigan-Dearborn, 4901 Evergreen Road, Dearborn, MI 48128, United States
h i g h l i g h t s
� Compared life cycle energy and GHGemissions of wireless to plug-incharging.� Modeled a transit bus system to
compare both charging methods as acase study.� Contrasted tradeoffs of infrastructure
burdens with lightweighting benefits.� The wireless battery can be
downsized to 27–44% of a plug-incharged battery.� Explored sensitivity of wireless
charging efficiency & grid carbonintensity.
g r a p h i c a l a b s t r a c t
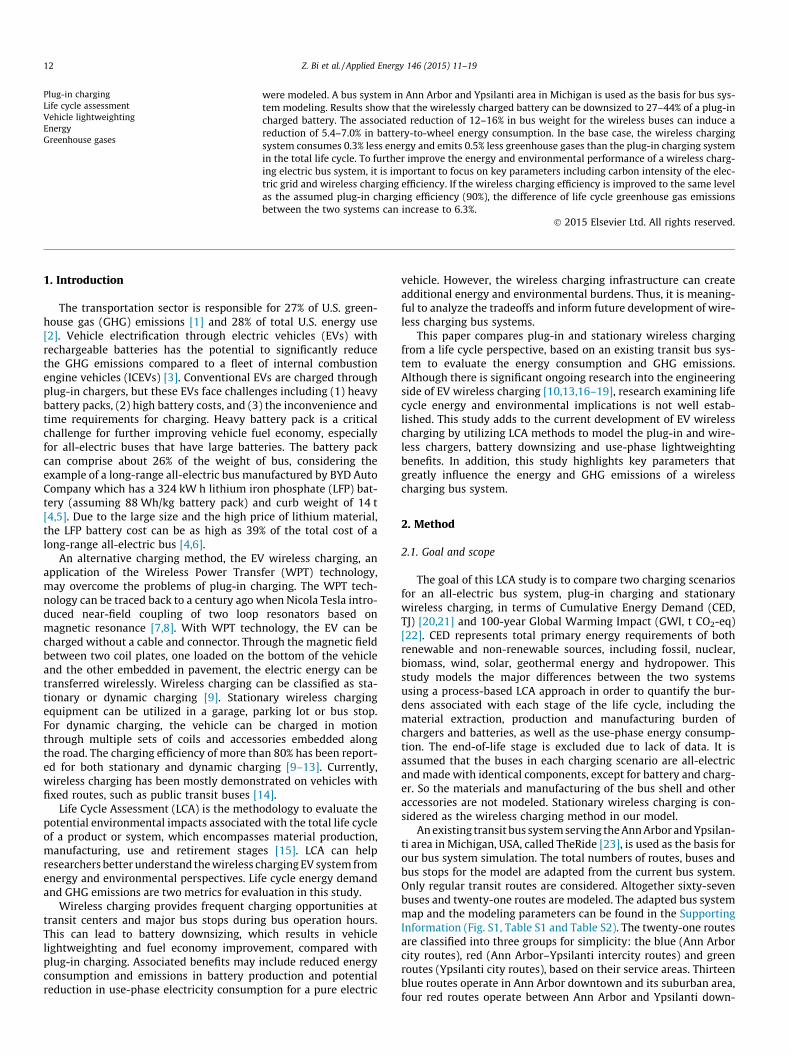
In this study, plug-in and wireless charging for an all-electric bus system are compared from the life cycleenergy and greenhouse gas (GHG) emissions perspectives. The comparison of life cycle GHG emissions isshown in the graph below. The major differences between the two systems, including the charger, batteryand use-phase electricity consumption, are modeled separately and compared aggregately. In the basecase, the wireless charging system consumes 0.3% less energy and emits 0.5% less greenhouse gases thanplug-in charging system in the total life cycle. To further improve the energy and environmental perfor-mance of the wireless charging system, key parameters including grid carbon intensity and wirelesscharging efficiency are analyzed and discussed in this paper.
a r t i c l e i n f o
Article history:Received 25 August 2014Received in revised form 6 February 2015Accepted 8 February 2015
Keywords:Wireless charging
a b s t r a c t
Wireless charging, as opposed to plug-in charging, is an alternative charging method for electric vehicles(EVs) with rechargeable batteries and can be applicable to EVs with fixed routes, such as transit buses.This study adds to the current research of EV wireless charging by utilizing the Life Cycle Assessment(LCA) to provide a comprehensive framework for comparing the life cycle energy demand and green-house gas emissions associated with a stationary wireless charging all-electric bus system to a plug-incharging all-electric bus system. Life cycle inventory analysis of both plug-in and wireless charging hard-ware was conducted, and battery downsizing, vehicle lightweighting and use-phase energy consumption
12 Z. Bi et al. / Applied Energy 146 (2015) 11–19
Plug-in chargingLife cycle assessmentVehicle lightweightingEnergyGreenhouse gases
were modeled. A bus system in Ann Arbor and Ypsilanti area in Michigan is used as the basis for bus sys-tem modeling. Results show that the wirelessly charged battery can be downsized to 27–44% of a plug-incharged battery. The associated reduction of 12–16% in bus weight for the wireless buses can induce areduction of 5.4–7.0% in battery-to-wheel energy consumption. In the base case, the wireless chargingsystem consumes 0.3% less energy and emits 0.5% less greenhouse gases than the plug-in charging systemin the total life cycle. To further improve the energy and environmental performance of a wireless charg-ing electric bus system, it is important to focus on key parameters including carbon intensity of the elec-tric grid and wireless charging efficiency. If the wireless charging efficiency is improved to the same levelas the assumed plug-in charging efficiency (90%), the difference of life cycle greenhouse gas emissionsbetween the two systems can increase to 6.3%.
� 2015 Elsevier Ltd. All rights reserved.
1. Introduction vehicle. However, the wireless charging infrastructure can create
The transportation sector is responsible for 27% of U.S. green-house gas (GHG) emissions [1] and 28% of total U.S. energy use[2]. Vehicle electrification through electric vehicles (EVs) withrechargeable batteries has the potential to significantly reducethe GHG emissions compared to a fleet of internal combustionengine vehicles (ICEVs) [3]. Conventional EVs are charged throughplug-in chargers, but these EVs face challenges including (1) heavybattery packs, (2) high battery costs, and (3) the inconvenience andtime requirements for charging. Heavy battery pack is a criticalchallenge for further improving vehicle fuel economy, especiallyfor all-electric buses that have large batteries. The battery packcan comprise about 26% of the weight of bus, considering theexample of a long-range all-electric bus manufactured by BYD AutoCompany which has a 324 kW h lithium iron phosphate (LFP) bat-tery (assuming 88 Wh/kg battery pack) and curb weight of 14 t[4,5]. Due to the large size and the high price of lithium material,the LFP battery cost can be as high as 39% of the total cost of along-range all-electric bus [4,6].
An alternative charging method, the EV wireless charging, anapplication of the Wireless Power Transfer (WPT) technology,may overcome the problems of plug-in charging. The WPT tech-nology can be traced back to a century ago when Nicola Tesla intro-duced near-field coupling of two loop resonators based onmagnetic resonance [7,8]. With WPT technology, the EV can becharged without a cable and connector. Through the magnetic fieldbetween two coil plates, one loaded on the bottom of the vehicleand the other embedded in pavement, the electric energy can betransferred wirelessly. Wireless charging can be classified as sta-tionary or dynamic charging [9]. Stationary wireless chargingequipment can be utilized in a garage, parking lot or bus stop.For dynamic charging, the vehicle can be charged in motionthrough multiple sets of coils and accessories embedded alongthe road. The charging efficiency of more than 80% has been report-ed for both stationary and dynamic charging [9–13]. Currently,wireless charging has been mostly demonstrated on vehicles withfixed routes, such as public transit buses [14].
Life Cycle Assessment (LCA) is the methodology to evaluate thepotential environmental impacts associated with the total life cycleof a product or system, which encompasses material production,manufacturing, use and retirement stages [15]. LCA can helpresearchers better understand the wireless charging EV system fromenergy and environmental perspectives. Life cycle energy demandand GHG emissions are two metrics for evaluation in this study.
Wireless charging provides frequent charging opportunities attransit centers and major bus stops during bus operation hours.This can lead to battery downsizing, which results in vehiclelightweighting and fuel economy improvement, compared withplug-in charging. Associated benefits may include reduced energyconsumption and emissions in battery production and potentialreduction in use-phase electricity consumption for a pure electric
additional energy and environmental burdens. Thus, it is meaning-ful to analyze the tradeoffs and inform future development of wire-less charging bus systems.
This paper compares plug-in and stationary wireless chargingfrom a life cycle perspective, based on an existing transit bus sys-tem to evaluate the energy consumption and GHG emissions.Although there is significant ongoing research into the engineeringside of EV wireless charging [10,13,16–19], research examining lifecycle energy and environmental implications is not well estab-lished. This study adds to the current development of EV wirelesscharging by utilizing LCA methods to model the plug-in and wire-less chargers, battery downsizing and use-phase lightweightingbenefits. In addition, this study highlights key parameters thatgreatly influence the energy and GHG emissions of a wirelesscharging bus system.
2. Method
2.1. Goal and scope
The goal of this LCA study is to compare two charging scenariosfor an all-electric bus system, plug-in charging and stationarywireless charging, in terms of Cumulative Energy Demand (CED,TJ) [20,21] and 100-year Global Warming Impact (GWI, t CO2-eq)[22]. CED represents total primary energy requirements of bothrenewable and non-renewable sources, including fossil, nuclear,biomass, wind, solar, geothermal energy and hydropower. Thisstudy models the major differences between the two systemsusing a process-based LCA approach in order to quantify the bur-dens associated with each stage of the life cycle, including thematerial extraction, production and manufacturing burden ofchargers and batteries, as well as the use-phase energy consump-tion. The end-of-life stage is excluded due to lack of data. It isassumed that the buses in each charging scenario are all-electricand made with identical components, except for battery and charg-er. So the materials and manufacturing of the bus shell and otheraccessories are not modeled. Stationary wireless charging is con-sidered as the wireless charging method in our model.
An existing transit bus system serving the Ann Arbor and Ypsilan-ti area in Michigan, USA, called TheRide [23], is used as the basis forour bus system simulation. The total numbers of routes, buses andbus stops for the model are adapted from the current bus system.Only regular transit routes are considered. Altogether sixty-sevenbuses and twenty-one routes are modeled. The adapted bus systemmap and the modeling parameters can be found in the SupportingInformation (Fig. S1, Table S1 and Table S2). The twenty-one routesare classified into three groups for simplicity: the blue (Ann Arborcity routes), red (Ann Arbor–Ypsilanti intercity routes) and greenroutes (Ypsilanti city routes), based on their service areas. Thirteenblue routes operate in Ann Arbor downtown and its suburban area,four red routes operate between Ann Arbor and Ypsilanti down-
Z. Bi et al. / Applied Energy 146 (2015) 11–19 13
towns and their suburban areas, and four green routes operate inYpsilanti downtown and its suburban area. Routes in the same groupare assumed to have the same parameters, such as travel distance ineach loop. It is assumed that about one quarter of bus operation time(from the beginning to end of daily duty) is dwell time at bus stopsand transit centers, which is based on a study for a typical route inthe TheRide bus system [24].
Two charging scenarios of this bus system are modeled: (1)plug-in charging scenario and (2) stationary wireless charging sce-nario. For the plug-in charging scenario, the plug-in chargers areassumed to be only located at the parking lot for buses to chargeovernight. For the wireless charging scenario, the wireless charginginfrastructure is hypothesized to be deployed across the bus ser-vice area located at those popular bus stops where the buses stopmore frequently, all of the transit centers, as well as the overnightparking lot. It is assumed that the downtown areas have greatercharging infrastructure density than the suburban areas. A longercharge time is assumed at each transit center (e.g., 6 min) andkey bus stop (e.g., 36 s per charging stop) in downtown than thesuburban areas (e.g., 29 s per charging stop) because the ridershipis assumed to be lower in suburb. The result is that about one quar-ter of the operation time is dwell time for wireless charging.
The functional unit for this study is providing transit servicesfor Ann Arbor and Ypsilanti area for 12 years with 67 buses,equivalent to 48,034,407 vehicle kilometers in total (on average716,932 vehicle kilometers per bus). The 12-year horizon is oftenused as an estimate for bus life in transit agency reports, such asU.S. Federal Transit Administration [25], and used by a previousLCA study modeling electric public transportation buses [26].
2.2. Data sources and model description
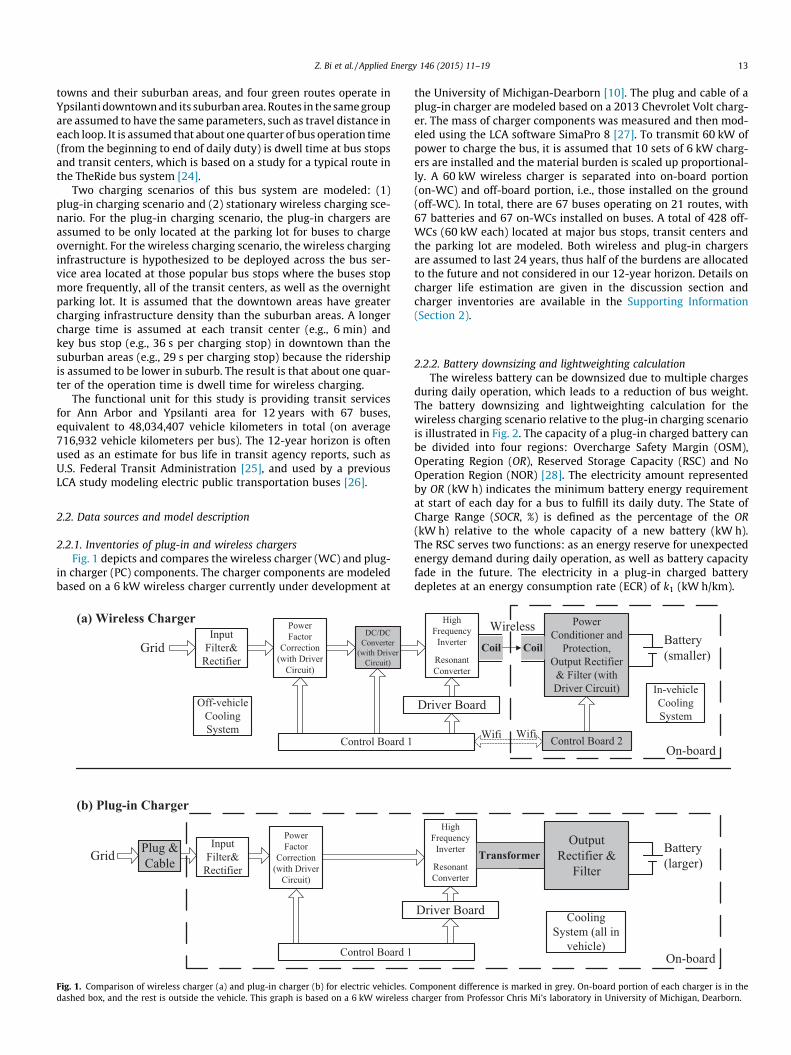
2.2.1. Inventories of plug-in and wireless chargersFig. 1 depicts and compares the wireless charger (WC) and plug-
in charger (PC) components. The charger components are modeledbased on a 6 kW wireless charger currently under development at
Input Filter&
Rectifier
Power Factor
Correction (with Driver
Circuit)
GridDC/DC
Converter (with Driver
Circuit)
Off-vehicleCooling System
Control Board 1
Input Filter&
Rectifier
Power Factor
Correction (with Driver
Circuit)
Grid
Control Board 1
Plug & Cable
(a) Wireless Charger
(b) Plug-in Charger
Fig. 1. Comparison of wireless charger (a) and plug-in charger (b) for electric vehicles. Cdashed box, and the rest is outside the vehicle. This graph is based on a 6 kW wireless
the University of Michigan-Dearborn [10]. The plug and cable of aplug-in charger are modeled based on a 2013 Chevrolet Volt charg-er. The mass of charger components was measured and then mod-eled using the LCA software SimaPro 8 [27]. To transmit 60 kW ofpower to charge the bus, it is assumed that 10 sets of 6 kW charg-ers are installed and the material burden is scaled up proportional-ly. A 60 kW wireless charger is separated into on-board portion(on-WC) and off-board portion, i.e., those installed on the ground(off-WC). In total, there are 67 buses operating on 21 routes, with67 batteries and 67 on-WCs installed on buses. A total of 428 off-WCs (60 kW each) located at major bus stops, transit centers andthe parking lot are modeled. Both wireless and plug-in chargersare assumed to last 24 years, thus half of the burdens are allocatedto the future and not considered in our 12-year horizon. Details oncharger life estimation are given in the discussion section andcharger inventories are available in the Supporting Information(Section 2).
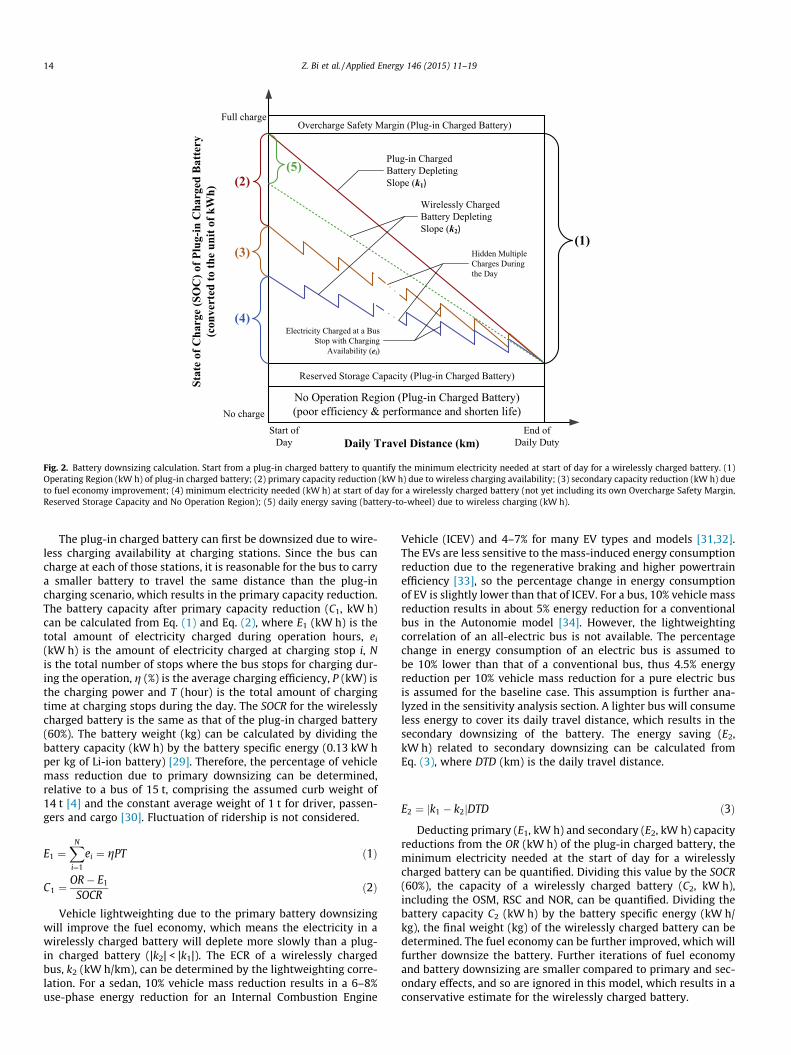
2.2.2. Battery downsizing and lightweighting calculationThe wireless battery can be downsized due to multiple charges
during daily operation, which leads to a reduction of bus weight.The battery downsizing and lightweighting calculation for thewireless charging scenario relative to the plug-in charging scenariois illustrated in Fig. 2. The capacity of a plug-in charged battery canbe divided into four regions: Overcharge Safety Margin (OSM),Operating Region (OR), Reserved Storage Capacity (RSC) and NoOperation Region (NOR) [28]. The electricity amount representedby OR (kW h) indicates the minimum battery energy requirementat start of each day for a bus to fulfill its daily duty. The State ofCharge Range (SOCR, %) is defined as the percentage of the OR(kW h) relative to the whole capacity of a new battery (kW h).The RSC serves two functions: as an energy reserve for unexpectedenergy demand during daily operation, as well as battery capacityfade in the future. The electricity in a plug-in charged batterydepletes at an energy consumption rate (ECR) of k1 (kW h/km).
High Frequency
Inverter
Resonant Converter
Coil
Power Conditioner and
Protection, Output Rectifier & Filter (with Driver Circuit)
Coil
WirelessBattery(smaller)
Driver Board
Control Board 2Wifi
In-vehicleCooling System
On-board
High Frequency
Inverter
Resonant Converter
TransformerOutput
Rectifier & Filter
Battery(larger)
Driver Board Cooling System (all in
vehicle)On-board
Wifi
omponent difference is marked in grey. On-board portion of each charger is in thecharger from Professor Chris Mi’s laboratory in University of Michigan, Dearborn.
Daily Travel Distance (km)
Overcharge Safety Margin (Plug-in Charged Battery)
No Operation Region (Plug-in Charged Battery)(poor efficiency & performance and shorten life)
Full charge
No charge
Start of Day
End of Daily Duty
(1)
(4)
(3)
(2)(5)
Plug-in Charged Battery Depleting Slope (k1)
Wirelessly Charged Battery Depleting Slope (k2)
Electricity Charged at a Bus Stop with Charging
Availability (ei)
Hidden Multiple Charges During the Day
Stat
e of
Cha
rge
(SO
C) o
f Plu
g-in
Cha
rged
Bat
tery
(c
onve
rted
to th
e un
it of
kW
h)
Reserved Storage Capacity (Plug-in Charged Battery)
Fig. 2. Battery downsizing calculation. Start from a plug-in charged battery to quantify the minimum electricity needed at start of day for a wirelessly charged battery. (1)Operating Region (kW h) of plug-in charged battery; (2) primary capacity reduction (kW h) due to wireless charging availability; (3) secondary capacity reduction (kW h) dueto fuel economy improvement; (4) minimum electricity needed (kW h) at start of day for a wirelessly charged battery (not yet including its own Overcharge Safety Margin,Reserved Storage Capacity and No Operation Region); (5) daily energy saving (battery-to-wheel) due to wireless charging (kW h).
14 Z. Bi et al. / Applied Energy 146 (2015) 11–19
The plug-in charged battery can first be downsized due to wire-less charging availability at charging stations. Since the bus cancharge at each of those stations, it is reasonable for the bus to carrya smaller battery to travel the same distance than the plug-incharging scenario, which results in the primary capacity reduction.The battery capacity after primary capacity reduction (C1, kW h)can be calculated from Eq. (1) and Eq. (2), where E1 (kW h) is thetotal amount of electricity charged during operation hours, ei
(kW h) is the amount of electricity charged at charging stop i, Nis the total number of stops where the bus stops for charging dur-ing the operation, g (%) is the average charging efficiency, P (kW) isthe charging power and T (hour) is the total amount of chargingtime at charging stops during the day. The SOCR for the wirelesslycharged battery is the same as that of the plug-in charged battery(60%). The battery weight (kg) can be calculated by dividing thebattery capacity (kW h) by the battery specific energy (0.13 kW hper kg of Li-ion battery) [29]. Therefore, the percentage of vehiclemass reduction due to primary downsizing can be determined,relative to a bus of 15 t, comprising the assumed curb weight of14 t [4] and the constant average weight of 1 t for driver, passen-gers and cargo [30]. Fluctuation of ridership is not considered.
E1 ¼XN
i¼1
ei ¼ gPT ð1Þ
C1 ¼OR� E1
SOCRð2Þ
Vehicle lightweighting due to the primary battery downsizingwill improve the fuel economy, which means the electricity in awirelessly charged battery will deplete more slowly than a plug-in charged battery (|k2| < |k1|). The ECR of a wirelessly chargedbus, k2 (kW h/km), can be determined by the lightweighting corre-lation. For a sedan, 10% vehicle mass reduction results in a 6–8%use-phase energy reduction for an Internal Combustion Engine
Vehicle (ICEV) and 4–7% for many EV types and models [31,32].The EVs are less sensitive to the mass-induced energy consumptionreduction due to the regenerative braking and higher powertrainefficiency [33], so the percentage change in energy consumptionof EV is slightly lower than that of ICEV. For a bus, 10% vehicle massreduction results in about 5% energy reduction for a conventionalbus in the Autonomie model [34]. However, the lightweightingcorrelation of an all-electric bus is not available. The percentagechange in energy consumption of an electric bus is assumed tobe 10% lower than that of a conventional bus, thus 4.5% energyreduction per 10% vehicle mass reduction for a pure electric busis assumed for the baseline case. This assumption is further ana-lyzed in the sensitivity analysis section. A lighter bus will consumeless energy to cover its daily travel distance, which results in thesecondary downsizing of the battery. The energy saving (E2,kW h) related to secondary downsizing can be calculated fromEq. (3), where DTD (km) is the daily travel distance.
E2 ¼ jk1 � k2jDTD ð3Þ
Deducting primary (E1, kW h) and secondary (E2, kW h) capacityreductions from the OR (kW h) of the plug-in charged battery, theminimum electricity needed at the start of day for a wirelesslycharged battery can be quantified. Dividing this value by the SOCR(60%), the capacity of a wirelessly charged battery (C2, kW h),including the OSM, RSC and NOR, can be quantified. Dividing thebattery capacity C2 (kW h) by the battery specific energy (kW h/kg), the final weight (kg) of the wirelessly charged battery can bedetermined. The fuel economy can be further improved, which willfurther downsize the battery. Further iterations of fuel economyand battery downsizing are smaller compared to primary and sec-ondary effects, and so are ignored in this model, which results in aconservative estimate for the wirelessly charged battery.
Z. Bi et al. / Applied Energy 146 (2015) 11–19 15
The lithium-ion battery with LiMn2O4 (LMO) cathode materialis used to model both plug-in and wirelessly charged batteries.LMO was chosen because of its well established life cycle invento-ry, lower cost and abundance of manganese in nature [35,36]. Thecradle-to-gate energy and GHG emissions are modeled as 75 MJ/kgbattery and 5.1 kg CO2-eq/kg battery, according to a process LCAstudy of LMO batteries for electric vehicles that is specific to theUnited States [29]. When the OSM is 5%, RSC is 15% and NOR is20%, the SOCR is 60% with the state of charge (SOC, %) assumedto swing around 35–95% for both plug-in and wirelessly chargedbatteries [28]. The cycle life of battery is assumed to be 3000cycles, based on the general performance of lithium-ion batteries[5,26,37]. For a wirelessly charged battery, the multiple wirelesscharges during daily operation, however, are assumed to have neg-ligible effect on the battery life. Therefore, for both plug-in andwirelessly charged batteries, energy depleting from 95% to 35%SOC during the operation and charging back to 95% overnight areassumed to represent one cycle.
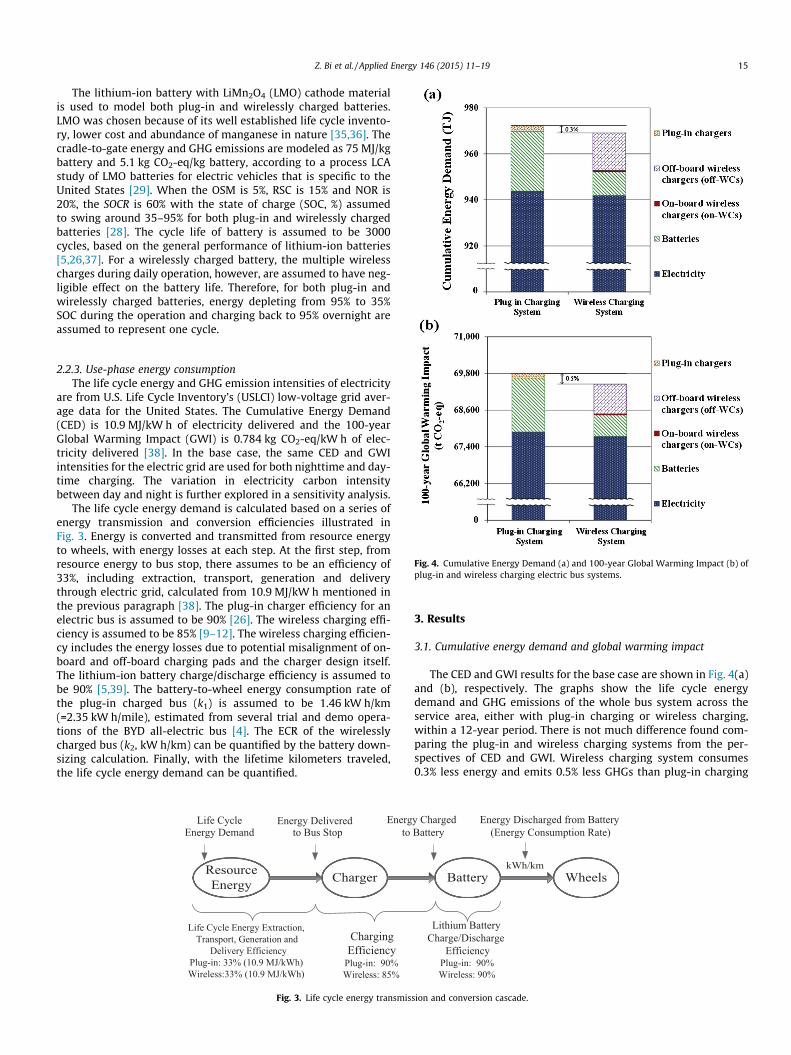
Fig. 4. Cumulative Energy Demand (a) and 100-year Global Warming Impact (b) ofplug-in and wireless charging electric bus systems.
2.2.3. Use-phase energy consumptionThe life cycle energy and GHG emission intensities of electricity
are from U.S. Life Cycle Inventory’s (USLCI) low-voltage grid aver-age data for the United States. The Cumulative Energy Demand(CED) is 10.9 MJ/kW h of electricity delivered and the 100-yearGlobal Warming Impact (GWI) is 0.784 kg CO2-eq/kW h of elec-tricity delivered [38]. In the base case, the same CED and GWIintensities for the electric grid are used for both nighttime and day-time charging. The variation in electricity carbon intensitybetween day and night is further explored in a sensitivity analysis.
The life cycle energy demand is calculated based on a series ofenergy transmission and conversion efficiencies illustrated inFig. 3. Energy is converted and transmitted from resource energyto wheels, with energy losses at each step. At the first step, fromresource energy to bus stop, there assumes to be an efficiency of33%, including extraction, transport, generation and deliverythrough electric grid, calculated from 10.9 MJ/kW h mentioned inthe previous paragraph [38]. The plug-in charger efficiency for anelectric bus is assumed to be 90% [26]. The wireless charging effi-ciency is assumed to be 85% [9–12]. The wireless charging efficien-cy includes the energy losses due to potential misalignment of on-board and off-board charging pads and the charger design itself.The lithium-ion battery charge/discharge efficiency is assumed tobe 90% [5,39]. The battery-to-wheel energy consumption rate ofthe plug-in charged bus (k1) is assumed to be 1.46 kW h/km(=2.35 kW h/mile), estimated from several trial and demo opera-tions of the BYD all-electric bus [4]. The ECR of the wirelesslycharged bus (k2, kW h/km) can be quantified by the battery down-sizing calculation. Finally, with the lifetime kilometers traveled,the life cycle energy demand can be quantified.
ResourceEnergy Charger
Life Cycle Energy Extraction, Transport, Generation and
Delivery EfficiencyPlug-in: 33% (10.9 MJ/kWh) Wireless:33% (10.9 MJ/kWh)
Charging Efficiency
Plug-in: 90%Wireless: 85%
Energy Delivered to Bus Stop
Energto Energy Demand
Life Cycle
Fig. 3. Life cycle energy transmis
3. Results
3.1. Cumulative energy demand and global warming impact
The CED and GWI results for the base case are shown in Fig. 4(a)and (b), respectively. The graphs show the life cycle energydemand and GHG emissions of the whole bus system across theservice area, either with plug-in charging or wireless charging,within a 12-year period. There is not much difference found com-paring the plug-in and wireless charging systems from the per-spectives of CED and GWI. Wireless charging system consumes0.3% less energy and emits 0.5% less GHGs than plug-in charging
Battery Wheels
Lithium BatteryCharge/Discharge
EfficiencyPlug-in: 90%Wireless: 90%
kWh/km
Energy Discharged from Battery (Energy Consumption Rate)
y Charged Battery
sion and conversion cascade.
3525
1546 1546
948
1.46
1.38 1.381.36
1.34
1.36
1.38
1.40
1.42
1.44
1.46
1.48
0
500
1000
1500
2000
2500
3000
3500
4000
Plug-in Bus Wireless Bus(Blue Route)
Wireless Bus(Green Route)
Wireless Bus(Red Route)
Ene
rgy
Con
sum
ptio
n R
ate
(kW
h/km
)
Bus
Bat
tery
Wei
ght (
kg)
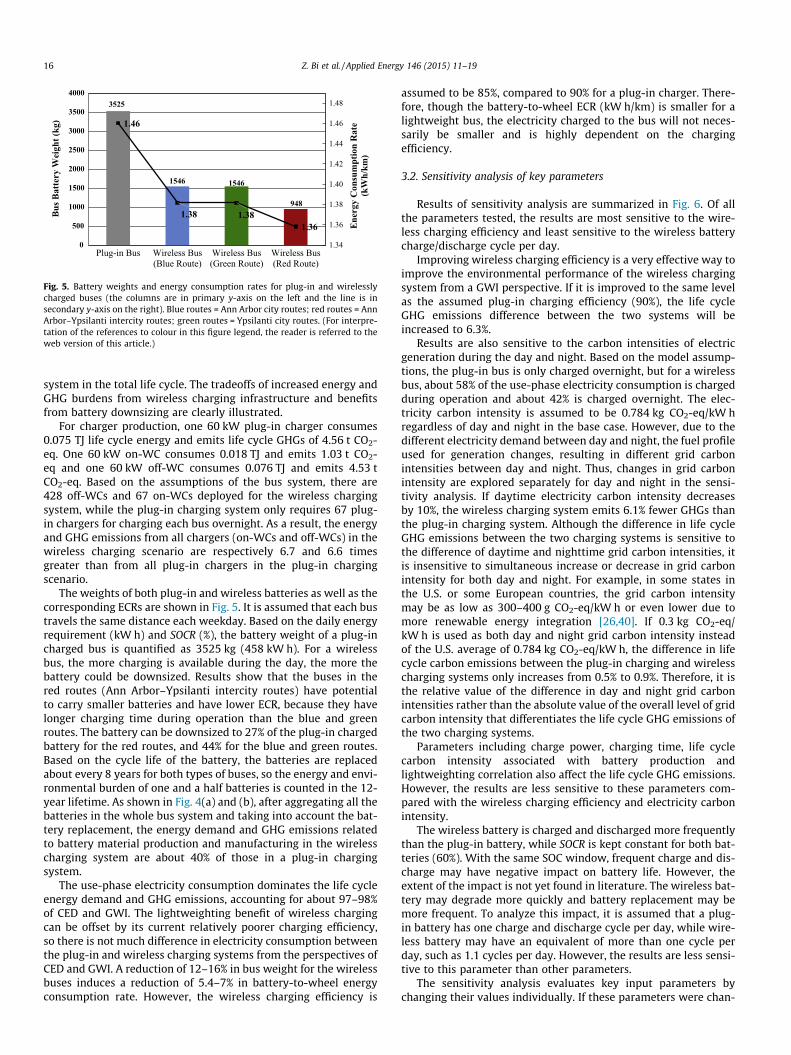
Fig. 5. Battery weights and energy consumption rates for plug-in and wirelesslycharged buses (the columns are in primary y-axis on the left and the line is insecondary y-axis on the right). Blue routes = Ann Arbor city routes; red routes = AnnArbor–Ypsilanti intercity routes; green routes = Ypsilanti city routes. (For interpre-tation of the references to colour in this figure legend, the reader is referred to theweb version of this article.)
16 Z. Bi et al. / Applied Energy 146 (2015) 11–19
system in the total life cycle. The tradeoffs of increased energy andGHG burdens from wireless charging infrastructure and benefitsfrom battery downsizing are clearly illustrated.
For charger production, one 60 kW plug-in charger consumes0.075 TJ life cycle energy and emits life cycle GHGs of 4.56 t CO2-eq. One 60 kW on-WC consumes 0.018 TJ and emits 1.03 t CO2-eq and one 60 kW off-WC consumes 0.076 TJ and emits 4.53 tCO2-eq. Based on the assumptions of the bus system, there are428 off-WCs and 67 on-WCs deployed for the wireless chargingsystem, while the plug-in charging system only requires 67 plug-in chargers for charging each bus overnight. As a result, the energyand GHG emissions from all chargers (on-WCs and off-WCs) in thewireless charging scenario are respectively 6.7 and 6.6 timesgreater than from all plug-in chargers in the plug-in chargingscenario.
The weights of both plug-in and wireless batteries as well as thecorresponding ECRs are shown in Fig. 5. It is assumed that each bustravels the same distance each weekday. Based on the daily energyrequirement (kW h) and SOCR (%), the battery weight of a plug-incharged bus is quantified as 3525 kg (458 kW h). For a wirelessbus, the more charging is available during the day, the more thebattery could be downsized. Results show that the buses in thered routes (Ann Arbor–Ypsilanti intercity routes) have potentialto carry smaller batteries and have lower ECR, because they havelonger charging time during operation than the blue and greenroutes. The battery can be downsized to 27% of the plug-in chargedbattery for the red routes, and 44% for the blue and green routes.Based on the cycle life of the battery, the batteries are replacedabout every 8 years for both types of buses, so the energy and envi-ronmental burden of one and a half batteries is counted in the 12-year lifetime. As shown in Fig. 4(a) and (b), after aggregating all thebatteries in the whole bus system and taking into account the bat-tery replacement, the energy demand and GHG emissions relatedto battery material production and manufacturing in the wirelesscharging system are about 40% of those in a plug-in chargingsystem.
The use-phase electricity consumption dominates the life cycleenergy demand and GHG emissions, accounting for about 97–98%of CED and GWI. The lightweighting benefit of wireless chargingcan be offset by its current relatively poorer charging efficiency,so there is not much difference in electricity consumption betweenthe plug-in and wireless charging systems from the perspectives ofCED and GWI. A reduction of 12–16% in bus weight for the wirelessbuses induces a reduction of 5.4–7% in battery-to-wheel energyconsumption rate. However, the wireless charging efficiency is
assumed to be 85%, compared to 90% for a plug-in charger. There-fore, though the battery-to-wheel ECR (kW h/km) is smaller for alightweight bus, the electricity charged to the bus will not neces-sarily be smaller and is highly dependent on the chargingefficiency.
3.2. Sensitivity analysis of key parameters
Results of sensitivity analysis are summarized in Fig. 6. Of allthe parameters tested, the results are most sensitive to the wire-less charging efficiency and least sensitive to the wireless batterycharge/discharge cycle per day.
Improving wireless charging efficiency is a very effective way toimprove the environmental performance of the wireless chargingsystem from a GWI perspective. If it is improved to the same levelas the assumed plug-in charging efficiency (90%), the life cycleGHG emissions difference between the two systems will beincreased to 6.3%.
Results are also sensitive to the carbon intensities of electricgeneration during the day and night. Based on the model assump-tions, the plug-in bus is only charged overnight, but for a wirelessbus, about 58% of the use-phase electricity consumption is chargedduring operation and about 42% is charged overnight. The elec-tricity carbon intensity is assumed to be 0.784 kg CO2-eq/kW hregardless of day and night in the base case. However, due to thedifferent electricity demand between day and night, the fuel profileused for generation changes, resulting in different grid carbonintensities between day and night. Thus, changes in grid carbonintensity are explored separately for day and night in the sensi-tivity analysis. If daytime electricity carbon intensity decreasesby 10%, the wireless charging system emits 6.1% fewer GHGs thanthe plug-in charging system. Although the difference in life cycleGHG emissions between the two charging systems is sensitive tothe difference of daytime and nighttime grid carbon intensities, itis insensitive to simultaneous increase or decrease in grid carbonintensity for both day and night. For example, in some states inthe U.S. or some European countries, the grid carbon intensitymay be as low as 300–400 g CO2-eq/kW h or even lower due tomore renewable energy integration [26,40]. If 0.3 kg CO2-eq/kW h is used as both day and night grid carbon intensity insteadof the U.S. average of 0.784 kg CO2-eq/kW h, the difference in lifecycle carbon emissions between the plug-in charging and wirelesscharging systems only increases from 0.5% to 0.9%. Therefore, it isthe relative value of the difference in day and night grid carbonintensities rather than the absolute value of the overall level of gridcarbon intensity that differentiates the life cycle GHG emissions ofthe two charging systems.
Parameters including charge power, charging time, life cyclecarbon intensity associated with battery production andlightweighting correlation also affect the life cycle GHG emissions.However, the results are less sensitive to these parameters com-pared with the wireless charging efficiency and electricity carbonintensity.
The wireless battery is charged and discharged more frequentlythan the plug-in battery, while SOCR is kept constant for both bat-teries (60%). With the same SOC window, frequent charge and dis-charge may have negative impact on battery life. However, theextent of the impact is not yet found in literature. The wireless bat-tery may degrade more quickly and battery replacement may bemore frequent. To analyze this impact, it is assumed that a plug-in battery has one charge and discharge cycle per day, while wire-less battery may have an equivalent of more than one cycle perday, such as 1.1 cycles per day. However, the results are less sensi-tive to this parameter than other parameters.
The sensitivity analysis evaluates key input parameters bychanging their values individually. If these parameters were chan-
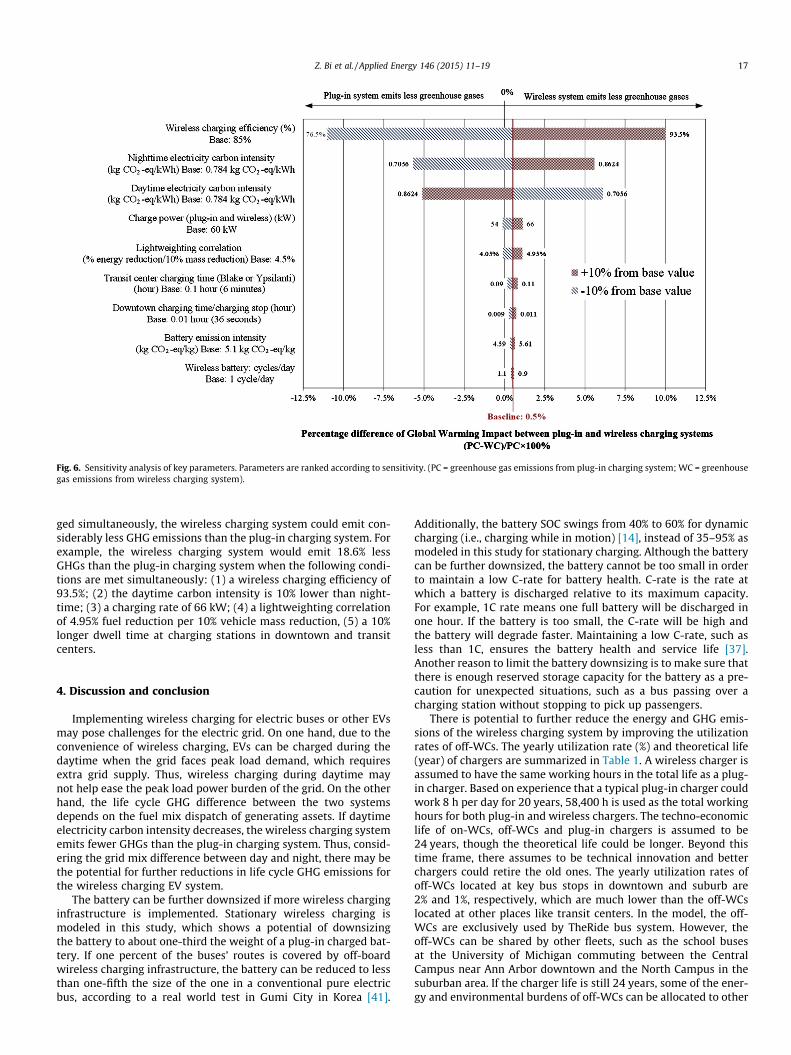
Fig. 6. Sensitivity analysis of key parameters. Parameters are ranked according to sensitivity. (PC = greenhouse gas emissions from plug-in charging system; WC = greenhousegas emissions from wireless charging system).
Z. Bi et al. / Applied Energy 146 (2015) 11–19 17
ged simultaneously, the wireless charging system could emit con-siderably less GHG emissions than the plug-in charging system. Forexample, the wireless charging system would emit 18.6% lessGHGs than the plug-in charging system when the following condi-tions are met simultaneously: (1) a wireless charging efficiency of93.5%; (2) the daytime carbon intensity is 10% lower than night-time; (3) a charging rate of 66 kW; (4) a lightweighting correlationof 4.95% fuel reduction per 10% vehicle mass reduction, (5) a 10%longer dwell time at charging stations in downtown and transitcenters.
4. Discussion and conclusion
Implementing wireless charging for electric buses or other EVsmay pose challenges for the electric grid. On one hand, due to theconvenience of wireless charging, EVs can be charged during thedaytime when the grid faces peak load demand, which requiresextra grid supply. Thus, wireless charging during daytime maynot help ease the peak load power burden of the grid. On the otherhand, the life cycle GHG difference between the two systemsdepends on the fuel mix dispatch of generating assets. If daytimeelectricity carbon intensity decreases, the wireless charging systememits fewer GHGs than the plug-in charging system. Thus, consid-ering the grid mix difference between day and night, there may bethe potential for further reductions in life cycle GHG emissions forthe wireless charging EV system.
The battery can be further downsized if more wireless charginginfrastructure is implemented. Stationary wireless charging ismodeled in this study, which shows a potential of downsizingthe battery to about one-third the weight of a plug-in charged bat-tery. If one percent of the buses’ routes is covered by off-boardwireless charging infrastructure, the battery can be reduced to lessthan one-fifth the size of the one in a conventional pure electricbus, according to a real world test in Gumi City in Korea [41].
Additionally, the battery SOC swings from 40% to 60% for dynamiccharging (i.e., charging while in motion) [14], instead of 35–95% asmodeled in this study for stationary charging. Although the batterycan be further downsized, the battery cannot be too small in orderto maintain a low C-rate for battery health. C-rate is the rate atwhich a battery is discharged relative to its maximum capacity.For example, 1C rate means one full battery will be discharged inone hour. If the battery is too small, the C-rate will be high andthe battery will degrade faster. Maintaining a low C-rate, such asless than 1C, ensures the battery health and service life [37].Another reason to limit the battery downsizing is to make sure thatthere is enough reserved storage capacity for the battery as a pre-caution for unexpected situations, such as a bus passing over acharging station without stopping to pick up passengers.
There is potential to further reduce the energy and GHG emis-sions of the wireless charging system by improving the utilizationrates of off-WCs. The yearly utilization rate (%) and theoretical life(year) of chargers are summarized in Table 1. A wireless charger isassumed to have the same working hours in the total life as a plug-in charger. Based on experience that a typical plug-in charger couldwork 8 h per day for 20 years, 58,400 h is used as the total workinghours for both plug-in and wireless chargers. The techno-economiclife of on-WCs, off-WCs and plug-in chargers is assumed to be24 years, though the theoretical life could be longer. Beyond thistime frame, there assumes to be technical innovation and betterchargers could retire the old ones. The yearly utilization rates ofoff-WCs located at key bus stops in downtown and suburb are2% and 1%, respectively, which are much lower than the off-WCslocated at other places like transit centers. In the model, the off-WCs are exclusively used by TheRide bus system. However, theoff-WCs can be shared by other fleets, such as the school busesat the University of Michigan commuting between the CentralCampus near Ann Arbor downtown and the North Campus in thesuburban area. If the charger life is still 24 years, some of the ener-gy and environmental burdens of off-WCs can be allocated to other
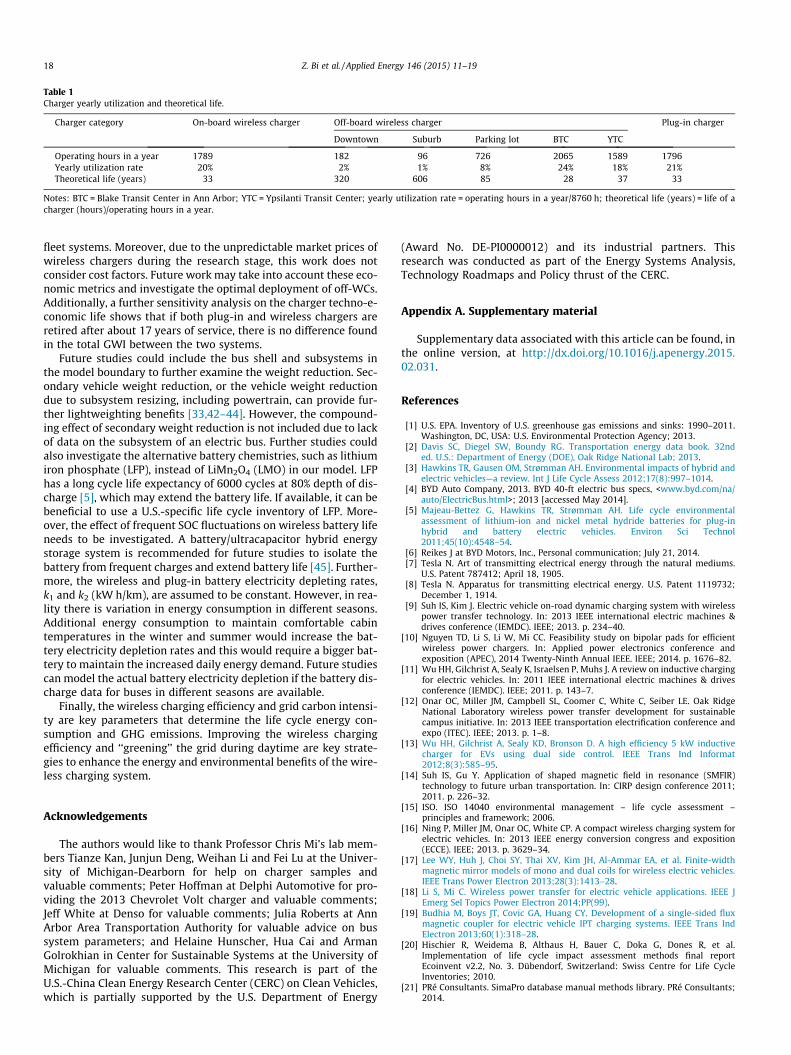
Table 1Charger yearly utilization and theoretical life.
Charger category On-board wireless charger Off-board wireless charger Plug-in charger
Downtown Suburb Parking lot BTC YTC
Operating hours in a year 1789 182 96 726 2065 1589 1796Yearly utilization rate 20% 2% 1% 8% 24% 18% 21%Theoretical life (years) 33 320 606 85 28 37 33
Notes: BTC = Blake Transit Center in Ann Arbor; YTC = Ypsilanti Transit Center; yearly utilization rate = operating hours in a year/8760 h; theoretical life (years) = life of acharger (hours)/operating hours in a year.
18 Z. Bi et al. / Applied Energy 146 (2015) 11–19
fleet systems. Moreover, due to the unpredictable market prices ofwireless chargers during the research stage, this work does notconsider cost factors. Future work may take into account these eco-nomic metrics and investigate the optimal deployment of off-WCs.Additionally, a further sensitivity analysis on the charger techno-e-conomic life shows that if both plug-in and wireless chargers areretired after about 17 years of service, there is no difference foundin the total GWI between the two systems.
Future studies could include the bus shell and subsystems inthe model boundary to further examine the weight reduction. Sec-ondary vehicle weight reduction, or the vehicle weight reductiondue to subsystem resizing, including powertrain, can provide fur-ther lightweighting benefits [33,42–44]. However, the compound-ing effect of secondary weight reduction is not included due to lackof data on the subsystem of an electric bus. Further studies couldalso investigate the alternative battery chemistries, such as lithiumiron phosphate (LFP), instead of LiMn2O4 (LMO) in our model. LFPhas a long cycle life expectancy of 6000 cycles at 80% depth of dis-charge [5], which may extend the battery life. If available, it can bebeneficial to use a U.S.-specific life cycle inventory of LFP. More-over, the effect of frequent SOC fluctuations on wireless battery lifeneeds to be investigated. A battery/ultracapacitor hybrid energystorage system is recommended for future studies to isolate thebattery from frequent charges and extend battery life [45]. Further-more, the wireless and plug-in battery electricity depleting rates,k1 and k2 (kW h/km), are assumed to be constant. However, in rea-lity there is variation in energy consumption in different seasons.Additional energy consumption to maintain comfortable cabintemperatures in the winter and summer would increase the bat-tery electricity depletion rates and this would require a bigger bat-tery to maintain the increased daily energy demand. Future studiescan model the actual battery electricity depletion if the battery dis-charge data for buses in different seasons are available.
Finally, the wireless charging efficiency and grid carbon intensi-ty are key parameters that determine the life cycle energy con-sumption and GHG emissions. Improving the wireless chargingefficiency and ‘‘greening’’ the grid during daytime are key strate-gies to enhance the energy and environmental benefits of the wire-less charging system.
Acknowledgements
The authors would like to thank Professor Chris Mi’s lab mem-bers Tianze Kan, Junjun Deng, Weihan Li and Fei Lu at the Univer-sity of Michigan-Dearborn for help on charger samples andvaluable comments; Peter Hoffman at Delphi Automotive for pro-viding the 2013 Chevrolet Volt charger and valuable comments;Jeff White at Denso for valuable comments; Julia Roberts at AnnArbor Area Transportation Authority for valuable advice on bussystem parameters; and Helaine Hunscher, Hua Cai and ArmanGolrokhian in Center for Sustainable Systems at the University ofMichigan for valuable comments. This research is part of theU.S.-China Clean Energy Research Center (CERC) on Clean Vehicles,which is partially supported by the U.S. Department of Energy
(Award No. DE-PI0000012) and its industrial partners. Thisresearch was conducted as part of the Energy Systems Analysis,Technology Roadmaps and Policy thrust of the CERC.
Appendix A. Supplementary material
Supplementary data associated with this article can be found, inthe online version, at http://dx.doi.org/10.1016/j.apenergy.2015.02.031.
References
[1] U.S. EPA. Inventory of U.S. greenhouse gas emissions and sinks: 1990–2011.Washington, DC, USA: U.S. Environmental Protection Agency; 2013.
[2] Davis SC, Diegel SW, Boundy RG. Transportation energy data book. 32nded. U.S.: Department of Energy (DOE), Oak Ridge National Lab; 2013.
[3] Hawkins TR, Gausen OM, Strømman AH. Environmental impacts of hybrid andelectric vehicles—a review. Int J Life Cycle Assess 2012;17(8):997–1014.
[4] BYD Auto Company, 2013. BYD 40-ft electric bus specs, <www.byd.com/na/auto/ElectricBus.html>; 2013 [accessed May 2014].
[5] Majeau-Bettez G, Hawkins TR, Strømman AH. Life cycle environmentalassessment of lithium-ion and nickel metal hydride batteries for plug-inhybrid and battery electric vehicles. Environ Sci Technol2011;45(10):4548–54.
[6] Reikes J at BYD Motors, Inc., Personal communication; July 21, 2014.[7] Tesla N. Art of transmitting electrical energy through the natural mediums.
U.S. Patent 787412; April 18, 1905.[8] Tesla N. Apparatus for transmitting electrical energy. U.S. Patent 1119732;
December 1, 1914.[9] Suh IS, Kim J. Electric vehicle on-road dynamic charging system with wireless
power transfer technology. In: 2013 IEEE international electric machines &drives conference (IEMDC). IEEE; 2013. p. 234–40.
[10] Nguyen TD, Li S, Li W, Mi CC. Feasibility study on bipolar pads for efficientwireless power chargers. In: Applied power electronics conference andexposition (APEC), 2014 Twenty-Ninth Annual IEEE. IEEE; 2014. p. 1676–82.
[11] Wu HH, Gilchrist A, Sealy K, Israelsen P, Muhs J. A review on inductive chargingfor electric vehicles. In: 2011 IEEE international electric machines & drivesconference (IEMDC). IEEE; 2011. p. 143–7.
[12] Onar OC, Miller JM, Campbell SL, Coomer C, White C, Seiber LE. Oak RidgeNational Laboratory wireless power transfer development for sustainablecampus initiative. In: 2013 IEEE transportation electrification conference andexpo (ITEC). IEEE; 2013. p. 1–8.
[13] Wu HH, Gilchrist A, Sealy KD, Bronson D. A high efficiency 5 kW inductivecharger for EVs using dual side control. IEEE Trans Ind Informat2012;8(3):585–95.
[14] Suh IS, Gu Y. Application of shaped magnetic field in resonance (SMFIR)technology to future urban transportation. In: CIRP design conference 2011;2011. p. 226–32.
[15] ISO. ISO 14040 environmental management – life cycle assessment –principles and framework; 2006.
[16] Ning P, Miller JM, Onar OC, White CP. A compact wireless charging system forelectric vehicles. In: 2013 IEEE energy conversion congress and exposition(ECCE). IEEE; 2013. p. 3629–34.
[17] Lee WY, Huh J, Choi SY, Thai XV, Kim JH, Al-Ammar EA, et al. Finite-widthmagnetic mirror models of mono and dual coils for wireless electric vehicles.IEEE Trans Power Electron 2013;28(3):1413–28.
[18] Li S, Mi C. Wireless power transfer for electric vehicle applications. IEEE JEmerg Sel Topics Power Electron 2014;PP(99).
[19] Budhia M, Boys JT, Covic GA, Huang CY. Development of a single-sided fluxmagnetic coupler for electric vehicle IPT charging systems. IEEE Trans IndElectron 2013;60(1):318–28.
[20] Hischier R, Weidema B, Althaus H, Bauer C, Doka G, Dones R, et al.Implementation of life cycle impact assessment methods final reportEcoinvent v2.2, No. 3. Dübendorf, Switzerland: Swiss Centre for Life CycleInventories; 2010.
[21] PRé Consultants. SimaPro database manual methods library. PRé Consultants;2014.
Z. Bi et al. / Applied Energy 146 (2015) 11–19 19
[22] IPCC. Climate change 2013: the physical science basis working group Icontribution to the fifth assessment report of the Intergovernmental Panel onClimate Change. The Intergovernmental Panel on Climate Change (IPCC); 2013.
[23] Ann Arbor Area Transportation Authority. Route schedules and maps (Winter2014, effective January 26, 2014–May 3, 2014). Michigan, USA: Ann Arbor AreaTransportation Authority; 2014.
[24] Batterman J, Homa B, Hori S, Jongsma K, Li M, Mani G, et al. Let’s roll:reimagining transit on Washtenaw Avenue. Michigan, United States: TaubmanCollege of Architecture & Urban Planning, University of Michigan; 2012.
[25] Clark NN, Zhen F, Wayne WS, Lyons DW. Transit bus life cycle cost and year2007 emissions estimation. Washington, DC, USA: Federal TransitAdministration; 2007.
[26] Cooney G, Hawkins TR, Marriott J. Life cycle assessment of diesel and electricpublic transportation buses. J Ind Ecology 2013;17(5):689–99.
[27] Goedkoop M, Oele M, Leijting J, Ponsioen T, Meijer E. Introduction to LCA withSimaPro. PRé Consultants; 2013.
[28] Marano V, Onori S, Guezennec Y, Rizzoni G, Madella N. Lithium-ion batterieslife estimation for plug-in hybrid electric vehicles. In: IEEE vehicle power andpropulsion conference, 2009 VPPC’09 IEEE; 2009. p. 536–43.
[29] Dunn JB, Gaines L, Sullivan J, Wang MQ. Impact of recycling on cradle-to-gateenergy consumption and greenhouse gas emissions of automotive lithium-ionbatteries. Environ Sci Technol 2012;46(22):12704–10.
[30] U.S. Department of Transportation. 2013 status of the nation’s highways,bridges, and transit: conditions & performance. U.S. Department ofTransportation Federal Highway Administration & Federal TransitAdministration; 2013.
[31] Kim HC at Ford Motor Company. Personal communication; March 25, 2014.[32] Kim HC, Wallington TJ. Life cycle assessment of vehicle lightweighting: a
physics-based model of mass-induced fuel consumption. Environ Sci Technol2013;47(24):14358–66.
[33] Lewis AM, Kelly JC, Keoleian GA. Vehicle lightweighting vs. electrification: lifecycle energy and GHG emissions results for diverse powertrain vehicles. ApplEnergy 2014;126:13–20.
[34] Argonne National Laboratory. Autonomie. UChicago Argonne, LLC; 2009.[35] Dunn JB, Gaines L, Barnes M, Sullivan J, Wang M. Material and energy flows in
the materials production, assembly, and end-of-life stages of the automotivelithium-ion battery life cycle. Argonne National Laboratory; 2012.
[36] Notter DA, Gauch M, Widmer R, Wager P, Stamp A, Zah R, et al. Contribution ofLi-ion batteries to the environmental impact of electric vehicles. Environ SciTechnol 2010;44(17):6550–6.
[37] Xu B, Andersson G, Oudalov A, Ulbig A. Degradation-limiting optimization ofbattery energy storage systems operation: ETH Zurich; 2013.
[38] National Renewable Energy Laboratory. U.S. LCI database project – user’sguide. Golden, CO, USA: NREL; 2004.
[39] Zackrisson M, Avellán L, Orlenius J. Life cycle assessment of lithium-ionbatteries for plug-in hybrid electric vehicles–critical issues. J Clean Prod2010;18(15):1519–29.
[40] Doucette RT, McCulloch MD. Modeling the CO2 emissions from battery electricvehicles given the power generation mixes of different countries. EnergyPolicy 2011;39:803–11.
[41] Thornton J. Pulling power from the road: charged by the route it follows, anelectric bus gets a real world test. Mech Eng ASME 2014:44–9.
[42] Lewis AM. The potential of lightweight materials and advanced engines toreduce life cycle energy and greenhouse gas emissions for ICVs and EVs usingdesign harmonization techniques. University of Michigan; 2013.
[43] Shiau CSN, Samaras C, Hauffe R, Michalek JJ. Impact of battery weight andcharging patterns on the economic and environmental benefits of plug-inhybrid vehicles. Energy Policy 2009;37(7):2653–63.
[44] Wohlecker R, Johannaber M, Espig M. Determination of weight elasticity offuel economy for ICE, hybrid and fuel cell vehicles. SAE Technical Paper 2007–01-0343; 2007.
[45] Cao J, Emadi A. A new battery/ultra-capacitor hybrid energy storage system forelectric, hybrid and plug-in hybrid electric vehicles. In: IEEE vehicle power andpropulsion conference, 2009 VPPC ‘09. IEEE; 2009. p. 941–6.
Glossary
CED: Cumulative Energy DemandDTD (km): daily travel distanceECR: energy consumption rate (kW h/km)EV: electric vehicleGHGs: Greenhouse GasesGWI: Global Warming ImpactICEV: internal combustion engine vehicleLCA: Life Cycle AssessmentLFP: lithium iron phosphateLMO: LiMn2O4
NOR: No Operation Regionoff-WC: off-board portion of the wireless charger (installed on the ground)on-WC: on-board portion of the wireless chargerOR: Operating RegionOSM: Overcharge Safety MarginPC: plug-in chargerRSC: Reserved Storage CapacitySOC: state of charge (%)SOCR (%): the percentage of the OR (kW h) relative to the whole capacity of a new
battery (kW h)WPT: Wireless Power Transfer