Polysaccharide-Rich Red Algae (Gelidium amansii) Hot-Water ...
Upload
rui-santosCategory
view
217download
0
Hydrobiologia 260/261: 269-276, 1993.A. R. O. Chapman, M. T. Brown & M. Lahaye (eds), Fourteenth International Seaweed Symposium.© 1993 Kluwer Academic Publishers. Printed in Belgium.
269
Plucking or cutting Gelidium sesquipedale? A demographic simulationof harvest impact using a population projection matrix model.
Rui SantosLaborat6rio Nacional de Engenharia e Tecnologia Industrial, Departamento de Estudos de ImpacteIndustrial, Estrada do Paco do Lumiar, Azinhaga dos Lameiros, 1600 Lisboa, Portugal. Present Address:Halifax Fisheries Research Laboratory, P.O. Box 550, Halifax, Nova Scotia, B3J 2S7, Canada
Key words: Gelidium sesquipedale; population dynamics; demography; matrix models; size classes;harvest; seaweed
Abstract
A matrix model describes the annual dynamics of a commercial (harvested by plucking) Gelidiumsesquipedale population off Cape Espichel, Portugal. Vital rates were measured from a frond populationdivided into size classes; annual transition probabilities among them were calculated. Transition prob-abilities under harvest by cutting are derived by assuming that all harvested fronds are cut to the firstsize class, and none are plucked. Simulations of the annual population dynamics for harvest by bothplucking and cutting are used to assess which harvest strategy will optimize yields. Assuming the sameefficiency for both strategies, cutting fronds to 7 cm (as mechanical harvesters do) results in a higherpopulation growth rate ( = 1.08 to 1.35) than occurs with the plucking technique ( = 0.85). Simulationsof population recovery show the number of fronds in each size class available the next harvest seasonwill be higher when cut than plucked. This model can also optimize yields by predicting the more effi-cient season opening, and harvesting cutting height.
Introduction
The subtidal agarophyte Gelidium sesquipedale hasbeen commercially harvested along the coasts ofSpain, Portugal and Morocco mainly by twomethods; gathering storm tossed fronds, and bydirectly hand-plucking fronds (Palminha, 1971;De Craene, 1971; Juanes & Borja, 1991). InSpain, most of the harvest yield is storm tossed.This technique has no direct impact on the pop-ulation dynamics, but is very inefficient. Only 18to 35 % of the cast off is recovered (Borja, 1987).An other disadvantage of this method is the lowand unpredictable quality of the harvest. G. ses-quipedale is mixed with sand and other seaweedspecies, which greatly influences the agar yield of
the harvest (Santos, R., J. M. Gorostiaga, R.Armis6n, J. M. Salinas & J. C. Oliveira, unpub-lished manuscript).
Hand-plucking by divers has been the mainsource of raw material in Portugal since the 1960s.Overharvesting of some beds has been observed(Santos & Duarte, 1991). Since 1990, mechanicaldevices are being used to harvest the seaweedfrom boats along Spain's Asturias and Cantabriacoasts (Santos, R., J. M. Gorostiaga, R. Armis6n,J. M. Salinas & J. C. Oliveira, unpublishedmanuscript). The machines apparently leave a4 cm to 8 cm stump and do not decrease fronddensity (Gorostiaga, pers. comm.). The relativeimpact of the two direct harvest methods on therecovery of populations is controversial, as evi-

270
denced in a recent meeting on Gelidium, amongharvesters, managers, scientists and representa-tives from industry (Juanes et al., 1991).
Experiments on recovery of G. sesquipedale,after plucking or cutting have yielded inconclu-sive results. Questions essential to choosing thebest harvest strategy have not been adequatelyaddressed. Seoane-Camba (1966) reported thatthe average annual growth of fronds in Vigo,Spain, cut to 1.5 to 3.2 cm was similar to thefronds tagged after experimental plucking. Yet, hegives no information on the size of the latterfronds, on the effect of frond size on growth, oron the population structures prior to and after theexperiments. Gorostiaga (1990), studying G. ses-quipedale on the Basque coast of Spain, testedtwo levels of each harvest strategy, measuring thebiomass and population structure of the harvestafter one, two and three years. He concluded thatmoderate cutting (8 cm) every two years was theharvest strategy that would maximize the harvestyield, but his experimental design was weak. Thetreatment effects were confounded by the annualbiomass variation, which was not controlled, noreplicates were used, and the experimental blockswere not randomly distributed.
In this study I attempt to discern which harveststrategy, plucking or cutting, will result in a bet-ter recovery of G. sesquipedale populations to thenext harvest season. A size-based matrix modelis constructed (Caswell, 1989; Ang & De Wreede,1990; Aberg, 1992). It contains the empiricallyderived vital rates of a G. sesquipedale populationcommercially exploited by hand-plucking. Thecutting vital rates of the population were calcu-lated from these data. The magnitude of the pop-ulation's recovery to the next harvest season isdetermined comparing predicted populationstructures. This approach allows the rapid as-sessment of the intrinsic mechanisms regulatingthe population recovery, rather by empiricalmeans through a long term study.
Methods
The study was conducted in the south edge of animportant Gelidium sesquipedale commercial bed
off Cape Espichel, Sesimbra, Portugal, where thespecies is most abundant (Santos, in press). Twoinclined surfaces of high G. sesquipedale cover(8 m to 12 m depth) that are characteristic of thiszone, were sampled monthly from September1989 to September 1990, except in the months ofNovember, December and February, when seaconditions did not permit diving.
As the species habit (Dixon, 1958; Fan, 1961)makes difficult the identification of physiologicallyseparated individuals (the genets sensu Harper,1977), the population demography was studied atthe frond level (erect axis), independently of theirorigin. Moreover, it is difficult to distinguishplants of the different life cycle phases as thetetrasporophytes and gametophytes are isomor-phic. A size-based matrix model was developed,rather than an age-based one, because the harvesteffort is selective for size rather than age. Fur-thermore, there is strong support for a stagebasedrather than age-based classification in plants, be-cause size is often a better predictor of populationvital rates (Caswell, 1989).
Frond mortality, growth and breakage werequantified by monitoring the number and lengthof 300 tagged (Sharp & Tremblay, 1985) frondshaphazardly selected through the study site, andcovering the size spectrum of the species. Frondsof less than 4 cm could not be tagged. Lost frondswere continuously replaced to maintain a statis-tically sound number of cases. The populationwas also sampled over the same period, by scrap-ing five 40 cm quadrats. Total recruitment (bothfrom vegetative growth and from spore germina-tion) was evaluated by combining data on growth,mortality, breakage and density variation of thefirst size class through time. Density increase ofthe first size class from one sample to another,after discounting all possible transitions due tomortality, growth to higher classes and frondbreakage to the first size class, was interpreted asrecruitment. In terms of the model, recruitment isthe number of new fronds per old frond in sizeclass x that will survive to the next time step andenter size class y. The details of demographic datawill be published elsewhere.
Six size classes were selected following Molo-

271
ney's (1986) algorithm: 1)4 to 10 cm, II) 11 to12 cm, III) 13 to 14 cm, IV) 15 to 22 cm, V) 23 to25 cm and VI) > 25 cm. Transition probabilitiesamong these size classes were calculated and ninematrices covering one year, were constructed. Aperiodic matrix product of these matrices wascalculated (Caswell, 1989). In the monthly matri-ces it was assumed that a frond will not growmore than 6 cm in one time step, and thereforerecruits will only enter the first size class (4 to10 cm). In the case of the annual product matrix,recruits may enter other size classes than the firstone.
High frond mortalities were observed duringharvest season (July/August and August/September), and interpreted as commercial har-vest of tagged fronds. The harvest season survi-vorship reflects both natural and harvestmortality. Therefore, the periodic matrix productdescribes the population annual dynamics underharvest by plucking. To simulate the cutting strat-egy, the two population projection matrices cor-responding to the harvest season were replacedby hypothetical values derived as follows, and thecorresponding product matrix was calculated forthe cutting situation.
Transition probabilities to higher size classes
The transition probabilities from the size class jto the size class i in the plucking case, Pp(i, j), canbe expressed as:
Pp(i,j) = (1 - M(')) * G(i,j) for i>j (1)
where M(j) is the total mortality (natural plusharvest) of class j and G(i, j) is the probability ofgrowing to the next size class in the time step ofone month.
Similarly in the cutting matrix, M() is the totalmortality, but here it is assumed there are noplucked fronds and thus M() is equal to the nat-ural mortality, Mn(j). In fact, the percentage ofplucked plants by the Spanish mechanical de-vices is less than 2%, (Gorostiaga, pers. comm.).Because estimates of class-specific natural mor-tality for the harvest season are unavailable
(tagged fronds were exposed to the harvest), Ihave assumed it to be equal to the mortalitiesobserved immediately before the harvest (June/July 1990). This may be a reasonable assumptionas environmental conditions are similar to thoseof the harvest season.
The transition probability to a higher size classin the cutting case, P(i, j), can then be derived asfollows:
P(i, j) = (1 - Mn(j)) * G(i, j)
G(i,j) = Pp(i,j)/(1 - M(j))
P(i, j) = (1 - Mn(j)) * [Pp(i,j)/(1 - M(j))]
from (1)
Transition probabilities to smaller size classes
Assuming the harvest occurs at the beginning ofeach time period, the transition probabilities fromsize class j to size class i can be expressed as:
P(i, j) = Bh(i,j) + B(i,j) * (1 - Bh(i, j))
for i<j
where Bh(i, j) is breakage caused by the harvestand Bn(i, j) is natural breakage, which will onlyact on fronds not broken by the harvest (1-Bh(i, j)).
Values of Bh(i, j) for cutting will depend on themechanical device used. The cutters of Asturiasand Cantabria, Spain, are height regulated atclass 1 fronds. The transition probabilities of anyclass j to class 1 can thus be expressed by:
P(1,j) = He(j) + Bn(1,j) * (1 - He(j))
for j>1
where He(j) is the harvest efficiency, i.e., the har-vest percentage of the harvestable population. Forpurposes of comparison between the two harveststrategies, the same harvest efficiency value wasconsidered. This variable was estimated as:
He(j) = Mp(j)/Mpmax(j )

272
where Mp(j) is the plucking mortality that actu-ally occurred in the two time periods (July/Augustand August/September) and Mpm,,() is the max-imum plucking mortality of each size class. Themaximum plucking mortality per size class wasexperimentally assessed by Santos (unpublisheddata): it is 0.54 for class I, 0.78 for class II, 0.89for class III, 0.95 for class IV, 0.99 for class Vand 1.0 for class VI. The plucking mortality, Mp(j)is calculated as follows (assuming that the harvestoccurs at the beginning of each time period):
MO) = Mp() + Mn(j)*(1 - Mpj))
Mp(j) = (M(j) - Mn(j))/( - Mn(j))
Assuming all cut fronds will now be in class 1,the transition probabilities of any class j to a lowerclass i different than one, are equal to the naturalbreakage Bn(i, j):
P(i,j) = Bn(i,j) for 1<i<j
As in the case of natural mortality, there is noindependent estimate of class specific naturalbreakage during the harvest season. Thus it willbe considered equal to that prior the harvest sea-son (June/July).
Probability of staying in the same size class
Since the total mortality of a size class j is thedifference from unity of the sum of all the possi-ble transitions from that class to another (includ-ing itself):
M(j) = 1 - P(i, j)
the probability of a frond staying in the same classin the time step, can be calculated as
P(j,j) = 1 - E P(i,j) - M(j) and i j
since it was assumed that cutting harvest does notpluck the plants, M(j) = Mn(j), and thus:
P(j,j) = 1 - E P(i,j) - Mn(j)
Results and discussion
Table 1 shows the annual product matrices usedto project the G. sesquipedale population underdifferent harvest strategies. The projection ma-trix A is the observed plucking situation, and itdescribes the annual dynamics of the population.Matrix cell values represent both the survivorshipand recruitment contributions. The transitionprobabilities among size classes without consid-ering recruitment are shown inside parentheses.Values in the diagonal represent the probabilitiesof a frond surviving and staying in the same sizeclass, the values above it represent the probabil-ities of surviving and breaking to a lower classand the values below it represent the probabilitiesof surviving and growing to a higher class. Annualsurvivorships are very low compared to values ofthe projection matrix including recruitment,showing the important effect of recruitment onthe population dynamics. The total survivorshipof size classes decreases with size; in the pluck-ing case, a first size class frond (4 to 10 cm) hasabout seven times more chances of surviving oneyear (p = 0.078) than a sixth size class frond(>25 cm, p = 0.011).
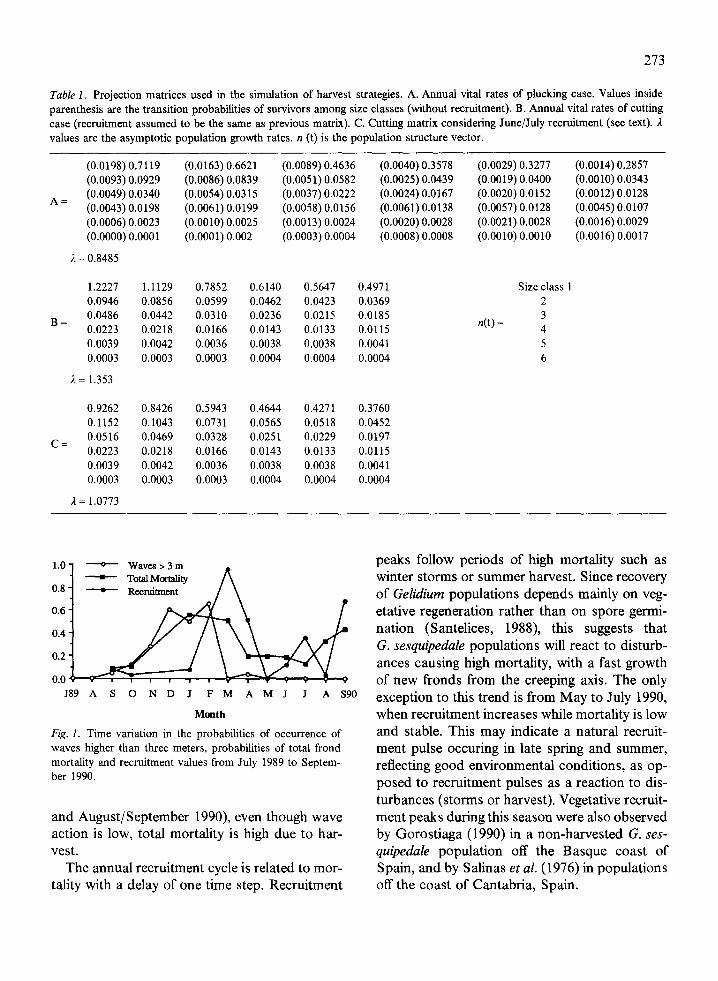
The principal eigenvalue of matrix A (Table 1)is the asymptotic population growth rate, (Caswell, 1989). Its value is lower than unity( = 0.85), indicating that if the vital rates remainconstant, the population will decrease to extinc-tion. In fact, sea conditions were unusually ad-verse. There were strong storms from Novemberto February with waves up to 7 meters high, caus-ing high frond mortalities (Fig. 1). This graphshows the probabilities of occurrence of waveshigher than 3 m at the study site.*Total mortalityprobability and recruitment values are also plot-ted. The annual cycle of mortality reflects thetrends of the wave dynamics, indicating a directrelationship between natural mortality and waveaction. During the harvest season (July/August
* Wave heights were estimated with the wave simulationmodel MAR211, from the Instituto Nacional de Meteorologiae Geofisica, Lisboa, Portugal.
273
Table 1. Projection matrices used in the simulation of harvest strategies. A. Annual vital rates of plucking case. Values insideparenthesis are the transition probabilities of survivors among size classes (without recruitment). B. Annual vital rates of cuttingcase (recruitment assumed to be the same as previous matrix). C. Cutting matrix considering June/July recruitment (see text). values are the asymptotic population growth rates. n (t) is the population structure vector.
(0.0198) 0.7119(0.0093) 0.0929(0.0049) 0.0340(0.0043) 0.0198(0.0006) 0.0023(0.0000) 0.0001
= 0.8485
(0.0163) 0.6621(0.0086) 0.0839(0.0054) 0.0315(0.0061) 0.0199(0.0010) 0.0025(0.0001) 0.002
(0.0089) 0.4636(0.0051) 0.0582(0.0037) 0.0222(0.0058) 0.0156(0.0013) 0.0024(0.0003) 0.0004
(0.0040) 0.3578(0.0025) 0.0439(0.0024) 0.0167(0.0061) 0.0138(0.0020) 0.0028(0.0008) 0.0008
(0.0029) 0.3277(0.0019) 0.0400(0.0020) 0.0152(0.0057) 0.0128(0.0021) 0.0028(0.0010) 0.0010
(0.0014) 0.2857(0.0010) 0.0343(0.0012) 0.0128(0.0045) 0.0107(0.0016) 0.0029(0.0016) 0.0017
Size class 123
n(t) = 456
J89 A S 0 N D J F M A M J J A S90
Month
Fig. 1. Time variation in the probabilities of occurrence ofwaves higher than three meters, probabilities of total frondmortality and recruitment values from July 1989 to Septem-ber 1990.
and August/September 1990), even though waveaction is low, total mortality is high due to har-vest.
The annual recruitment cycle is related to mor-tality with a delay of one time step. Recruitment
peaks follow periods of high mortality such aswinter storms or summer harvest. Since recoveryof Gelidium populations depends mainly on veg-etative regeneration rather than on spore germi-nation (Santelices, 1988), this suggests thatG. sesquipedale populations will react to disturb-ances causing high mortality, with a fast growthof new fronds from the creeping axis. The onlyexception to this trend is from May to July 1990,when recruitment increases while mortality is lowand stable. This may indicate a natural recruit-ment pulse occuring in late spring and summer,reflecting good environmental conditions, as op-posed to recruitment pulses as a reaction to dis-turbances (storms or harvest). Vegetative recruit-ment peaks during this season were also observedby Gorostiaga (1990) in a non-harvested G. ses-quipedale population off the Basque coast ofSpain, and by Salinas et al. (1976) in populationsoff the coast of Cantabria, Spain.
1.22270.09460.04860.02230.00390.0003
= 1.353
0.92620.11520.05160.02230.00390.0003
A= 1.0773
0.49710.03690.01850.01150.00410.0004
1.11290.08560.04420.02180.00420.0003
0.84260.10430.04690.02180.00420.0003
0.78520.05990.03100.01660.00360.0003
0.59430.07310.03280.01660.00360.0003
0.61400.04620.02360.01430.00380.0004
0.46440.05650.02510.01430.00380.0004
0.56470.04230.02150.01330.00380.0004
0.42710.05180.02290.01330.00380.0004
0.37600.04520.01970.01150.00410.0004
,

274
The hypothetical cutting situation where re-cruitment is assumed to be the same as in A(matrix B of Table 1) shows a much higher pop-ulation growth rate (A = 1.35) than the pluckingcase ( = 0.85). This suggests a population har-vested by cutting will recover much faster. Al-though, the recruitment values of matrix B arelikely to be overestimated. Harvest by cutting doesnot cause frond mortality, hence a recruit pulse isnot expected.
A good estimate of recruitment in the cuttingsituation is one that both reflects spring/summerenvironmental conditions and it is not disturbedby any strong decrease in density. Both recruit-ment values estimated prior to the harvest season,from May to June and June to July, seem ade-quate (see Fig. 1). Even selecting the lower ofthese values (May/June), the cutting simulation(matrix C of Fig. 1) indicates that this strategywill result in a higher population growth rate(A= 1.08) than the plucking strategy (A = 0.85).The recruitment value considered in this case islikely to be underestimated. The removal of thefronds of size classes higher than 1 increases theavailability of both light and nutrients to thesmaller fronds and prostrate axes, which mayfavor the production of new upright fronds.Therefore, the cutting matrices B and C containrespectively high and low estimates of recruit-ment.
Table 2 shows the September 1989 populationstructure, and the observed vs projected popula-
tion structures after 12 months. At this point, thealternative strategy of harvest by cutting (both Band C recruitment rates) was also simulated. Thepopulation structures prior to the start of the nextharvest season, resulting from 10 more months ofprojection, are also presented. In this second sim-ulation period it is assumed that the vital rates arethe same as those of the previous one.
Although the objective of this model is not topredict the absolute densities of G. sesquipedalesize classes, because of its density independence(see Caswell, 1989), its accuracy in describing theannual dynamics of this population was assessedby comparing the observed and projected sizeclass structures after 12 months of simulation(Sep/90, Table 2). Projected structures underes-timate size classes I to III, and overestimate sizeclasses IV to VI. Nevertheless, the model predictsa marked decrease of G. sesquipedale standingstock, suggested by the decrease of projectedfrond numbers, particularly of higher classes, after12 months (Sep/90, Table 2), and after 22 months(July /91-Plucking vector, Table 2). This projec-tion is validated both by the population structureobserved in Sep/90 (Table 2), and by the low har-vest landings in 1990 and 1991 compared with1989, respectively 817 t, 231 t and 1683 t (J. Ol-iveira pers. comm.).
The population structures projected to July/91suggest the population will recover better aftercutting than after plucking. Both cutting B and Cpopulation vectors show that higher densities of
Table 2. Column vectors of population structures (fronds per m2) before and after 12 and 22 months of simulation. Projectedpopulation structures of September 90 and July/91-Plucking were derived from matrix A. Cutting B and Cutting C were derivedfrom matrices B and C (Table 1).
Population structures
Sep/89 Sep/90 July/91
Initial Observed Projected Plucking Cutting B Cutting C
5268 6193 5313 4906 7849 62411130 1004 672 686 1097 872697 348 248 377 600 479
1038 110 152 209 329 26632 0 20 12 17 1516 0 2 1 2 2

275
all size classes would be available to the harvestthan in the plucking case (Table 2).
Conclusions
A general conclusion of this work is that theG. sesquipedale population studied would recoverfaster if the fronds were harvested by cutting toa length of about 7 cm (the middle of the first sizeclass) rather than it actually does after being har-vested by plucking. For all size classes, the num-ber of fronds available in the next harvest seasonwould be higher, and therefore better yields couldbe obtained. This supports the conclusions of theexperimental study done by Gorostiaga (1990) onthe Basque Coast, Spain. The model developedhere, can also be used to estimate the optimumtime to start G. sesquipedale harvest season, andthe optimum length to which the fronds should becut in order to maximize a sustainable harvestyield.
Based on the model assumptions, the develop-ment and use of mechanical harvesters may in-crease G. sesquipedale yields. Nevertheless, to de-cide if the harvest by plucking currently practicedin Portugal, should be replaced by a cutting strat-egy, other factors must be considered. A costanalysis of the investment (in time and money)necessary to harvest the same yield should bedone for both methods. Social and economic fac-tors should also be considered. Studies on theharvest efficiency of both methods and its impacton G. sesquipedale populations are needed. In thisstudy, the harvest efficiency of plucking and cut-ting was simply assumed to be the same, but theyare likely to be different. Also, different cuttingdevices have different harvest efficiencies. For ex-ample, the cutting of the fronds by divers usingshears does not seem an alternative to cuttingmachines as it is most likely very inefficient intime.
It is my belief that the approach taken in thisstudy should be further developed. Much workhas to be done, as data on the population biologyof G. sesquipedale are very poor. Longer time se-ries of the species vital rates must be collected, so
that the time variance of population parameterscan be assessed. The relationship of these param-eters, particularly the recruitment rates, to standdensity must also be understood for purposes ofprediction. In order to generalize the conclusionsof these studies models must be calibrated fordifferent geographical areas.
Acknowledgements
P. Duarte wrote the Basic program to calculatethe vital rates. K. Warkentin edited an earlier ver-sion of the manuscript. The comments ofDrs J. Pringle, S. Walde, P. Ang, G. Sharp andP. Aberg are appreciated. This work was fundedby Laborat6rio Nacional de Engenharia e Tec-nologia Industrial through the grant ofDr C. Peneda, to whom I am particularly grate-ful. The Junta Nacional de Investigagao Cienti-fica e Tecnol6gica (BIC n° 402) supported mystay in Canada. The Halifax Fisheries ResearchLaboratory provided research facilities. I thankthe Instituto Nacional de Meteorologa e Geofi-sica, Lisboa, Portugal, for providing wave data.
References
,Aberg, P., 1992. A demographic study of two populations ofthe seaweed Ascophyllum nodosum: Ecology 73: 1473-1487.
Ang, P. O. & R. E. De Wreede, 1990. Matrix models for algallife history stages. Marine Ecology Progress Series 59: 171-181.
Borja, A., 1987. Cartografia, evaluaci6n de la biomassa yarribazones del alga Gelidium sesquipedale (Clem.) Born etThur en la costa guipuzcoana (N EspafAa). Inv. Pesq. 51:199-224.
Caswell, H., 1989. Matrix Population Models: construction,analysis and interpretation. Sinauer, Sunderland, MA,328 pp.
De Craene, R. J. A., 1971. Les algues en g6n6ral et leur ex-ploration au Maroc. Revue de l'Agriculture 6/7: 815-836.
Dixon, P., 1958. The structure and development of the thal-lus in the British species of Gelidium and Pterocladia. Ann.Bot. 22: 353-368.
Fan, K. C., 1961. Morphological studies of the Gelidiales.Univ. Cal. Publ. Bot. 32: 315-368.
Gorostiaga, J. M., 1990. Aspectos demograficos del alga rojaGelidium sesquipedale (Clemente) Thuret. Discusi6n sobre

276
su adequada gesti6n como recurso explotable. Ph. D. Dis-sertation, Uni.ersidad del Pais Vasco, Bilbao, Spain.
Harper, J. L. (1977). Population Biology of Plants. AcademicPress, London, 892 pp.
Juanes, J. A. & A. Borja, 1991. Biological criteria for the ex-ploitation of the commercially important species of Gelid-ium in Spain. In J. A. Juanes, B. Santelices & J. L.McLachlan (eds), International Workshop on Gelidium.Developments in Hydrobiology 68. Kluwer Academic Pub-lishers, Dordrecht: 45-54. Reprinted from Hydrobiologia221.
Juanes, J. A., B. Santelices & J. L. McLachlan, 1991. Inter-national Workshop on Gelidium. Developments in Hydro-biology 68. Kluwer Academic Publishers, Dordrecht,203 pp. Reprinted from Hydrobiologia 221.
Moloney, K. A., 1986. A generalized algorithm for determin-ing category size. Oecologia 69: 176-180.
Palminha, F., 1971. ExploraCdo e utilizacao de Algas Marin-has na Plataforma Portuguesa e nas Ilhas do Arquip6lago
dos Agores. Junta Nacional de Fomento das Pescas 7:25-36.
Salinas, J. M., B. Reguera & R. Gancedo, 1976. Biometria enGelidium sesquipedale (Rhodophyta). Primera Parte. Bol.Inst. esp. Oceanogr. 226: 1-70.
Santelices, B., 1988. Synopsis of biological data on the sea-weed genera Gelidium and Pterocladia (Rhodophyta). FAOFisheries Synopsis, 145, 55 pp.
Santos, R., in press. A multivariate study of biotic and abi-otic relationships in a subtidal algal stand. Marine EcologyProgress Series.
Santos, R. & P. Duarte, 1991. Marine plant harvest in Por-tugal.
Seoane-Camba, J., 1966. Algunos datos de inter6s en larecolecci6n de Gelidium sesquipedale. Publ. tcn. J. Est.Pesca 5: 437-455.
Sharp, G. J. & D. M. Tremblay 1985. A tagging technique forsmall macrophytes. Bot. mar. 28: 549-551.