PLS 2014: Early Results of the LANTERNS Project
52
The LANTERNS project is funded by the NIHR Public Health Research Programme. The views expressed here are those of the authors and do not necessarily reflect those of NIHR or the Department of Health Early results of the LANTERNS project
-
Upload
institution-of-lighting-professionals -
Category
Data & Analytics
-
view
103 -
download
0
Transcript of PLS 2014: Early Results of the LANTERNS Project
The LANTERNS project is funded by the NIHR Public Health ResearchProgramme. The views expressed here are those of the authors anddo not necessarily reflect those of NIHR or the Department ofHealth
Early results of the LANTERNS project
What are the public health
impacts of reduced street
lighting at night?
• To collate information on street lighting adaptation schemes nationally
• Statistically examine whether reduced lighting has any effects on traffic crashes or crime
• Explore local public opinion on street lighting provision, and potential for reducing levels
• Investigate whether street lighting adaptation schemes offer value for money
LANTERNS Project Aims
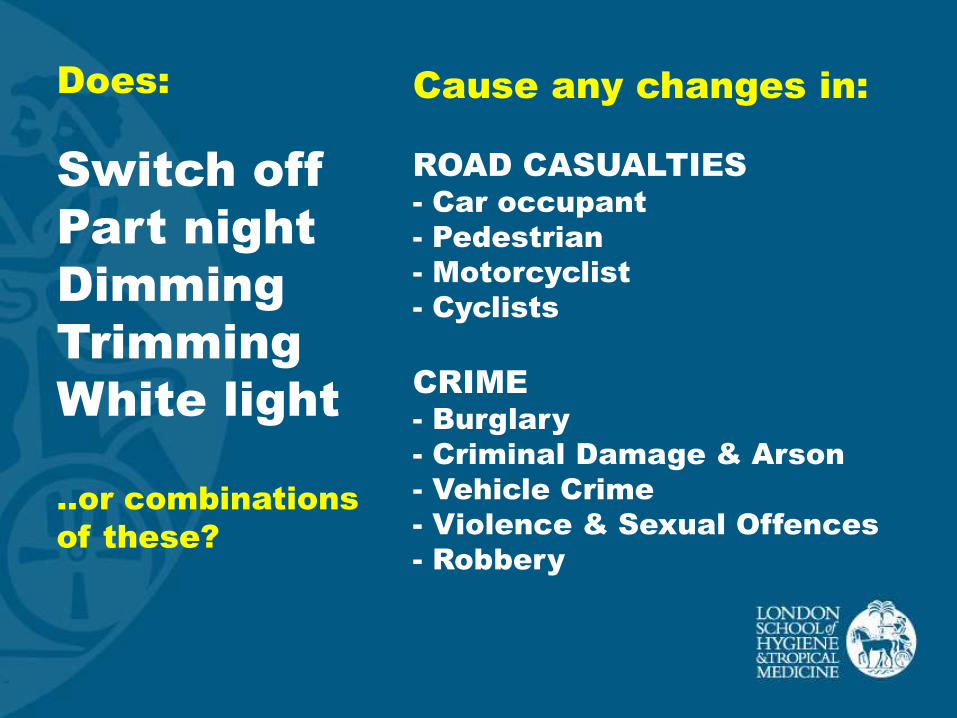
Does:
Switch off
Part night
Dimming
Trimming
White light
..or combinations
of these?
Cause any changes in:
ROAD CASUALTIES
- Car occupant
- Pedestrian
- Motorcyclist
- Cyclists
CRIME
- Burglary
- Criminal Damage & Arson
- Vehicle Crime
- Violence & Sexual Offences
- Robbery
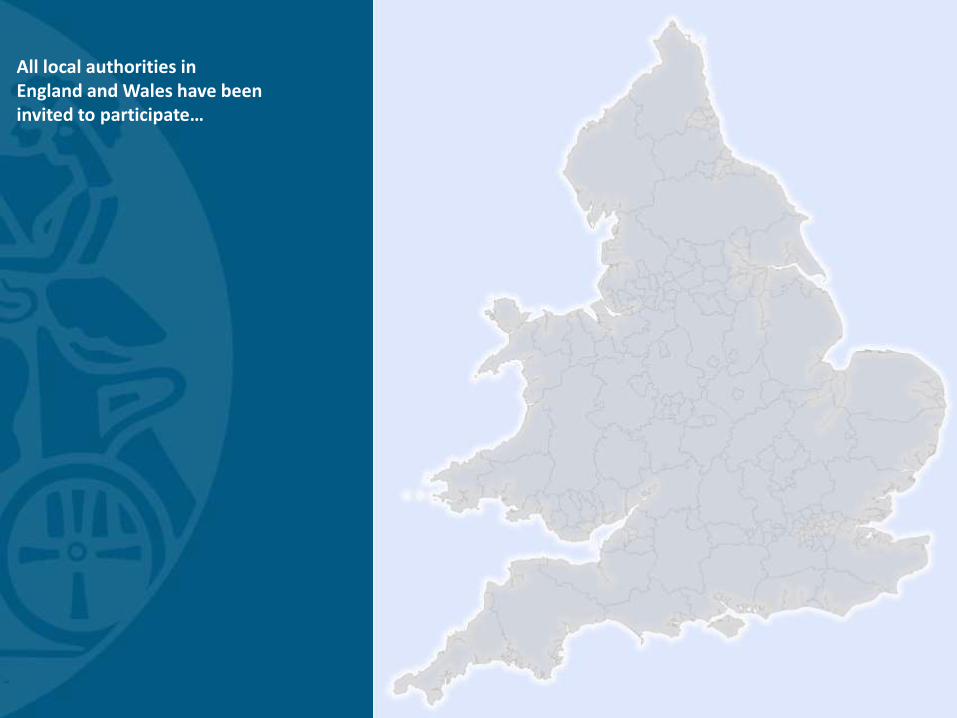
All local authorities in England and Wales have been invited to participate…
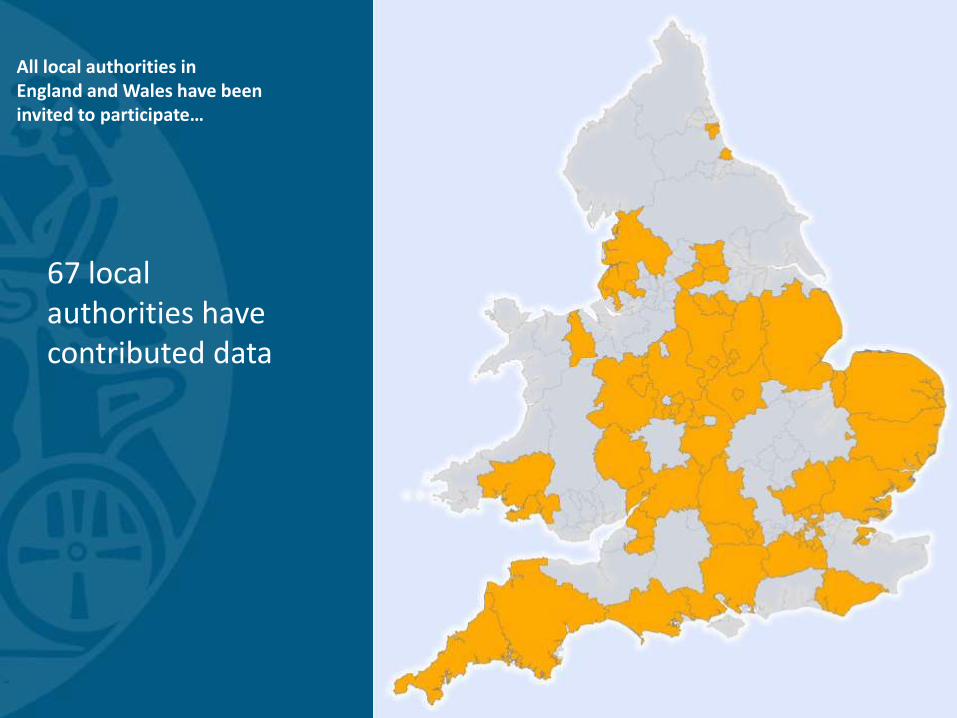
All local authorities in England and Wales have been invited to participate…
67 local authorities have contributed data
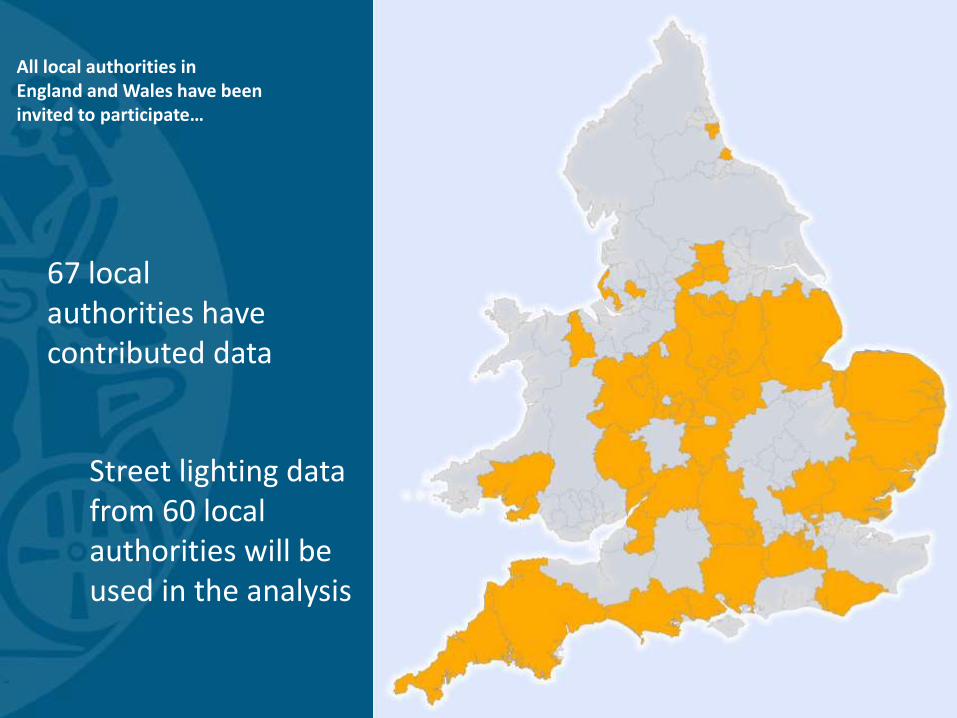
All local authorities in England and Wales have been invited to participate…
67 local authorities have contributed data
Street lighting data from 60 local authorities will be used in the analysis
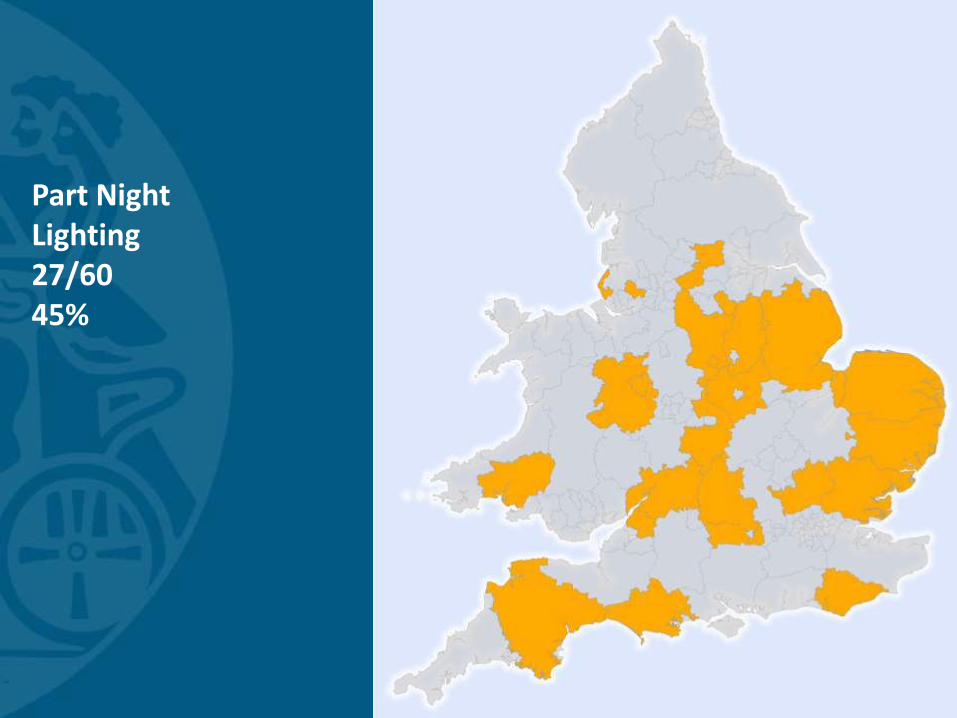
Part Night Lighting27/6045%

Trimming29/6048%
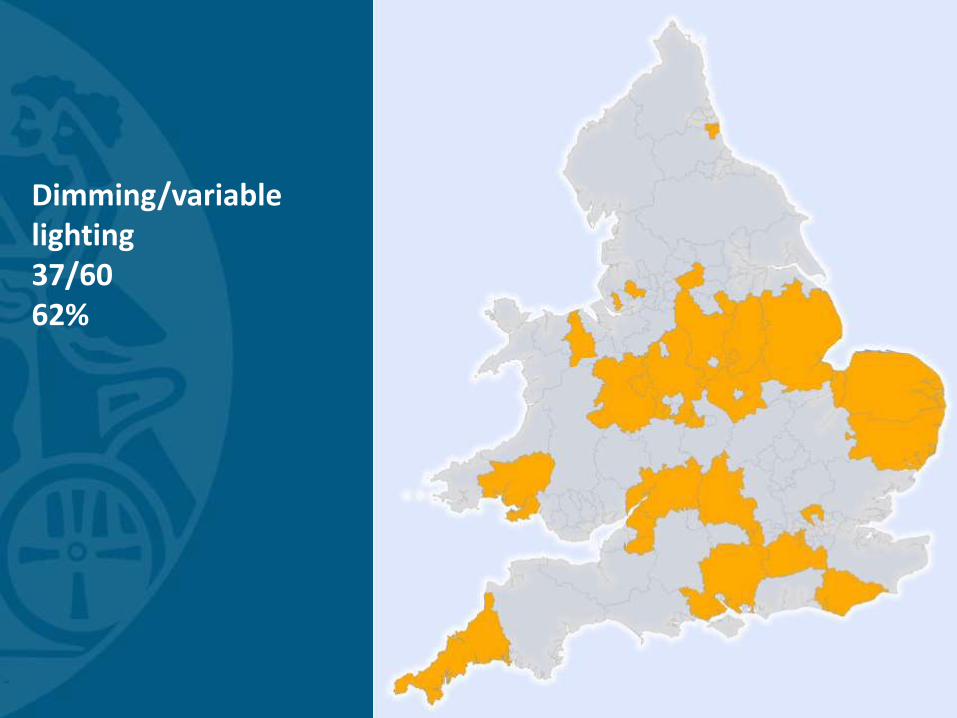
Dimming/variable lighting37/6062%

White light46/6077%
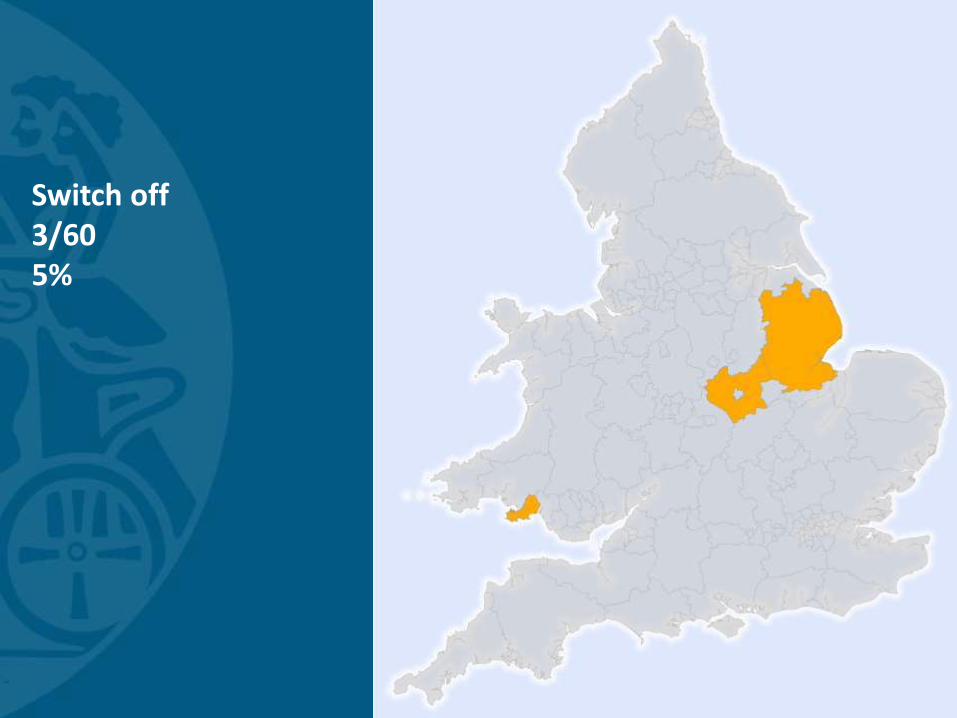
Switch off3/605%


0
2000
4000
6000
8000
10000
12000
14000
16000
18000
Jan
-00
Jun
-00
No
v-0
0
Ap
r-0
1
Sep
-01
Feb
-02
Jul-
02
Dec
-02
May
-03
Oct
-03
Mar
-04
Au
g-0
4
Jan
-05
Jun
-05
No
v-0
5
Ap
r-0
6
Sep
-06
Feb
-07
Jul-
07
Dec
-07
May
-08
Oct
-08
Mar
-09
Au
g-0
9
Jan
-10
Jun
-10
No
v-1
0
Ap
r-1
1
Sep
-11
Feb
-12
Jul-
12
Dec
-12
May
-13
Oct
-13
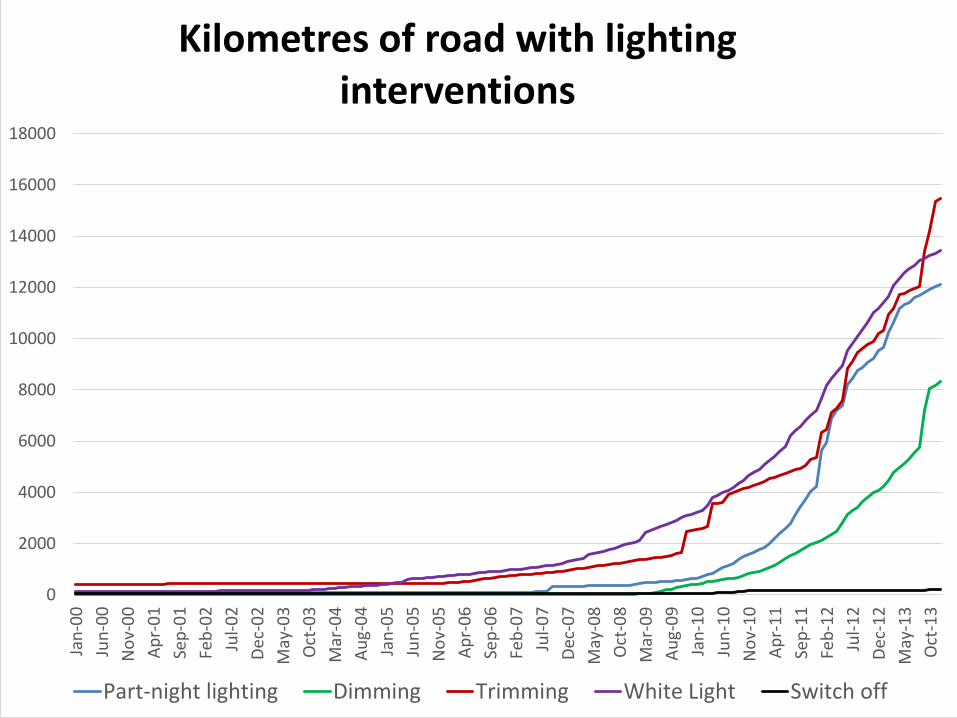
Kilometres of road with lighting interventions
Part-night lighting Dimming Trimming White Light Switch off

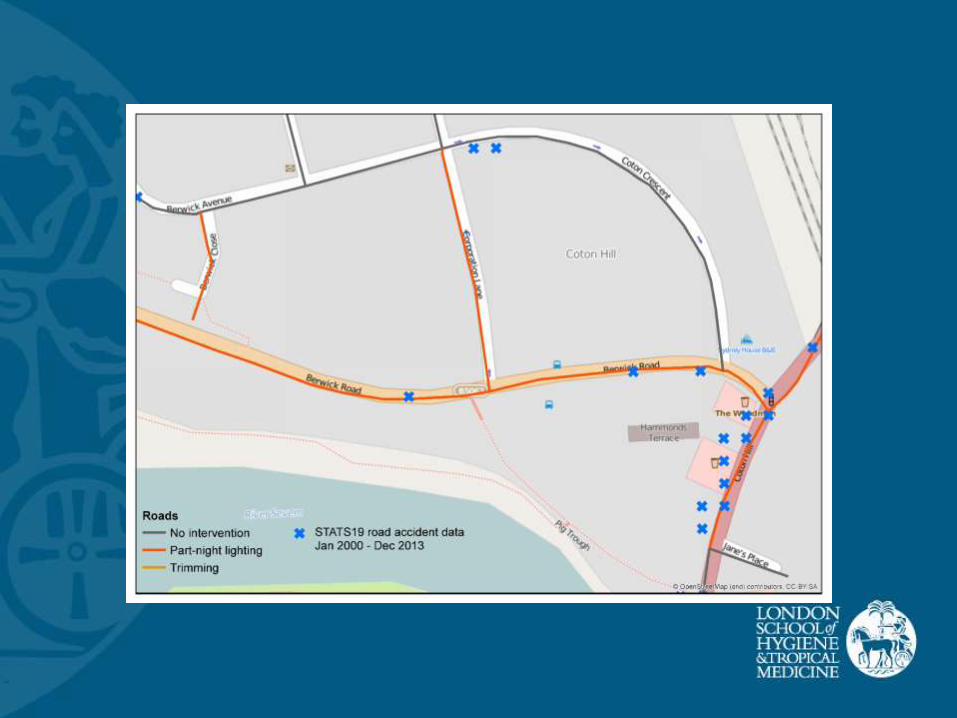
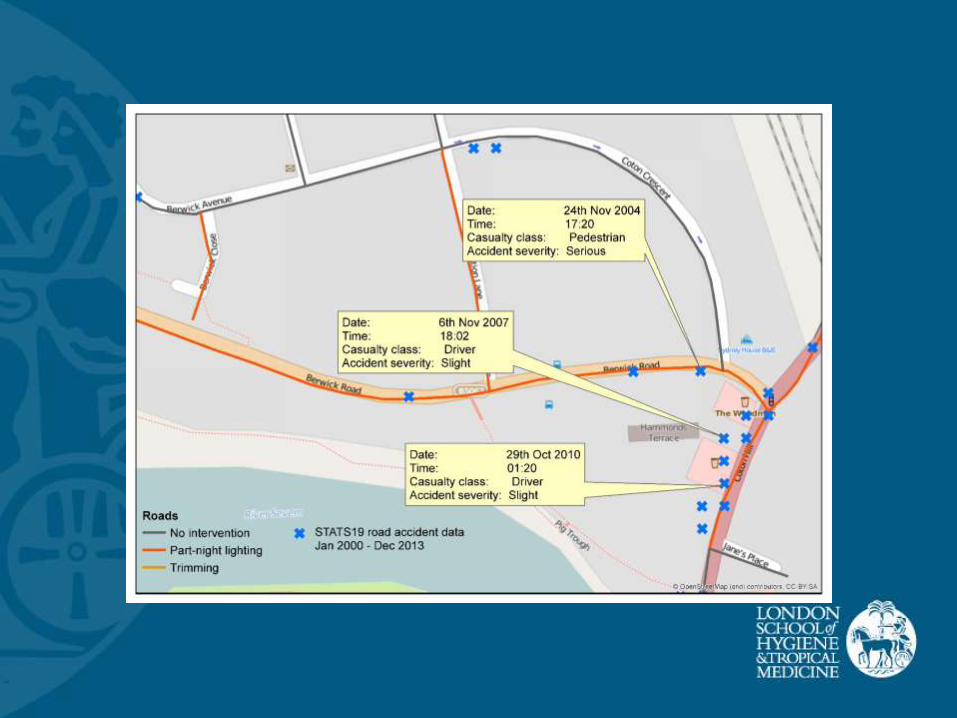
Road traffic injury data
Stats19
– Easting and Northing of collision
– Time of day of collision
0
2000
4000
6000
8000
10000
12000
14000
16000
18000
2000 2001 2002 2003 2004 2005 2006 2007 2008 2009 2010 2011 2012 2013
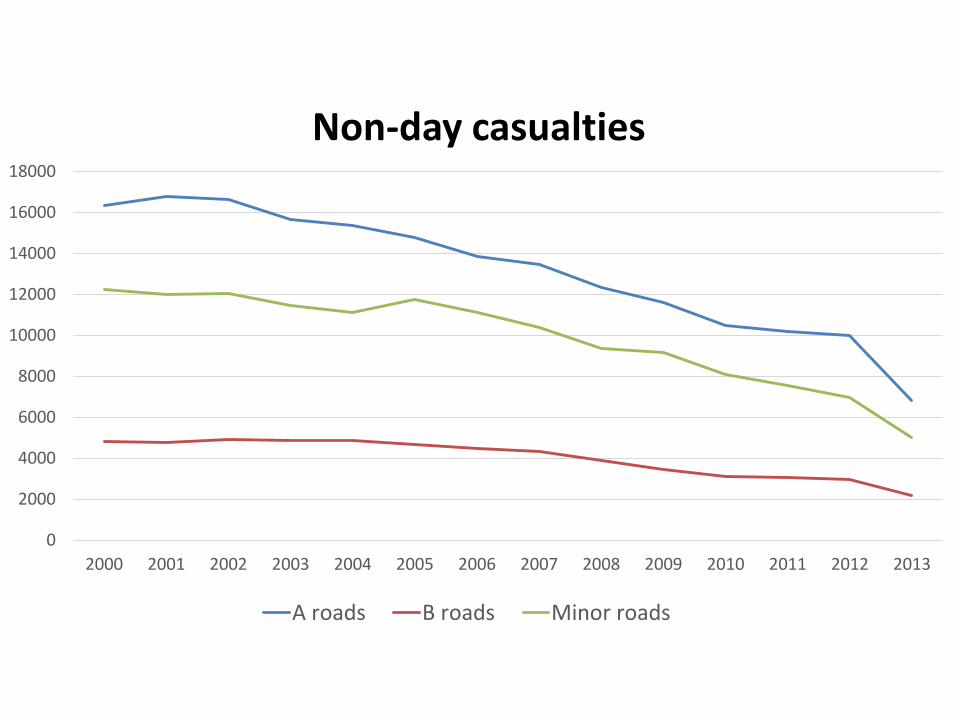
Non-day casualties
A roads B roads Minor roads
0
5000
10000
15000
20000
25000
30000
35000
40000
2000 2001 2002 2003 2004 2005 2006 2007 2008 2009 2010 2011 2012 2013
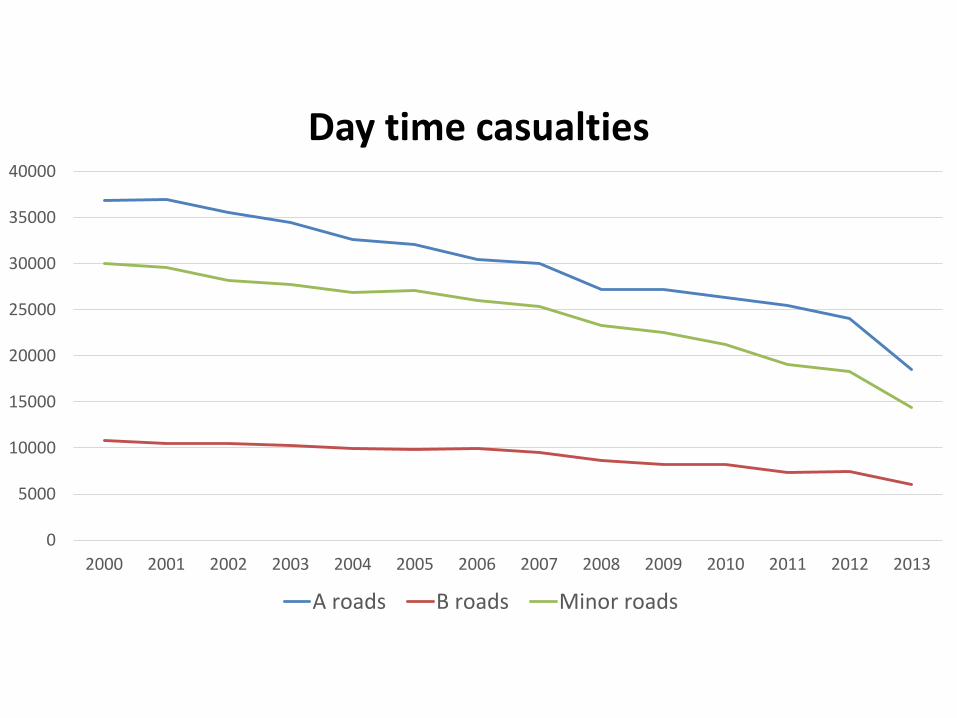
Day time casualties
A roads B roads Minor roads
0
2000
4000
6000
8000
10000
12000
14000
16000
18000
Jan
-00
Jun
-00
No
v-0
0
Ap
r-0
1
Sep
-01
Feb
-02
Jul-
02
Dec
-02
May
-03
Oct
-03
Mar
-04
Au
g-0
4
Jan
-05
Jun
-05
No
v-0
5
Ap
r-0
6
Sep
-06
Feb
-07
Jul-
07
Dec
-07
May
-08
Oct
-08
Mar
-09
Au
g-0
9
Jan
-10
Jun
-10
No
v-1
0
Ap
r-1
1
Sep
-11
Feb
-12
Jul-
12
Dec
-12
May
-13
Oct
-13
Kilometres of road with lighting interventions
Part-night lighting Dimming Trimming White Light Switch off

0
0.01
0.02
0.03
0.04
2009 2010 2011 2012 2013
Non-day time casualties per km
Part-night lighting Dimming Trimming
White Light Switch off Non-intervention
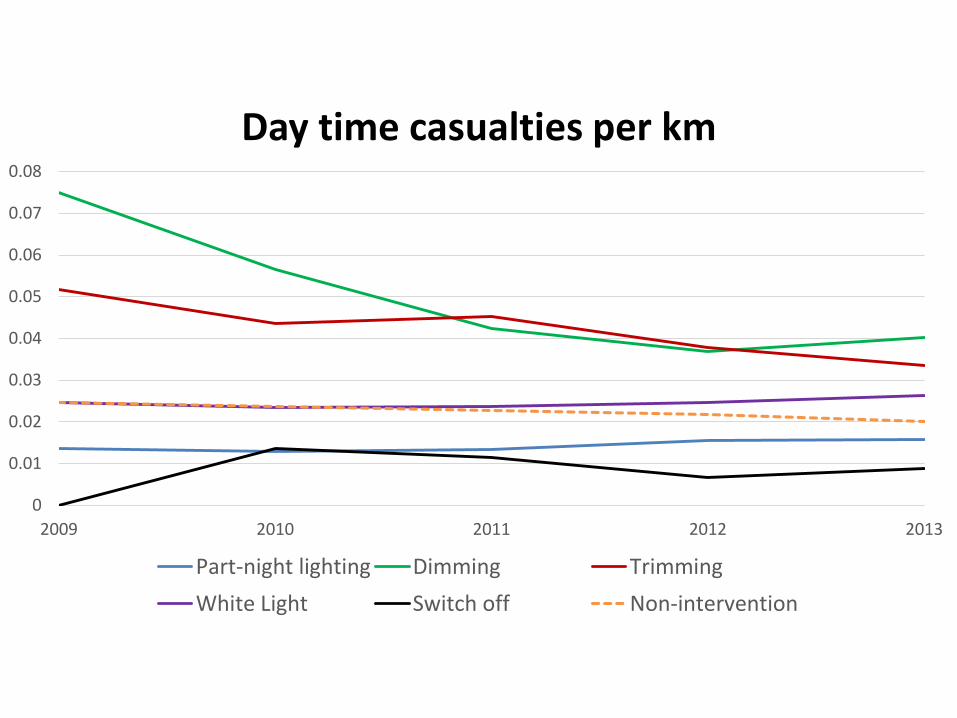
0
0.01
0.02
0.03
0.04
0.05
0.06
0.07
0.08
2009 2010 2011 2012 2013
Day time casualties per km
Part-night lighting Dimming Trimming
White Light Switch off Non-intervention
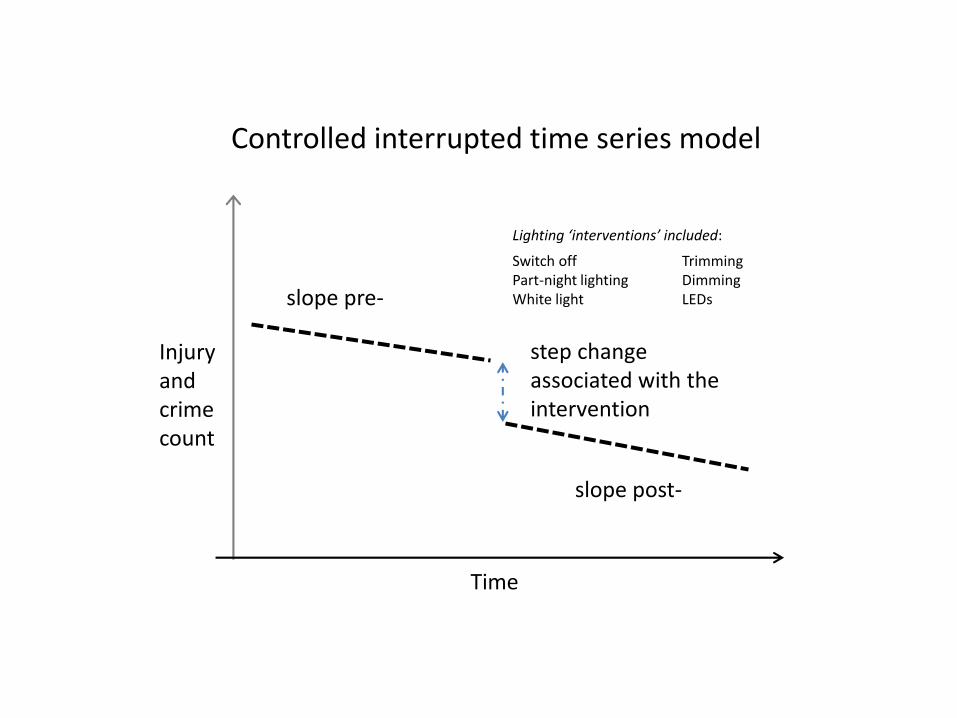
slope pre-
Injury and crime count
Time
slope post-
step change associated with the intervention
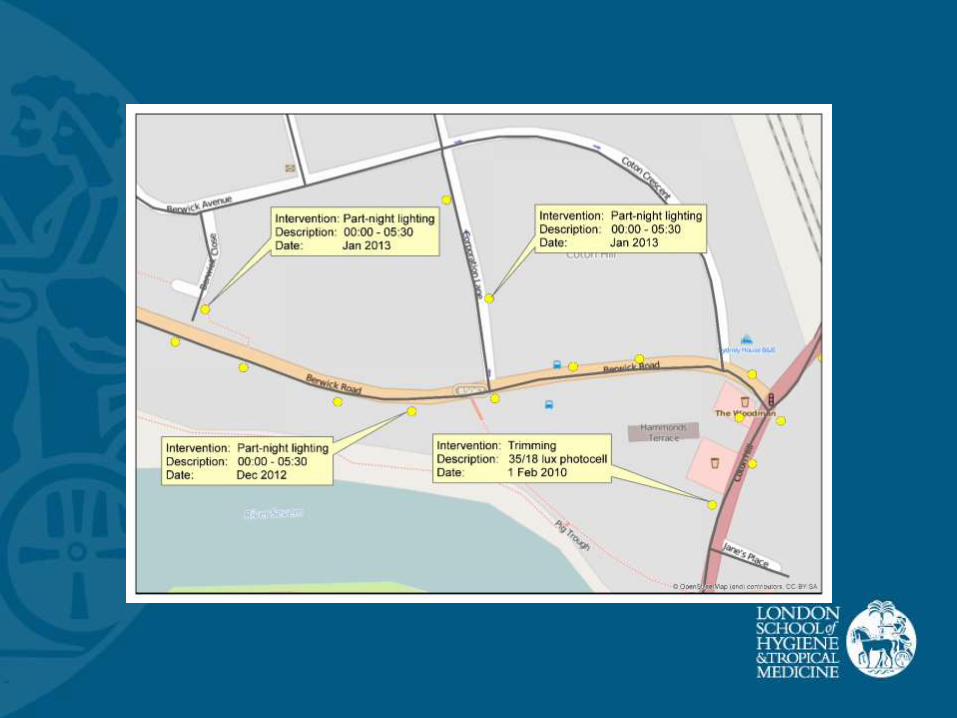
Lighting ‘interventions’ included:
Switch off TrimmingPart-night lighting DimmingWhite light LEDs
Controlled interrupted time series model

number of casualties & crimes in road segment ‘s’ in year ‘t’
𝑌𝑠,𝑡~ 𝑃𝑜𝑖𝑠𝑠𝑜𝑛 𝜇𝑠,𝑡
log 𝜇𝑠,𝑡 = 𝛼𝑠 + 𝑆 𝑡, 𝑧𝑠 + 𝛃. 𝐱𝑠,𝑡
𝑦𝑠,𝑡 =
𝛼𝑠 = road segment effect
𝑆 𝑡, 𝑧𝑠 = function of year to allow for nationwide trends, dependent on road segment characteristics
𝑧𝑠 = road segment characteristics
𝐱𝑠,𝑡 = vector of indicator (0,1) variables identifying road segments affected
𝛃 = vector of coefficients of effect of lighting change on casualties and crimes
Crime data
Police.uk (national coverage)
– Monthly counts of ASB, criminal damage, burglary, vehicle crime, robbery
West Midlands Police Force recorded crime data
– Type of crime
– Date and time (from and to)
– Location
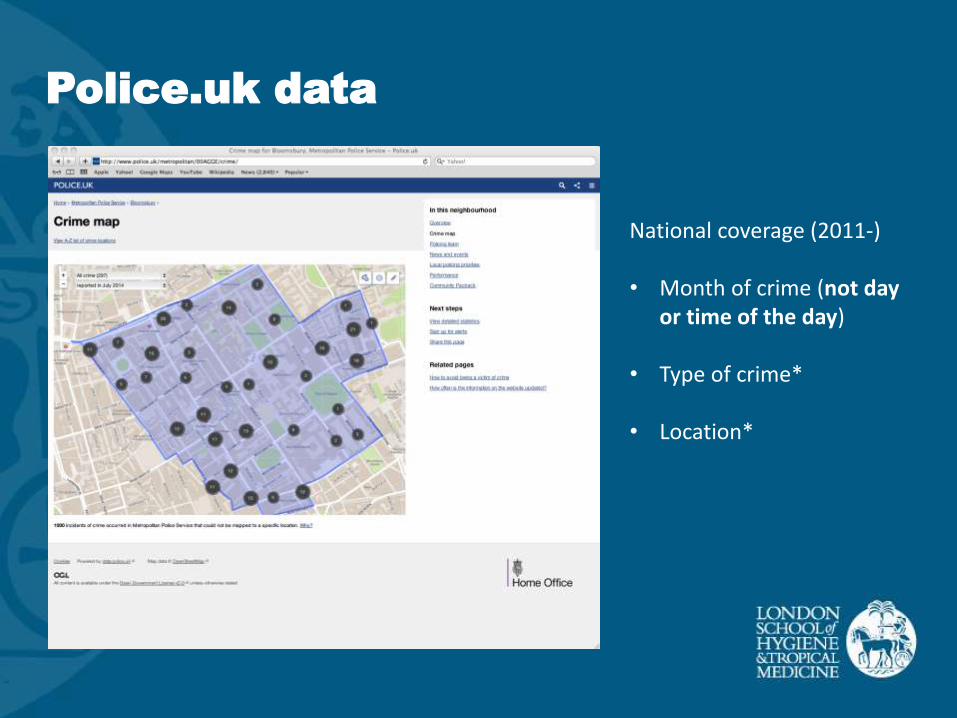
Police.uk data
National coverage (2011-)
• Month of crime (not day or time of the day)
• Type of crime*
• Location*
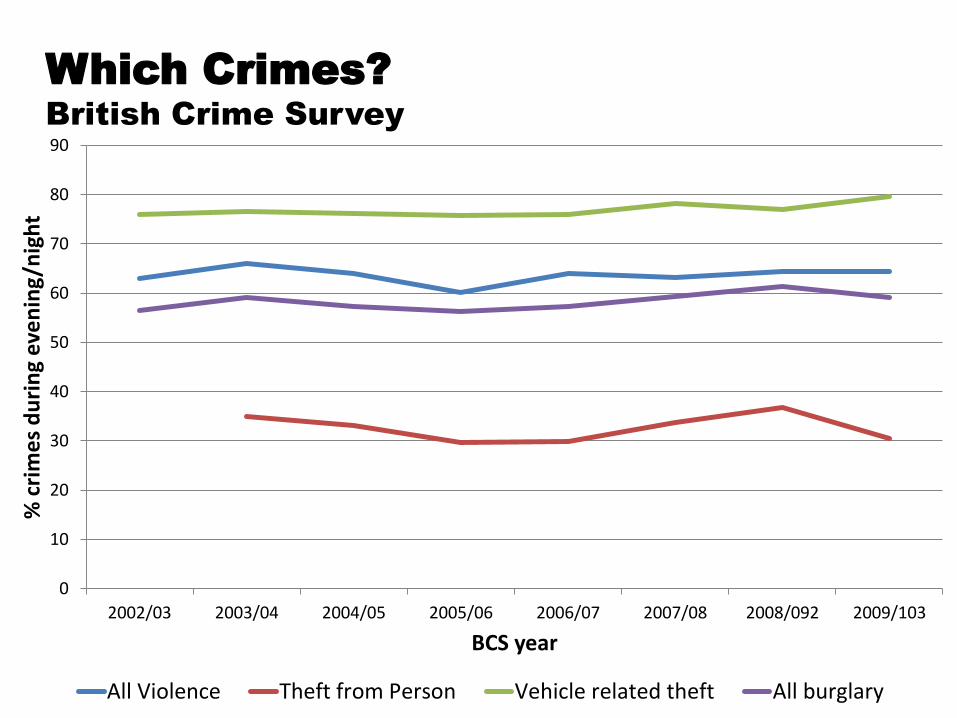
Which Crimes?
British Crime Survey
0
10
20
30
40
50
60
70
80
90
2002/03 2003/04 2004/05 2005/06 2006/07 2007/08 2008/092 2009/103
% c
rim
es
du
rin
g e
ven
ing/
nig
ht
BCS year
All Violence Theft from Person Vehicle related theft All burglary
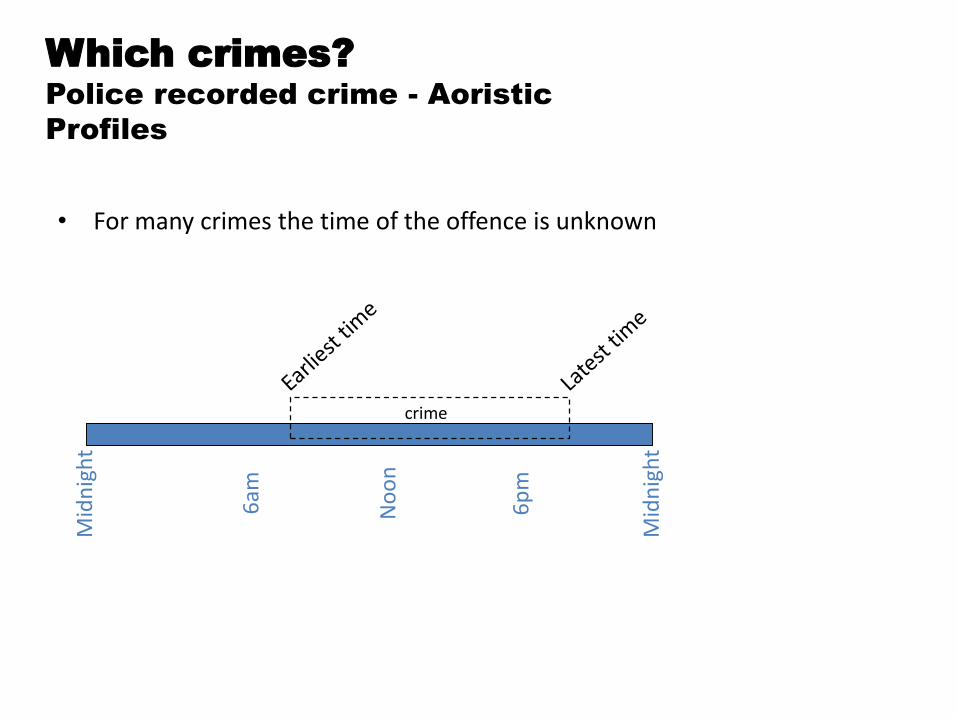
Which crimes?
Police recorded crime - Aoristic
Profiles
• For many crimes the time of the offence is unknown
Mid
nig
ht
No
on
6p
m
6am
Mid
nig
ht
crime
0.00
0.02
0.04
0.06
0.08
5 10 15 20
Hour of the day
Pro
bab
ility
cri
me
occurs
in
ho
ur
t
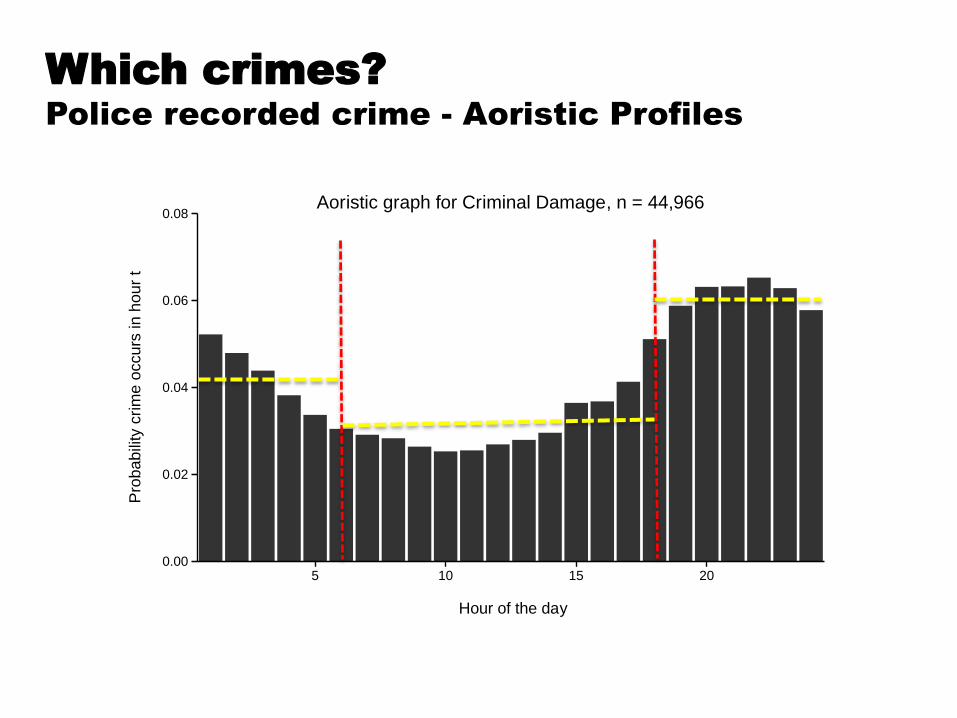
Aoristic graph for Criminal Damage, n = 44,966
Which crimes?
Police recorded crime - Aoristic Profiles

0.000
0.025
0.050
0.075
0.100
5 10 15 20
Hour of the day
Pro
bab
ility
cri
me
occurs
in
ho
ur
t
Aoristic graph for Robbery, n = 19,397
0.00
0.01
0.02
0.03
0.04
0.05
0.06
5 10 15 20
Hour of the day
Pro
bab
ility
cri
me
occurs
in
ho
ur
t
Aoristic graph for Vehicle Crime, n = 69,860
0.00
0.01
0.02
0.03
0.04
0.05
5 10 15 20
Hour of the day
Pro
bab
ility
cri
me
occurs
in
ho
ur
t
Aoristic graph for Burglary, n = 79,108
Which crimes?
Police recorded crime - Aoristic Profiles

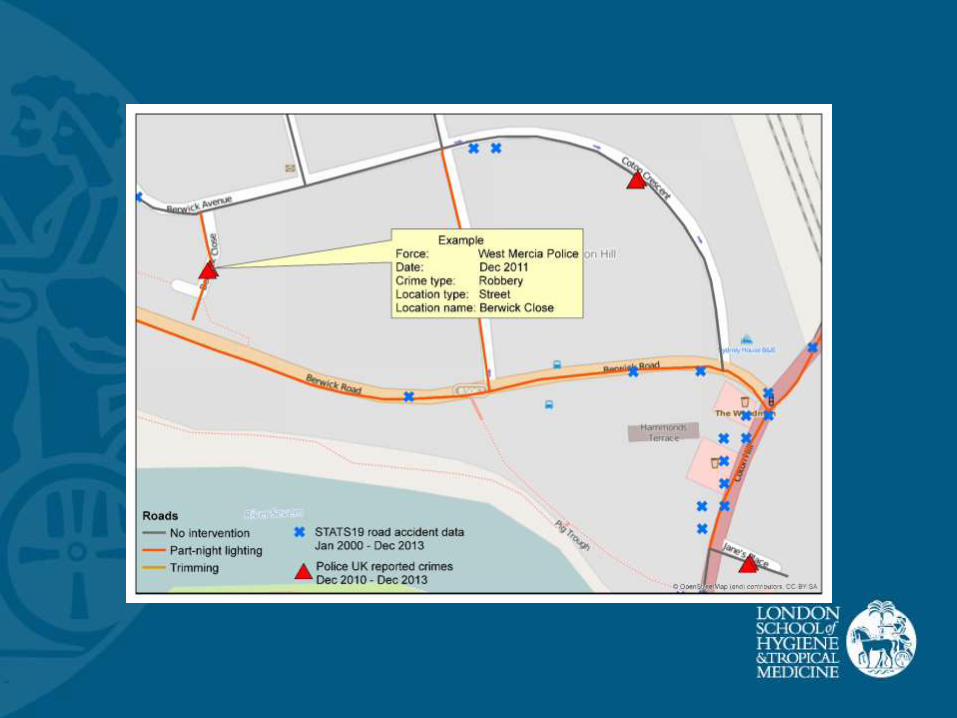
Police.uk - Geomasking
• “Each dot marks the approximate location of an incident of crime or anti-social behaviour and it will usually appear on a street with 8 or more postal addresses. We have purposely used radar-style icons to demonstrate this and also clearly state at each dot that the incident is ‘on or near.’”
(http://www.police.uk/help?)
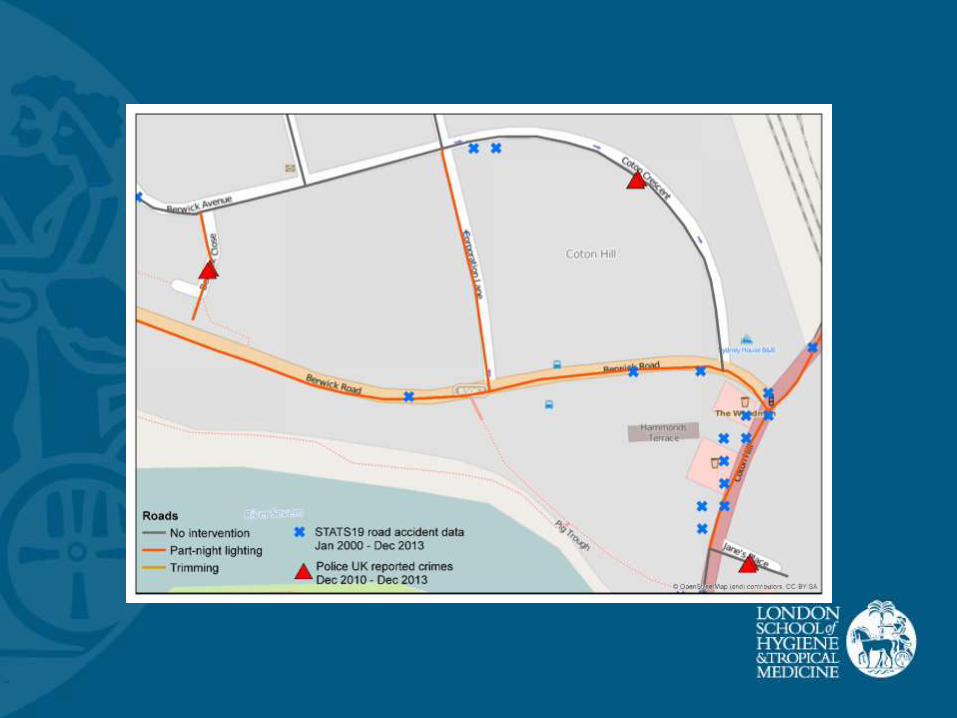
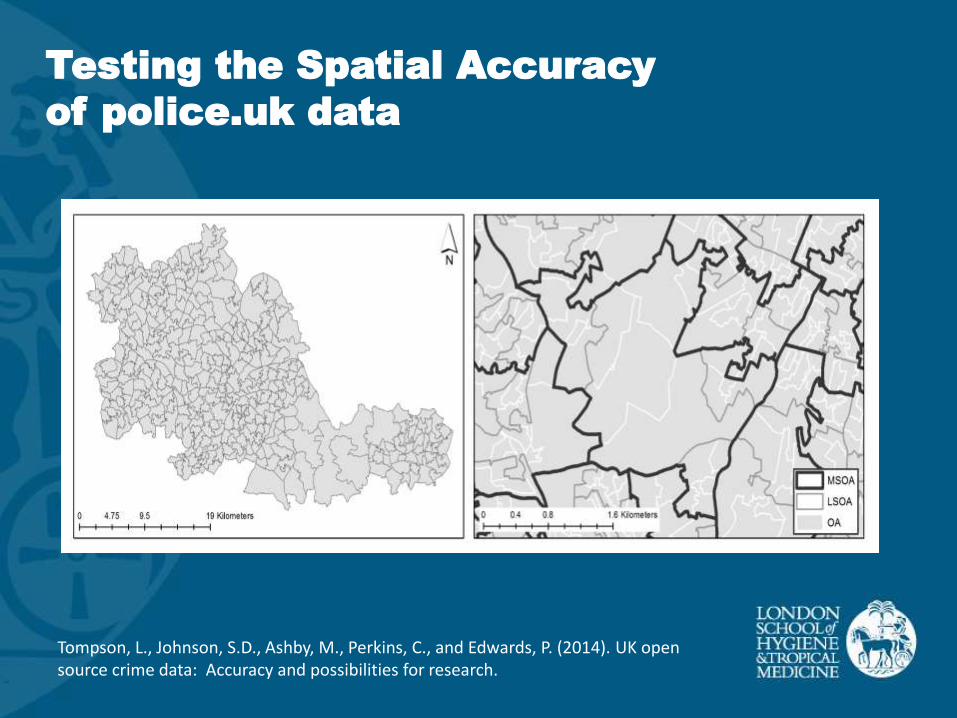
Testing the Spatial Accuracy
of police.uk data
Tompson, L., Johnson, S.D., Ashby, M., Perkins, C., and Edwards, P. (2014). UK open source crime data: Accuracy and possibilities for research.
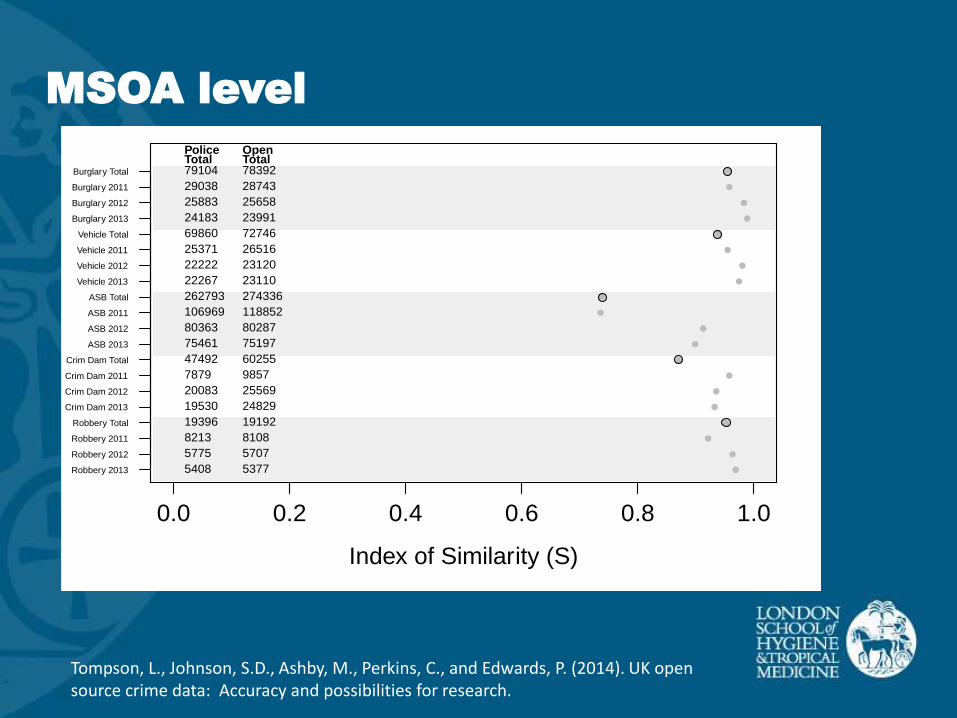
MSOA level
0.0 0.2 0.4 0.6 0.8 1.0
MSOA
Index of Similarity (S)
Robbery 2013
Robbery 2012
Robbery 2011
Robbery Total
Crim Dam 2013
Crim Dam 2012
Crim Dam 2011
Crim Dam Total
ASB 2013
ASB 2012
ASB 2011
ASB Total
Vehicle 2013
Vehicle 2012
Vehicle 2011
Vehicle Total
Burglary 2013
Burglary 2012
Burglary 2011
Burglary Total
PoliceTotal
OpenTotal
79104
29038
25883
24183
69860
25371
22222
22267
262793
106969
80363
75461
47492
7879
20083
19530
19396
8213
5775
5408
78392
28743
25658
23991
72746
26516
23120
23110
274336
118852
80287
75197
60255
9857
25569
24829
19192
8108
5707
5377
Tompson, L., Johnson, S.D., Ashby, M., Perkins, C., and Edwards, P. (2014). UK open source crime data: Accuracy and possibilities for research.
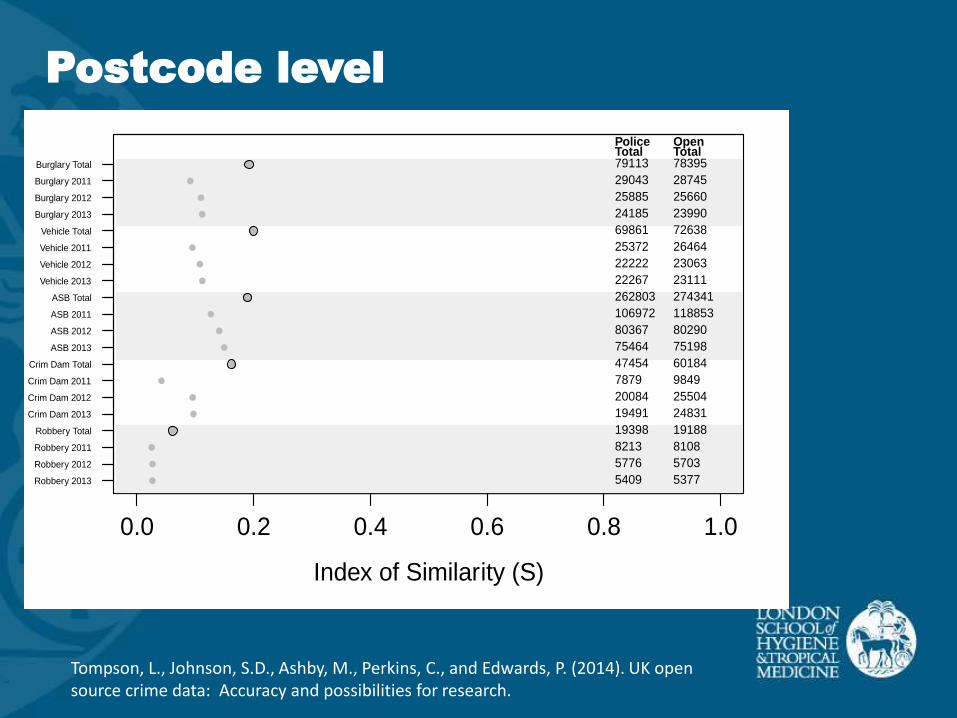
Postcode level
0.0 0.2 0.4 0.6 0.8 1.0
PC
Index of Similarity (S)
Robbery 2013
Robbery 2012
Robbery 2011
Robbery Total
Crim Dam 2013
Crim Dam 2012
Crim Dam 2011
Crim Dam Total
ASB 2013
ASB 2012
ASB 2011
ASB Total
Vehicle 2013
Vehicle 2012
Vehicle 2011
Vehicle Total
Burglary 2013
Burglary 2012
Burglary 2011
Burglary Total
PoliceTotal
OpenTotal
79113
29043
25885
24185
69861
25372
22222
22267
262803
106972
80367
75464
47454
7879
20084
19491
19398
8213
5776
5409
78395
28745
25660
23990
72638
26464
23063
23111
274341
118853
80290
75198
60184
9849
25504
24831
19188
8108
5703
5377
Tompson, L., Johnson, S.D., Ashby, M., Perkins, C., and Edwards, P. (2014). UK open source crime data: Accuracy and possibilities for research.
Outcome Analysis
• Better thought of as reflecting crime on and/or near a street
• Area level analysis
• Spatial accuracy improved substantially by modeling the error in the data
• Case study analyses with police recorded crime data
• To collate information on street lighting adaptation schemes nationally
• Statistically examine whether reduced lighting has any effects on traffic crashes or crime
• Explore local public opinion on street lighting provision, and potential for reducing levels
• Investigate whether street lighting adaptation schemes offer value for money
LANTERNS Project Aims

Rapid appraisal
• Survey of web and public sources• LA consultations• Local media
• Key informant interviews
• Ethnographic interviews and observations
• Focus groups and in depth interviews
• Household survey in one LA comparing affected and unaffected streets (N=1000)
Sample of 8 contrasting Local Authorities
Expressed public views
I pay my tax, I now have to walk home in the pitch black […] I expect a basic service
I am over the moon […] to look up at the night sky and be able to see the stars on a clear night
Am I alone in thinking it’s a fantastic idea? … the money saved … can be ploughed back into schools and lollipop ladies…. Sleeping in the pitch black will have amazing health benefits for the people of this town. Not to mention the impact on the environment
Interaction and deliberation
• You wouldn’t want them to just totally switch things off...
• I don’t know, because it’s, on estates, because I know what Lucy was saying, since she got burgled, because it’s so well lit where she is. She says, the, the policeman said if, if it hadn’t had been as well lit and they hadn’t been able to see your house, your garage ...
• [...]
• I suppose you’re never going to please any, everybody are you?
• No.
• [laughter]
• You’re never going to please everybody.
Private views: wonder, and
fear
I know this sounds weird, but I got quite obsessed by it when they first started turning them off at midnight, I started to stay up to watch them going out – just to see how dark it was. It was so strange watching the lights going out – an odd thing to happen.
(Herts resident, informal conversation)
I don’t like to walk in the dark. I could carry a torch – but that shows you up, If there’s a street light, people can say ‘I saw a lady walk past us...’ If I’m carrying a torch, all they can see is the torch. (Herts resident, informal conversation)

Private views: ‘Going
backwards’
you know, you take it for granted but the whole streetlight thing seemed to me to be a big step forwards in the quality of life 150 years ago now probably or whatever. But the thought of actually going backwards seems to me to be quite appalling, you know, so I’d, I’d feel quite strongly about it in that sense. (Bucks resident, interview)
Lighting ‘in the right place’:
the modern city
I used to live out in [small village], it’s very rural there, it’s completely different. When I was there I didn’t go out as much at night, I didn’t feel as secure. Here I go out to the theatre, cinema, I feel safe. (Wakefield, interview)
The city people want street lights - there is a new build estate, and its second generation people coming from London, with different expectations – they want them. It is a divide – people do talk about it as something people come to the country and then expect it to be like the city (Herts, informal interview)
The silent majority: lights,
what lights?
• I don’t notice to be honest (informal interview, Shrewsbury)
• I don’t notice really as I don’t go out after dark (informal interview, Swansea)
• To be honest, I haven’t got an opinion, you just get used to it. (Informal interview, Swansea)
• I’m not going to lie, when you first, um, suggested it to me I was like, eh, street lights, that’s a random topic. (Hackney, in depth interview)
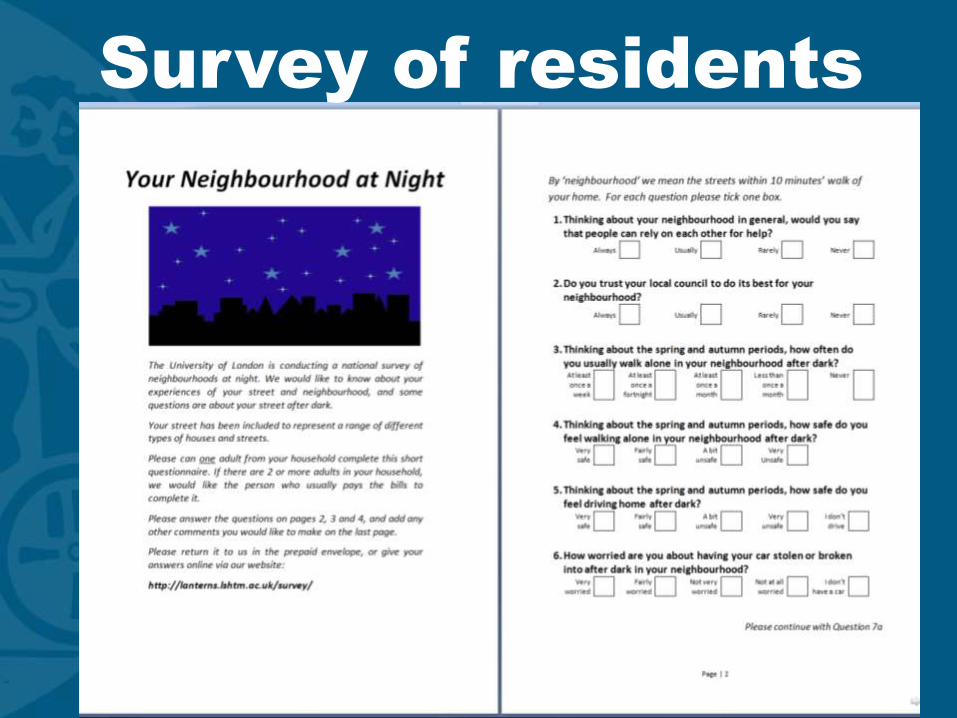
Survey of residents
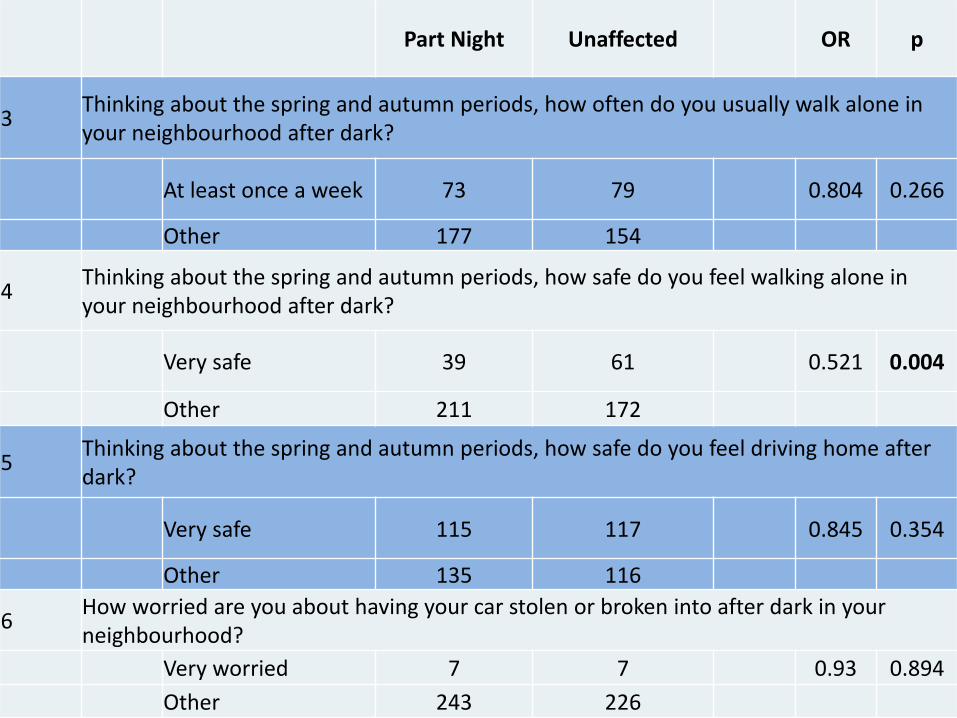
Part Night Unaffected OR p
3Thinking about the spring and autumn periods, how often do you usually walk alone in your neighbourhood after dark?
At least once a week 73 79 0.804 0.266
Other 177 154
4Thinking about the spring and autumn periods, how safe do you feel walking alone in your neighbourhood after dark?
Very safe 39 61 0.521 0.004
Other 211 172
5Thinking about the spring and autumn periods, how safe do you feel driving home after dark?
Very safe 115 117 0.845 0.354
Other 135 116
6How worried are you about having your car stolen or broken into after dark in your neighbourhood?
Very worried 7 7 0.93 0.894
Other 243 226
Next Steps
• Data collection is finished!
• Finalize quantitative models
• Use results from quantitative and qualitative aims to inform cost-benefit analysis
• Final Results due January 2015