PLOTCON NYC: Custom Colormaps for Your Field
60
Custom Colormaps for Your Field Kristen Thyng Research Assistant Professor Oceanography Texas A&M University _________ kristenthyng.com @thyngkm November 17, 2016
-
Upload
plotly -
Category
Data & Analytics
-
view
119 -
download
5
Transcript of PLOTCON NYC: Custom Colormaps for Your Field
Custom Colormaps for Your Field
Kristen ThyngResearch Assistant ProfessorOceanographyTexas A&M University_________kristenthyng.com @thyngkm
November 17, 2016
Why are colormaps important?
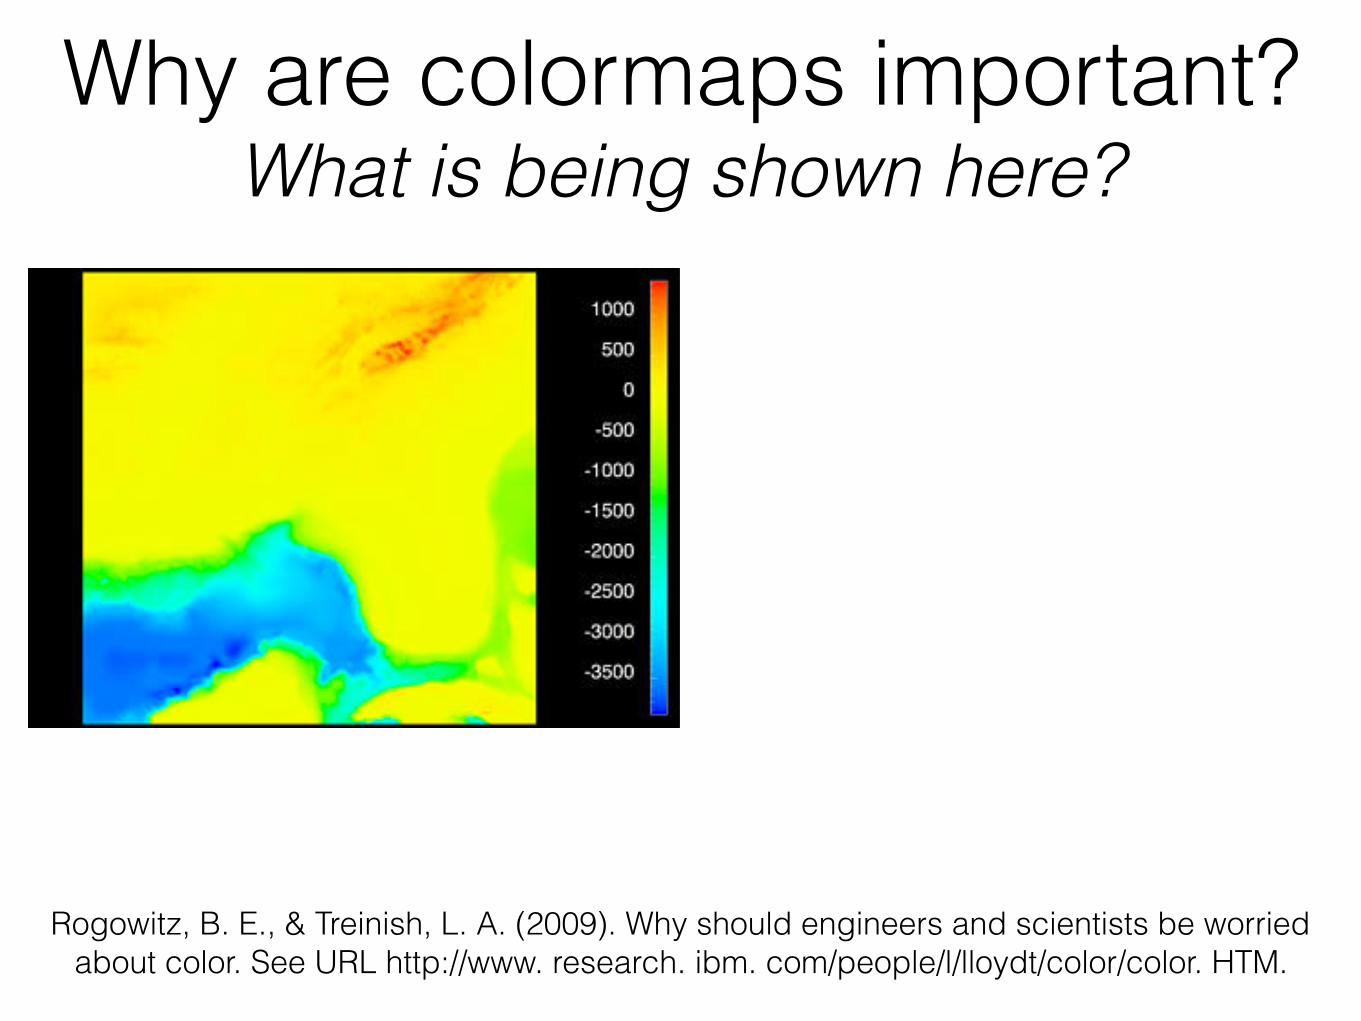
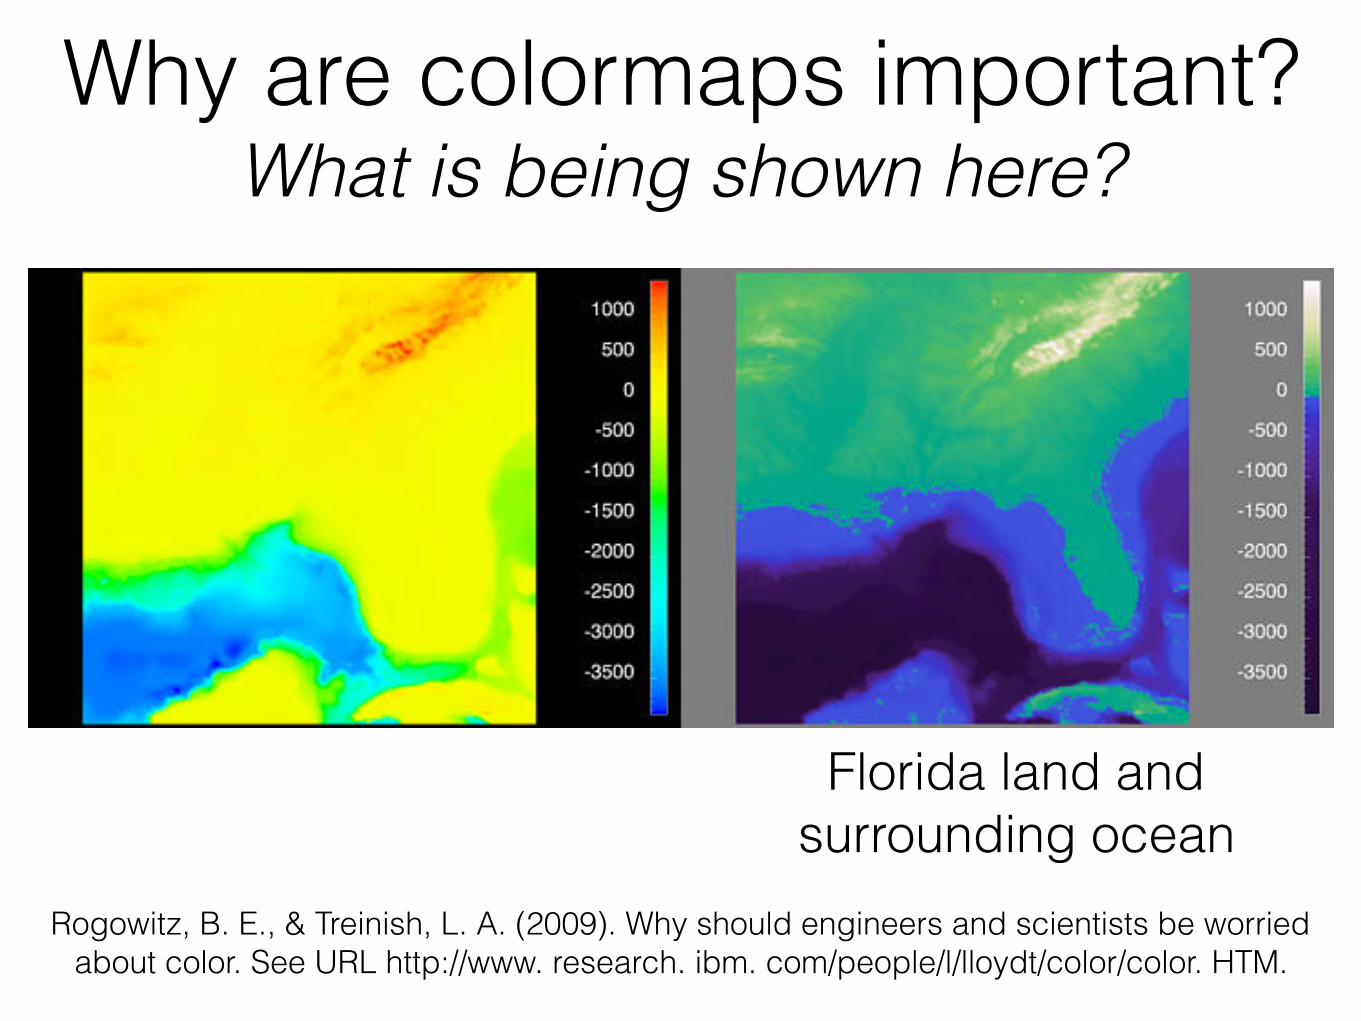
Why are colormaps important? What is being shown here?
Rogowitz, B. E., & Treinish, L. A. (2009). Why should engineers and scientists be worried about color. See URL http://www. research. ibm. com/people/l/lloydt/color/color. HTM.
Why are colormaps important? What is being shown here?
Rogowitz, B. E., & Treinish, L. A. (2009). Why should engineers and scientists be worried about color. See URL http://www. research. ibm. com/people/l/lloydt/color/color. HTM.
Florida land and surrounding ocean
• Disclaimer: there are both facts and opinions about many aspects of colormaps
• I will cover a few of both and give guidelines
• Anyone’s particular application may have unique considerations
What makes a good colormap?

Basic function of colormap
• Represent data with no preferential values
• All data should be perceived as equally important
• Changes in value are perceived uniformly across the colormap
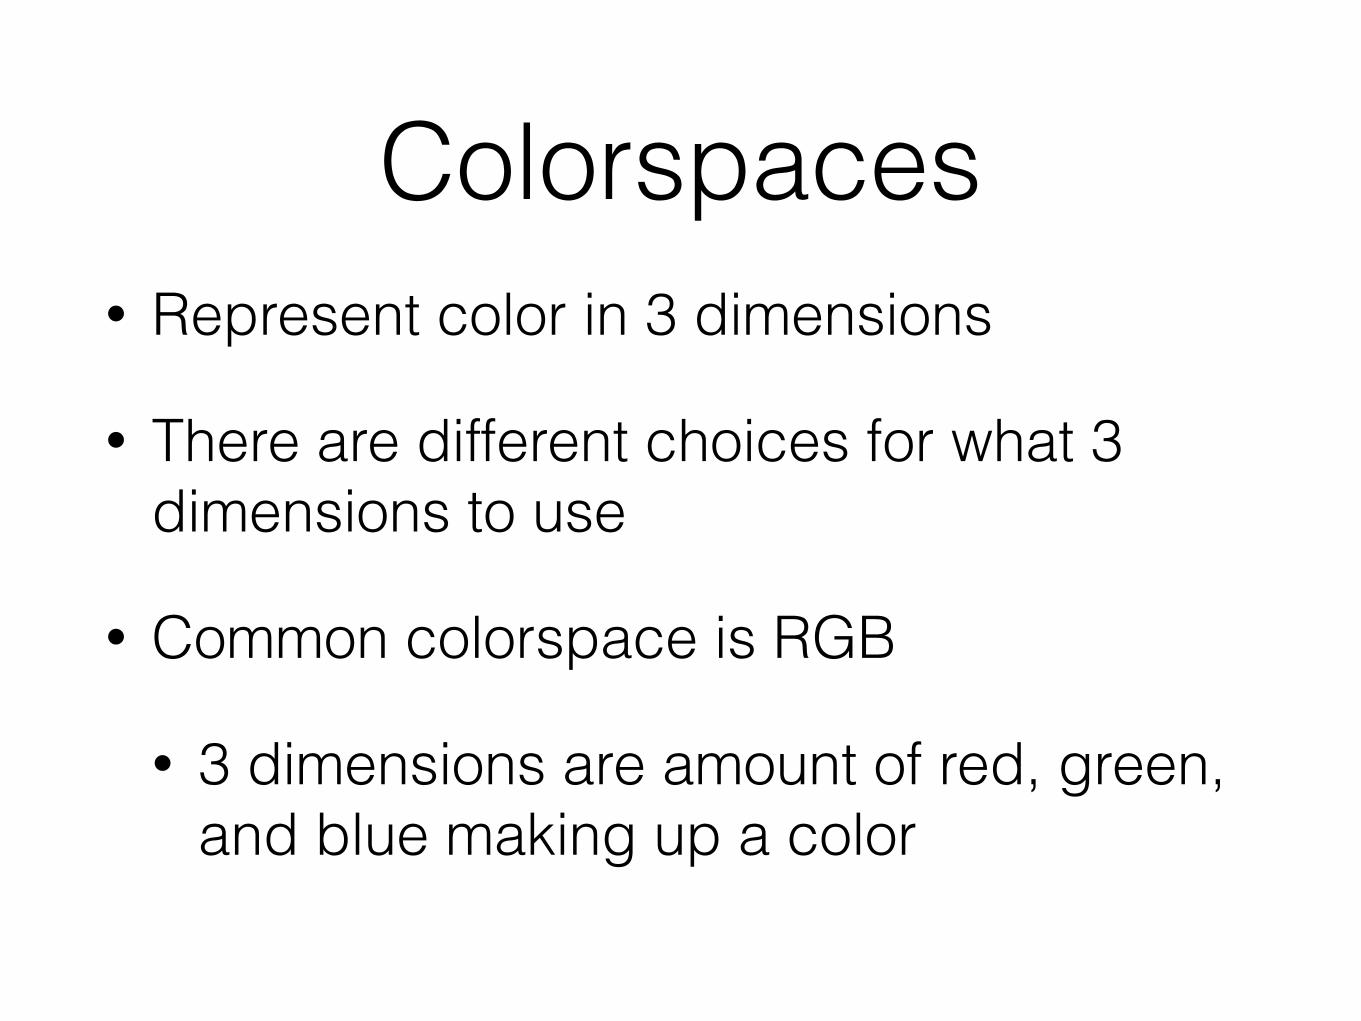
Colorspaces• Represent color in 3 dimensions
Colorspaces• Represent color in 3 dimensions
• There are different choices for what 3 dimensions to use
Colorspaces• Represent color in 3 dimensions
• There are different choices for what 3 dimensions to use
• Common colorspace is RGB
• 3 dimensions are amount of red, green, and blue making up a color
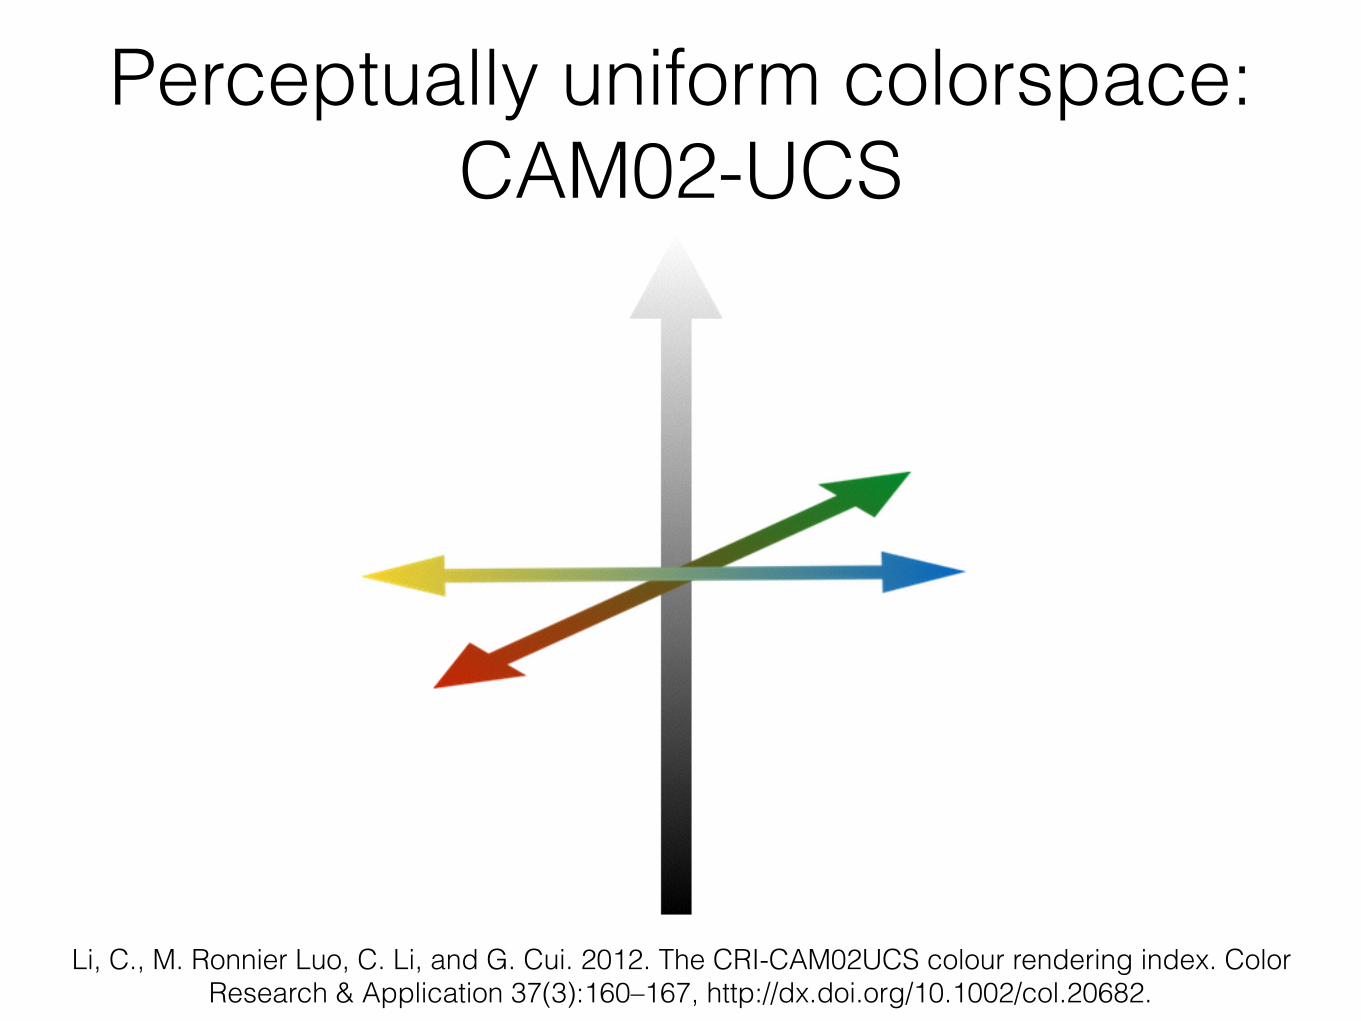
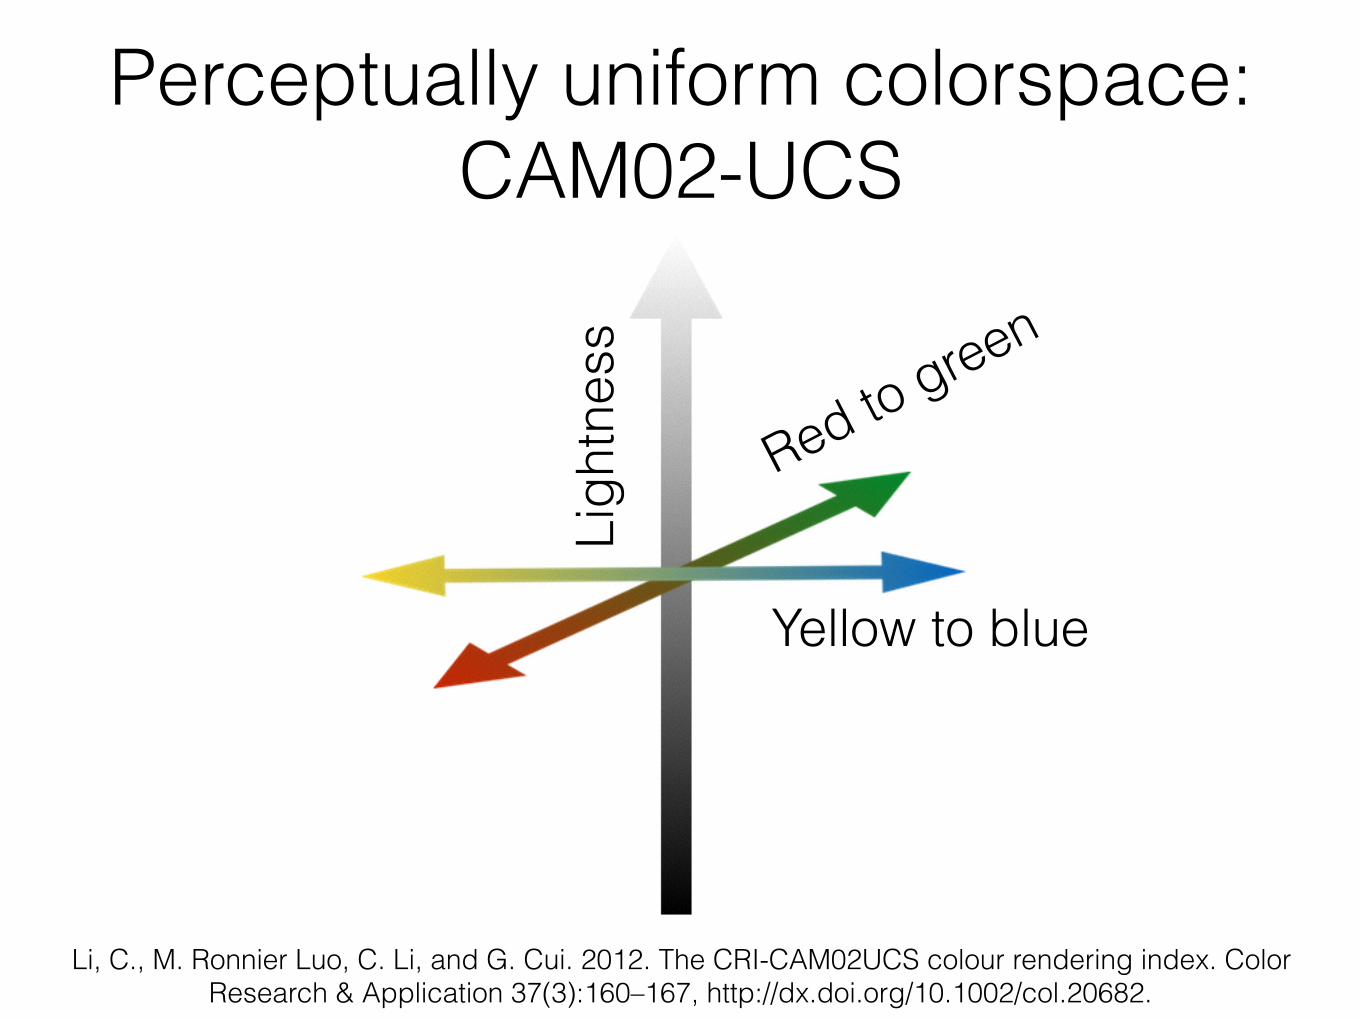
Perceptually uniform colorspace: CAM02-UCS
Li, C., M. Ronnier Luo, C. Li, and G. Cui. 2012. The CRI-CAM02UCS colour rendering index. Color Research & Application 37(3):160–167, http://dx.doi.org/10.1002/col.20682.
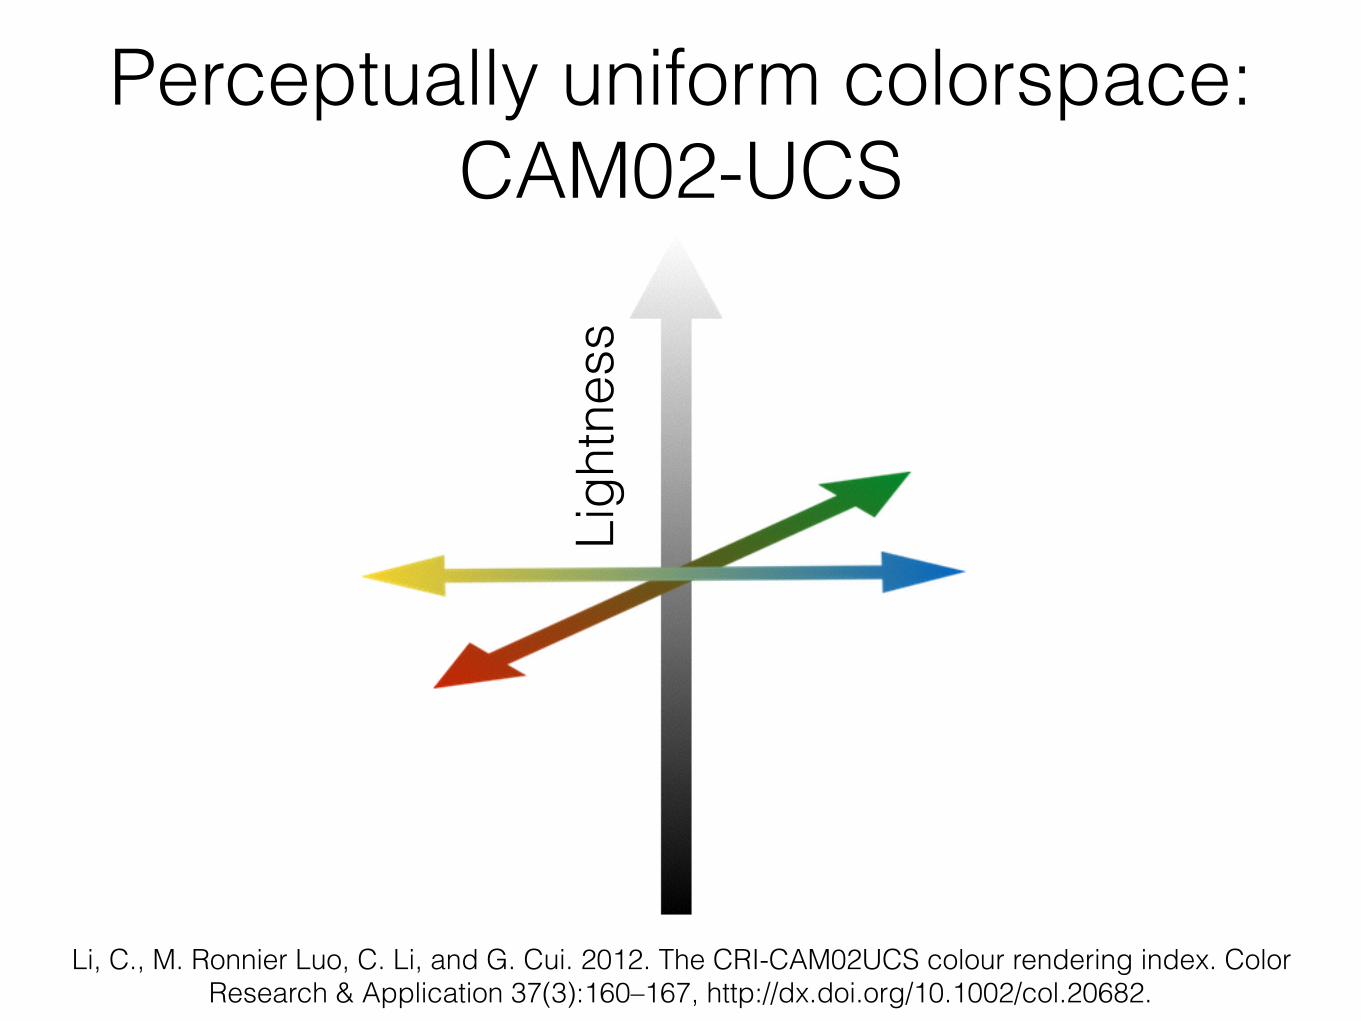
Perceptually uniform colorspace: CAM02-UCS
Li, C., M. Ronnier Luo, C. Li, and G. Cui. 2012. The CRI-CAM02UCS colour rendering index. Color Research & Application 37(3):160–167, http://dx.doi.org/10.1002/col.20682.
Ligh
tnes
s
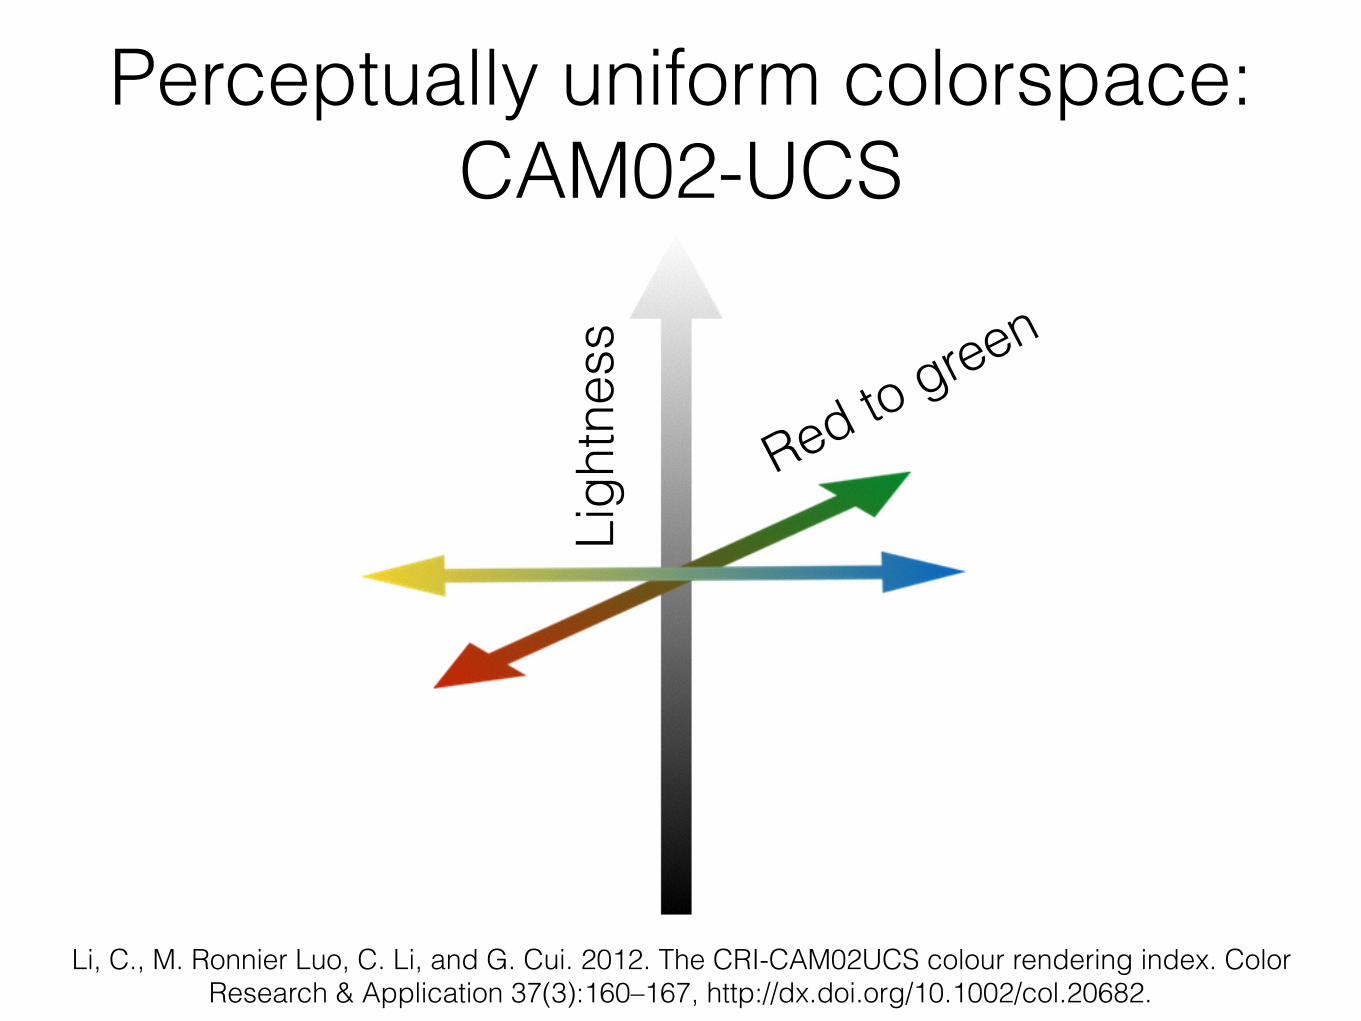
Perceptually uniform colorspace: CAM02-UCS
Li, C., M. Ronnier Luo, C. Li, and G. Cui. 2012. The CRI-CAM02UCS colour rendering index. Color Research & Application 37(3):160–167, http://dx.doi.org/10.1002/col.20682.
Ligh
tnes
s
Red to green
Perceptually uniform colorspace: CAM02-UCS
Li, C., M. Ronnier Luo, C. Li, and G. Cui. 2012. The CRI-CAM02UCS colour rendering index. Color Research & Application 37(3):160–167, http://dx.doi.org/10.1002/col.20682.
Ligh
tnes
s
Red to green
Yellow to blue
Perceptually uniform colorspace: CAM02-UCS
Li, C., M. Ronnier Luo, C. Li, and G. Cui. 2012. The CRI-CAM02UCS colour rendering index. Color Research & Application 37(3):160–167, http://dx.doi.org/10.1002/col.20682.
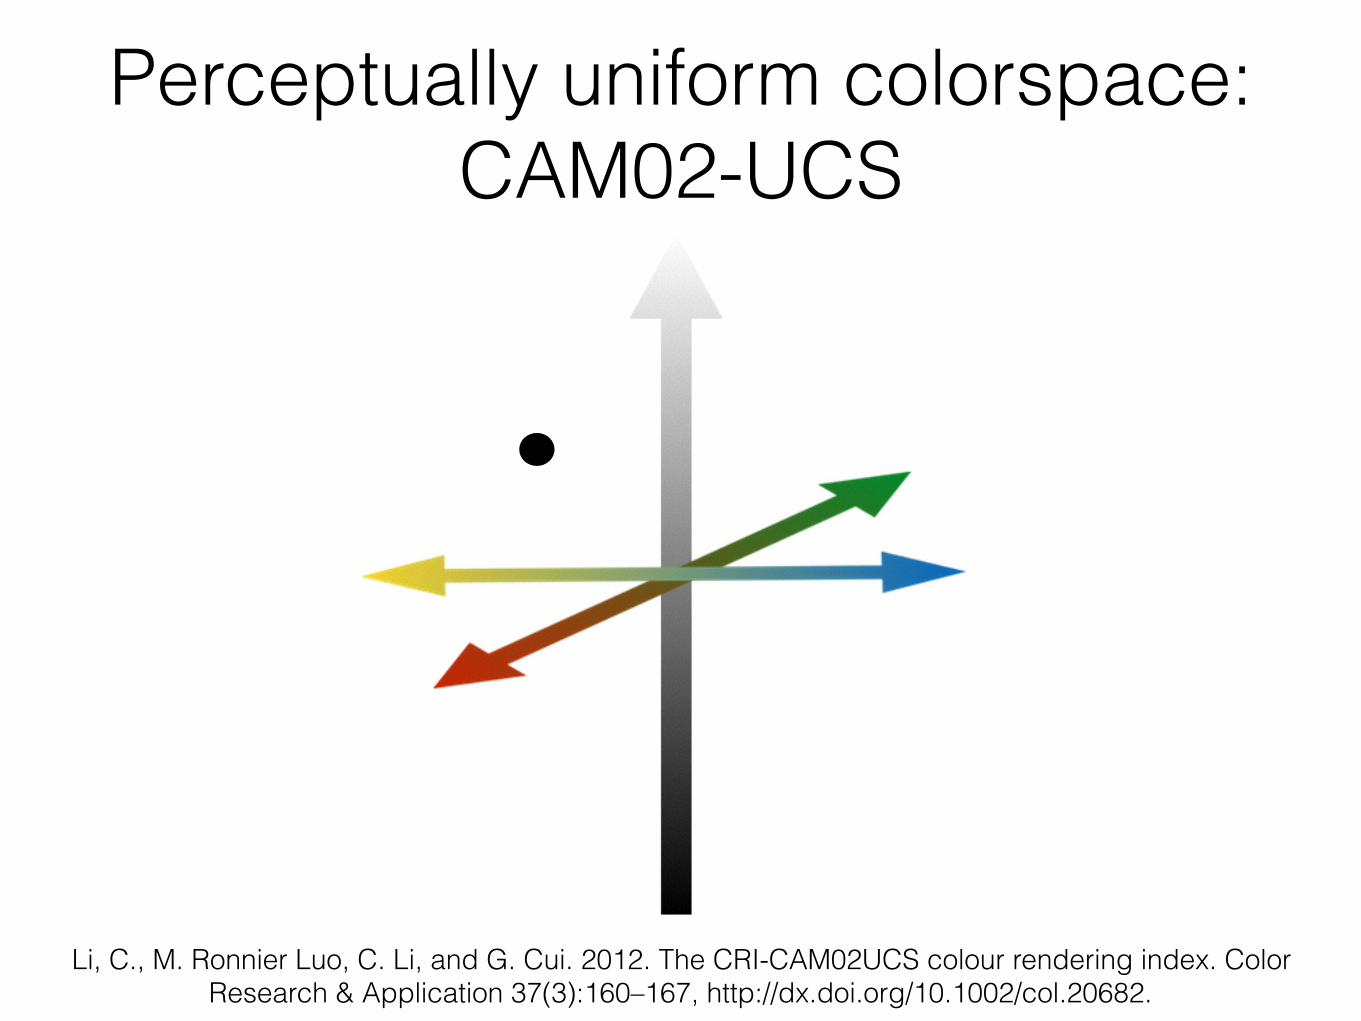
Perceptually uniform colorspace: CAM02-UCS
Li, C., M. Ronnier Luo, C. Li, and G. Cui. 2012. The CRI-CAM02UCS colour rendering index. Color Research & Application 37(3):160–167, http://dx.doi.org/10.1002/col.20682.
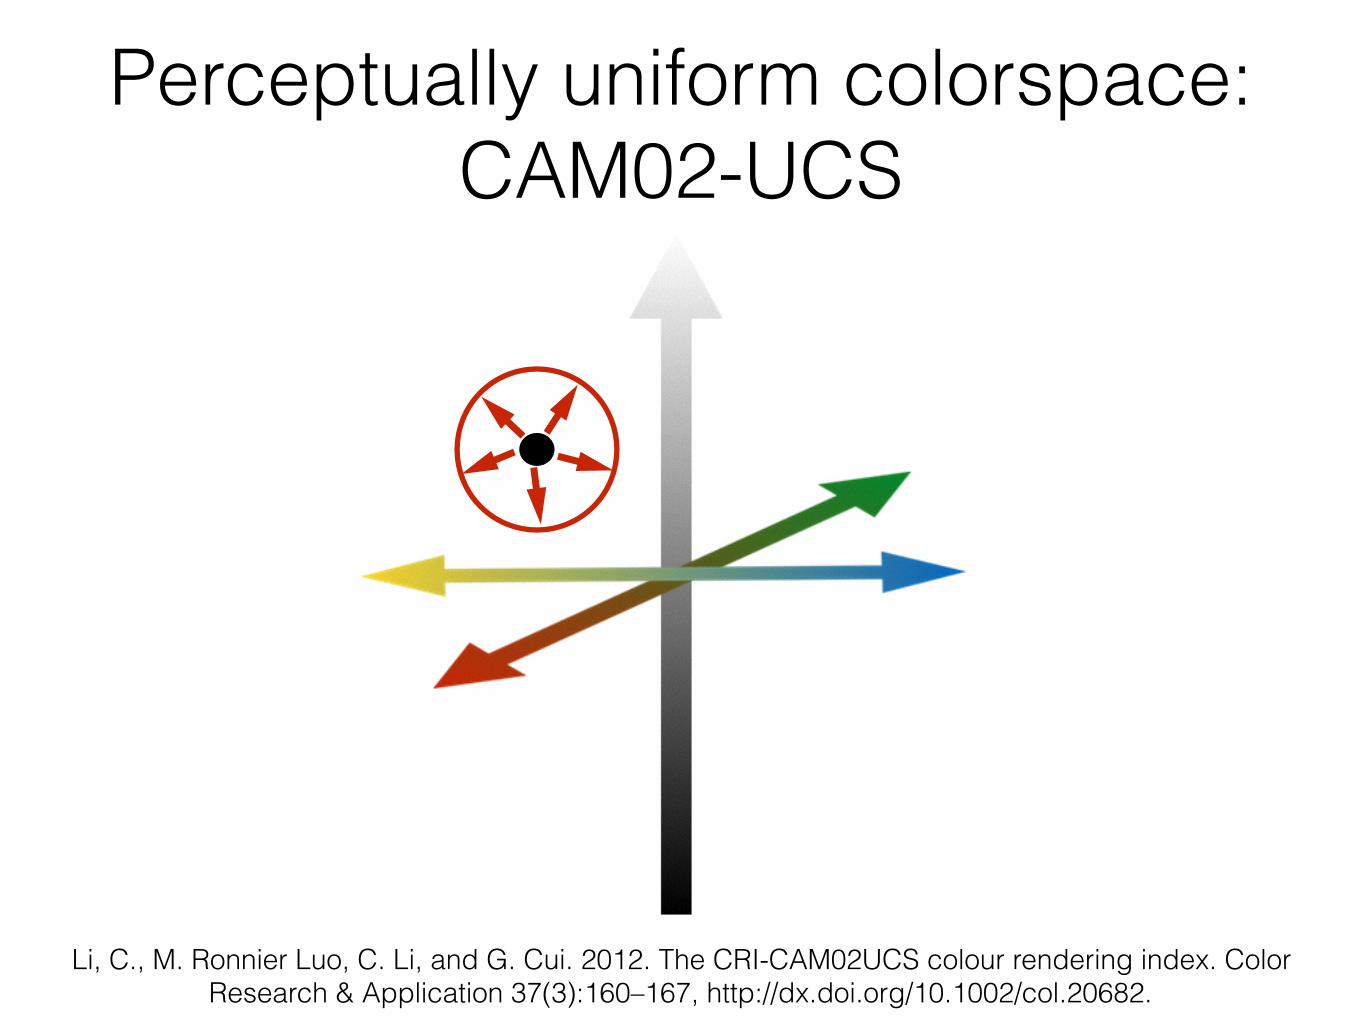
Perceptually uniform colorspace: CAM02-UCS
Li, C., M. Ronnier Luo, C. Li, and G. Cui. 2012. The CRI-CAM02UCS colour rendering index. Color Research & Application 37(3):160–167, http://dx.doi.org/10.1002/col.20682.
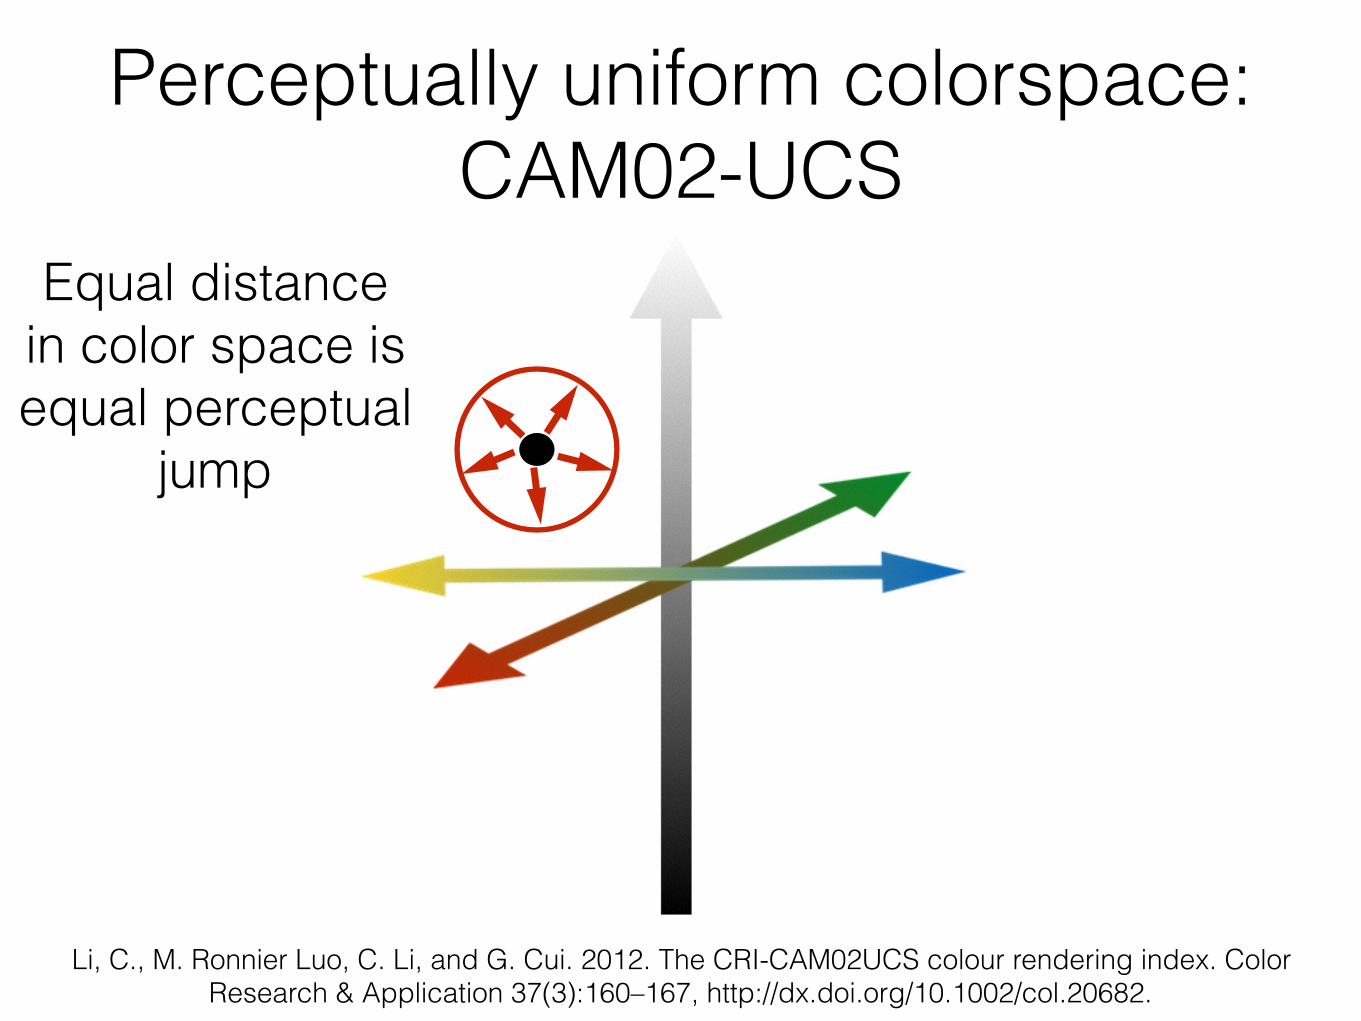
Equal distance in color space is equal perceptual
jump
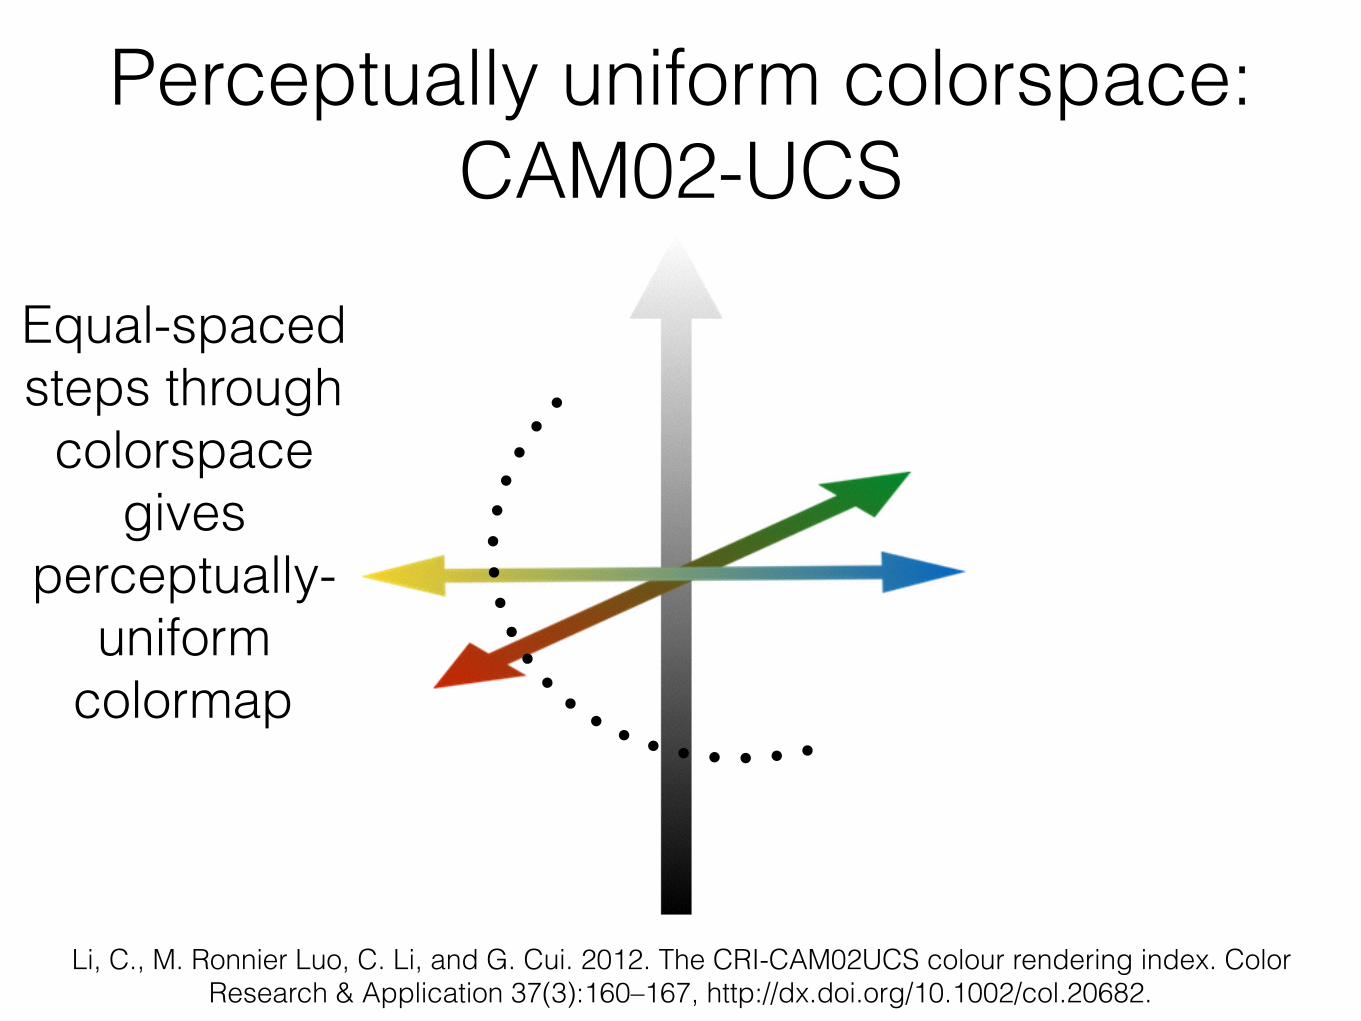
Perceptually uniform colorspace: CAM02-UCS
Li, C., M. Ronnier Luo, C. Li, and G. Cui. 2012. The CRI-CAM02UCS colour rendering index. Color Research & Application 37(3):160–167, http://dx.doi.org/10.1002/col.20682.
Equal-spaced steps through
colorspace gives
perceptually-uniform
colormap
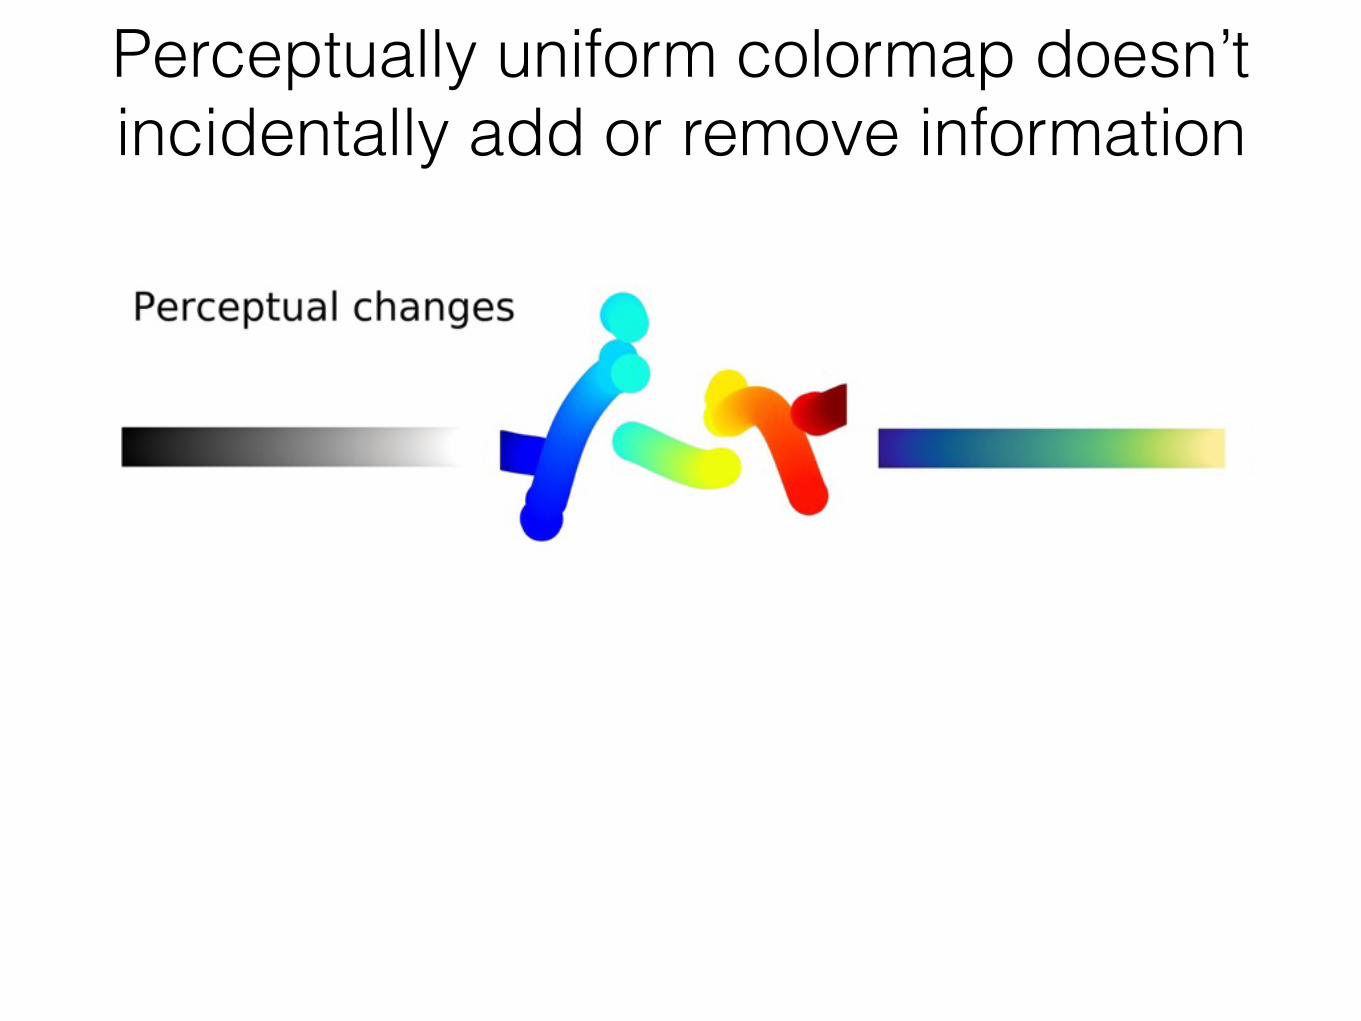
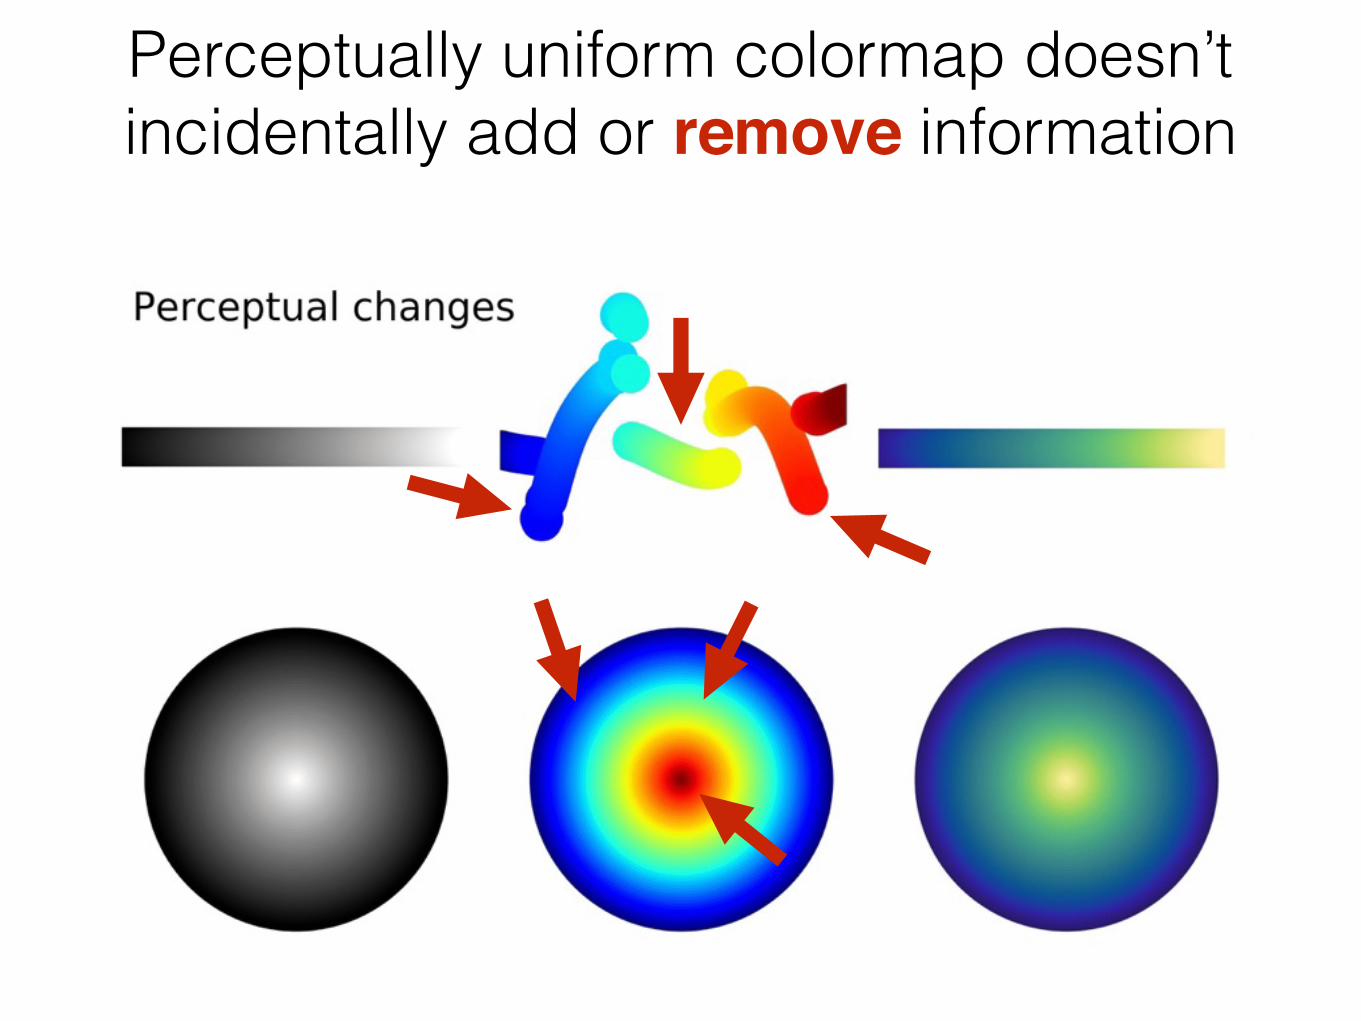
Perceptually uniform colormap doesn’t incidentally add or remove information
Perceptually uniform colormap doesn’t incidentally add or remove information
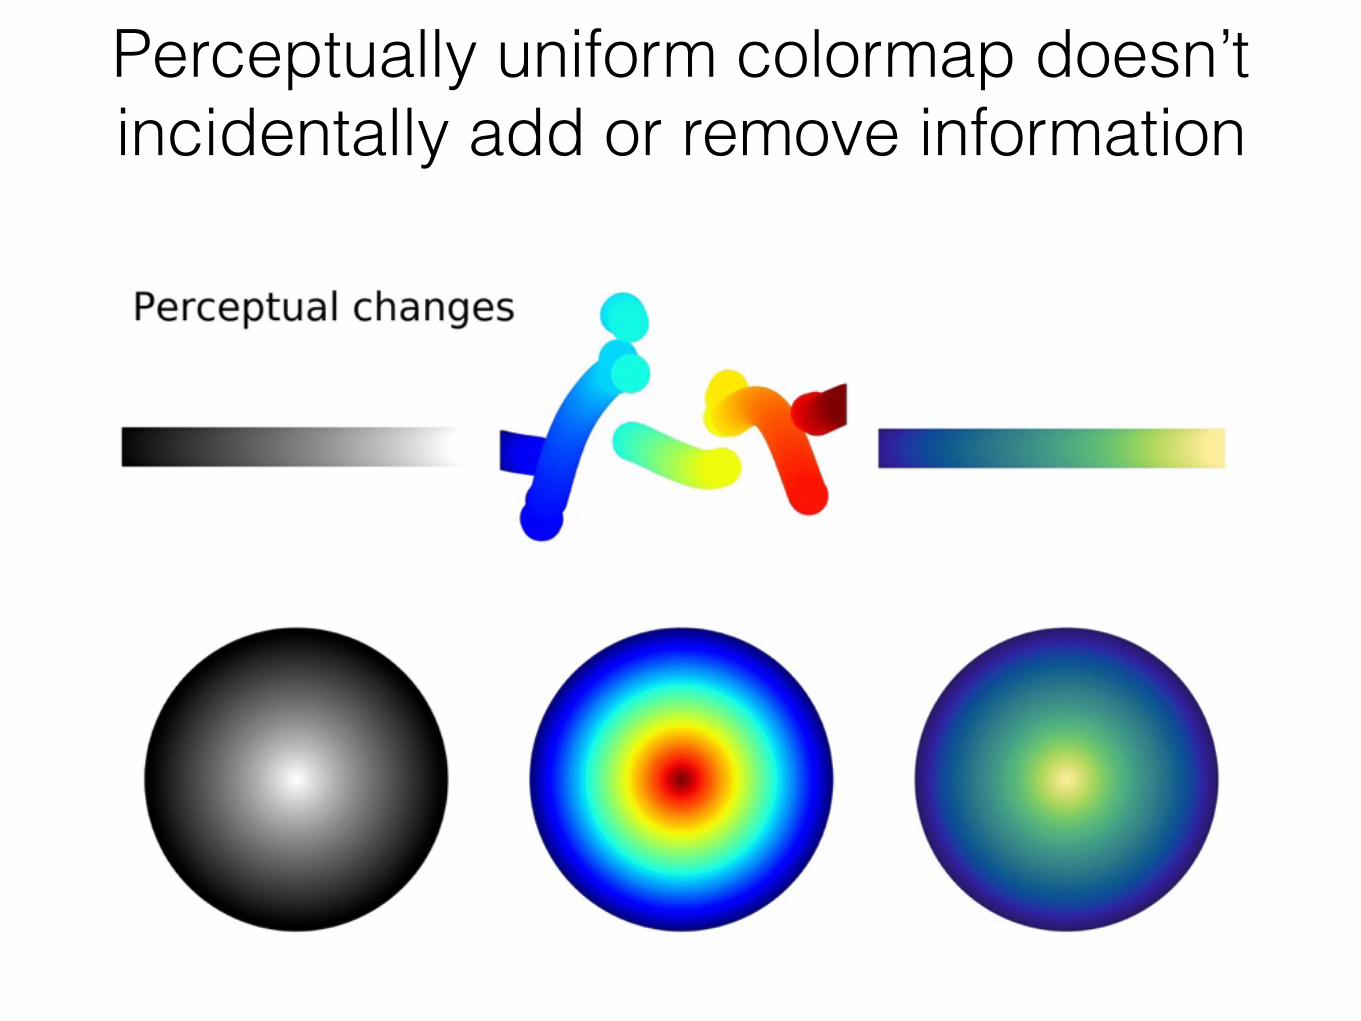
Perceptually uniform colormap doesn’t incidentally add or remove information
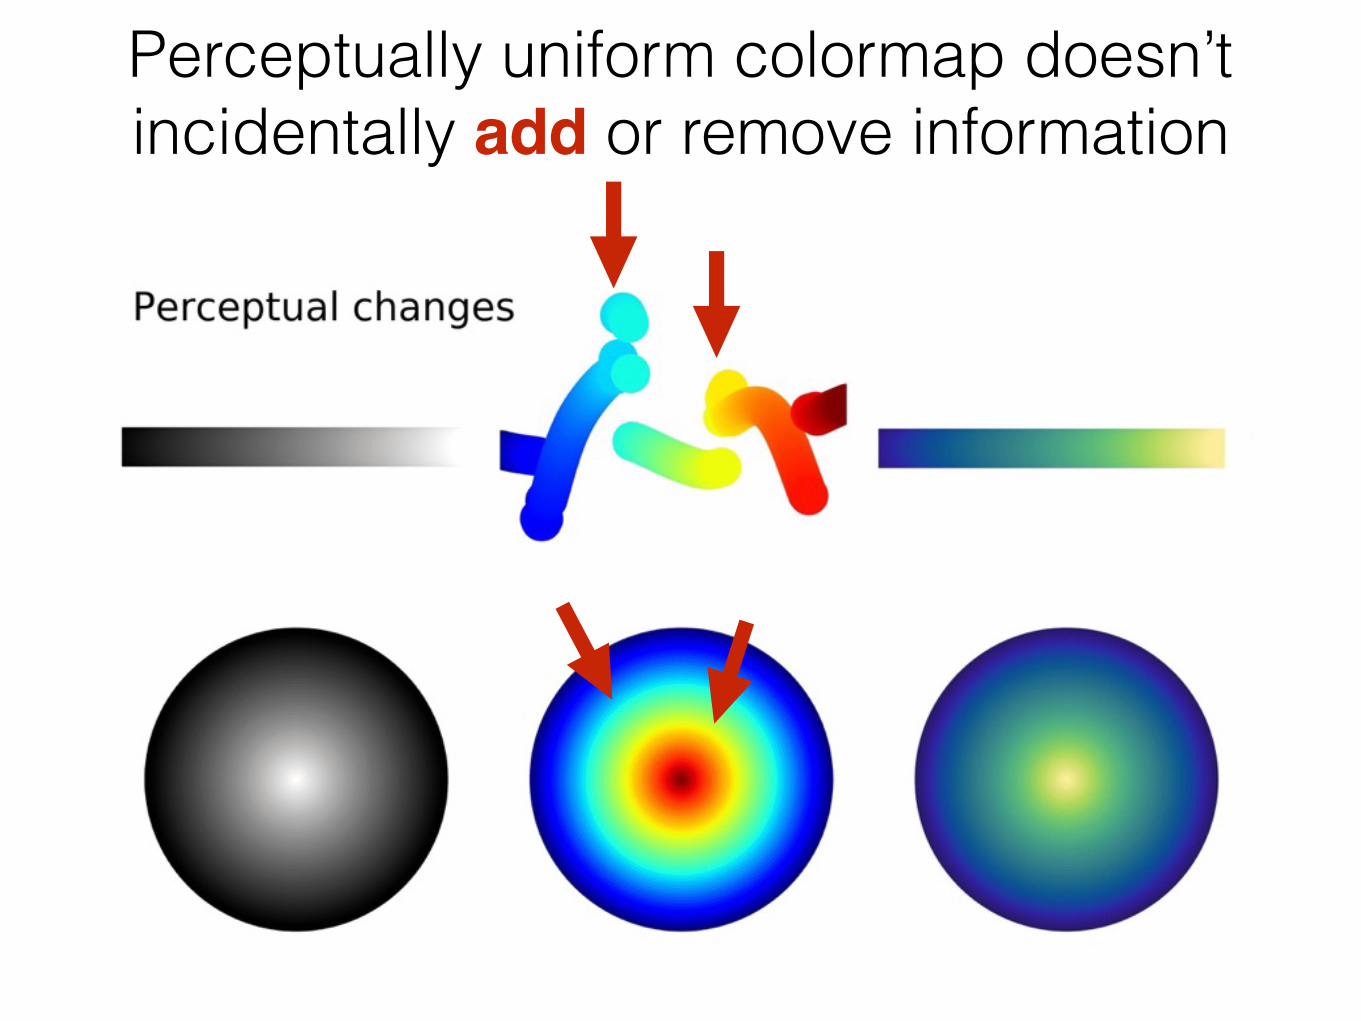
Perceptually uniform colormap doesn’t incidentally add or remove information
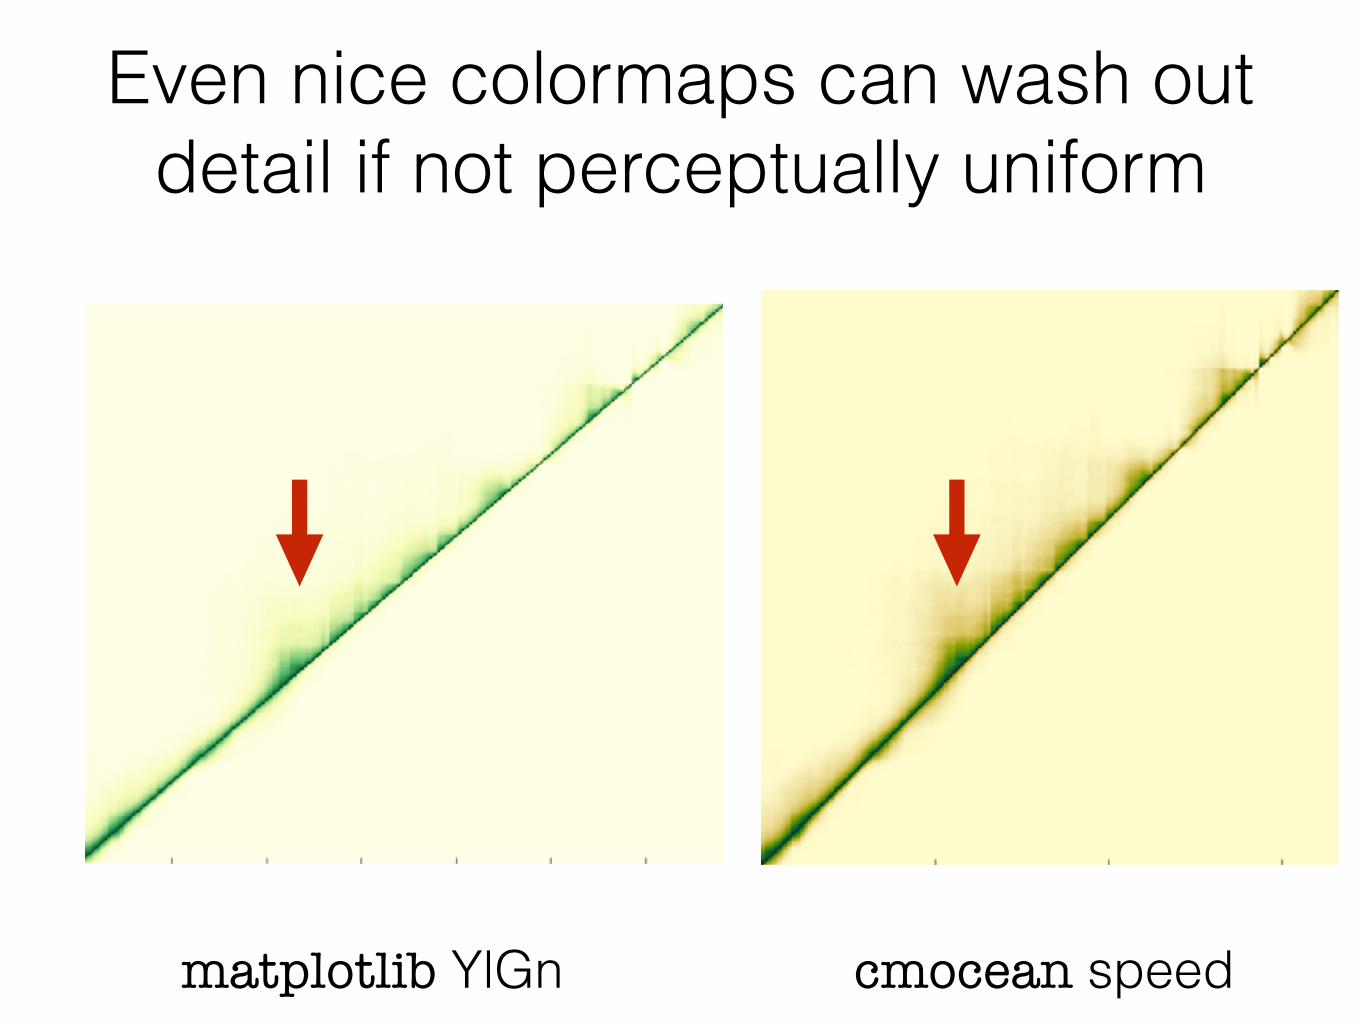
Even nice colormaps can wash out detail if not perceptually uniform
matplotlib YlGn cmocean speed
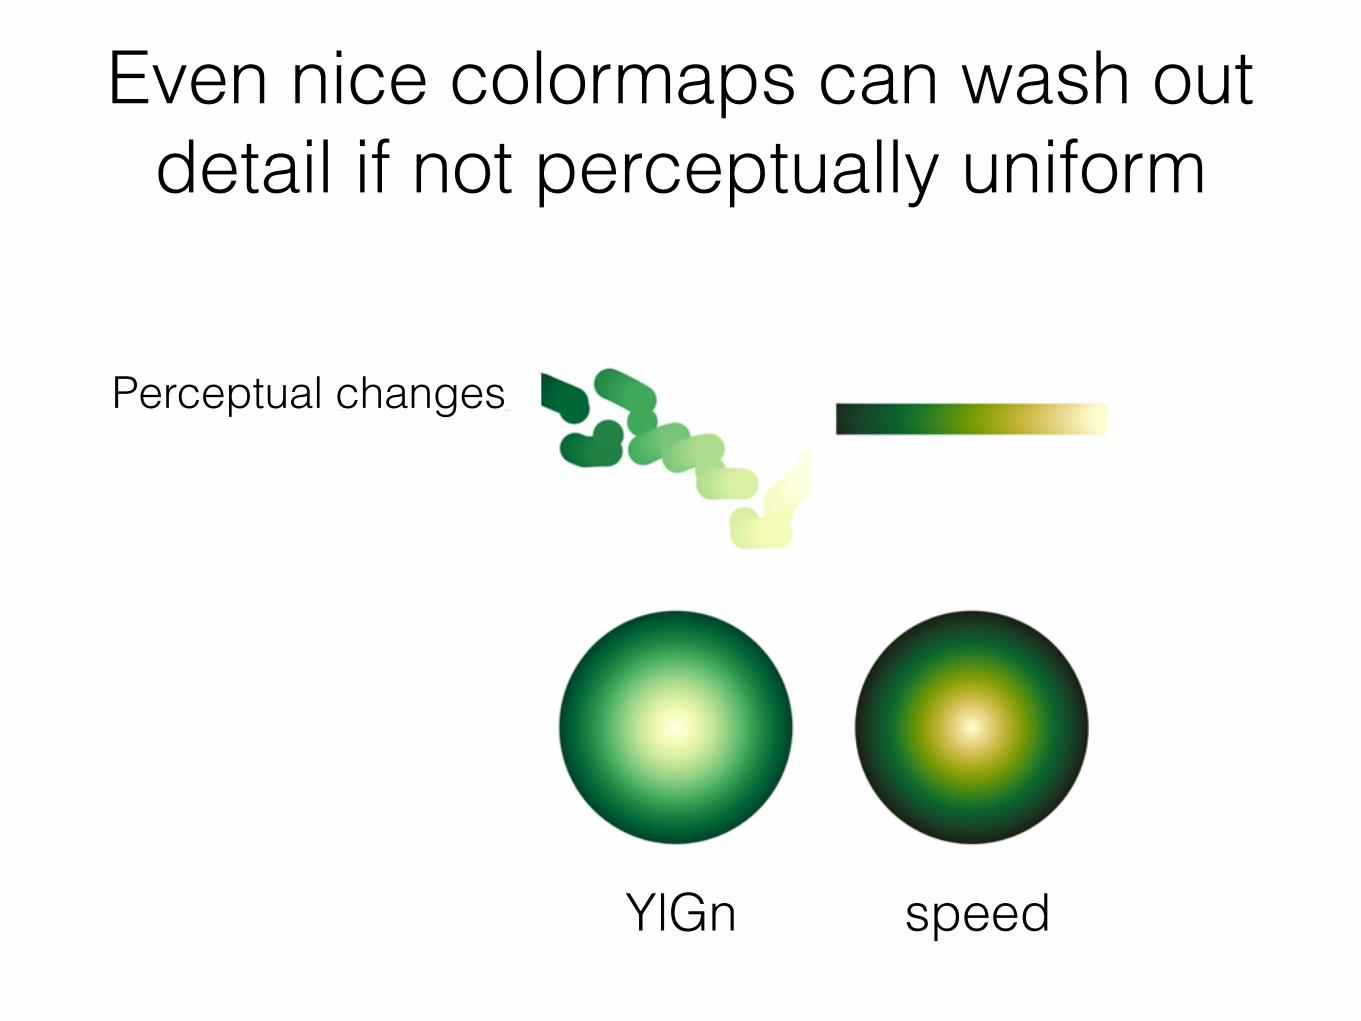
Even nice colormaps can wash out detail if not perceptually uniform
Perceptual changes
YlGn speed
Importance of lightness
• People interpret spatial structure of data best when mapped by lightness
• not hue!
• Use lightness strategically to show data
Ware, C. (1988). Color sequences for univariate maps: Theory, experiments and principles. IEEE Computer Graphics and Applications, 8(5), 41-49.
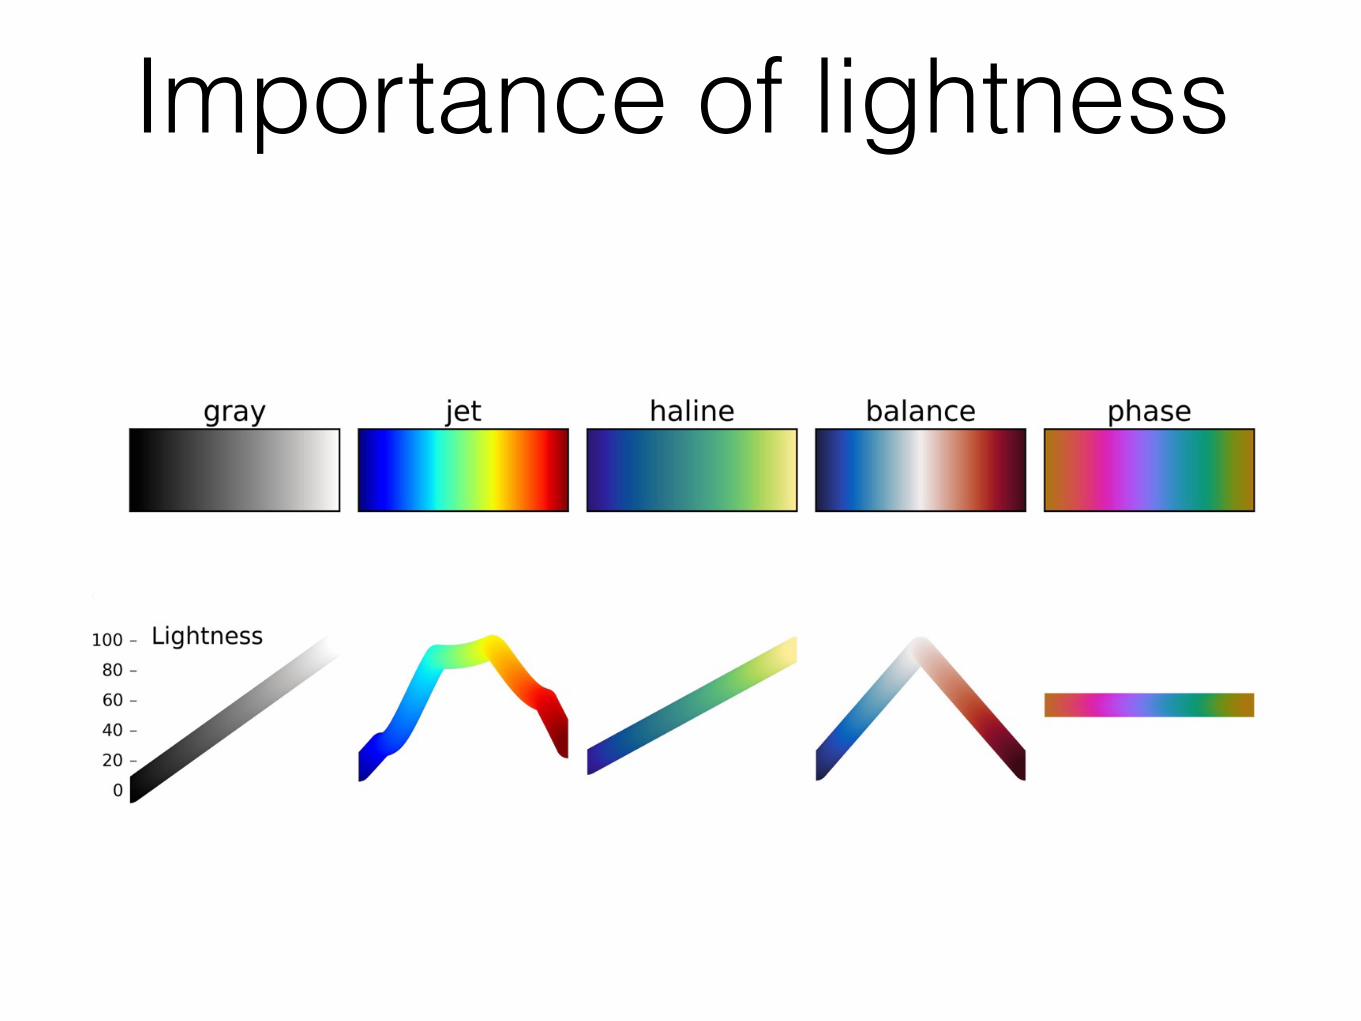
Importance of lightness
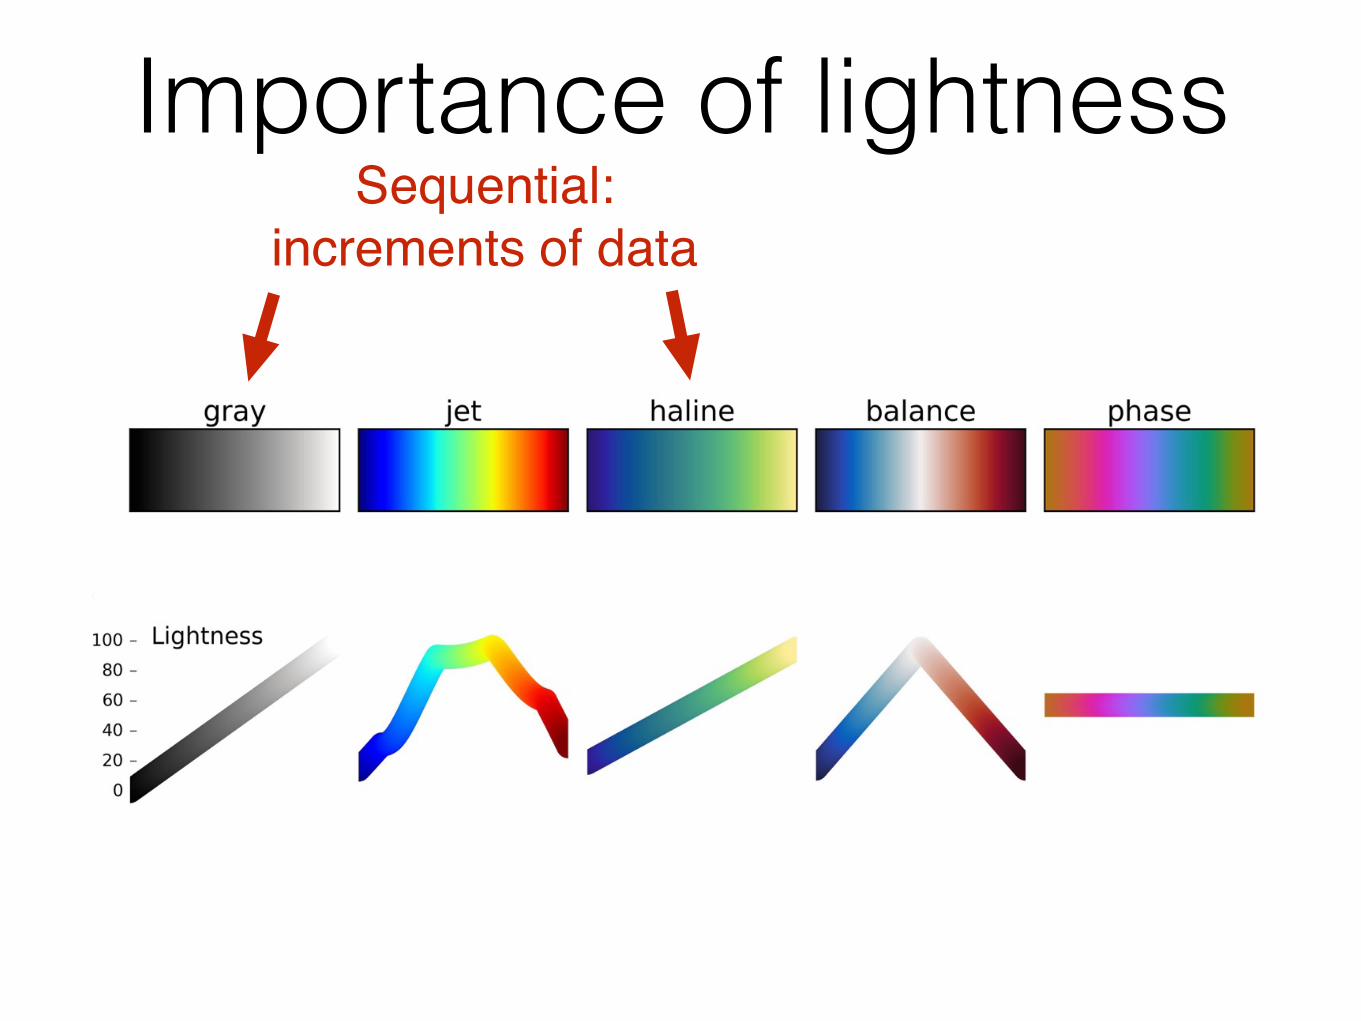
Importance of lightnessSequential:
increments of data
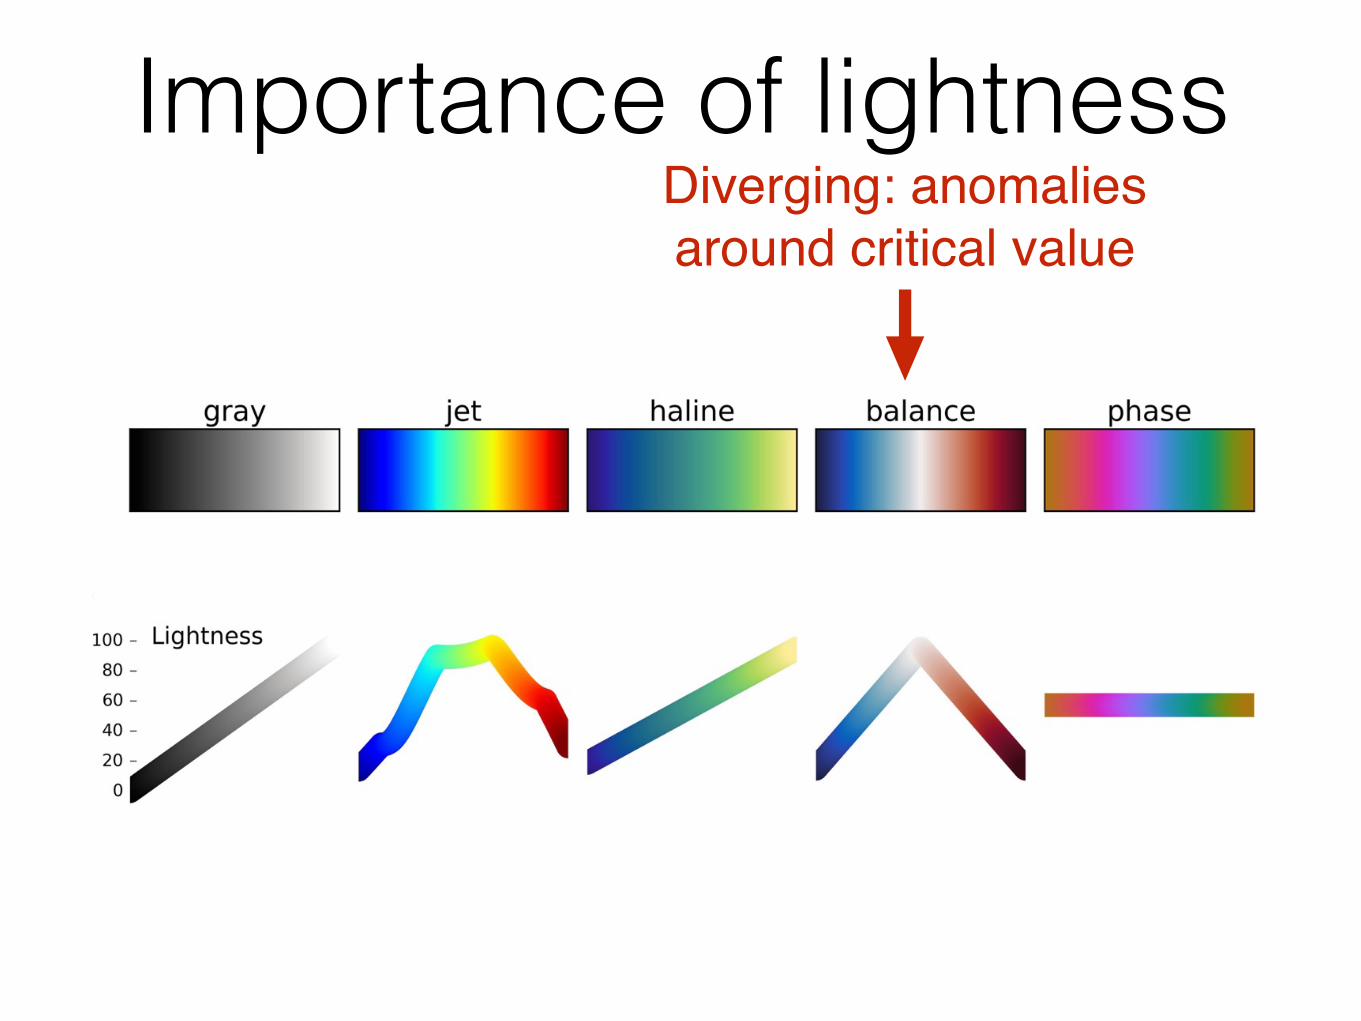
Importance of lightnessDiverging: anomalies around critical value
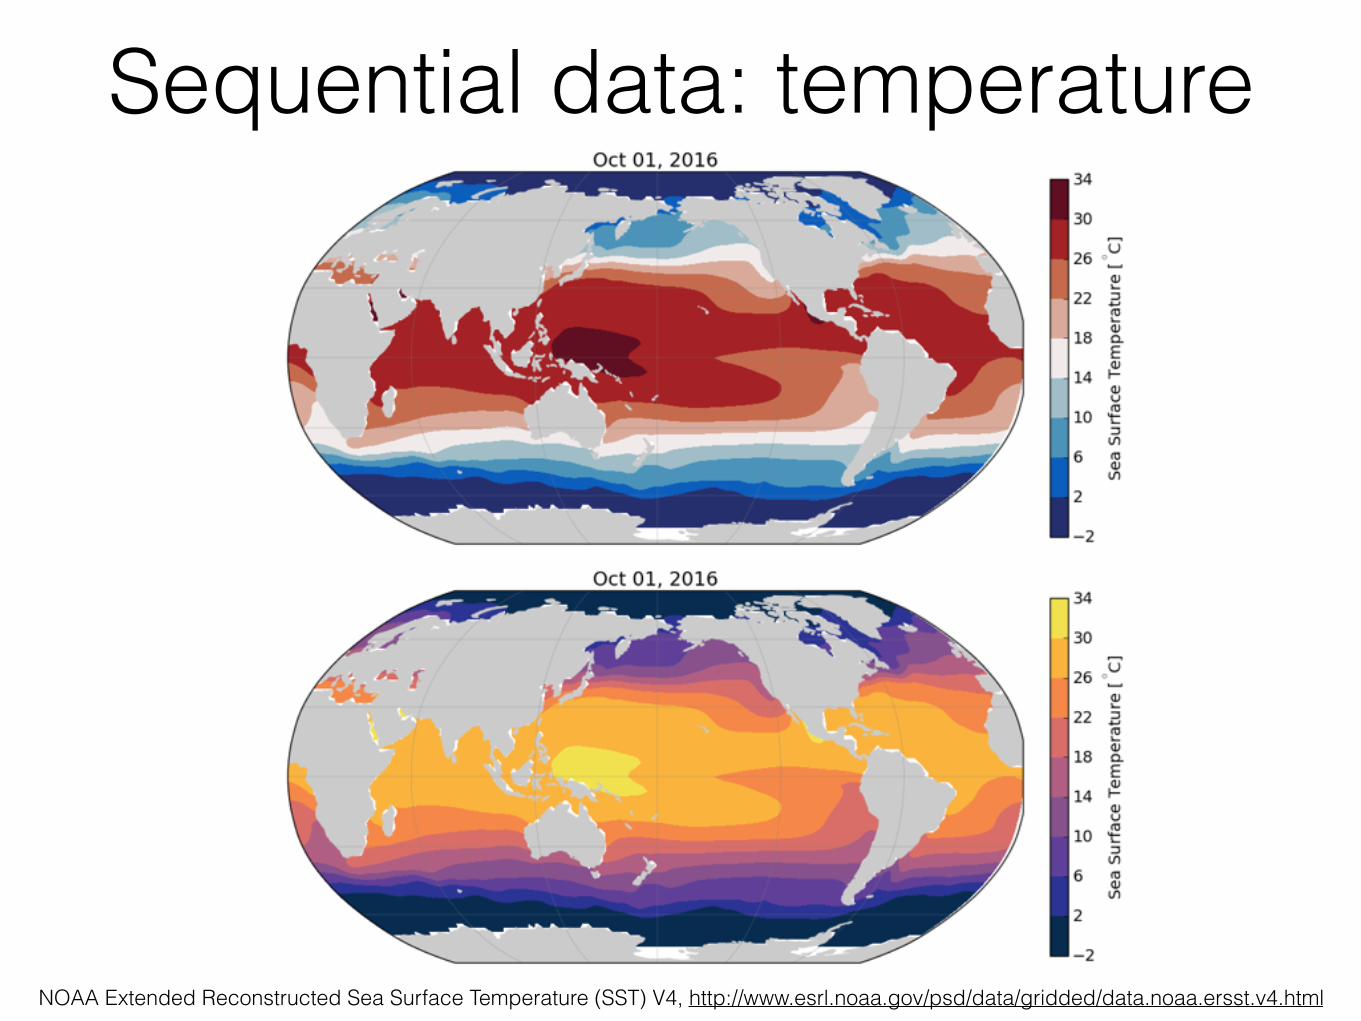
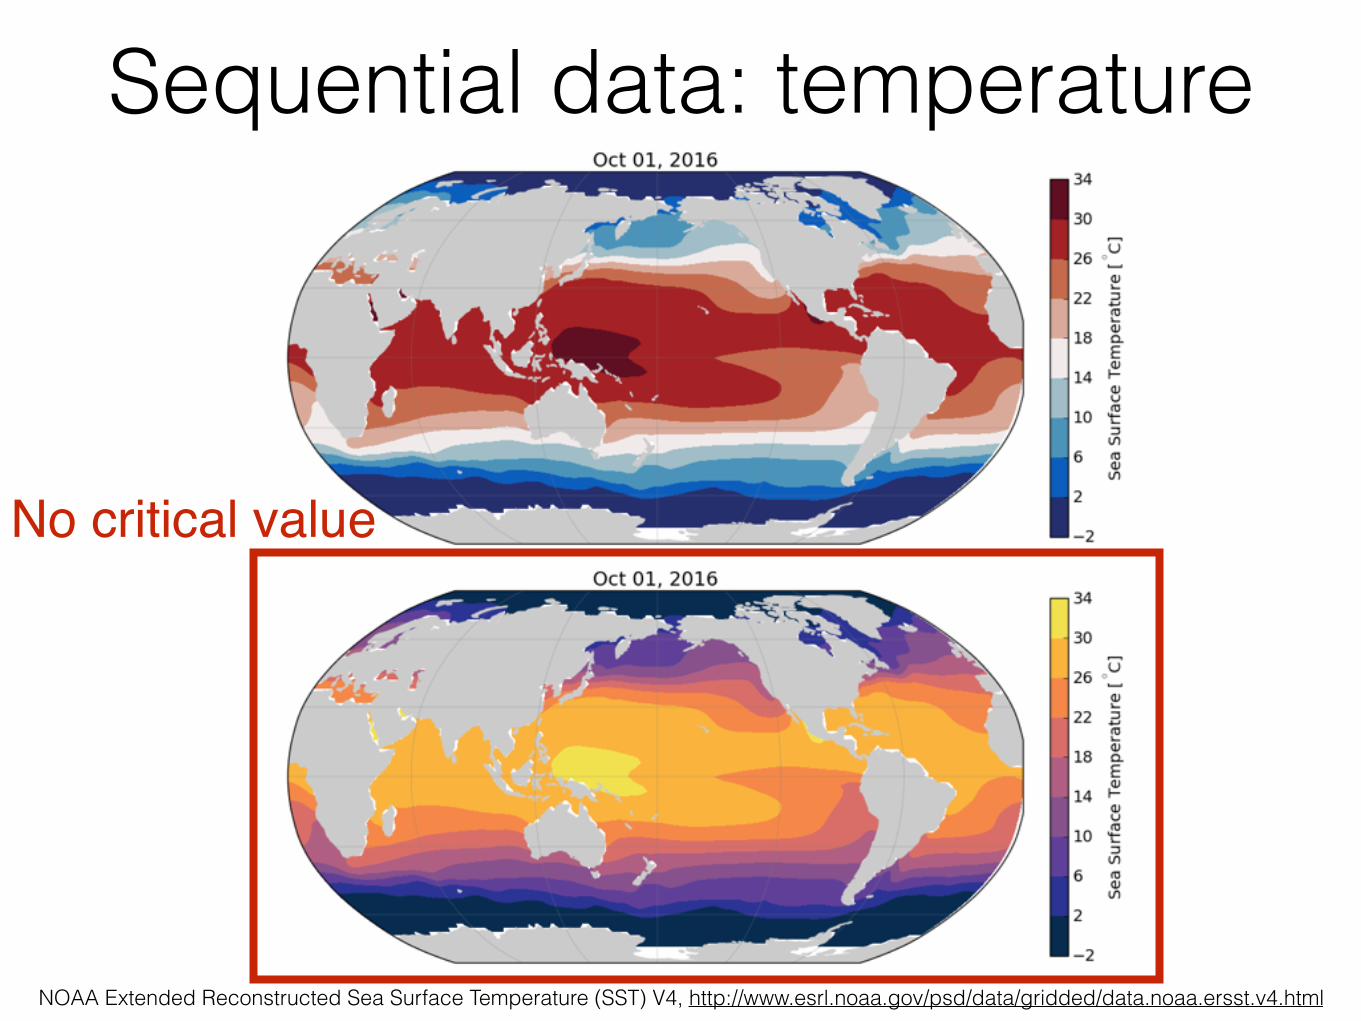
Sequential data: temperature
NOAA Extended Reconstructed Sea Surface Temperature (SST) V4, http://www.esrl.noaa.gov/psd/data/gridded/data.noaa.ersst.v4.html
Sequential data: temperature
NOAA Extended Reconstructed Sea Surface Temperature (SST) V4, http://www.esrl.noaa.gov/psd/data/gridded/data.noaa.ersst.v4.html
No critical value
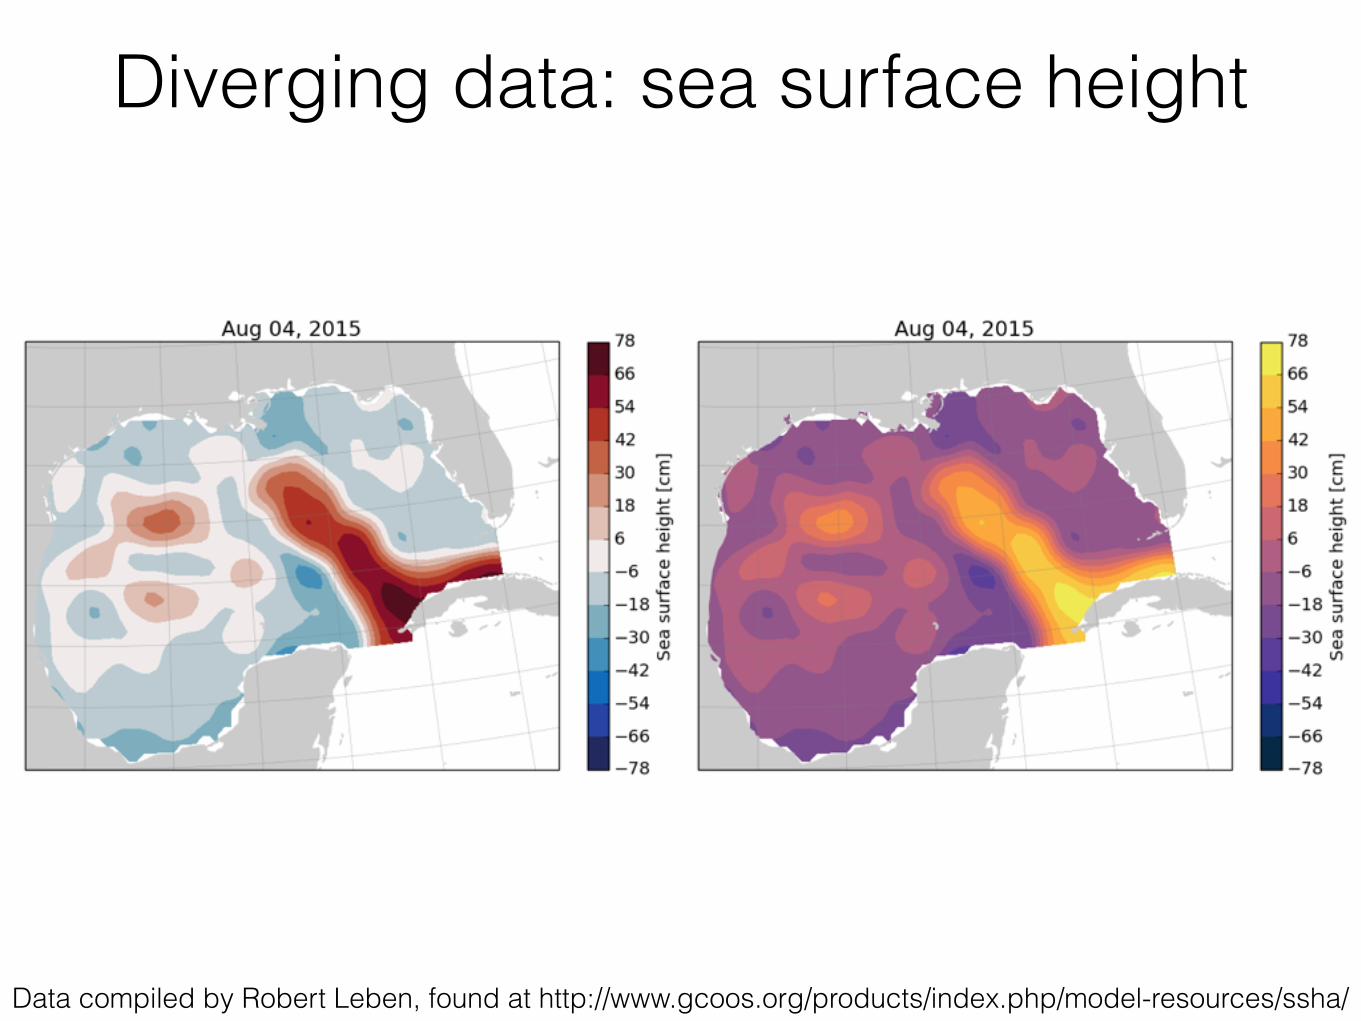
Diverging data: sea surface height
Data compiled by Robert Leben, found at http://www.gcoos.org/products/index.php/model-resources/ssha/
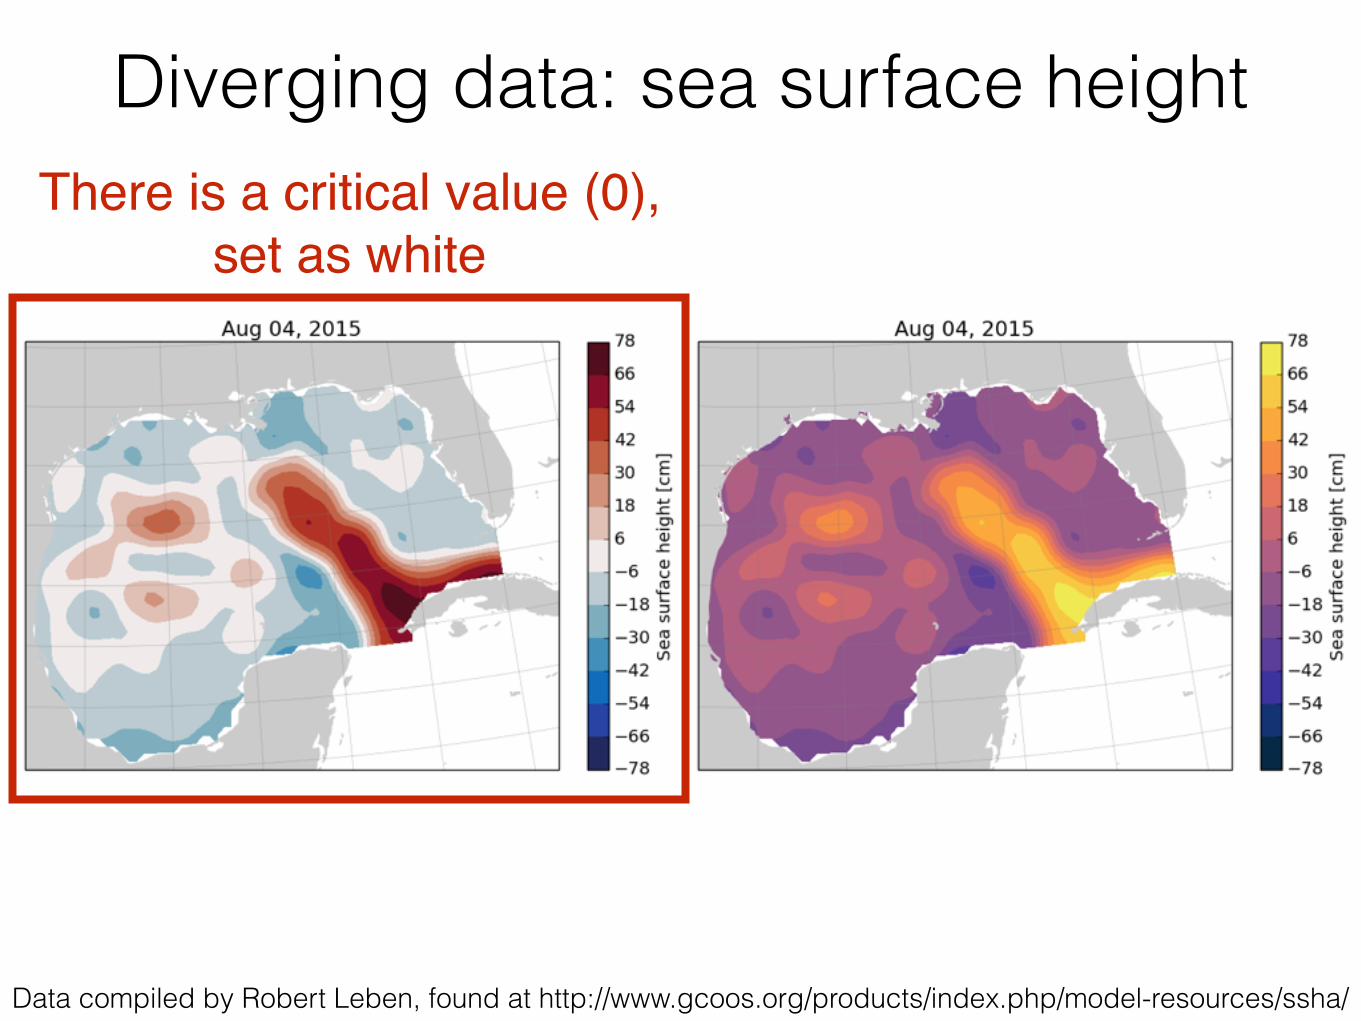
Diverging data: sea surface heightThere is a critical value (0),
set as white
Data compiled by Robert Leben, found at http://www.gcoos.org/products/index.php/model-resources/ssha/

Importance of lightness
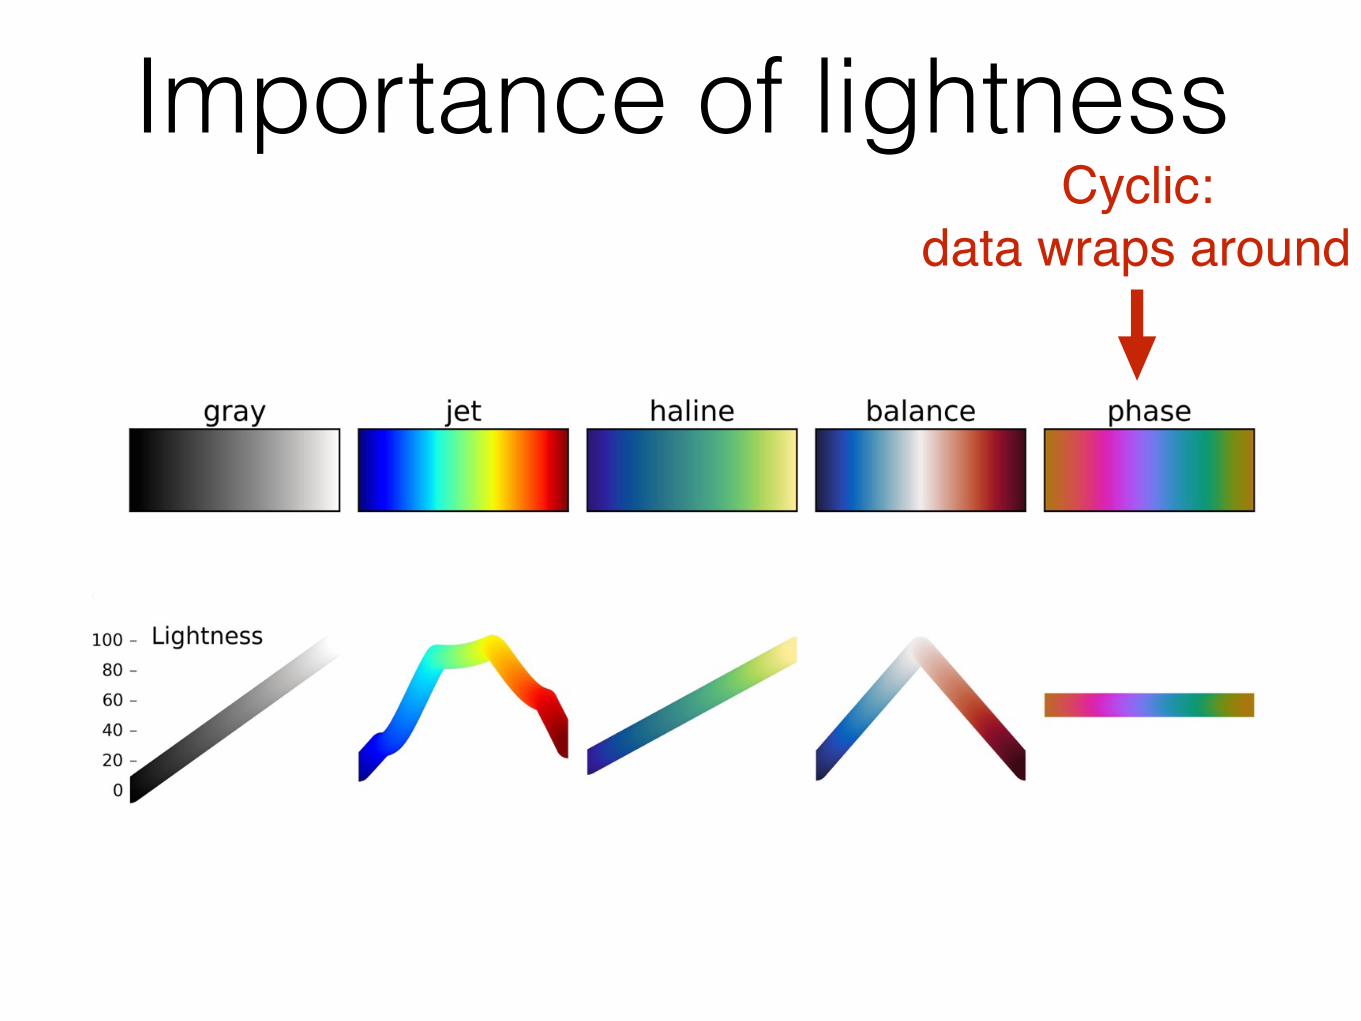
Importance of lightnessCyclic:
data wraps around
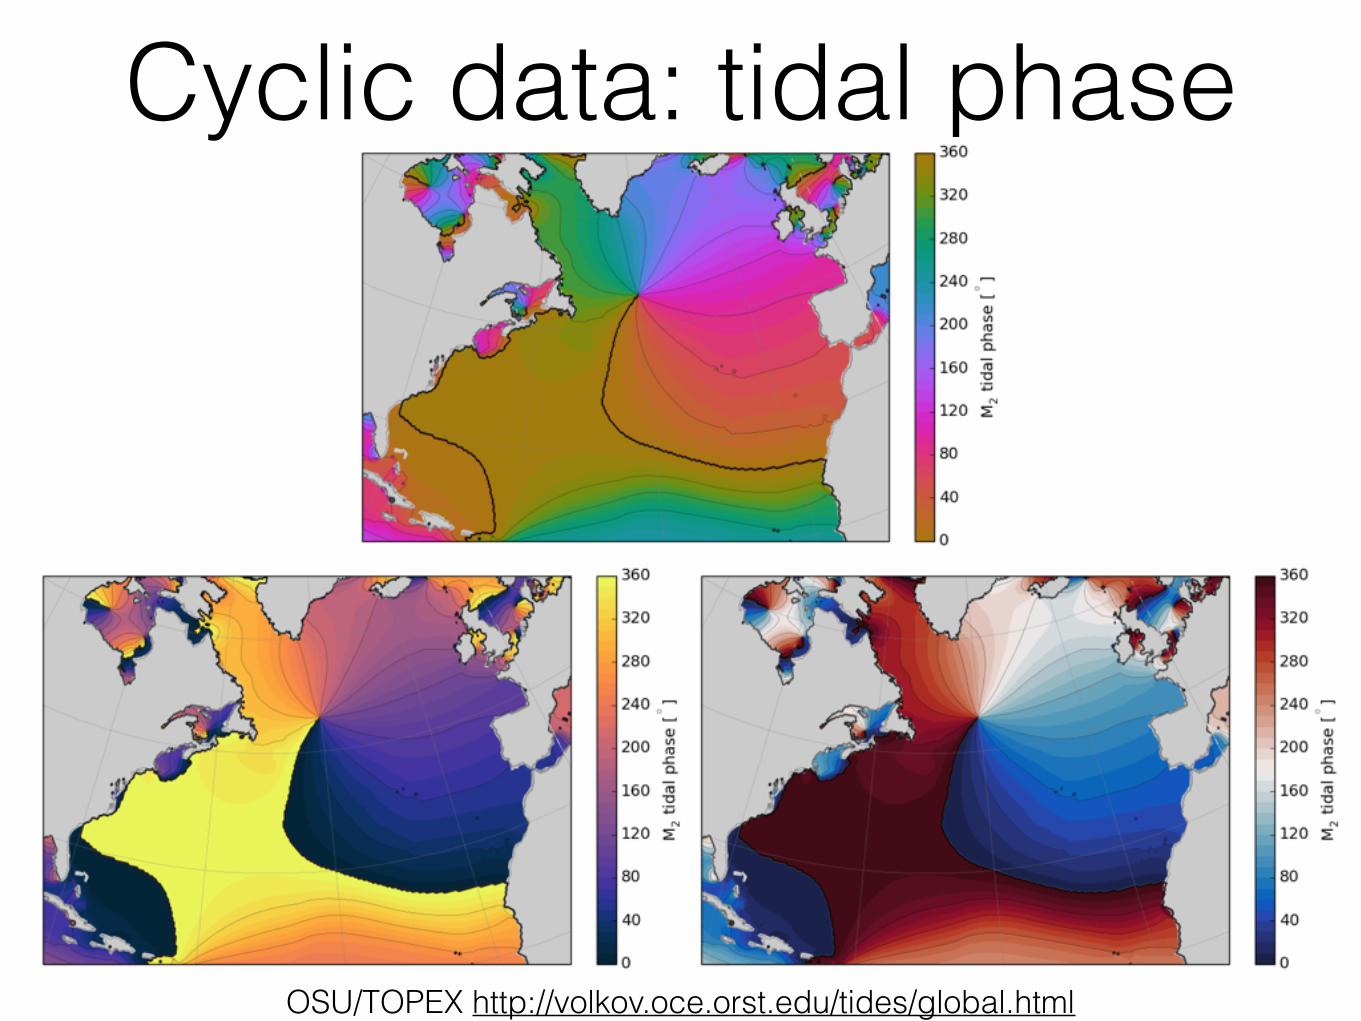
Cyclic data: tidal phase
OSU/TOPEX http://volkov.oce.orst.edu/tides/global.html
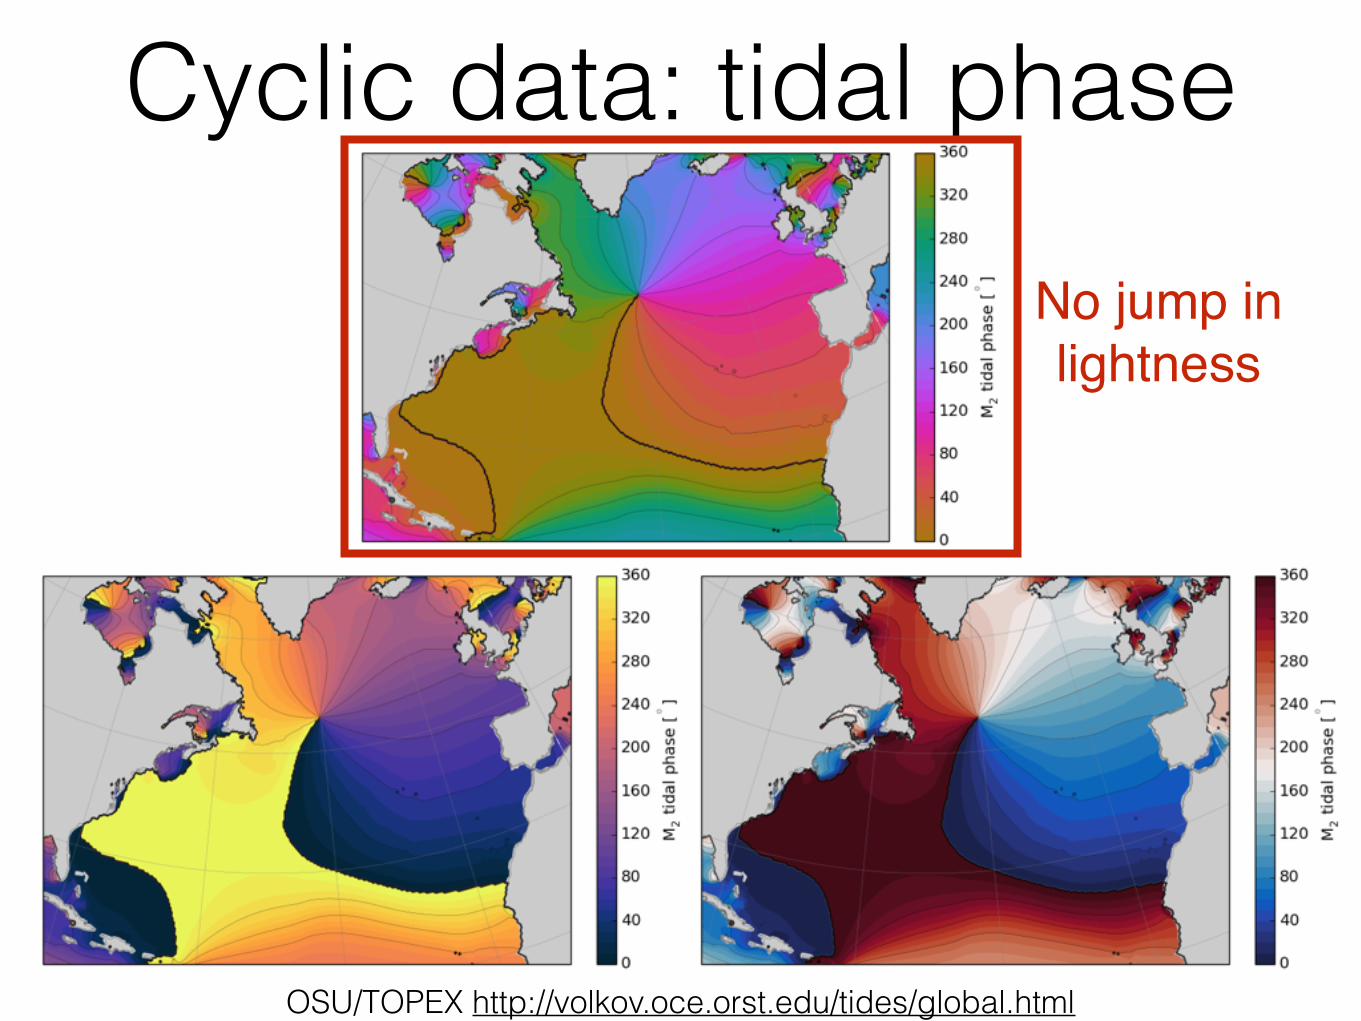
Cyclic data: tidal phase
OSU/TOPEX http://volkov.oce.orst.edu/tides/global.html
No jump in lightness
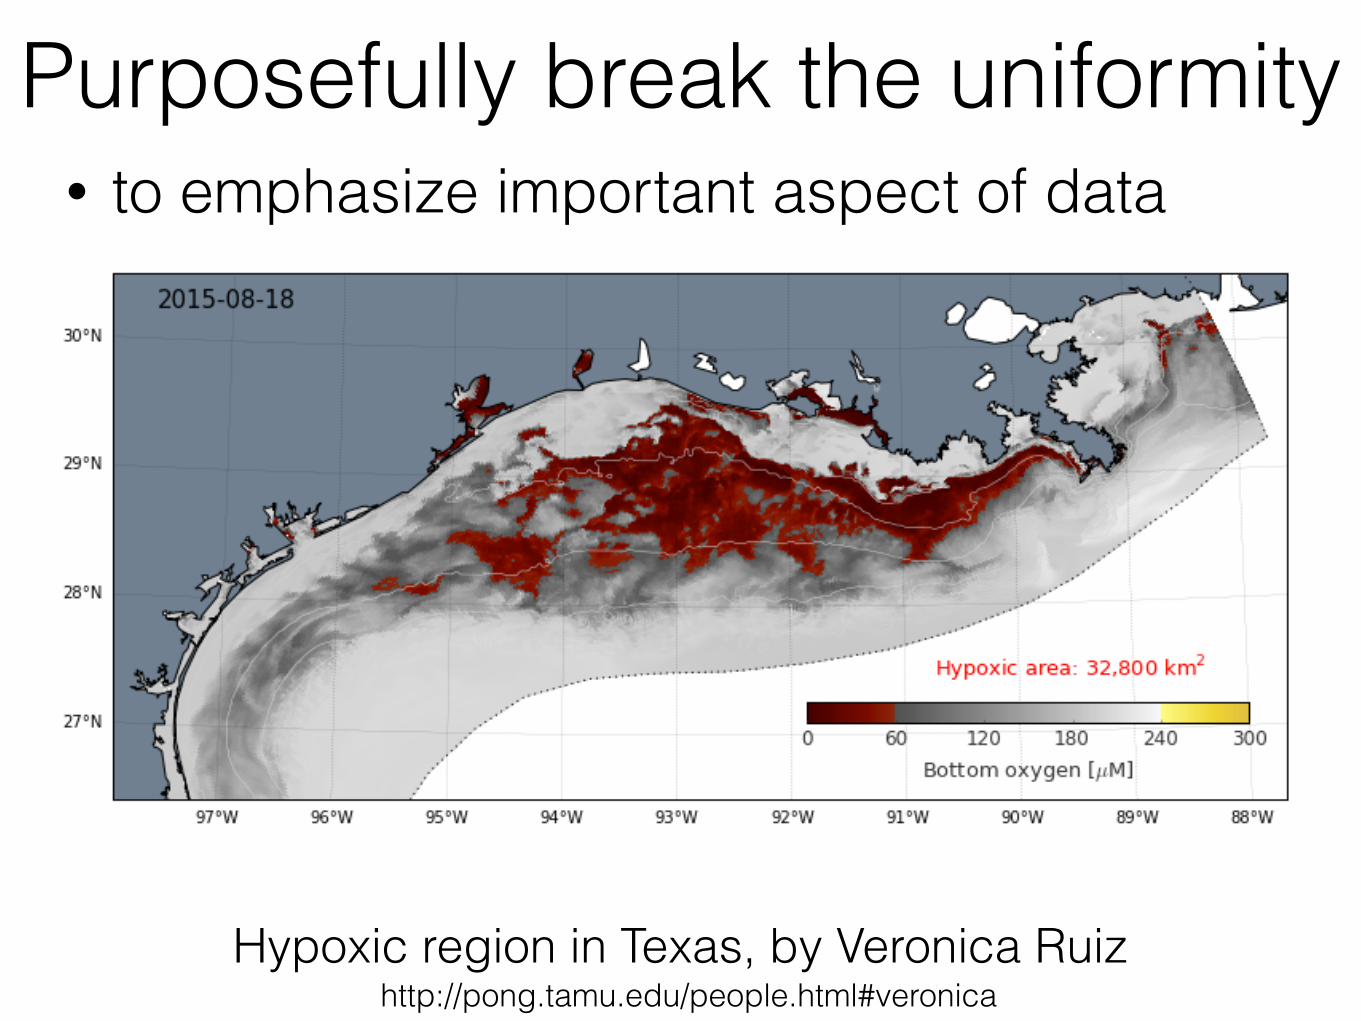
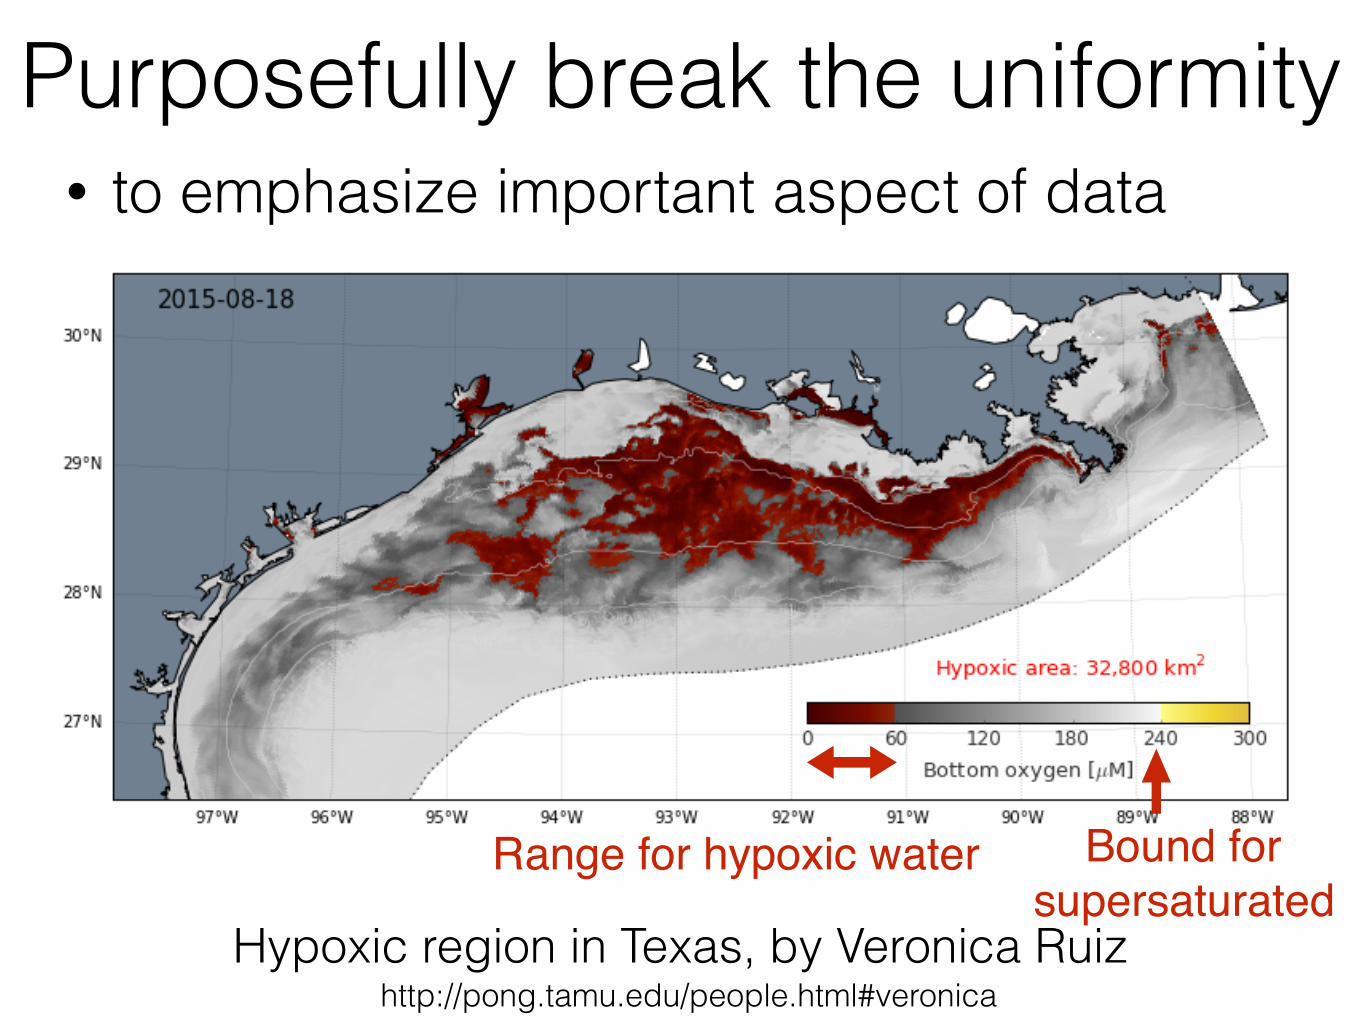
• to emphasize important aspect of dataPurposefully break the uniformity
Hypoxic region in Texas, by Veronica Ruizhttp://pong.tamu.edu/people.html#veronica
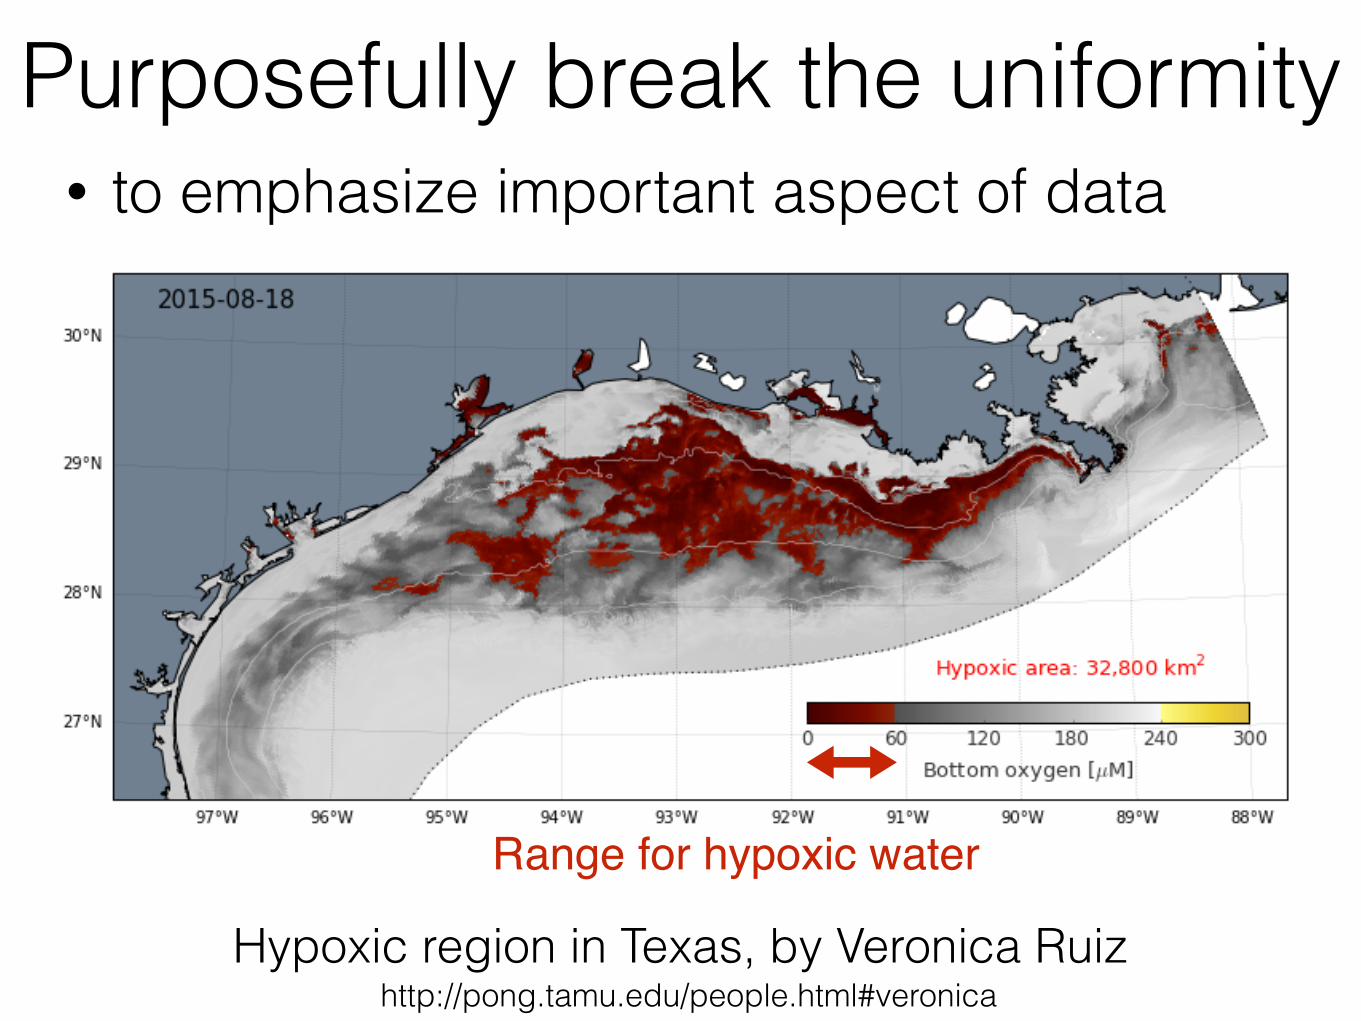
• to emphasize important aspect of dataPurposefully break the uniformity
Hypoxic region in Texas, by Veronica Ruizhttp://pong.tamu.edu/people.html#veronica
Range for hypoxic water
• to emphasize important aspect of dataPurposefully break the uniformity
Hypoxic region in Texas, by Veronica Ruizhttp://pong.tamu.edu/people.html#veronica
Range for hypoxic water Bound for supersaturated
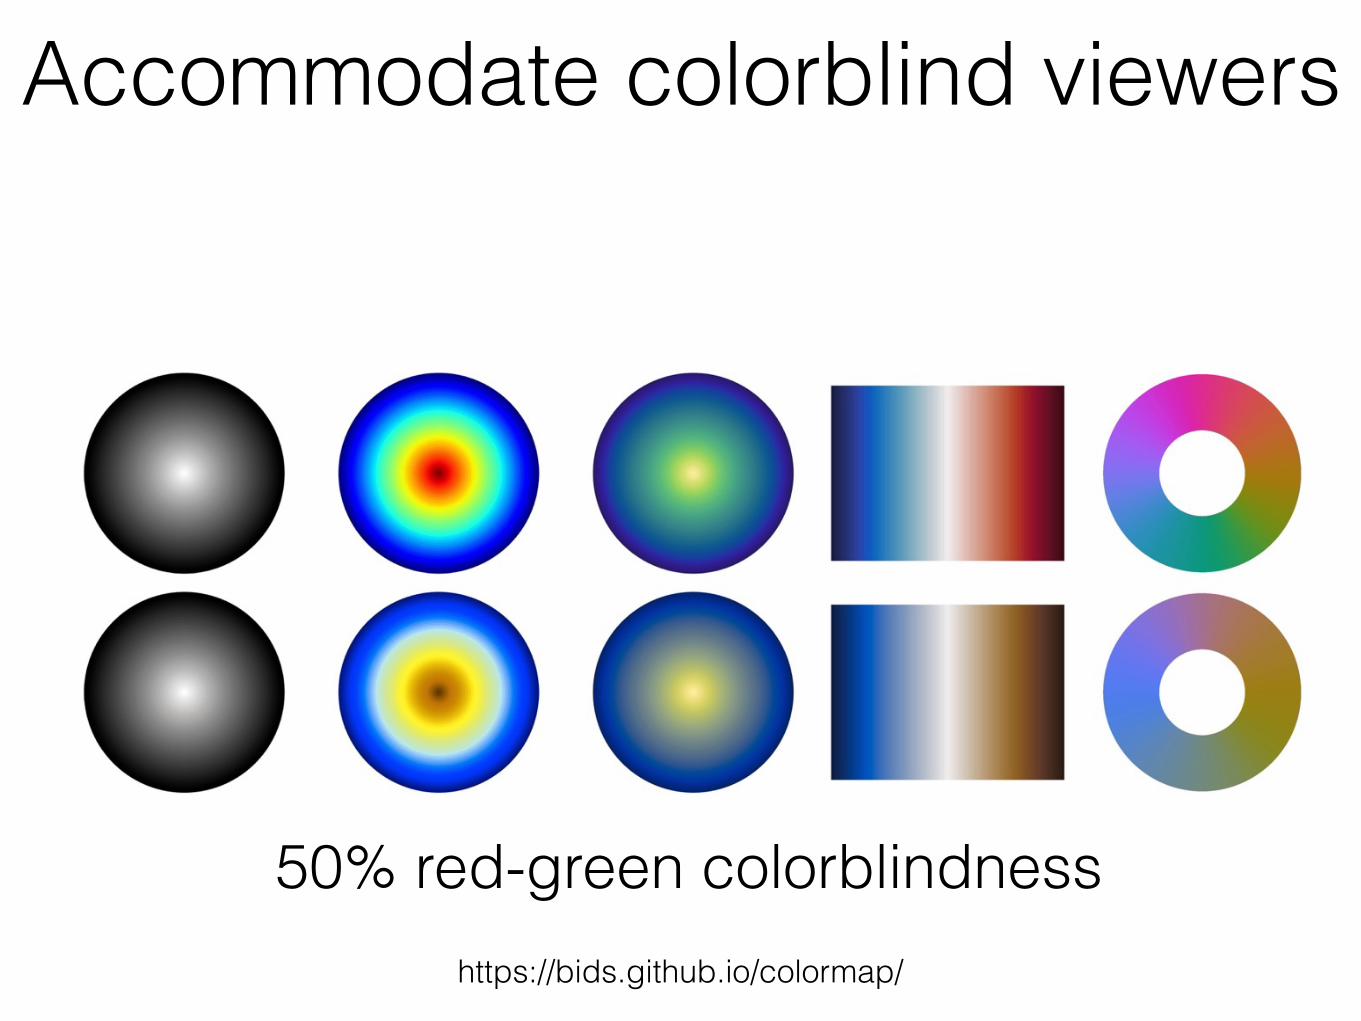
Accommodate colorblind viewers
50% red-green colorblindnesshttps://bids.github.io/colormap/
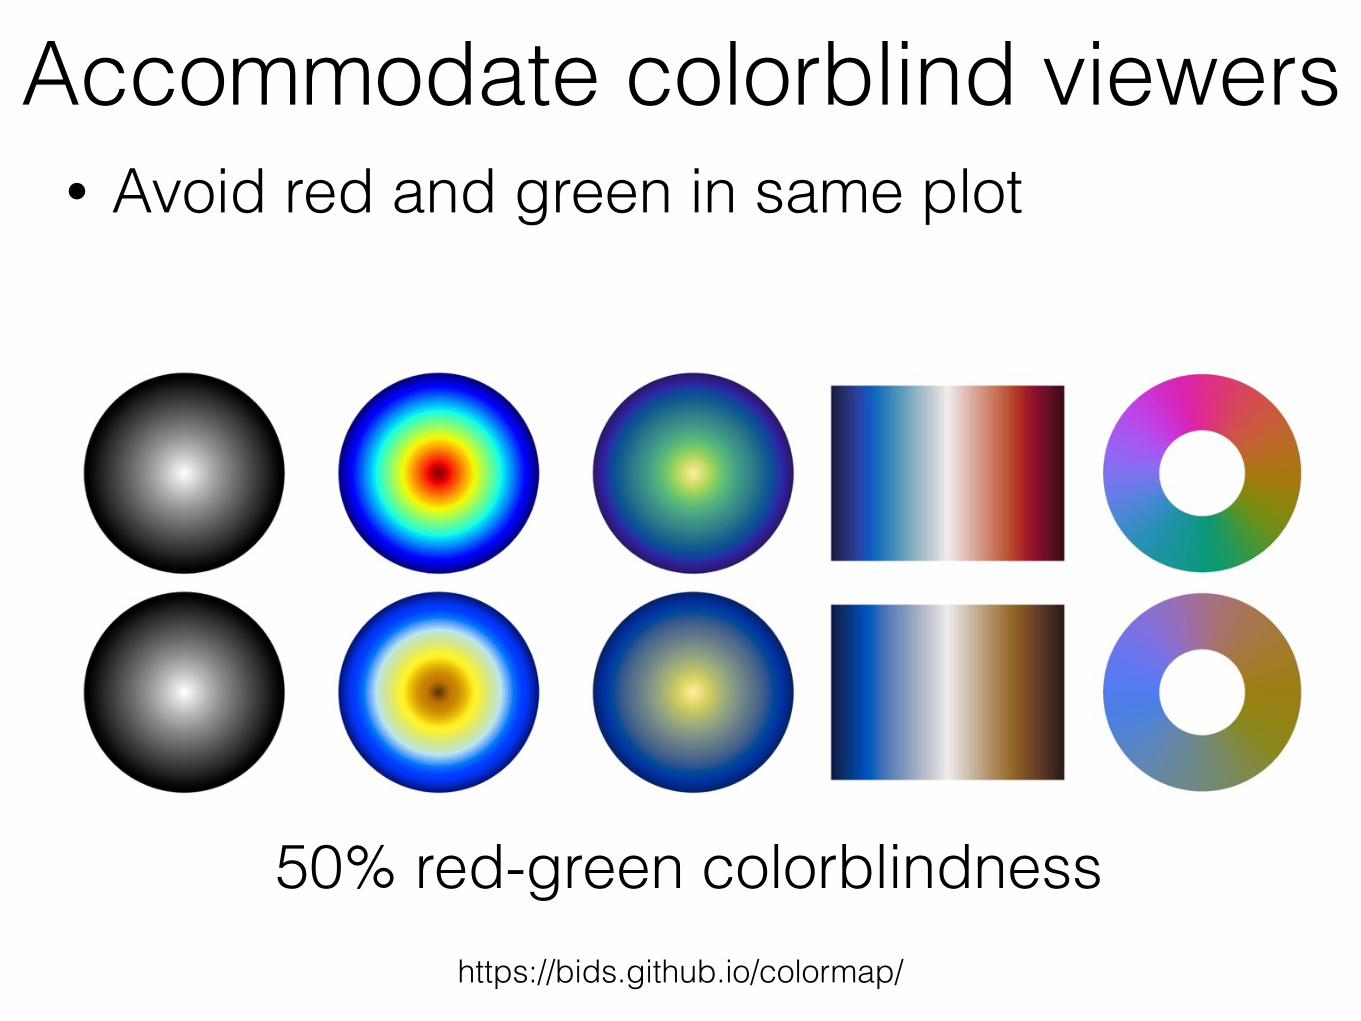
Accommodate colorblind viewers• Avoid red and green in same plot
50% red-green colorblindnesshttps://bids.github.io/colormap/
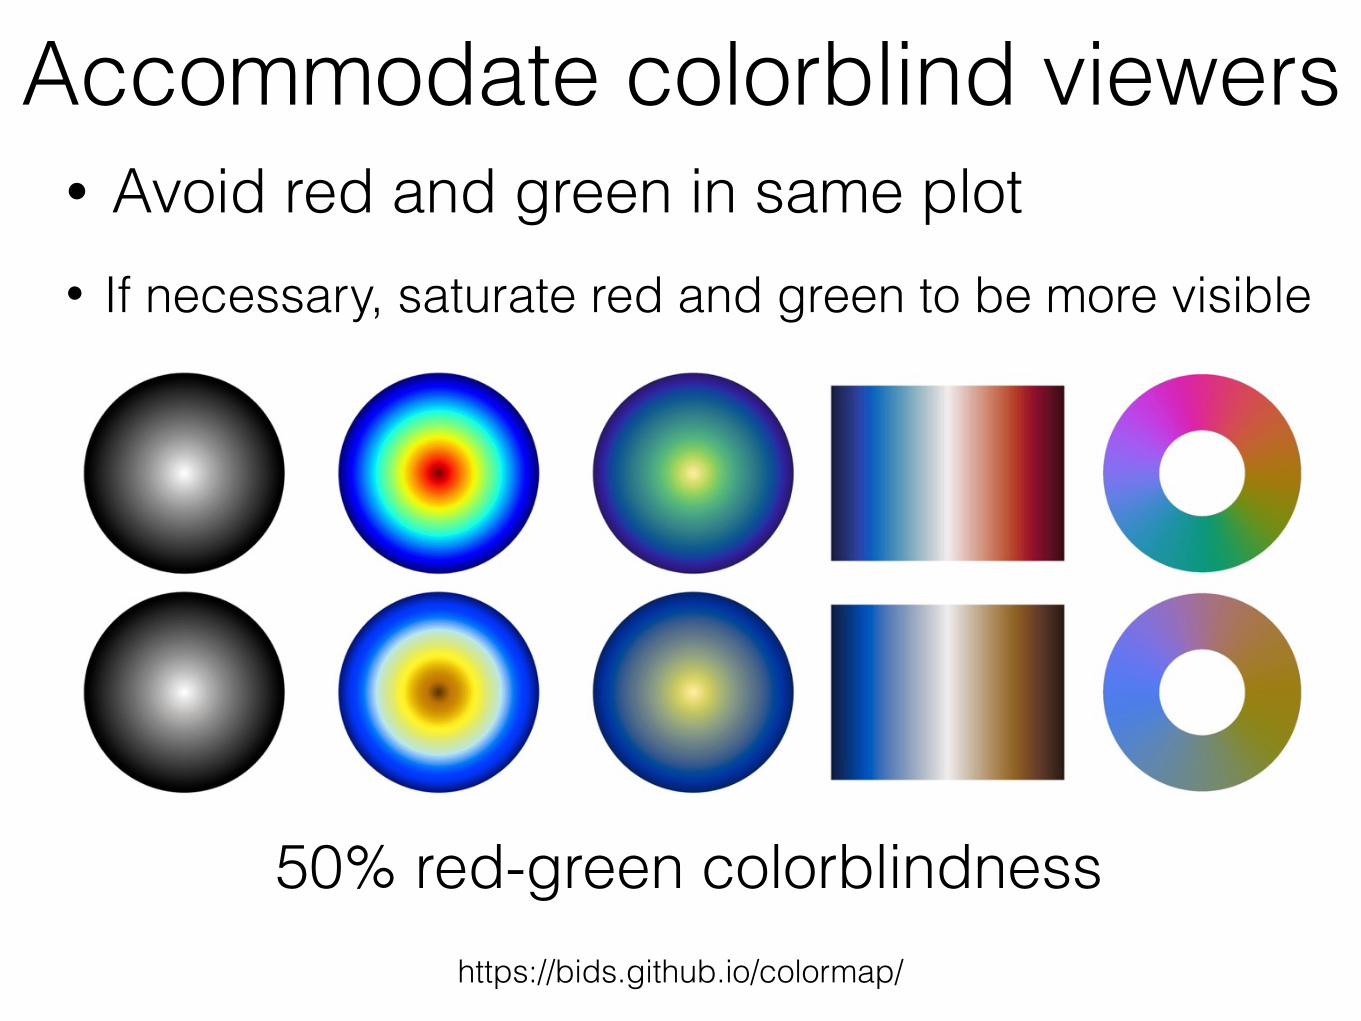
Accommodate colorblind viewers• Avoid red and green in same plot• If necessary, saturate red and green to be more visible
50% red-green colorblindnesshttps://bids.github.io/colormap/
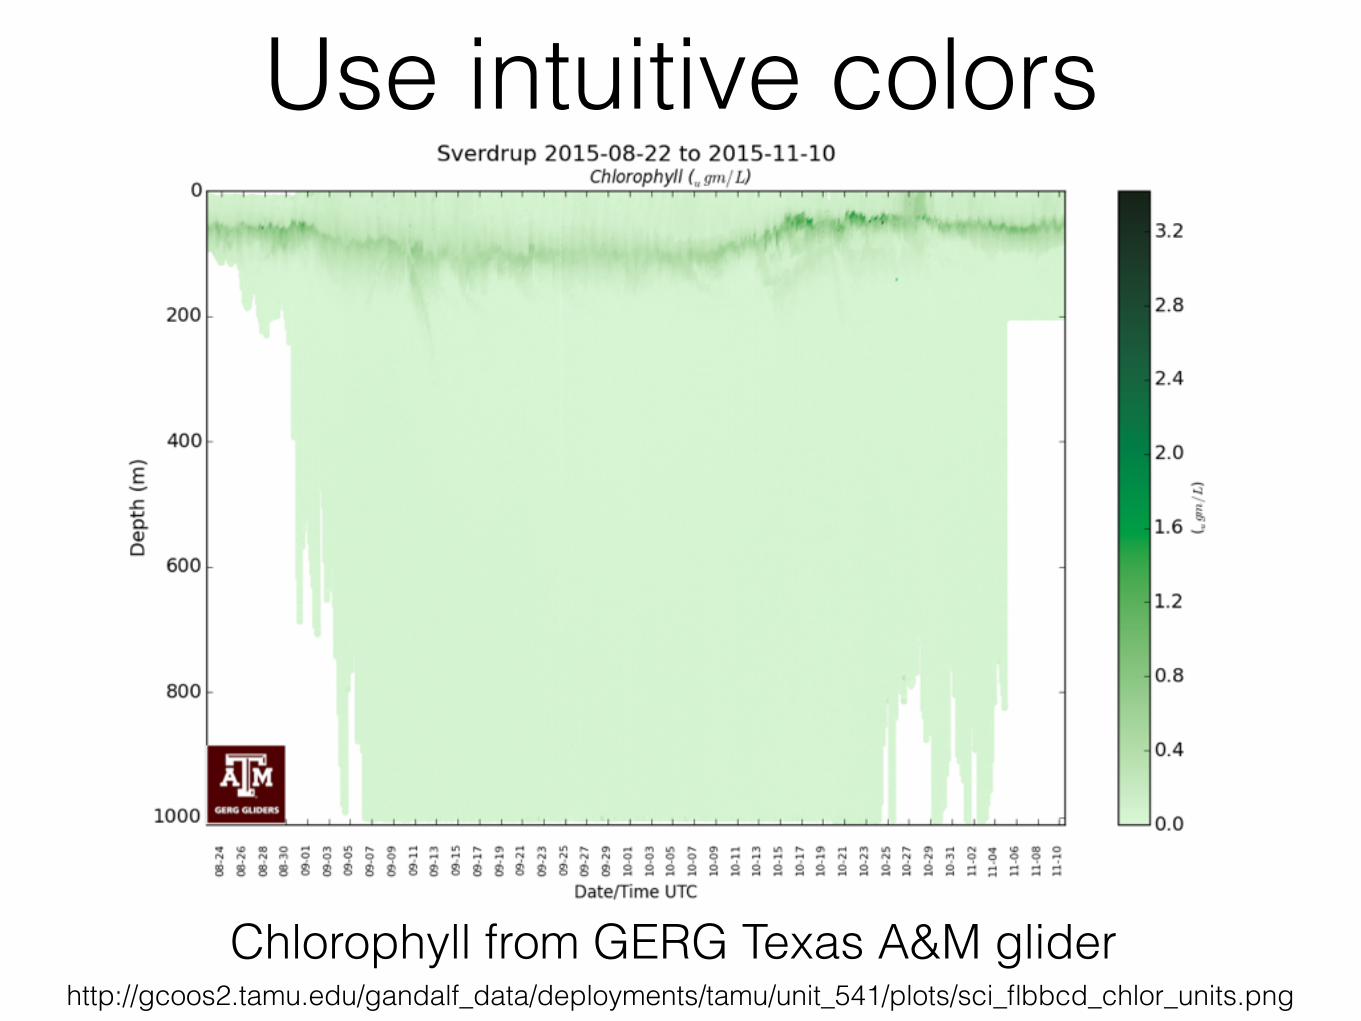
Use intuitive colors
Chlorophyll from GERG Texas A&M gliderhttp://gcoos2.tamu.edu/gandalf_data/deployments/tamu/unit_541/plots/sci_flbbcd_chlor_units.png
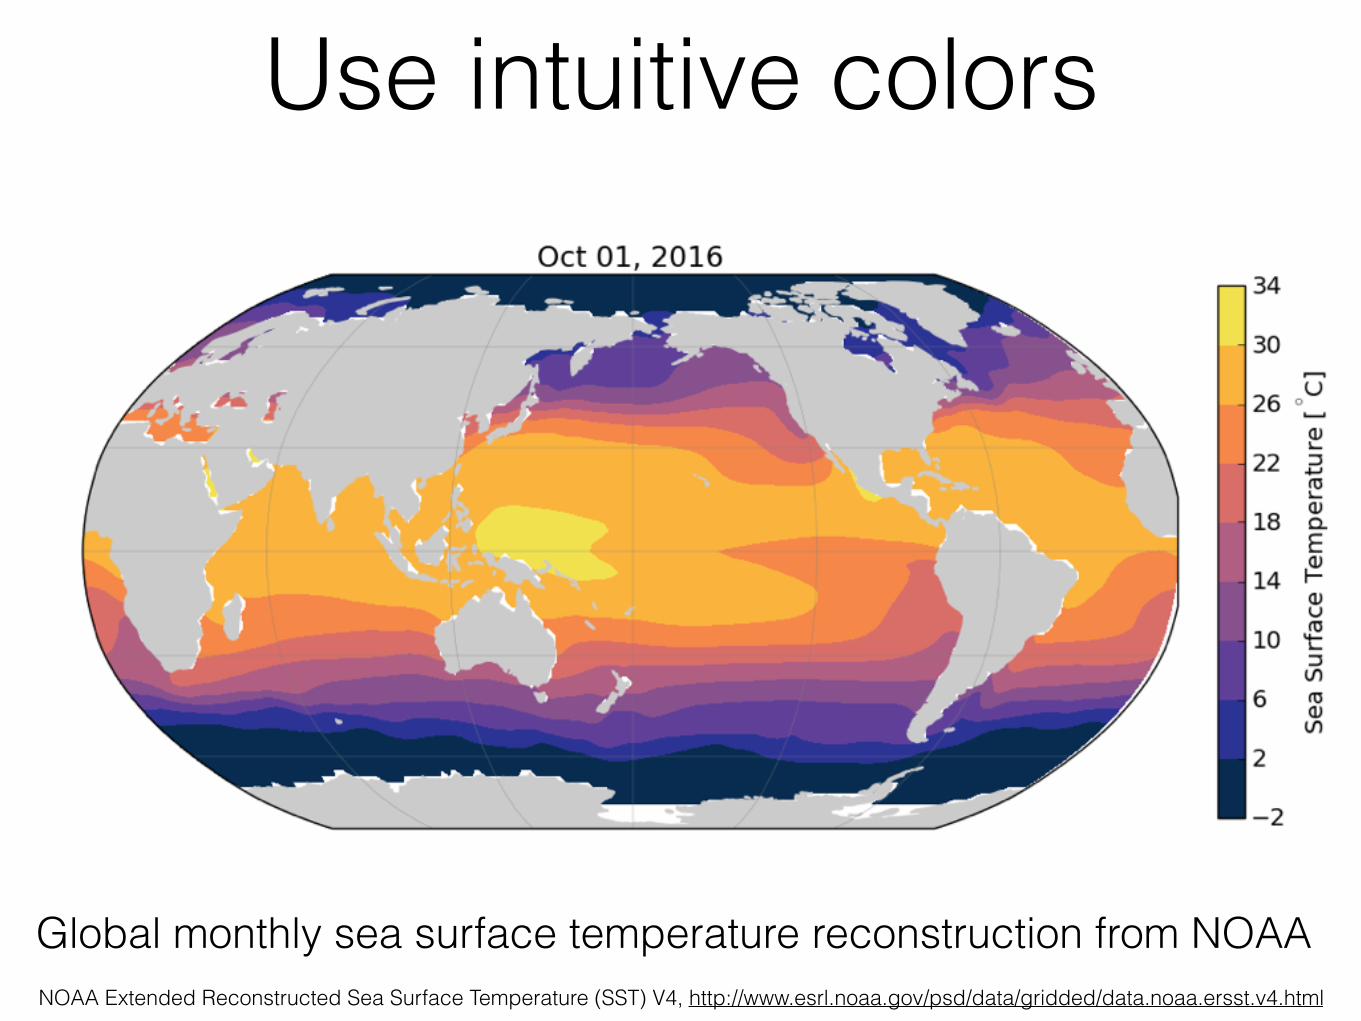
Use intuitive colors
Global monthly sea surface temperature reconstruction from NOAANOAA Extended Reconstructed Sea Surface Temperature (SST) V4, http://www.esrl.noaa.gov/psd/data/gridded/data.noaa.ersst.v4.html
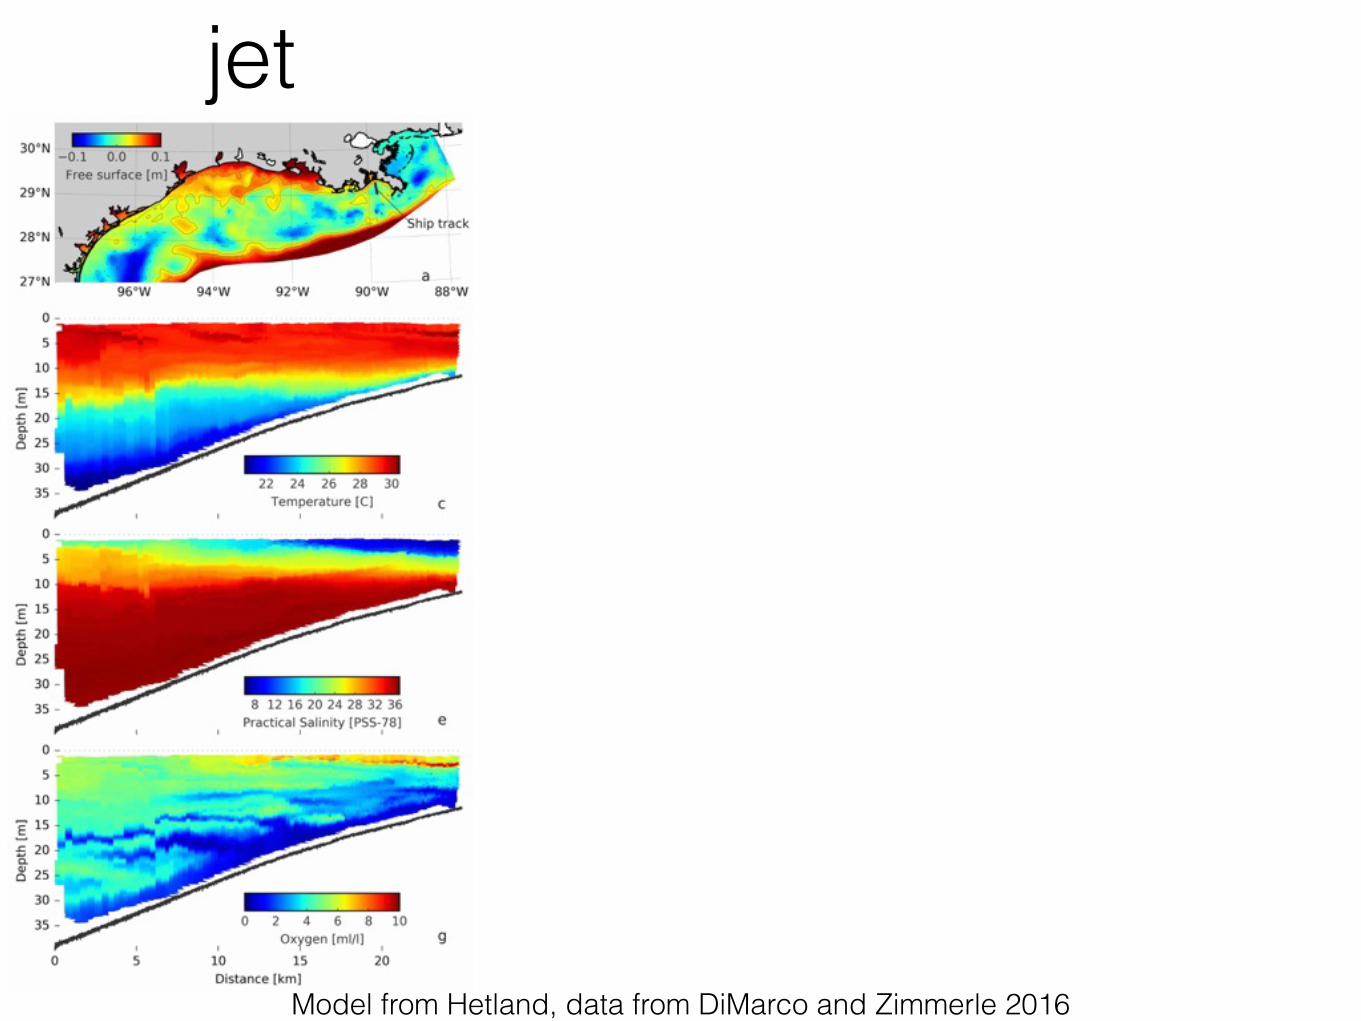
Model from Hetland, data from DiMarco and Zimmerle 2016
jet
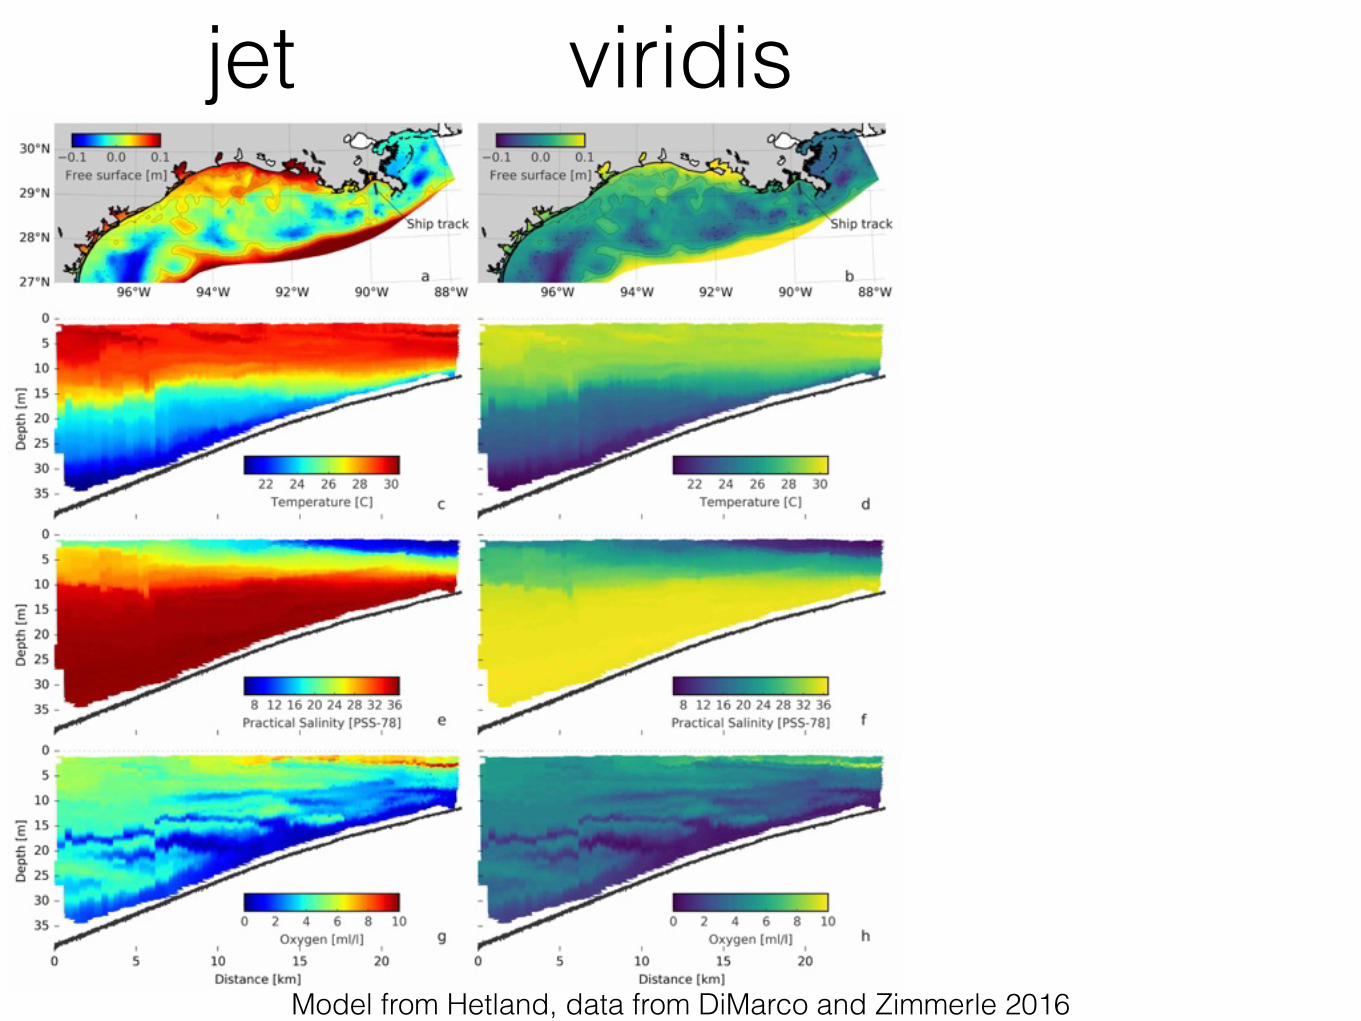
viridisjet
Model from Hetland, data from DiMarco and Zimmerle 2016
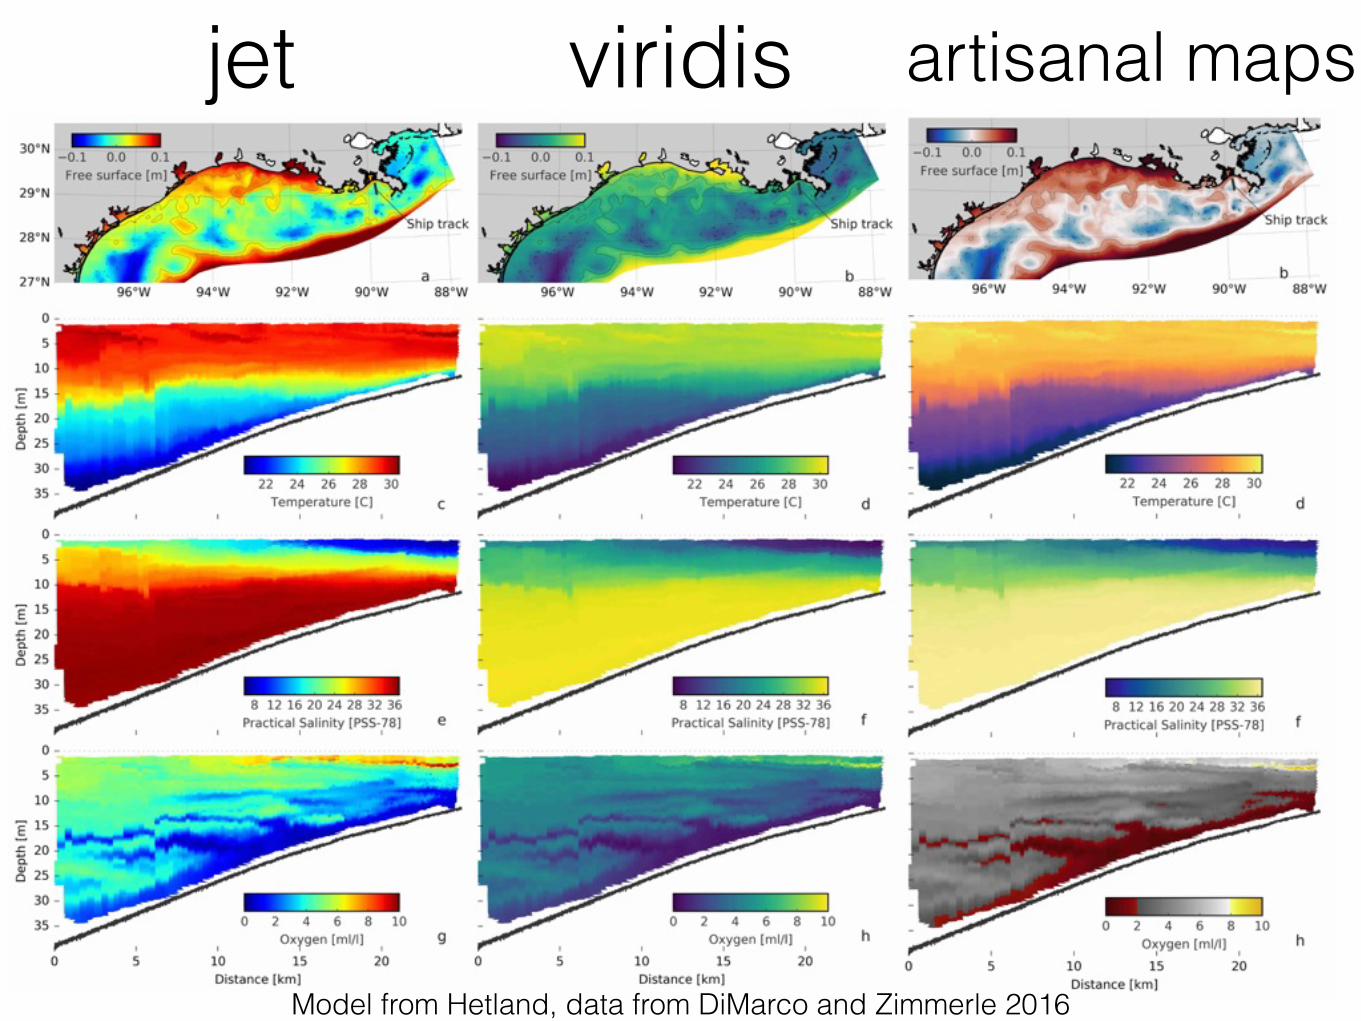
artisanal mapsviridisjet
Model from Hetland, data from DiMarco and Zimmerle 2016
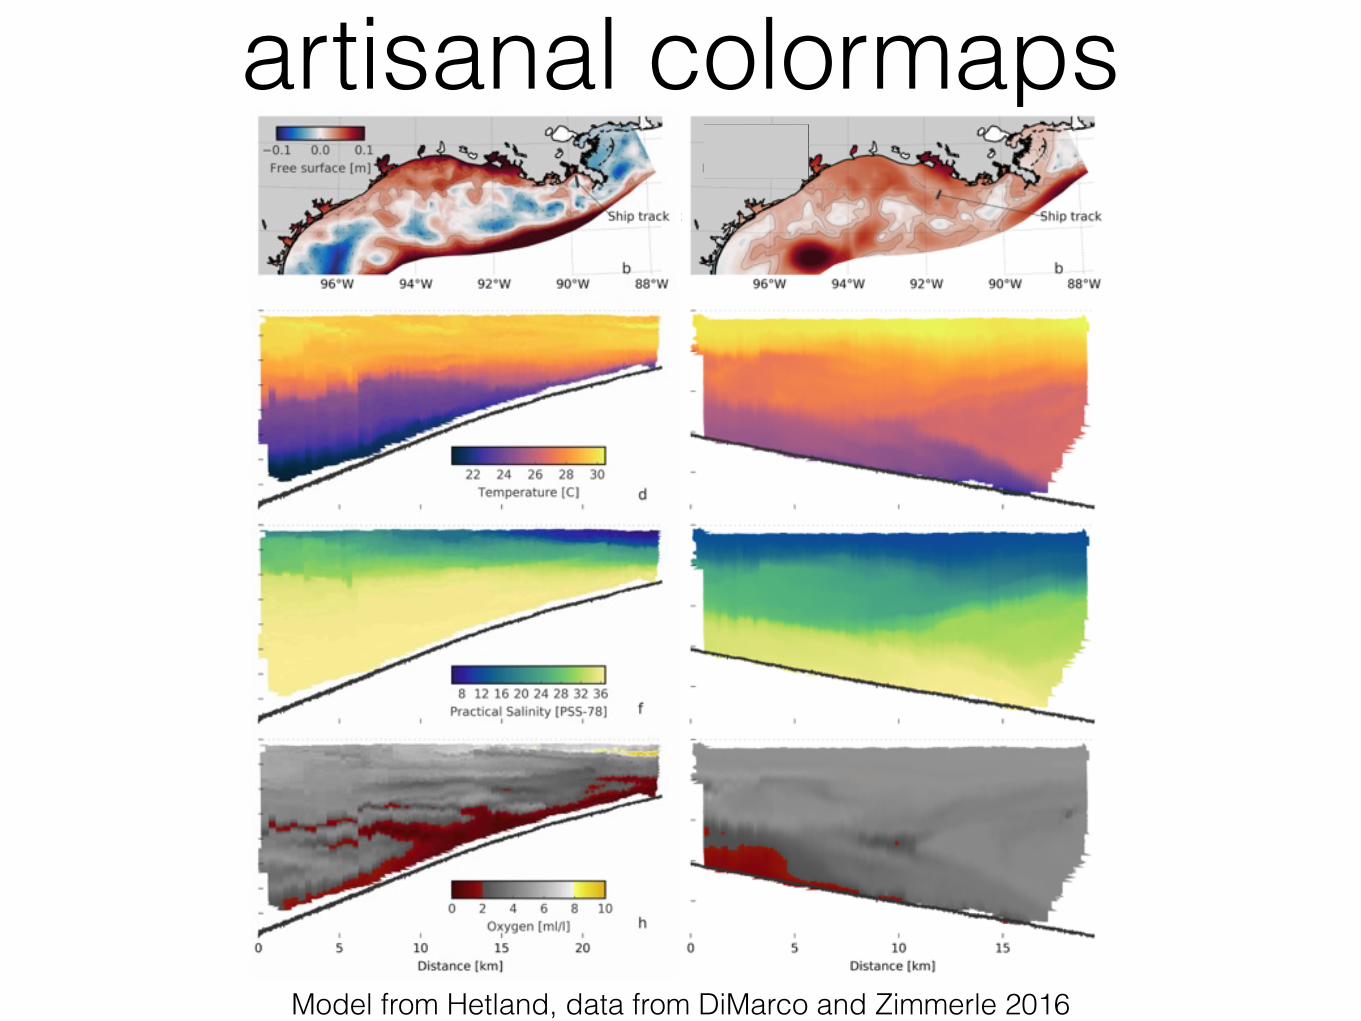
artisanal colormaps
Model from Hetland, data from DiMarco and Zimmerle 2016
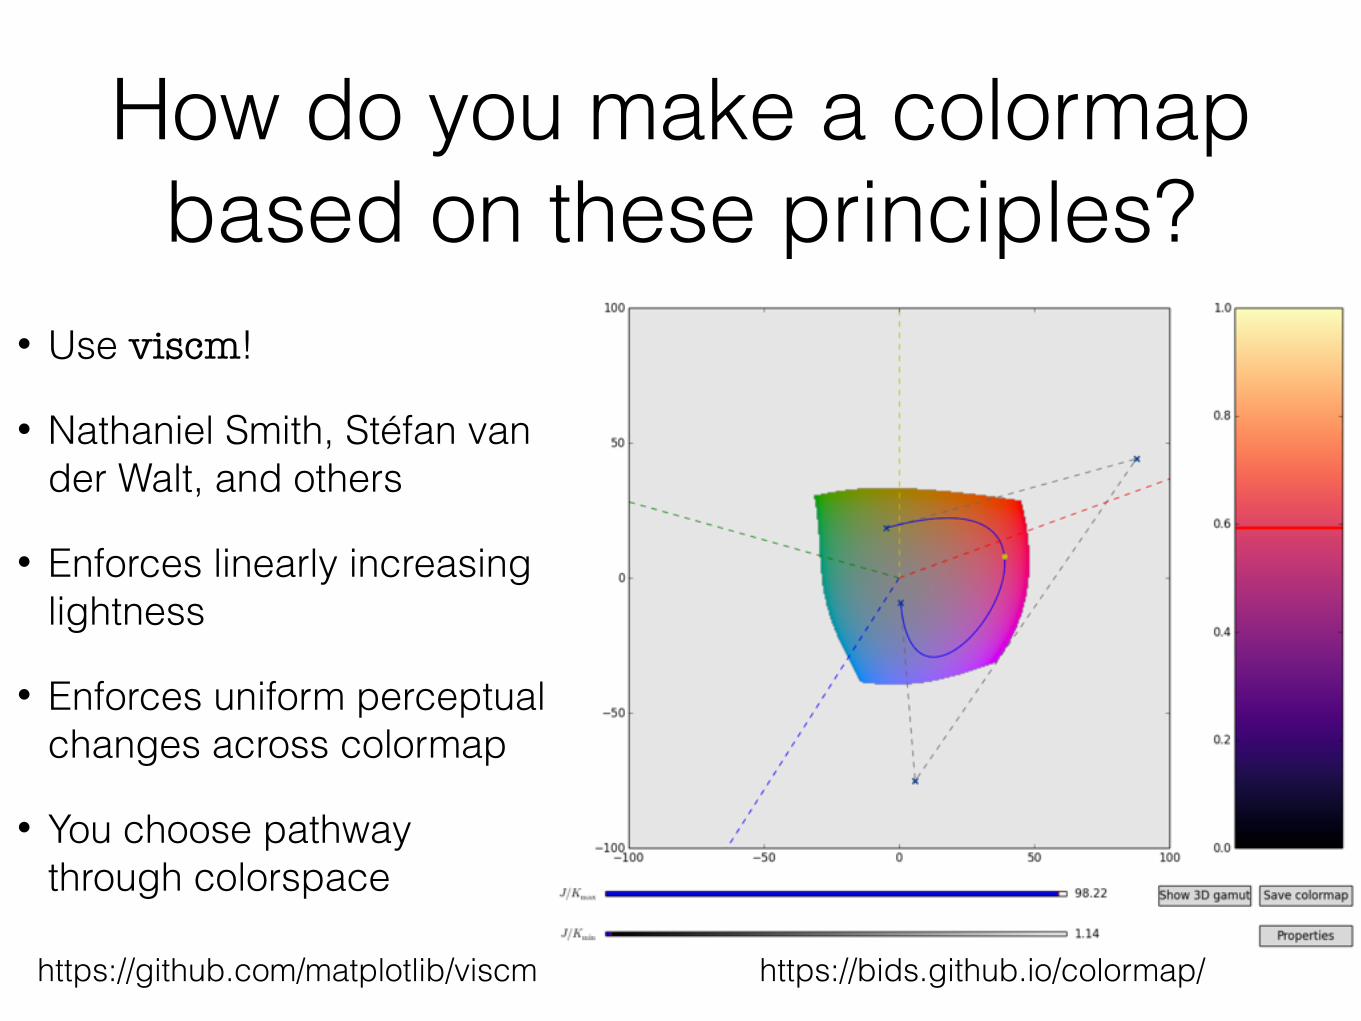
How do you make a colormap based on these principles?
• Use viscm!
• Nathaniel Smith, Stéfan van der Walt, and others
• Enforces linearly increasing lightness
• Enforces uniform perceptual changes across colormap
• You choose pathway through colorspace
https://github.com/matplotlib/viscm https://bids.github.io/colormap/
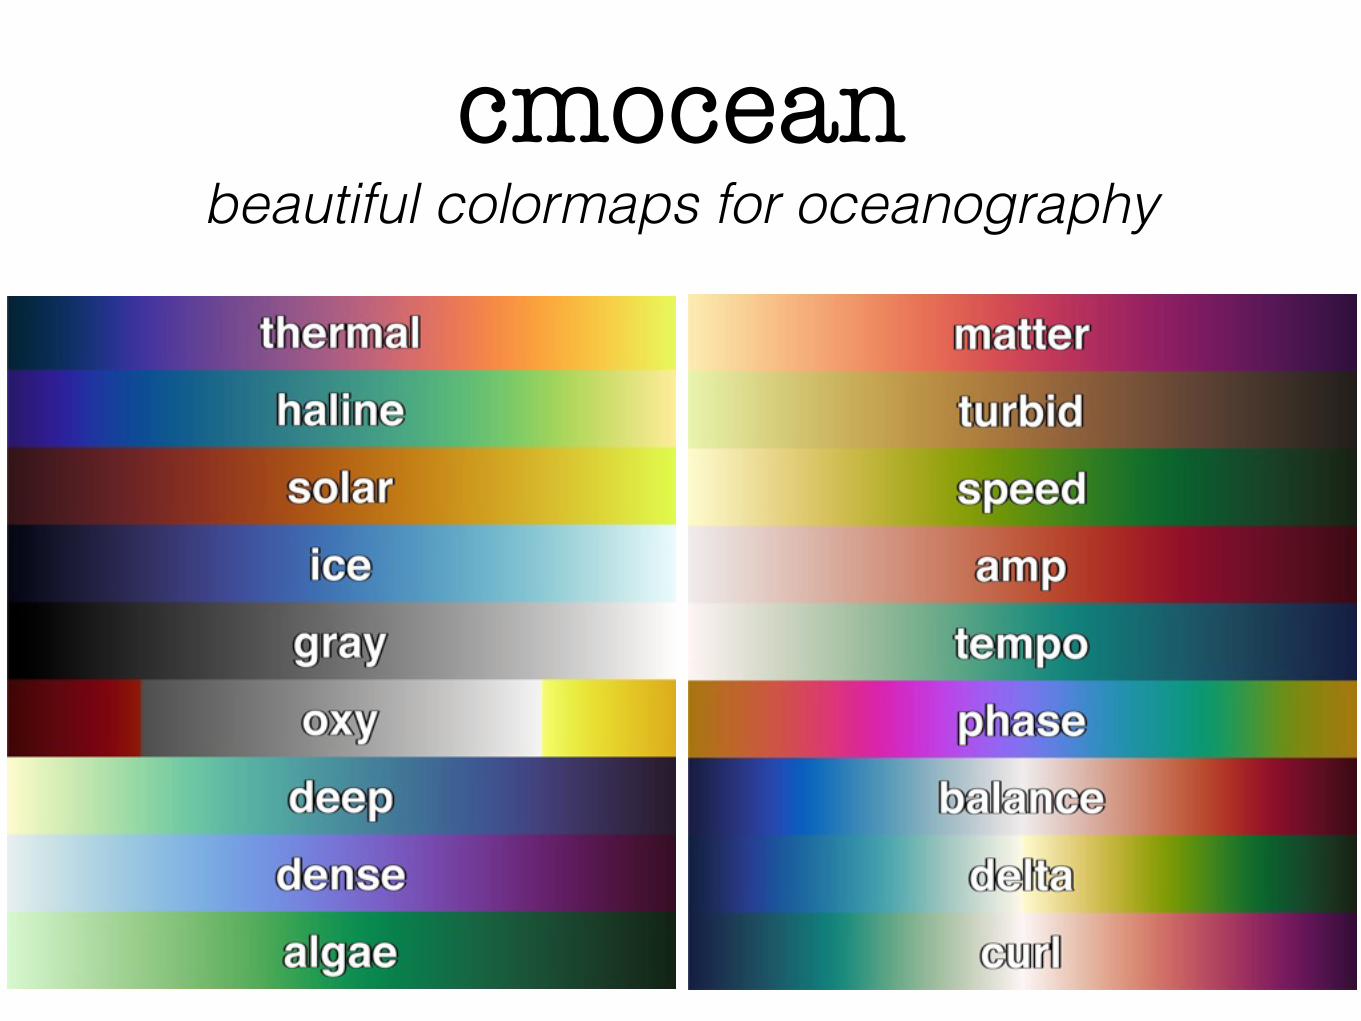
cmocean beautiful colormaps for oceanography
cmocean beautiful colormaps for oceanography
pip install cmocean
or
conda install -c conda-forge cmocean
matplotlib.org/cmocean
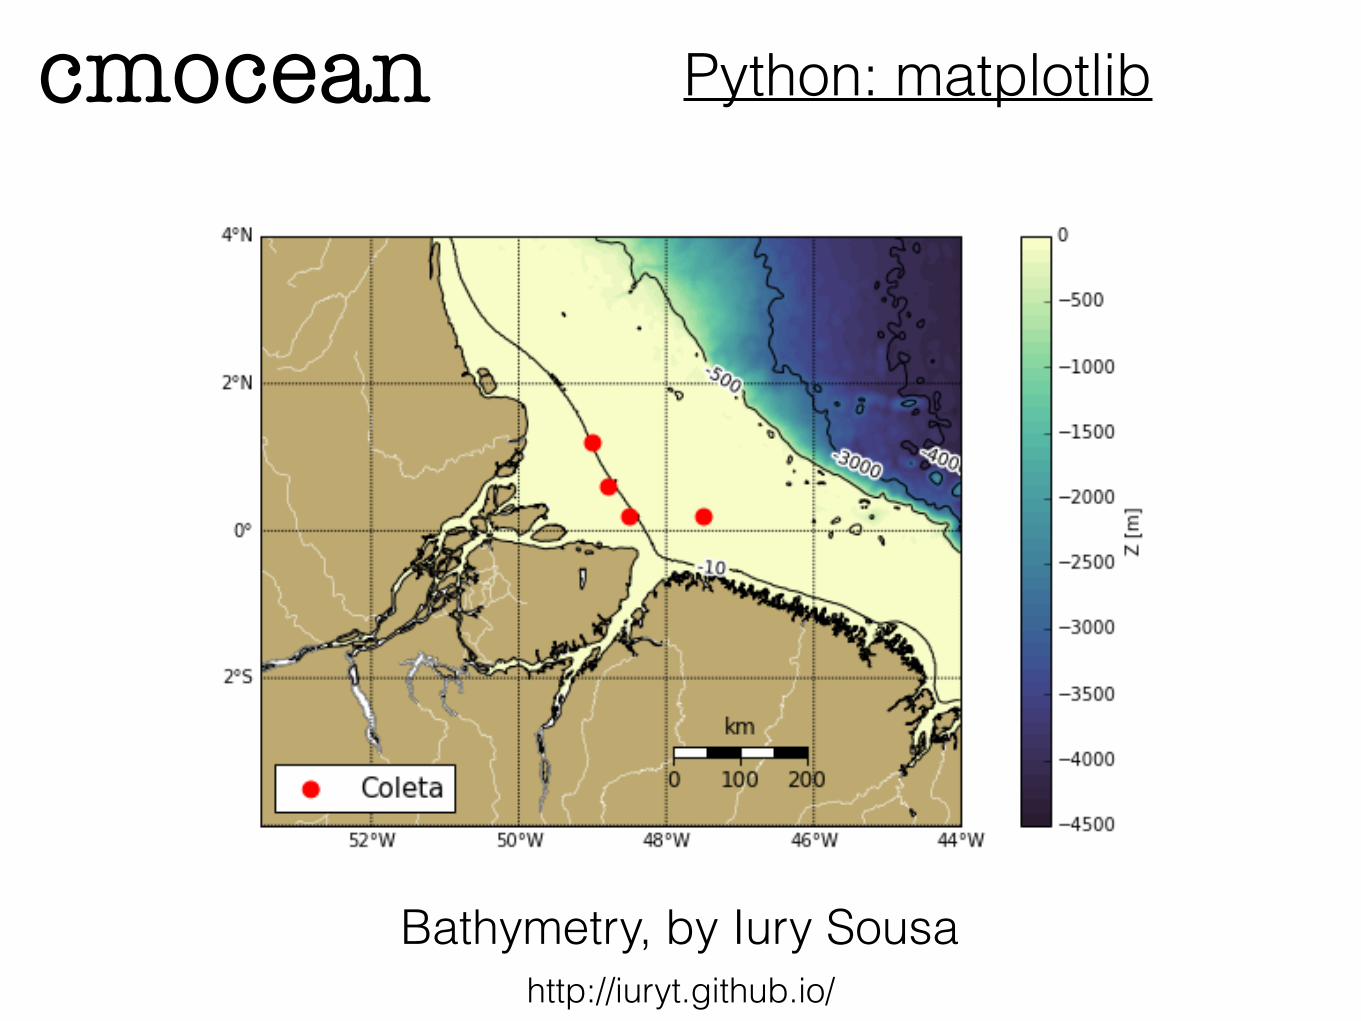
Python: matplotlibcmocean
Bathymetry, by Iury Sousahttp://iuryt.github.io/
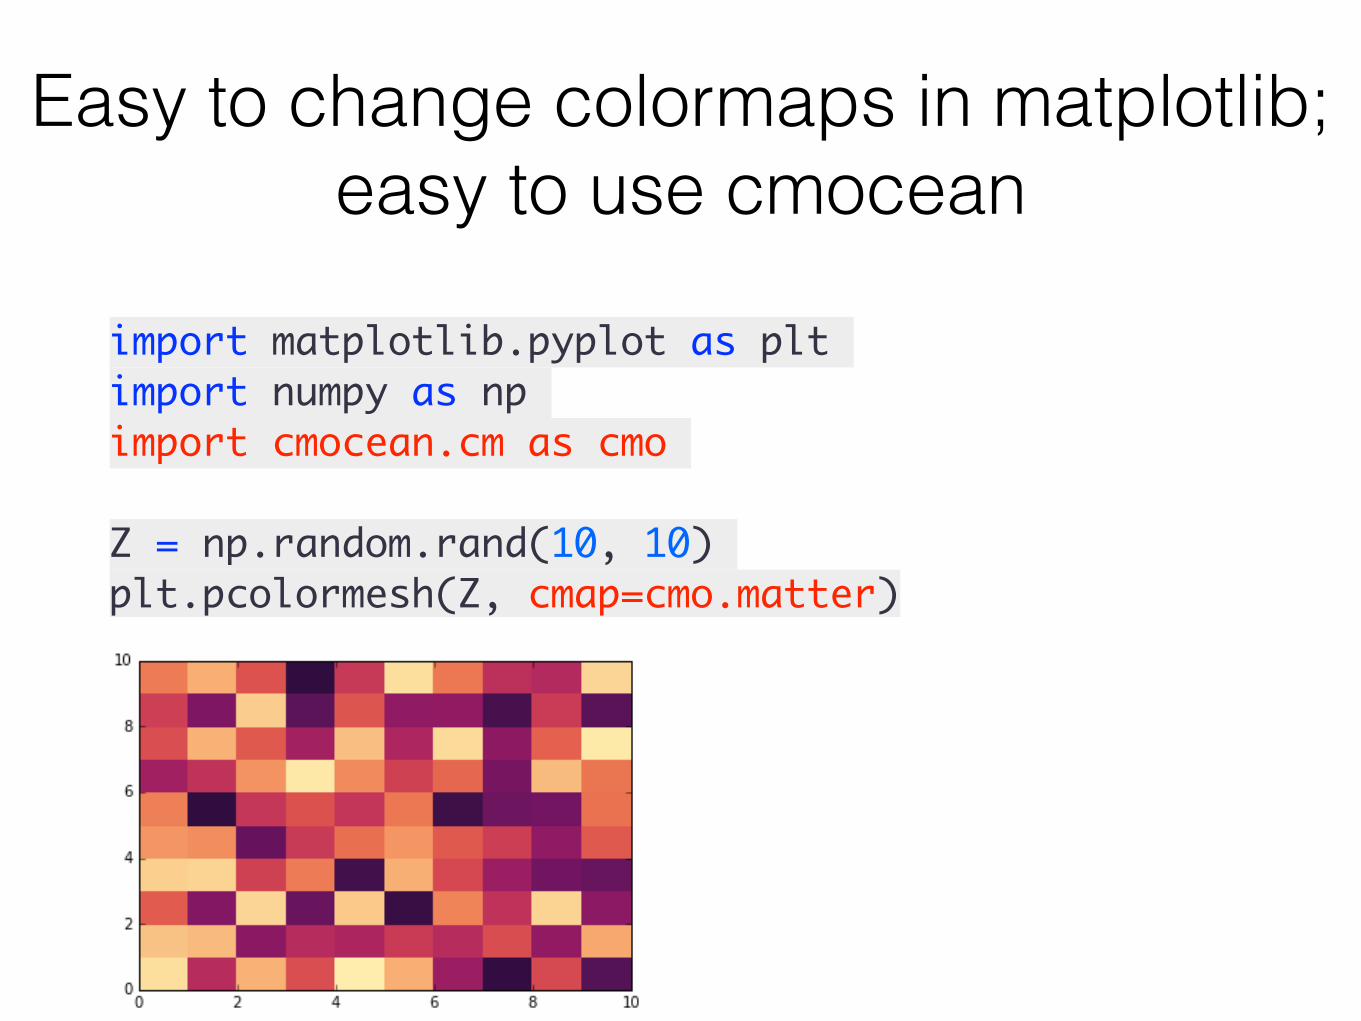
Easy to change colormaps in matplotlib; easy to use cmocean
import matplotlib.pyplot as pltimport numpy as npimport cmocean.cm as cmo
Z = np.random.rand(10, 10)plt.pcolormesh(Z, cmap=cmo.matter)
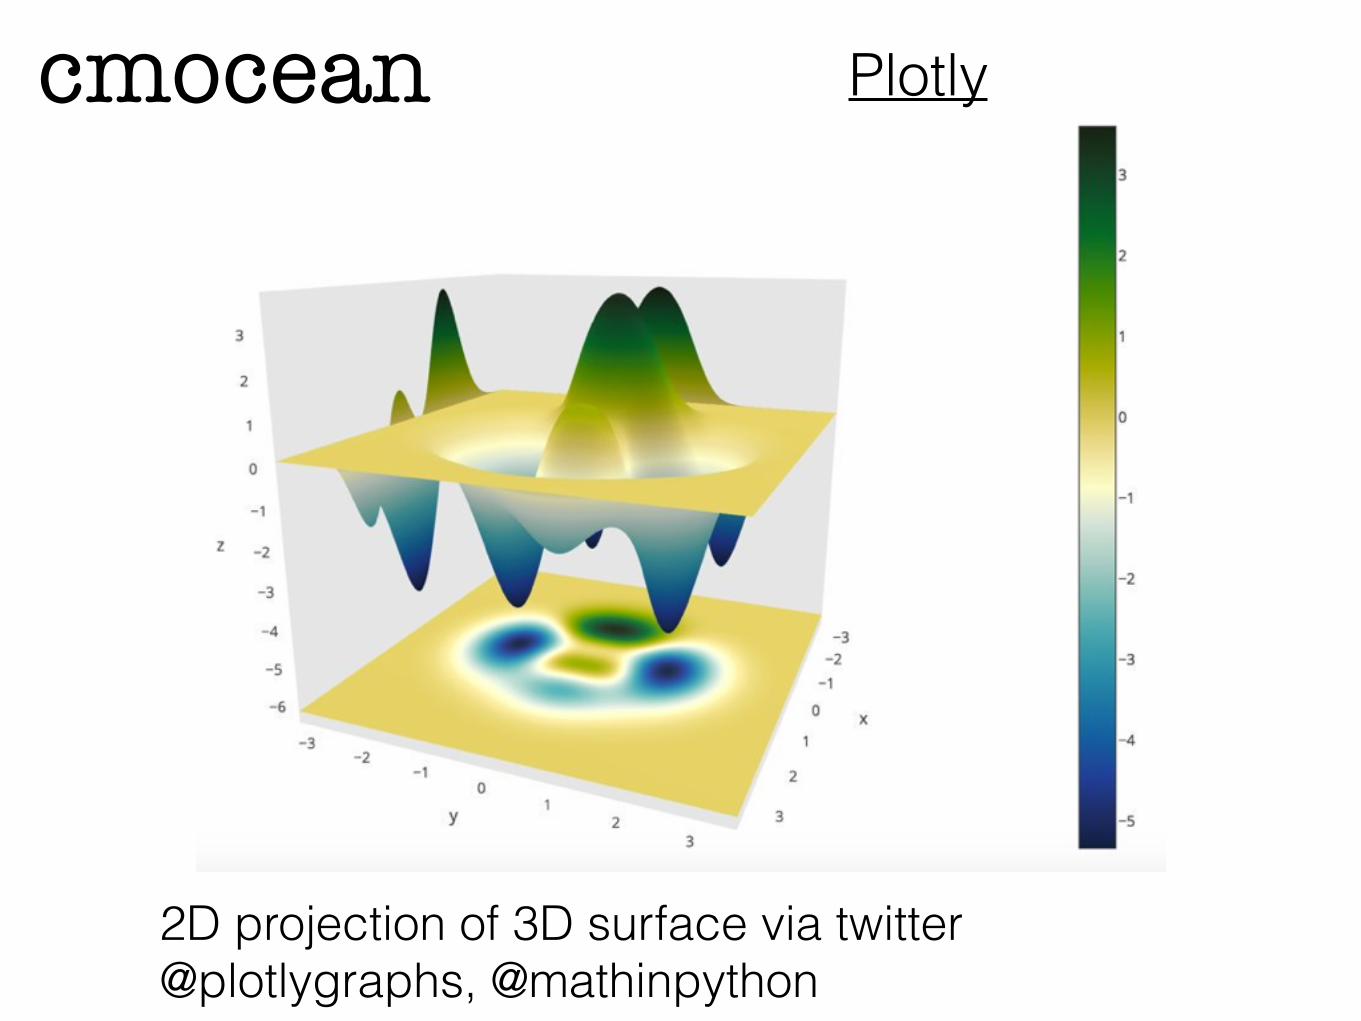
Plotlycmocean
2D projection of 3D surface via twitter @plotlygraphs, @mathinpython
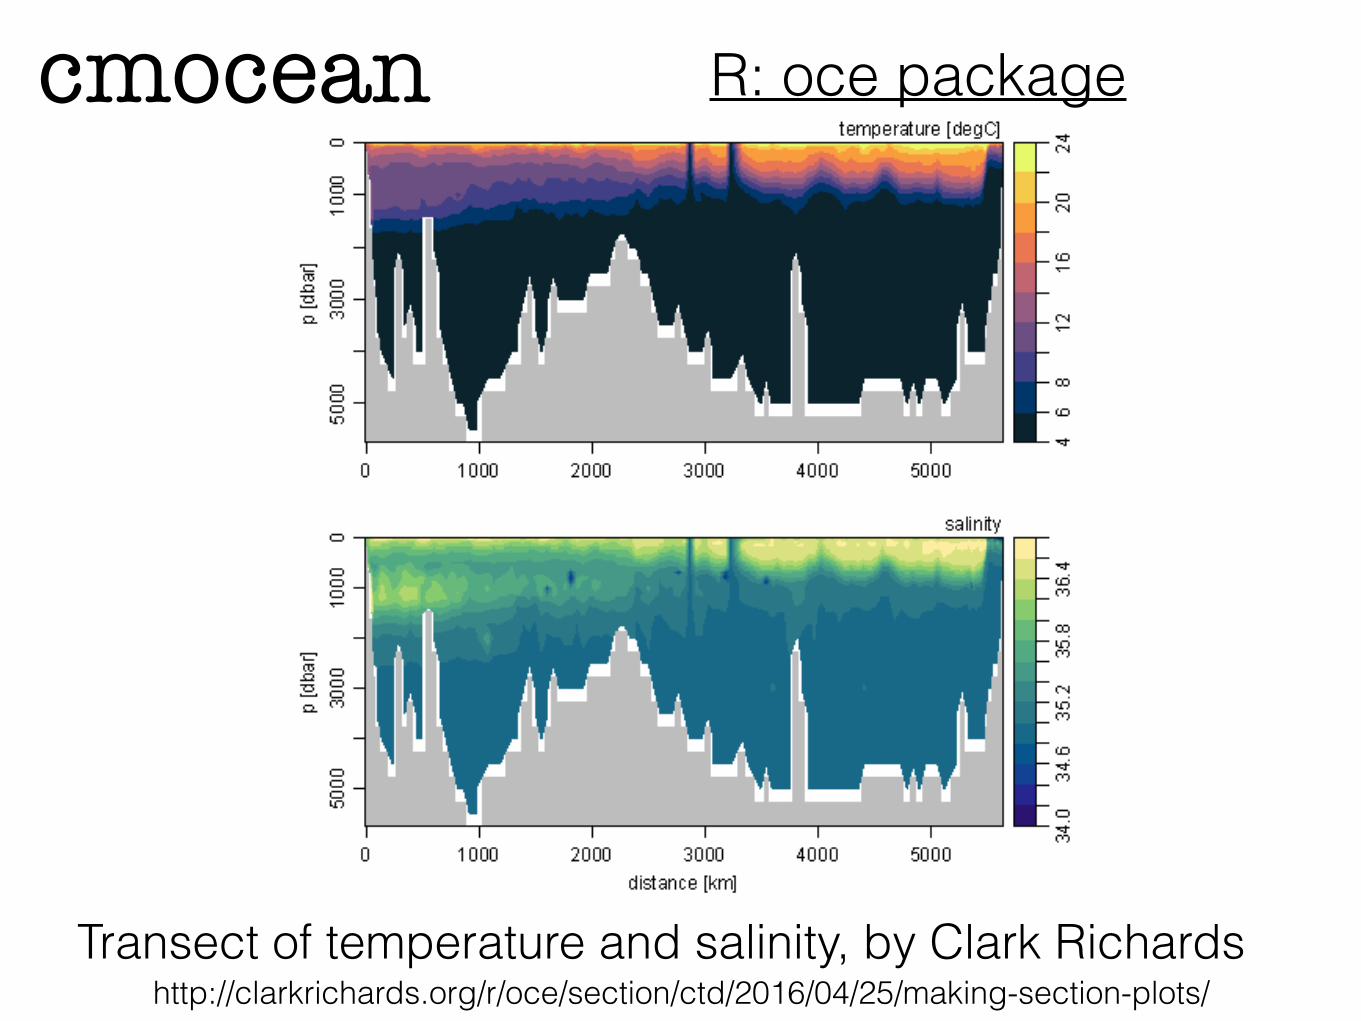
R: oce packagecmocean
Transect of temperature and salinity, by Clark Richardshttp://clarkrichards.org/r/oce/section/ctd/2016/04/25/making-section-plots/
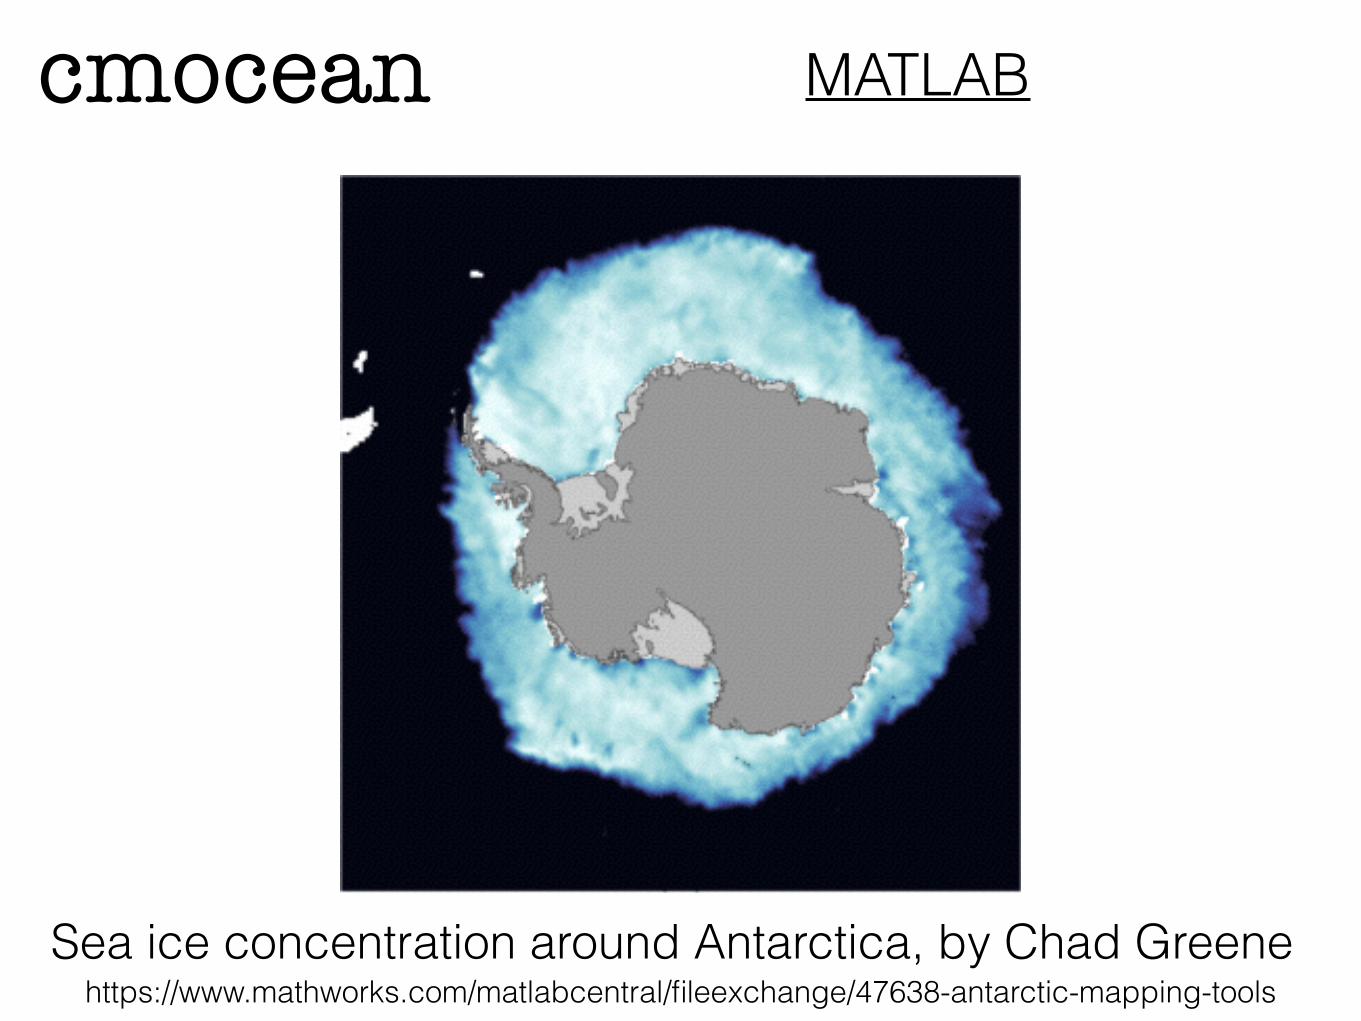
MATLABcmocean
Sea ice concentration around Antarctica, by Chad Greenehttps://www.mathworks.com/matlabcentral/fileexchange/47638-antarctic-mapping-tools
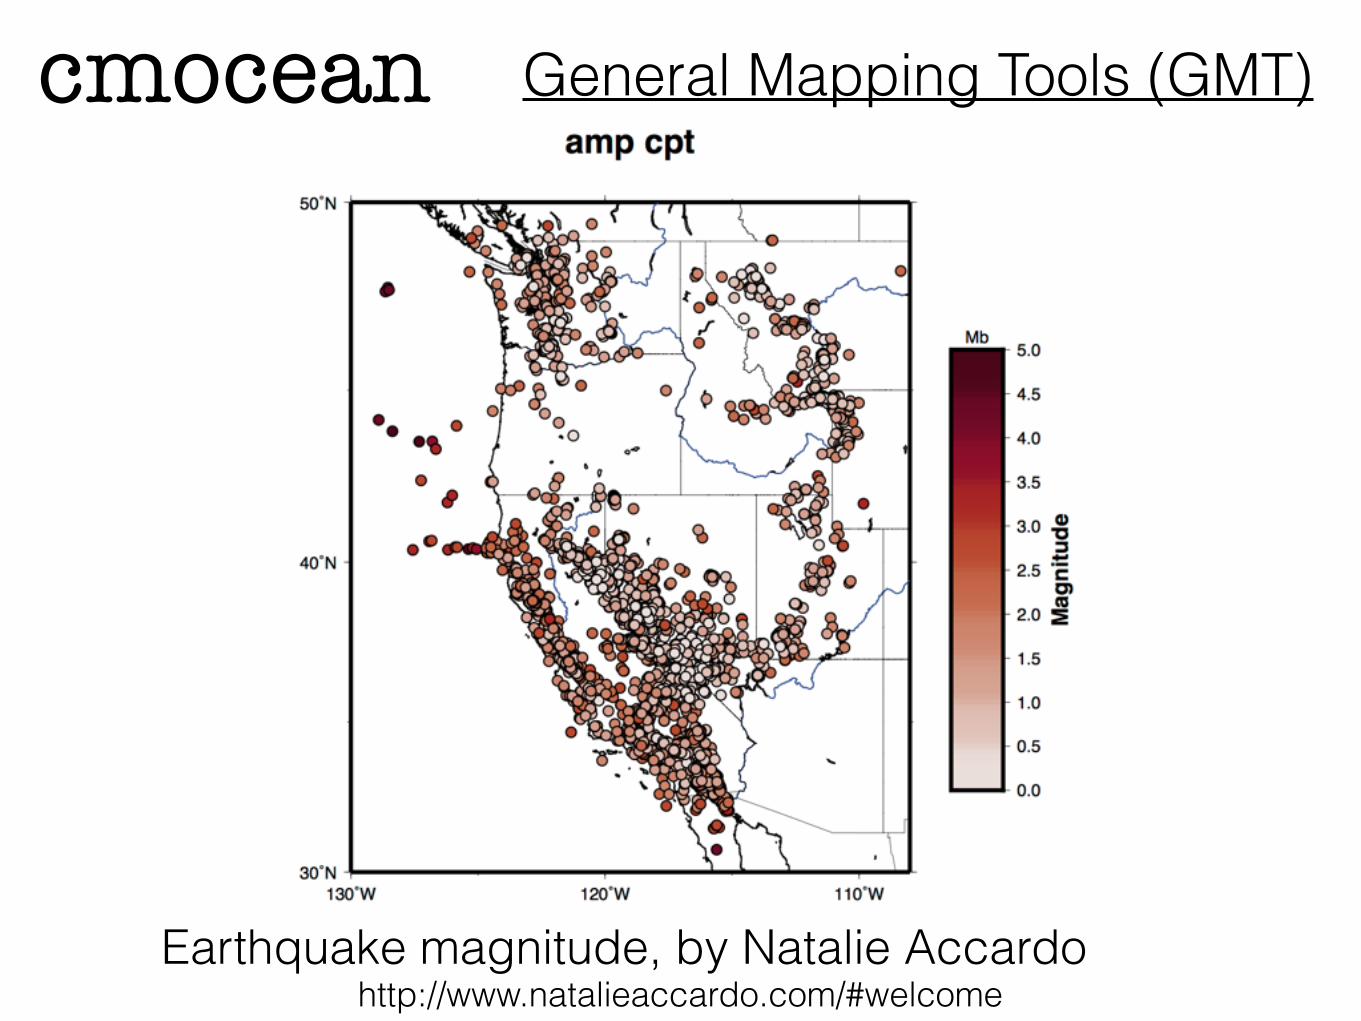
General Mapping Tools (GMT)cmocean
Earthquake magnitude, by Natalie Accardohttp://www.natalieaccardo.com/#welcome
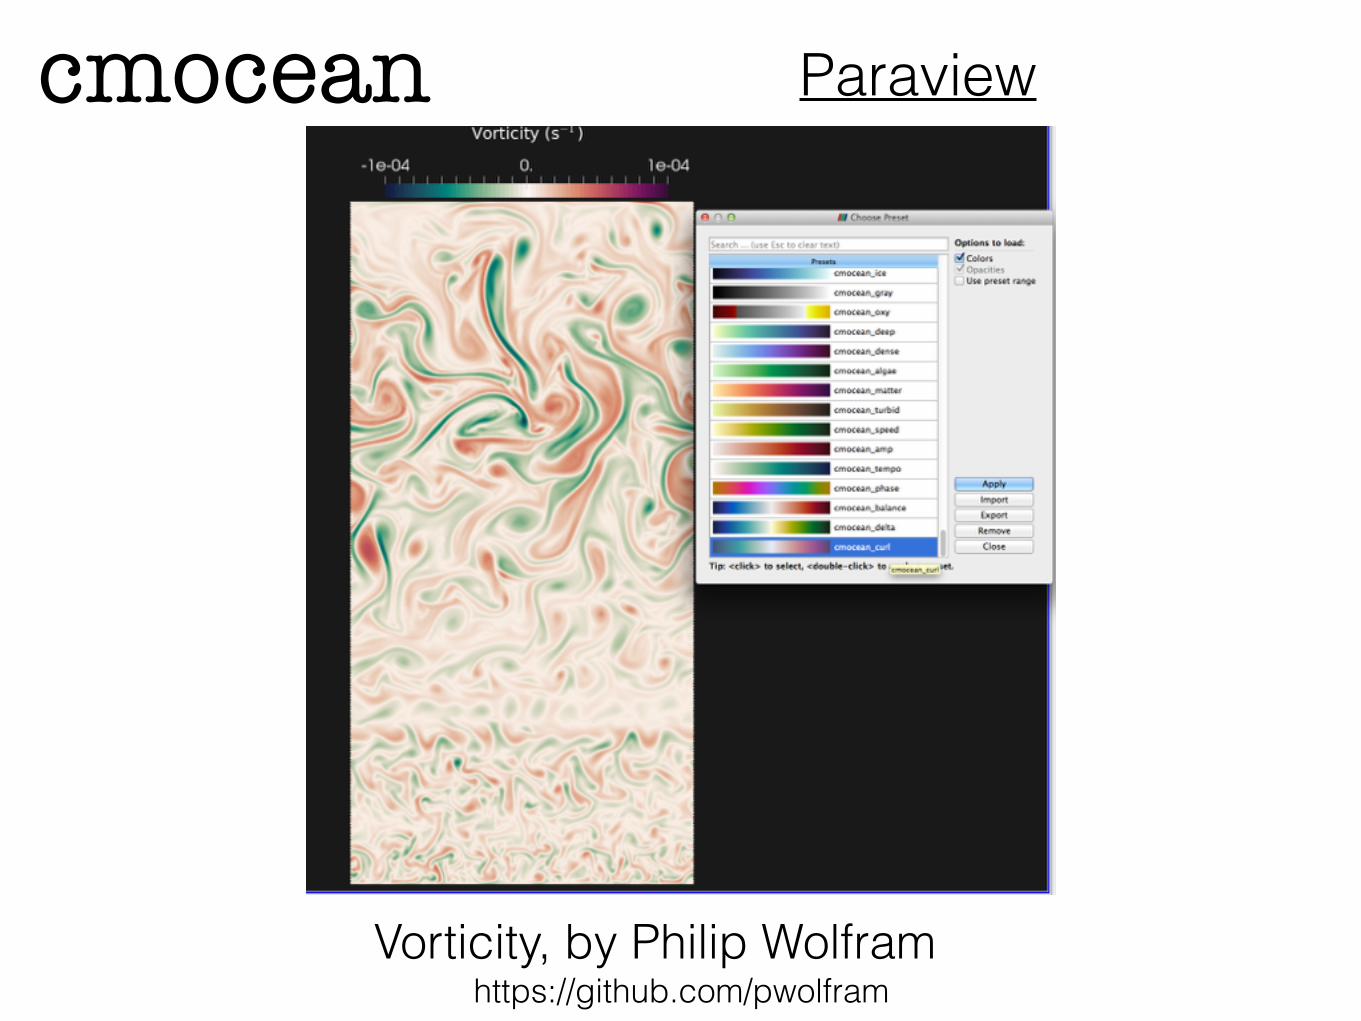
Paraviewcmocean
Vorticity, by Philip Wolframhttps://github.com/pwolfram
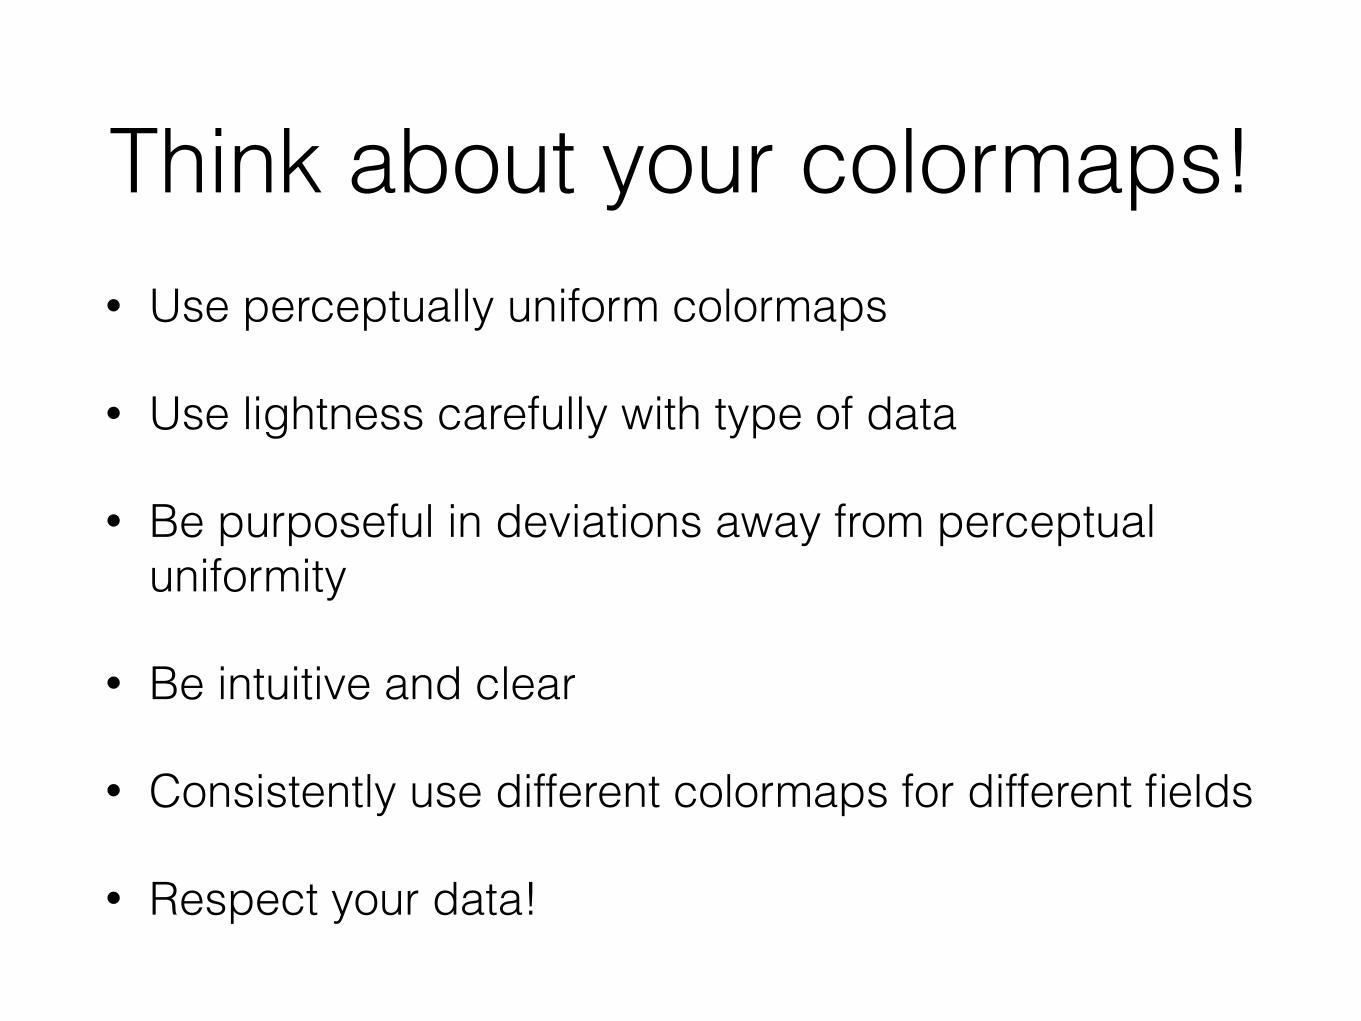
Think about your colormaps!• Use perceptually uniform colormaps
• Use lightness carefully with type of data
• Be purposeful in deviations away from perceptual uniformity
• Be intuitive and clear
• Consistently use different colormaps for different fields
• Respect your data!
cmocean beautiful colormaps for oceanography
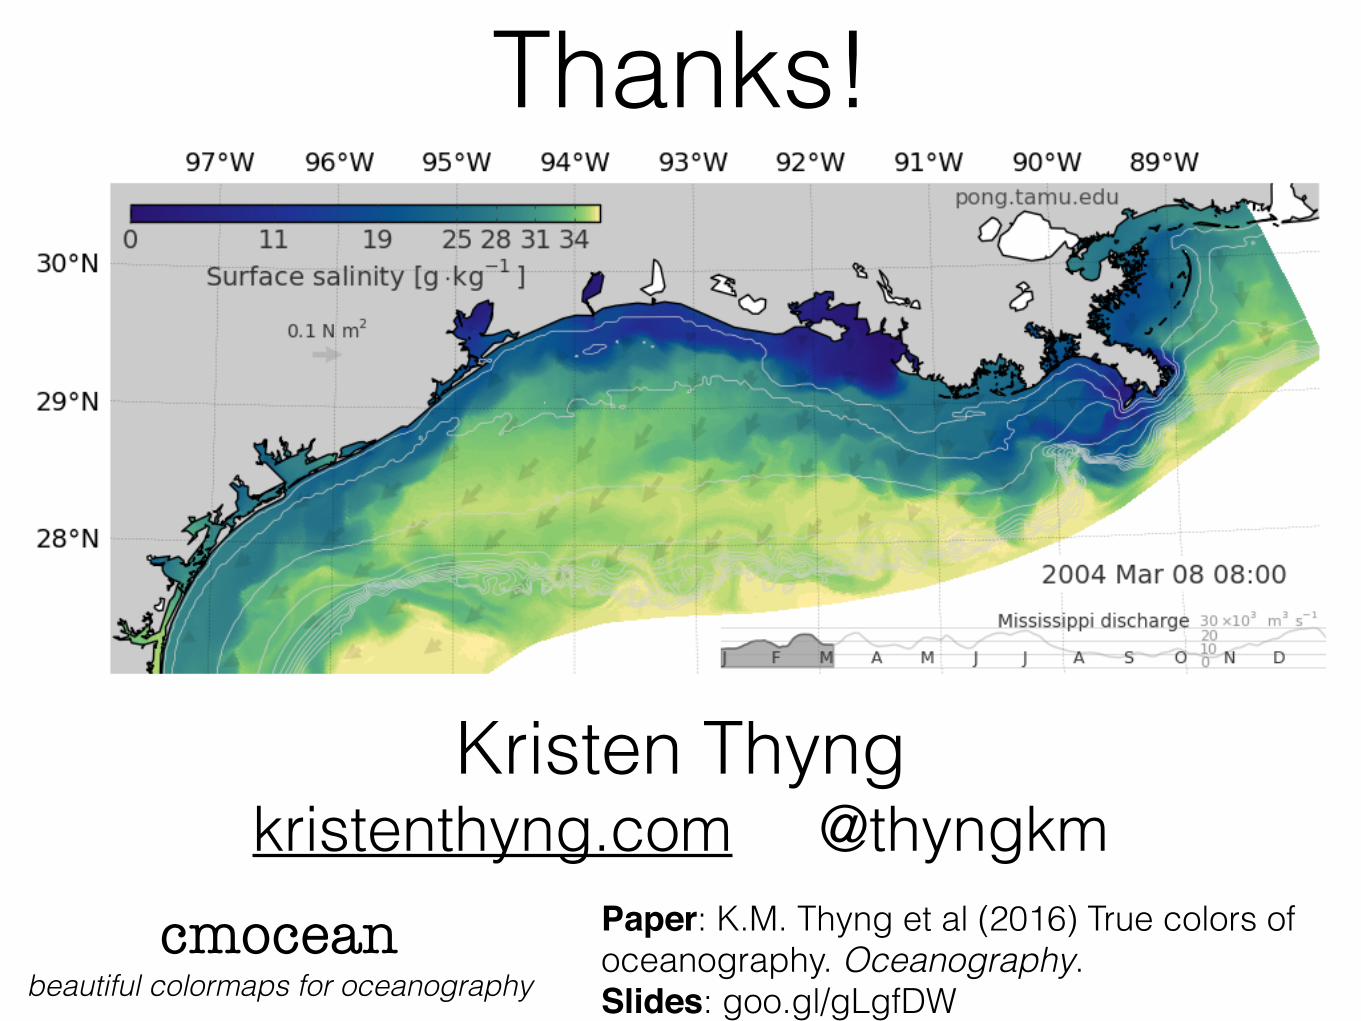
Thanks!
Kristen Thyng kristenthyng.com @thyngkm
Paper: K.M. Thyng et al (2016) True colors of oceanography. Oceanography. Slides: goo.gl/gLgfDW
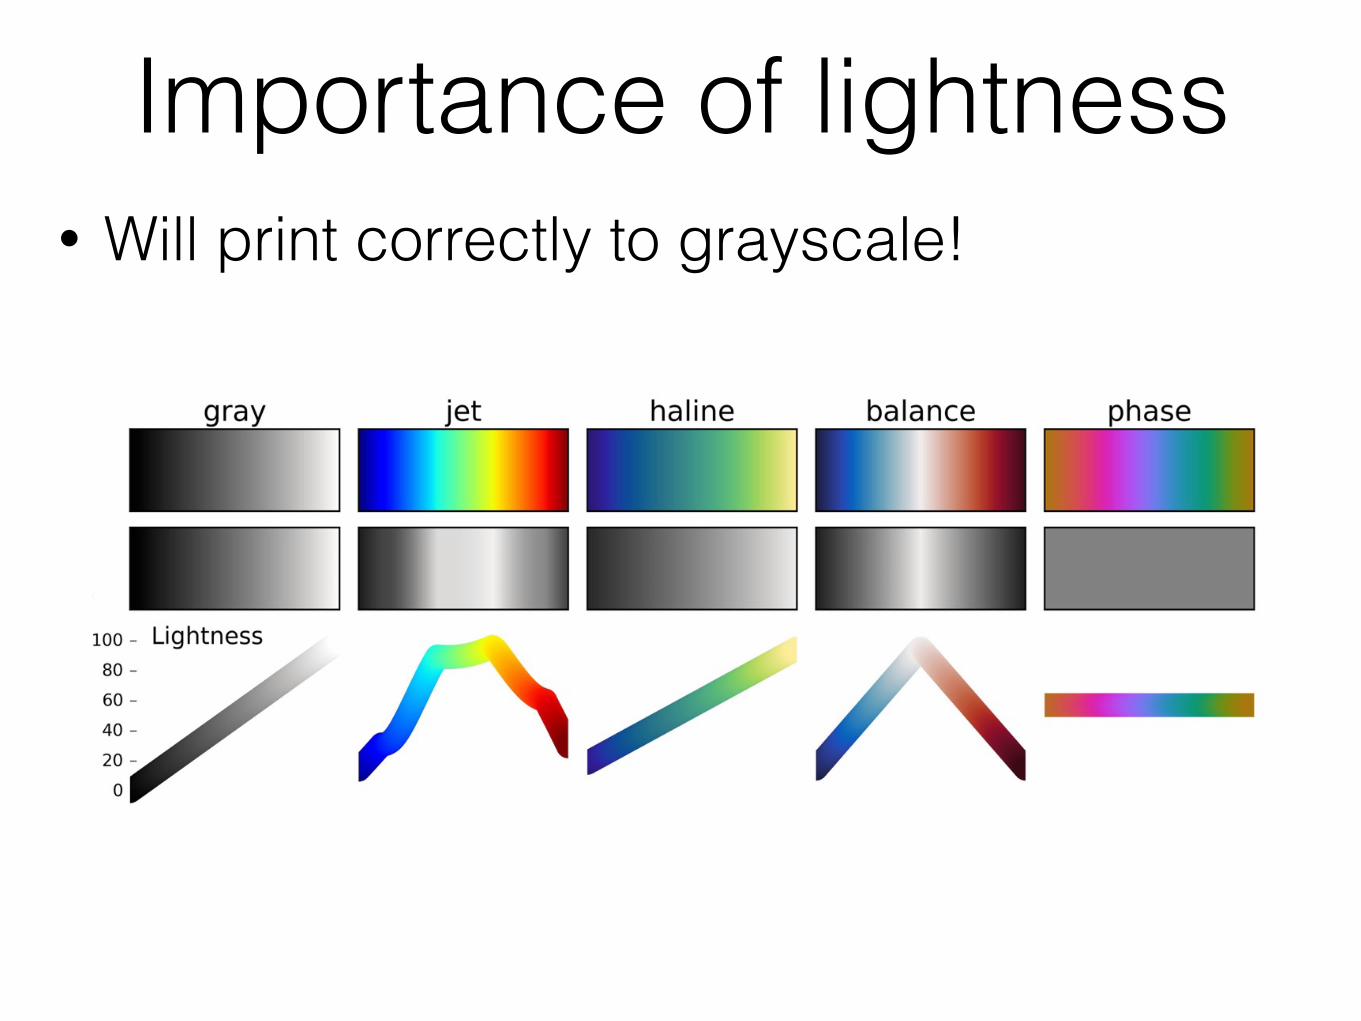
• Will print correctly to grayscale!
Importance of lightness


![Interactive Extraction of High-Frequency Aesthetically ...geometry.caltech.edu/pubs/LD03.pdfautomatically finding visual focus points [Miau], that the extraction of these colormaps](https://static.fdocuments.us/doc/165x107/6045b2cf0b7a9b7c116e2b95/interactive-extraction-of-high-frequency-aesthetically-automatically-finding.jpg)