
In-vitro Synthesis and Reconstitution of Cytochrome bo3 Ubiquinol
Upload
arijit-boseCategory
view
71download
0description

Copyright HDR 2008 Copyright HDR 2008 [email protected]@hubbardresearch.com
11
How To Measure Anything:
Finding the Value of Intangibles in Business

Copyright HDR 2008 Copyright HDR 2008 [email protected]@hubbardresearch.com
22
How to Measure Anything• In the past 12 years, I have conducted
over 60 major risk/return analysis projects that included a variety of “impossible” measurements
• I found such a high need for measuring difficult things that I decided I had to write a book
• The objective today is to explain an approach to making the “immeasurable” measurable and the surprising things we find when we accomplish this
What is AIE?
33
Modern PortfolioModern PortfolioTheoryTheory
AppliedAppliedInformationInformationEconomicsEconomics
EconomicsEconomics
Decision/Game Decision/Game TheoryTheory
StatisticsStatistics
Information TheoryInformation TheoryOptionsOptionsTheoryTheory
Operations ResearchOperations Research
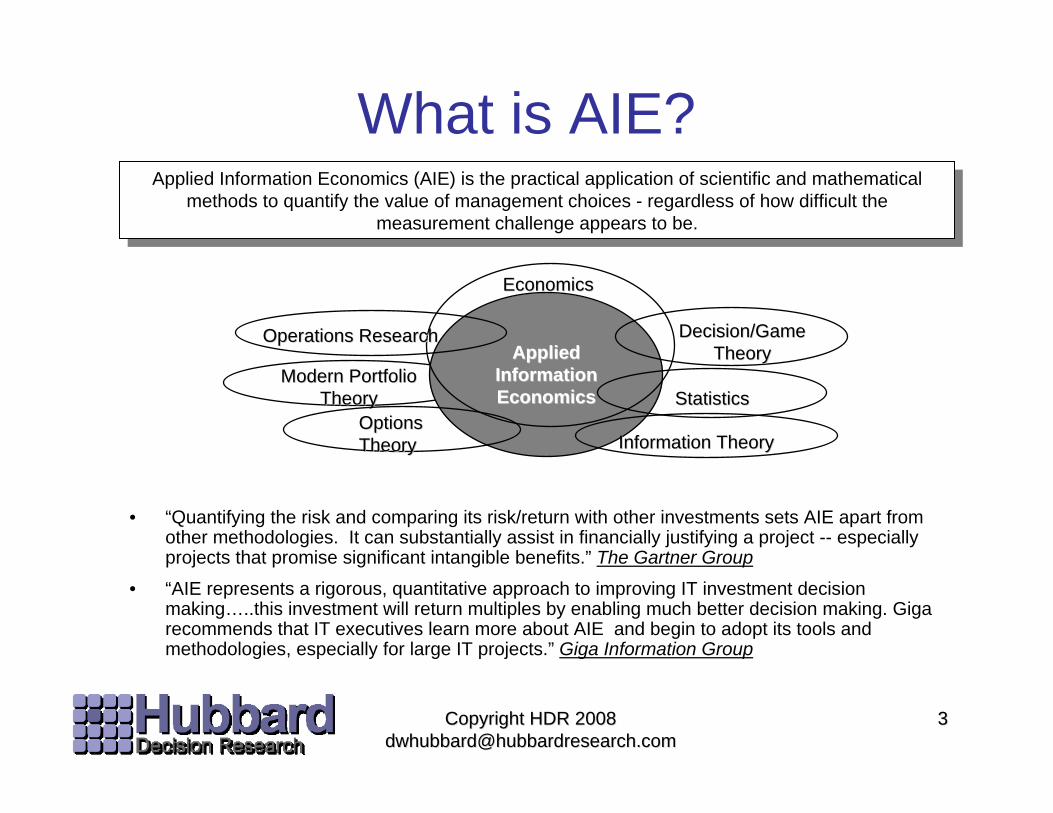
Applied Information Economics (AIE) is the practical application of scientific and mathematical methods to quantify the value of management choices - regardless of how difficult the
measurement challenge appears to be.
Applied Information Economics (AIE) is the practical application of scientific and mathematical methods to quantify the value of management choices - regardless of how difficult the
measurement challenge appears to be.
• “Quantifying the risk and comparing its risk/return with other investments sets AIE apart from other methodologies. It can substantially assist in financially justifying a project -- especially projects that promise significant intangible benefits.” The Gartner Group
• “AIE represents a rigorous, quantitative approach to improving IT investment decision making…..this investment will return multiples by enabling much better decision making. Giga recommends that IT executives learn more about AIE and begin to adopt its tools and methodologies, especially for large IT projects.” Giga Information Group
Copyright HDR 2008 Copyright HDR 2008 [email protected]@hubbardresearch.com

A Few Measurement Examples• Risk of IT• The Risk of obsolescence• The value of a human life• The value of saving an
endangered species• The value of better
information• The value of public health• Forecasting fuel demand
for the battlefield
Copyright HDR 2008 Copyright HDR 2008 [email protected]@hubbardresearch.com
44
• The value of better security
• The effects of an initiative when many other variables affect performance
• The future demand for space tourism
• The risk of a .com venture capital startup
• The risks of a major construction project
Copyright HDR 2008 Copyright HDR 2008 [email protected]@hubbardresearch.com
55
Three Illusions of Intangibles(The “howtomeasureanything.com” approach)
• The perceived impossibility of measurement is an illusion caused by not understanding:– the Concept of measurement– the Object of measurement– the Methods of measurement
• See my “Everything is Measurable”article in CIO Magazine (go to “articles”link on www.hubbardresearch.com
Copyright HDR 2008 Copyright HDR 2008 [email protected]@hubbardresearch.com
66
Uncertainty, Risk & Measurement
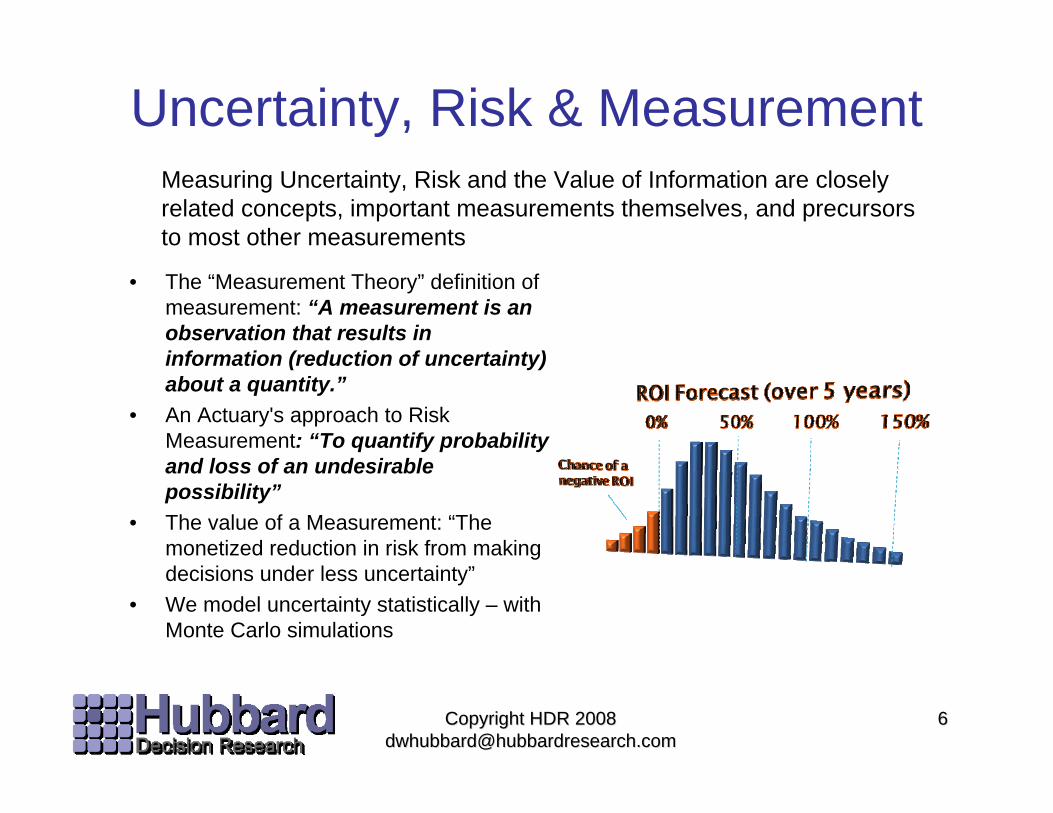
• The “Measurement Theory” definition of measurement: “A measurement is an observation that results in information (reduction of uncertainty) about a quantity.”
• An Actuary's approach to Risk Measurement: “To quantify probability and loss of an undesirable possibility”
• The value of a Measurement: “The monetized reduction in risk from making decisions under less uncertainty”
• We model uncertainty statistically – with Monte Carlo simulations
Measuring Uncertainty, Risk and the Value of Information are closely related concepts, important measurements themselves, and precursors to most other measurements

Ideal vs. Real-world Measurements
77
Normal Distribution
Uniform Distribution
Lognormal Distribution
Hybrid
Threshold confidence 15% 85%
Ideal Values: Point
Real-world Meas.
Assumptions: Most values in business cases are represented as exact values – even though exact values are almost never known
No Assumptions: Most things we DO know are better represented by ranges and probabilities – we don’t have to assume anything we don’t really know.
Copyright HDR 2007 Copyright HDR 2007 [email protected]@hubbardresearch.com

Copyright HDR 2008 Copyright HDR 2008 [email protected]@hubbardresearch.com
88
An Approach That Works1. Define the relevant decision and clarify the
inputs2. Model what you know now3. Compute the value of additional information4. Measure where the information value is
high5. Update the model and optimize the decision
Copyright HDR 2008 Copyright HDR 2008 [email protected]@hubbardresearch.com
99
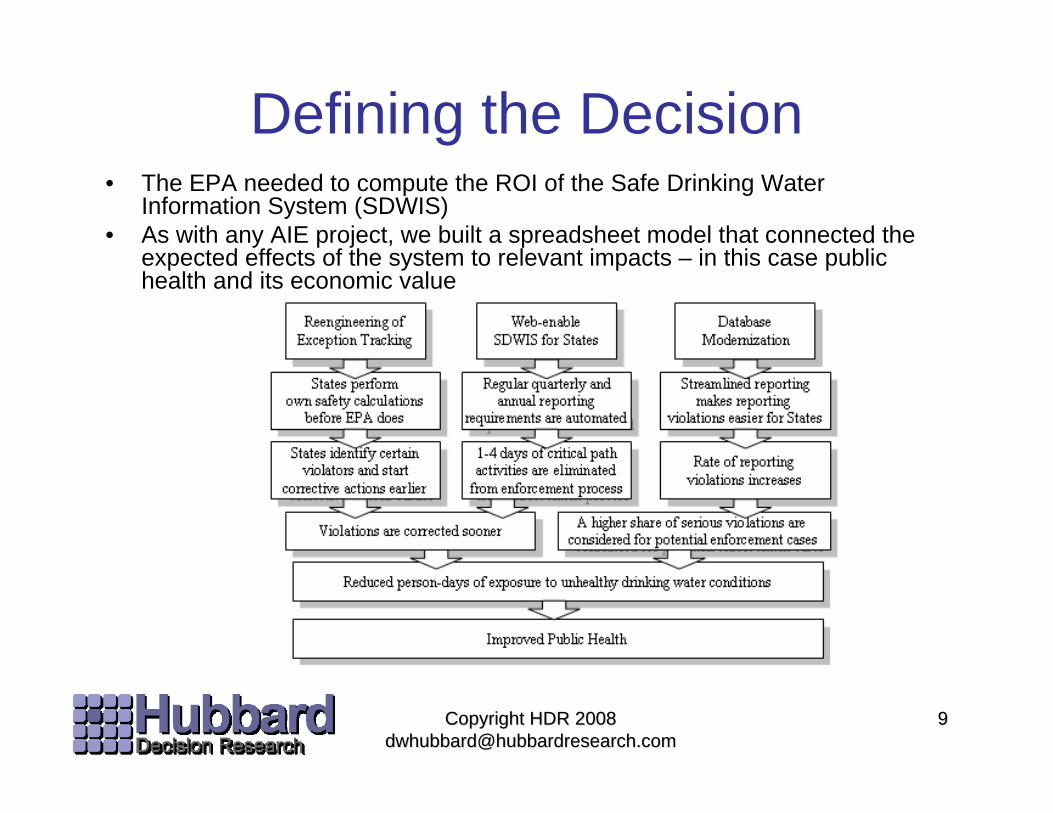
Defining the Decision• The EPA needed to compute the ROI of the Safe Drinking Water
Information System (SDWIS)• As with any AIE project, we built a spreadsheet model that connected the
expected effects of the system to relevant impacts – in this case public health and its economic value

1010
Model What You Know• Decades of studies show that most managers are
statistically “overconfident” when assessing their own uncertainty– Studies showed that bookies were great at assessing odds
subjectively, while doctors were terrible
• Studies also show that measuring your ownuncertainty about a quantity is a general skill that can be taught with a measurable improvement
• Training can “calibrate” people so that of all the times they say they are 90% confident, they will be right 90% of the time
Copyright HDR 2008 Copyright HDR 2008 [email protected]@hubbardresearch.com

1111
Calibration Test Examples• How many grams does the average Jelly Belly Jelly
Bean weight? – _____ to ____ (90% Confidence)
• What is the height in meters of the Sears Tower?– _____ to ____ (90% Confidence)
• Idaho has a larger area than Iraq. – True/False ____% Confidence
• In the English Language, the word “strategy” is used more often than the word “celebrate”.• True/False ____% Confidence
Copyright HDR 2008 Copyright HDR 2008 [email protected]@hubbardresearch.com

90% Confidence IntervalCalibrated probability assessment
results from various studies
Calibrated Estimates: Ranges
Copyright HDR 2008 Copyright HDR 2008 [email protected]@hubbardresearch.com
1212

Copyright HDR 2008 Copyright HDR 2008 [email protected]@hubbardresearch.com
1313
Giga Analysts
Giga Clients
Statistical Error
“Ideal” Confidence
30%
40%
50%
60%
70%
80%
90%
100%
50% 60% 80% 90% 100%
25
75 71 65 58
21
17
68 15265
4521
70%Assessed Chance Of Being Correct
Perc
ent C
orre
ct
99 # of Responses
Calibrated Estimates of Events• 1997: An experiment Hubbard conducted with Giga Information
Group proves people can be trained to assess probabilities of uncertain forecasts
• Hundreds have been calibrated since then• Calibrated probabilities are the basis for modeling the current state
of uncertainty

The Value of Information
Copyright HDR 2008 Copyright HDR 2008 [email protected]@hubbardresearch.com
1414
EVI p r V p r V p r V p r EVi j j ij
z
j j i l j j ij
z
j
z
i
k
=⎡
⎣⎢
⎤
⎦⎥ −
= ===∑ ∑∑∑ ( ) max ( | ), ( | ),... ( | ), *, , ,1
12
111Θ Θ Θ
The formula for the value of information has been around for almost 60 years. It is widely used in many parts of industry and government as part of the “decision analysis” methods – but still mostly unheard of in the parts of business where it might do the most good.
What it means:1.Information reduces uncertainty2.Reduced uncertainty improves decisions3.Improved decisions have observable consequences with measurable value

The EOL Method• The simplest approach computes the change in “Expected Opportunity
Loss”• “Opportunity Loss” is the loss (compared to the alternative) if it turns out you
made the wrong decision• Expected Opportunity Loss (EOL) is the cost of being wrong times the
chance of being wrong• The reduction in EOL from more information is the value of the information.• In the case of perfect information (if that were possible) the value of
information is equal to the EOL.• Simple Binary Example: You are about to make a $20 million investment to
upgrade the equipment in a factory to make a new product. If the new product does well, you save $50 million in manufacturing. If not, you lose (net) $10 million. There is a 20% chance of the new product failing. What’s it worth to have perfect certainty about this investment if that were possible?
• Answer: 20% x $10 million = $2 million
Copyright HDR 2008 Copyright HDR 2008 [email protected]@hubbardresearch.com
1515

• The value of information is computed a little differently with a distribution, but the same basic concepts apply
• For each variable, there is a “Threshold” where the investment just breaks even
• If the threshold is within the range of possible values, then there is a chance that you would make a different decision with better measurements
90% Confidence
IntervalThreshold Mean
5% tail 5% tail
ThresholdProbability
Information Value w/Ranges
Copyright HDR 2008 Copyright HDR 2008 [email protected]@hubbardresearch.com
1616

Normal Distribution VIA• The curve on the other side of the threshold is divided up into hundreds of
“slices”• Each slice has an assigned quantity (such as a potential productivity
improvement) and a probability of occurrence• For each assigned quantity, there is an Opportunity Loss• Each slice’s Opportunity Loss is multiplied by probability to compute its
Expected Opportunity Loss• The total EOL for all slices is the EVPI of the uncertain variable
Productivity Improvement in Process X
# effected by virus: 15%Opportunity Loss: $1,855,000Probability: 0.0053%EOL: $98.31
# effected by virus: 15%Opportunity Loss: $1,855,000Probability: 0.0053%EOL: $98.31
25%20%15%10%5%
Copyright HDR 2008 Copyright HDR 2008 [email protected]@hubbardresearch.com
1717
Total of all EOL’s = $58,989

Dol
lar V
alue
/Cos
t EVI
MaximumENBI
ECI
ENBI
Increasing Value & Cost of Info.
• EVPI – Expected Value of Perfect Information
• ECI – Expected Cost of Information
• EVI – Expected Value of Information
• ENBI – Expected Net Benefit of Information
$0
$$$
Low accuracyHigh accuracy
EVPIAim for this range
Copyright HDR 2008 Copyright HDR 2008 [email protected]@hubbardresearch.com
1818
• The value of information levels off while the cost of information accelerates• Information value grows fastest at the beginning of information collection• Use iterative measurements that err on the side of “small bites” at the steep
part of the slope

Copyright HDR 2008 Copyright HDR 2008 [email protected]@hubbardresearch.com
1919
The Measurement Inversion
Typical Attention
Econ
omic
Rel
evan
ce
Measurement Attention vs. Relevance
• After the information values for over 3,500 variables was computed, a pattern emerged.
• The highest value measurements were almost never measured while most measurement effort was spent on less relevant factors
– Costs were measured more than the more uncertain benefits
– Small “hard” benefits would be measured more than large “soft” benefits
• Also, we found that, if anything, fewermeasurements were required after the information values were known.
See my article “The IT Measurement Inversion” in CIO Magazine(its also on my website at www.hubbardresearch.com under the “articles” link)

Copyright HDR 2008 Copyright HDR 2008 [email protected]@hubbardresearch.com
2020
Next Step: Observations• Once we’ve determined what to measure, we
can think of observations that would reduce uncertainty
• The value of the information limits what methods we should use, but we have a variety of methods available
• Take the “Nike Method”: Just Do It – don’t let imagined difficulties get in the way of starting observations

Copyright HDR 2008 Copyright HDR 2008 [email protected]@hubbardresearch.com
2121
Practical Assumptions• Its been measured before• You have more data than you think• You need less data than you think• Its more economical than you think• Your subjective estimate of possible
measurement errors is exaggerated
“It’s amazing what you can see when you look”Yogi Berra

The “Math-less” Statistics Table• Measurement is based on
observation and most observations are just samples
• Reducing your uncertainty with random samples is not made intuitive in most statistics texts
• This table makes computing a 90% confidence interval easy
Copyright HDR 2008 Copyright HDR 2008 [email protected]@hubbardresearch.com
2222

Copyright HDR 2008 Copyright HDR 2008 [email protected]@hubbardresearch.com
2323
Measuring to the Threshold• Measurements have
value usually because there is some point where the quantity makes a difference
• Its often much harder to ask “How much is X” than “Is X enough” Samples Below Threshold
20%
30%
40%
50%
0.1%
1%
10%
4 5 6 7 8 9 10
2 4 6 8 10 12 16 20Number Sampled
Cha
nce
the
Med
ian
is B
elow
the
Thre
shol
d
1 2 3
1814
2%
5%
0.2%
0.5%
0

Copyright HDR 2008 Copyright HDR 2008 [email protected]@hubbardresearch.com
2424
Statistics Goes to War
• Several clever sampling methods exist that can measure more with less data than you might think
• Examples: estimating the population of fish in the ocean, estimating the number of tanks created by the Germans in WWII, extremely small samples, etc.

Copyright HDR 2008 Copyright HDR 2008 [email protected]@hubbardresearch.com
2525
Reducing Inconsistency• The “Lens Model” is another method used to improve on expert intuition• The chart shows the reduction in error from this method on intuitive estimates• In every case, this method equaled or bettered the judgment of experts
0% 10% 20% 30% 40%
Cancer patient life-expectancy
Life-insurance salesrep performance
Graduate students gradesChanges in stock prices
Mental illness using personality tests
Student ratings of teaching effectiveness
IQ scores using Rorschach tests
Psychology course grades
Business failures using financial ratios
Reduction in Errors
Battlefield Fuel ForecastsIT Portfolio Priorities My StudiesMy Studies
Source: Hubbard Decision Research

Copyright HDR 2008 Copyright HDR 2008 [email protected]@hubbardresearch.com
2626
The Simplest Method• “Bayesian” methods in statistics use new information to update prior
knowledge• Bayesian methods can be even more elaborate that other statistical
methods BUT…• It turns out that calibrated people are already mostly “instinctively
Bayesian”• The instinctive Bayesian approach:
– Assess your initial subjective uncertainty with a calibrated probability– Gather and study new information about the topic (it could be qualitative or
even tangentially related)– Give another subjective calibrated probability assessment with this new
information• In studies where people were asked to do this, thier results were
usually not irrational compared to what would be computed with Bayesian statistics – calibrated people do even better

Comparison of Methods• Traditional non-Bayesian
statistics (what you probably learned in the first semester of stats) assumes you knew nothing prior to the samples you took - this is almost never true in reality
• Most un-calibrated experts are overconfident and slightly overemphasize new information
• Calibrated experts are not overconfident, but slightly ignore prior knowledge
• Bayesian analysis is the perfect balance; neither under- nor over- confident, uses both new and old information
Copyright HDR 2008 Copyright HDR 2008 [email protected]@hubbardresearch.com
2727
Ignores Prior Knowledge; Emphasizes new data
Ignores New data; Emphasizes Prior
Knowledge
Under-confident (Stated
uncertainty is higher than
rational)
Overconfident (Stated
uncertainty is lower than rational)
Calibrated Expert
Bayesian
Typical Un-calibrated
Expert
Non-BayesianStatistics
StubbornGullible
OverlyCautious
Vacillating,Indecisive

Copyright HDR 2008 Copyright HDR 2008 [email protected]@hubbardresearch.com
2828
Risk/ROI w/ “Monte Carlo”
Administrative Cost Reduction
Total Project Cost
Customer Retention Increase
5% 10% 15%
10% 20% 30%
$2 million $4 million $6 million
ROI-50% 50% 100%0%
• A Monte Carlo simulation generates thousands of random scenarios using the defined probabilities and ranges
• The result is a range ROI not a point ROI

Quantifying Risk Aversion
Copyright HDR 2008 Copyright HDR 2008 [email protected]@hubbardresearch.com
2929
Acceptable Risk/Return Boundary
Investment Region
• The simplest element of Harry Markowitz’s Nobel Prize-winning method “Modern Portfolio Theory” is documenting how much risk an investor accepts for a given return.
• The “Investment Boundary” states how much risk an investor is willing to accept for a given return.
• For our purposes, we modified Markowitz’s approach a bit.
Investment

Define Decision Model
Define Decision Model
Calibrate EstimatorsCalibrate
Estimators
Conduct Value of Information Analysis (VIA)
Conduct Value of Information Analysis (VIA)
Measure according to VIA
results and update model
Measure according to VIA
results and update model
Populate Model with Calibrated
Estimates & Measurements
Populate Model with Calibrated
Estimates & Measurements
Analyze Remaining Risk
Analyze Remaining Risk
Optimize DecisionOptimize Decision
“Full” RRA in 7 Steps
3030Copyright HDR 2008 Copyright HDR 2008 [email protected]@hubbardresearch.com

Copyright HDR 2008 Copyright HDR 2008 [email protected]@hubbardresearch.com
3131
Forecasting Fuel for Battle
• The US Marine Corps with the Office of Naval Research needed a better method for forecasting fuel for wartime operations
• The VIA showed that the big uncertainty was really supply route conditions, not whether they are engaging the enemy
• Consequently, we performed a series of experiments with supply trucks rigged with GPS and fuel-flow meters
Copyright HDR 2008 Copyright HDR 2008 [email protected]@hubbardresearch.com
3232
Reactions: Fuel for the Marines• “The biggest surprise was that we can save so much
fuel. We freed up vehicles because we didn’t have to move as much fuel. For a logistics person that's critical. Now vehicles that moved fuel can move ammunition.“Luis Torres, Fuel Study Manager, Office of Naval Research
• “What surprised me was that [the model] showed most fuel was burned on logistics routes. The study even uncovered that tank operators would not turn tanks off if they didn’t think they could get replacement starters. That’s something that a logistician in a 100 years probably wouldn’t have thought of.” Chief Warrant Officer Terry Kunneman, Bulk Fuel Planning, HQ Marine Corps
Copyright HDR 2008 Copyright HDR 2008 [email protected]@hubbardresearch.com
3333
Final Tips• Learn how to think about uncertainty, risk and
information value in a quantitative way• Assume its been measured before• You have more data than you think and you
need less data than you think• Methods that reduce your uncertainty are more
economical than many managers assume• Don’t let “exception anxiety” cause you to avoid
any observations at all• Just do it

Copyright HDR 2008 Copyright HDR 2008 [email protected]@hubbardresearch.com
3434
Questions?Doug HubbardHubbard Decision [email protected] 858 2788• If you want electronic copies of this presentation and
copies of supporting articles I mention, please leave me a business card with “Presentation” written on the back


