Platypus Indoor Localization and Identification through Sensing of … · 2018-01-04 · Platypus...
14
Platypus — Indoor Localization and Identification through Sensing Electric Potential Changes in Human Bodies Tobias Grosse-Puppendahl 1 , Xavier Dellangnol 2 , Christian Hatzfeld 2 , Biying Fu 3 , Mario Kupnik 2 , Arjan Kuijper 2,3 , Matthias R. Hastall 4 , James Scott 1 , Marco Gruteser 5 1 Microsoft Research, 21 Station Road, CB1 2FB Cambridge, UK, {tgp,jws}@microsoft.com 2 Technische Universität Darmstadt, Karolinenplatz 5, 64283 Darmstadt, Germany, [email protected], {c.hatzfeld,kupnik}@emk.tu-darmstadt.de 3 Fraunhofer IGD, Fraunhoferstr. 5, 64283 Darmstadt, Germany, {biying.fu,arjan.kuijper}@igd.fraunhofer.de 4 TU Dortmund University, Emil-Figge-Str. 50, 44227 Dortmund, Germany, [email protected] 5 WINLAB, Rutgers University, New Jersey 08902, USA, [email protected] ABSTRACT Platypus is the first system to localize and identify people by remotely and passively sensing changes in their body elec- tric potential which occur naturally during walking. While it uses three or more electric potential sensors with a maximum range of 2 m, as a tag-free system it does not require the user to carry any special hardware. We describe the physi- cal principles behind body electric potential changes, and a predictive mathematical model of how this affects a passive electric field sensor. By inverting this model and combining data from sensors, we infer a method for localizing people and experimentally demonstrate a median localization er- ror of 0.16 m. We also use the model to remotely infer the change in body electric potential with a mean error of 8.8 % compared to direct contact-based measurements. We show how the reconstructed body electric potential differs from person to person and thereby how to perform identification. Based on short walking sequences of 5 s, we identify four users with an accuracy of 94 %, and 30 users with an accu- racy of 75 %. We demonstrate that identification features are valid over multiple days, though change with footwear. Categories and Subject Descriptors H.5.m [Information Interfaces and Presentation (I.7)]: Miscellaneous Keywords localization; identification; capacitive sensing; electric po- tential sensing Permission to make digital or hard copies of all or part of this work for personal or classroom use is granted without fee provided that copies are not made or distributed for profit or commercial advantage and that copies bear this notice and the full citation on the first page. Copyrights for components of this work owned by others than the author(s) must be honored. Abstracting with credit is permitted. To copy otherwise, or republish, to post on servers or to redistribute to lists, requires prior specific permission and/or a fee. Request permissions from [email protected]. MobiSys ’16, June 25–30, 2016, Singapore. © 2016 ACM. ISBN 978-1-4503-4269-8/16/06. . . $15.00 DOI: http://dx.doi.org/10.1145/2906388.2906402 1. INTRODUCTION Localizing and identifying humans in indoor spaces has been a challenging problem in mobile and pervasive com- puting for many years [56, 39, 32]. Applications in valuable domains like home automation [30], institutional care [60], and personalized energy metering [64] rely on localization and identification information. Ideally, such a system should be “tag free”, so that the users at home or in an office environment are not required to carry any particular hardware. Existing tag-free approaches have relied on sensing various properties of humans such as sounds they make [22], heat emissions [42] or the effect of the body on RF signals [1, 36]. In our system we remotely sense a different underlying quantity: the electric potential car- ried by the human body. Unlike existing capacitive sensing systems that actively generate an electric field to sense peo- ple [57, 9], we passively observe naturally occurring electric field changes, similarly to platypuses when hunting under- water preys [16]. As people move, their bodies’ electric potential changes when interacting with the environment. The most signifi- cant changes occur through two means: static charging ex- plained by the triboelectric effect [10], and changes in ca- pacitive coupling to the environment as one’s feet move to- wards and away from the floor during walking [17]. With Platypus, we remotely infer body electric potential changes at distances up to 2 m using a distributed grid of passive electric field sensors. Requiring at least three sensors, we have developed a method of inferring both the location of the body and the characteristic signature pattern of electric potential changes that occurs when walking, which permits identification of users. The contribution of this paper is the introduction of Platy- pus, a novel use of electric field sensing that supports both localization and user differentiation: • We localize a person observing the ambient electric field, further reconstruct body electric potential change, and extract a signature for identification.
Transcript of Platypus Indoor Localization and Identification through Sensing of … · 2018-01-04 · Platypus...
Platypus — Indoor Localization and Identification throughSensing Electric Potential Changes in Human Bodies
Tobias Grosse-Puppendahl1, Xavier Dellangnol2, Christian Hatzfeld2, Biying Fu3,Mario Kupnik2, Arjan Kuijper2,3, Matthias R. Hastall4, James Scott1, Marco Gruteser5
1Microsoft Research, 21 Station Road, CB1 2FB Cambridge, UK,tgp,[email protected]
2Technische Universität Darmstadt, Karolinenplatz 5, 64283 Darmstadt, Germany,[email protected], c.hatzfeld,[email protected] IGD, Fraunhoferstr. 5, 64283 Darmstadt, Germany,
biying.fu,[email protected] Dortmund University, Emil-Figge-Str. 50, 44227 Dortmund, Germany,
[email protected], Rutgers University, New Jersey 08902, USA,
ABSTRACTPlatypus is the first system to localize and identify people byremotely and passively sensing changes in their body elec-tric potential which occur naturally during walking. While ituses three or more electric potential sensors with a maximumrange of 2 m, as a tag-free system it does not require theuser to carry any special hardware. We describe the physi-cal principles behind body electric potential changes, and apredictive mathematical model of how this affects a passiveelectric field sensor. By inverting this model and combiningdata from sensors, we infer a method for localizing peopleand experimentally demonstrate a median localization er-ror of 0.16 m. We also use the model to remotely infer thechange in body electric potential with a mean error of 8.8 %compared to direct contact-based measurements. We showhow the reconstructed body electric potential differs fromperson to person and thereby how to perform identification.Based on short walking sequences of 5 s, we identify fourusers with an accuracy of 94 %, and 30 users with an accu-racy of 75 %. We demonstrate that identification featuresare valid over multiple days, though change with footwear.
Categories and Subject DescriptorsH.5.m [Information Interfaces and Presentation (I.7)]:Miscellaneous
Keywordslocalization; identification; capacitive sensing; electric po-tential sensing
Permission to make digital or hard copies of all or part of this work for personal orclassroom use is granted without fee provided that copies are not made or distributedfor profit or commercial advantage and that copies bear this notice and the full citationon the first page. Copyrights for components of this work owned by others than theauthor(s) must be honored. Abstracting with credit is permitted. To copy otherwise, orrepublish, to post on servers or to redistribute to lists, requires prior specific permissionand/or a fee. Request permissions from [email protected].
MobiSys ’16, June 25–30, 2016, Singapore.
© 2016 ACM. ISBN 978-1-4503-4269-8/16/06. . . $15.00
DOI: http://dx.doi.org/10.1145/2906388.2906402
1. INTRODUCTIONLocalizing and identifying humans in indoor spaces has
been a challenging problem in mobile and pervasive com-puting for many years [56, 39, 32]. Applications in valuabledomains like home automation [30], institutional care [60],and personalized energy metering [64] rely on localizationand identification information.
Ideally, such a system should be “tag free”, so that theusers at home or in an office environment are not required tocarry any particular hardware. Existing tag-free approacheshave relied on sensing various properties of humans such assounds they make [22], heat emissions [42] or the effect of thebody on RF signals [1, 36]. In our system we remotely sensea different underlying quantity: the electric potential car-ried by the human body. Unlike existing capacitive sensingsystems that actively generate an electric field to sense peo-ple [57, 9], we passively observe naturally occurring electricfield changes, similarly to platypuses when hunting under-water preys [16].
As people move, their bodies’ electric potential changeswhen interacting with the environment. The most signifi-cant changes occur through two means: static charging ex-plained by the triboelectric effect [10], and changes in ca-pacitive coupling to the environment as one’s feet move to-wards and away from the floor during walking [17]. WithPlatypus, we remotely infer body electric potential changesat distances up to 2 m using a distributed grid of passiveelectric field sensors. Requiring at least three sensors, wehave developed a method of inferring both the location ofthe body and the characteristic signature pattern of electricpotential changes that occurs when walking, which permitsidentification of users.
The contribution of this paper is the introduction of Platy-pus, a novel use of electric field sensing that supports bothlocalization and user differentiation:• We localize a person observing the ambient electric
field, further reconstruct body electric potential change,and extract a signature for identification.
• We detail the physical principles behind Platypus, themathematical models and working prototype hardware.• Based on detailed experiments, we show that Platy-
pus achieves a median localization error of 16 cm for awalking user.• We experimentally validate Platypus’s ability to recog-
nize users based on their signature of electric potentialchanges during walking; we observe an average accu-racy of 94 % for 4 users and 75 % for 30 users.
2. BACKGROUND & RELATED WORK
2.1 Localization & Identification SystemsIndoor localization and identification systems can be di-
vided into tag-dependent and tag-free [32, 35, 39, 56]. Tag-free systems, including Platypus, do not limit who is moni-tored to those with tags, or require specific behaviour (car-rying the tag). We therefore focus on other tag-free systemsas comparisons for Platypus.
Camera-based systems [60], including depth [62] cameras,can localize people accurately (error < 1 cm) as well as iden-tify them with face and/or body shape recognition. How-ever, privacy and security concerns make them unsuitablefor some environments [31]. Similar concerns may be raisedwhen using an array of microphones to recognize humanactivities (e.g. talking or opening a door). These can be re-alized with techniques such as time difference of arrival [7]and may also require classification of sounds [22].
Infrared sensors have been used as binary [52] as well asanalog [26, 41, 42] sources for localization. The modalityis a low-power, low-cost solution [42] that can even trackmultiple targets [63], and potentially perform identificationby gait analysis [65]. Pressure-sensitive or capacitive local-ization systems use sensors deployed underneath the flooror integrated in furniture [8, 9, 51, 57]. The effort of in-stalling such systems is large, as changes to existing flooringare required [9].
Various RF-based tag-free localization methods have beenpresented, using ultra-wideband radar [48], radio tomogra-phy [61], RSSI fingerprinting [2], WiFi Doppler [47] andFMCW-modulated radar [1]. Recent systems have lever-aged Wi-Fi for vital sign detection [36] or to recognize spo-ken words [58].
Identification and room-level localization has been demon-strated by ultrasonic distance sensors used to measure theheight of occupants, e.g. as they walk through doors [28, 54].Compared to these weak biometric factors related to bodyheight and movements, we investigate an even more tempo-rary factor that changes with footwear and clothing. Thiscan be regarded as a privacy advantage, allowing to identifya person for as long as the same shoes are worn.
Our system Platypus uses changes in body electric poten-tial due to walking, which is a different underlying physicalmechanism to any above. This modality has a particularset of trade-offs. It is passive, requiring no injection of e.g.RF or audio into the environment. Like PIR, camera andaudio systems, it cannot operate through walls, in contrastto RF systems [47]. While active capacitive techniques aresusceptible to high-frequency noise, Platypus as a passivesystem has a cut-off frequency of less than 10 Hz. Higherfrequency components, e.g. injected by power-lines [15] orswitch-mode power supplies [34], have a limited effect onthe operation of Platypus. Other appliances like fluorescent
Sensor
Cc VB
1
VB
2
+ + + + + + +--- -- - -
+ + + + + +
---
-- - -+
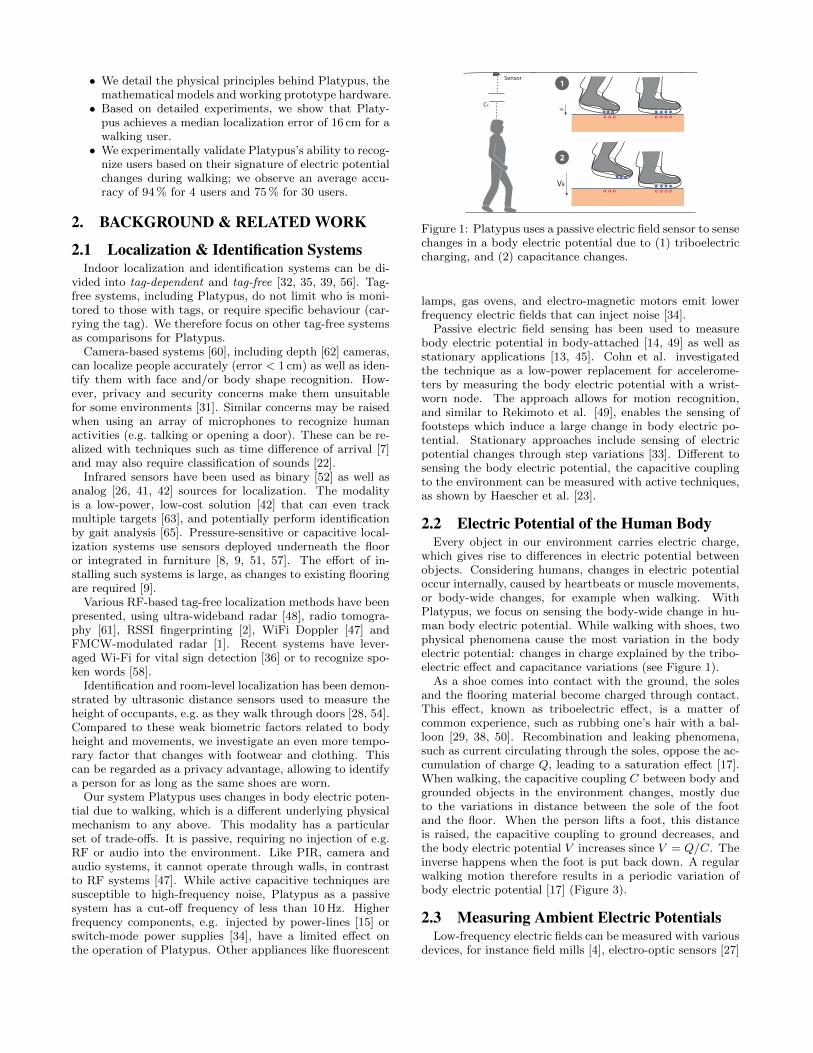
Figure 1: Platypus uses a passive electric field sensor to sensechanges in a body electric potential due to (1) triboelectriccharging, and (2) capacitance changes.
lamps, gas ovens, and electro-magnetic motors emit lowerfrequency electric fields that can inject noise [34].
Passive electric field sensing has been used to measurebody electric potential in body-attached [14, 49] as well asstationary applications [13, 45]. Cohn et al. investigatedthe technique as a low-power replacement for accelerome-ters by measuring the body electric potential with a wrist-worn node. The approach allows for motion recognition,and similar to Rekimoto et al. [49], enables the sensing offootsteps which induce a large change in body electric po-tential. Stationary approaches include sensing of electricpotential changes through step variations [33]. Different tosensing the body electric potential, the capacitive couplingto the environment can be measured with active techniques,as shown by Haescher et al. [23].
2.2 Electric Potential of the Human BodyEvery object in our environment carries electric charge,
which gives rise to differences in electric potential betweenobjects. Considering humans, changes in electric potentialoccur internally, caused by heartbeats or muscle movements,or body-wide changes, for example when walking. WithPlatypus, we focus on sensing the body-wide change in hu-man body electric potential. While walking with shoes, twophysical phenomena cause the most variation in the bodyelectric potential: changes in charge explained by the tribo-electric effect and capacitance variations (see Figure 1).
As a shoe comes into contact with the ground, the solesand the flooring material become charged through contact.This effect, known as triboelectric effect, is a matter ofcommon experience, such as rubbing one’s hair with a bal-loon [29, 38, 50]. Recombination and leaking phenomena,such as current circulating through the soles, oppose the ac-cumulation of charge Q, leading to a saturation effect [17].When walking, the capacitive coupling C between body andgrounded objects in the environment changes, mostly dueto the variations in distance between the sole of the footand the floor. When the person lifts a foot, this distanceis raised, the capacitive coupling to ground decreases, andthe body electric potential V increases since V = Q/C. Theinverse happens when the foot is put back down. A regularwalking motion therefore results in a periodic variation ofbody electric potential [17] (Figure 3).
2.3 Measuring Ambient Electric PotentialsLow-frequency electric fields can be measured with various
devices, for instance field mills [4], electro-optic sensors [27]
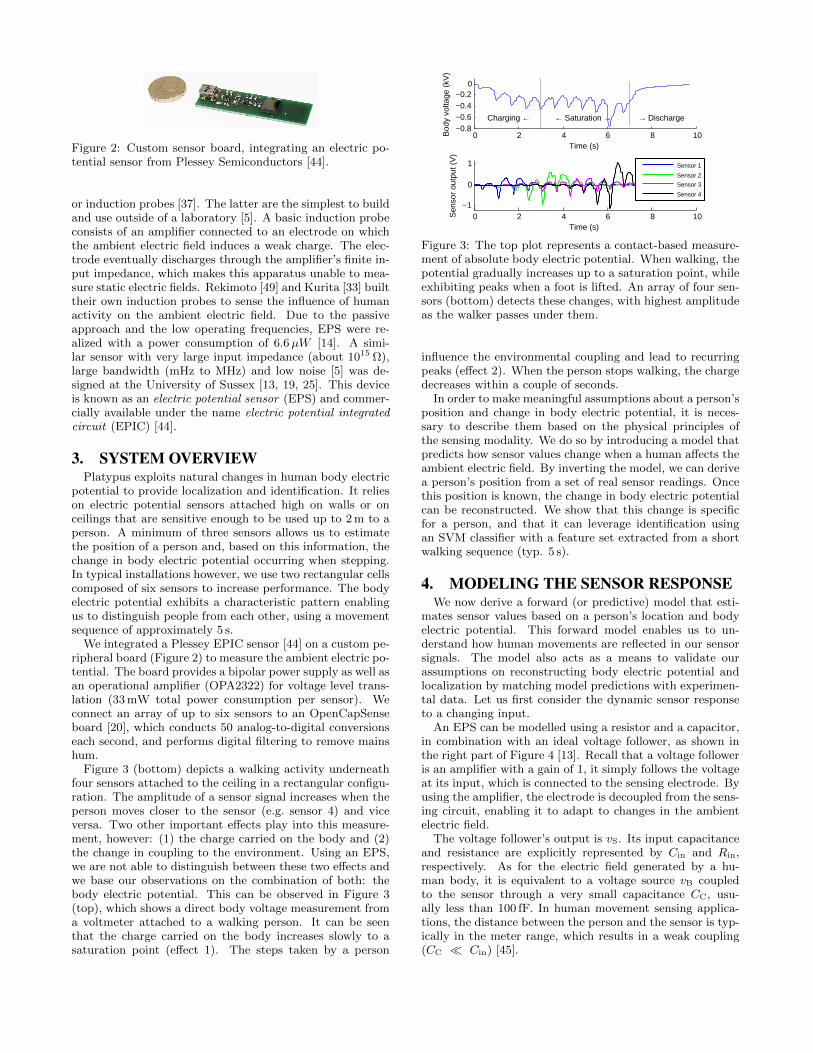
Figure 2: Custom sensor board, integrating an electric po-tential sensor from Plessey Semiconductors [44].
or induction probes [37]. The latter are the simplest to buildand use outside of a laboratory [5]. A basic induction probeconsists of an amplifier connected to an electrode on whichthe ambient electric field induces a weak charge. The elec-trode eventually discharges through the amplifier’s finite in-put impedance, which makes this apparatus unable to mea-sure static electric fields. Rekimoto [49] and Kurita [33] builttheir own induction probes to sense the influence of humanactivity on the ambient electric field. Due to the passiveapproach and the low operating frequencies, EPS were re-alized with a power consumption of 6.6µW [14]. A simi-lar sensor with very large input impedance (about 1015 Ω),large bandwidth (mHz to MHz) and low noise [5] was de-signed at the University of Sussex [13, 19, 25]. This deviceis known as an electric potential sensor (EPS) and commer-cially available under the name electric potential integratedcircuit (EPIC) [44].
3. SYSTEM OVERVIEWPlatypus exploits natural changes in human body electric
potential to provide localization and identification. It relieson electric potential sensors attached high on walls or onceilings that are sensitive enough to be used up to 2 m to aperson. A minimum of three sensors allows us to estimatethe position of a person and, based on this information, thechange in body electric potential occurring when stepping.In typical installations however, we use two rectangular cellscomposed of six sensors to increase performance. The bodyelectric potential exhibits a characteristic pattern enablingus to distinguish people from each other, using a movementsequence of approximately 5 s.
We integrated a Plessey EPIC sensor [44] on a custom pe-ripheral board (Figure 2) to measure the ambient electric po-tential. The board provides a bipolar power supply as well asan operational amplifier (OPA2322) for voltage level trans-lation (33 mW total power consumption per sensor). Weconnect an array of up to six sensors to an OpenCapSenseboard [20], which conducts 50 analog-to-digital conversionseach second, and performs digital filtering to remove mainshum.
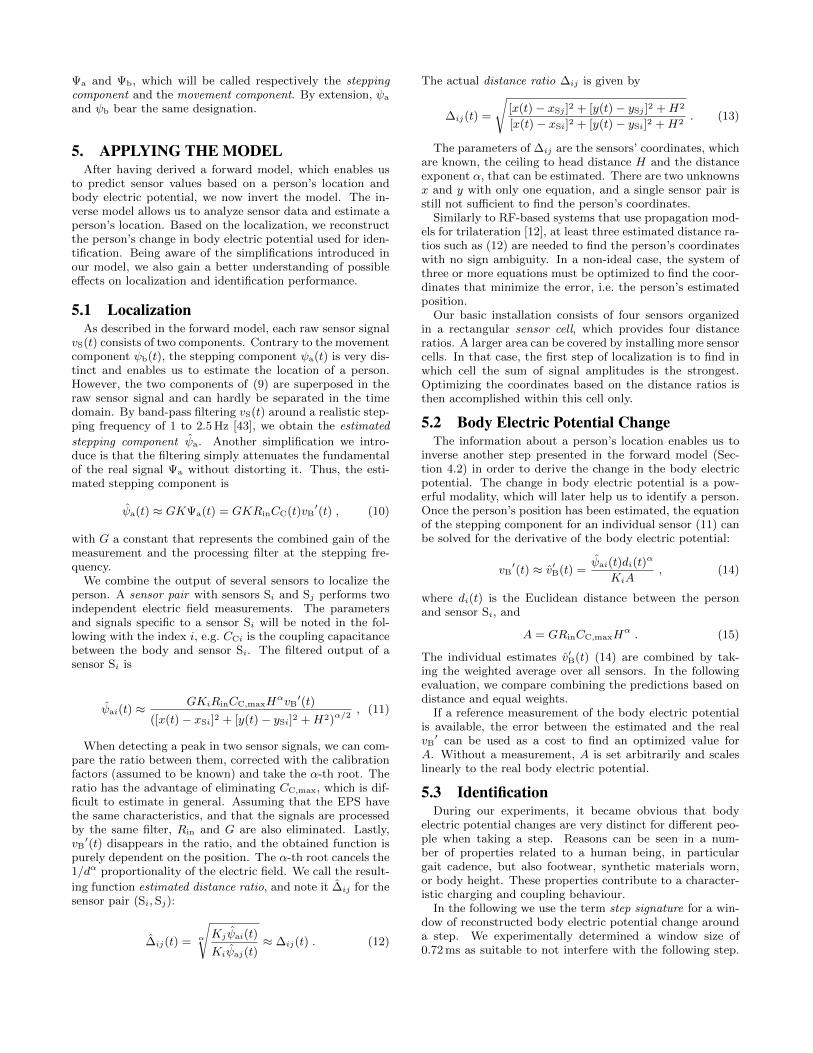
Figure 3 (bottom) depicts a walking activity underneathfour sensors attached to the ceiling in a rectangular configu-ration. The amplitude of a sensor signal increases when theperson moves closer to the sensor (e.g. sensor 4) and viceversa. Two other important effects play into this measure-ment, however: (1) the charge carried on the body and (2)the change in coupling to the environment. Using an EPS,we are not able to distinguish between these two effects andwe base our observations on the combination of both: thebody electric potential. This can be observed in Figure 3(top), which shows a direct body voltage measurement froma voltmeter attached to a walking person. It can be seenthat the charge carried on the body increases slowly to asaturation point (effect 1). The steps taken by a person
0 2 4 6 8 10−1
0
1
Time (s)
Sen
sor
outp
ut (
V)
Sensor 1
Sensor 2
Sensor 3
Sensor 4
0 2 4 6 8 10−0.8−0.6−0.4−0.2
0
Time (s)
Bod
y vo
ltage
(kV
)
Charging ← ← Saturation → → Discharge
Figure 3: The top plot represents a contact-based measure-ment of absolute body electric potential. When walking, thepotential gradually increases up to a saturation point, whileexhibiting peaks when a foot is lifted. An array of four sen-sors (bottom) detects these changes, with highest amplitudeas the walker passes under them.
influence the environmental coupling and lead to recurringpeaks (effect 2). When the person stops walking, the chargedecreases within a couple of seconds.
In order to make meaningful assumptions about a person’sposition and change in body electric potential, it is neces-sary to describe them based on the physical principles ofthe sensing modality. We do so by introducing a model thatpredicts how sensor values change when a human affects theambient electric field. By inverting the model, we can derivea person’s position from a set of real sensor readings. Oncethis position is known, the change in body electric potentialcan be reconstructed. We show that this change is specificfor a person, and that it can leverage identification usingan SVM classifier with a feature set extracted from a shortwalking sequence (typ. 5 s).
4. MODELING THE SENSOR RESPONSEWe now derive a forward (or predictive) model that esti-
mates sensor values based on a person’s location and bodyelectric potential. This forward model enables us to un-derstand how human movements are reflected in our sensorsignals. The model also acts as a means to validate ourassumptions on reconstructing body electric potential andlocalization by matching model predictions with experimen-tal data. Let us first consider the dynamic sensor responseto a changing input.
An EPS can be modelled using a resistor and a capacitor,in combination with an ideal voltage follower, as shown inthe right part of Figure 4 [13]. Recall that a voltage followeris an amplifier with a gain of 1, it simply follows the voltageat its input, which is connected to the sensing electrode. Byusing the amplifier, the electrode is decoupled from the sens-ing circuit, enabling it to adapt to changes in the ambientelectric field.
The voltage follower’s output is vS. Its input capacitanceand resistance are explicitly represented by Cin and Rin,respectively. As for the electric field generated by a hu-man body, it is equivalent to a voltage source vB coupledto the sensor through a very small capacitance CC, usu-ally less than 100 fF. In human movement sensing applica-tions, the distance between the person and the sensor is typ-ically in the meter range, which results in a weak coupling(CC Cin) [45].

−
+
vS ( t)
vB ( t) C C R in C in
Human Sensor
Figure 4: Electric potential sensor represented by an equiv-alent circuit (adapted from [13]). vb represents the changingbody electric potential, whereas CC is the coupling capaci-tance which changes with the body-to-sensor distance.
When the person moves relatively to the EPS, CC is not aconstant but depends on the body-to-sensor distance d. Inorder to simplify the notation, d is considered a function oftime d(t) in the following, and the coupling capacitance iswritten CC(t). Analyzing the circuit yields
vS′(t)[CC(t) + Cin] + vS(t)[CC
′(t) + 1/Rin]
=d
dt[CC(t)vB(t)] . (1)
We can solve (1) for the sensor output vS by assuming thatCC(t) Cin and CC
′(t) 1/Rin for all t. These assump-tions are justified in weak coupling situations with a highinput impedance sensor such as the EPIC. Additionally, weintroduce a first-order low-pass filter with impulse responseh1(t) (time constant τ1 = RinCin), and a first-order high-pass filter with impulse response h2(t) (cutoff frequency typ-ically in the mHz range). The first filter simplifies the ex-pression, and the second models the effect of the passivecomponents integrated in the EPS [46]. The output of anEPS is finally
vS(t) = Rinh1(t) ∗ h2(t) ∗(
d
dt[CC(t)vB(t)]
). (2)
With this equation, we are able to predict a sensor outputbased on the two variables of coupling capacitance and bodyvoltage.
4.1 Coupling CapacitancesWe now take a closer look on how coupling capacitances
are related to a person’s distance to a sensor. To derive thecoupling capacitance CC, we start with a point charge ap-proximation [11], in which CC(d) ∝ 1/d2. We generalize thisslightly to CC(d) ∝ 1/dα where a constant α is the distanceexponent, to account for deviations from the point chargeapproximation [53, 21]. In the far field/weak coupling case,there must be a lower limit dmin to the distance correspond-ing to an upper limit CC,max to the coupling capacitance, sothat
CC(d) = CC,max
(dmin
d
)α. (3)
Placing the sensors on a room’s ceiling (or at the top ofwalls) ensures that there is a minimum distance of about0.5 m to 1 m between the ceiling and the top of the person’shead. This point approximates the participant’s position,assuming the human body is perfectly conducting at lowfrequencies [18]. With an electrode of about 1 cm2, the pointcharge approximation is justified, at least on the sensor side.
Knowing that the sensors are on the ceiling, the constantminimum height between the top of the person’s head andthe sensors is defined as
H = ceiling height− person’s height. (4)
We introduce the simplification that the coordinates of aperson may only vary in two dimensions. Let (x(t), y(t), z(t))be the person’s coordinates at time t, and (xS, yS, zS) the co-ordinates of a sensor. The z = 0 plane is the space wherethe top of the person’s head moves. This allows to write theEuclidean distance between the head and the sensor, anddefine the minimum distance dmin = H. The final couplingcapacitance is
CC(t) =CC,maxH
α([x(t)− xS]2 + [y(t)− yS]2 +H2
)α/2 . (5)
4.2 Complete Forward ModelWe described models for the EPIC sensor (2) and the body
to sensor coupling (5). Each element of the measurement sit-uation (Figure 1) is known. Let us synthesize this knowledgein a complete forward model.
For further derivations, it will be useful to separate thefilters’ responses in (2) from the rest of the expression. Thefiltered signal is the derivative of a product, that may beexpressed as a sum thanks to the product rule. The twoelements of this sum are
Ψa(t) = RinCC(t)vB′(t), and (6)
Ψb(t) = RinCC′(t)vB(t) . (7)
With the coupling capacitance (5), the expressions of Ψa(t) (6)and Ψb(t) (7) can be inferred. Let us focus on Ψa, which isrelated to the change in body electric potential, for examplecaused by stepping:
Ψa(t) =RinCC,maxH
αvB′(t)(
[x(t)− xS]2 + [y(t)− yS]2 +H2)α/2 . (8)
The signals that compose the response of an EPIC are fil-tered versions of Ψa and Ψb, which is noted ψa(t) = h1(t) ∗h2(t) ∗Ψa(t) and ψb(t) = h1(t) ∗ h2(t) ∗Ψb(t).
To complete the forward model, an experimental phe-nomenon is considered: the sensor placement within theroom influences the amplitude of the output. For instance,an EPS has a strong coupling to the environment whenplaced close to a wall. If this coupling increases the cir-cuit’s input impedance, the amplitude of the sensor outputis decreased. Let this effect be approximated by a simpledimensionless factor, the calibration constant K. Includingthe partial components ψa, ψb and the calibration constant,the expression
vS(t) = K [ψa(t) + ψb(t)] . (9)
describes the output of an EPIC, depending on the body’sposition and electric potential.
The measurement result is a filtered combination of thebody electric potential, its derivative, the position and thespeed. This is a new formulation of an old observation. AsAronoff et al. [3] already noted in 1965, the variable electricfield generated by a walking human being is a combination oftwo effects: the variable electric potential (due to stepping)of a static body, and the static electric potential of a mov-ing body. This corresponds exactly to the two components
Ψa and Ψb, which will be called respectively the steppingcomponent and the movement component. By extension, ψa
and ψb bear the same designation.
5. APPLYING THE MODELAfter having derived a forward model, which enables us
to predict sensor values based on a person’s location andbody electric potential, we now invert the model. The in-verse model allows us to analyze sensor data and estimate aperson’s location. Based on the localization, we reconstructthe person’s change in body electric potential used for iden-tification. Being aware of the simplifications introduced inour model, we also gain a better understanding of possibleeffects on localization and identification performance.
5.1 LocalizationAs described in the forward model, each raw sensor signal
vS(t) consists of two components. Contrary to the movementcomponent ψb(t), the stepping component ψa(t) is very dis-tinct and enables us to estimate the location of a person.However, the two components of (9) are superposed in theraw sensor signal and can hardly be separated in the timedomain. By band-pass filtering vS(t) around a realistic step-ping frequency of 1 to 2.5 Hz [43], we obtain the estimated
stepping component ψa. Another simplification we intro-duce is that the filtering simply attenuates the fundamentalof the real signal Ψa without distorting it. Thus, the esti-mated stepping component is
ψa(t) ≈ GKΨa(t) = GKRinCC(t)vB′(t) , (10)
with G a constant that represents the combined gain of themeasurement and the processing filter at the stepping fre-quency.
We combine the output of several sensors to localize theperson. A sensor pair with sensors Si and Sj performs twoindependent electric field measurements. The parametersand signals specific to a sensor Si will be noted in the fol-lowing with the index i, e.g. CCi is the coupling capacitancebetween the body and sensor Si. The filtered output of asensor Si is
ψai(t) ≈GKiRinCC,maxH
αvB′(t)
([x(t)− xSi]2 + [y(t)− ySi]2 +H2)α/2, (11)
When detecting a peak in two sensor signals, we can com-pare the ratio between them, corrected with the calibrationfactors (assumed to be known) and take the α-th root. Theratio has the advantage of eliminating CC,max, which is dif-ficult to estimate in general. Assuming that the EPS havethe same characteristics, and that the signals are processedby the same filter, Rin and G are also eliminated. Lastly,vB
′(t) disappears in the ratio, and the obtained function ispurely dependent on the position. The α-th root cancels the1/dα proportionality of the electric field. We call the result-
ing function estimated distance ratio, and note it ∆ij for thesensor pair (Si, Sj):
∆ij(t) = α
√Kjψai(t)
Kiψaj(t)≈ ∆ij(t) . (12)
The actual distance ratio ∆ij is given by
∆ij(t) =
√[x(t)− xSj ]2 + [y(t)− ySj ]2 +H2
[x(t)− xSi]2 + [y(t)− ySi]2 +H2. (13)
The parameters of ∆ij are the sensors’ coordinates, whichare known, the ceiling to head distance H and the distanceexponent α, that can be estimated. There are two unknownsx and y with only one equation, and a single sensor pair isstill not sufficient to find the person’s coordinates.
Similarly to RF-based systems that use propagation mod-els for trilateration [12], at least three estimated distance ra-tios such as (12) are needed to find the person’s coordinateswith no sign ambiguity. In a non-ideal case, the system ofthree or more equations must be optimized to find the coor-dinates that minimize the error, i.e. the person’s estimatedposition.
Our basic installation consists of four sensors organizedin a rectangular sensor cell, which provides four distanceratios. A larger area can be covered by installing more sensorcells. In that case, the first step of localization is to find inwhich cell the sum of signal amplitudes is the strongest.Optimizing the coordinates based on the distance ratios isthen accomplished within this cell only.
5.2 Body Electric Potential ChangeThe information about a person’s location enables us to
inverse another step presented in the forward model (Sec-tion 4.2) in order to derive the change in the body electricpotential. The change in body electric potential is a pow-erful modality, which will later help us to identify a person.Once the person’s position has been estimated, the equationof the stepping component for an individual sensor (11) canbe solved for the derivative of the body electric potential:
vB′(t) ≈ v′B(t) =
ψai(t)di(t)α
KiA, (14)
where di(t) is the Euclidean distance between the personand sensor Si, and
A = GRinCC,maxHα . (15)
The individual estimates v′B(t) (14) are combined by tak-ing the weighted average over all sensors. In the followingevaluation, we compare combining the predictions based ondistance and equal weights.
If a reference measurement of the body electric potentialis available, the error between the estimated and the realvB
′ can be used as a cost to find an optimized value forA. Without a measurement, A is set arbitrarily and scaleslinearly to the real body electric potential.
5.3 IdentificationDuring our experiments, it became obvious that body
electric potential changes are very distinct for different peo-ple when taking a step. Reasons can be seen in a num-ber of properties related to a human being, in particulargait cadence, but also footwear, synthetic materials worn,or body height. These properties contribute to a character-istic charging and coupling behaviour.
In the following we use the term step signature for a win-dow of reconstructed body electric potential change arounda step. We experimentally determined a window size of0.72 ms as suitable to not interfere with the following step.
dVb
Steps Signatures
Min/Max Histogram
Mean Step Length
Mean Step Duration
Histogram Power Spectral Density
All Means All Standard Deviations
Fast Fourier Transform
0 50 100 150
−0.5
0
0.5
Nor
m. b
ody
pote
ntia
l cha
nge
Time (samples), Fs = 50 Hz
Concatenated step signatures
0 50 100 150 200 250−400
−200
0
200
Time (samples), Fs = 50 Hz
Body
pot
entia
l cha
nge
(V) Estimation of body voltage change
0 5 10 15 20 25 30 35 40
−1
−0.5
0
0.5
Nor
m. b
ody
volta
ge c
hang
e
Time / samples (Fs = 50 Hz)
Combined step signature
Mean SpeedGait
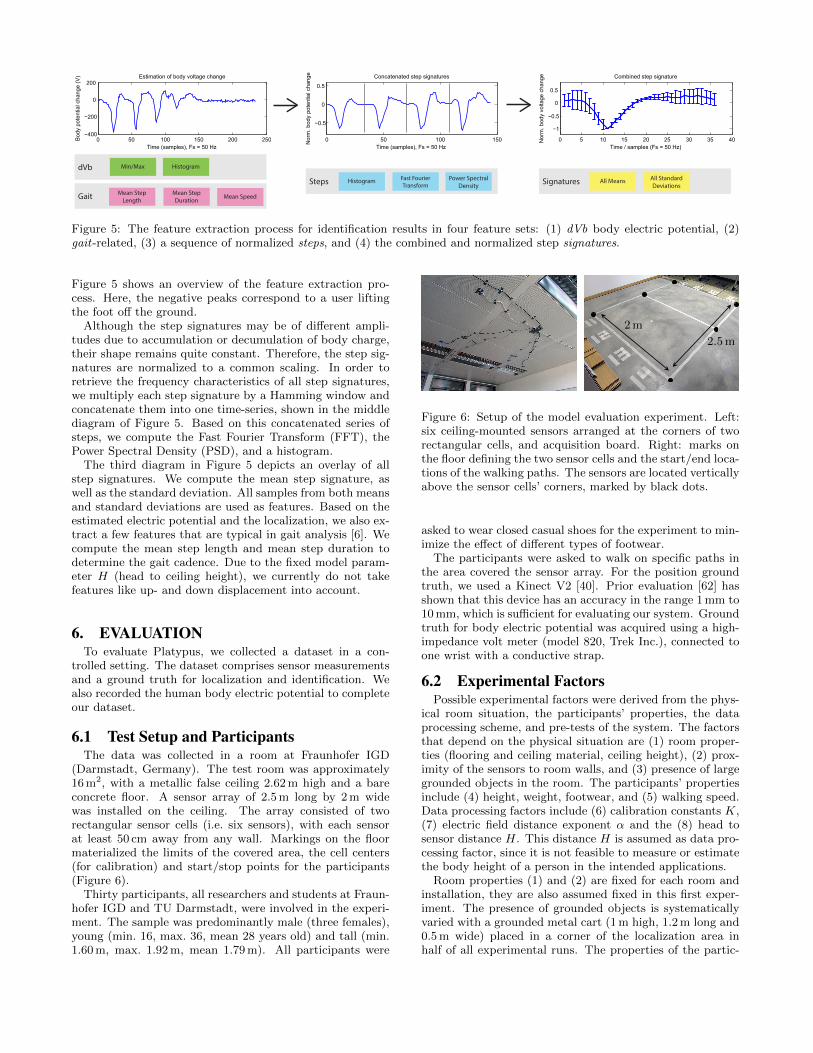
Figure 5: The feature extraction process for identification results in four feature sets: (1) dVb body electric potential, (2)gait-related, (3) a sequence of normalized steps, and (4) the combined and normalized step signatures.
Figure 5 shows an overview of the feature extraction pro-cess. Here, the negative peaks correspond to a user liftingthe foot off the ground.
Although the step signatures may be of different ampli-tudes due to accumulation or decumulation of body charge,their shape remains quite constant. Therefore, the step sig-natures are normalized to a common scaling. In order toretrieve the frequency characteristics of all step signatures,we multiply each step signature by a Hamming window andconcatenate them into one time-series, shown in the middlediagram of Figure 5. Based on this concatenated series ofsteps, we compute the Fast Fourier Transform (FFT), thePower Spectral Density (PSD), and a histogram.
The third diagram in Figure 5 depicts an overlay of allstep signatures. We compute the mean step signature, aswell as the standard deviation. All samples from both meansand standard deviations are used as features. Based on theestimated electric potential and the localization, we also ex-tract a few features that are typical in gait analysis [6]. Wecompute the mean step length and mean step duration todetermine the gait cadence. Due to the fixed model param-eter H (head to ceiling height), we currently do not takefeatures like up- and down displacement into account.
6. EVALUATIONTo evaluate Platypus, we collected a dataset in a con-
trolled setting. The dataset comprises sensor measurementsand a ground truth for localization and identification. Wealso recorded the human body electric potential to completeour dataset.
6.1 Test Setup and ParticipantsThe data was collected in a room at Fraunhofer IGD
(Darmstadt, Germany). The test room was approximately16 m2, with a metallic false ceiling 2.62 m high and a bareconcrete floor. A sensor array of 2.5 m long by 2 m widewas installed on the ceiling. The array consisted of tworectangular sensor cells (i.e. six sensors), with each sensorat least 50 cm away from any wall. Markings on the floormaterialized the limits of the covered area, the cell centers(for calibration) and start/stop points for the participants(Figure 6).
Thirty participants, all researchers and students at Fraun-hofer IGD and TU Darmstadt, were involved in the experi-ment. The sample was predominantly male (three females),young (min. 16, max. 36, mean 28 years old) and tall (min.1.60 m, max. 1.92 m, mean 1.79 m). All participants were
2 m
2.5 m
Figure 6: Setup of the model evaluation experiment. Left:six ceiling-mounted sensors arranged at the corners of tworectangular cells, and acquisition board. Right: marks onthe floor defining the two sensor cells and the start/end loca-tions of the walking paths. The sensors are located verticallyabove the sensor cells’ corners, marked by black dots.
asked to wear closed casual shoes for the experiment to min-imize the effect of different types of footwear.
The participants were asked to walk on specific paths inthe area covered the sensor array. For the position groundtruth, we used a Kinect V2 [40]. Prior evaluation [62] hasshown that this device has an accuracy in the range 1 mm to10 mm, which is sufficient for evaluating our system. Groundtruth for body electric potential was acquired using a high-impedance volt meter (model 820, Trek Inc.), connected toone wrist with a conductive strap.
6.2 Experimental FactorsPossible experimental factors were derived from the phys-
ical room situation, the participants’ properties, the dataprocessing scheme, and pre-tests of the system. The factorsthat depend on the physical situation are (1) room proper-ties (flooring and ceiling material, ceiling height), (2) prox-imity of the sensors to room walls, and (3) presence of largegrounded objects in the room. The participants’ propertiesinclude (4) height, weight, footwear, and (5) walking speed.Data processing factors include (6) calibration constants K,(7) electric field distance exponent α and the (8) head tosensor distance H. This distance H is assumed as data pro-cessing factor, since it is not feasible to measure or estimatethe body height of a person in the intended applications.
Room properties (1) and (2) are fixed for each room andinstallation, they are also assumed fixed in this first exper-iment. The presence of grounded objects is systematicallyvaried with a grounded metal cart (1 m high, 1.2 m long and0.5 m wide) placed in a corner of the localization area inhalf of all experimental runs. The properties of the partic-
ipants (4) are generally random and are not systematicallyvaried in the experiment. Walking speed (5) is included asa nominal factor, asking participants to walk normally orslowly.
Two data processing factors were varied in the experi-ment, namely K and α. The calibration constants K usedfor estimating the distance ratio in (12) were either from anindividual calibration for each test person or taken from astandard calibration performed by the second author. Pre-tests showed that α ≈ 2.5 could be a better choice thanthe theoretical α = 2 as a value for the electric field dis-tance exponent. This factor was evaluated on three levels.Head-to-ceiling-distance H showed no effect in the pre-tests.Therefore, H was calculated with the ceiling height using anaverage statue of 1.72 m [55].
This led to a 2 × 2 × 2 × 3 full factorial design with thefactors walking speed, presence of grounded object, type ofcalibration (individual or standard) and the value of α. Only(speed × object) treatments needed an actual experiment,since all data processing factors could be varied in the cal-culations afterwards. Four repetitions per test person (i.e.16 trajectories) were conducted.
For each participant, a series of eight trajectories with ran-dom start and stop points (see Fig. 6) and random speedswas drawn. The speeds were picked without replacementfrom a set of four “normal” and four “slow”, to get a ran-dom order of speeds but always four normal walks and fourslow ones. A similar series of eight start/stop/speed sets waspicked for the tests with the grounded object present (elim-inating the stop point 21, which was blocked by the object).Additionally, a calibration routine (100 steps in each cell)was performed by participants, to look at the effect of usingindividual calibration constants K rather than a system-wide calibration. The experiment lasted about 20 min perperson and the results were analysed with SPSS version 22.
6.3 Localization ResultsThe localization error is calculated for detection i in the
recording according to
εi =√
(xK[ki]− xP[ki])2 + (yK[ki]− yP[ki])2 , (16)
where ki are the discrete samples when signal peaks weredetected, and the subscripts K and P indicate the true coor-dinates measured by the Kinect and the estimates given bythe Platypus, respectively. The errors from all trajectoriesof a test person with the same treatment are pooled and themedian is used as localization error measure for this treat-ment. This leads to 24 localization errors for each person,corresponding to the 24 treatments and 720 results in total.
We used linear regression to test the assumptions of negli-gible effects of test person height and weight as well as shoesize. Analysis shows a lack of significance for all partici-pants’ properties (height: R2 = 0.007, p = 0.657; weight:R2 = 0.015, p = 0.525; shoe size: R2 = 0.001, p = 0.902).We therefore conclude that Platypus’s localization errors arenot sensitive to these factors.
Further analysis is based on a repeated-measures analy-sis of variance (ANOVA). From the total variation of thisdata set, 19.81 % can be attributed to the variations be-tween participants. These variations cannot be describedany further, but can be explained by individual propertiesof the participants not accounted for (e.g. clothing). Themodel above can explain 32.42 % of the variation, whereas
2 2.5 3
0.15
0.2
α
localization
error(m
) Presence of Object
2 2.5 3
0.15
0.2
α
Walking Speed
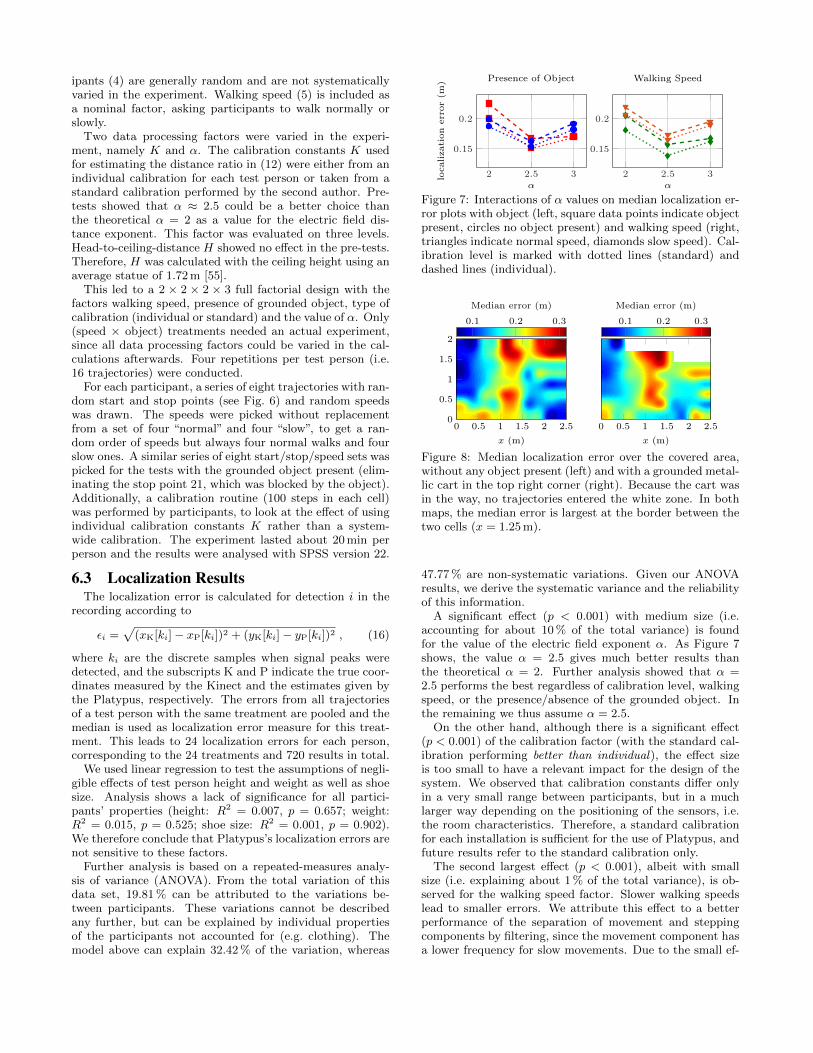
Figure 7: Interactions of α values on median localization er-ror plots with object (left, square data points indicate objectpresent, circles no object present) and walking speed (right,triangles indicate normal speed, diamonds slow speed). Cal-ibration level is marked with dotted lines (standard) anddashed lines (individual).
0 0.5 1 1.5 2 2.5
x (m)
0.1 0.2 0.3
Median error (m)
0 0.5 1 1.5 2 2.5
2
1.5
1
0.5
0
x (m)
0.1 0.2 0.3
Median error (m)
Figure 8: Median localization error over the covered area,without any object present (left) and with a grounded metal-lic cart in the top right corner (right). Because the cart wasin the way, no trajectories entered the white zone. In bothmaps, the median error is largest at the border between thetwo cells (x = 1.25 m).
47.77 % are non-systematic variations. Given our ANOVAresults, we derive the systematic variance and the reliabilityof this information.
A significant effect (p < 0.001) with medium size (i.e.accounting for about 10 % of the total variance) is foundfor the value of the electric field exponent α. As Figure 7shows, the value α = 2.5 gives much better results thanthe theoretical α = 2. Further analysis showed that α =2.5 performs the best regardless of calibration level, walkingspeed, or the presence/absence of the grounded object. Inthe remaining we thus assume α = 2.5.
On the other hand, although there is a significant effect(p < 0.001) of the calibration factor (with the standard cal-ibration performing better than individual), the effect sizeis too small to have a relevant impact for the design of thesystem. We observed that calibration constants differ onlyin a very small range between participants, but in a muchlarger way depending on the positioning of the sensors, i.e.the room characteristics. Therefore, a standard calibrationfor each installation is sufficient for the use of Platypus, andfuture results refer to the standard calibration only.
The second largest effect (p < 0.001), albeit with smallsize (i.e. explaining about 1 % of the total variance), is ob-served for the walking speed factor. Slower walking speedslead to smaller errors. We attribute this effect to a betterperformance of the separation of movement and steppingcomponents by filtering, since the movement component hasa lower frequency for slow movements. Due to the small ef-
0 0.1 0.2 0.3 0.4 0.5 0.6 0.70
0.20.40.60.8
1
Localization error (m)
Cum
ulat
ive
prob
.
Normal walkingSlow walking
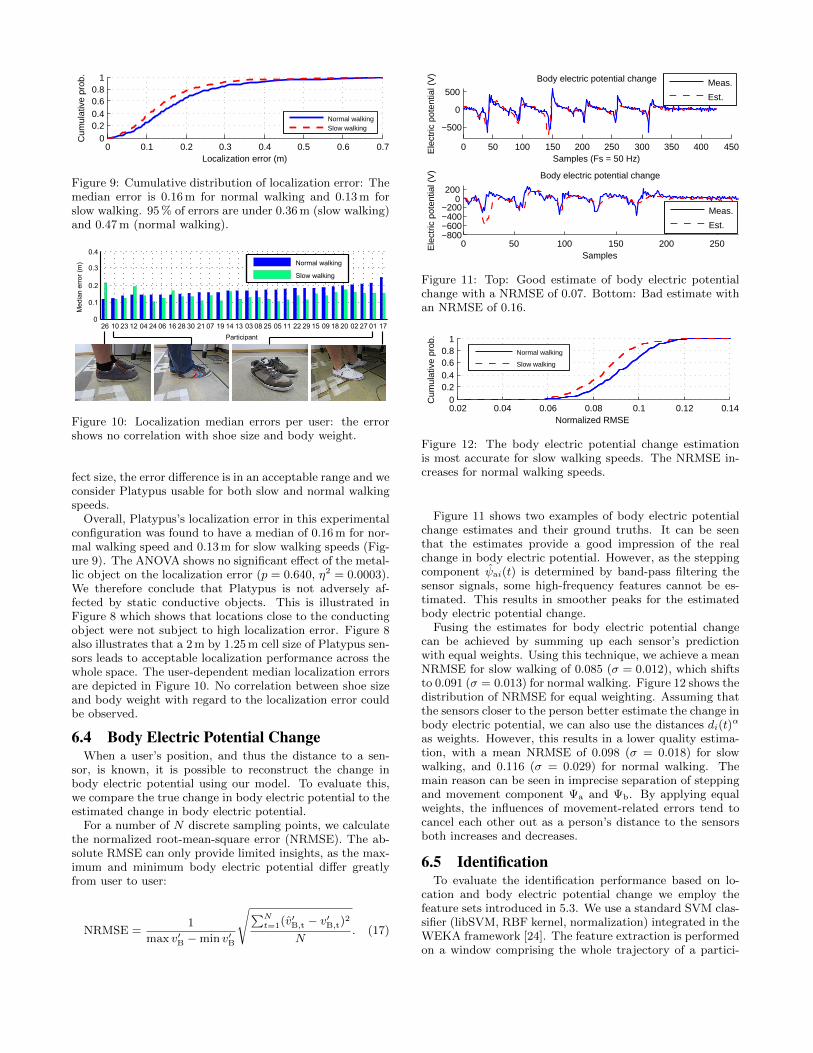
Figure 9: Cumulative distribution of localization error: Themedian error is 0.16 m for normal walking and 0.13 m forslow walking. 95 % of errors are under 0.36 m (slow walking)and 0.47 m (normal walking).
26 10 23 12 04 24 06 16 28 30 21 07 19 14 13 03 08 25 05 11 22 29 15 09 18 20 02 27 01 170
0.1
0.2
0.3
0.4
Participant
Med
ian
erro
r (m
) Normal walking
Slow walking
Figure 10: Localization median errors per user: the errorshows no correlation with shoe size and body weight.
fect size, the error difference is in an acceptable range and weconsider Platypus usable for both slow and normal walkingspeeds.
Overall, Platypus’s localization error in this experimentalconfiguration was found to have a median of 0.16 m for nor-mal walking speed and 0.13 m for slow walking speeds (Fig-ure 9). The ANOVA shows no significant effect of the metal-lic object on the localization error (p = 0.640, η2 = 0.0003).We therefore conclude that Platypus is not adversely af-fected by static conductive objects. This is illustrated inFigure 8 which shows that locations close to the conductingobject were not subject to high localization error. Figure 8also illustrates that a 2 m by 1.25 m cell size of Platypus sen-sors leads to acceptable localization performance across thewhole space. The user-dependent median localization errorsare depicted in Figure 10. No correlation between shoe sizeand body weight with regard to the localization error couldbe observed.
6.4 Body Electric Potential ChangeWhen a user’s position, and thus the distance to a sen-
sor, is known, it is possible to reconstruct the change inbody electric potential using our model. To evaluate this,we compare the true change in body electric potential to theestimated change in body electric potential.
For a number of N discrete sampling points, we calculatethe normalized root-mean-square error (NRMSE). The ab-solute RMSE can only provide limited insights, as the max-imum and minimum body electric potential differ greatlyfrom user to user:
NRMSE =1
max v′B −min v′B
√∑Nt=1(v′B,t − v′B,t)
2
N. (17)
0 50 100 150 200 250 300 350 400 450
−500
0
500
Samples (Fs = 50 Hz)
Ele
ctric
pot
entia
l (V
) Body electric potential change
Meas.
Est.
0 50 100 150 200 250−800−600−400−200
0200
Samples
Ele
ctric
pot
entia
l (V
) Body electric potential change
Meas.
Est.
Figure 11: Top: Good estimate of body electric potentialchange with a NRMSE of 0.07. Bottom: Bad estimate withan NRMSE of 0.16.
0.02 0.04 0.06 0.08 0.1 0.12 0.140
0.20.40.60.8
1
Normalized RMSEC
umul
ativ
e pr
ob.
Normal walking
Slow walking
Figure 12: The body electric potential change estimationis most accurate for slow walking speeds. The NRMSE in-creases for normal walking speeds.
Figure 11 shows two examples of body electric potentialchange estimates and their ground truths. It can be seenthat the estimates provide a good impression of the realchange in body electric potential. However, as the steppingcomponent ψai(t) is determined by band-pass filtering thesensor signals, some high-frequency features cannot be es-timated. This results in smoother peaks for the estimatedbody electric potential change.
Fusing the estimates for body electric potential changecan be achieved by summing up each sensor’s predictionwith equal weights. Using this technique, we achieve a meanNRMSE for slow walking of 0.085 (σ = 0.012), which shiftsto 0.091 (σ = 0.013) for normal walking. Figure 12 shows thedistribution of NRMSE for equal weighting. Assuming thatthe sensors closer to the person better estimate the change inbody electric potential, we can also use the distances di(t)
α
as weights. However, this results in a lower quality estima-tion, with a mean NRMSE of 0.098 (σ = 0.018) for slowwalking, and 0.116 (σ = 0.029) for normal walking. Themain reason can be seen in imprecise separation of steppingand movement component Ψa and Ψb. By applying equalweights, the influences of movement-related errors tend tocancel each other out as a person’s distance to the sensorsboth increases and decreases.
6.5 IdentificationTo evaluate the identification performance based on lo-
cation and body electric potential change we employ thefeature sets introduced in 5.3. We use a standard SVM clas-sifier (libSVM, RBF kernel, normalization) integrated in theWEKA framework [24]. The feature extraction is performedon a window comprising the whole trajectory of a partici-
0 0.25 0.5−1
0
1Participant 1
Nor
m. V
b’
0 0.25 0.5
Participant 2
0 0.25 0.5
Participant 3
0 0.25 0.5
Participant 4
0 0.25 0.5
Participant 5
0 0.25 0.5
Participant 6
0 0.25 0.5
Participant 7
0 0.25 0.5
Participant 8
0 0.25 0.5
Participant 9
0 0.25 0.5
Participant 10
0 0.25 0.5−1
0
1Participant 11
Nor
m. V
b’
0 0.25 0.5
Participant 12
0 0.25 0.5
Participant 13
0 0.25 0.5
Participant 14
0 0.25 0.5
Participant 15
0 0.25 0.5
Participant 16
0 0.25 0.5
Participant 17
0 0.25 0.5
Participant 18
0 0.25 0.5
Participant 19
0 0.25 0.5
Participant 20
0 0.25 0.5−1
0
1Participant 21
Nor
m. V
b’
Time (s)
0 0.25 0.5
Participant 22
Time (s)
0 0.25 0.5
Participant 23
Time (s)
0 0.25 0.5
Participant 24
Time (s)
0 0.25 0.5
Participant 25
Time (s)
0 0.25 0.5
Participant 26
Time (s)
0 0.25 0.5
Participant 27
Time (s)
0 0.25 0.5
Participant 28
Time (s)
0 0.25 0.5
Participant 29
Time (s)
0 0.25 0.5
Participant 30
Time (s)
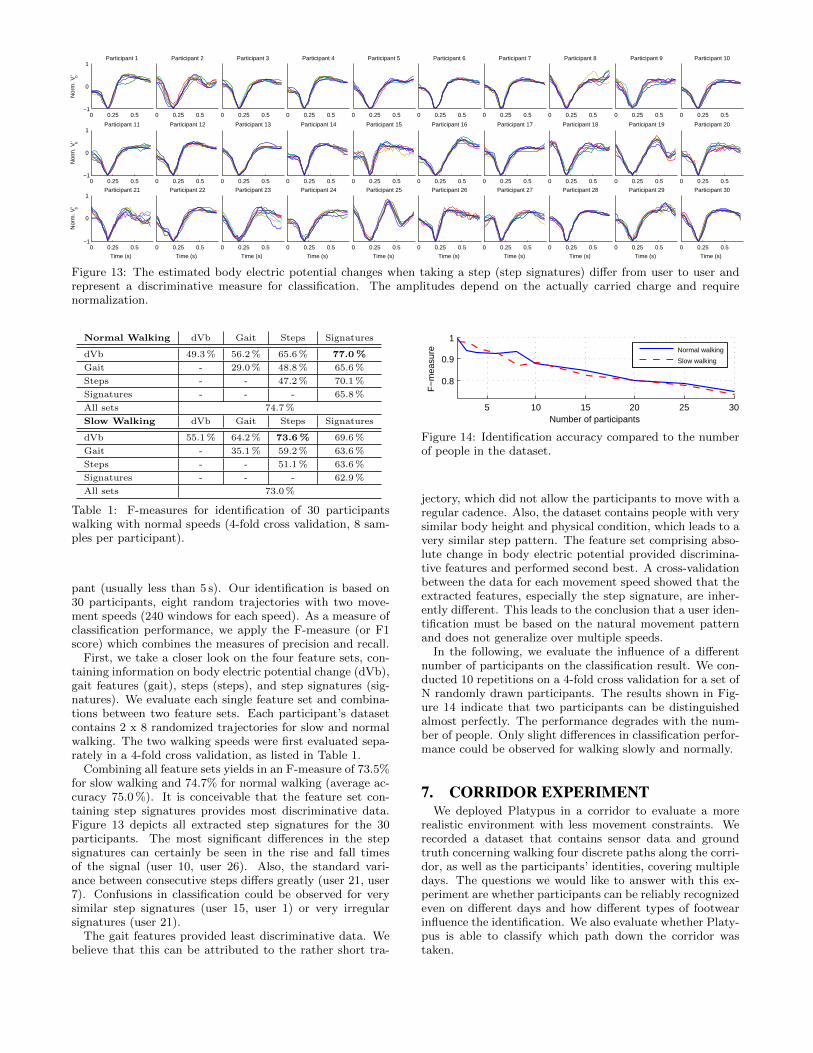
Figure 13: The estimated body electric potential changes when taking a step (step signatures) differ from user to user andrepresent a discriminative measure for classification. The amplitudes depend on the actually carried charge and requirenormalization.
Normal Walking dVb Gait Steps Signatures
dVb 49.3% 56.2% 65.6% 77.0%
Gait - 29.0% 48.8% 65.6%
Steps - - 47.2% 70.1%
Signatures - - - 65.8%
All sets 74.7%
Slow Walking dVb Gait Steps Signatures
dVb 55.1% 64.2% 73.6% 69.6%
Gait - 35.1% 59.2% 63.6%
Steps - - 51.1% 63.6%
Signatures - - - 62.9%
All sets 73.0%
Table 1: F-measures for identification of 30 participantswalking with normal speeds (4-fold cross validation, 8 sam-ples per participant).
pant (usually less than 5 s). Our identification is based on30 participants, eight random trajectories with two move-ment speeds (240 windows for each speed). As a measure ofclassification performance, we apply the F-measure (or F1score) which combines the measures of precision and recall.
First, we take a closer look on the four feature sets, con-taining information on body electric potential change (dVb),gait features (gait), steps (steps), and step signatures (sig-natures). We evaluate each single feature set and combina-tions between two feature sets. Each participant’s datasetcontains 2 x 8 randomized trajectories for slow and normalwalking. The two walking speeds were first evaluated sepa-rately in a 4-fold cross validation, as listed in Table 1.
Combining all feature sets yields in an F-measure of 73.5%for slow walking and 74.7% for normal walking (average ac-curacy 75.0 %). It is conceivable that the feature set con-taining step signatures provides most discriminative data.Figure 13 depicts all extracted step signatures for the 30participants. The most significant differences in the stepsignatures can certainly be seen in the rise and fall timesof the signal (user 10, user 26). Also, the standard vari-ance between consecutive steps differs greatly (user 21, user7). Confusions in classification could be observed for verysimilar step signatures (user 15, user 1) or very irregularsignatures (user 21).
The gait features provided least discriminative data. Webelieve that this can be attributed to the rather short tra-
5 10 15 20 25 30
0.8
0.9
1
Number of participantsF
−m
easu
re
Normal walking
Slow walking
Figure 14: Identification accuracy compared to the numberof people in the dataset.
jectory, which did not allow the participants to move with aregular cadence. Also, the dataset contains people with verysimilar body height and physical condition, which leads to avery similar step pattern. The feature set comprising abso-lute change in body electric potential provided discrimina-tive features and performed second best. A cross-validationbetween the data for each movement speed showed that theextracted features, especially the step signature, are inher-ently different. This leads to the conclusion that a user iden-tification must be based on the natural movement patternand does not generalize over multiple speeds.
In the following, we evaluate the influence of a differentnumber of participants on the classification result. We con-ducted 10 repetitions on a 4-fold cross validation for a set ofN randomly drawn participants. The results shown in Fig-ure 14 indicate that two participants can be distinguishedalmost perfectly. The performance degrades with the num-ber of people. Only slight differences in classification perfor-mance could be observed for walking slowly and normally.
7. CORRIDOR EXPERIMENTWe deployed Platypus in a corridor to evaluate a more
realistic environment with less movement constraints. Werecorded a dataset that contains sensor data and groundtruth concerning walking four discrete paths along the corri-dor, as well as the participants’ identities, covering multipledays. The questions we would like to answer with this ex-periment are whether participants can be reliably recognizedeven on different days and how different types of footwearinfluence the identification. We also evaluate whether Platy-pus is able to classify which path down the corridor wastaken.
1L 1R
2R
S
1.25 m
2.4 m
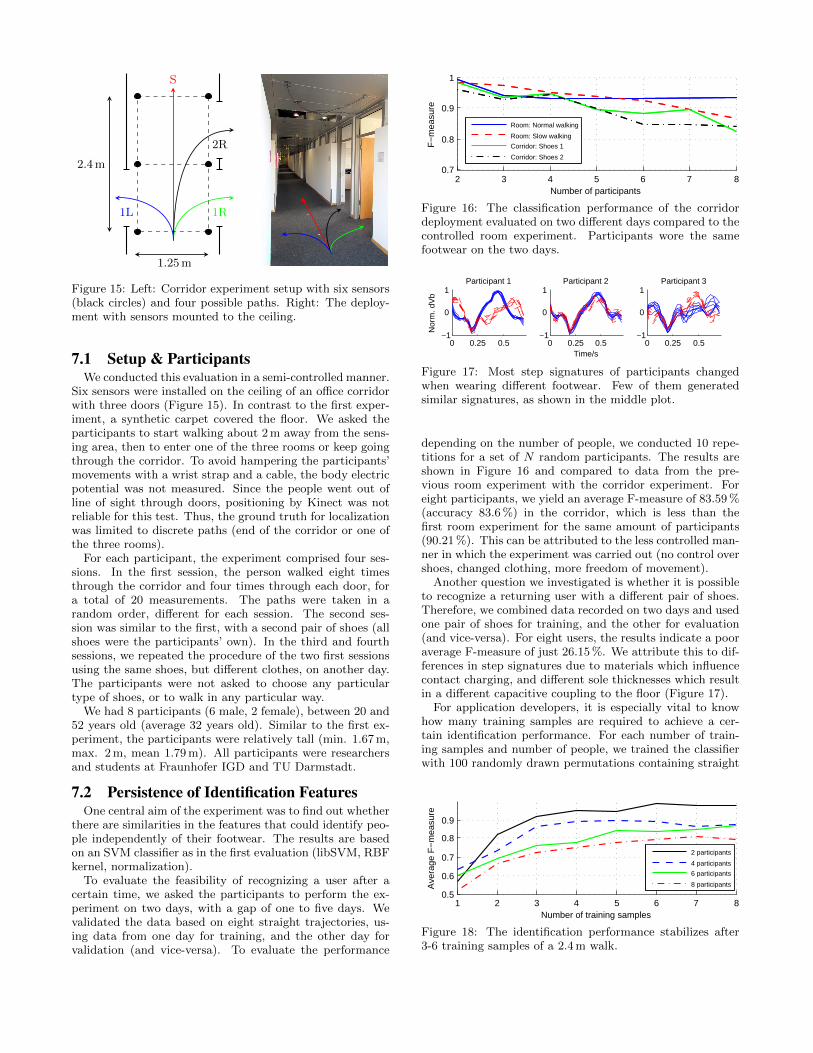
Figure 15: Left: Corridor experiment setup with six sensors(black circles) and four possible paths. Right: The deploy-ment with sensors mounted to the ceiling.
7.1 Setup & ParticipantsWe conducted this evaluation in a semi-controlled manner.
Six sensors were installed on the ceiling of an office corridorwith three doors (Figure 15). In contrast to the first exper-iment, a synthetic carpet covered the floor. We asked theparticipants to start walking about 2 m away from the sens-ing area, then to enter one of the three rooms or keep goingthrough the corridor. To avoid hampering the participants’movements with a wrist strap and a cable, the body electricpotential was not measured. Since the people went out ofline of sight through doors, positioning by Kinect was notreliable for this test. Thus, the ground truth for localizationwas limited to discrete paths (end of the corridor or one ofthe three rooms).
For each participant, the experiment comprised four ses-sions. In the first session, the person walked eight timesthrough the corridor and four times through each door, fora total of 20 measurements. The paths were taken in arandom order, different for each session. The second ses-sion was similar to the first, with a second pair of shoes (allshoes were the participants’ own). In the third and fourthsessions, we repeated the procedure of the two first sessionsusing the same shoes, but different clothes, on another day.The participants were not asked to choose any particulartype of shoes, or to walk in any particular way.
We had 8 participants (6 male, 2 female), between 20 and52 years old (average 32 years old). Similar to the first ex-periment, the participants were relatively tall (min. 1.67 m,max. 2 m, mean 1.79 m). All participants were researchersand students at Fraunhofer IGD and TU Darmstadt.
7.2 Persistence of Identification FeaturesOne central aim of the experiment was to find out whether
there are similarities in the features that could identify peo-ple independently of their footwear. The results are basedon an SVM classifier as in the first evaluation (libSVM, RBFkernel, normalization).
To evaluate the feasibility of recognizing a user after acertain time, we asked the participants to perform the ex-periment on two days, with a gap of one to five days. Wevalidated the data based on eight straight trajectories, us-ing data from one day for training, and the other day forvalidation (and vice-versa). To evaluate the performance
2 3 4 5 6 7 80.7
0.8
0.9
1
Number of participants
F−
mea
sure
Room: Normal walking
Room: Slow walking
Corridor: Shoes 1
Corridor: Shoes 2
Figure 16: The classification performance of the corridordeployment evaluated on two different days compared to thecontrolled room experiment. Participants wore the samefootwear on the two days.
0 0.25 0.5−1
0
1Participant 1
Nor
m. d
Vb
0 0.25 0.5−1
0
1Participant 2
Time/s0 0.25 0.5
−1
0
1Participant 3
Figure 17: Most step signatures of participants changedwhen wearing different footwear. Few of them generatedsimilar signatures, as shown in the middle plot.
depending on the number of people, we conducted 10 repe-titions for a set of N random participants. The results areshown in Figure 16 and compared to data from the pre-vious room experiment with the corridor experiment. Foreight participants, we yield an average F-measure of 83.59 %(accuracy 83.6 %) in the corridor, which is less than thefirst room experiment for the same amount of participants(90.21 %). This can be attributed to the less controlled man-ner in which the experiment was carried out (no control overshoes, changed clothing, more freedom of movement).
Another question we investigated is whether it is possibleto recognize a returning user with a different pair of shoes.Therefore, we combined data recorded on two days and usedone pair of shoes for training, and the other for evaluation(and vice-versa). For eight users, the results indicate a pooraverage F-measure of just 26.15 %. We attribute this to dif-ferences in step signatures due to materials which influencecontact charging, and different sole thicknesses which resultin a different capacitive coupling to the floor (Figure 17).
For application developers, it is especially vital to knowhow many training samples are required to achieve a cer-tain identification performance. For each number of train-ing samples and number of people, we trained the classifierwith 100 randomly drawn permutations containing straight
1 2 3 4 5 6 7 80.5
0.6
0.7
0.8
0.9
Number of training samples
Ave
rage
F−
mea
sure
2 participants
4 participants
6 participants
8 participants
Figure 18: The identification performance stabilizes after3-6 training samples of a 2.4 m walk.
Recognized as
S 1L 1R 2R
S 244 3 9 0
1L 0 127 0 1
1R 0 4 119 5
2R 0 3 3 122 1 2 3 4 5 6 7 80
0.5
1
Participant
F-m
easu
re
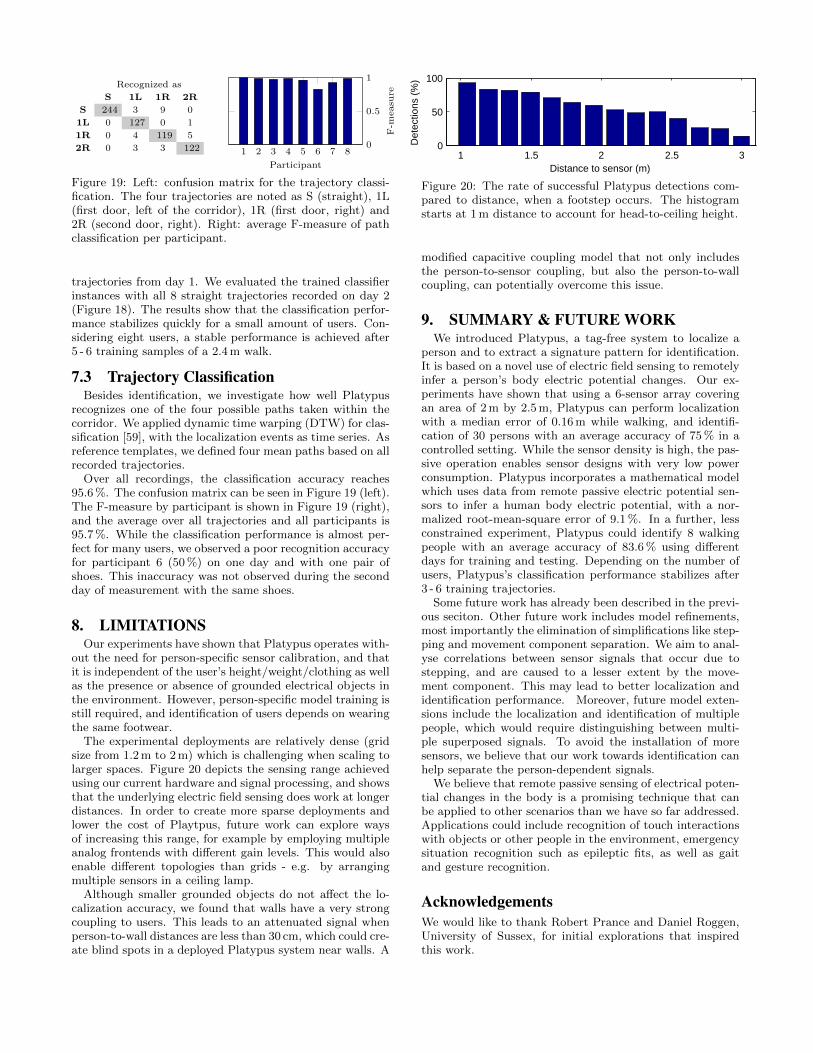
Figure 19: Left: confusion matrix for the trajectory classi-fication. The four trajectories are noted as S (straight), 1L(first door, left of the corridor), 1R (first door, right) and2R (second door, right). Right: average F-measure of pathclassification per participant.
trajectories from day 1. We evaluated the trained classifierinstances with all 8 straight trajectories recorded on day 2(Figure 18). The results show that the classification perfor-mance stabilizes quickly for a small amount of users. Con-sidering eight users, a stable performance is achieved after5 - 6 training samples of a 2.4 m walk.
7.3 Trajectory ClassificationBesides identification, we investigate how well Platypus
recognizes one of the four possible paths taken within thecorridor. We applied dynamic time warping (DTW) for clas-sification [59], with the localization events as time series. Asreference templates, we defined four mean paths based on allrecorded trajectories.
Over all recordings, the classification accuracy reaches95.6 %. The confusion matrix can be seen in Figure 19 (left).The F-measure by participant is shown in Figure 19 (right),and the average over all trajectories and all participants is95.7 %. While the classification performance is almost per-fect for many users, we observed a poor recognition accuracyfor participant 6 (50 %) on one day and with one pair ofshoes. This inaccuracy was not observed during the secondday of measurement with the same shoes.
8. LIMITATIONSOur experiments have shown that Platypus operates with-
out the need for person-specific sensor calibration, and thatit is independent of the user’s height/weight/clothing as wellas the presence or absence of grounded electrical objects inthe environment. However, person-specific model training isstill required, and identification of users depends on wearingthe same footwear.
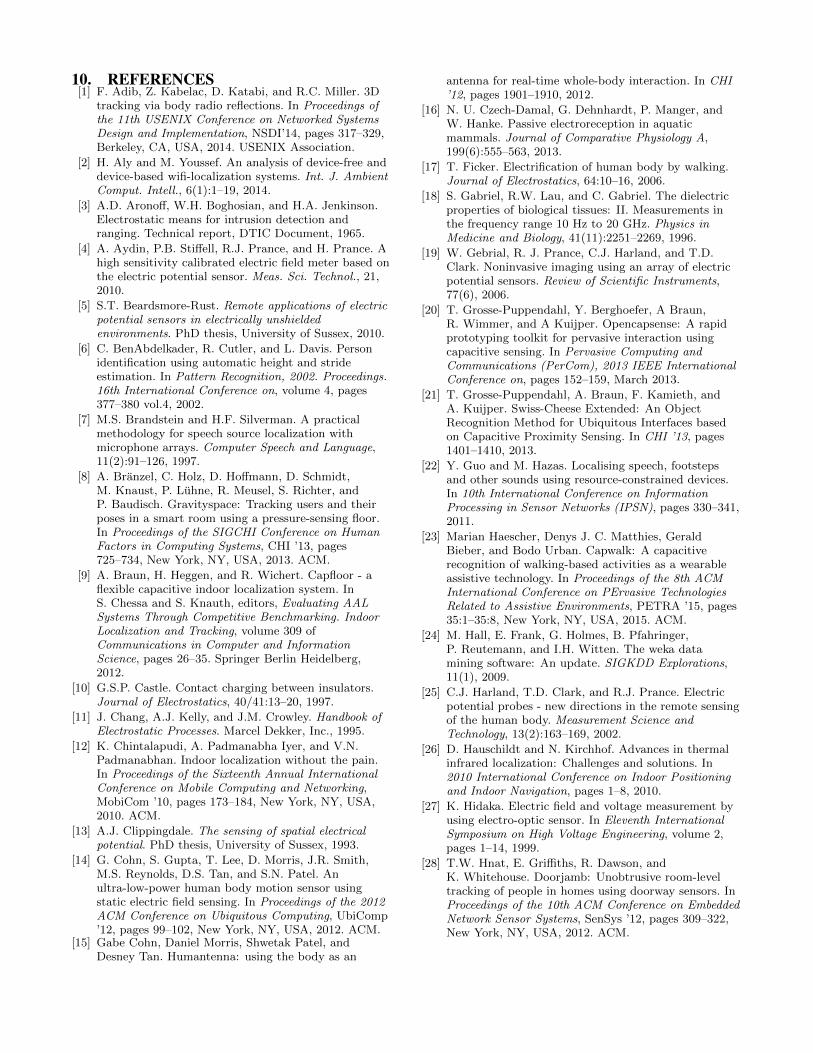
The experimental deployments are relatively dense (gridsize from 1.2 m to 2 m) which is challenging when scaling tolarger spaces. Figure 20 depicts the sensing range achievedusing our current hardware and signal processing, and showsthat the underlying electric field sensing does work at longerdistances. In order to create more sparse deployments andlower the cost of Playtpus, future work can explore waysof increasing this range, for example by employing multipleanalog frontends with different gain levels. This would alsoenable different topologies than grids - e.g. by arrangingmultiple sensors in a ceiling lamp.
Although smaller grounded objects do not affect the lo-calization accuracy, we found that walls have a very strongcoupling to users. This leads to an attenuated signal whenperson-to-wall distances are less than 30 cm, which could cre-ate blind spots in a deployed Platypus system near walls. A
1 1.5 2 2.5 30
50
100
Distance to sensor (m)
Det
ectio
ns (
%)
Figure 20: The rate of successful Platypus detections com-pared to distance, when a footstep occurs. The histogramstarts at 1 m distance to account for head-to-ceiling height.
modified capacitive coupling model that not only includesthe person-to-sensor coupling, but also the person-to-wallcoupling, can potentially overcome this issue.
9. SUMMARY & FUTURE WORKWe introduced Platypus, a tag-free system to localize a
person and to extract a signature pattern for identification.It is based on a novel use of electric field sensing to remotelyinfer a person’s body electric potential changes. Our ex-periments have shown that using a 6-sensor array coveringan area of 2 m by 2.5 m, Platypus can perform localizationwith a median error of 0.16 m while walking, and identifi-cation of 30 persons with an average accuracy of 75 % in acontrolled setting. While the sensor density is high, the pas-sive operation enables sensor designs with very low powerconsumption. Platypus incorporates a mathematical modelwhich uses data from remote passive electric potential sen-sors to infer a human body electric potential, with a nor-malized root-mean-square error of 9.1 %. In a further, lessconstrained experiment, Platypus could identify 8 walkingpeople with an average accuracy of 83.6 % using differentdays for training and testing. Depending on the number ofusers, Platypus’s classification performance stabilizes after3 - 6 training trajectories.
Some future work has already been described in the previ-ous seciton. Other future work includes model refinements,most importantly the elimination of simplifications like step-ping and movement component separation. We aim to anal-yse correlations between sensor signals that occur due tostepping, and are caused to a lesser extent by the move-ment component. This may lead to better localization andidentification performance. Moreover, future model exten-sions include the localization and identification of multiplepeople, which would require distinguishing between multi-ple superposed signals. To avoid the installation of moresensors, we believe that our work towards identification canhelp separate the person-dependent signals.
We believe that remote passive sensing of electrical poten-tial changes in the body is a promising technique that canbe applied to other scenarios than we have so far addressed.Applications could include recognition of touch interactionswith objects or other people in the environment, emergencysituation recognition such as epileptic fits, as well as gaitand gesture recognition.
AcknowledgementsWe would like to thank Robert Prance and Daniel Roggen,University of Sussex, for initial explorations that inspiredthis work.
10. REFERENCES[1] F. Adib, Z. Kabelac, D. Katabi, and R.C. Miller. 3D
tracking via body radio reflections. In Proceedings ofthe 11th USENIX Conference on Networked SystemsDesign and Implementation, NSDI’14, pages 317–329,Berkeley, CA, USA, 2014. USENIX Association.
[2] H. Aly and M. Youssef. An analysis of device-free anddevice-based wifi-localization systems. Int. J. AmbientComput. Intell., 6(1):1–19, 2014.
[3] A.D. Aronoff, W.H. Boghosian, and H.A. Jenkinson.Electrostatic means for intrusion detection andranging. Technical report, DTIC Document, 1965.
[4] A. Aydin, P.B. Stiffell, R.J. Prance, and H. Prance. Ahigh sensitivity calibrated electric field meter based onthe electric potential sensor. Meas. Sci. Technol., 21,2010.
[5] S.T. Beardsmore-Rust. Remote applications of electricpotential sensors in electrically unshieldedenvironments. PhD thesis, University of Sussex, 2010.
[6] C. BenAbdelkader, R. Cutler, and L. Davis. Personidentification using automatic height and strideestimation. In Pattern Recognition, 2002. Proceedings.16th International Conference on, volume 4, pages377–380 vol.4, 2002.
[7] M.S. Brandstein and H.F. Silverman. A practicalmethodology for speech source localization withmicrophone arrays. Computer Speech and Language,11(2):91–126, 1997.
[8] A. Branzel, C. Holz, D. Hoffmann, D. Schmidt,M. Knaust, P. Luhne, R. Meusel, S. Richter, andP. Baudisch. Gravityspace: Tracking users and theirposes in a smart room using a pressure-sensing floor.In Proceedings of the SIGCHI Conference on HumanFactors in Computing Systems, CHI ’13, pages725–734, New York, NY, USA, 2013. ACM.
[9] A. Braun, H. Heggen, and R. Wichert. Capfloor - aflexible capacitive indoor localization system. InS. Chessa and S. Knauth, editors, Evaluating AALSystems Through Competitive Benchmarking. IndoorLocalization and Tracking, volume 309 ofCommunications in Computer and InformationScience, pages 26–35. Springer Berlin Heidelberg,2012.
[10] G.S.P. Castle. Contact charging between insulators.Journal of Electrostatics, 40/41:13–20, 1997.
[11] J. Chang, A.J. Kelly, and J.M. Crowley. Handbook ofElectrostatic Processes. Marcel Dekker, Inc., 1995.
[12] K. Chintalapudi, A. Padmanabha Iyer, and V.N.Padmanabhan. Indoor localization without the pain.In Proceedings of the Sixteenth Annual InternationalConference on Mobile Computing and Networking,MobiCom ’10, pages 173–184, New York, NY, USA,2010. ACM.
[13] A.J. Clippingdale. The sensing of spatial electricalpotential. PhD thesis, University of Sussex, 1993.
[14] G. Cohn, S. Gupta, T. Lee, D. Morris, J.R. Smith,M.S. Reynolds, D.S. Tan, and S.N. Patel. Anultra-low-power human body motion sensor usingstatic electric field sensing. In Proceedings of the 2012ACM Conference on Ubiquitous Computing, UbiComp’12, pages 99–102, New York, NY, USA, 2012. ACM.
[15] Gabe Cohn, Daniel Morris, Shwetak Patel, andDesney Tan. Humantenna: using the body as an
antenna for real-time whole-body interaction. In CHI’12, pages 1901–1910, 2012.
[16] N. U. Czech-Damal, G. Dehnhardt, P. Manger, andW. Hanke. Passive electroreception in aquaticmammals. Journal of Comparative Physiology A,199(6):555–563, 2013.
[17] T. Ficker. Electrification of human body by walking.Journal of Electrostatics, 64:10–16, 2006.
[18] S. Gabriel, R.W. Lau, and C. Gabriel. The dielectricproperties of biological tissues: II. Measurements inthe frequency range 10 Hz to 20 GHz. Physics inMedicine and Biology, 41(11):2251–2269, 1996.
[19] W. Gebrial, R. J. Prance, C.J. Harland, and T.D.Clark. Noninvasive imaging using an array of electricpotential sensors. Review of Scientific Instruments,77(6), 2006.
[20] T. Grosse-Puppendahl, Y. Berghoefer, A Braun,R. Wimmer, and A Kuijper. Opencapsense: A rapidprototyping toolkit for pervasive interaction usingcapacitive sensing. In Pervasive Computing andCommunications (PerCom), 2013 IEEE InternationalConference on, pages 152–159, March 2013.
[21] T. Grosse-Puppendahl, A. Braun, F. Kamieth, andA. Kuijper. Swiss-Cheese Extended: An ObjectRecognition Method for Ubiquitous Interfaces basedon Capacitive Proximity Sensing. In CHI ’13, pages1401–1410, 2013.
[22] Y. Guo and M. Hazas. Localising speech, footstepsand other sounds using resource-constrained devices.In 10th International Conference on InformationProcessing in Sensor Networks (IPSN), pages 330–341,2011.
[23] Marian Haescher, Denys J. C. Matthies, GeraldBieber, and Bodo Urban. Capwalk: A capacitiverecognition of walking-based activities as a wearableassistive technology. In Proceedings of the 8th ACMInternational Conference on PErvasive TechnologiesRelated to Assistive Environments, PETRA ’15, pages35:1–35:8, New York, NY, USA, 2015. ACM.
[24] M. Hall, E. Frank, G. Holmes, B. Pfahringer,P. Reutemann, and I.H. Witten. The weka datamining software: An update. SIGKDD Explorations,11(1), 2009.
[25] C.J. Harland, T.D. Clark, and R.J. Prance. Electricpotential probes - new directions in the remote sensingof the human body. Measurement Science andTechnology, 13(2):163–169, 2002.
[26] D. Hauschildt and N. Kirchhof. Advances in thermalinfrared localization: Challenges and solutions. In2010 International Conference on Indoor Positioningand Indoor Navigation, pages 1–8, 2010.
[27] K. Hidaka. Electric field and voltage measurement byusing electro-optic sensor. In Eleventh InternationalSymposium on High Voltage Engineering, volume 2,pages 1–14, 1999.
[28] T.W. Hnat, E. Griffiths, R. Dawson, andK. Whitehouse. Doorjamb: Unobtrusive room-leveltracking of people in homes using doorway sensors. InProceedings of the 10th ACM Conference on EmbeddedNetwork Sensor Systems, SenSys ’12, pages 309–322,New York, NY, USA, 2012. ACM.
[29] P.M. Ireland. The role of changing contact in slidingtriboelectrification. Journal of Physics D: AppliedPhysics, 41(2), 2008.
[30] C.D. Kidd, R. Orr, G.D. Abowd, C.G. Atkeson, I.A.Essa, B. MacIntyre, E. Mynatt, T.E. Starner, andW. Newstetter. The aware home: A living laboratoryfor ubiquitous computing research. In CooperativeBuildings. Integrating Information, Organizations, andArchitecture, volume 1670 of Lecture Notes inComputer Science, pages 191–198. Springer BerlinHeidelberg, 1999.
[31] F. Kirchbuchner, T. Grosse-Puppendahl, M.R.Hastall, M. Distler, and A. Kuijper. Ambientintelligence from senior citizens’ perspectives:Understanding privacy concerns, technologyacceptance, and expectations. In Ambient Intelligence,volume 9425 of Lecture Notes in Computer Science,pages 48–59. Springer International Publishing, 2015.
[32] T. Kivimaki, T. Vuorela, P. Peltola, and J. Vanhala. Areview on device-free passive indoor positioningmethods. International Journal of Smart Home,8(1):71–91, 2014.
[33] K. Kurita, R. Takizawa, and H. Kumon. Detection ofhuman walking motion based on measurement systemof current generated by electrostatic induction. InICCAS-SICE, 2009, pages 5485–5488, 2009.
[34] G. Laput, C. Yang, R. Xiao, A. Sample, andC. Harrison. Em-sense: Touch recognition ofuninstrumented, electrical and electromechanicalobjects. In Proceedings of the 28th Annual ACMSymposium on User Interface Software & Technology,UIST ’15, pages 157–166, New York, NY, USA, 2015.ACM.
[35] H. Liu, H. Darabi, P. Banerjee, and J. Liu. Survey ofwireless indoor positioning techniques and systems.IEEE Transactions on Systems, Man, andCybernetics, Part C: Applications and Reviews,37(6):1067–1080, 2007.
[36] J. Liu, Y. Wang, Y. Chen, J. Yang, X. Chen, andJ. Cheng. Tracking vital signs during sleep leveragingoff-the-shelf wifi. In Proceedings of the 16th ACMInternational Symposium on Mobile Ad HocNetworking and Computing, pages 267–276. ACM,2015.
[37] P. Llovera, P. Molinie, A. Soria, and A. Quijano.Measurements of electrostatic potentials and electricfields in some industrial applications: Basic principles.Journal of Electrostatics, 67(2/3):457–461, 2009.
[38] J. Lowell and A.C. Rose-Innes. Contact electrification.Advances in Physics, 29(6):947–1023, 1980.
[39] R. Mautz. Indoor positioning technologies. ETHZurich, 2012. Habilitation thesis.
[40] Microsoft. Kinect for Windows features.http://www.microsoft.com/en-us/kinectforwindows/meetkinect/features.aspx (dateaccessed 2015-08-24).
[41] G. Monaci and A. Pandharipande. Indoor user zoningand tracking in passive infrared sensing systems. InProceedings of the 20th European Signal ProcessingConference (EUSIPCO), pages 1089–1093, 2012.
[42] S. Narayana, R.V. Prasad, V.S. Rao, T.V. Prabhakar,S.S. Kowshik, and M.S. Iyer. PIR sensors:
Characterization and novel localization technique. InProceedings of the 14th International Conference onInformation Processing in Sensor Networks, IPSN ’15,pages 142–153, 2015.
[43] A. Pachi and T. Ji. Frequency and velocity of peoplewalking. The Structural Engineer, 83(3):36–40, 2005.
[44] Plessey Semiconductors. EPIC sensor.http://www.plesseysemiconductors.com/epic-plessey-semiconductors.php (date accessed2015-12-09).
[45] H. Prance, P. Watson, R.J. Prance, and S.T.Beardsmore-Rust. Position and movement sensing atmetre standoff distances using ambient electric field.Meas. Sci. Technol., 23, 2012.
[46] R. Prance and C. Harland. Electric potential sensor,July 2 2009. US Patent App. 12/374,359.
[47] Q. Pu, S. Gupta, S. Gollakota, and S. Patel.Whole-home gesture recognition using wireless signals.In Proceedings of the 19th Annual InternationalConference on Mobile Computing & Networking,MobiCom ’13, pages 27–38, New York, NY, USA,2013. ACM.
[48] T.S. Ralston, G.L. Charvat, and J.E. Peabody.Real-time through-wall imaging using anultrawideband multiple-input multiple-output (mimo)phased array radar system. In Phased Array Systemsand Technology (ARRAY), 2010 IEEE InternationalSymposium on, pages 551–558, Oct 2010.
[49] J. Rekimoto and H. Wang. Sensing gamepad:Electrostatic potential sensing for enhancingentertainment oriented interactions. In ExtendedAbstracts on Human Factors in Computing Systems,pages 1457–1460, 2004.
[50] C.A. Rezende, R.F. Gouveia, M.A. da Silva, andF. Galembeck. Detection of charge distributions ininsulator surfaces. Journal of Physics: CondensedMatter, 21(26), 2009.
[51] H. Rimminen. Detection of human movement by nearfield imaging: development of a novel method andapplications. PhD thesis, Aalto University, School ofScience and Technology, 2011.
[52] M. Shankar, J.B. Burchett, Q. Hao, B.D. Guenther,and D.J. Brady. Human-tracking systems usingpyroelectric infrared detectors. Optical Engineering,45(10):106401–106401, 2006.
[53] J.R. Smith. Electric Field Imaging. PhD thesis,Massachusetts Institute of Technology, 1999.
[54] R. Srinivasan, C. Chen, and D.J. Cook. Activityrecognition using actigraph sensor. In Proceedings ofthe Fourth Int. Workshop on Knowledge Discoveryform Sensor Data (ACM SensorKDD’10),Washington, DC, July, pages 25–28, 2010.
[55] Statistisches Bundesamt. Mikrozensus - Fragen zurGesundheit - Korpermaße der Bevolkerung 2013 (inGerman), 2014.
[56] T. Teixeira, G. Dublon, and A. Savvides. A survey ofhuman-sensing: Methods for detecting presence,count, location, track, and identity. Technical report,ENALAB, 2010.
[57] M. Valtonen, T. Vuorela, L. Kaila, and J. Vanhala.Capacitive indoor positioning and contact sensing for
activity recognition in smart homes. J. Ambient Intell.Smart Environ., 4(4):305–334, 2012.
[58] G. Wang, Y. Zou, and K.and Ni L.M. Zhou,Z.and Wu. We can hear you with wi-fi! In Proceedingsof the 20th Annual International Conference onMobile Computing and Networking, MobiCom ’14,pages 593–604, New York, NY, USA, 2014. ACM.
[59] Q. Wang. Dynamic time warping (dtw), 2014.http://mathworks.com/matlabcentral/fileexchange/43156(date accessed: 2015/11/15).
[60] A. Williams, D. Ganesan, and A. Hanson. Aging inplace: Fall detection and localization in a distributedsmart camera network. In Proceedings of the 15thACM International Conference on Multimedia, MM’07, pages 892–901, New York, NY, USA, 2007. ACM.
[61] J. Wilson and N. Patwari. See-through walls: Motiontracking using variance-based radio tomographynetworks. Mobile Computing, IEEE Transactions on,10(5):612–621, May 2011.
[62] K. Woolford. Defining accuracy in the use of kinect v2for exercise monitoring. In Proceedings of the 2ndInternational Workshop on Movement and Computing,pages 112–119. ACM, 2015.
[63] P. Wu and F. Li. The pyroelectric sensor basedsystem: Human tracking and self-calibration scheme.In 2012 International Conference on InformationScience and Technology (ICIST), pages 839–846, 2012.
[64] C. You, H. Kao, B. Ho, N. Chen, Y. Hsieh, P. Huang,and H. Chu. Thermalprobe: Exploring the use ofthermal identification for per-user energy metering. InInternet of Things (iThings), 2014 IEEE InternationalConference on, pages 554–561, Sept 2014.
[65] X. Zhou, Q. Hao, and H. Fei. 1-bit walker recognitionwith distributed binary pyroelectric sensors. In 2010IEEE Conference on Multisensor Fusion andIntegration for Intelligent Systems (MFI), pages168–173, 2010.