Platform for Quality of Experience Evaluation in Real … · Applications over LTE networks Luis...
140
Platform for Quality of Experience Evaluation in Real Time Applications over LTE networks Luis Miguel Cardoso Pereira [email protected] Orientador Doutor Osvaldo Arede dos Santos Coorientador Doutor Paulo Jorge Coelho Marques Dissertação apresentado à Escola Superior de Tecnologia do Instituto Politécnico de Castelo Branco para cumprimento dos requisitos necessários à obtenção do grau de Mestre em Desenvolvimento de Software e Sistemas Interativos, realizada sob a orientação científica do Doutor Osvaldo Arede dos Santos e coorientação do Doutor Paulo Jorge Coelho Marques, do Instituto Politécnico de Castelo Branco. Junho de 2015
Transcript of Platform for Quality of Experience Evaluation in Real … · Applications over LTE networks Luis...
Platform for Quality of Experience Evaluation in Real Time
Applications over LTE networks
Luis Miguel Cardoso Pereira
Orientador
Doutor Osvaldo Arede dos Santos
Coorientador
Doutor Paulo Jorge Coelho Marques
Dissertação apresentado à Escola Superior de Tecnologia do Instituto Politécnico de Castelo Branco para
cumprimento dos requisitos necessários à obtenção do grau de Mestre em Desenvolvimento de Software
e Sistemas Interativos, realizada sob a orientação científica do Doutor Osvaldo Arede dos Santos e
coorientação do Doutor Paulo Jorge Coelho Marques, do Instituto Politécnico de Castelo Branco.
Junho de 2015

II
III
Composição do Júri
Presidente do júri
Doutor Alexandre José Pereira Duro da Fonte
Professor Adjunto da UTC de Informática da Escola Superior de Tecnologia do
Instituto Politécnico de Castelo Branco
Vogais
Doutor Nuno Manuel Garcia dos Santos
Professor Auxiliar da Universidade da Beira Interior
Doutor Vasco Nuno da Gama de Jesus Soares
Professor Adjunto da UTC de Informática da Escola Superior de Tecnologia do
Instituto Politécnico de Castelo Branco
Doutor Osvaldo Arede dos Santos
Professor Adjunto da UTC de Informática da Escola Superior de Tecnologia do
Instituto Politécnico de Castelo Branco (Orientador)

IV
V
Agradecimentos
Este trabalho foi realizado em cooperação com várias empresas e quero deixar um
agradecimento a essas empresas que permitiram e possibilitaram a realização deste trabalho,
são elas a Portugal Telecom Inovação (PTIN), Instituto Politécnico de Castelo Branco (IPCB),
Instituto de Telecomunicações (IT) e Mecalbi – Engineering Solutions, Lda (MECALBI).
Como as empresas são constituídas por pessoas e são elas a parte principal das empresas,
quero deixar aqui um especial agradecimento aos principais responsáveis destas empresas
neste projeto: Eng. Álvaro Gomes (PTIN), Valdemar Monteiro (IT), Shahid Mumtaz (IT),
Jonathan Rodriguez (IT), Fernando Mateus (MECALBI), Jorge Amaral (MECALBI) e Professor
Doutor Paulo Marques (IPCB).
Quero deixar também um especial agradecimento ao Professor Doutor Osvaldo Santos,
orientador deste trabalho, por todo o apoio e ajuda disponibilizada ao longo da realização deste
trabalho.
Quero ainda deixar um especial agradecimento ao Professor Doutor Paulo Marques,
coorientador deste trabalho, por todo o apoio, ajuda e confiança que colocou em mim ao me
confiar esta tarefa no projeto Green-T.

VI
VII
Resumo
Atualmente existem vário simuladores para várias tecnologias de redes sem fios (LTE,
UMTS, Wi-Fi ...). Quase todos eles simulam valores para diferentes utilizadores como por
exemplo de taxas de transferência (Mbit/s), a potência recebida, a SNR, entre outros valores,
dependendo do tipo de simulação.
A maioria dos resultados apresentados pelos simuladores correspondem apenas a
números, como valores de taxa de transferência ou BER. Então, é difícil entender o impacto
desses valores numa comunicação real. Pretende-se com este projeto dar a utilizador por
exemplo 2 Mbits/s de taxa de transferência (uplink/downlink), um valor BER de 1 × 10⁻⁶ ou
uma potência recebida em torno 1NW obtidos num cenário de simulação e em tempo real e
para um cenário real o utilizador experienciar as condições de comunicação e interatividade
com as mesmas aplicações utilizadas na realidade.
O desenvolvimento da plataforma proposta neste projeto tem como objetivo verificar e
avaliar em tempo real a QoS e a QoE obtida para um utilizador simulado naquele momento e
para o cenário simulado. Isso permite que os utilizadores experienciem a interatividade com
aplicações para diferentes cenários de simulação.
Esta plataforma tem como objetivo converter os valores numéricos obtidos apenas por
ferramentas de simulação, para uma experiência em tempo real para um determinado cenário
simulado. Inicialmente, a rede pretendida a simular é LTE, mas outros protocolos e tipos de
rede poderão ser utilizados e testados nesta plataforma, desde que sejam baseados no
protocolo IP, tal como o LTE.
Palavras-chave
LTE, Real Time Link, QoE, Interatividade

VIII
IX
Abstract
There are many simulators for various wireless technologies (LTE, UMTS, WI-FI …). Almost
all of them have different values for users as bitrate, received power, SNR, among other values
depending on the simulation type.
Most of the simulators results are just numbers like bitrate or BER values. So is difficult to
understand the impact of those values in a real communication. It is intended with this project
to give a user for instance 2Mbits/s bitrate, a BER value of 1 × 10⁻⁶ or a received power around
1𝑛𝑊 in a simulation scenario and he could in real time and real scenario experience the
communication conditions and interactivity with applications.
The development of the platform proposed in this project aims to verify in real time the
QoS and QoE which simulated user experiences in that moment on the simulated scenario. This
allows users to experience the interactivity with applications for different simulation
scenarios.
This platform aims to convert the values merely numerical, obtained by simulation tools,
to a real-time experience for the scenario simulated. Initially the target network is LTE, but
other network protocols will be allowed to use ant test, since that they are IP based protocols
like LTE.
Key-words
LTE, Real Time Link, QoE, Interactivity

X
XI
Index Composição do Júri ............................................................................................................................................ III
Agradecimentos ................................................................................................................................................... V
Resumo ................................................................................................................................................................. VII
Abstract .................................................................................................................................................................. IX
Index of figures ................................................................................................................................................... XV
Index of tables ................................................................................................................................................... XXI
Index of Example Codes ................................................................................................................................ XXI
List of Acronyms ........................................................................................................................................... XXIII
1 Introduction ................................................................................................................................................ 1
1.1 Green-T project ..................................................................................................................................... 1
1.2 Green-T a Hybrid Approach ............................................................................................................ 2
1.3 Purpose of using a Real Time Link ............................................................................................... 4
1.3.1 Concepts and initial proposal ............................................................................................... 4
1.3.2 Communication protocols ...................................................................................................... 4
2 State of the Art ........................................................................................................................................... 9
2.1 Long Term Evolution .......................................................................................................................... 9
2.1.1 Evolved Packet System Architecture ................................................................................. 9
2.1.2 Radio Protocol Architecture ............................................................................................... 10
2.1.3 LTE network elements .......................................................................................................... 14
2.1.4 LTE Terminal States ............................................................................................................... 15
2.1.5 Link level and System level simulators .......................................................................... 17
2.2 Overview on the main LTE Simulators .................................................................................... 18
2.2.1 Metrifly ........................................................................................................................................ 18
2.2.2 Technical University of Vienna LTE based system simulator............................... 18
2.2.3 LTE eNB Emulator – NPT3081 .......................................................................................... 22
2.2.4 Steepest Ascent 3G Evolution Lab - LTE Toolbox and Blockset .......................... 24
2.2.5 Polaris Networks ..................................................................................................................... 29
2.2.6 QUALNET Multi-standard Network Evaluator ........................................................... 31
2.2.7 IXIA LTE UEs emulator ......................................................................................................... 33
2.2.8 WinProp LTE Radio Network Planning tool ................................................................ 40
3 System Level Simulator ....................................................................................................................... 47
3.1 System Level Simulator - overview ........................................................................................... 47
3.2 System Level Simulator – Graphical User Interface ........................................................... 52
4 Real Time Link platform ..................................................................................................................... 55

XII
XIII
4.1 LTE Emulator requirements ........................................................................................................ 55
4.2 Real Time Link platform implementation .............................................................................. 58
4.2.1 Redirect IP Packets Block .................................................................................................... 59
4.2.2 LTE Protocol Stack.................................................................................................................. 63
4.2.3 Gigabit Ethernet Link ............................................................................................................ 66
4.3 RTL GUI ................................................................................................................................................. 78
4.3.1 eNodeB side ............................................................................................................................... 78
4.3.2 User Equipment side.............................................................................................................. 78
4.3.3 ENodeB Statistics and Connection Settings ................................................................. 79
5 Integration with the System Level Simulator ............................................................................ 81
5.1 Interface between RTLE and SLS GUI....................................................................................... 85
5.2 RTL SLS GUI communication ....................................................................................................... 85
5.3 Running SLS with RTLE ................................................................................................................. 86
5.3.1 SLS connection ......................................................................................................................... 87
5.3.2 Run the simulation ................................................................................................................. 89
5.3.3 Run a new simulation ............................................................................................................ 91
5.4 Example scenarios used for demonstration of emulator capabilities ........................ 92
5.4.1 Scenario 1: Web browser ..................................................................................................... 93
5.4.2 Scenario 2: Video Streaming .............................................................................................. 93
5.4.3 Scenario 3: File Transfer ...................................................................................................... 94
5.4.4 Scenario 4: VoIP ....................................................................................................................... 94
5.4.5 Discussion .................................................................................................................................. 95
5.5 Security features ............................................................................................................................... 97
6 Conclusions and future work ............................................................................................................ 99
6.1 Future Work ........................................................................................................................................ 99
7 References ............................................................................................................................................. 101
8 Anexes ..................................................................................................................................................... 105
8.1 Paper Green-T ................................................................................................................................. 105

XIV
XV
Index of figures Figure 1: Green-T LTE Emulator. .......................................................................................................................... 3
Figure 2: implementation scenario. ..................................................................................................................... 4
Figure 3: hybrid TCP/IP model. ............................................................................................................................. 5
Figure 4: Architecture of LTE protocols (downlink) (Dahlman, Parkvall, & Sköld, 2011). ........... 5
Figure 5: encapsulation of the data in LTE (without considering segmentation/concatenation
in protocols). .................................................................................................................................................................. 5
Figure 6: encapsulating a TCP segment in an Ethernet frame. ................................................................. 6
Figure 7: encapsulation of traffic to be transmitted between computers. ........................................... 6
Figure 8: Emulator implementation Scheme.................................................................................................... 7
Figure 9: LTE Evolved Packet System (based on (3GPP TS 23.401 v12.2.0, 09-2013)). ............. 10
Figure 10: LTE radio protocol architecture (Tutorialspoint, 2015). ................................................... 10
Figure 11: Control Plane UE – MME (3GPP TS 23.401 v12.2.0, 09-2013). ........................................ 11
Figure 12: Protocol structure between UE and PDN GW (3GPP TS 23.401 v12.2.0, 09-2013).
.......................................................................................................................................................................................... 11
Figure 13: LTE Terminal States and Transition (Kai & Lihua, 2010). ................................................. 15
Figure 14: Schematic block diagram of the LTE system level simulator (Mehlführer et al., 2011).
.......................................................................................................................................................................................... 19
Figure 15: Three possible scenarios in the Vienna LTE link level simulator allow us to adjust
the scale of the simulation complexity: single-downlink, single-cell multi-user, and multi-cell
multi-user (Mehlführer et al., 2011). ................................................................................................................ 19
Figure 16: UE and cell throughput CDFs: TxD and OLSM, max C/I and round robin schedulers
(Mehlführer et al., 2011). ....................................................................................................................................... 21
Figure 17: Sector SINR, calculated with distance dependent macroscale pathloss only (left) and
additional lognormal-distributed space-correlated shadow fading (right) (Mehlführer et al.,
2011). ............................................................................................................................................................................. 22
Figure 18: Test setup example for UE protocol stack development (EikoSeidel, 2008). ............ 23
Figure 19: Communications Standards Libraries ( The MathWorks, Inc, s.d.)................................ 24
Figure 20: Physical Channels ( The MathWorks, Inc, s.d.). ...................................................................... 27
Figure 21: Physical Signals ( The MathWorks, Inc, s.d.). .......................................................................... 27
Figure 22: Downlink Shared Channel Functions ( The MathWorks, Inc, s.d.). ................................ 28
Figure 23: Physical Channels & Signals ( The MathWorks, Inc, s.d.). .................................................. 28
Figure 24: Physical Uplink Shared Channel Functions ( The MathWorks, Inc, s.d.). .................... 29
Figure 25: Qualnet Number of Handover results (SCALABLE Network Technologies, Inc, s.d.).
.......................................................................................................................................................................................... 33
Figure 26: Typical lxload access test configuration (Ixia, s.d.)............................................................... 34
Figure 27: Statistics displayed in real time during a test. ........................................................................ 36
Figure 28: Air interface definition for LTE (awe-communications, s.d.). .......................................... 41
Figure 29: Air interface settings for LTE (awe-communications, s.d.). .............................................. 41
Figure 30: Transmission mode definition for LTE (awe-communications, s.d.). ........................... 43
Figure 31: SNIR targets depending on the modulation and coding scheme for LTE (awe-
communications, s.d.). ............................................................................................................................................ 44
Figure 32: Definition of simulation parameters (awe-communications, s.d.). ................................ 45
Figure 33: Definition of individual cell load (awe-communications, s.d.). ........................................ 45
Figure 34: System Level Simulator components. ........................................................................................ 48
Figure 35: Block diagram representing system simulator components. ........................................... 50

XVI
XVII
Figure 36: Functional Block Diagram […]. ...................................................................................................... 50
Figure 37: Segmentation and concatenation of packets to be transmitted […]. ............................. 51
Figure 38: Wireless System Level Simulator. ................................................................................................ 51
Figure 39: Interface between Link and System Level. ............................................................................... 52
Figure 40: System Level Simulator Graphical User Interface: main window view. ...................... 52
Figure 41: Example results, from left to right: left: “BSs and UEs Map” graphic”, “BSant
Throughput” charts and “EU Cell ID and Dist” charts. ............................................................................... 53
Figure 42: Practical implementation of the emulator. .............................................................................. 56
Figure 43: maximum distance supported by different standards Gigabit Ethernet. .................... 57
Figure 44: Real Time Link overall structure. ................................................................................................. 59
Figure 45: redirect IP packets block diagram. .............................................................................................. 61
Figure 46: ROHC implementation scenario (1/2). ...................................................................................... 64
Figure 47: ROHC implementation scenario (2/2). ...................................................................................... 65
Figure 48: scheme of connection establishment (uplink and downlink). ......................................... 69
Figure 49: BLER vs. SNR plot for different modulation and coding (Mumtaz & Rodriguez, March
2013). ............................................................................................................................................................................. 70
Figure 50: errors generator function results for different error rates values. ................................ 71
Figure 51: normal sequence of IP packets. ..................................................................................................... 71
Figure 52: sequence of IP packets with delays introduced between them. ...................................... 71
Figure 53: LTE Frame structure (Dahlman, Parkvall, & Sköld, 2011). ............................................... 72
Figure 54: relationship between the file on disk, a file mapping object, and a file view
(Microsoft, s.d.). ......................................................................................................................................................... 74
Figure 55: RTL Header ............................................................................................................................................ 77
Figure 56: copy the two first bytes from variable “size” to “data”. ...................................................... 77
Figure 57: eNodeB Link main window. ........................................................................................................... 78
Figure 58: User Equipment Link main window. .......................................................................................... 79
Figure 59: eNodeB Link statistics and Connection Settings window. ................................................. 79
Figure 60: LTE emulator, main software modules. ..................................................................................... 81
Figure 61: Simulation process: communication interfaces and sequence events. ........................ 82
Figure 62: Emulation process: communication interfaces and sequence events. ......................... 83
Figure 63: RTL SLS GUI communication flowchart. ................................................................................... 86
Figure 64: data transferred between SLS and RTLE. ................................................................................. 86
Figure 65: RTLE eNodeB main window – not connected with SLS GUI. ............................................ 87
Figure 66: RTLE eNodeB main window – connecting with SLS GUI. ................................................... 88
Figure 67: RTLE eNodeB main window – SLS connected. ....................................................................... 88
Figure 68: RTLE User Equipment window – running. ............................................................................... 89
Figure 69: SLS not connected window. ............................................................................................................ 89
Figure 70: RTLE User Equipment window – running SLS simulation. ............................................... 89
Figure 71: RTLE eNodeB main window – running SLS simulation. ..................................................... 90
Figure 72: System Level Simulator main window – running. ................................................................. 90
Figure 73: RTLE User Equipment window – running. ............................................................................... 91
Figure 74: RTLE eNodeB main window – SLS simulation finished. ..................................................... 91
Figure 75: Scenario 1 implementation............................................................................................................. 93
Figure 76: Scenario 2 implementation............................................................................................................. 94
Figure 77: Scenario 3 implementation............................................................................................................. 94
Figure 78: Scenario 4 implementation............................................................................................................. 95

XVIII

XIX
Figure 79: example of communication without delays using the ping tool, delay = 0
microseconds. ............................................................................................................................................................. 95
Figure 80: example of communication with delays using the Ping tool, delay = 25000
microseconds. ............................................................................................................................................................. 96
Figure 81: Received stream without errors. .................................................................................................. 96
Figure 82: Received stream with BER = 1E-5 (right)................................................................................. 96

XX

XXI
Index of tables Table 1: Summary of the main functions in each LTE layer. ........................................................... 12
Table 2: EPS architecture components and their main features. .................................................. 14
Table 3: Network Overview statistics. ...................................................................................................... 36
Table 4: Per-Sector UE statistics. ................................................................................................................ 36
Table 5: Per-Sector Cell statistics. .............................................................................................................. 37
Table 6: Session statistics. ............................................................................................................................. 38
Table 7: Global statistics. ................................................................................................................................ 38
Table 8: Current Attach-Detach statistics. .............................................................................................. 39
Table 9: Cumulative Attach-Detach statistics. ....................................................................................... 39
Table 10: Handover statistics. ...................................................................................................................... 39
Table 11: Real Time Link Requirements Summary. ........................................................................... 58
Table 12: values of Ethernet Type field according to the IP version. .......................................... 62
Table 13: example input arguments in delayUs() function. ............................................................ 73
Table 14: LTE simulation parameters for emulator demonstration. ........................................... 92
Index of Example Codes Example Code 1: source code to fill the Ethernet header frame (simplified). ......................... 63
Example Code 2: Signalling used with ROHC communications in RTL Header. ...................... 65
Example Code 3: example code that shows how to set TCP_NODELAY option. ...................... 68
Example Code 4: example code to enable NON-BLOCKING sockets. ........................................... 68
Example Code 5: Sleep function declaration. ......................................................................................... 72
Example Code 6: delayUs function declaration. ................................................................................... 72
Example Code 7: structure of data to exchange between processes. .......................................... 75
Example Code 8: Use of the ProcessBuilder to start the SLS. .......................................................... 82
Example Code 9: Signalling used in SLS communications (some of the values defined in RTL
Header for communication with SLS). ............................................................................................................. 85

XXII

XXIII
List of Acronyms
Acronym Definition
#
3GPP Third Generation Partnership Project
3GPP AAA 3GPP Authentication Authorization and Accounting Server
A
ALE Automatic Link Establishment
AM Acknowledged Mode
APN Access Point Name
AS access stratum
ASAPS
API Application Programming Interface
B
BER Bit Error Rate
BLER Block Error Rate
C
CP Control Plane
CN Core Network
CS Circuit Switching
CSV Comma Separated Values
D
DCI Downlink Control Information
DIS Distributed Interactive Simulation
DL Downlink
DSP Digital Signal Processing
E
E-UTRA Evolved UMTS Terrestrial Radio Access
E-UTRAN Evolved Universal Terrestrial Radio Access Network
EDGE Enhanced Data rates for GSM Evolution
eNB eNodeB
eNodeB Evolved NodeB

XXIV
XXV
ePDG Evolved Packet Data Gateway
EPC Evolved Packet Core
EPS Evolved Packet System
F
FDD Frequency Division Duplex
FDMA Frequency Division Multiple Access
FFT Fast Fourier Transform
FT Functional Tester
FTP File Transfer Protocol
G
GSM Global System for Mobile Communications
GUI Graphical User Interface
H
HARQ Hybrid Automatic Repeat Request
HLA High Level Architecture
HO Handover
HSDPA High-Speed Downlink Packet Access
HSUPA High-Speed Uplink Packet Access
HSS/AuC Home Subscriber Server/Authentication Centre
HTTP Hypertext Transfer Protocol
I
IP Internet Protocol
IPTV Internet Protocol television
IPv4 Internet Protocol version 4
IPv6 Internet Protocol version 6
J
K
L
LTE Long Term Evolution
M
MAC Medium Access Control

XXVI

XXVII
Mbps Megabit/second
MIMO Multiple-input and multiple-output
MME Mobility Management Entity
MMSE Minimum Mean Square Error
N
NAS Non Access Stratum
O
OFDM Orthogonal frequency-division multiplexing
P
PCRF Policy and Charging Rules Function
PDCP Packet Data Convergence Protocol
PDN-GW Packet Data Network Gateway
PDU(s) Protocol Data Unit(s)
PHY Physical Layer
PPDR Public Protection and Disaster Relief
Q
QAM Quadrature amplitude modulation
QCI QoS Class Identifier
QoE Quality of Experience
QoS Quality of Service
R
RF Radio Frequency
RLC Radio Link Control
RMC Reference Measurement Channel
RNP Radio Network Planning
ROHC Robust Header Compression
RRC Radio Resource Control
RSRP Reference Signal Received Power
RSRQ Reference Signal Received Quality
RSSI Received Signal Strength Indication
RTLE Real Time Link Emulator
RX Receiver

XXVIII

XXIX
S
SAE System Architecture Evolution
S-GW Serving Gateway
SC-FDMA Single-carrier FDMA
SDU(s) Service Data Unit(s)
SOFDMA Scalable Orthogonal Frequency Division Multiplexing Access
SNIR Signal to Noise Plus Interference Ratio
T
TCP Transmission Control Protocol
TDD Time Division Duplex
TIREM Terrain Integrated Rough Earth Model
TR Technical Report
TTI Transmission Time interval
TAU Tracking Area Update
TS Technical Specification
TX Transmitter
U
UDP User Datagram Protocol
UE User Equipment
UL Uplink
UMTS Universal Mobile Telecommunications System
UP User Plane
V
VoLTE Voice Over LTE
W
WCDMA Wideband Code Division Multiple Access
X
Y
Z
ZF Zero Forcing (equalizer)

XXX

Platform for Quality of Experience Evaluation in Real Time Applications over LTE networks
1
1 Introduction In current days to support the growing demand for packet-based mobile broadband
systems, the 3rd Generation Partnership Project (3GPP) (3GPP, s.d.) has introduced the next
step of the current 3G cellular networks, the Long Term Evolution (LTE). An advanced access
network, the Evolved-UMTS Terrestrial Radio Access Network (E-UTRAN) and an Evolved
Packet Core (EPC) network have been defined. It is clear that the level of optimization from the
2nd Generation to the 4th Generation mobile networks is a topic worth of investigation for
both industrial and academic communities. Optimization tools such as system level simulators
are not easily available for these communities and there is a lack of differentiation between the
network simulation and network emulation. In fact, vendors of mobile communication
equipment’s have implemented their own simulators, and other simulators, developed in
academia-industrial cooperation, can be purchased using a commercial license, because their
source codes are not publicly available. Current freely available simulators don’t consider
many relevant aspects of the LTE emulation, such as realistic applications, or a complete LTE
protocol stack implementation, and multi-cell environments with uplink flows. In this
document will be described the implementation of an innovative LTE Emulator composed by
a System Level Simulator (SLS) and the Real Time Link Emulator (RTLE). From one side the
SLS take into consideration all network aspects such as planning, scheduling, and interference.
From the other side the RTLE take into consideration aspects regarding the LTE protocol stack
and the information exchange between a LTE UE and a LTE eNodeB.
1.1 Green-T project
GREEN-T is a CELTIC-Plus project (Instituto de Telecomunicações, 2015) which lists as one
of its goals to develop and implement a 4G emulator, allowing the end-user to evaluate the
quality of experience of real-time based services. There are many simulators for various
wireless technologies (LTE, UMTS, WI-FI) and almost all of them have as outputs different
values, such as bitrate, received power, SNR, depending on the simulation type. In spite of the
reliability of these simulators, it is difficult to understand the impact of those values in real
communication. This document describes the implementation of an LTE emulator based on
system simulator results where the end user can experience real time and real scenario
communication conditions and interactivity with applications. This platform aims to convert
the merely numerical values, obtained through the use of simulation tools, to a real-time
experience for the simulated scenario. We demonstrate a 2Mbits/s bitrate video application,
with a BER value of around 1 × 10⁻⁶ or a received power around 1 𝑛𝑊 in a simulation
scenario. In spite of the fact that the implementation was based on the LTE, protocols of other
4G and 5G networks will be allowed to be used and tested, since they are IP based protocols
like LTE.
One of the biggest impediments of future wireless communications systems is the need to
limit the energy consumption of the battery-driven devices so as to prolong the operational
times and to avoid active cooling. GREEN-T also aims to overcome the energy trap of 4G mobile
systems by investigating and demonstrating energy saving technologies for multi-standard
wireless mobile devices, exploiting the combination of cognitive radio and cooperative
strategies while still enabling the required performance in terms of data rate and QoS to
support active applications. This notion is further extended by investigating lightweight
Luis Pereira
2
security approaches, which is a pivotal requirement of 4G systems that will constitute a
multitude of players from network operators to services providers cooperating under a
converged service platform. In this scope, this document describes the implementation of an
LTE emulator, which allows users to measure their quality of experience, in this specific case,
of multimedia services. Given the need to analyse in real time various parameters such as
quality of service (QoS) and quality of experience (QoE), we propose to develop a platform to
meet those requirements. The intended platform must support the most commonly used
services on the internet like Web Browsing, File Download, IPTV / Online Media and Voice over
LTE.
In annex 8.1 it is presented one Green-T project paper. That paper was presented at WICON
- 8th International Wireless Internet Conference (www.wicon.org) that was held in Lisbon
2015.
1.2 Green-T a Hybrid Approach
As discussed previously different simulation and emulation processes can be envisaged,
depending on the objectives in mind. A system level simulator and particularly a Radio
Network Planning (RNP) tool should provide to the radio network planner an accurate view of
the radio behavior. Nevertheless, to speed up the simulation in such complex scenarios some
simplifications are assumed and basically only the PHY level is considered. The average
behavior of the upper protocol layers are previously simulated using a link level simulator and
the outputs feed the SLS. Despite some link level simulators could replicate with significant
accuracy the link performance, they use interference and traffic models that only hardly could
evaluate the user link performance on specific situations (e.g. environment, service and
mobility). To overcome this drawback Green-T project proposes a Hybrid approach based on:
System Level Simulator - to evaluate the performance of LTE networks in large
scenarios (eNodeBs and users) as close as possible of the real one and in line with the
most advanced commercial RNPs tools.
A Real Time Link Emulator – To replicate the most important LTE protocols features
and to emulate a specific user and eNodeB of the simulated environment. For this
emulated user, a service and a trajectory could be defined in the simulated scenario and
shown in real time a real application, to evaluate not only the QoS but also the QoE
(Quality of Experience).
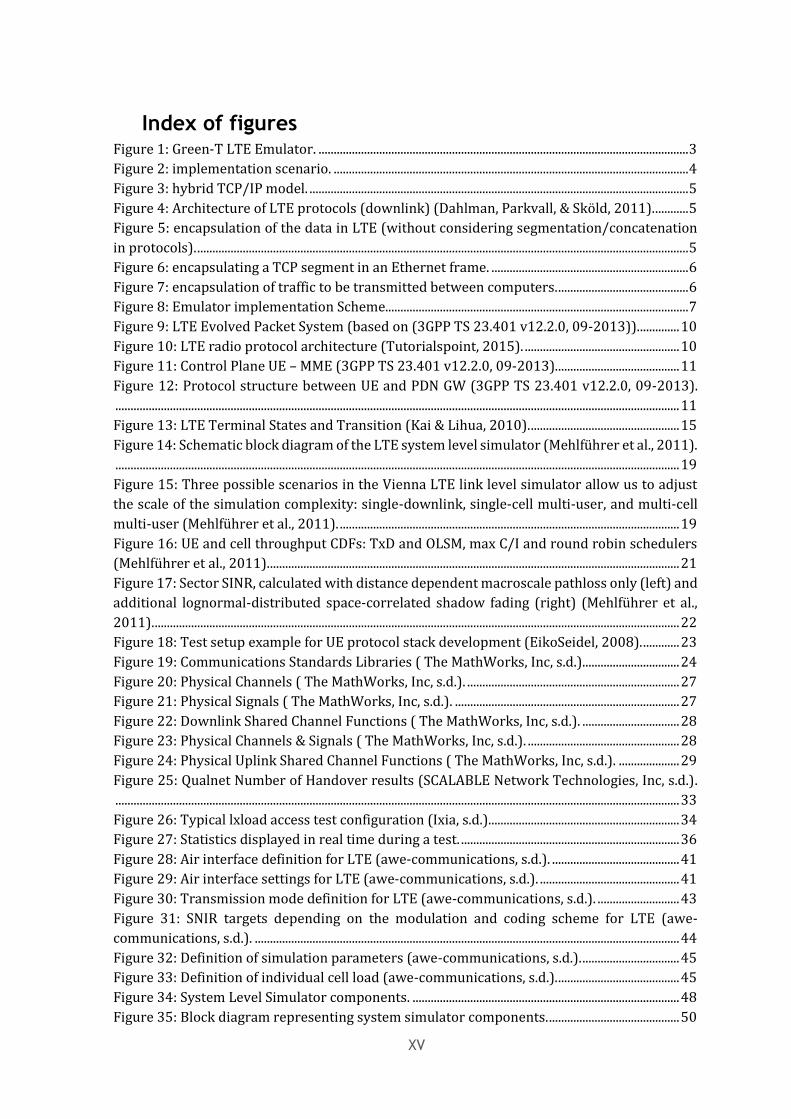
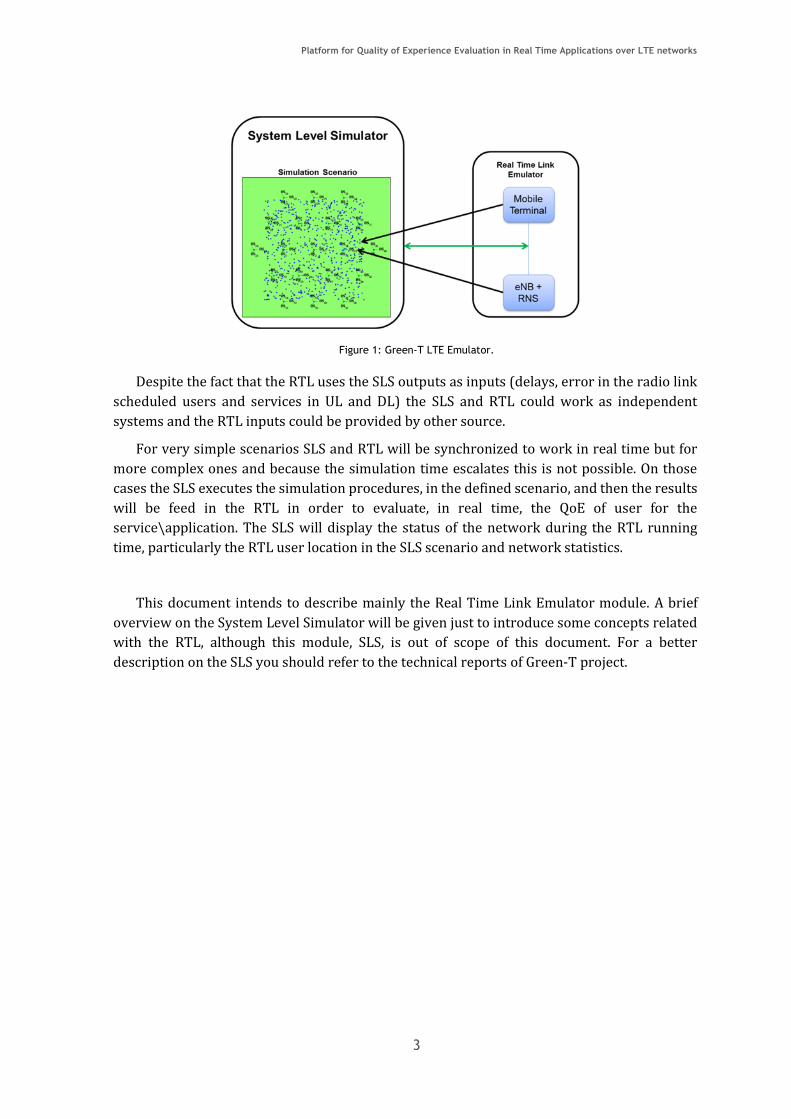
Figure 1 depicts the overall Green-T LTE Emulator with the two modules, the System Level
Simulator and the Real Time Link Emulator.
Platform for Quality of Experience Evaluation in Real Time Applications over LTE networks
3
Figure 1: Green-T LTE Emulator.
Despite the fact that the RTL uses the SLS outputs as inputs (delays, error in the radio link
scheduled users and services in UL and DL) the SLS and RTL could work as independent
systems and the RTL inputs could be provided by other source.
For very simple scenarios SLS and RTL will be synchronized to work in real time but for
more complex ones and because the simulation time escalates this is not possible. On those
cases the SLS executes the simulation procedures, in the defined scenario, and then the results
will be feed in the RTL in order to evaluate, in real time, the QoE of user for the
service\application. The SLS will display the status of the network during the RTL running
time, particularly the RTL user location in the SLS scenario and network statistics.
This document intends to describe mainly the Real Time Link Emulator module. A brief
overview on the System Level Simulator will be given just to introduce some concepts related
with the RTL, although this module, SLS, is out of scope of this document. For a better
description on the SLS you should refer to the technical reports of Green-T project.

Luis Pereira
4
1.3 Purpose of using a Real Time Link
Given the need to analyse in real time various parameters such as quality of service (QoS)
and quality of experience (QoE), we, at Green-T project, propose to develop a platform to meet
those requirements. The intended platform must support the most commonly used services on
the internet like Web Browsing, File Download, IPTV / Online Media and Voice Over LTE
(VoLTE).
1.3.1 Concepts and initial proposal
To emulate an eNodeB independent from the emulation of the User Equipment, we (at
Green-T Project) present a solution based on two devices, with two different computers, which
allows a better processing performance. Figure 2 shows a simplified schematic of the
connection between UE and eNodeB.
Figure 2: implementation scenario.
The purpose of this connection is to demonstrate, at real time, the functionalities of the
services and applications in a simulated environment, both for the evaluation of the QoE and
the QoS at the UB and eNodeB (UL/DL). So, one of the crucial aspect here is the simulation time,
which cannot be greater than the time defined for the LTE. Another aspect to consider is that
the connection between the two emulators, besides having to work in a transparent mode,
should not introduce errors or delays (greater than 2ms) to prevent significant interference
with the simulation time – though we might want to introduce simulated errors for testing
purposes.
As the speed of the LTE in the Downlink is up to 100Mbps (in release 8) the connection
between the two emulators must operate at least at this transfer rate. As an initial approach,
the 1000BASE-T standard Gigabit Ethernet technology is a possible solution, since the
distances between the two emulators are relatively short. Also this technology allows data
transfers up to 1Gbps, and there is no need to purchase additional hardware components, as
many recent computers already have a Gigabit Ethernet interface compatible with this
standard.
1.3.2 Communication protocols
The Gigabit Ethernet technology mentioned above corresponds only to the physical layer
of the TCP/IP model, so we still have to define the protocols to use in the remaining layers.
The TCP/IP model is characterized by four layers, Network Access, Internet, Transport and
Application (Microsoft, s.d.). But is possible to represent the TCP/IP model using a hybrid
User Equipment Emulator
eNodeB Emulator
Internet
Platform for Quality of Experience Evaluation in Real Time Applications over LTE networks
5
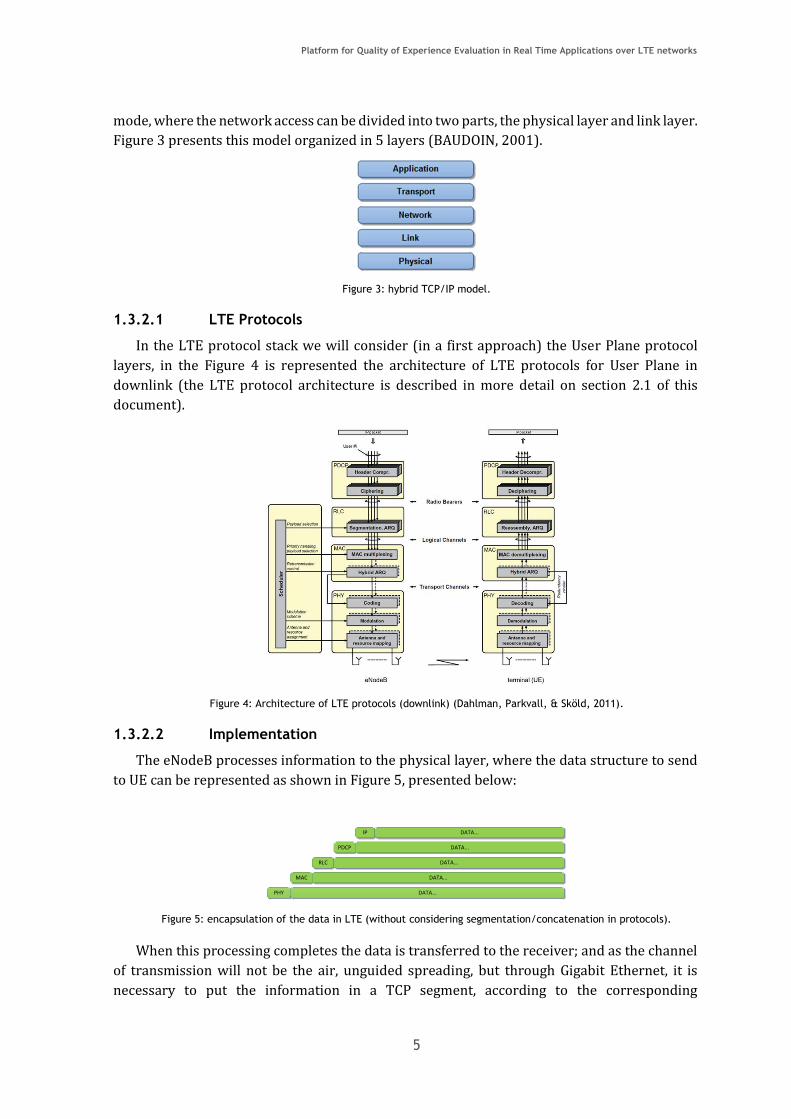
mode, where the network access can be divided into two parts, the physical layer and link layer.
Figure 3 presents this model organized in 5 layers (BAUDOIN, 2001).
Figure 3: hybrid TCP/IP model.
1.3.2.1 LTE Protocols
In the LTE protocol stack we will consider (in a first approach) the User Plane protocol
layers, in the Figure 4 is represented the architecture of LTE protocols for User Plane in
downlink (the LTE protocol architecture is described in more detail on section 2.1 of this
document).
Figure 4: Architecture of LTE protocols (downlink) (Dahlman, Parkvall, & Sköld, 2011).
1.3.2.2 Implementation
The eNodeB processes information to the physical layer, where the data structure to send
to UE can be represented as shown in Figure 5, presented below:
Figure 5: encapsulation of the data in LTE (without considering segmentation/concatenation in protocols).
When this processing completes the data is transferred to the receiver; and as the channel
of transmission will not be the air, unguided spreading, but through Gigabit Ethernet, it is
necessary to put the information in a TCP segment, according to the corresponding
PHY
MAC
RLC
PDCP
DATA...
DATA...
DATA...
DATA...
IP DATA...
Luis Pereira
6
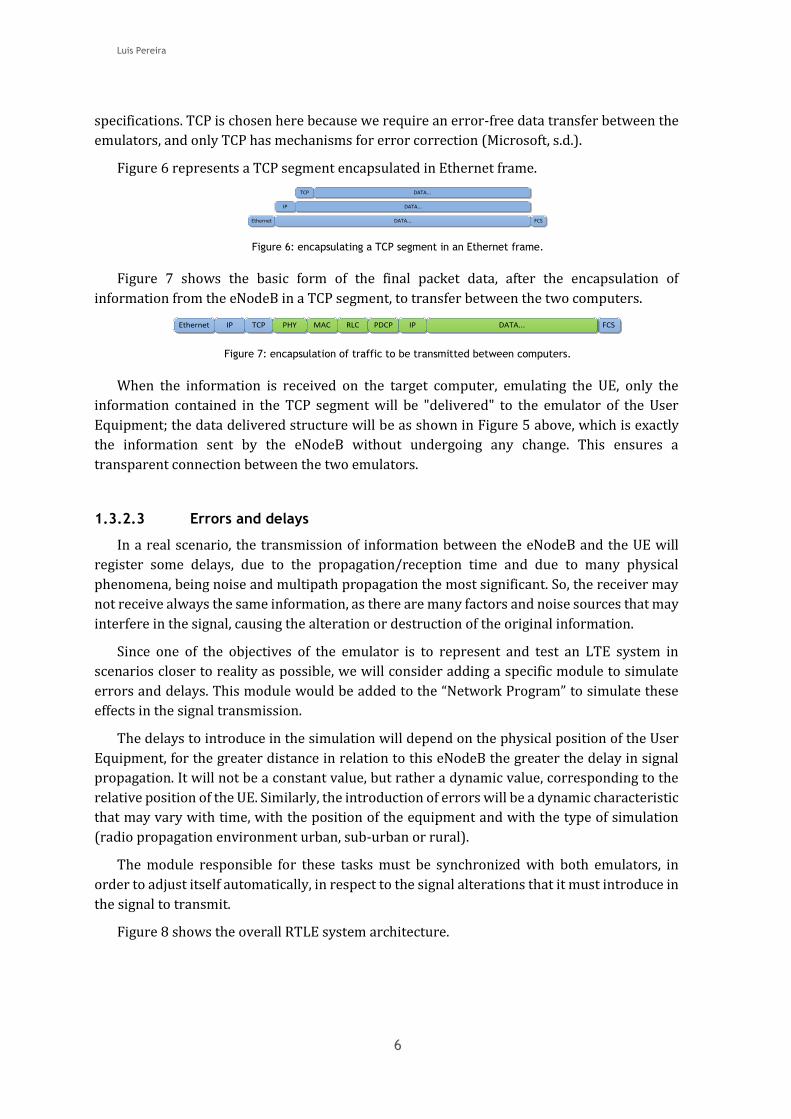
specifications. TCP is chosen here because we require an error-free data transfer between the
emulators, and only TCP has mechanisms for error correction (Microsoft, s.d.).
Figure 6 represents a TCP segment encapsulated in Ethernet frame.
Figure 6: encapsulating a TCP segment in an Ethernet frame.
Figure 7 shows the basic form of the final packet data, after the encapsulation of
information from the eNodeB in a TCP segment, to transfer between the two computers.
Figure 7: encapsulation of traffic to be transmitted between computers.
When the information is received on the target computer, emulating the UE, only the
information contained in the TCP segment will be "delivered" to the emulator of the User
Equipment; the data delivered structure will be as shown in Figure 5 above, which is exactly
the information sent by the eNodeB without undergoing any change. This ensures a
transparent connection between the two emulators.
1.3.2.3 Errors and delays
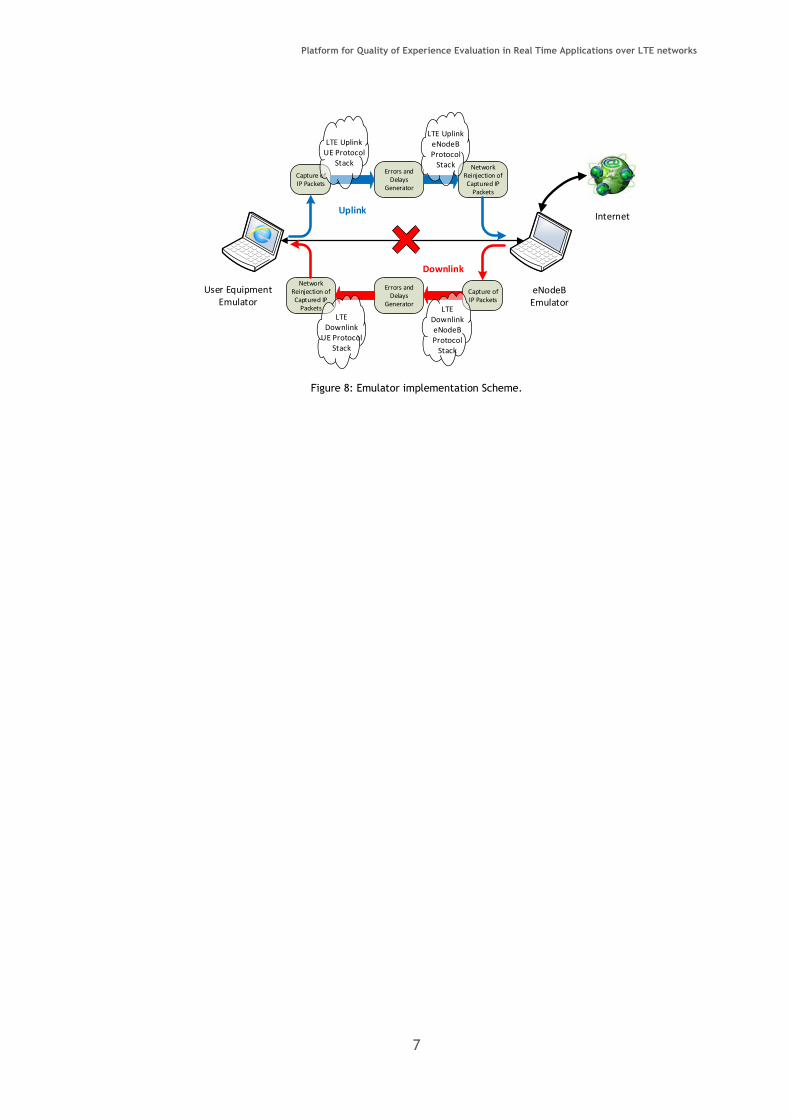
In a real scenario, the transmission of information between the eNodeB and the UE will
register some delays, due to the propagation/reception time and due to many physical
phenomena, being noise and multipath propagation the most significant. So, the receiver may
not receive always the same information, as there are many factors and noise sources that may
interfere in the signal, causing the alteration or destruction of the original information.
Since one of the objectives of the emulator is to represent and test an LTE system in
scenarios closer to reality as possible, we will consider adding a specific module to simulate
errors and delays. This module would be added to the “Network Program” to simulate these
effects in the signal transmission.
The delays to introduce in the simulation will depend on the physical position of the User
Equipment, for the greater distance in relation to this eNodeB the greater the delay in signal
propagation. It will not be a constant value, but rather a dynamic value, corresponding to the
relative position of the UE. Similarly, the introduction of errors will be a dynamic characteristic
that may vary with time, with the position of the equipment and with the type of simulation
(radio propagation environment urban, sub-urban or rural).
The module responsible for these tasks must be synchronized with both emulators, in
order to adjust itself automatically, in respect to the signal alterations that it must introduce in
the signal to transmit.
Figure 8 shows the overall RTLE system architecture.
Ethernet
IP
TCP
DATA...
DATA...
DATA...
FCS
Ethernet IP TCP FCSPHY MAC RLC PDCP IP DATA...
Platform for Quality of Experience Evaluation in Real Time Applications over LTE networks
7
Figure 8: Emulator implementation Scheme.
User Equipment Emulator
eNodeB Emulator
Internet
Capture of IP Packets
Errors and Delays
Generator
Network Reinjection of Captured IP
Packets
LTE Uplink UE Protocol
Stack
LTE Uplink eNodeB Protocol
Stack
Capture of IP Packets
Errors and Delays
Generator
Network Reinjection of Captured IP
Packets
LTE Downlink
UE Protocol Stack
LTE Downlink eNodeB Protocol
Stack
Uplink
Downlink

Luis Pereira
8

Platform for Quality of Experience Evaluation in Real Time Applications over LTE networks
9
2 State of the Art This section is a survey of available software simulation tools for the LTE cellular system
and related 3GPP protocols. The main technical characteristics and features are described and
compared. This study is important to establish a benchmark for the Green-T LTE protocol
simulator and for the definition of an up-to-date list of system requirements. It is also given a
very first approach and overview on LTE and on its main features and architecture.
2.1 Long Term Evolution
Long Term evolution (LTE), widely known as 4G, is a standard for high speed wireless
communications, developed by the 3GPP (3rd Generation Partnership Project) and is specified
in its Release 8 document series (first release). LTE is based on the GSM (Global System for
Mobile Communications)/EDGE (Enhanced Data rates for GSM Evolution) and UMTS/HSPA
network technologies towards an end-to-end all-IP system, achieving increased capacity and
speed using a different radio interface together with core network improvements. LTE first
release (release 8), provided downlink peak rates of 150Mbit/s, uplink peak rates of 50Mbit/s
and QoS provisions enabling a transfer latency of less than 10ms in LTE network. Currently
3GPP works on Release 12 and 13 of the standard. With increased data rates, improved
spectrum efficiency and packet-optimized system, LTE technology is set to drive machine to
machine technology and data intensive applications (LteWorld, s.d.). 3GPP is also working in
order to implement Public Protection and Disaster Relief (PPDR), also known as Public Safety,
communications in LTE. These new LTE features have specific requirements related with
security and reliability due to the sensitive information that is transmitted in these networks.
2.1.1 Evolved Packet System Architecture
The Evolved Packet System (EPS) is a 3GPP term which refers to a complete end-to-end
system, that is, the User Equipment (UE), Evolved Universal Terrestrial Radio Access Network
(E-UTRAN) and Core Network (CN), designated in LTE by Evolved Packet Core (EPC) (Olsson,
Sultana, Rommer, Frid, & Mulligan, 2009). The main LTE module that constitutes the E-UTRAN
is the Evolved NodeB (eNodeB or eNB), the LTE Relay Node shown in Figure 9 is a feature of
release 10 and its purpose is to improve network coverage and bandwidth. The EPC can have
multiple modules (depending on the network operator requirements), the main ones are the
Mobility Management Entity (MME), Serving Gateway (SGW), Packet Data Network Gateway
(PDN GW), Home Subscriber Server/Authentication Centre (HSS/AuC) and the Policy and
Charging Rules Function (PCRF). When Interworking with other technologies the Evolved
Packet Data Gateway (ePDG) and the 3GPP Authentication Authorization and Accounting
Server (3GPP AAA) are also important modules that shall be considered. Figure 9 depicts the
modules described above with the corresponding inter-module interfaces.

Luis Pereira
10
Figure 9: LTE Evolved Packet System (based on (3GPP TS 23.401 v12.2.0, 09-2013)).
2.1.2 Radio Protocol Architecture
The radio protocol architecture for LTE can be separated into Control Plane architecture
and User Plane architecture, as shown in Figure 10 (Tutorialspoint, 2015):
Figure 10: LTE radio protocol architecture (Tutorialspoint, 2015).
At User Plane side, the application creates data packets that are processed by protocols
such as TCP, UDP and IP, while in the Control Plane the radio resource control (RRC) protocol
writes the signalling messages that are exchanged between the eNodeB and the UE. In both
cases, the information is processed by the Packet Data Convergence Protocol (PDCP), the Radio
Link Control (RLC) protocol and the medium access control (MAC) protocol, before being
passed to the physical layer for transmission, see Figure 11.
Platform for Quality of Experience Evaluation in Real Time Applications over LTE networks
11
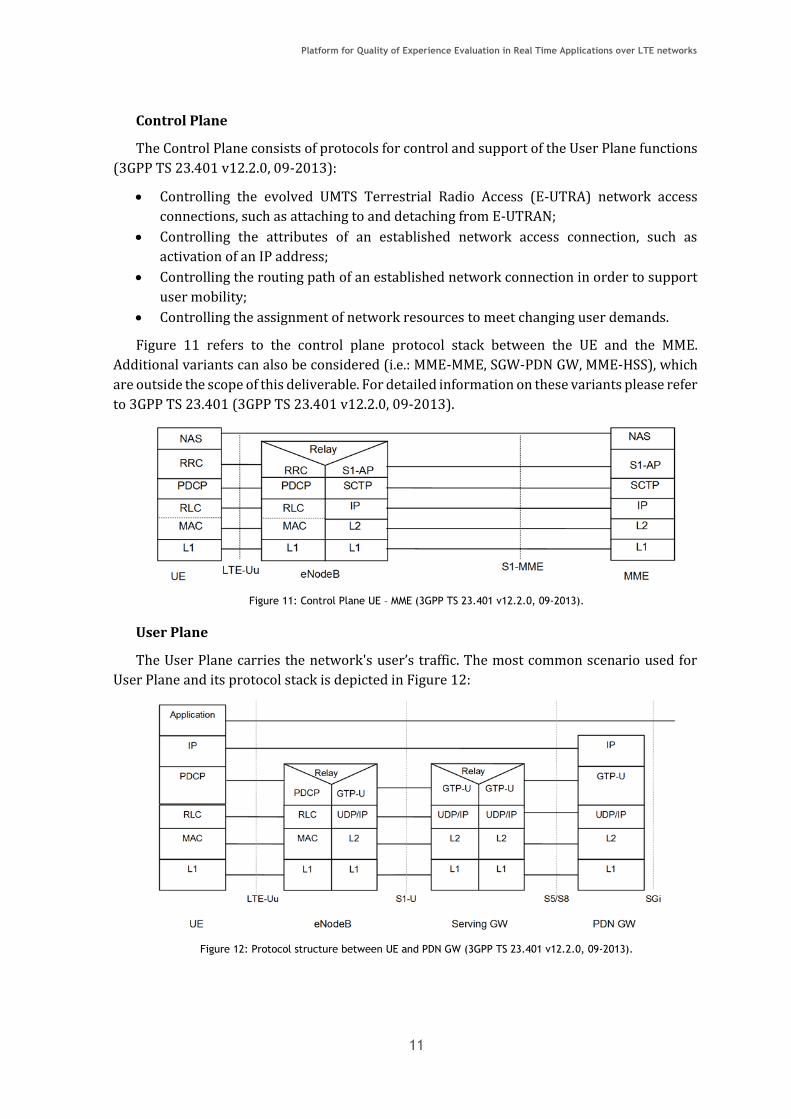
Control Plane
The Control Plane consists of protocols for control and support of the User Plane functions
(3GPP TS 23.401 v12.2.0, 09-2013):
Controlling the evolved UMTS Terrestrial Radio Access (E-UTRA) network access
connections, such as attaching to and detaching from E-UTRAN;
Controlling the attributes of an established network access connection, such as
activation of an IP address;
Controlling the routing path of an established network connection in order to support
user mobility;
Controlling the assignment of network resources to meet changing user demands.
Figure 11 refers to the control plane protocol stack between the UE and the MME.
Additional variants can also be considered (i.e.: MME-MME, SGW-PDN GW, MME-HSS), which
are outside the scope of this deliverable. For detailed information on these variants please refer
to 3GPP TS 23.401 (3GPP TS 23.401 v12.2.0, 09-2013).
Figure 11: Control Plane UE – MME (3GPP TS 23.401 v12.2.0, 09-2013).
User Plane
The User Plane carries the network's user’s traffic. The most common scenario used for
User Plane and its protocol stack is depicted in Figure 12:
Figure 12: Protocol structure between UE and PDN GW (3GPP TS 23.401 v12.2.0, 09-2013).

Luis Pereira
12
The main functions for each of the LTE layers are briefly described in Table 1.
Table 1: Summary of the main functions in each LTE layer.
Layer description
Non Access
Stratum (NAS)
Protocols
NAS is specified in 3GPP TS 24.301 (3GPP TS 24.301, 12-2013) and
forms the highest stratum of the control plane between the UE and the
MME.
NAS protocols support the mobility of the UE and the session
management procedures to establish and maintain IP
connectivity between the UE and a PDN GW.
Radio
Resource
Control (RRC)
RRC is specified in 3GPP TS 36.331 (3GPP TS 36.331 v12.5.0, 03-
2015). The main services and functions of the RRC sublayer include:
Broadcast of system information related to the non-access
stratum (NAS);
Broadcast of system information related to the access stratum
(AS);
Paging;
Establishment, maintenance and release of an RRC connection
between the UE and E-UTRAN;
Security functions including key management;
Establishment, configuration, maintenance and release of point-
to-point Radio Bearers;
Mobility functions;
QoS management functions;
UE measurement reporting and control of the reporting;
NAS direct message transfer to/from NAS from/to UE.
Packet Data
Convergence
Control (PDCP)
PDCP is specified in 3GPP TS 36.323 (3GPP TS 36.323 v12.3.0, 03-
2015) and the main services and functions for the user plane include:
Header compression and decompression: Robust Header
Compression (ROHC) only;
Transfer of user data;
In-sequence delivery of upper layer protocol data units (PDUs)
at PDCP re-establishment procedure for RLC acknowledged
mode (AM);
Duplicate detection of lower layer Service Data Units (SDUs) at
PDCP re-establishment procedure for RLC AM;
Retransmission of PDCP SDUs at handover for RLC AM;
Ciphering and deciphering;
Timer-based SDU discard in uplink.
The main services and functions of the PDCP for the control
plane include:
Ciphering and Integrity Protection;
Platform for Quality of Experience Evaluation in Real Time Applications over LTE networks
13
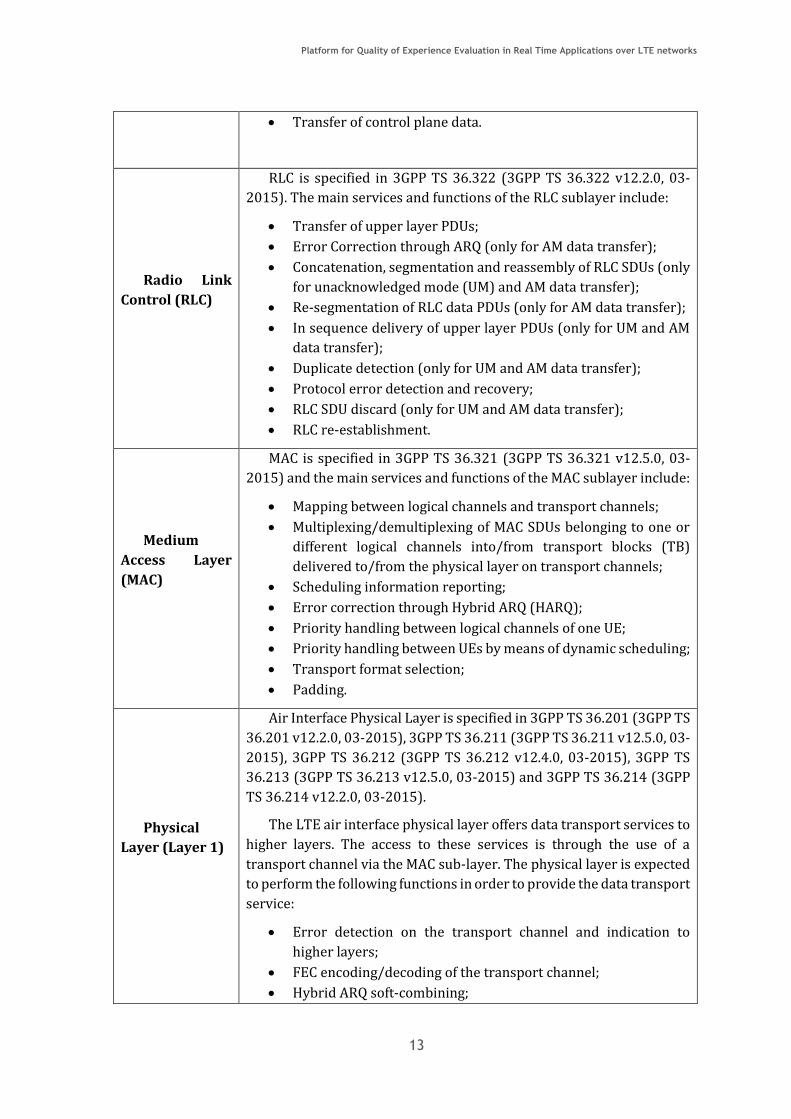
Transfer of control plane data.
Radio Link
Control (RLC)
RLC is specified in 3GPP TS 36.322 (3GPP TS 36.322 v12.2.0, 03-
2015). The main services and functions of the RLC sublayer include:
Transfer of upper layer PDUs;
Error Correction through ARQ (only for AM data transfer);
Concatenation, segmentation and reassembly of RLC SDUs (only
for unacknowledged mode (UM) and AM data transfer);
Re-segmentation of RLC data PDUs (only for AM data transfer);
In sequence delivery of upper layer PDUs (only for UM and AM
data transfer);
Duplicate detection (only for UM and AM data transfer);
Protocol error detection and recovery;
RLC SDU discard (only for UM and AM data transfer);
RLC re-establishment.
Medium
Access Layer
(MAC)
MAC is specified in 3GPP TS 36.321 (3GPP TS 36.321 v12.5.0, 03-
2015) and the main services and functions of the MAC sublayer include:
Mapping between logical channels and transport channels;
Multiplexing/demultiplexing of MAC SDUs belonging to one or
different logical channels into/from transport blocks (TB)
delivered to/from the physical layer on transport channels;
Scheduling information reporting;
Error correction through Hybrid ARQ (HARQ);
Priority handling between logical channels of one UE;
Priority handling between UEs by means of dynamic scheduling;
Transport format selection;
Padding.
Physical
Layer (Layer 1)
Air Interface Physical Layer is specified in 3GPP TS 36.201 (3GPP TS
36.201 v12.2.0, 03-2015), 3GPP TS 36.211 (3GPP TS 36.211 v12.5.0, 03-
2015), 3GPP TS 36.212 (3GPP TS 36.212 v12.4.0, 03-2015), 3GPP TS
36.213 (3GPP TS 36.213 v12.5.0, 03-2015) and 3GPP TS 36.214 (3GPP
TS 36.214 v12.2.0, 03-2015).
The LTE air interface physical layer offers data transport services to
higher layers. The access to these services is through the use of a
transport channel via the MAC sub-layer. The physical layer is expected
to perform the following functions in order to provide the data transport
service:
Error detection on the transport channel and indication to
higher layers;
FEC encoding/decoding of the transport channel;
Hybrid ARQ soft-combining;

Luis Pereira
14
Rate matching of the coded transport channel to physical
channels;
Mapping of the coded transport channel onto physical channels;
Power weighting of physical channels;
Modulation and demodulation of physical channels;
Frequency and time synchronisation;
Radio characteristics measurements and indication to higher
layers;
Multiple Input Multiple Output (MIMO) antenna processing;
Transmit Diversity (TX diversity);
Beamforming;
RF processing.
2.1.3 LTE network elements
The most relevant EPS architecture components are depicted in Table 2.
Table 2: EPS architecture components and their main features.
Component Security Features
UE
The User Equipment allows a user access to network services.
Ciphering, integrity and replay protection of NAS signalling;
Ciphering, integrity and replay protection of RRC signalling;
Ciphering of User Plane data at PDCP layer.
eNodeB
The evolved NodeB is a logical node responsible for radio transmission /
reception in one or more cells to/from the UE (also commonly called as LTE base
station).
Ciphering, integrity and replay protection of RRC signalling;
Ciphering of User Plane data at PDCP layer.
MME
The Mobility Management Entity is the key control-node for the LTE access-
network. The main security feature is ciphering, integrity and replay protection
of NAS signalling.
HSS/AuC
The Home Subscriber Server/Authentication Centre is a database that contains
user-related and subscriber-related information (3GPP, s.d.). It also provides
support functions in:
Mobility management;
Call and session setup;
User authentication and access authorization.
AAA Server
Provides authentication, authorization, policy control and routing
information to packet gateways. It performs EAP-SIM/AKA authentication of
Subscriber Identity Module (SIM) devices directly to the Home Location Register
(HLR)/HSS for a seamless and secure access to the networks.
Platform for Quality of Experience Evaluation in Real Time Applications over LTE networks
15
ePDG
The Evolved Packet Data Gateway is responsible for interworking between
the EPC and untrusted non-3GPP networks that require secure access, such as a
Wi-Fi, LTE metro, and femtocell access networks.
S-GW
The Serving Gateway is the point of interconnect between the radio-side and
the EPC. As its name indicates, this gateway serves the UE by routing the
incoming and outgoing IP packets. It is the anchor point for the intra-LTE mobility
(i.e. in case of handover between eNodeBs) and between LTE and other 3GPP
accesses (3GPP, s.d.).
PDN-GW
The Packet Data Network Gateway is the point of interconnect between the
EPC and the external IP networks, it routes packets to and from the PDNs. The
PDN GW also performs various functions such as IP address / IP prefix allocation
or Policy control and charging (3GPP, s.d.).
PCRF
The Policy and Charging Rules Function is responsible mainly for supporting
the detection of service data flow, the charging system based on this data flow,
and policy enforcement.
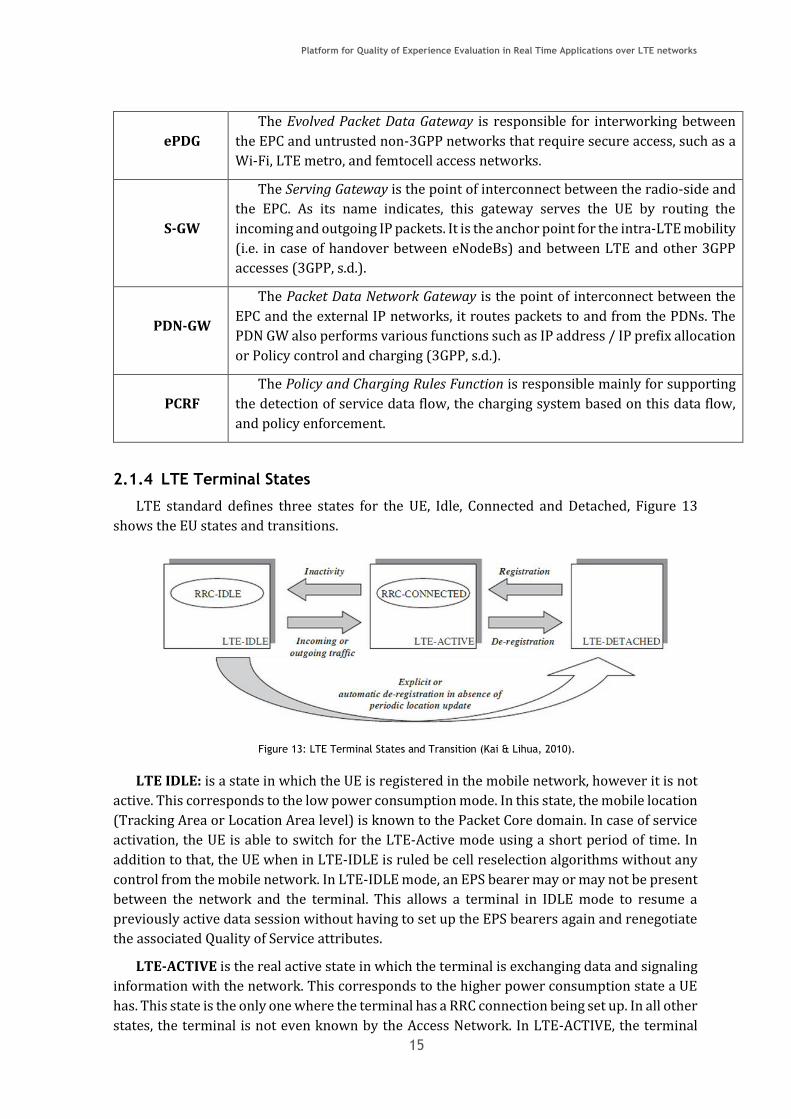
2.1.4 LTE Terminal States
LTE standard defines three states for the UE, Idle, Connected and Detached, Figure 13
shows the EU states and transitions.
Figure 13: LTE Terminal States and Transition (Kai & Lihua, 2010).
LTE IDLE: is a state in which the UE is registered in the mobile network, however it is not
active. This corresponds to the low power consumption mode. In this state, the mobile location
(Tracking Area or Location Area level) is known to the Packet Core domain. In case of service
activation, the UE is able to switch for the LTE-Active mode using a short period of time. In
addition to that, the UE when in LTE-IDLE is ruled be cell reselection algorithms without any
control from the mobile network. In LTE-IDLE mode, an EPS bearer may or may not be present
between the network and the terminal. This allows a terminal in IDLE mode to resume a
previously active data session without having to set up the EPS bearers again and renegotiate
the associated Quality of Service attributes.
LTE-ACTIVE is the real active state in which the terminal is exchanging data and signaling
information with the network. This corresponds to the higher power consumption state a UE
has. This state is the only one where the terminal has a RRC connection being set up. In all other
states, the terminal is not even known by the Access Network. In LTE-ACTIVE, the terminal

Luis Pereira
16
location is also more accurate as the network knows its current cell, and the terminal mobility
is ruled by the handover algorithms controlled by the network.
LTE-DETACHED corresponds to an initial state in which the UE is switched on but is not
yet registered in the mobile network. This could happen because the UE has not yet registered,
or because the registration has failed in the case when non suitable network is available.

Platform for Quality of Experience Evaluation in Real Time Applications over LTE networks
17
2.1.5 Link level and System level simulators
LTE, the current evolutionary step in the third Generation Partnership Project (3GPP)
roadmap for future wireless cellular systems, was introduced in 3GPP Release 8. Besides the
definition of the novel physical layer, LTE also contains many other remarkable innovations.
Most notable are (i) the redevelopment of the system architecture, now called System
Architecture Evolution (SAE), (ii) the definition of network self-organization, and (iii) the
introduction of home base-stations. The main reasons for these profound changes in the Radio
Access Network (RAN) system design are to provide higher spectral efficiency, lower delay
(latency), and greater multi-user flexibility than the currently deployed networks.
In the development and standardization of LTE, as well as in the implementation process
of equipment manufacturers, simulations are necessary to test and optimize algorithms and
procedures. This has to be carried out on the physical layer (link level) and in the network
(system level) context:
1) Link level simulations allow for the investigation of channel estimation, tracking, and
prediction algorithms, as well as synchronization algorithms; Multiple- Input Multiple-
Output (MIMO) gains; Adaptive Modulation and Coding (AMC); and feedback
techniques. Furthermore, receiver structures (typically neglecting inter-cell
interference and impact of scheduling, as this increases simulation complexity and
runtime dramatically), modelling of channel encoding and decoding, physical-layer
modelling crucial, for system level simulations, and the like, are typically analysed on
link level. Although MIMO techniques have been investigated quite extensively over the
past few years, there are still a lot of open questions that need to be resolved, both in
theory and in practical implementation. For example, LTE offers the flexibility to adjust
many transmission parameters, but it is not clear up to now how to exploit the available
Degrees of Freedom to achieve the optimum performance.
2) System level simulations focus more on network related issues, such as resource
allocation and scheduling, multi-user handling, mobility management, admission
control, interference management, and network planning optimization. Furthermore,
in a multi-user oriented system, such as LTE, it is not clear which figures of merit should
be used to assess the performance of the system. The classical measures of (un)coded
Bit Error Ratio (BER), (un)coded Block Error Ratio (BLER), and throughput are not
covering multi-user scenario properties. More comprehensive measures of the LTE
performance are, for example, fairness and multi-user diversity. However, these
theoretical concepts have to be mapped to performance values that can be evaluated
by means of simulations. Around the world, many research facilities and vendors are
investigating the above mentioned aspects of LTE. For that purpose, commercially
available simulators applied in industry, as well as simulators applied in academia,
have been developed. Also, probably all major equipment vendors have implemented
their own, proprietary simulators. Regardless of the simulation tools being
commercial/non-commercial, the development framework (C, C++, MATLAB, WM-
SIM,...), or their claimed performance/flexibility, one fact is shared by all of the
simulators: their closed implementation disables access to implementation details and
thus to any assumption that may have been included. As such, the reliability of the
results relies purely on the faith of a proper implementation. Independent validation of
results in such closed simulation environments is not easy, very time-consuming, and

Luis Pereira
18
often not feasible. Since the results were obtained with closed tools, simply repeating
the same experiment is a daunting task.
2.2 Overview on the main LTE Simulators
This section is a survey of available software simulation tools for the LTE cellular system
and related 3GPP protocols. The main technical characteristics and features are described and
compared. This study is important to establish a benchmark for the Green-T LTE protocol
simulator and for the definition of an up-to-date list of system requirements.
2.2.1 Metrifly
The Metrifly tool (Metrifly, s.d.) allows to analyse network performance from user devices,
and store it in the cloud, to show what is happening on user’s networks, the actual coverage,
and the quality customers see. This tools covers the entire performance analysis cycle, from
collection to evaluation.
2.2.1.1 Key features (from (Metrifly, s.d.)):
Measure wireless networks: the client application provides on-demand measurement
of several performance indicators for the current Wi-Fi and Mobile networks;
Report to the Cloud: measurements are securely reported to the cloud platform, where
they are processed and aggregated into consistent data sets taking into account access
points, cells, and locations and network conditions;
Analyse in Real Time: the collected measurements are available for detailed analysis on
the cloud platform, allowing detailed performance comparison of different carrier
networks, locations, or access points, through visual tools like charts or tables.
Wireless metrics on the fly with Wi-Fi, 3G and 4G support
2.2.2 Technical University of Vienna LTE based system simulator
Technical University (TU) of Wien, developed a LTE system level simulator based on
MATLAB [1]. In (Ikuno, Wrulich, & Rupp, 2010) is referred that “The LTE system level
simulator implementation offers a high degree of flexibility. Extensive use of the Object-
oriented programming (OOP) capabilities of MATLAB, introduced with the 2008a Release have
been made for the implementation. Having a modular code, with a clear structure based in
objects, results in a much more organized, understandable and maintainable simulator
structure, in which new functionalities and algorithms can be easily added and tested”.
The simulator is freely available on the internet (Vienna University of Technology, s.d.)
under an open license, free for non-commercial academic use, which facilitates research and
enables a closer cooperation between universities and research facilities.
The Figure 14 depicts a schematic block diagram of the LTE system-level simulator.
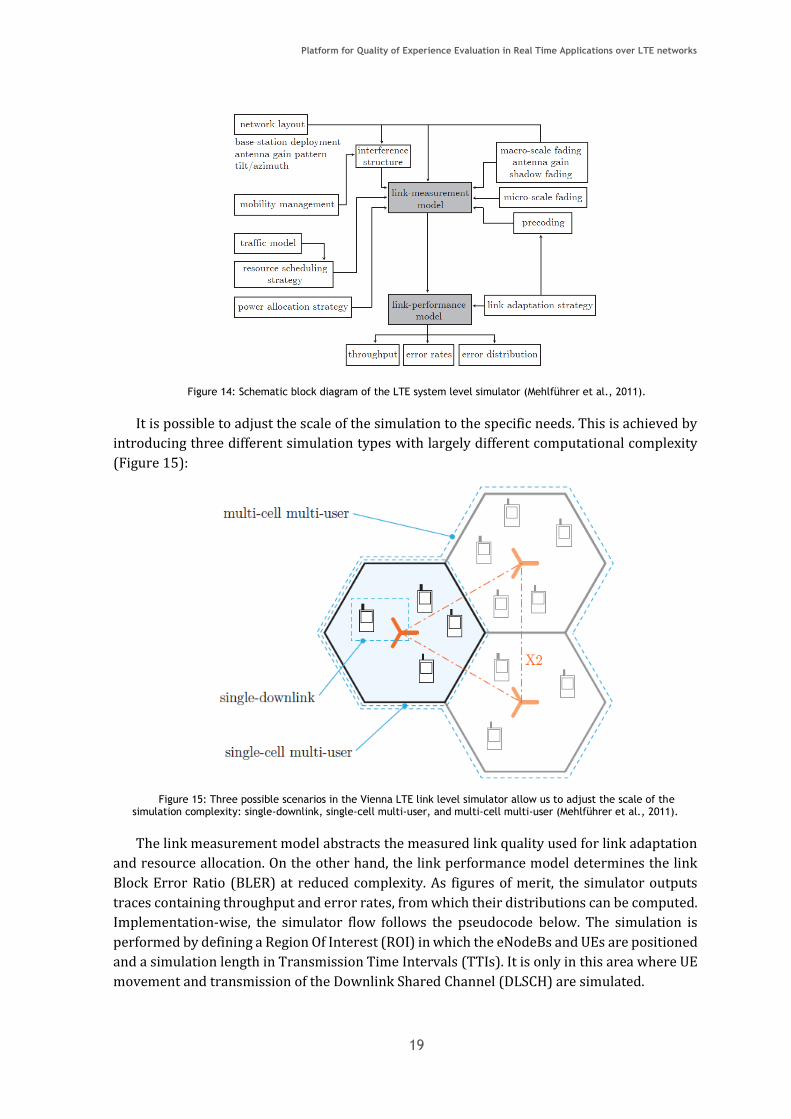
Platform for Quality of Experience Evaluation in Real Time Applications over LTE networks
19
Figure 14: Schematic block diagram of the LTE system level simulator (Mehlführer et al., 2011).
It is possible to adjust the scale of the simulation to the specific needs. This is achieved by
introducing three different simulation types with largely different computational complexity
(Figure 15):
Figure 15: Three possible scenarios in the Vienna LTE link level simulator allow us to adjust the scale of the simulation complexity: single-downlink, single-cell multi-user, and multi-cell multi-user (Mehlführer et al., 2011).
The link measurement model abstracts the measured link quality used for link adaptation
and resource allocation. On the other hand, the link performance model determines the link
Block Error Ratio (BLER) at reduced complexity. As figures of merit, the simulator outputs
traces containing throughput and error rates, from which their distributions can be computed.
Implementation-wise, the simulator flow follows the pseudocode below. The simulation is
performed by defining a Region Of Interest (ROI) in which the eNodeBs and UEs are positioned
and a simulation length in Transmission Time Intervals (TTIs). It is only in this area where UE
movement and transmission of the Downlink Shared Channel (DLSCH) are simulated.

Luis Pereira
20
2.2.2.1 Link measurement model
The System Level Simulator in order to abstract the measured link quality uses the Signal
to Interference and Noise Ratio (SINR) as metric; specifically, a per subcarrier post-
equalization symbol SINR as described in (Ikuno, Wrulich, & Rupp, 2010): “The link
measurement model abstracts the measurements for link adaptation and resource allocation
and aims at reducing run-time computational complexity by pre-generating as many
parameters needed as possible. This shifts most of the computational burden to an off-line task
that pre-generates and stores the results in trace files that can be (re-)used at simulation time.
Special care has been taken as to account for the spatial and time correlation of the channel
present in a wireless cellular system. To this effect, the link quality model has been split into
three parts, which are afterwards combined to obtain post-equalization symbol SINR
expressions: (i) macroscopic pathloss, (ii) shadow fading, and (iii) small-scale fading (SISO and
MIMO).”
2.2.2.2 Path loss vs. distance in terms of model used
In the same document, (Ikuno, Wrulich, & Rupp, 2010), is also described how the simulato
handles the relation between the pathloss and the distance between a UE and a eNodeB: “The
macroscopic pathloss between an eNodeB sector and UE is used to jointly model both the
propagation pathloss due to the distance and the antenna gain. It is noted as LM,bi,uj , where
bi denotes the i-th transmitter: 0 for the attached eNodeB (desired signal) and 1, . . . , Nint for
the Nint interfering eNodeBs and uj the j-th UE, which then determines the (x, y) position. It is
implemented as a pathloss map that can be computed once and, as long as the network layout
is kept the same, be reused. The map specifies for each point in the simulated ROI the
macroscopic pathloss between any point (x, y) and each transmitter.”
2.2.2.3 Shadowing
In (Ikuno, Wrulich, & Rupp, 2010) the shadowing is defined as: “Shadow fading, LS,bi,uj , is
caused by obstacles in the propagation path between the UE and the eNodeB and can be
interpreted as the irregularities of the geographical characteristics of the terrain introduced
with respect to the average pathloss obtained from the macroscopic pathloss model. It is
typically approximated by a log-normal distribution of mean 0 dB and standard deviation 10
dB” and in the same article is also described how the simulator handles with the shadowing.
2.2.2.4 Channel modelling
The LTE System-Level Simulator takes a special attention to the Channel modelling during
simulations and (Ikuno, Wrulich, & Rupp, 2010) has the following description for the Channel
modelling: “While the losses caused by the macroscopic pathloss and the shadow fading are
position-dependent and time-invariant, small-scale fading is modeled as a time-dependent
process (Mehlführer et al., 2011). For each of the modeled MIMO transmission modes
(Transmission Diversity (TxD) and Open Loop Spatial Multiplexing (OLSM)), a model based on
a simple Zero Forcing (ZF) receiver has been developed. As of this version, systems with two
transmit antennas have been modeled, but the derived SINR expressions can be easily
extended for the LTE transmit modes using four antenna ports. Based on the derived models,
a trace of fading parameters modeling the time-and-frequency variant behavior of the channel
has been generated. These fading-parameters furthermore allow for a generation prior to the
system level simulation itself, which reduces the run-time computational complexity
significantly. The channel modeling aims at computing a per-layer SINR. In LTE, a spatial layer

Platform for Quality of Experience Evaluation in Real Time Applications over LTE networks
21
is the term used for the different streams generated by spatial multiplexing. A layer thus can
be described as a mapping of symbols onto the transmit antenna ports. Each layer is then
identified by a (precoding) vector of size equal to the number of transmit antenna ports.”
2.2.2.5 Use cases and demonstration results
In this section we present use cases for LTE SISO and MIMO networks using TxD or OLSM
transmit modes and offered for free under an academic, non-commercial use license. The main
purpose of this tool is to assess the network performance increase of new scheduling
algorithms.
Testing Fractional Frequency Reuse (FFR) strategies implemented at the scheduler level,
as well as the network impact of different receiver types and channel quality feedback
strategies, provided accurate modeling of those, can also be tested. SINR optimization via
electrical and mechanical tilting and with pathloss maps imported from network planning tools
can also be easily added, thus enabling validation simulations against network planning tools,
which usually use an even more abstract modeling of the physical layer.
The availability of its source code allows its results to be cross-checked and validated and
researchers to compare algorithms in a standardized system. Together with the LTE link-level
simulator, it forms, to the best of the authors’ knowledge, the only link-and-system LTE
simulation suite openly available for research purposes. Illustrative results of the LTE system
simulator are depicted below.
Figure 16: UE and cell throughput CDFs: TxD and OLSM, max C/I and round robin schedulers (Mehlführer et al., 2011).
Luis Pereira
22
Figure 17: Sector SINR, calculated with distance dependent macroscale pathloss only (left) and additional lognormal-distributed space-correlated shadow fading (right) (Mehlführer et al., 2011).
The Simulators of the University of Vienna LTE consist of a link level and a system level
simulator. Both simulators are available under a non-commercial open source academic-use
license and thereby enable researchers to implement and test algorithms in the context of LTE.
The open source availability of the simulators facilitates researchers to reproduce published
results in the context of LTE, and thus supports the comparison of novel algorithms with
previous state-of the-art.
2.2.3 LTE eNB Emulator – NPT3081
The NPT3081 protocol development and test system for LTE (EikoSeidel, 2008) is
described in (NOMOR research) as an “eNodeB emulator, designed specifically to meet the
needs of design teams who want to develop and optimize LTE protocol software. It provides
an implementation of the eNodeB protocol stack with a detailed physical layer emulation in
realistic multi-cell, multi-user environment. Unlike usual conformance test systems that rely
on a complete design before carrying out first tests, the NPT3081 supports network
development with traffic sources, test scenarios and network peer entities from the very first
day of the design phase.
While not being a highly expensive and complex conformance test tool, the NPT3081 can
be used as PC based development environment by the software engineers for various
purposes.”
2.2.3.1 Features
Peer network entity to generate and process bit exact PDCP, RLC and MAC packets;
Initial test environment that generates error messages and various statistics of the
data transfer (e.g. bit rates, error rates, delay, retransmission rates);
Load generator for different eNodeB scheduler and different network load and
traffic sources;
Optimization of vendor specific UE algorithms (e.g. uplink logical channel
multiplexing).
The NPT3081 is a suitable tool to facilitate protocol development for mobile devices.
Develop, verify and test the MAC, RLC, PDCP and RRC protocol stack without actual availability
Platform for Quality of Experience Evaluation in Real Time Applications over LTE networks
23
of RF (Radio frequency) hardware and lower layer DSP (Digital Signal Processing) software.
This makes it the perfect environment to start LTE protocol development, do initial testing and
for protocol optimisation later on.
Figure 18 below illustrates a realisation where a customized PHY/MAC API allows the
exchange of packets and lower layer primitives between emulator and protocol
implementation.
Figure 18: Test setup example for UE protocol stack development (EikoSeidel, 2008).
Alternatively network interfaces (such as S1-u or S1-c) can also be used for message
exchange and testing.
Key Features:
LTE specification compliant protocol stack (MAC, RLC, PDCP, RRC);
Detailed PHY (Physical Layer) emulation;
Realistic system load in multi-cell and multi-user environment;
Bit-exact packet exchange via API’s;
Easily configurable set of scenarios;
Various data and error logs;
Quasi real-time capability allows connection to target hardware;
Testing/optimisation with live applications possible.
2.2.3.2 Summary
The verification and test process is supported by data and error log files. The data log file,
on the one hand, continuously provides side information for downlink and uplink transmission
and the error log file, on the other hand, traces warnings and errors which occurred during a
test run. Additionally various statistics can be captured the support the optimization process.
Luis Pereira
24
2.2.4 Steepest Ascent 3G Evolution Lab - LTE Toolbox and Blockset
Steepest Ascent's software product portfolio consists of a set of Communication and DSP
simulation libraries ( The MathWorks, Inc, s.d.). The software products are offered across
various platforms including The MathWorks MATLAB® and Simulink®, and Agilent
SystemVue®.
Figure 19: Communications Standards Libraries ( The MathWorks, Inc, s.d.).
2.2.4.1 3G Evolution Lab - LTE Toolbox and Blockset
3G Evolution Lab - LTE Toolbox and LTE Blockset for The MathWorks MATLAB® and
Simulink® is a comprehensive physical layer simulation Toolbox for the uplink and downlink
of Release 8 (v8.8.0/v8.9.0) of the 3GPP Evolved Universal Terrestrial Radio Access (E-UTRA)
standard. The library accelerates PHY algorithms development, supports golden reference
verification and enables custom test & measurement waveform generation.
It provides models to perform channel coding/decoding and modulation/demodulation
operations implementing the full physical layer transmit/receive processing chain, from
transport channels and control information to OFDM and SC-FDMA modulated waveforms.
Receive models are available to recover the transmitted signals. Full two- and four-antenna
MIMO layering and pre-coding are supported.
2.2.4.2 Product Overview
The toolbox features functions to perform channel coding/decoding and
modulation/demodulation operations implementing the full physical layer transmit/receive
processing chain, from transport channels and control information to OFDM and SC-FDMA
modulated waveforms. Receive models are offered to recover the transmitted signals. Channel
coding for transport channels and control information is available for uplink and downlink.
Test Models and Reference Measurement Channel (RMCs) waveform generators are available
to easily generate reference waveforms.
The current version supports v8.8.0/v8.9.0 of the 3GPP TS36.21x standard series. The
Steepest Ascent development roadmap includes tracking compliance from Release 8 through
Release 10 and beyond.
Platform for Quality of Experience Evaluation in Real Time Applications over LTE networks
25
2.2.4.3 Simulation Platforms
a) LTE Toolbox: The MathWorks MATLAB® (R2006b or later; Windows 32 & 64 Bit,
Linux 64 Bit)
The LTE Toolbox for MATLAB provides a comprehensive set of tools for LTE physical layer
verification, algorithm development and conformance testing. It offers a full set of functions for
the latest Release 8 LTE standard including uplink, downlink and propagation channels. The
toolbox creates an environment compliant and performing with the LTE standard.
The LTE Toolbox also includes GUI (graphical user interface) based tools for the creation
of Reference Measurement Channels and Test Model data sources to drive conformance tests.
The set of command-line functions span a range of granularity from complete channel
processing in a single function call to individual commands for the various coding stages to
allow for pin-point design verification. A range of receiver algorithms are provided including
synchronization, MIMO channel estimation, ZF (Zero Forcing equalizer) and MMSE (Minimum
Mean Square Error) equalization.
b) LTE Blockset: The MathWorks Simulink®
The LTE Blockset for The MathWorks Simulink® offers a complete set of models for LTE
physical layer design, simulation and verification. In conjunction with Simulink, the Blockset
provides an interactive graphical platform to accelerate LTE PHY design and test.
2.2.4.4 Trial Version & Datasheet
a) LTE Toolbox Trial v3.5.2 (Windows version x86 and x64; Linux 64 bit);
b) LTE Toolbox Blockset Leaflet v2.0;
c) LTE Toolbox v3.5 Datasheet v3.5.
*Trialware support: upon installation a 14 day evaluation license is offered, sent by email.
In the Trial version all LTE Toolbox functions are supplied as P-code and there are a number
of parameter limitations, most notably, only a fixed number of non-standard bandwidths are
enabled. These Trial versions are not intended for existing customers. Requires MATLAB
R2006b or later. The architecture (32/64 bit) of the Toolbox must match that of the MATLAB
installation.
2.2.4.5 Key Features
Comprehensive set of functions modeling the LTE physical layer transmit and
receive processing;
3GPP Release 8 E-UTRA physical layer implementation conforming to TS 36.211
(3GPP TS 36.211 v12.5.0, 03-2015), TS 36.212 (3GPP TS 36.212 v12.4.0, 03-2015)
and TS 36.213 (3GPP TS 36.213 v12.5.0, 03-2015);
Extensive help, background documentation and demo set including HARQ (Hybrid
automatic repeat request) BER, MIMO channel estimation and reception, and
conformance test example;
Supports HARQ process modeling;
Supports FDD (Frequency Division Duplex) and TDD (Time Division Duplex)
duplexing mode;
Downlink and uplink support;

Luis Pereira
26
Standard compliant propagation channel models (EPA, EVA, ETU, Moving, HST);
Complete support for 1, 2 and 4 antenna transmissions including all MIMO layering
and precoding options;
Full control of all parameters via MATLAB / Extensible MATLAB language features;
Full DCI (Downlink Control Information) message creation and control region
building and decoding;
All physical layer steps available as individual functions / blocks:
o Transport channel coding / decoding;
o Scrambling / descrambling;
o Symbol Modulation / demapping;
o Resource element mapping;
o OFDM and SC-FDMA.
2.2.4.6 Steepest Ascent Wireless Communications Standards Libraries
Mobile and wireless communications standards toolboxes and blocksets.
Highlights
Standard-compliant physical layer simulations
Golden reference waveform generation
Custom test and measurement waveform generation
Accelerated PHY algorithm development
Fully configurable physical layer parameters
Downlink Functions
Grid View – Graphical access to toolbox functions using populated sub-frame resource grid
as reference.
Platform for Quality of Experience Evaluation in Real Time Applications over LTE networks
27
Figure 20: Physical Channels ( The MathWorks, Inc, s.d.).
Figure 21: Physical Signals ( The MathWorks, Inc, s.d.).
Luis Pereira
28
Block view – Graphical access to toolbox functions using block diagrams of processing
chains for transport channel coding and physical channel modulation.
Figure 22: Downlink Shared Channel Functions ( The MathWorks, Inc, s.d.).
Uplink Functions
Grid View – Graphical access to toolbox functions using populated sub-frame resource grid
as reference:
Figure 23: Physical Channels & Signals ( The MathWorks, Inc, s.d.).
Platform for Quality of Experience Evaluation in Real Time Applications over LTE networks
29
Block view – Graphical access to toolbox functions using block diagrams of processing
chains for transport channel coding and physical channel modulation:
Figure 24: Physical Uplink Shared Channel Functions ( The MathWorks, Inc, s.d.).
Conclusions
Steepest Ascent offers a range of toolboxes and blocksets for simulating the PHY layer of
several digital communications standards, with libraries for WCDMA (Wideband Code Division
Multiple Access)/UMTS (Universal Mobile Telecommunications System), HSxPA and 3GPP
LTE. All functions and blocks are fully parameterizable. A user-friendly and powerful graphical
user interface (GUI) enables the designer to easily visualize and control complex parameter
structures in Simulink® blocks.
2.2.5 Polaris Networks
Polaris Networks was started in 2003 by a group of former Agilent Technologies
employees, with a focus on Networking Protocol Software, particularly Wireless Protocol Test
Tools. Since then, Polaris Networks has developed a wide range of test tools and
communication gateways that are actively used by Network Equipment Manufacturers, Service
Providers and Test Labs across the world. As a member of several industry organizations in
the communications arena, Polaris has gained a reputation for promoting the adoption of new
technologies such as WiFi, WiMAX, RFID and LTE right from the draft specification to
deployment (Polaris Networks, s.d.). The two main tools regarding LTE provided by Polaris
Networks: EPC Emulator Test Tools and eNodeB Functional Tester, a brief description on each
tool is given in the next sections below.
Luis Pereira
30
2.2.5.1 EPC Emulator Test Tools
The LTE EPC Emulators (Polaris Networks, 2015) from Polaris Networks offers a low-cost
alternative to replace real EPC elements (MME, S-GW, PDN-GW) in the lab. The EPC emulators
allow testing in a variety of network topologies thereby allowing effective utilization of lab
equipment, reduction in capital expenditure and ongoing support costs associated with a test
lab.
The EPC Emulators consist of the MME Emulator, SGW Emulator and the PDN-GW
Emulator, which can be used together to simulate the complete LTE Packet Core or individually
to create a combination of real and simulated Core Network elements. These Emulators
includes all the network interfaces and implements all the communication protocols required
for core network equipment to operate in an LTE/SAE (System Architecture Evolution)
network. The MME Emulator includes a built-in HSS and the PDN-GW Emulator includes a
built-in PCRF Function.
Compared to real core network equipment, the EPC emulators provide greater control to
simulate field network conditions in the lab and can thereby be used for testing functionality,
scalability and performance of LTE base stations.
The EPC Emulators can also be used along with the LTE eNodeB Emulator from Polaris for
an end-to-end simulation of LTE network on a PC.
Features
Emulator and not simulador;
Capable of simulating multiple nodes using single Emulator;
Tests failure scenarios;
User-friendly GUI;
Tests features like S1-Flex;
Scripting interface for test automation.
2.2.5.2 eNodeB Functional Tester
The LTE eNodeB Functional Tester (FT) (Polaris Networks, 2014) provides a wrap-around
test solution for LTE base stations by emulating all the LTE network elements surrounding the
base station (System Under Test). The Tester emulates an LTE UE, MME and SGW to test both
the LTE-Uu radio interface and the S1 interfaces of an eNodeB. The tester also emulates an
eNodeB entity to test the eNodeB-to-eNodeB interaction over the X2 logical interface.
The eNodeB FT tests the correctness of the implementation according to 3GPP standards,
TS 36.321 (3GPP TS 36.321 v12.5.0, 03-2015) (MAC), TS 36.322 (3GPP TS 36.322 v12.2.0, 03-
2015) (RLC), TS 36.323 (3GPP TS 36.323 v12.3.0, 03-2015) (PDCP), TS 36.331 (3GPP TS 36.331
v12.5.0, 03-2015) (RRC), TS 36.413 (3GPP TS 36.413 v12.5.0, 03-2015) (S1AP), TS 36.423
(3GPPTS 36.423 v12.5.0, 03-2015) (X2AP) and other related standards.
eNodeB FT is designed to verify the behaviour of the eNodeB under test by creating
different test scenarios of control message exchanges. Polaris Networks has defined the
functional test cases for eNodeB testing to cover all aspects of the operations of an eNodeB.
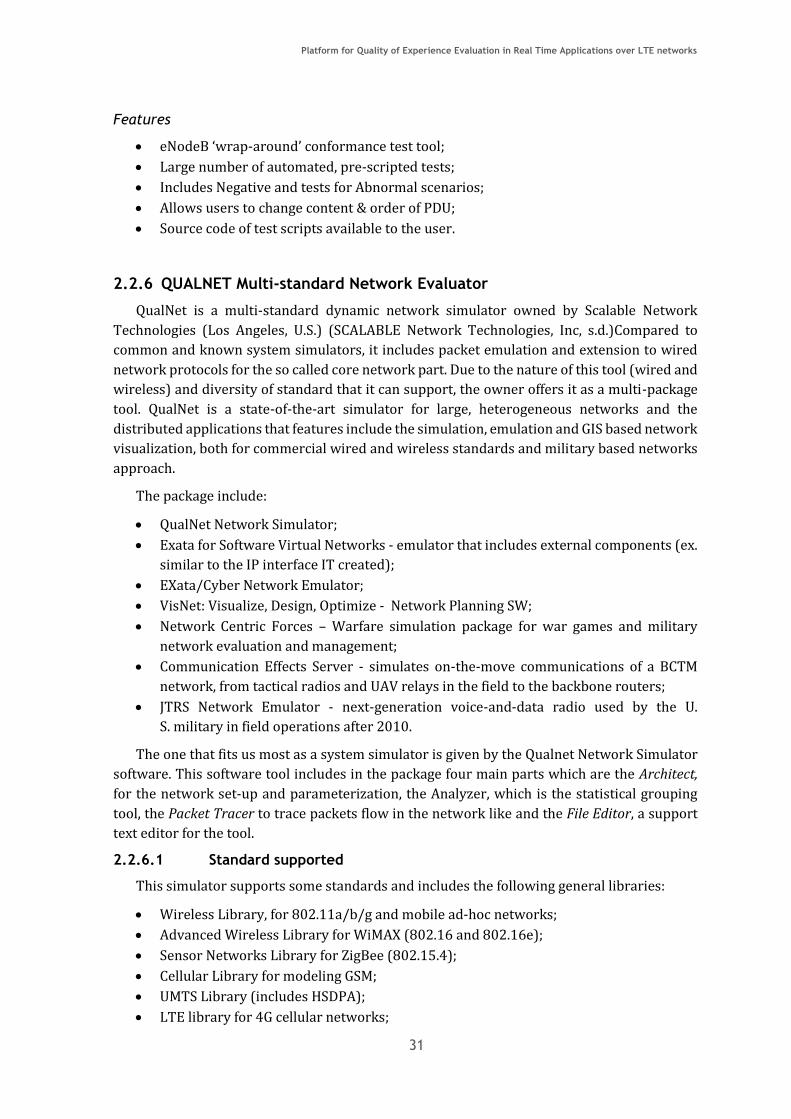
Platform for Quality of Experience Evaluation in Real Time Applications over LTE networks
31
Features
eNodeB ‘wrap-around’ conformance test tool;
Large number of automated, pre-scripted tests;
Includes Negative and tests for Abnormal scenarios;
Allows users to change content & order of PDU;
Source code of test scripts available to the user.
2.2.6 QUALNET Multi-standard Network Evaluator
QualNet is a multi-standard dynamic network simulator owned by Scalable Network
Technologies (Los Angeles, U.S.) (SCALABLE Network Technologies, Inc, s.d.)Compared to
common and known system simulators, it includes packet emulation and extension to wired
network protocols for the so called core network part. Due to the nature of this tool (wired and
wireless) and diversity of standard that it can support, the owner offers it as a multi-package
tool. QualNet is a state-of-the-art simulator for large, heterogeneous networks and the
distributed applications that features include the simulation, emulation and GIS based network
visualization, both for commercial wired and wireless standards and military based networks
approach.
The package include:
QualNet Network Simulator;
Exata for Software Virtual Networks - emulator that includes external components (ex.
similar to the IP interface IT created);
EXata/Cyber Network Emulator;
VisNet: Visualize, Design, Optimize - Network Planning SW;
Network Centric Forces – Warfare simulation package for war games and military
network evaluation and management;
Communication Effects Server - simulates on-the-move communications of a BCTM
network, from tactical radios and UAV relays in the field to the backbone routers;
JTRS Network Emulator - next-generation voice-and-data radio used by the U.
S. military in field operations after 2010.
The one that fits us most as a system simulator is given by the Qualnet Network Simulator
software. This software tool includes in the package four main parts which are the Architect,
for the network set-up and parameterization, the Analyzer, which is the statistical grouping
tool, the Packet Tracer to trace packets flow in the network like and the File Editor, a support
text editor for the tool.
2.2.6.1 Standard supported
This simulator supports some standards and includes the following general libraries:
Wireless Library, for 802.11a/b/g and mobile ad-hoc networks;
Advanced Wireless Library for WiMAX (802.16 and 802.16e);
Sensor Networks Library for ZigBee (802.15.4);
Cellular Library for modeling GSM;
UMTS Library (includes HSDPA);
LTE library for 4G cellular networks;

Luis Pereira
32
Developer Library;
Multimedia and Enterprise Library;
Standard Interfaces library for integrating QualNet to a number of complementary
simulators via HLA (High Level Architecture) or DIS (Distributed Interactive
Simulation);
Satellite Library for modeling satellites and ground nodes;
Stand-alone Propagation Library;
Urban for urban and suburban path loss and terrain effects;
Including ALE (Automatic Link Establishment)/ASAPS for military radio (unmanned
air);
TIREM (Terrain Integrated Rough Earth Model) for terrain and propagation effects
based on the Terrain Integrated Rough Earth Model.
2.2.6.2 Channel models
The simulator includes the following channel models:
Free-Space Air-to-Air Model the situation when both nodes are located above the
horizon of an urban canyon;
COST231 Walfish-Ikegami Model when one node is located in an urban canyon and the
other is located at heights comparable to building heights. Variants for both LoS and
NLoS communication are available;
Street Microcell Model when nodes are located in adjacent streets in an urban canyon;
Street Mobile-to-Mobile Model: calculates path loss between the source and destination
pairs communicating across several building obstacles;
COST231 Hata Model: large cell size (larger than 1 km), and works for small to medium
sized cities, large cities, suburban areas, and open rural areas.
2.2.6.3 Results
The results are obtained through the Statistical Analyzer. From the number of
measurements and performance results that can be obtained by the simulator we present
number of Handovers and number of Blocks received during the simulator.
Platform for Quality of Experience Evaluation in Real Time Applications over LTE networks
33
Figure 25: Qualnet Number of Handover results (SCALABLE Network Technologies, Inc, s.d.).
2.2.7 IXIA LTE UEs emulator
Ixia provides application performance and security resilience solutions to validate, secure,
and optimize businesses’ physical and virtual networks. Enterprises, service providers,
network equipment manufacturers, and governments worldwide rely on Ixia’s solutions to
deploy new technologies and achieve efficient, secure, ongoing operation of their networks.
Ixia's powerful and versatile solutions, expert global support, and professional services equip
organizations to exceed customer expectations and achieve better business outcomes (Ixia,
s.d.). This section will provide an overview of the IxLoad tool.
2.2.7.1 Overall description
An Overall description of the IxLoad is given in (IXIA, 2013): “IxLoad Access (IXIA product
(Ixia, s.d.)) provides complex, realistic user equipment (UE) modeling and emulation against
LTE eNodeBs for performance, scalability and service validation testing. It is a full-featured
layer 4-7 test application that provides real-world traffic emulation of voice, video, and data
services to test wireless networks and components. IxLoad simultaneously emulates multiple
layer 7 protocol activities, making it perfect for testing new rich media services, QoS and policy
control mechanisms, and VoLTE systems. Network equipment vendors can use IxLoad Access
to test eNodeBs standalone, while mobile operators can test end-to-end with a complete LTE
network.”
IxLoad Access is a powerful but easy-to-use solution for comprehensive performance
testing of all aspects of LTE base stations. It is not necessary to be a protocol expert to develop
test realism using IxLoad's real world subscriber modeling. From a single application, testers
can perform capacity tests, detail a devices throughput, measure voice and video quality, model
a wide variety of mobility scenarios, and much more Ixia's IxLoad Access has a modular system
design that provides best-in-industry scalability for high capacity testing.

Luis Pereira
34
The eNodeB is the new radio base station for LTE access networks. It is the lynch pin in
delivering the 3GPP's objective of improved radio spectrum efficiency to provide increased
capacity and enhanced data rates. The eNodeB plays a fundamental role in managing traffic on
the network and fulfilling the quality of experience (QoE) requirements of mobile subscribers.
To meet QoE expectations, the eNodeB performs radio resource scheduling and
uplink/downlink rate limiting to enforce policy decisions and QoS characteristics associated to
different service and subscriber types on the network.
Figure 26: Typical lxload access test configuration (Ixia, s.d.).
eNodeB testing involves validating multiple levels, including:
Physical, protocol, and application layer functionality;
User and control plane capacity and throughput;
Handover functionality and performance;
Policy management and QoS mechanisms for converged voice, video, and data traffic;
Security vulnerability assessment.
IxLoad offers the industry's most comprehensive LTE access test solution, measuring all
aspects of eNodeB base station capacity and performance. The test architecture is designed to
scale to thousands of simulated UEs (smartphones and tablets). It has the flexibility to perform
application layer testing, and supports complex LTE handover scenarios. To test policy
management and QoS mechanisms, Ixia's LTE access test solution includes Ixia's leading
service quality validation that uses both mobile subscriber modeling and advanced QoE
measurements. Ixia's LTE access solution allows users to:
Verify there is reliable radio link between mobile subscribers and the network;
Maximize total cell/sector throughput;
Maximize the number of subscribers within a cell/sector;
Test the control (signalling) plane performance of eNodeBs;
Test complex handover scenarios;
Perform service quality validation with subscriber modelling, multiplay voice, video,
and data traffic generation, and QoE measurement.
Subscriber models
Multiple UE ranges each with UE specific properties;
Voice, video, and data traffic types with QoE and QoS measurements;
Complex signaling operation including Attach, Detach, Handover, TAU (Tracking Area
Update) and Idle Mode operation;

Platform for Quality of Experience Evaluation in Real Time Applications over LTE networks
35
All LTE Inter and Intra-eNodeB HO (Handover) supported across all connected sectors.
LTE Compliance
UE Category 1 – 4;
UE Category 5 under 2x2 MIMO;
FDD and TDD;
All 3GPP R8 2009 specifications;
3GPP R9 June and December 2010 specifications;
All LTE FDD and TDD Frequency Bands;
All TDD configurations and SSF configurations;
Transmission modes; SISO, Tx Diversity, 2x2 MIMO and Beamforming;
5, 10, 15, 20 MHz Channel Bandwidth Support;
QPSK, 1 6QAM and 64QAM Modulation schemes;
NAS Compression and Ciphering;
Full DL/UL HARQ Capability;
Semi-Persistent Scheduling;
UE Power Control, Group Hopping;
Frequency Hopping Modes 0, 2, 4;
Automatic configuration of MIB/SIB parameters.
Capacity/Performance
400 connected UEs per sector with traffic;
1 100 Connected and Idle UEs per sector;
Full Capacity Throughput per sector (up to 150Mbps DL, 75Mbps UL);
Up to 6 sectors;
16/10 DL/UL UEs/TTI (Transmission Time interval);
Maximum single UE performance at 80/50 Mbps DL/UL.
Control Plane
3GPP TS 24.301 (3GPP TS 24.301, 12-2013) Non-Access-Stratum (NAS) protocol for
Evolved Packet System (EPS);
3GPP TS 36.331 (3GPP TS 36.331 v12.5.0, 03-2015) Radio Resource Control (RRC);
Protocol specification;
3GPP TS 36.323 (3GPP TS 36.323 v12.3.0, 03-2015) Packet Data Convergence Protocol
(PDCP) specification;
3GPP TS 36.322 (3GPP TS 36.322 v12.2.0, 03-2015) Radio Link Control (RLC) protocol
specification;
3GPP TS 36.321 (3GPP TS 36.321 v12.5.0, 03-2015) Medium Access Control (MAC)
protocol specification;
3GPP TS 36.211 (3GPP TS 36.211 v12.5.0, 03-2015) Physical Channels and Modulation;
3GPP TS 36.212 (3GPP TS 36.212 v12.4.0, 03-2015) Multiplexing and channel coding;
3GPP TS 36.213 (3GPP TS 36.213 v12.5.0, 03-2015) Physical layer procedures;

Luis Pereira
36
User Plane
HTTP
FTP
HTTP Streaming
VoLTE
All layer 7 protocols listed above are true stateful emulations that can interact with real
network devices.
2.2.7.2 Statistics and Measurements
All statistics and measurements listed below are available in real time, as well as in comma
separated value (CSV) format at the end of a test.
Figure 27: Statistics displayed in real time during a test.
Network Overview statistics
Table 3: Network Overview statistics.
Statistics Description
Sessions Initiated Number of UE sessions started over the whole test
Sessions Succeeded Number of UE sessions succeeded over the whole test
Sessions Failed Number of UE sessions failed over the whole test
Per-Sector UE statistics
Table 4: Per-Sector UE statistics.
Statistics Description
Current Dedicated Bearer Count The current number of dedicated bearers
Sessions Initiated Count The total number of UE sessions started
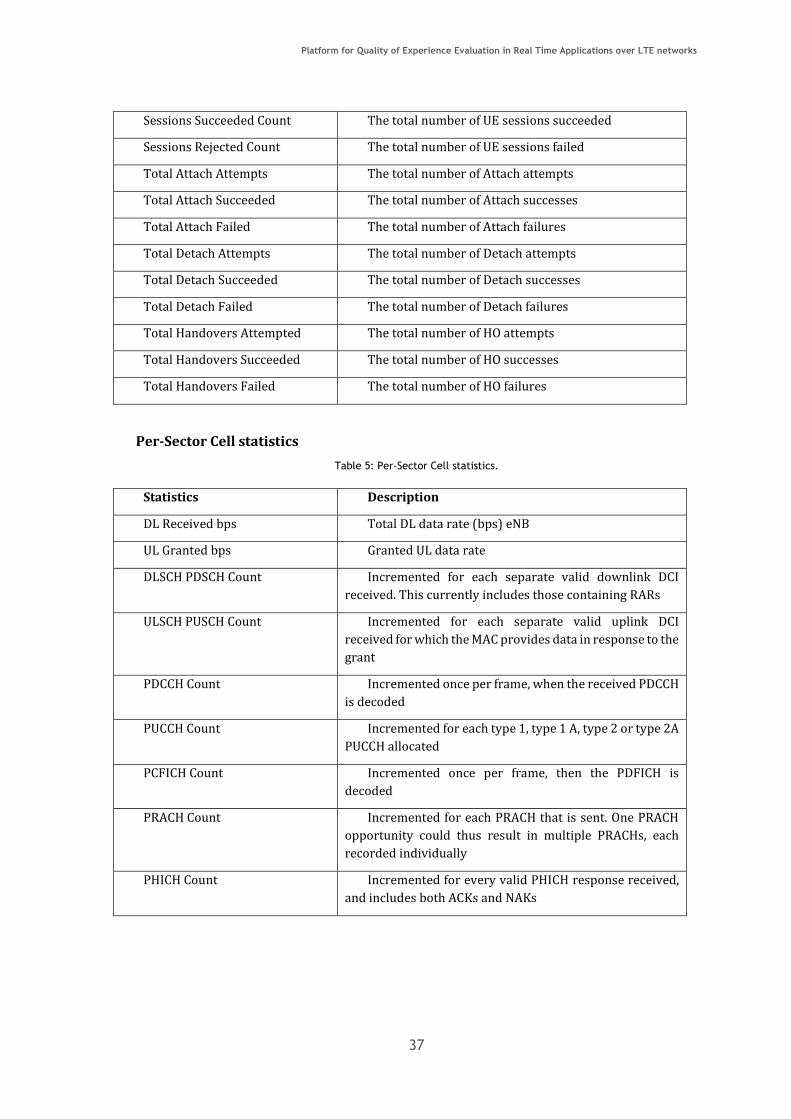
Platform for Quality of Experience Evaluation in Real Time Applications over LTE networks
37
Sessions Succeeded Count The total number of UE sessions succeeded
Sessions Rejected Count The total number of UE sessions failed
Total Attach Attempts The total number of Attach attempts
Total Attach Succeeded The total number of Attach successes
Total Attach Failed The total number of Attach failures
Total Detach Attempts The total number of Detach attempts
Total Detach Succeeded The total number of Detach successes
Total Detach Failed The total number of Detach failures
Total Handovers Attempted The total number of HO attempts
Total Handovers Succeeded The total number of HO successes
Total Handovers Failed The total number of HO failures
Per-Sector Cell statistics
Table 5: Per-Sector Cell statistics.
Statistics Description
DL Received bps Total DL data rate (bps) eNB
UL Granted bps Granted UL data rate
DLSCH PDSCH Count Incremented for each separate valid downlink DCI
received. This currently includes those containing RARs
ULSCH PUSCH Count Incremented for each separate valid uplink DCI
received for which the MAC provides data in response to the
grant
PDCCH Count Incremented once per frame, when the received PDCCH
is decoded
PUCCH Count Incremented for each type 1, type 1 A, type 2 or type 2A
PUCCH allocated
PCFICH Count Incremented once per frame, then the PDFICH is
decoded
PRACH Count Incremented for each PRACH that is sent. One PRACH
opportunity could thus result in multiple PRACHs, each
recorded individually
PHICH Count Incremented for every valid PHICH response received,
and includes both ACKs and NAKs

Luis Pereira
38
Session statistics
Table 6: Session statistics.
Statistics Description
Sessions Initiated Number of UE sessions started over the whole test
Sessions Succeeded Number of UE sessions succeeded over the whole test
Sessions Failed Number of UE sessions failed over the whole test
Global statistics
Table 7: Global statistics.
Statistics Description
Cells in BCH Sync The number of EMM Security Mode Commands
received
Available UEs The number of EMM Security Mode Completes
transmitted
Current Attached UEs EMM_Registered
Current Detached UEs EMM_Deregistered
Current RRC Connected UEs The total number of Attach failures
Current RRC Idle UEs The total number of Detach attempts
Current APN Connections
(Default)
The total number of Detach successes
Current Dedicated Bearers The total number of Detach failures
Throughput UL The number of EMM Tracking Area Update Requests
transmitted
Throughput DL The number of EMM Tracking Area Update Accepts
received
Total Attach Attempts The total number of Attach attempts
Total Attach Succeeded The total number of Attach successes
Total Attach Failed The total number of Attach failures
Total Detach Attempts The total number of Detach attempts
Total Detach Succeeded The total number of Detach successes
Total Detach Failed The total number of Detach failures
UEs that attempted HO The number of configured UEs that have attempted HO
Total HO Attempts The total number of HO attempts
Total HO Succeeded The total number of HO successes
Total HO Failed The total number of HO failures

Platform for Quality of Experience Evaluation in Real Time Applications over LTE networks
39
Current Attach-Detach statistics
Table 8: Current Attach-Detach statistics.
Statistics Description
Current Attached UEs EMM_Registered
Current Detached UEs EMM_Deregistered
Current RRC Connected UEs The total number of Attach failures
Current RRC Idle UEs The total number of Detach attempts
Current APN Connections
(Default)
The total number of Detach successes
Current Dedicated Bearers The total number of Detach failures
Cumulative Attach-Detach statistics
Table 9: Cumulative Attach-Detach statistics.
Statistics Description
Total Attach Attempts The total number of Attach attempts
Total Attach Succeeded The total number of Attach successes
Total Attach Failed The total number of Attach failures
Total Detach Attempts The total number of Detach attempts
Total Detach Succeeded The total number of Detach successes
Total Detach Failed The total number of Detach failures
Handover statistics
Table 10: Handover statistics.
Statistics Description
UEs that attempted HO The number of configured UEs that have attempted HO
Total HO Attempts The total number of HO attempts
Total HO Succeeded The total number of HO successes
Total HO Failed The total number of HO failures
The eNodeB is the new radio base station for LTE access networks. It is the lynch pin in
delivering the 3GPP's objective of improved radio spectrum efficiency to provide increased
capacity and enhanced data rates. The eNodeB plays a fundamental role in managing traffic on
the network and fulfilling the quality of experience (QoE) requirements of mobile subscribers.
To meet QoE expectations, the eNodeB performs radio resource scheduling and
uplink/downlink rate limiting to enforce policy decisions and QoS characteristics associated to
different service and subscriber types on the network.
Luis Pereira
40
The above LTE access test solution, measures all aspects of eNodeB functionality, capacity,
and performance. Ixia designed its test architecture from the ground up to scale to thousands
of simulated UEs (user equipment). It has the flexibility to perform physical, protocol, and
application layer testing, and supports security testing and complex handover scenarios. To
test policy management and QoS mechanisms, Ixia's LTE access test solution includes Ixia's
leading service quality validation that uses both mobile subscriber modelling (at very high load
rate) and advanced QoE measurements. The Ixia solution fully isolates the eNodeB by
emulating all surrounding nodes, including thousands of UEs/mobile subscribers, adjacent
eNodeBs, the mobility management entity (MME), and the evolved packet core (EPC). Unlike
other options, Ixia's solution was built for capacity testing - all test functionality exists whether
the test scenario is emulating a single UE or thousands of UEs.
The solution proposed by Ixia provides a good understanding about the eNodeB
performance at several levels and particularly facilitate the benchmarking of products from
several manufactures and even the development and design of optimized eNodeBs.
Nevertheless before evaluate its real performance each specific network implementation,
particularly the radio network should be well characterized and some estimation about the
service and traffic should be carried out. Green-T proposes a solution that integrates these two
aspects. Despite considering a generic eNodeB Green-T can provide a better estimation about
the network expected performance because takes into consideration real and very specific
deployment scenarios.
2.2.8 WinProp LTE Radio Network Planning tool
AWE Communications was founded in 1998 as a spin off from the Institute of Radio
Frequency Technology at the University of Stuttgart. Since these early days, the main focus of
AWE Communications has been the development of software tools for wave propagation and
radio network planning (awe-communications, s.d.).
WinProp, the main software suite of AWE Communications is described in (awe-
communications, s.d.) as: “Win Prop is a standard software in the world of wireless
propagation and radio network planning. Furthermore, all propagation models and network
simulators of AWE Communications are available as plug-ins for many popular radio network
planning tools and they can be integrated via their flexible APIs into any software tool of the
customer”. Below, it will be given a brief description on WinProp software suite obtained also
from (awe-communications, s.d.).
2.2.8.1 Simulator Parameterization
Since the radio network simulation it is an important component of the Green-T
architecture; in this section it is briefly described a LTE RNP (Radio Network Planning) tool. Is
is presented as WinProp by its developer AWE (awe-communications, s.d.).
For considering the LTE air interface, in the radio network planning project, the
corresponding WinProp LTE wst-file (wst stands for wireless standard) has to be selected at
the project definition. The parameters on the air interface page (see Figure 28) for multiple
access, duplex separation, bandwidth, carriers, transmission modes (modulation and coding
schemes), cell assignment and mobile station are defined accordingly. There are various wst-

Platform for Quality of Experience Evaluation in Real Time Applications over LTE networks
41
files available depending on the frequency band and the bandwidth. MIMO technology can be
activated optionally if spatial multiplexing shall be considered (see the specific MIMO
application note for further details).
Figure 28: Air interface definition for LTE (awe-communications, s.d.).
Further settings of the scheme OFDM/SOFDMA (Scalable Orthogonal Frequency Division
Multiplexing Access) for multiple access can be defined on the corresponding page (see Figure
29.
Figure 29: Air interface settings for LTE (awe-communications, s.d.).
Tx Power Settings (Downlink)
The Tx power is split among the given sub-carriers (by default each sub-carrier gets the
same power). In case the sub-carriers with reference (pilot) or control signals should get more
power, an additional back-off can be defined (negative value in case of more power, positive
value in case of less power). The value defined for the reference (pilot) signal power back-off
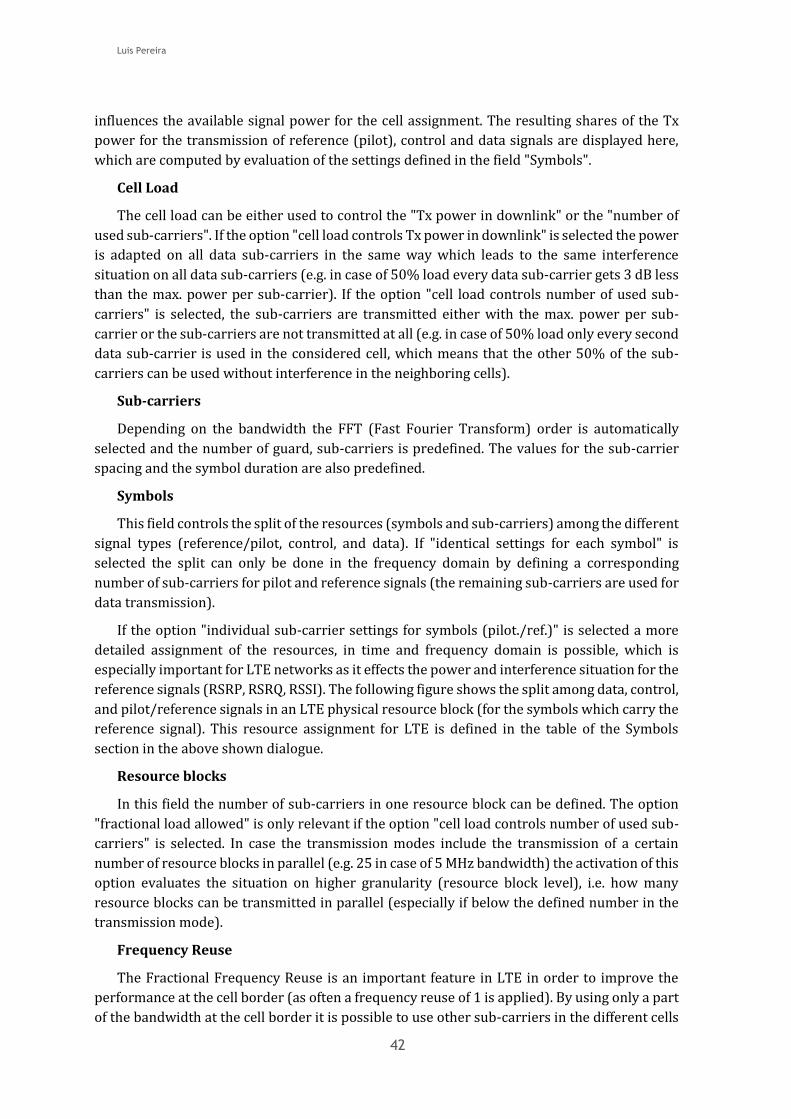
Luis Pereira
42
influences the available signal power for the cell assignment. The resulting shares of the Tx
power for the transmission of reference (pilot), control and data signals are displayed here,
which are computed by evaluation of the settings defined in the field "Symbols".
Cell Load
The cell load can be either used to control the "Tx power in downlink" or the "number of
used sub-carriers". If the option "cell load controls Tx power in downlink" is selected the power
is adapted on all data sub-carriers in the same way which leads to the same interference
situation on all data sub-carriers (e.g. in case of 50% load every data sub-carrier gets 3 dB less
than the max. power per sub-carrier). If the option "cell load controls number of used sub-
carriers" is selected, the sub-carriers are transmitted either with the max. power per sub-
carrier or the sub-carriers are not transmitted at all (e.g. in case of 50% load only every second
data sub-carrier is used in the considered cell, which means that the other 50% of the sub-
carriers can be used without interference in the neighboring cells).
Sub-carriers
Depending on the bandwidth the FFT (Fast Fourier Transform) order is automatically
selected and the number of guard, sub-carriers is predefined. The values for the sub-carrier
spacing and the symbol duration are also predefined.
Symbols
This field controls the split of the resources (symbols and sub-carriers) among the different
signal types (reference/pilot, control, and data). If "identical settings for each symbol" is
selected the split can only be done in the frequency domain by defining a corresponding
number of sub-carriers for pilot and reference signals (the remaining sub-carriers are used for
data transmission).
If the option "individual sub-carrier settings for symbols (pilot./ref.)" is selected a more
detailed assignment of the resources, in time and frequency domain is possible, which is
especially important for LTE networks as it effects the power and interference situation for the
reference signals (RSRP, RSRQ, RSSI). The following figure shows the split among data, control,
and pilot/reference signals in an LTE physical resource block (for the symbols which carry the
reference signal). This resource assignment for LTE is defined in the table of the Symbols
section in the above shown dialogue.
Resource blocks
In this field the number of sub-carriers in one resource block can be defined. The option
"fractional load allowed" is only relevant if the option "cell load controls number of used sub-
carriers" is selected. In case the transmission modes include the transmission of a certain
number of resource blocks in parallel (e.g. 25 in case of 5 MHz bandwidth) the activation of this
option evaluates the situation on higher granularity (resource block level), i.e. how many
resource blocks can be transmitted in parallel (especially if below the defined number in the
transmission mode).
Frequency Reuse
The Fractional Frequency Reuse is an important feature in LTE in order to improve the
performance at the cell border (as often a frequency reuse of 1 is applied). By using only a part
of the bandwidth at the cell border it is possible to use other sub-carriers in the different cells
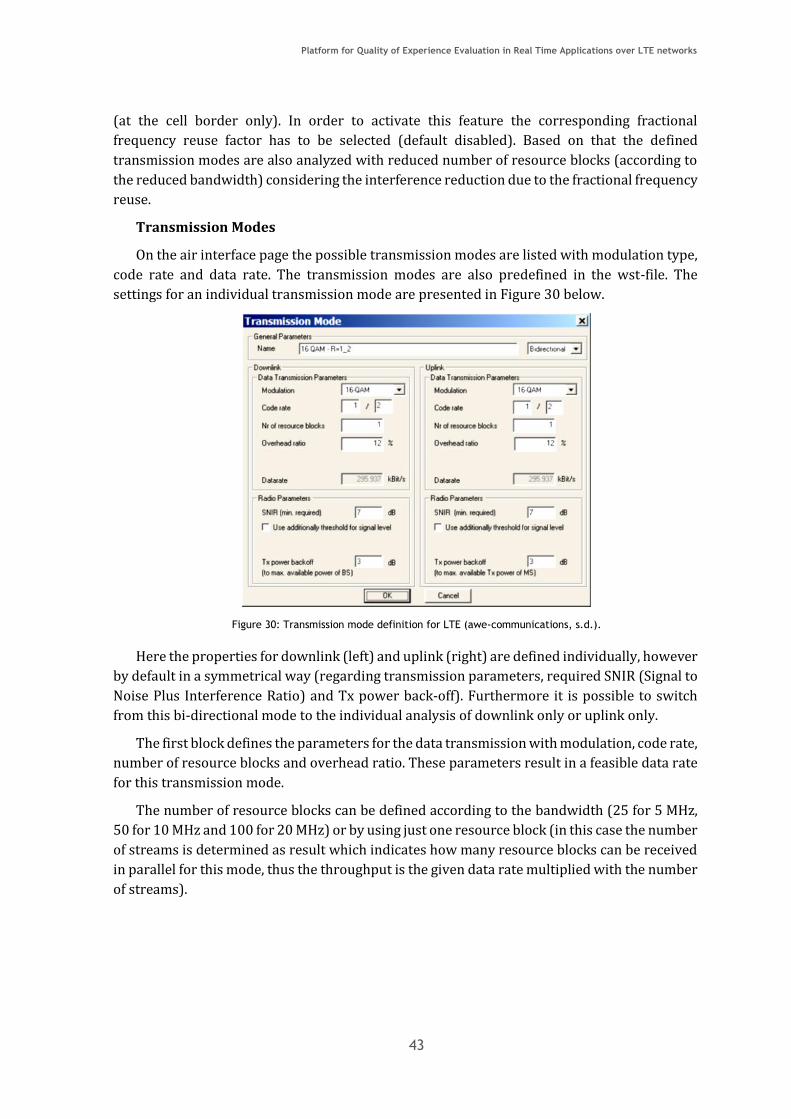
Platform for Quality of Experience Evaluation in Real Time Applications over LTE networks
43
(at the cell border only). In order to activate this feature the corresponding fractional
frequency reuse factor has to be selected (default disabled). Based on that the defined
transmission modes are also analyzed with reduced number of resource blocks (according to
the reduced bandwidth) considering the interference reduction due to the fractional frequency
reuse.
Transmission Modes
On the air interface page the possible transmission modes are listed with modulation type,
code rate and data rate. The transmission modes are also predefined in the wst-file. The
settings for an individual transmission mode are presented in Figure 30 below.
Figure 30: Transmission mode definition for LTE (awe-communications, s.d.).
Here the properties for downlink (left) and uplink (right) are defined individually, however
by default in a symmetrical way (regarding transmission parameters, required SNIR (Signal to
Noise Plus Interference Ratio) and Tx power back-off). Furthermore it is possible to switch
from this bi-directional mode to the individual analysis of downlink only or uplink only.
The first block defines the parameters for the data transmission with modulation, code rate,
number of resource blocks and overhead ratio. These parameters result in a feasible data rate
for this transmission mode.
The number of resource blocks can be defined according to the bandwidth (25 for 5 MHz,
50 for 10 MHz and 100 for 20 MHz) or by using just one resource block (in this case the number
of streams is determined as result which indicates how many resource blocks can be received
in parallel for this mode, thus the throughput is the given data rate multiplied with the number
of streams).
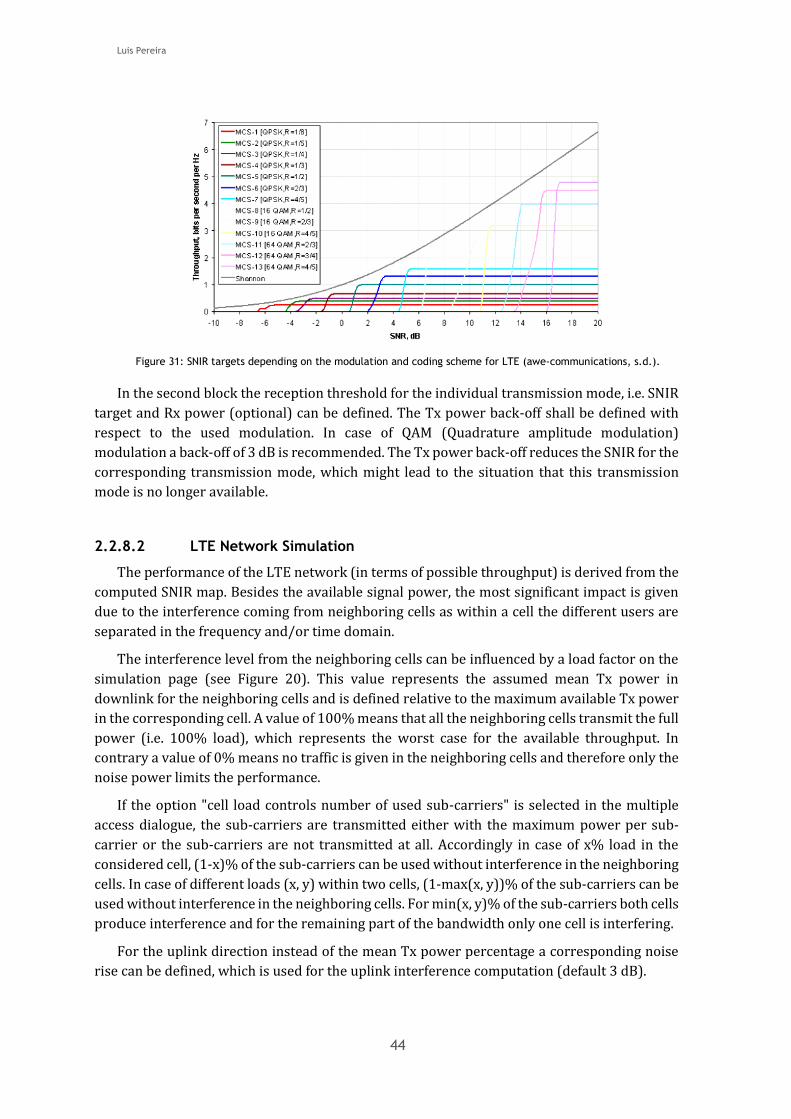
Luis Pereira
44
Figure 31: SNIR targets depending on the modulation and coding scheme for LTE (awe-communications, s.d.).
In the second block the reception threshold for the individual transmission mode, i.e. SNIR
target and Rx power (optional) can be defined. The Tx power back-off shall be defined with
respect to the used modulation. In case of QAM (Quadrature amplitude modulation)
modulation a back-off of 3 dB is recommended. The Tx power back-off reduces the SNIR for the
corresponding transmission mode, which might lead to the situation that this transmission
mode is no longer available.
2.2.8.2 LTE Network Simulation
The performance of the LTE network (in terms of possible throughput) is derived from the
computed SNIR map. Besides the available signal power, the most significant impact is given
due to the interference coming from neighboring cells as within a cell the different users are
separated in the frequency and/or time domain.
The interference level from the neighboring cells can be influenced by a load factor on the
simulation page (see Figure 20). This value represents the assumed mean Tx power in
downlink for the neighboring cells and is defined relative to the maximum available Tx power
in the corresponding cell. A value of 100% means that all the neighboring cells transmit the full
power (i.e. 100% load), which represents the worst case for the available throughput. In
contrary a value of 0% means no traffic is given in the neighboring cells and therefore only the
noise power limits the performance.
If the option "cell load controls number of used sub-carriers" is selected in the multiple
access dialogue, the sub-carriers are transmitted either with the maximum power per sub-
carrier or the sub-carriers are not transmitted at all. Accordingly in case of x% load in the
considered cell, (1-x)% of the sub-carriers can be used without interference in the neighboring
cells. In case of different loads (x, y) within two cells, (1-max(x, y))% of the sub-carriers can be
used without interference in the neighboring cells. For min(x, y)% of the sub-carriers both cells
produce interference and for the remaining part of the bandwidth only one cell is interfering.
For the uplink direction instead of the mean Tx power percentage a corresponding noise
rise can be defined, which is used for the uplink interference computation (default 3 dB).
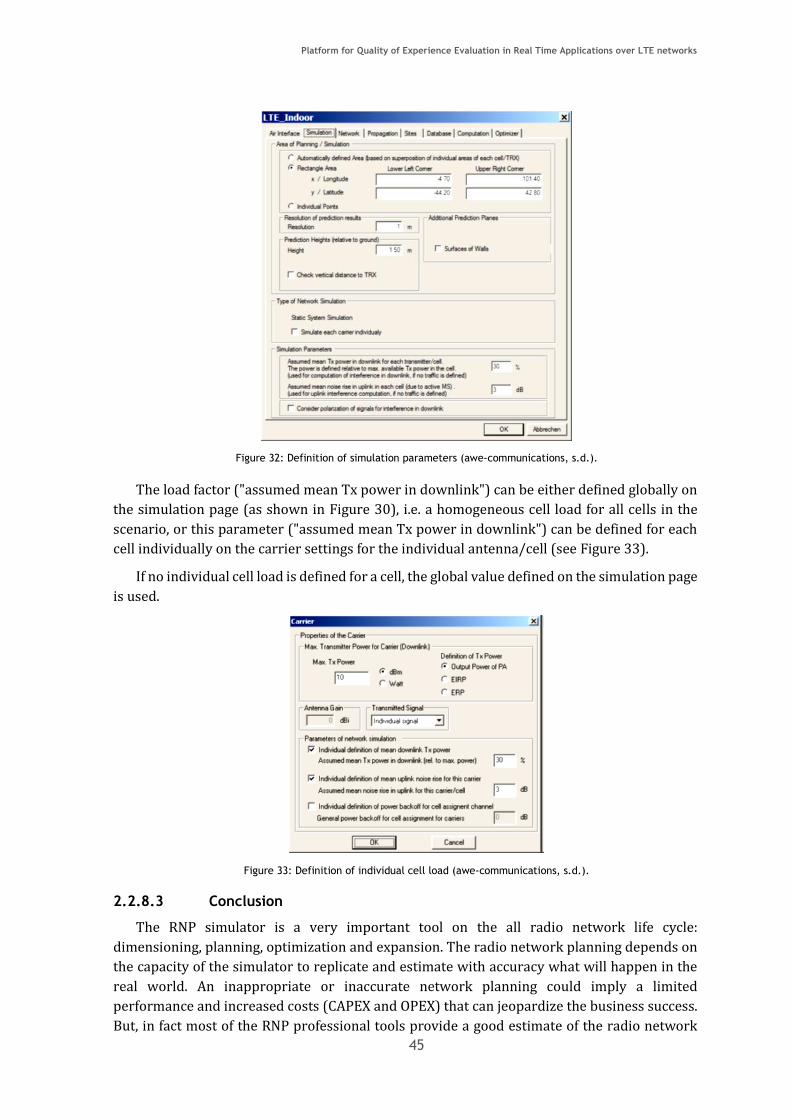
Platform for Quality of Experience Evaluation in Real Time Applications over LTE networks
45
Figure 32: Definition of simulation parameters (awe-communications, s.d.).
The load factor ("assumed mean Tx power in downlink") can be either defined globally on
the simulation page (as shown in Figure 30), i.e. a homogeneous cell load for all cells in the
scenario, or this parameter ("assumed mean Tx power in downlink") can be defined for each
cell individually on the carrier settings for the individual antenna/cell (see Figure 33).
If no individual cell load is defined for a cell, the global value defined on the simulation page
is used.
Figure 33: Definition of individual cell load (awe-communications, s.d.).
2.2.8.3 Conclusion
The RNP simulator is a very important tool on the all radio network life cycle:
dimensioning, planning, optimization and expansion. The radio network planning depends on
the capacity of the simulator to replicate and estimate with accuracy what will happen in the
real world. An inappropriate or inaccurate network planning could imply a limited
performance and increased costs (CAPEX and OPEX) that can jeopardize the business success.
But, in fact most of the RNP professional tools provide a good estimate of the radio network

Luis Pereira
46
behavior and expected performance on the most diverse deployments scenarios. Particularly
LTE can be deployed on many different bands, bandwidths and configurations requires
simulation and emulation tools that mirrors its flexibility in order to provide to the network
operator a clear view about the impact of its choices on the network performance, user QoS
and QoE. The design and development of a LTE radio network simulation environment it’s one
of the most important tasks in Green-T that will create the radio environment on which the UE
<-> eNodeB emulated connection is analyzed and evaluated. The commercial available RNPs
provide a good evaluation of radio behavior and expected radio network performance
modeling and basically simplifying the upper protocols providing, short time of simulation and
accuracy at expense of not providing the capability of analyses of the upper protocol layers and
the flexibility to evaluate new ones. Therefore, it is not very useful for research, and its life will
be quite limited because it does not support the technology evolution, Green-T intends to
overcome this drawback.
Platform for Quality of Experience Evaluation in Real Time Applications over LTE networks
47
3 System Level Simulator The System Level Simulator (SLS) is out of scope of this document, although a brief
description on the main features and modules will be given. The SLS provides input data for
the RTLE and so it is very important to introduce this tool on this document.
Note: some information and figures within this section were obtained from (Pereira, et al.,
2014), which is a paper from the same author of this document.
3.1 System Level Simulator - overview
The performance evaluation of a broadband wireless system such as LTE, for scenarios of
application as close as possible to reality, must be conducted on system-level simulation
platforms, with realistic models for traffic and signal propagation phenomena such as: path-
loss, shadowing and fast fading; mobility patterns and traffic generation for supported users;
inter-cell influence, etc.. The more accuracy achieved in the implementation of these models in
the simulation platform, the closer the simulator outputs are to reality. A properly designed
system-level simulation platform suits the derivation of the performance figures needed in the
evaluation of the impact and satisfaction of the standard, in terms of system requirements such
as: spectrum efficiency, system capacity, quality of service support, end-user satisfaction and
cost-efficiency. If the results obtained from system-level simulations are satisfactory then
hardware can be designed and manufactured.
The methodology followed in system level simulations depends on a different set of
assumptions regarding: type of wireless system simulated, air interface technology,
simulations complexity and time resolution, interface with other layers of the protocol stack,
such as the physical layer, network layout, channel and interference modelling and application
traffic models.
The SLS developed within this project takes in care the following topics:
Network Scenario: This is related to the type of environment considered in the
simulations: urban, rural, vehicular or indoor;
Network Layout: Amount of tiers and number of base stations simulated, type of cells:
one omnidirectional cell or three, six sectored cells for example, number of mobile
stations and their distribution over the network coverage area;
Radio Resource Management: enable/disable power control, enable/disable user
mobility and handover, definition of the radio resources according to the type of air
interface and medium access layer;
Physical Layer Modelling and Abstraction: definition of the metrics used to map
physical layer performance to higher layers of the protocol stack, definition of the types
of interfaces used in the interaction between system and physical layers;
Propagation and channel modelling: path loss propagation, slow fading (shadowing)
propagation, fast fading channel modelling.
Interference modelling: intra-cell, inter-cell and inter-system interference;
Implemented radio access system: multiple access to radio resources, circuit
switch/packet switch;
Traffic models for application services: choice of traffic models, emulation by using pre-
defined traffic models or use of real traces from real networks;

Luis Pereira
48
Performance metrics: metrics for network evaluation performance, metrics for user
satisfaction evaluation.
Figure 34, below, shows a block diagram of SLS.
Figure 34: System Level Simulator components.
The performance evaluation of LTE system, for scenarios of application as envisaged for
the Green-T project, must be conducted on system-level simulation platform, with realistic
models for traffic and signal propagation phenomena such as: path-loss, shadowing and fast
fading; mobility patterns and traffic generation for supported users; inter-cell influence, etc.
The more accuracy achieved in the implementation of these models in the simulation platform,
the closer the simulator outputs are to reality. A properly designed system-level simulation
platform suits the derivation of the performance figures needed in the evaluation of the impact
and satisfaction of the standard, in terms of system requirements such as: spectrum efficiency,
system capacity, quality of service support, end-user satisfaction and cost-efficiency. If the
results obtained from system-level simulations are satisfactory then hardware can be designed
and manufactured.
The methodology followed in system level simulations depends on a different set of
assumptions regarding: type of wireless system simulated, air interface technology,
simulations complexity and time resolution, interface with other layers of the protocol stack,
such as the physical layer, network layout, channel and interference modelling and application
traffic models.
In particular, the following aspects must be considered with care in developing a system
level tool and on performing system level simulations:
Network Scenario
This is related to the type of environment considered in the simulations: urban, rural,
vehicular or indoor.
Network Layout
Amount of tiers and number of base stations simulated;
Platform for Quality of Experience Evaluation in Real Time Applications over LTE networks
49
Type of cells: one omnidirectional cell or three, six sectored cells for example;
Number of mobile stations and their distribution over the network coverage area.
Radio Resource Management
Enable/disable power control;
Enable/disable user mobility and handover;
Definition of the radio resources according to the type of air interface and medium
access layer.
Physical Layer Modelling and Abstraction
Definition of the metrics used to map physical layer performance to higher layers of the
protocol stack;
Definition of the types of interfaces used in the interaction between system and
physical layers.
Propagation and channel modelling
Path loss propagation.
Slow fading (shadowing) propagation.
Fast fading channel modelling.
Interference modelling
Intra-cell, inter-cell and inter-system interference.
Implemented radio access system
Multiple access to radio resources, circuit switch/packet switch.
Traffic models for application services
Choice of traffic models: emulation by using pre-defined traffic models or use of real
traces from real networks.
Performance metrics
Metrics for network evaluation performance.
Metrics for user satisfaction evaluation.
Simulation complexity and time resolution
There is a trade-off between accuracy and simulation execution time. The correct balance
must be found. The main simulation components of a complete simulation tool are illustrated
in Figure 35.
A figure illustrating the block diagram of the simulator is presented in Figure 35 below.

Luis Pereira
50
Figure 35: Block diagram representing system simulator components.
The system level simulation tool that will be initially designed for the simulation of a
beyond 3G mobile communication system. However, the design can evolve to include the
possibility of simulating any type of wireless communication network. This is achieved by
using the modular approach of C++ object oriented design and analysis. Hence, every object
contains all information and functions that correspond to its functionality, and which also maps
to real-life objects found in wireless systems.
Functionalities, input parameters and output metrics
Figure 36 illustrates a functional block diagram of the system level simulator. The inputs
and configuration files are shown as arrows entering the main block. The calculated metrics
and output files are shown as arrows exiting from the main block.
Figure 36: Functional Block Diagram.
The multi-cell scenario, can be analysed in terms of what happens individually in each cell.
The Figure 36 illustrates the functional block diagram of the simulator relating to one cell. The
generated packets are queued in each user buffer. The scheduler, in the RRM, selects the
packets to be transmitted, according traffic demands and channel quality. The quantity of data
to be transmitted for each user depends on the Radio Block size (SDU), given by the CQI. The
Traffic Models
- Voice
- Web
- Video Streaming
- FTP
eNodeB
RRM
schemes
Channel
ITU Models
-Pedestrian A,B
-Vehicular A,B
Interference
-Intercell
Thermal noise
UE
LLI+
Results
FER/BlER
CQI report
SINR

Platform for Quality of Experience Evaluation in Real Time Applications over LTE networks
51
SINR is computed according channel losses, interference and thermal noise. At the receiver the
received data state is computed if received correct or not, based on the system Block Error Rate
(BLER) given by the Link Layer Interface (LLI).
Figure 37: Segmentation and concatenation of packets to be transmitted.
Figure 38 shows a system with a multiple cells and there is one base station and a random
number of mobile terminals, randomly located inside each cell. Mobiles access the network
through Base station (BS’s). A comprehensive system level tool (called System Level Simulator)
is needed to evaluate the performance of such system, which captures every aspects of the real
cellular environment. A single simulator approach would be preferred, but the complexity of
such simulator (including everything from transmitted waveforms to multi-cell network) is far
too high with the required simulation resolutions and simulation times. In addition, domains
of simulations of both simulators (i.e. link level simulates a single link, one base station and one
user whereas system level simulator simulates a multiple links) as shown in Figure 38 is very
different:
At link level, the granularity is in order of Bit Error Rate (BER) or if CDMA its chip error
rate, which can be as low as nanoseconds, while at the network level it is at the level of packet
durations, which is typically several orders of magnitude higher than the BER. Due to these
computational complexities, it is not possible to simulate all networks in a one System level
Simulator. Therefore, separate link and system level simulations are needed with an
appropriate methodology to pass the results from the link level to the SLS.
Figure 38: Wireless System Level Simulator.
This is the so-called Link-to-System (L2S) interface as shown in Figure 39. In practice, this
interface is realized through a set of mapping (Look-up) tables. These mapping tables are
constructed on the link level and they represent tabulated BER or FER function of
instantaneous system level SINR.
SDU n SDU n+1
Packet i+1Packet i
SDU n+2 SDU n+3
Packet i+2
SDU n+4SDU
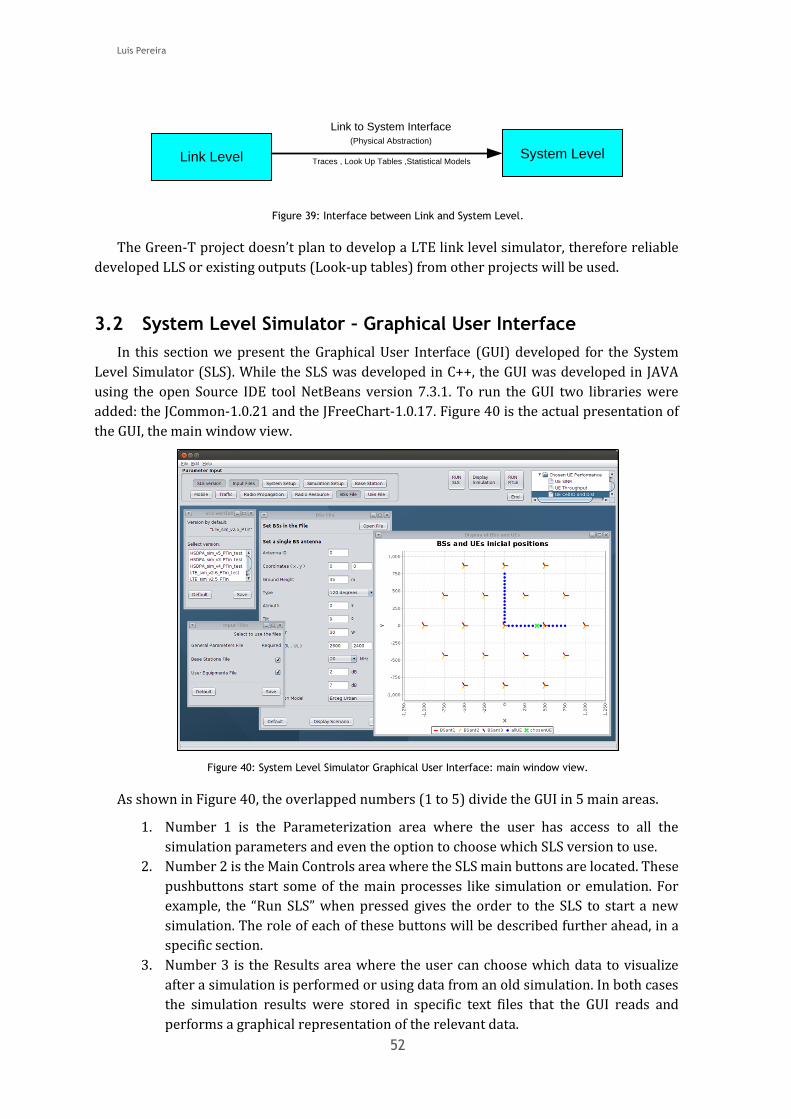
Luis Pereira
52
Figure 39: Interface between Link and System Level.
The Green-T project doesn’t plan to develop a LTE link level simulator, therefore reliable
developed LLS or existing outputs (Look-up tables) from other projects will be used.
3.2 System Level Simulator – Graphical User Interface
In this section we present the Graphical User Interface (GUI) developed for the System
Level Simulator (SLS). While the SLS was developed in C++, the GUI was developed in JAVA
using the open Source IDE tool NetBeans version 7.3.1. To run the GUI two libraries were
added: the JCommon-1.0.21 and the JFreeChart-1.0.17. Figure 40 is the actual presentation of
the GUI, the main window view.
Figure 40: System Level Simulator Graphical User Interface: main window view.
As shown in Figure 40, the overlapped numbers (1 to 5) divide the GUI in 5 main areas.
1. Number 1 is the Parameterization area where the user has access to all the
simulation parameters and even the option to choose which SLS version to use.
2. Number 2 is the Main Controls area where the SLS main buttons are located. These
pushbuttons start some of the main processes like simulation or emulation. For
example, the “Run SLS” when pressed gives the order to the SLS to start a new
simulation. The role of each of these buttons will be described further ahead, in a
specific section.
3. Number 3 is the Results area where the user can choose which data to visualize
after a simulation is performed or using data from an old simulation. In both cases
the simulation results were stored in specific text files that the GUI reads and
performs a graphical representation of the relevant data.
Link Level
Link to System Interface
(Physical Abstraction)
System LevelTraces , Look Up Tables ,Statistical Models

Platform for Quality of Experience Evaluation in Real Time Applications over LTE networks
53
4. Number 4 is the Visualization area where all the sub-windows (also called as
internal frames) are presented. These small windows are used for the modification
of the input parameters (input data) and for the visualization of the different charts
(output data). This way the user can dispose the windows as he desires, giving him
the possibility to visualize and analyze different charts at the same time.
5. Number 5 is the Progress Bar used in different occasions, so the user can visualize
the progression of the current task. The graphic is accompanied by a textual
representation of the progress in a percentage format. This progress bar is used at
different occasions: in a simulation, emulation or a display simulation over time.
Results Visualization
The visualization of the results is an important part of the LTE emulator, for analysis and
validation of the simulation results, Figure 41 shows three examples os results that can be seen
in SLS GUI after simulation.
Figure 41: Example results, from left to right: left: “BSs and UEs Map” graphic”, “BSant Throughput” charts and “EU Cell ID and Dist” charts.
The SLS GUI comprises mainly three functions:
1. Configurations: configurations of the simulation parameters and settings;
2. SLS Simulation: invocation of the SLS to perform the simulation according with the
configurations defined in the previous step;
3. RTLE Emulation: integration with the RTLE to emulate in real time the scenario
previously simulated.

Luis Pereira
54

Platform for Quality of Experience Evaluation in Real Time Applications over LTE networks
55
4 Real Time Link platform In this section will be described the implementation of the Real Time Link platform. This
platform aims to emulate in real time a user simulated by the System Level Simulator,
described in section 3. This platform will receive values previous calculated by the SLS for a
given scenario and will replicate in real time and with real applications, the network conditions
simulated for a specific user in the simulated scenario.
Note: some information and figures within this section were obtained from (Pereira, et al.,
2014), which is a paper from the same author of this document.
4.1 LTE Emulator requirements
This section covers the requirements of the LTE Real Time Link emulator by introducing
how the LTE protocol stack operates. Due to the fact that the final 3GPP specification is
constituted of a very detailed description of each protocol, here the idea to provide the general
overview to help the identification of each requirement associated to the real time link
emulator.
The GREEN-T Real Time Link Emulator is constituted by one emulated LTE eNodeB and
one emulated LTE UE. To enable the communication between both it is required the use of a
defined protocol. Protocols are a set of rules that describes how to devices can communicate
and understand themselves, turning possible the exchange the information. In general terms
for describing a protocol usually is used a description of which messages can be sent and
received including also particular procedures and functions. In addition to that and to use the
protocols for information exchange between the eNodeB and the UE an interface is required
and need to be defined. Regarding the LTE network, two groups of protocols are defined. One
is used to allow the eNodeB to control the UE, exchanging only control messages as shown in
the Figure 11. This protocols group in LTE is called Control Plane. The other protocols group,
also called User plane, is used to exchange just raw data as shown in the Figure 12.
To emulate an eNodeB independent from the emulation of the User Equipment, we present
a solution based on two devices, with two different computers, which allows a better
processing performance. Figure 42 shows a simplified schematic of the connection between
the emulated LTE UE and the emulated LTE eNodeB.

Luis Pereira
56
Figure 42: Practical implementation of the emulator.
The purpose of this connection is to demonstrate, at real time, the functionalities of the
services and applications in a simulated environment, both for the evaluation of the QoE and
the QoS at the UB and eNodeB (UL/DL). So, one of the crucial aspect here is the simulation time,
which cannot be greater than the time defined for the LTE. Another aspect to consider is that
the connection between the two emulators, besides having to work in a transparent mode,
should not introduce errors or delays (greater than 2ms) to prevent significant interference
with the simulation time – though we might want to introduce simulated errors for testing
purposes.
Available Technologies
As the speed of the LTE in the Downlink is 100Mbps the connection between the two
emulators must operate at least at this transfer rate. This excludes the FastEthernet
technology, whose maximum transfer rate is 100Mbps. In the next range we have the Gigabit
Ethernet technology, allowing transfer rates up to 1000 Mbps - there are many patterns as
1000BASE-T, 1000BASE-CX, 1000BASE-SX, 1000BASE-LX. Below is a short description of each
of these technologies.
1000BASE-T
In case the network has less than 100 meters, this would be the most feasible technology.
And because it uses the same twisted-pair cables, of category 6, as the current 100 Mbps
networks, it does not require purchasing new cables and no furthers adjustments are
necessary to support it; and the use of compatible switches with this technology allows to
combine nodes of 10, 100 and 1000 megabits.
In Pattern 1000baseT the number of pairs of cables required differs from other previous
standards, as it uses all four pairs available on the twisted pair, and for this reason is possible
to transmit at 1000 Mbps, which is different from previous versions that use only two pairs of
this same cable.

Platform for Quality of Experience Evaluation in Real Time Applications over LTE networks
57
1000BASE-CX
1000baseCX is the initial standard for Gigabit Ethernet over copper cable, usable upto 25
meters, maximum. The wiring is made with STP cables (Shielded Twisted Pair). It is still used
for specific applications, with specific cabling, for particular users; for instance, the IBM
BladeCenter uses 1000BASE-CX for Ethernet connection between the server blades and
switching modules.
1000BASE-SX
This technology uses optical fiber cabling, and is recommended for networks of up to 550
meters in length. It uses the same optical technology as used in CD-ROMs so it is cheaper than
the technology 1000BaseLX, another standard that uses optical fiber.
It uses four laser patterns. With the most expensive pattern, using 50 micron lasers and a
frequency of 500 MHz, the signal is able to travel 550 meters, which is the same of the capacity
as the cheaper pattern of 1000BaseLX. The second pattern also uses lasers 50 microns, but the
frequency is 400 MHz and the maximum range drops to 500 meters. The other two patterns,
using lasers of 62.5 microns and frequencies of 200 MHz and 160, they can only achieve 275
and 220 meters respectively. We can use single-mode and multi-mode type, the most common
being the multimode (cheaper but with shorter range).
1000BASE-LX
This is the most expensive technology, because is prepared for the greatest ranges. If the
network cable is greater than 550 meters, it is the only solution, being capable of reaching up
to 5km using fiber optic cables of 9 microns.
All standards mentioned above are compatible with each other over the Data Link layer of
the OSI model. Below the Data Link layer we have the physical layer of the network, which
includes the cable and the type of modulation used in the data transmission.
The technology 1000BaseLX is used with a mono-mode fiber type; therefore it can achieve
a greater distance compared to the standard 1000baseSX. Figure 43 shows a comparison of the
different Gigabit Ethernet technologies regarding the maximum distance.
Figure 43: maximum distance supported by different standards Gigabit Ethernet.
Thus, we conclude that, as an initial approach, the 1000BASE-T standard Gigabit Ethernet
technology is a possible solution, since the distances between the two emulators are relatively

Luis Pereira
58
short. Also this technology allows data transfers up to 1Gbps, and there is no need to purchase
additional hardware components, as many recent computers already have a Gigabit Ethernet
interface compatible with this standard.
Table 11 lists the main requirements for the RTLE platform.
Table 11: Real Time Link Requirements Summary.
Nº Requirements Description
R1 Link connection between the
EU and the eNodeB need to be
less than 2 milliseconds
In order to introduce errors and delays in the
transport layer and to successfully update the overall
emulator, the latency need to be less than 2 milliseconds
R2 The individual LTE protocol
management
In order to make changes inside each protocol, the
management of each one individually needs to be
possible.
R3 Real Time services and
applications functioning
The system need to show in Real Time the services
and applications functioning within the simulated
scenario to evaluate the overall QoS in terms of Uplink
and Downlink
R4 Tested application over IP Every application that will be tested using the
emulator need to work over IP
R5 Support the three terminal
states
To fully emulate the User Equipment, each terminal
state need to be supported or at least some part of them.
R6 Input simulation Results Capability to receive and read simulation results
from SLS
R7 Synchronization Capability to synchronize with other interfaces
4.2 Real Time Link platform implementation
It is needed to develop the highest efficient platform as possible, since the operations to
perform require processing huge amounts of information in real time. And this requirement
will be the worst requirement to achieve, LTE has very high requirements, as presented before,
and the platform must overcome all the LTE specifications and requirements. It will be used
multithread applications, since multi-core processors are quite common nowadays, and this
type of applications are capable of taking full advantage of the system resources.
The platform will be divided as depicted below, to allow parallel processing of multiple
blocks and also to reduce the complexity in terms of source code and to improve execution
efficiency:

Platform for Quality of Experience Evaluation in Real Time Applications over LTE networks
59
Figure 44: Real Time Link overall structure.
The main blocks presented in previous figure, Figure 44: Real Time Link overall structure,
are:
• Redirect IP Packets Block
o Redirect User Equipment
o Redirect eNodeB
• LTE Protocol Stack
o User Equipment
o eNodeB
• Gigabit Ethernet Link
o User Equipment Link
o eNodeB Link
In the next sub sections it will be given a description of each block constituent of the RTL
platform.
4.2.1 Redirect IP Packets Block
There are two names for this block, considering the User Equipment side of the Real Time
Link, this block is referred to as "Redirect UserEquipment Block" while in the eNodeB side this
block was termed as "Redirect eNodeB Block."
In order to simulate a real-time communication in LTE is necessary to create a block to
generate or capture IP packets entering the LTE User Plane, using PDCP Protocol.
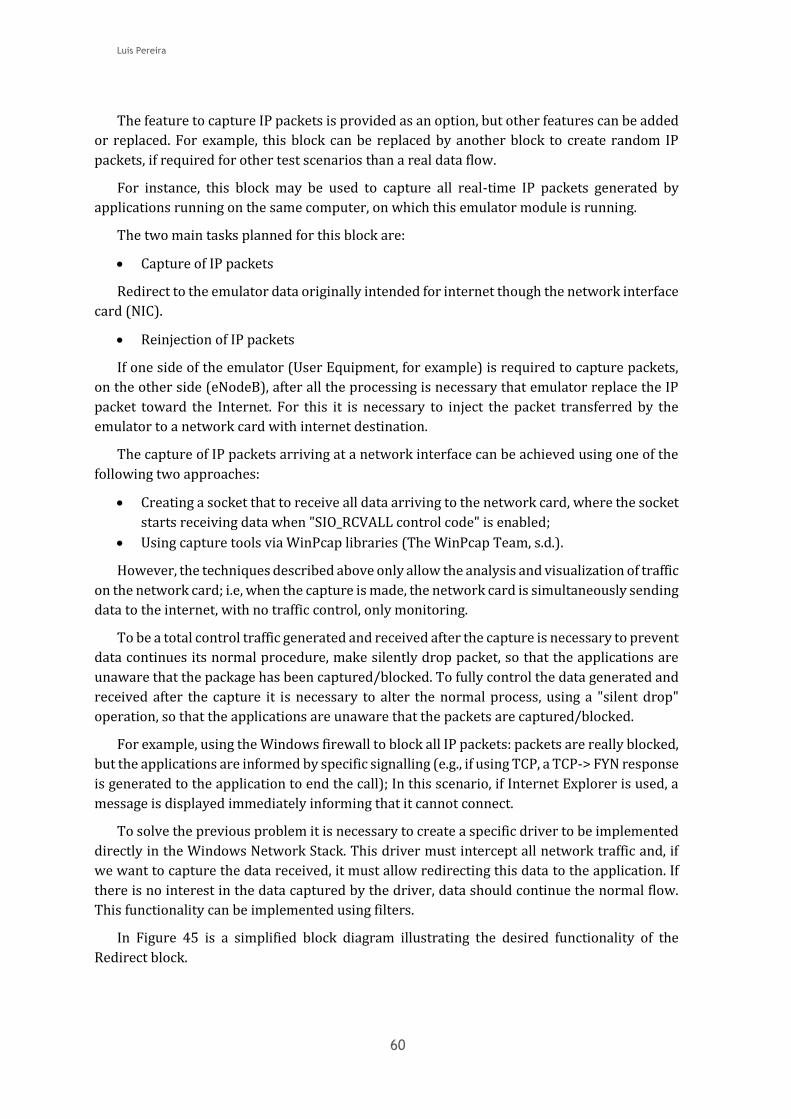
Luis Pereira
60
The feature to capture IP packets is provided as an option, but other features can be added
or replaced. For example, this block can be replaced by another block to create random IP
packets, if required for other test scenarios than a real data flow.
For instance, this block may be used to capture all real-time IP packets generated by
applications running on the same computer, on which this emulator module is running.
The two main tasks planned for this block are:
Capture of IP packets
Redirect to the emulator data originally intended for internet though the network interface
card (NIC).
Reinjection of IP packets
If one side of the emulator (User Equipment, for example) is required to capture packets,
on the other side (eNodeB), after all the processing is necessary that emulator replace the IP
packet toward the Internet. For this it is necessary to inject the packet transferred by the
emulator to a network card with internet destination.
The capture of IP packets arriving at a network interface can be achieved using one of the
following two approaches:
Creating a socket that to receive all data arriving to the network card, where the socket
starts receiving data when "SIO_RCVALL control code" is enabled;
Using capture tools via WinPcap libraries (The WinPcap Team, s.d.).
However, the techniques described above only allow the analysis and visualization of traffic
on the network card; i.e, when the capture is made, the network card is simultaneously sending
data to the internet, with no traffic control, only monitoring.
To be a total control traffic generated and received after the capture is necessary to prevent
data continues its normal procedure, make silently drop packet, so that the applications are
unaware that the package has been captured/blocked. To fully control the data generated and
received after the capture it is necessary to alter the normal process, using a "silent drop"
operation, so that the applications are unaware that the packets are captured/blocked.
For example, using the Windows firewall to block all IP packets: packets are really blocked,
but the applications are informed by specific signalling (e.g., if using TCP, a TCP-> FYN response
is generated to the application to end the call); In this scenario, if Internet Explorer is used, a
message is displayed immediately informing that it cannot connect.
To solve the previous problem it is necessary to create a specific driver to be implemented
directly in the Windows Network Stack. This driver must intercept all network traffic and, if
we want to capture the data received, it must allow redirecting this data to the application. If
there is no interest in the data captured by the driver, data should continue the normal flow.
This functionality can be implemented using filters.
In Figure 45 is a simplified block diagram illustrating the desired functionality of the
Redirect block.

Platform for Quality of Experience Evaluation in Real Time Applications over LTE networks
61
Figure 45: redirect IP packets block diagram.
As can be seen from the previous figure, it is intended to develop the driver to be
implemented in Windows kernel and intercepts all network traffic. Upon interception of data,
and in accordance with the applied filter, the driver may allow a normal flow of data or redirect
data to the emulator, after dropping packets silently. In the case of uplink data, as shown in the
figure, after receiving the data on the "User Equipment Redirect", this block initiates the
processing of the data on the emulator, sending it to the next block, "LTE Protocol Stack".
After this processing on the emulator side, it is necessary to have another driver installed
on the computer running the block for the "eNodeB", so that the driver may return the data
into the network stack of Windows, doing packet re-injection. In the case of the downlink the
process is done in a similar way, reversing the blocks as presented on the previous image.
The Reinjection procedure is done by WinPcap libraries (The WinPcap Team, s.d.).
4.2.1.1 Capture and redirect IP Packets
“Capture and redirect of IP Packets” consists on several steps:
Capture of IP packets from the Network Interface card before they are sent;
Block captured packets from exiting the network interface card;
Redirect captured packets to the Real Time Link Emulator.
The driver adopted to perform the steps described above is the WinDivert driver. This
driver is open source and freely available under the terms of the GNU Lesser General Public
License (LGPL) (Basil, 2015).
4.2.1.2 IP packet reinjection
When data is transferred via the emulator is necessary to resend it on the network card
towards its destination, using a specific network driver - the network driver selected was
WinPcap (The WinPcap Team, s.d.).
“WinPcap is the industry-standard tool for link-layer network access in Windows
environments: it allows applications to capture and transmit network packets bypassing the
protocol stack, and has additional useful features, including kernel-level packet filtering, a
network statistics engine and support for remote packet capture.” (The WinPcap Team, s.d.).
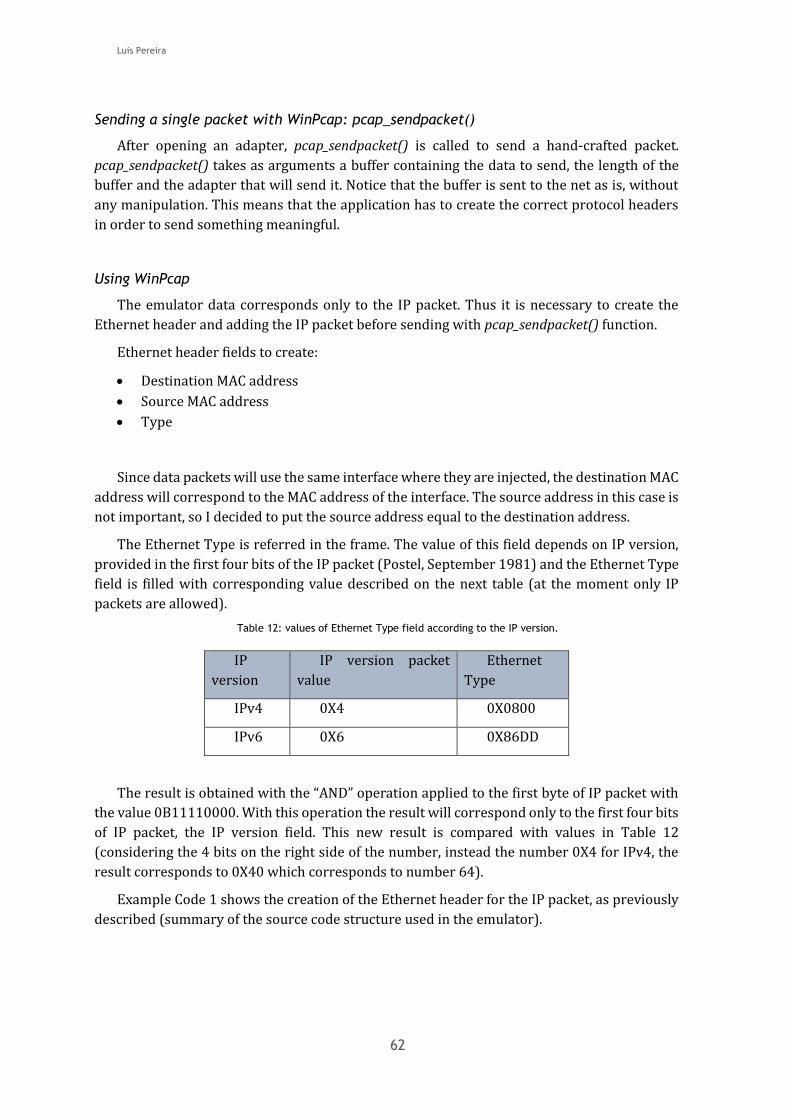
Luis Pereira
62
Sending a single packet with WinPcap: pcap_sendpacket()
After opening an adapter, pcap_sendpacket() is called to send a hand-crafted packet.
pcap_sendpacket() takes as arguments a buffer containing the data to send, the length of the
buffer and the adapter that will send it. Notice that the buffer is sent to the net as is, without
any manipulation. This means that the application has to create the correct protocol headers
in order to send something meaningful.
Using WinPcap
The emulator data corresponds only to the IP packet. Thus it is necessary to create the
Ethernet header and adding the IP packet before sending with pcap_sendpacket() function.
Ethernet header fields to create:
Destination MAC address
Source MAC address
Type
Since data packets will use the same interface where they are injected, the destination MAC
address will correspond to the MAC address of the interface. The source address in this case is
not important, so I decided to put the source address equal to the destination address.
The Ethernet Type is referred in the frame. The value of this field depends on IP version,
provided in the first four bits of the IP packet (Postel, September 1981) and the Ethernet Type
field is filled with corresponding value described on the next table (at the moment only IP
packets are allowed).
Table 12: values of Ethernet Type field according to the IP version.
IP
version
IP version packet
value
Ethernet
Type
IPv4 0X4 0X0800
IPv6 0X6 0X86DD
The result is obtained with the “AND” operation applied to the first byte of IP packet with
the value 0B11110000. With this operation the result will correspond only to the first four bits
of IP packet, the IP version field. This new result is compared with values in Table 12
(considering the 4 bits on the right side of the number, instead the number 0X4 for IPv4, the
result corresponds to 0X40 which corresponds to number 64).
Example Code 1 shows the creation of the Ethernet header for the IP packet, as previously
described (summary of the source code structure used in the emulator).
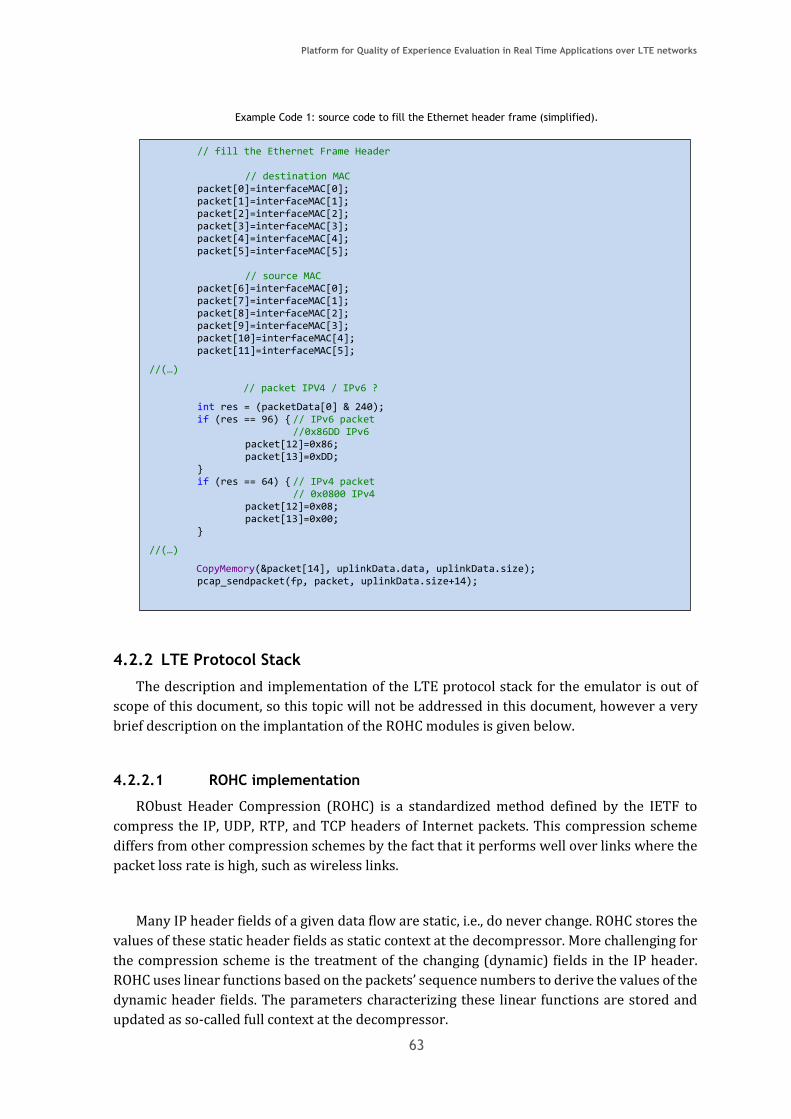
Platform for Quality of Experience Evaluation in Real Time Applications over LTE networks
63
Example Code 1: source code to fill the Ethernet header frame (simplified).
4.2.2 LTE Protocol Stack
The description and implementation of the LTE protocol stack for the emulator is out of
scope of this document, so this topic will not be addressed in this document, however a very
brief description on the implantation of the ROHC modules is given below.
4.2.2.1 ROHC implementation
RObust Header Compression (ROHC) is a standardized method defined by the IETF to
compress the IP, UDP, RTP, and TCP headers of Internet packets. This compression scheme
differs from other compression schemes by the fact that it performs well over links where the
packet loss rate is high, such as wireless links.
Many IP header fields of a given data flow are static, i.e., do never change. ROHC stores the
values of these static header fields as static context at the decompressor. More challenging for
the compression scheme is the treatment of the changing (dynamic) fields in the IP header.
ROHC uses linear functions based on the packets’ sequence numbers to derive the values of the
dynamic header fields. The parameters characterizing these linear functions are stored and
updated as so-called full context at the decompressor.
// fill the Ethernet Frame Header // destination MAC packet[0]=interfaceMAC[0]; packet[1]=interfaceMAC[1]; packet[2]=interfaceMAC[2]; packet[3]=interfaceMAC[3]; packet[4]=interfaceMAC[4]; packet[5]=interfaceMAC[5]; // source MAC packet[6]=interfaceMAC[0]; packet[7]=interfaceMAC[1]; packet[8]=interfaceMAC[2]; packet[9]=interfaceMAC[3]; packet[10]=interfaceMAC[4]; packet[11]=interfaceMAC[5];
//(…)
// packet IPV4 / IPv6 ?
int res = (packetData[0] & 240); if (res == 96) { // IPv6 packet //0x86DD IPv6 packet[12]=0x86; packet[13]=0xDD; } if (res == 64) { // IPv4 packet // 0x0800 IPv4 packet[12]=0x08; packet[13]=0x00; }
//(…)
CopyMemory(&packet[14], uplinkData.data, uplinkData.size); pcap_sendpacket(fp, packet, uplinkData.size+14);
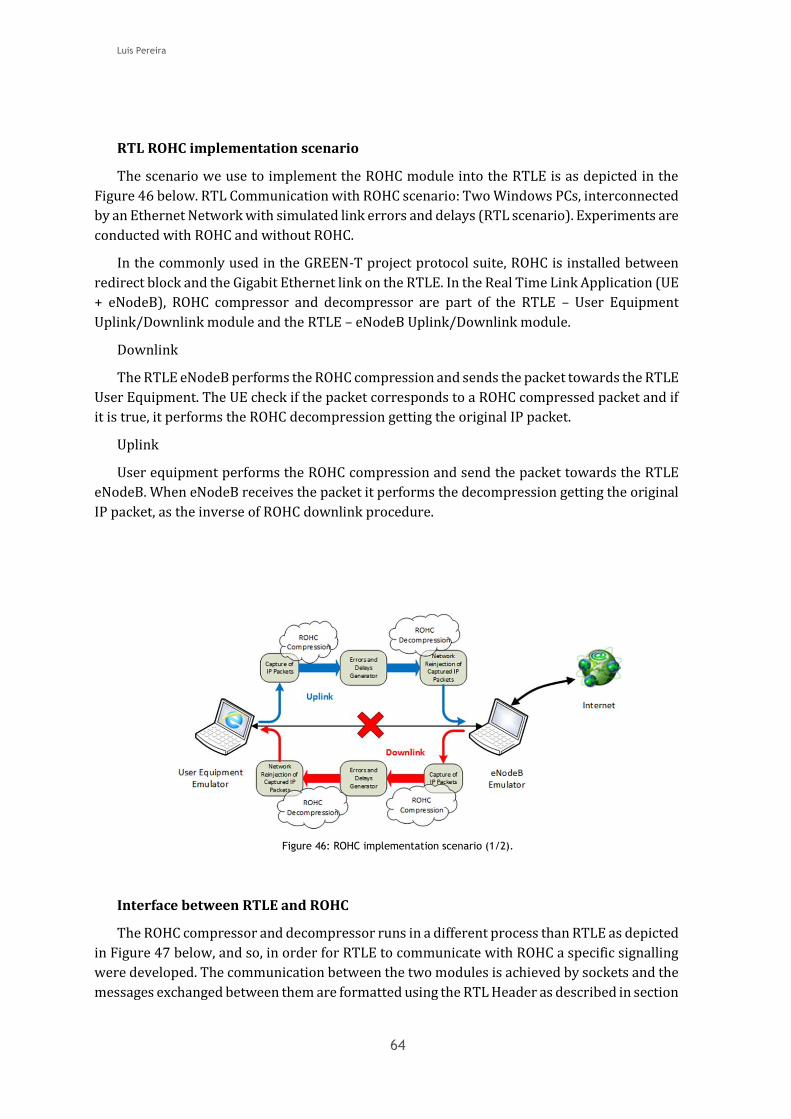
Luis Pereira
64
RTL ROHC implementation scenario
The scenario we use to implement the ROHC module into the RTLE is as depicted in the
Figure 46 below. RTL Communication with ROHC scenario: Two Windows PCs, interconnected
by an Ethernet Network with simulated link errors and delays (RTL scenario). Experiments are
conducted with ROHC and without ROHC.
In the commonly used in the GREEN-T project protocol suite, ROHC is installed between
redirect block and the Gigabit Ethernet link on the RTLE. In the Real Time Link Application (UE
+ eNodeB), ROHC compressor and decompressor are part of the RTLE – User Equipment
Uplink/Downlink module and the RTLE – eNodeB Uplink/Downlink module.
Downlink
The RTLE eNodeB performs the ROHC compression and sends the packet towards the RTLE
User Equipment. The UE check if the packet corresponds to a ROHC compressed packet and if
it is true, it performs the ROHC decompression getting the original IP packet.
Uplink
User equipment performs the ROHC compression and send the packet towards the RTLE
eNodeB. When eNodeB receives the packet it performs the decompression getting the original
IP packet, as the inverse of ROHC downlink procedure.
Figure 46: ROHC implementation scenario (1/2).
Interface between RTLE and ROHC
The ROHC compressor and decompressor runs in a different process than RTLE as depicted
in Figure 47 below, and so, in order for RTLE to communicate with ROHC a specific signalling
were developed. The communication between the two modules is achieved by sockets and the
messages exchanged between them are formatted using the RTL Header as described in section

Platform for Quality of Experience Evaluation in Real Time Applications over LTE networks
65
4.2.3.5. In Example Code 2 is a list of the most common signalling values (messageTypeFlag
values) used in ROHC communications.
Figure 47: ROHC implementation scenario (2/2).
Example Code 2: Signalling used with ROHC communications in RTL Header.
Each one of the signalling values presented in the previous Example code intends to identify
and control the communications between the RTLE and the ROHC application. As an example
we can consider the scenario where the eNodeB compresses a packet and sends it to the User
Equipment, the following steps will be applied:
1. In the eNodeB, the flag 0x1C must be enable, this means that ROHC in connected
and enabled (0x1A & 0x1B);
2. The eNodeB sends the IP Packet to the ROHC compressor with the
messageTypeFlag = 0x1E;
Windows x64User Equipment
Client
DOWNLINK
Internet
DecompressorTCP Port:22225
CompressorTCP Port:22224
ROHC Server
Windows x64eNodeBServer
ROHC Server
// ROHC Downlink Communication // 0x18 0001-1000(2) -> reserved // 0x19 0001-1001(2) -> ROHC Downlink start Connection // 0x1A 0001-1010(2) -> ROHC Downlink eNodeB connected // 0x1B 0001-1011(2) -> ROHC Downlink UE connected // 0x1C 0001-1100(2) -> ROHC Downlink Start ROHC (running) // 0x1D 0001-1101(2) -> ROHC Downlink compressed packet // 0x1E 0001-1110(2) -> ROHC Downlink uncompressed packet // 0x1F 0001-1111(2) -> ROHC Downlink STOP (stop compression) // //************************** // ROHC Uplink Communication // 0x20 0010-0000(2) -> reserved // 0x21 0010-0001(2) -> ROHC Uplink start Connection // 0x22 0010-0010(2) -> ROHC Uplink eNodeB connected // 0x23 0010-0011(2) -> ROHC Uplink UE connected // 0x24 0010-0100(2) -> ROHC Uplink Start ROHC (running) // 0x25 0010-0101(2) -> ROHC Uplink compressed packet // 0x26 0010-0110(2) -> ROHC Uplink uncompressed packet // 0x27 0010-0111(2) -> ROHC Uplink STOP (stop compression)
Luis Pereira
66
3. ROHC proceds with the compression and returns the packet to the eNodeB, but now
with the messageTypeFlag = 0x1D;
4. eNodeB sends the compressed packet towards the User Equipment;
5. the User Equipment receives the 0x1D packet;
6. as the packet is a ROHC compressed packet (0x1D), the UE send it to the ROHC
decompressor;
7. ROHC decompressor returns the packets decompressed to the UE with
messageTypeFlag = 0x1E;
8. UE now has the original IP packet, transmitted along the channel with ROHC.
As stated before, this section is out of scope of the present document, and so, for a complete
description on the modules integrated with the RTL you should refer to Technical Reports of
GREEN-T project (Instituto de Telecomunicações, 2015).
4.2.3 Gigabit Ethernet Link
This third block of the main structure will be responsible to the connection between the
two computers running the emulator.
The starting point is the creation of the connection between the two computers. When this
block is initiated, connections (uplink and downlink and possible others for LTE signalling) are
established and tested as soon as the destination IP is available and the device is ready for the
call. This theme, establishing the connection, will be discussed in more detail later.
Other features inherent to this block are creating errors and delays in transmitting data to
simulate wireless communication in a real scenario. This block will also have a module for
analysis of the links, bit rate analysis in uplink and downlink, and information about delays and
errors produced at each instant, among other information relevant to the emulator.
Briefly, this block, Gigabit Ethernet Link, internally consists of several modules, the main
ones being:
TCP connection
Errors and Delays processing module
o Errors Generator
o Create Delays
o Bitrate control
Link monitoring
4.2.3.1 TCP connection
This module aims to provide a transparent and error free communication. One way to
achieve these goals is through the use of TCP (Transmission Control Protocol) at the transport
layer. The TCP has underperformed the UDP protocol, as has a larger header (20 bytes) than
the UDP (8 bytes) and has some extra signalling between the receiver and the transmitter, e.g.
confirmation of receipt data (ACK packets) or data retransmissions. But in return is guarantee
Platform for Quality of Experience Evaluation in Real Time Applications over LTE networks
67
of delivery of data, i.e. data sent is always received by the receiver, otherwise there is automatic
retransmission of data.
Despite the lower performance achieved by TCP for the UDP, there are a few mechanisms
to significantly reduce this performance gap. The main mechanisms currently used to boost
performance and reduce latency in the transmission are:
• TCP_NODELAY option (consists in disable Nagle's algorithm)
• Non-blocking sockets
Nagle's algorithm
“Nagle’s algorithm, named after John Nagle, is a means of improving the efficiency of TCP/IP
networks by reducing the number of packets that need to be sent over the network.
Nagle's document, Congestion Control in IP/TCP Internetworks (RFC 896) describes what
he called the "small packet problem", where an application repeatedly emits data in small
chunks, frequently only 1 byte in size. Since TCP packets have a 40 byte header (20 bytes for
TCP, 20 bytes for IPv4), this results in a 41 byte packet for 1 byte of useful information, a huge
overhead. (…)
Nagle's algorithm works by combining a number of small outgoing messages, and sending
them all at once. Specifically, as long as there is a sent packet for which the sender has received
no acknowledgment, the sender should keep buffering its output until it has a full packet's
worth of output, so that output can be sent all at once.”.
“(…)Delayed acknowledgments, commonly referred to as delayed ACK, are also designed
into TCP/IP to enable more efficient piggybacking of acknowledgments when return data is
forthcoming from the receiving side application. Unfortunately, if this data is not forthcoming
and the sending side is waiting for an acknowledgment, delays of approximately 200
milliseconds per send can occur.” (Microsoft, s.d.).
TCP_NODELAY
“The TCP_NODELAY option is specific to TCP/IP service providers. The Nagle algorithm is
disabled if the TCP_NODELAY option is enabled (and vice versa). The process involves
buffering send data when there is unacknowledged data already in flight or buffering send data
until a full-size packet can be sent. (…). However, for some applications this algorithm can
impede performance, and TCP_NODELAY can be used to turn it off. These are applications
where many small messages are sent, and the time delays between the messages are
maintained (…).” (Microsoft, s.d.).
Activating this option (TCP_NODELAY) will increase the overhead on the link, but will avoid
the waiting time for sending data, due to the algorithm described above, thus decreasing the
latency of the connection, avoiding delays of approximately 200 milliseconds per send, in the
case of small packages. In the following Example Code (Example Code 3) is one of the ways to
enable/disable the TCP_NODELAY option.
Luis Pereira
68
Example Code 3: example code that shows how to set TCP_NODELAY option.
Non-blocking sockets
Another method to improve performance, but in this case mainly in the application level, is
to place the socket in non-blocking state, using Non-blocking sockets.
“By default, TCP sockets are in "blocking" mode. For example, when you call recv() to read
from a stream, control isn't returned to your program until at least one byte of data is read
from the remote site. This process of waiting for data to appear is referred to as "blocking". The
same is true for the write() API, the connect() API, etc. When you run them, the connection
"blocks" until the operation is complete.
It is possible to set a descriptor so that it is placed in "non-blocking" mode. When placed in
non-blocking mode, you never wait for an operation to complete. This is an invaluable tool if
you need to switch between many different connected sockets, and want to ensure that none
of them cause the program to “lock up”.” (Programming, s.d.)
Activation of Non-blocking sockets adopted for the emulator is summarized in the
following Example Code 4:
Example Code 4: example code to enable NON-BLOCKING sockets.
Connection establishment
Physically there is a single bond where the uplink and downlink occur, but it was chosen to
create different logical connections: one logical connection for downlink and another for
uplink. There are thus two TCP connections.
The setting of each of the links is taken as a normal TCP connection based on three way
handshake, for uplink connection Windows assigns a random port to the socket on the User
// TCP_NODELAY
// If flag = 0, TCP_NODELAY is disable;
// If flag != 0, TCP_NODELAY is enable.
int flag = 1;
int result = setsockopt(*linkSocket, IPPROTO_TCP, TCP_NODELAY, (char *) &flag, sizeof(int));
// NON-BLOCKING socket // If iMode = 0, blocking mode is enabled; // If iMode != 0, non-blocking mode is enabled. u_longiMode=1; ioctlsocket(*linkSocket, FIONBIO, &iMode);
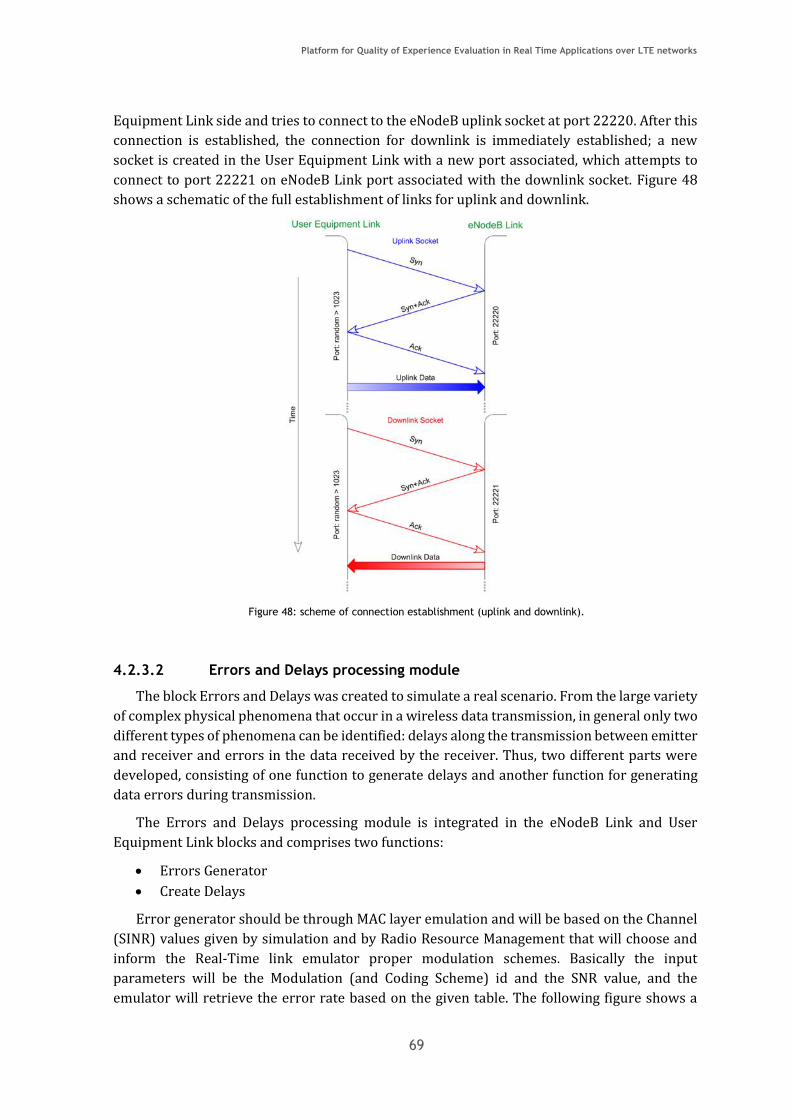
Platform for Quality of Experience Evaluation in Real Time Applications over LTE networks
69
Equipment Link side and tries to connect to the eNodeB uplink socket at port 22220. After this
connection is established, the connection for downlink is immediately established; a new
socket is created in the User Equipment Link with a new port associated, which attempts to
connect to port 22221 on eNodeB Link port associated with the downlink socket. Figure 48
shows a schematic of the full establishment of links for uplink and downlink.
Figure 48: scheme of connection establishment (uplink and downlink).
4.2.3.2 Errors and Delays processing module
The block Errors and Delays was created to simulate a real scenario. From the large variety
of complex physical phenomena that occur in a wireless data transmission, in general only two
different types of phenomena can be identified: delays along the transmission between emitter
and receiver and errors in the data received by the receiver. Thus, two different parts were
developed, consisting of one function to generate delays and another function for generating
data errors during transmission.
The Errors and Delays processing module is integrated in the eNodeB Link and User
Equipment Link blocks and comprises two functions:
Errors Generator
Create Delays
Error generator should be through MAC layer emulation and will be based on the Channel
(SINR) values given by simulation and by Radio Resource Management that will choose and
inform the Real-Time link emulator proper modulation schemes. Basically the input
parameters will be the Modulation (and Coding Scheme) id and the SNR value, and the
emulator will retrieve the error rate based on the given table. The following figure shows a
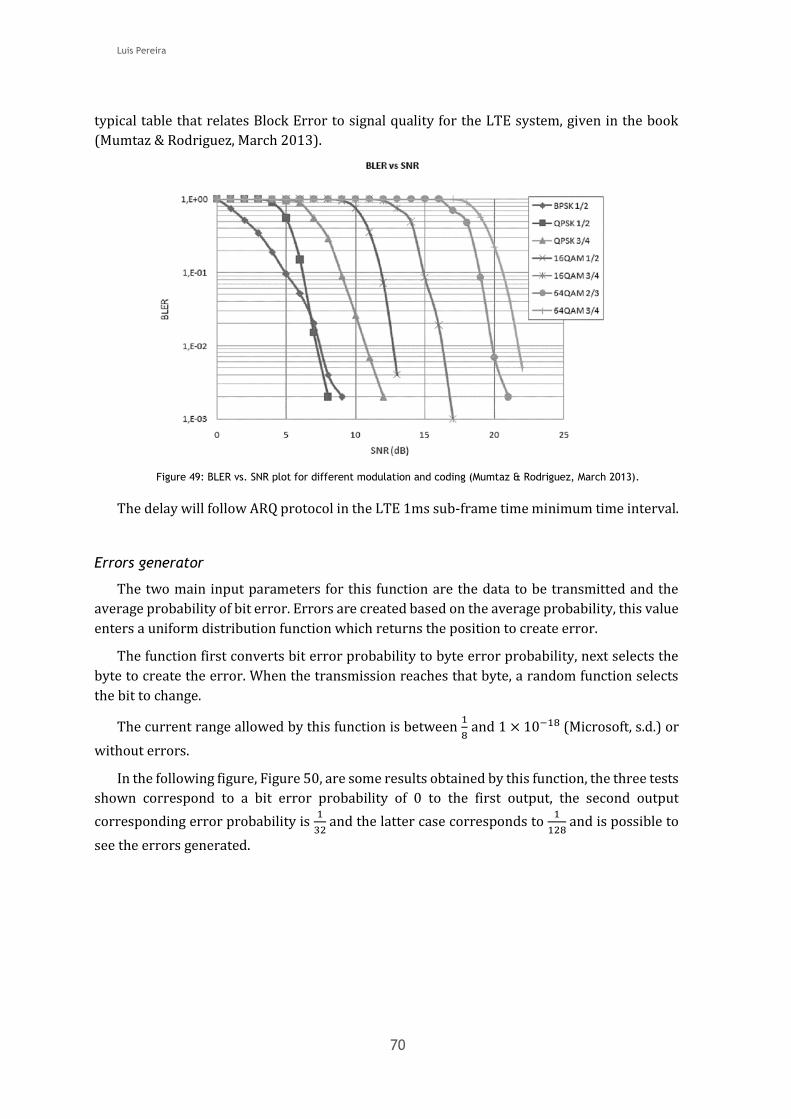
Luis Pereira
70
typical table that relates Block Error to signal quality for the LTE system, given in the book
(Mumtaz & Rodriguez, March 2013).
Figure 49: BLER vs. SNR plot for different modulation and coding (Mumtaz & Rodriguez, March 2013).
The delay will follow ARQ protocol in the LTE 1ms sub-frame time minimum time interval.
Errors generator
The two main input parameters for this function are the data to be transmitted and the
average probability of bit error. Errors are created based on the average probability, this value
enters a uniform distribution function which returns the position to create error.
The function first converts bit error probability to byte error probability, next selects the
byte to create the error. When the transmission reaches that byte, a random function selects
the bit to change.
The current range allowed by this function is between 1
8 and 1 × 10⁻¹⁸ (Microsoft, s.d.) or
without errors.
In the following figure, Figure 50, are some results obtained by this function, the three tests
shown correspond to a bit error probability of 0 to the first output, the second output
corresponding error probability is 1
32 and the latter case corresponds to
1
128 and is possible to
see the errors generated.
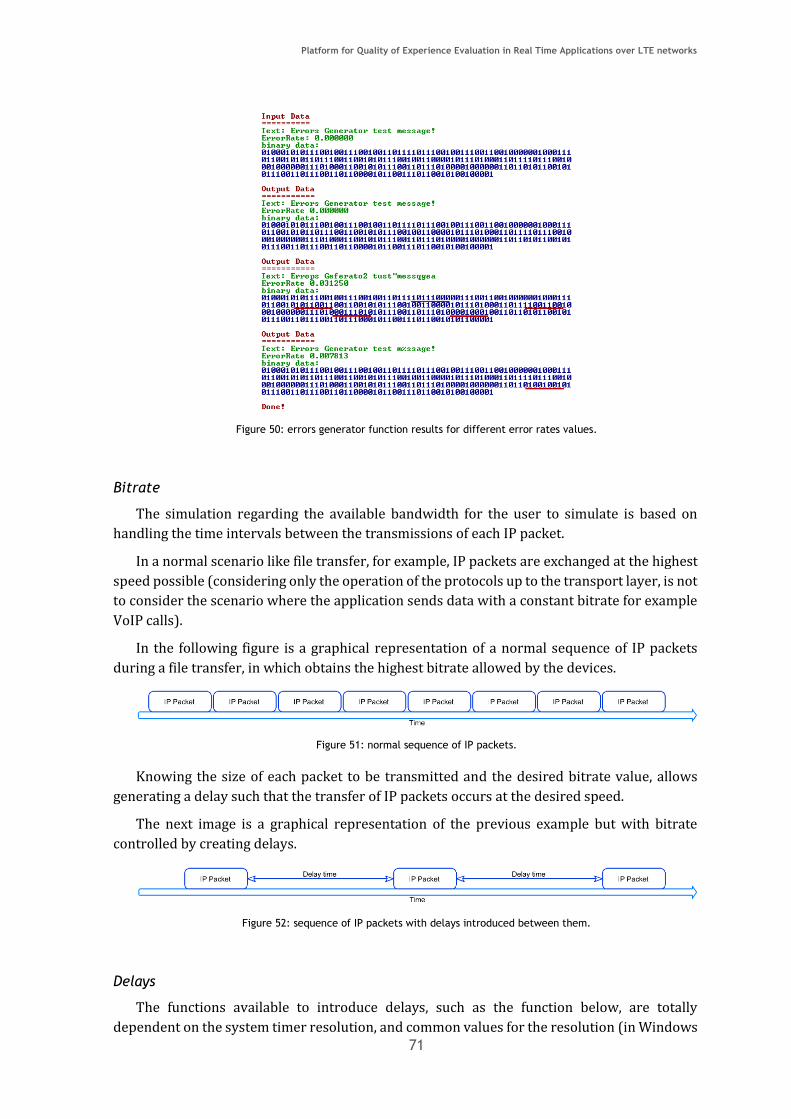
Platform for Quality of Experience Evaluation in Real Time Applications over LTE networks
71
Figure 50: errors generator function results for different error rates values.
Bitrate
The simulation regarding the available bandwidth for the user to simulate is based on
handling the time intervals between the transmissions of each IP packet.
In a normal scenario like file transfer, for example, IP packets are exchanged at the highest
speed possible (considering only the operation of the protocols up to the transport layer, is not
to consider the scenario where the application sends data with a constant bitrate for example
VoIP calls).
In the following figure is a graphical representation of a normal sequence of IP packets
during a file transfer, in which obtains the highest bitrate allowed by the devices.
Figure 51: normal sequence of IP packets.
Knowing the size of each packet to be transmitted and the desired bitrate value, allows
generating a delay such that the transfer of IP packets occurs at the desired speed.
The next image is a graphical representation of the previous example but with bitrate
controlled by creating delays.
Figure 52: sequence of IP packets with delays introduced between them.
Delays
The functions available to introduce delays, such as the function below, are totally
dependent on the system timer resolution, and common values for the resolution (in Windows
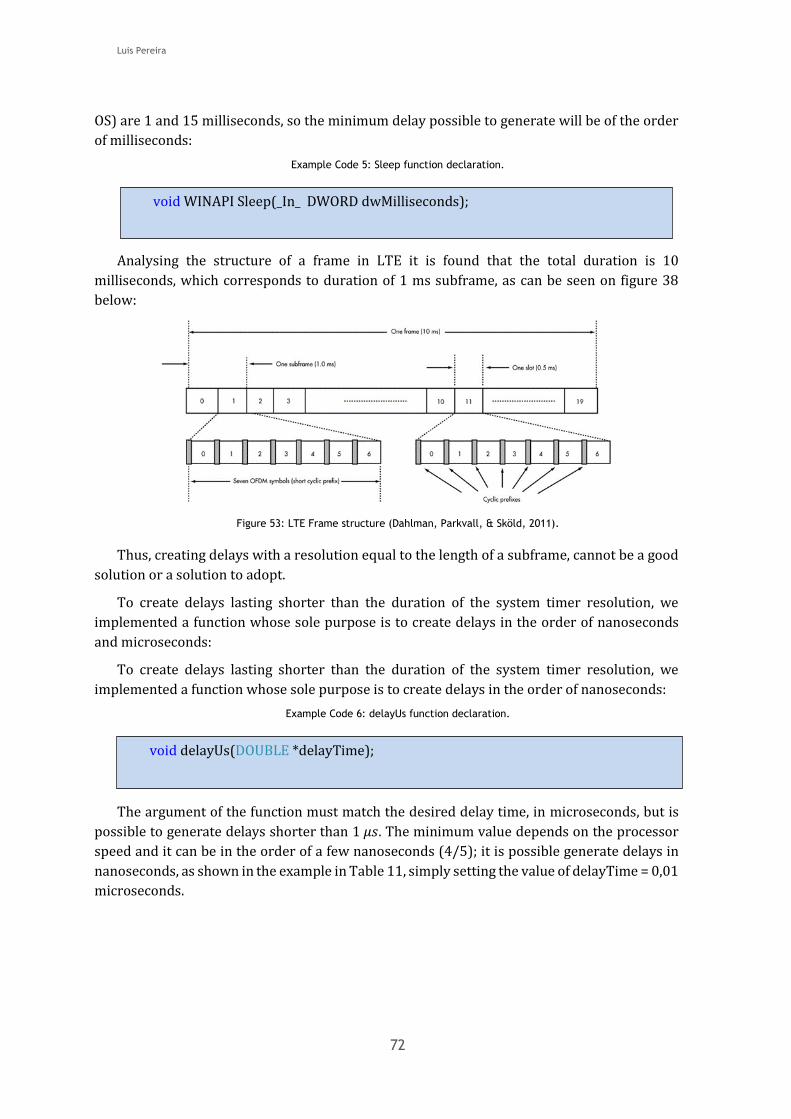
Luis Pereira
72
OS) are 1 and 15 milliseconds, so the minimum delay possible to generate will be of the order
of milliseconds:
Example Code 5: Sleep function declaration.
Analysing the structure of a frame in LTE it is found that the total duration is 10
milliseconds, which corresponds to duration of 1 ms subframe, as can be seen on figure 38
below:
Figure 53: LTE Frame structure (Dahlman, Parkvall, & Sköld, 2011).
Thus, creating delays with a resolution equal to the length of a subframe, cannot be a good
solution or a solution to adopt.
To create delays lasting shorter than the duration of the system timer resolution, we
implemented a function whose sole purpose is to create delays in the order of nanoseconds
and microseconds:
To create delays lasting shorter than the duration of the system timer resolution, we
implemented a function whose sole purpose is to create delays in the order of nanoseconds:
Example Code 6: delayUs function declaration.
The argument of the function must match the desired delay time, in microseconds, but is
possible to generate delays shorter than 1 𝜇𝑠. The minimum value depends on the processor
speed and it can be in the order of a few nanoseconds (4/5); it is possible generate delays in
nanoseconds, as shown in the example in Table 11, simply setting the value of delayTime = 0,01
microseconds.
void WINAPI Sleep(_In_ DWORD dwMilliseconds);
void delayUs(DOUBLE *delayTime);

Platform for Quality of Experience Evaluation in Real Time Applications over LTE networks
73
Table 13: example input arguments in delayUs() function.
Function Delay
delayUs(1e-2) 10 nanoseconds
delayUs(1); 1 microsecond
delayUs(1e3) 1 millisecond
delayUs(1e6) 1 second
Network Delay
There are however some delays inherent in the network delays both signal propagation
inside the cable between the two computers and delays on the card network due to processing
of the data before sending and after receiving them. Mathematically the propagation delay of
the signal between the two computers can be obtained by:
𝑡𝑖𝑚𝑒 =𝑠𝑝𝑎𝑐𝑒
𝑣𝑒𝑙𝑜𝑐𝑖𝑡𝑦
Since the speed of propagation of an electromagnetic wave is given by:
𝑣𝑝 = √1
𝜀 × 𝜇
In the case of UTP cable Cat. 5e propagation velocity is 68% of the velocity in vacuum, then:
𝑣𝑝 = 𝑐 × 0.68 = 3 × 108 × 0.68 = 204 × 106 𝑚/𝑠
In a practice situation where you have 3 meter cable length corresponding propagation
delay is:
𝑑𝑒𝑙𝑎𝑦 =𝑠
𝑣𝑝⇔ 𝑑 =
3
204 × 106= 14.7 𝑛𝑠
The time spent by the processor of the network adapter obtained experimentally
corresponds approximately to the average 100 milliseconds.
Note: delayUs() function described above takes into account these delays in the connection
between computers, subtracting this delay to the desired delay:
𝐷𝑒𝑙𝑎𝑦 𝑡𝑜 𝑐𝑎𝑢𝑠𝑒 = 𝑑𝑒𝑠𝑖𝑟𝑒𝑑 𝐷𝑒𝑙𝑎𝑦 − 𝐺𝑖𝑔𝑎𝑏𝑖𝑡 𝐸𝑡ℎ𝑒𝑟𝑛𝑒𝑡 𝑙𝑖𝑛𝑘 𝐷𝑒𝑙𝑎𝑦
When the links are created, downlink and uplink, tests are made to obtain an average value
of the delay, to simulate delays as accurately as possible.
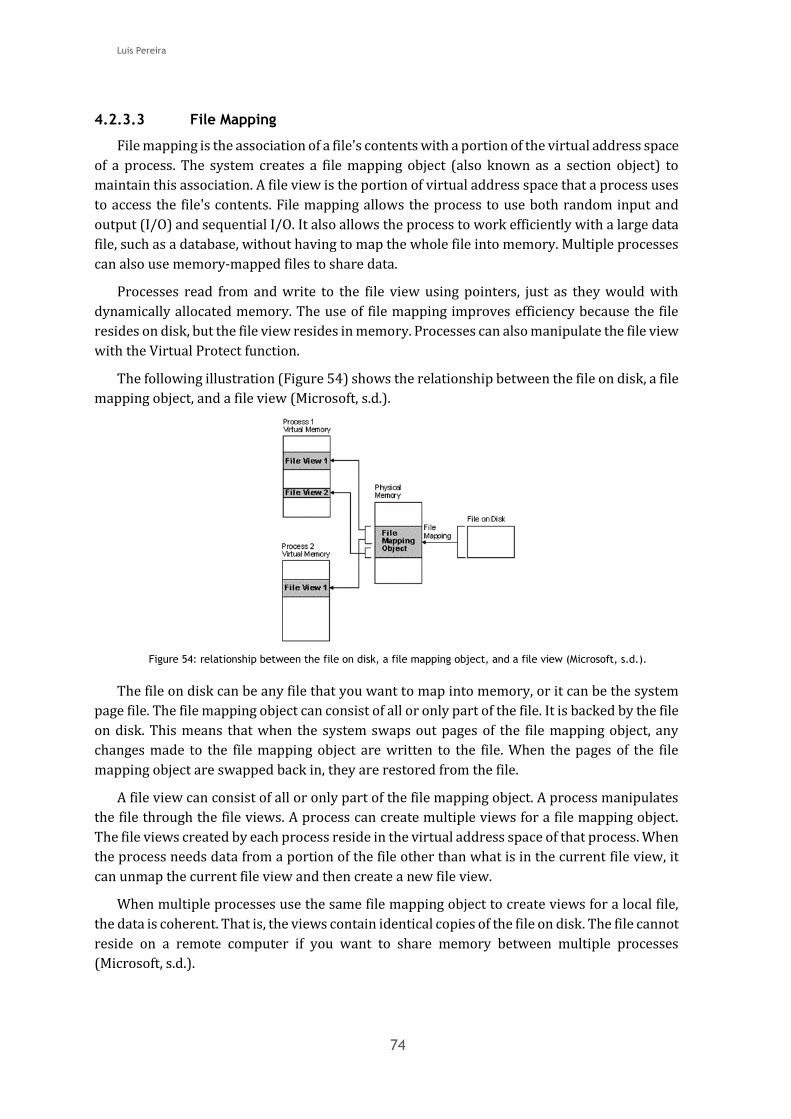
Luis Pereira
74
4.2.3.3 File Mapping
File mapping is the association of a file's contents with a portion of the virtual address space
of a process. The system creates a file mapping object (also known as a section object) to
maintain this association. A file view is the portion of virtual address space that a process uses
to access the file's contents. File mapping allows the process to use both random input and
output (I/O) and sequential I/O. It also allows the process to work efficiently with a large data
file, such as a database, without having to map the whole file into memory. Multiple processes
can also use memory-mapped files to share data.
Processes read from and write to the file view using pointers, just as they would with
dynamically allocated memory. The use of file mapping improves efficiency because the file
resides on disk, but the file view resides in memory. Processes can also manipulate the file view
with the Virtual Protect function.
The following illustration (Figure 54) shows the relationship between the file on disk, a file
mapping object, and a file view (Microsoft, s.d.).
Figure 54: relationship between the file on disk, a file mapping object, and a file view (Microsoft, s.d.).
The file on disk can be any file that you want to map into memory, or it can be the system
page file. The file mapping object can consist of all or only part of the file. It is backed by the file
on disk. This means that when the system swaps out pages of the file mapping object, any
changes made to the file mapping object are written to the file. When the pages of the file
mapping object are swapped back in, they are restored from the file.
A file view can consist of all or only part of the file mapping object. A process manipulates
the file through the file views. A process can create multiple views for a file mapping object.
The file views created by each process reside in the virtual address space of that process. When
the process needs data from a portion of the file other than what is in the current file view, it
can unmap the current file view and then create a new file view.
When multiple processes use the same file mapping object to create views for a local file,
the data is coherent. That is, the views contain identical copies of the file on disk. The file cannot
reside on a remote computer if you want to share memory between multiple processes
(Microsoft, s.d.).

Platform for Quality of Experience Evaluation in Real Time Applications over LTE networks
75
The File Mapping is used to transfer information between different processes of the
emulator. The structure designed to transmit the data is composed of four elements: size, delay,
ErrorRate and Data. A brief description of each one is given below:
Size – corresponds to the number of bytes to be transmitted, the size of the byte array
"data", in other words, if there is no change in the IP packet captured in this field will
be the total size of the IP packet (including IP header);
Delay – in this variable will be introduced the desired delay in the transmission of data
currently presents the structure;
ErrorRate – corresponds to the mean value of error probability to produce in the array
to generate data to be transmitted, “data”;
Data – actively transmitting data between User Equipment and eNodeB or vice versa.
In the following Example Code 7 is represented the struct FILEDATA, the structure that
contains the parameters described above and used in the source code:
Example Code 7: structure of data to exchange between processes.
4.2.3.4 Multithreading
Multithreading is the ability of an operating system to execute different parts of a program,
called threads, simultaneously. (The programmer must carefully design the program in such a
way that all the threads can run at the same time without interfering with each other.)
“A thread is basically a path of execution through a program. It is also the smallest unit of
execution that Win32 schedules. A thread consists of a stack, the state of the CPU registers, and
an entry in the execution list of the system scheduler. Each thread shares all the process's
resources.
A process consists of one or more threads and the code, data, and other resources of a
program in memory. Typical program resources are open files, semaphores, and dynamically
allocated memory. A program executes when the system scheduler gives one of its threads
execution control. The scheduler determines which threads should run and when they should
run. Threads of lower priority might have to wait while higher priority threads complete their
tasks. On multiprocessor machines, the scheduler can move individual threads to different
processors to balance the CPU load.
Each thread in a process operates independently. Unless you make them visible to each
other, the threads execute individually and are unaware of the other threads in a process
(Microsoft, s.d.).
In order to increase the performance and efficiency of each emulator block, each process is
divided into different threads. The two most important threads are downlink and uplink
struct FILEDATA { int size; // size of “data” in bytes DOUBLE delay; // delay time in microseconds DOUBLEerrorRate; // probability of error char data[FILE_DATA_SIZE]; // data to transfer };
Luis Pereira
76
threads. Each process has a thread for processing downlink information, and another thread
for processing the uplink information.
4.2.3.5 Real Time Link protocol
In order to achieve the requisites for the RTL a completely new Protocol were been
developed. This new protocol beyond control the packet flow still allows to identify and
categorize the different packets exchanged inside the RTL emulator. This additional
information, designed by RTL Header is added on top of TCP Header (see Figure 55).
The RTL Header consists in a 3 bytes length information that is appended to the beginning
of each data transferred on the emulator as depicted in Figure 55 below.
The first two bytes of RTL Header correspond to the size of the “Data” field (in bytes), as
described before. The third byte, the “messageTypeFlag” value, is a new byte added to identify
the type of data in the “Data” field (i.e.: RTL internal signalling, ROHC data, SLS data…). In
section 4.2.2 are described the most important values used in messageTypeFlag for
communication with ROHC and SLS GUI.
To explain the use of the RTL Header we will consider the scenario of a packet capture.
After the capture procedure, a packet is sent to the next block, "eNodeB" or "User Equipment"
depending on the packet direction.
To simplify the implementation, we use one variable of type FILEDATA (see 4.2.3.3) to
process useful information, such as the data length, instead of implementing the whole features
of LTE mechanism at once, since at this point it is still easy to determine the total size of data
transferred, from field "Total Length" contained in the IP Header (Postel, September 1981).
With this solution, we always have the required information to process data, regardless of
the protocol used (IPv4, IPv6, PDCP, RLC, MAC, etc.).
Variable FILEDATA contains "data" field, the "size" field with byte size of the field "Data".
That is, if you change the field "data" you should also update the field "size" with new data size.
So, in addition to the normal protocol procedures we need to update field "size" with the
total bytes of the data placed in the field "data" before transmitting to block "Gigabit Ethernet
Link". When "FILEDATA" information reaches "Gigabit Ethernet Link" block, via File Mapping,
this block knows what to send to the network and the amount of bytes to send.
This implementation also allows testing each protocol without affecting the correct
functioning of the emulator (works for protocols IPv4, IPv6, PDCP, RLC, MAC, etc.).
At the receiver, there is no direct way for the receiving block to know how many bytes were
sent for a given packet, and the connection is not finished after each packet sent. So if you get
all the data available, for example, the block could receive data of the next packet. In order to
transmit the data size, 2 bytes are added to the data being transmitted. These two bytes identify
the total size of bytes that make up the packet to be transmitted and are placed at the beginning
of the data to be transferred.
Before receiving all the data, the destination block calls function "recv()" (Microsoft, s.d.),
setting argument "len" to the value "2", so the function returns only the two bytes that identify
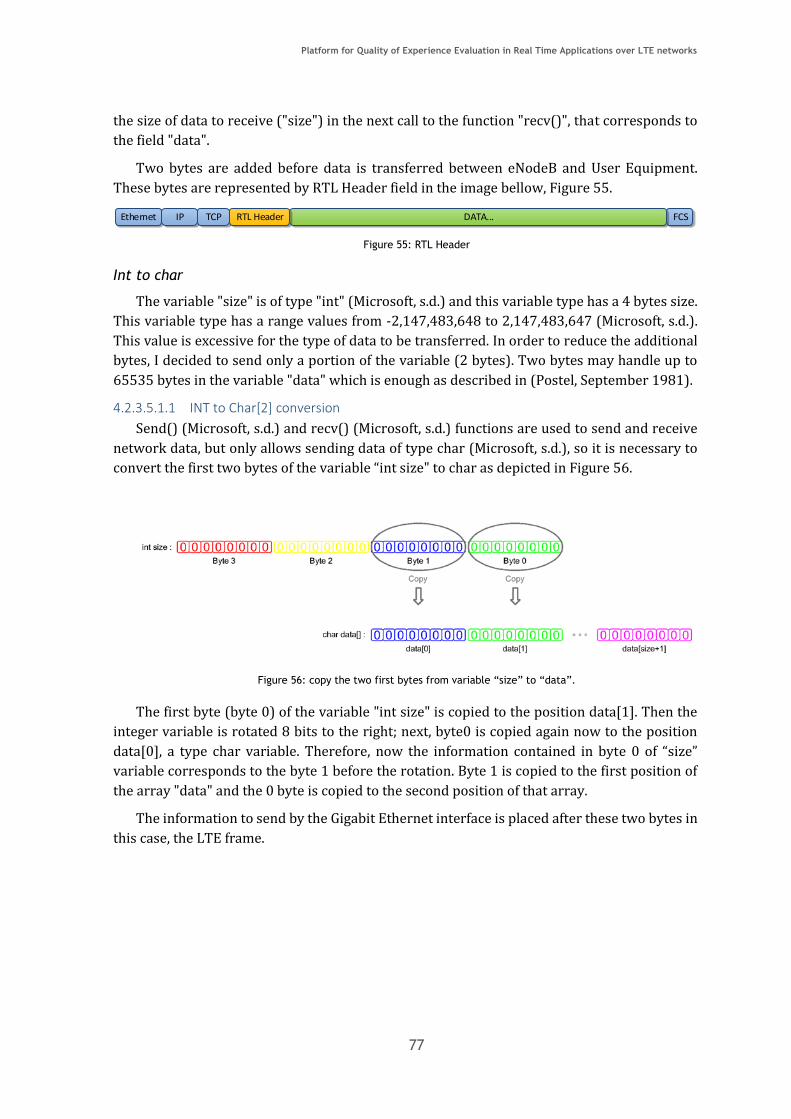
Platform for Quality of Experience Evaluation in Real Time Applications over LTE networks
77
the size of data to receive ("size") in the next call to the function "recv()", that corresponds to
the field "data".
Two bytes are added before data is transferred between eNodeB and User Equipment.
These bytes are represented by RTL Header field in the image bellow, Figure 55.
Figure 55: RTL Header
Int to char
The variable "size" is of type "int" (Microsoft, s.d.) and this variable type has a 4 bytes size.
This variable type has a range values from -2,147,483,648 to 2,147,483,647 (Microsoft, s.d.).
This value is excessive for the type of data to be transferred. In order to reduce the additional
bytes, I decided to send only a portion of the variable (2 bytes). Two bytes may handle up to
65535 bytes in the variable "data" which is enough as described in (Postel, September 1981).
4.2.3.5.1.1 INT to Char[2] conversion
Send() (Microsoft, s.d.) and recv() (Microsoft, s.d.) functions are used to send and receive
network data, but only allows sending data of type char (Microsoft, s.d.), so it is necessary to
convert the first two bytes of the variable “int size" to char as depicted in Figure 56.
Figure 56: copy the two first bytes from variable “size” to “data”.
The first byte (byte 0) of the variable "int size" is copied to the position data[1]. Then the
integer variable is rotated 8 bits to the right; next, byte0 is copied again now to the position
data[0], a type char variable. Therefore, now the information contained in byte 0 of “size”
variable corresponds to the byte 1 before the rotation. Byte 1 is copied to the first position of
the array "data" and the 0 byte is copied to the second position of that array.
The information to send by the Gigabit Ethernet interface is placed after these two bytes in
this case, the LTE frame.
Ethernet IP TCP FCSDATA...RTL Header
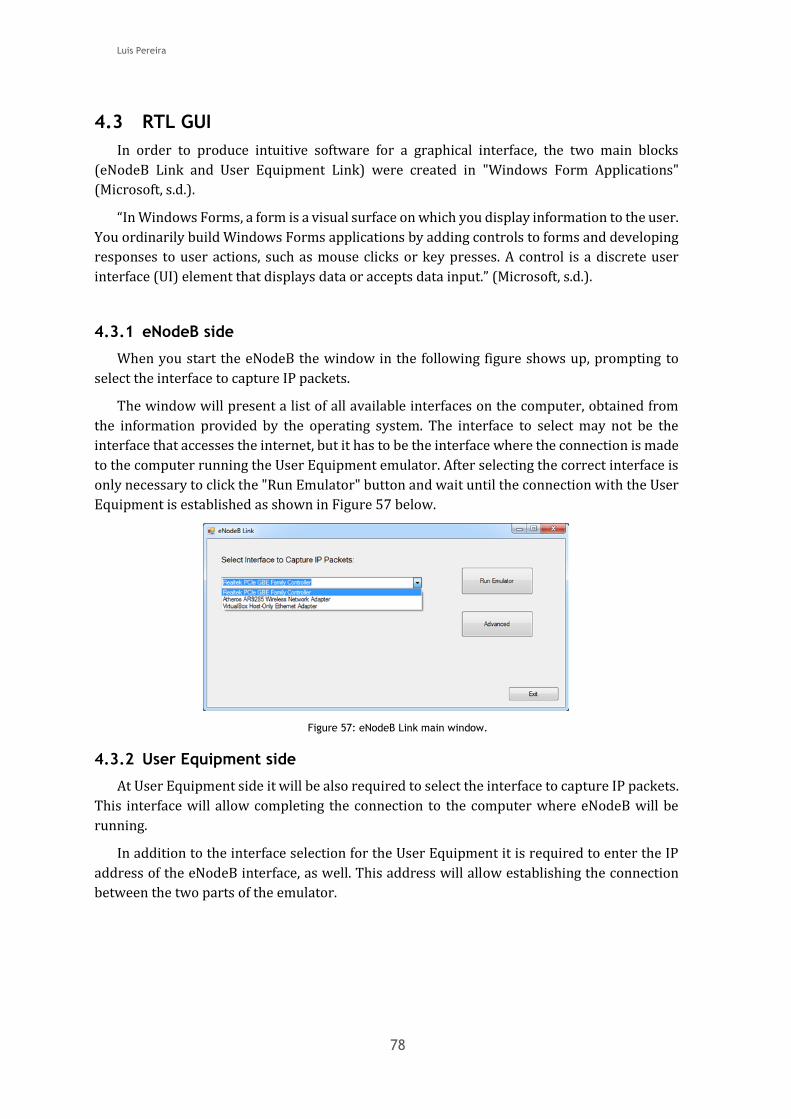
Luis Pereira
78
4.3 RTL GUI
In order to produce intuitive software for a graphical interface, the two main blocks
(eNodeB Link and User Equipment Link) were created in "Windows Form Applications"
(Microsoft, s.d.).
“In Windows Forms, a form is a visual surface on which you display information to the user.
You ordinarily build Windows Forms applications by adding controls to forms and developing
responses to user actions, such as mouse clicks or key presses. A control is a discrete user
interface (UI) element that displays data or accepts data input.” (Microsoft, s.d.).
4.3.1 eNodeB side
When you start the eNodeB the window in the following figure shows up, prompting to
select the interface to capture IP packets.
The window will present a list of all available interfaces on the computer, obtained from
the information provided by the operating system. The interface to select may not be the
interface that accesses the internet, but it has to be the interface where the connection is made
to the computer running the User Equipment emulator. After selecting the correct interface is
only necessary to click the "Run Emulator" button and wait until the connection with the User
Equipment is established as shown in Figure 57 below.
Figure 57: eNodeB Link main window.
4.3.2 User Equipment side
At User Equipment side it will be also required to select the interface to capture IP packets.
This interface will allow completing the connection to the computer where eNodeB will be
running.
In addition to the interface selection for the User Equipment it is required to enter the IP
address of the eNodeB interface, as well. This address will allow establishing the connection
between the two parts of the emulator.

Platform for Quality of Experience Evaluation in Real Time Applications over LTE networks
79
Figure 58: User Equipment Link main window.
4.3.3 ENodeB Statistics and Connection Settings
After establishing a connection between the eNodeB Link and the User Equipment Link, a
new window opens on the eNodeB side. In this window you can see the speeds of downlink
and uplink on line charts, representing the bit rate in (Mbits/s) in order to time. There are also
options to set the link status; see example on following figure, Figure 59:
Figure 59: eNodeB Link statistics and Connection Settings window.
In the previous figure, Figure 59, it is possible to identify where we can define statically
some connection parameters both for downlink and uplink. The parameters that are possible
to adjust statically are:
Desired bitrate: In this field is possible to define the maximum mean bitrate value. If a
value is set the emulator only allows transmissions up to that value.
Bit error rate probability: This value corresponds to the mean bit error value to
produce in the transmission.
Delay: Defines the delay between each IP packet, this value should be in microseconds.

Luis Pereira
80

Platform for Quality of Experience Evaluation in Real Time Applications over LTE networks
81
5 Integration with the System Level Simulator In order to emulate a real communication through the emulator is necessary that the
different modules constituting the emulator can communicate with each other. After the SLS
finalize all simulations, it is necessary that it sends the values obtained towards RTLE, so that
it can emulate a simulated communication. In this report will be described in detail the
procedures for establishing communication between the SLS and the RTLE, as well as the
structure of the messages exchanged between them so that RTLE can emulate the real time
communication according to the simulations.
The LTE emulator was divided in four software modules:
System Level Simulator (SLS) consists in the SLS process where it is the entire SLS core
used for simulation purposes;
GUI: developed to improve the SLS operability software modules;
RTLE eNodeB: eNodeB emulator;
RTLE User Equipment: User Equipment emulator.
The Input File and Output File blocks are also represented (although they are not software
modules) due to their relevant communications with the SLS Process and the GUI. The GUI
communicates with the SLS process, the RTLE eNodeB, the Input Files and Output Files. In turn,
the RTLE eNodeB communicates with the RTLE User Equipment and has an Internet access
provided by the LTE eNodeB.
The user interaction with the SLS is performed only through the GUI. Using the GUI the user
has access to all the simulation parameters (in the Input Files) and also the simulation results
(in the Output Files). The Input Files consists in three files: General parameters file, Base
Stations file and User Equipment’s file.
Figure 60: LTE emulator, main software modules.
The LTE emulator is composed by two main processes: the simulation process and the
emulation process, represented in Figure 61 and Figure 62. In both figures it is shown the main
blocks (as mentioned above), the main communications as blue line and a sequence of events
(sorted by numbers) that lead to the main objective, to simulate or emulate. In addition, the
real implementation perspective is also presented. LTE emulator is implemented in two
computers, PC1 and PC2 with Windows OS, and one virtual computer in PC1 with Linux OS.
PC1 has an Ethernet connection with PC2 and a Wi-Fi connection with the Internet Access, as
depicted in Figure 62. Inside PC1 a virtual Ethernet connection was created between Windows
and Linux OSs. In terms of software modules in PC1 are the SLS process, GUI and RTLE eNodeB.
In PC2 the RTLE User Equipment is the main software module. As described previously, the
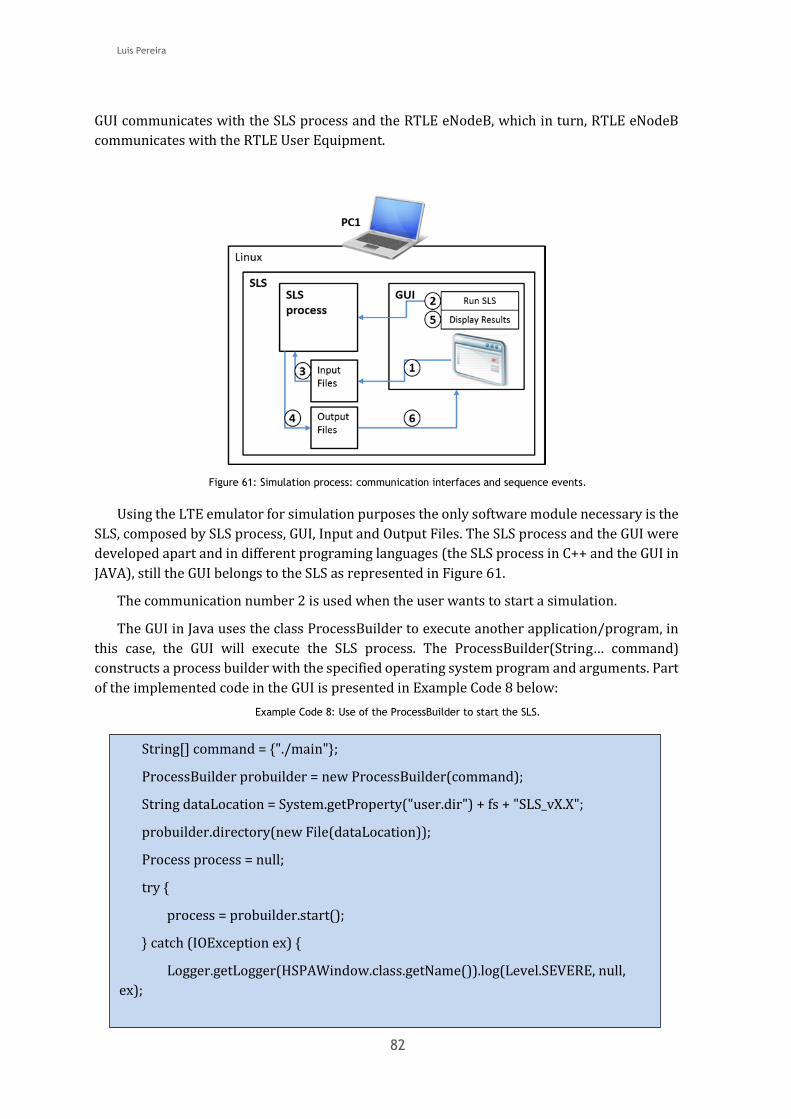
Luis Pereira
82
GUI communicates with the SLS process and the RTLE eNodeB, which in turn, RTLE eNodeB
communicates with the RTLE User Equipment.
Figure 61: Simulation process: communication interfaces and sequence events.
Using the LTE emulator for simulation purposes the only software module necessary is the
SLS, composed by SLS process, GUI, Input and Output Files. The SLS process and the GUI were
developed apart and in different programing languages (the SLS process in C++ and the GUI in
JAVA), still the GUI belongs to the SLS as represented in Figure 61.
The communication number 2 is used when the user wants to start a simulation.
The GUI in Java uses the class ProcessBuilder to execute another application/program, in
this case, the GUI will execute the SLS process. The ProcessBuilder(String… command)
constructs a process builder with the specified operating system program and arguments. Part
of the implemented code in the GUI is presented in Example Code 8 below:
Example Code 8: Use of the ProcessBuilder to start the SLS.
String[] command = {"./main"};
ProcessBuilder probuilder = new ProcessBuilder(command);
String dataLocation = System.getProperty("user.dir") + fs + "SLS_vX.X";
probuilder.directory(new File(dataLocation));
Process process = null;
try {
process = probuilder.start();
} catch (IOException ex) {
Logger.getLogger(HSPAWindow.class.getName()).log(Level.SEVERE, null,
ex);

Platform for Quality of Experience Evaluation in Real Time Applications over LTE networks
83
Communication number 1 and 6, from Figure 61, are used when the GUI reads or writes in
the text files located in the Input or Output Files blocks. Using the GUI, the user is able to modify
the simulation parameterization by writing the input files (number 1) and he is able to analyze
the simulation results by reading the output files (number 6). To access these text files the GUI
has in memory all the file paths. For example, if the user wants to modify the Base Station file,
the GUI knows the file path is “SLS_vX.X\config\BS_file.csv” or if the GUI needs to read one of
the results file the path is for example “SLS_vX.X\results\allUsersData.csv”. If for some reason
a file is placed in a different location from the file path that the GUI has, the GUI will not be able
to find this file.
Figure 61 displays a sequence of events sorted by number from 1 to 6. The command
sequence is quite relevant for the proper operation of the simulation process and for the
correct use of the GUI.
As expected, the simulation process starts by setting all the parameters for the simulation.
The user uses the GUI to modify the input files (number 1) and when it ends, the user needs to
press the “Run SLS” button (in the GUI main control area) to execute the SLS process (number
2). The SLS process reads the Input Files (number 3) and runs the simulation. When the
simulation ends, all the relevant data is store in the output files (number 4). By pressing the
“Display Simulation” button (number 5) the GUI will access the results (number 6) and it will
display the simulation results in a graphical representation.
Figure 62: Emulation process: communication interfaces and sequence events.
For using the LTE emulator for emulation purposes most of the software modules are
required. As presented in Figure 62 the only software module not used in the emulation
process is the SLS process. At this stage we are assuming that a simulation was previously
performed so the emulation process has access to the simulation results, in the Output Files
block. To have these result files the user can perform a simulation process or use the results
form an older simulation by “copy and paste” the result files in the Output Files folder. For the
emulation process two computer are required, PC1 (Windows OS and a virtual machine with
Linux OS) and PC2 (with Windows OS). As explained previously, PC1 has the SLS and the RTLE

Luis Pereira
84
eNodeB and PC2 the RTLE User Equipment. The RTLE eNodeB communicates with the RTLE
User Equipment through an Ethernet connection, with the GUI through a virtual Ethernet
connection and with the Internet Access through a Wi-Fi connection.
The communication between the SLS process and the GUI was already described
previously, in section 3. The communications interfaces between RTLE eNodeB - Internet
Access and RTLE eNodeB - RTLE User Equipment are explained with more detail in the RTLE
section. So the remaining interface to address is the communication between the GUI and the
RTLE eNodeB.
The virtual Ethernet connection in PC1 was created so the GUI (in the Linux virtual
machine) and the RTLE eNodeB (in the Windows computer) can communicate. With this
virtual Ethernet connection it was possible to implement a communication over Transmission
Control Protocol (TCP) between the two programs, GUI and RTLE eNodeB. TCP provides a
reliable point-to-point communication, channel that client-server applications on the Internet
use to communicate with each other. To communicate over TCP, a client program and a server
program establish a connection to one another, in our case the GUI and the RTLE eNodeB. Each
program binds a socket to its end of the connection. A socket is one end-point of two-way
communication link between two programs running on the network.
Before initiating an emulation process both SLS and RTLE must be running, but to have the
RTLE fully operational, the communications interfaces between RTLE eNodeB - Internet Access
and RTLE eNodeB - RTLE User Equipment need to be previously activated, following the step
described in the RTLE section.
To describe the emulation process, Figure 62 presents a sequence of events that are sorted
by number from 1 to 4. The emulation process is initiated when the user presses the “Prepare
Emulation” button, located in the GUI main control area. This action, represented in Figure 62
as number 1, establishes the TCP connection between GUI and RTLE eNodeB. At the same time,
the GUI reads all the relevant data from the Output Files and stores it in the program memory
(number 2) so the GUI has a quicker access to the data when sending it, each millisecond, to
the RTLE. Once the TCP connection is active and the data is stored in the program memory, the
GUI waits for an order to start the emulation. This order/command comes from the RTLE User
Equipment, the “Start Emulation” button (number 3).
The GUI will wait while the “inputBuffer” send by the RTLE User Equipment is different
from 0x11. When the user presses the “Start Emulation” button in the RTLE User Equipment
(number 3), the order (value 0x11) to start the emulation is send to the GUI. The GUI initiates
the emulation by performing three tasks (number 4) at the same time, all of them synchronized.
In one of the tasks, the GUI accesses memory to get all the BSs and UEs data and displays the
simulation scenario along with some relevant data, in the GUI window. In another task, the GUI
accesses memory to get the chosen UE data and sends the data, each millisecond, to the RTLE
eNodeB. With the remaining task the GUI updates the progress bar until the emulation ends.
At the end of emulation the GUI sends a flag to the RTLE User Equipment to notify the end, this
way the RTLE UE can release the “Start Emulation” button and the emulation process can be
repeated.

Platform for Quality of Experience Evaluation in Real Time Applications over LTE networks
85
5.1 Interface between RTLE and SLS GUI
In order for RTLE and SLS GUI communicates, it was defined a specific signaling for RTL
Header for the communication between this two modules. In this section is explained the
signaling exchanged between the RTL and the SLS GUI.
The signaling defined for this communication intends to identify, for example, when
connection is established, when the simulation shall start, finish or cancelled. The most
common signaling data exchanged between RTL and SLS GUI are depicted in the next Example
Code 9. There are other signaling values that are used related with SLS GUI in the RTL Emulator,
but since this values are used only internally on the emulator, they will not be listed in this
section.
Example Code 9: Signalling used in SLS communications (some of the values defined in RTL Header for communication with SLS).
5.2 RTL SLS GUI communication
In order to System Level Simulator (GUI) communicates with Real Time Link two steps
should be performed after the RTLE starts:
1. Establish the connection between RTL and SLS GUI
a. On the eNodeB side of emulator there are a menu designed by “System Level
Simulator” and then click on “Connect with SLS”. This enables the RTL to accept
a connection from the GUI.
b. On the GUI is necessary to establish the connection (“Prepare RTL” Button)
2. Click on “Start SLS Simulation” button on the User Equipment side of RTL
a. After a successful connection by both sides (RTL and SLS GUI) the emulator is
ready to start the simulation. When a click occurs on the “Start SLS Simulation”
button at the User Equipment emulator is started the simulation process.
b. The SLS GUI starts sending data to Real Time Link each millisecond.
The flowchart of the communication steps is depicted on Figure 63 below:
// SLS Communication // 0x10 0001-0000 -> reserved // 0x11 0001-0001 -> Start SLS Simulation // 0x12 0001-0010 -> SLS data (Downlink Bitrate(8)[0], Downlink
BitErrorRate(8)[8], Downlink Delay(8)[16], Uplink Bitrate(8)[24], Uplink BitErrorRate(8)[32], Uplink Delay(8)[40])
// 0x13 0001-0011 -> End SLS communication (simulation finishes) // 0x14 0001-0100 -> SLS Connected // 0x15 0001-0101 -> SLS Not Connected // 0x16 0001-0110 -> SLS Cancel simmulation // 0x17 0001-0111 -> not used

Luis Pereira
86
Figure 63: RTL SLS GUI communication flowchart.
The packets sent from SLS GUI to RTL (designate in Figure 63 by “SLS Data”) carrying values
of bitrate, bit error rate and delays for uplink and downlink. Once the values are received by
the RTLE, the channel between UE and eNodeB are adapted according with those values. All
the values are “Double” type (8 byte length) and converted to byte[] array when inserted in the
packet according with Figure 64. After the conversion the SLS GUI sends the packet towards
the RTLE.
Figure 64: data transferred between SLS and RTLE.
When RTLE receives the packet, it converts the byte [] array into the original Double values
and applies those values to the channel.
5.3 Running SLS with RTLE
When running the SLS with the RTLE the SLS sends some of simulated values towards the
RTLE, each millisecond. In order to the RTL receive data from the SLS a few steps must be
performed:
Start SLS GUI, and select a previous simulation results to emulate.
Start RTL
Start connection between RTLE and SLS
Start simulation
Note: when the simulation finishes it is possible to run the same simulation or to choose a
new simulation at the SLS GUI as described in section 3.2.
Ethernet IP TCP FCSDATA...RTL Header
Downlink BitErrorRateDownlink Bitrate Downlink Delay Uplink BitErrorRateUplink Bitrate Uplink Delay
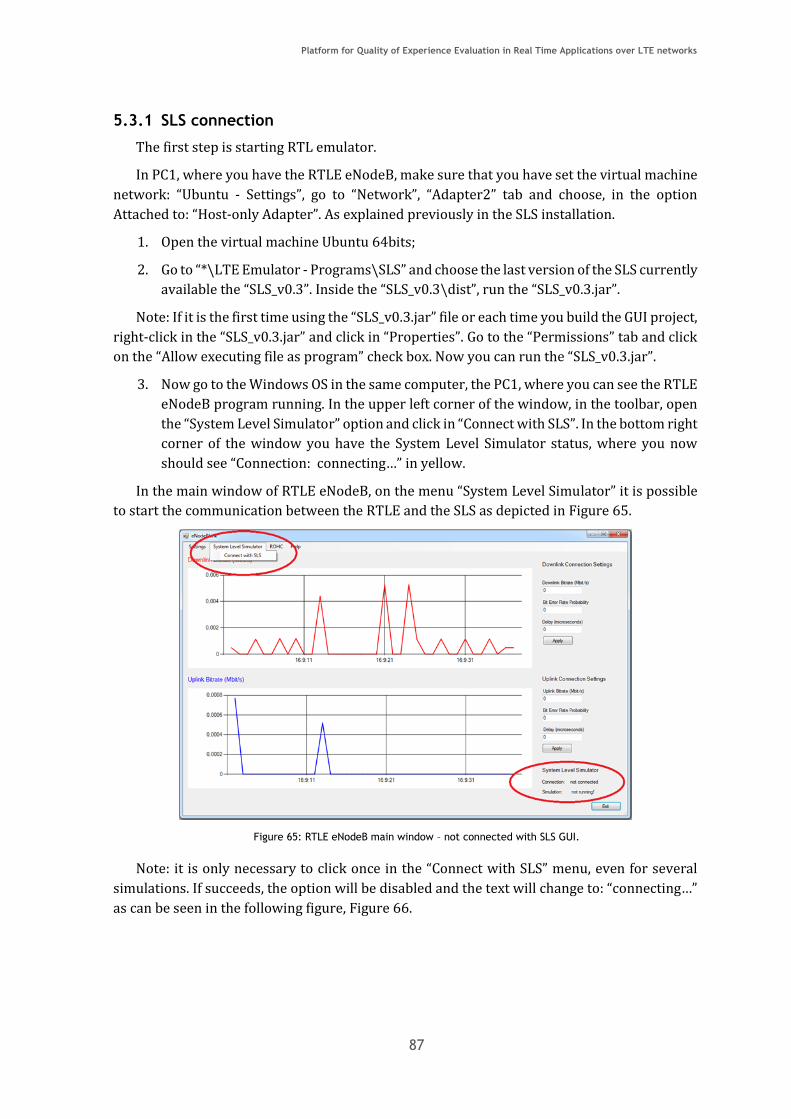
Platform for Quality of Experience Evaluation in Real Time Applications over LTE networks
87
5.3.1 SLS connection
The first step is starting RTL emulator.
In PC1, where you have the RTLE eNodeB, make sure that you have set the virtual machine
network: “Ubuntu - Settings”, go to “Network”, “Adapter2” tab and choose, in the option
Attached to: “Host-only Adapter”. As explained previously in the SLS installation.
1. Open the virtual machine Ubuntu 64bits;
2. Go to “*\LTE Emulator - Programs\SLS” and choose the last version of the SLS currently
available the “SLS_v0.3”. Inside the “SLS_v0.3\dist”, run the “SLS_v0.3.jar”.
Note: If it is the first time using the “SLS_v0.3.jar” file or each time you build the GUI project,
right-click in the “SLS_v0.3.jar” and click in “Properties”. Go to the “Permissions” tab and click
on the “Allow executing file as program” check box. Now you can run the “SLS_v0.3.jar”.
3. Now go to the Windows OS in the same computer, the PC1, where you can see the RTLE
eNodeB program running. In the upper left corner of the window, in the toolbar, open
the “System Level Simulator” option and click in “Connect with SLS”. In the bottom right
corner of the window you have the System Level Simulator status, where you now
should see “Connection: connecting…” in yellow.
In the main window of RTLE eNodeB, on the menu “System Level Simulator” it is possible
to start the communication between the RTLE and the SLS as depicted in Figure 65.
Figure 65: RTLE eNodeB main window – not connected with SLS GUI.
Note: it is only necessary to click once in the “Connect with SLS” menu, even for several
simulations. If succeeds, the option will be disabled and the text will change to: “connecting…”
as can be seen in the following figure, Figure 66.

Luis Pereira
88
Figure 66: RTLE eNodeB main window – connecting with SLS GUI.
At this time, RTLE is waiting for the SLS GUI connection. When you “click” to connect in a
button on GUI the connection will change to “connected!”
4. Go back to SLS GUI, in the virtual machine Ubuntu, and in the GUI Main Control area
click in the “Prepare RTLE” button. The SLS will try to connect with the RTLE trough a
TCP connection protocol.
Note: If this connection (SLS-RTLE) is not established or fails you need to check network
connectivity between the virtual machine and the host operative system.
Now that SLS and RTLE are connected, in the RTLE windows you should see in the bottom
right corner, in the SLS status, “Connection: connected” in green (Figure 67).
Figure 67: RTLE eNodeB main window – SLS connected.
All software modules are connected.
Platform for Quality of Experience Evaluation in Real Time Applications over LTE networks
89
5.3.2 Run the simulation
To start the emulation, all software modules must be connected. At this moment the
connection must be established!
On the User equipment side, just click on “Start SLS Simulation” button.
Figure 68: RTLE User Equipment window – running.
If the connection is not established, a message will be shown to connect SLS first, as shown
in Figure 69.
Figure 69: SLS not connected window.
If the simulation starts successful the background color of the button will change to green
while simulation runs, see Figure 70 below.
Figure 70: RTLE User Equipment window – running SLS simulation.
In the RTLE eNodeB on the text boxes will appear the current values of bitrate, bit error
rate and delays. “Connected” and “running” shall also appears on System Level Simulator
information’s as can be seen in the next figure, Figure 71.

Luis Pereira
90
Figure 71: RTLE eNodeB main window – running SLS simulation.
Now in the SLS GUI you should the scenario with all the BSs and UEs moving along the
simulation time. In the RTLE eNodeB window, in the bottom right corner, in the SLS status you
should see “Simulation: running…” in green. You should also see in the right side of the RTLE
eNodeB window, the values in the Downlink and Uplink Connection Settings changing each
second accordingly with the data that the SLS GUI is sending each millisecond to the RTLE
eNodeB.
At this point you should run one of the four scenarios defined for the demonstration of the
Emulator.
Figure 72: System Level Simulator main window – running.
When the simulation finishes at the UE the window returns to its initial state, Figure 73.

Platform for Quality of Experience Evaluation in Real Time Applications over LTE networks
91
Figure 73: RTLE User Equipment window – running.
On the eNodeB side, the program will wait for a new simulation, trying to connect with SLS,
and appears the text “finished!” on simulation label as can be seen in Figure 74 below. All the
values in the RTLE eNodeB for the Downlink and Uplink Connection Settings returns to their
default value 0 (no limitations).
Figure 74: RTLE eNodeB main window – SLS simulation finished.
5.3.3 Run a new simulation
To run again the emulation you need to reconnect the SLS and RTLE. In the SLS GUI click in
“Prepare RTLE” and after this in the RTLE User Equipment click in “Start SLS Simulation”.
Luis Pereira
92
5.4 Example scenarios used for demonstration of emulator capabilities
Next, we describe the real time link emulator configurations for demonstration purposes.
Each one of the presented scenarios intends to demonstrate the most common services used
in LTE. The scenarios can be demonstrated all at the same time or one at a time, it means the
user can make use of all the services at the same time or simply use just one of the services at
a time. The following four scenarios were developed for emulator demonstration purposes:
1. Web browser
2. Video streaming RTP
3. File Transfer FTP
4. VoIP
Those scenarios were selected as they represent the most common services used in LTE.
The scenarios can be demonstrated all at the same time or one at a time, or, in other words, the
user can use of all the services at the same time or simply use one of the services at a time.
For the LTE system level simulator component of the emulator, the parameters that have
been used are summarized the next table.
Table 14: LTE simulation parameters for emulator demonstration.
Downlink LTE (FDD) System Parameters
Carrier frequency 𝒇𝒄 2𝐺𝐻𝑧
Bandwidth 10𝑀𝐻𝑧
Fast fading model Rayleigh fading using Pedestrian B model (6
taps, SISO), urban environment
Number of cells 19, hexagonal grid
Number of mobile users 100 per cell
Mobile users’ speed 3 & 30 km/h
Mobile users’ power 23𝑑𝐵𝑚
BS transmit power 43𝑑𝐵𝑚
Inter-site distance 500𝑚
Time transmission interval (Ttti) 1𝑚𝑠 (sub-frame)
Number of resource blocks 50 RB in each slot , 7 OFDM symbols per slot=7,
12 subcarriers per RB
Traffic model Mix Traffic Option (VoIP & NRTV), Cell Arrival
Rate: 10 user/cell/Sec
Radio Resource Management RR, PF, Max C/I
Number of MCS 12 (from QPSK 1/3 to 64-QAM 3/4) [1]
Next, we describe the real time link emulator configurations for demonstration purposes.
Platform for Quality of Experience Evaluation in Real Time Applications over LTE networks
93
Each one of the presented scenarios intends to demonstrate the most common services
used in LTE. The scenarios can be demonstrated all at the same time or one at a time, it means
the user can make use of all the services at the same time or simply use just one of the services
at a time.
5.4.1 Scenario 1: Web browser
In the first scenario the user makes use of the web browsers. The user will access any web
site (i.e. http://greent.av.it.pt/) available in the internet through a web browser like Internet
Explorer, Google Chrome, Firefox or other similar programs.
In this scenario the main effects that can be experienced are the delays and the time that a
web page takes to load.
The implementation scenario is depicted in the Figure 75 below.
Figure 75: Scenario 1 implementation.
The scenario involves the RTLE where the eNodeB connects to the internet and allows the
User Equipment to access the internet through it. The user accesses to the internet in the RTLE
User Equipment.
5.4.2 Scenario 2: Video Streaming
This second scenario allows the user to evaluate the QoE while see a movie or listening
music distributed by UDP protocol.
Recently the operators start to distribute television by IPTV but at this moment there are
only few implementations by LTE once the distribution is done by unicast and it will consumes
all the available LTE bandwidth. In the future the operators possible will start to distribute
IPTV by multicast in order to reduce the bandwidth once the data will be sent to all users using
the same channels. This second scenario can evaluate the QoE for future deployments in the
distribution of IPTV by multicast on LTE.
In this scenario the main effects that can be experienced are the delays and the errors that
can be received. The implementation scenario is depicted in the Figure 76 below.
RTLE User Equipment RTLE eNodeB
Internet

Luis Pereira
94
Figure 76: Scenario 2 implementation.
The scenario involves the RTLE and a Video Streaming Server. The RTLE eNodeB connects
to the Video Streaming Server and allows the RTLE User Equipment to access the video
streaming. The user will see the video streaming in the RTLE User Equipment.
5.4.3 Scenario 3: File Transfer
The third scenario allows the user to evaluate the QoE while downloading files. In this
scenario the main effects that can be experienced are the amount of time that the download
takes to finish and the average bitrate. Due to the channel conditions and the software used to
download it can also fails and the user may cannot download the file.
The implementation scenario is depicted in the Figure 77 below.
Figure 77: Scenario 3 implementation.
The scenario involves the RTLE and a File Transfer Server. The RTLE eNodeB connects to
the File Transfer Server allows the RTLE User Equipment to access and download the data in
the Server. The user will download files from the Server in the RTLE User Equipment.
5.4.4 Scenario 4: VoIP
LTE is an all-IP network, it means that it does not supports circuit switching (CS) .Since LTE
does not support CS it means the voice calls must be converted to IP packets and so the voice
data will suffer the effects of any IP packet (delay, jitter, errors…) according the corresponding
traffic (IPv6 header) class and the QCI set to the traffic.
In this scenario the main effects that can be experienced are similar to the previous
scenario, the delays and the errors that can be received. The implementation scenario is
depicted in the Figure 78 below.
RTLE User Equipment RTLE eNodeB
Video Steaming Server
RTLE User Equipment RTLE eNodeB
File Transfere Server

Platform for Quality of Experience Evaluation in Real Time Applications over LTE networks
95
Figure 78: Scenario 4 implementation.
This scenario is the most complex scenario of the four scenarios proposed for
demonstration. The scenario involves the RTLE connected to the internet and an external
device (i.e. computer) also connected to the internet. Both devices (RTLE User Equipment and
User 2) must have a VoIP application installed and ready to run. The eNodeB connects to the
Video Streaming Server and allows the User Equipment to access the video streaming. The user
will see the video streaming in the RTLE User Equipment.
In this scenario are not considered all the specific modules required for a VoIP
communication since are out of scope of this document. The steps for register and create
accounts are also out of scope of this document.
5.4.5 Discussion
Ping Tool
In order to verify the effects of insert delays in communication we can use ping utility
(Microsoft, s.d.). Two situations were tested, in Figure 79 no delays were added to
communication, in the second test we add a 25000 microseconds (25 milliseconds) in the
communication as can be seen in Figure 80.
Figure 79: example of communication without delays using the ping tool, delay = 0 microseconds.
RTLE User Equipment RTLE eNodeB
Internet
User 2
Luis Pereira
96
Figure 80: example of communication with delays using the Ping tool, delay = 25000 microseconds.
In the first test a delay of 1ms was verified, but in the second test a 25ms higher latency can
be verified in communication. In a communication where a high number of packets must be
transmitted this second delay can be enough to block the connection between the two hosts.
Video Stream
In this second tests a video stream was used to analyse the effect of errors in
communication (with UDP protocol (Microsoft, s.d.)). As we do with Ping utility tests above,
two situations were used, in Figure 81 no errors were created in communication, but in the
other hand a bit error rate of 1 × 10⁻⁵ was used in Figure 82 below.
Figure 81: Received stream without errors.
Figure 82: Received stream with BER = 1E-5 (right).
Looking for Figure 82 it can be easily seen that is very difficult to recognise the picture
represented, this way a user that are seeing this movie rapidly will give up to see all the movie.
HTTP (WEB browser)
Using HTTP (used by almost all Internet services) is difficult to show results since this
protocol uses TCP (Microsoft, s.d.), this way the most experienced results when connection
settings is changed are:
Very low bitrates due to big number of retransmissions;
In some services connection can be refused do to the quality of received messages (i.e.
Skype video calls);
If errors occurred in packet header, packet can be lost and service neither is noticed;
High latency in communications.
Platform for Quality of Experience Evaluation in Real Time Applications over LTE networks
97
5.5 Security features
This tool (RTL) can be used to evaluate the performance of network with real data in real
time, this way two very important topics related with security must be taken in consideration
before the usage of emulator:
1 – The communication between the eNodeB Link and User Equipment Link is performed
on an unprotected way, it means, there are no protection applied to the channel due to several
reasons such as the security mechanisms will decrease emulator performance and at this
moment the emulator only works in closed environments;
2 – This tool is also a very powerful tool and can be used to perform several malicious
network attacks such as:
Eavesdropping
Data Modification
Identity Spoofing (IP Address Spoofing)
Denial-of-Service Attack
Man-in-the-Middle Attack
Sniffer Attack
Application-Layer Attack
The attacks can be performed in a very easy way once the platform delivers to the user the
entire IP Packet before it reaches its destination. This way, it is very important that any
confidential data MUST NOT pass through the emulator.

Luis Pereira
98
Platform for Quality of Experience Evaluation in Real Time Applications over LTE networks
99
6 Conclusions and future work In this document was mainly explained the implementation and evaluation of the “Real
Time Link Emulator”, a platform for quality of experience evaluation in real time applications
over LTE networks. The Real time Link Emulator adapts a channel between two devices (UE
and an eNodeB or more generalist between a user and the Internet) according several values
as bitrate, delays and errors.
Once we need to work with real time applications, the need for very small transmission
delays and the huge amount of data to transmit in a small amount of time is essential. Since the
main target of the emulator is to be used with LTE networks, so all the specifications of this
technology must also be overcome.
With a CPU Intel I7 quad-core (8 Threads) (and considering zero errors and no delays) the
platform can achieve a transfer rate up to 5Gbit/s. Regarding the delays on the network
between the two emulators, the platform can transfer a packet within a maximum time of 100
microseconds. This means that all the performance requirements were successfully mastered.
The most difficult requirement regarding this platform, the very high level of performance, was
achieved successful.
The integration with several external modules was also achieved with success and in very
high performance environment. The integration with a System Level Simulator was
successfully integrated as well as with other external components. It is possible to use the
platform in a large variety of scenarios, and network configurations.
The platform runs in Windows Operative Systems even with the need of very high
performance, it is implemented without the need of a real time operative system (RTOS), which
is also a very important feature once the possible interested users does not need to acquire
specific software. The platform has no limitation regarding the desired application to use, since
it is based on IP protocol and uses Windows 7/8/10 based operative systems.
With Real Time Link Platform is possible to experience in real time a communication
between two devices for different scenario and channel conditions. If a connection is
established with a system level simulator, and this one exchanges channel conditions to the
Real Time Link Emulator, a user can experience in real time the QoE he would have in a real
scenario for the QoS calculated by the simulator. If the conditions are very bad the interactivity
between user and applications will be very poor, by the other hand if channel conditions are
good, user experiences a transparent communication and probably not even notice that he are
using LTE or optical fibre.
6.1 Future Work
At this moment the platform has implemented: BER, delay and bitrate control connection
options, is also important to implement at least two more features: “out-of-order” delivery and
“drop packet” probability. This features can be easily implemented as they are relevant and
needed. Implementation of the entire LTE protocol stack according with the 3GPP
specifications. Integration with other commercial LTE simulators to receive its output
parameters and then adapt automatically emulator connection with that values.

Luis Pereira
100
Platform for Quality of Experience Evaluation in Real Time Applications over LTE networks
101
7 References The MathWorks, Inc. (n.d.). LTE System Toolbox - MATLAB. Retrieved 04 20, 2015, from http://www.mathworks.com/products/lte-system/ 3GPP. (n.d.). 3GPP. Retrieved 04 06, 2015, from http://www.3gpp.org/ 3GPP. (n.d.). The Evolved Packet Core. Retrieved 03 30, 2015, from http://www.3gpp.org/technologies/keywords-acronyms/100-the-evolved-packet-core 3GPP TS 23.401 v12.2.0. (09-2013). General Packet Radio Service (GPRS) enhancements for Evolved Universal Terrestrial Radio Access Network (E-UTRAN) access. 3GPP TS 24.301. (12-2013). Non-Access-Stratum (NAS) protocol for Evolved Packet System (EPS). 3GPP TS 36.201 v12.2.0. (03-2015). Evolved Universal Terrestrial Radio Access (E-UTRA); LTE physical layer; General description. 3GPP TS 36.211 v12.5.0. (03-2015). Evolved Universal Terrestrial Radio Access (E-UTRA); Physical channels and modulation. 3GPP TS 36.212 v12.4.0. (03-2015). Evolved Universal Terrestrial Radio Access (E-UTRA); Multiplexing and channel coding. 3GPP TS 36.213 v12.5.0. (03-2015). Evolved Universal Terrestrial Radio Access (E-UTRA); Physical layer procedures. 3GPP TS 36.214 v12.2.0. (03-2015). Evolved Universal Terrestrial Radio Access (E-UTRA); Physical layer; Measurements. 3GPP TS 36.321 v12.5.0. (03-2015). Evolved Universal Terrestrial Radio Access (E-UTRA); Medium Access Control (MAC) protocol specification. 3GPP TS 36.322 v12.2.0. (03-2015). Evolved Universal Terrestrial Radio Access (E-UTRA); Radio Link Control (RLC) protocol specification. 3GPP TS 36.323 v12.3.0. (03-2015). Evolved Universal Terrestrial Radio Access (E-UTRA); Packet Data Convergence Protocol (PDCP) specification. 3GPP TS 36.331 v12.5.0. (03-2015). Evolved Universal Terrestrial Radio Access (E-UTRA); Radio Resource Control (RRC); Protocol specification. 3GPP TS 36.413 v12.5.0. (03-2015). Evolved Universal Terrestrial Radio Access Network (E-UTRAN); S1 Application Protocol (S1AP). 3GPPTS 36.423 v12.5.0. (03-2015). Evolved Universal Terrestrial Radio Access Network (E-UTRAN); X2 Application Protocol (X2AP). awe-communications. (n.d.). Company. Retrieved 04 20, 2015, from http://www.awe-communications.com/ awe-communications. (n.d.). Planning of LTE RAdio Networks in WinProp. Retrieved 04 20, 2015, from http://www.awe-communications.com/Download/ApplicationNotes/NetworkPlanningLTE.pdf awe-communications. (n.d.). Products. Retrieved 04 20, 2015, from http://www.awe-communications.com/Products/index.html Basil. (2015, 06 06). WinDivert 1.1: Windows Packet Divert. Retrieved from https://reqrypt.org/windivert.html BAUDOIN, S. (2001, 09). TmP - Networks. Retrieved 02 11, 2014, from http://www2.themanualpage.org/networks/networks_tcpip.php3 Dahlman, E., Parkvall, S., & Sköld, J. (2011). 4G LTE/LTE-Advanced for Mobile Broadband. UK: Elsevier Ltd. EikoSeidel. (2008, 09 12). Nomor_eNB_emulator_v1-0. Retrieved 02 27, 2015, from http://www.nomor.de/uploads/7O/z2/7Oz2z4vQygXl7kJjTjG9Wg/Nomor_eNB_emulator_v1-0.pdf Ikuno, J. C., Wrulich, M., & Rupp, M. (2010). System level simulation of LTE networks. IEEE 71st Vehicular Technology Conference, (pp. 16-19). Taipei, Taiwan. Instituto de Telecomunicações. (2015, 06 06). Green-T Project. Retrieved from http://greent.av.it.pt/
Luis Pereira
102
IXIA. (2013, 08). IxLoad Access: LTE Access Testing. Retrieved from https://www.ixiacom.com/sites/default/files/resources/datasheet/ixload_lte_access.pdf Ixia. (n.d.). Ixia Network|Security|Application Performance. Retrieved 04 20, 2015, from http://www.ixiacom.com/ Kai, W., & Lihua, L. (2010). Research and implementation of LTE RRC connection establishment process of network side. Educational and Information Technology (ICEIT), 3, 229-232. LteWorld. (n.d.). LTE Protocols & Specifications. Retrieved 03 31, 2015, from http://lteworld.org/lte-protocols-specifications Mehlführer et al. (2011). The Vienna LTE simulators - Enabling reproducibility in wireless communications research. EURASIP Journal on Advances in Signal Processing. Metrifly. (n.d.). Metrifly - metrifly. Retrieved 04 13, 2015, from https://metrifly.com/ Microsoft. (n.d.). Data Type Ranges. Retrieved 11 14, 2013, from http://msdn.microsoft.com/en-us/library/s3f49ktz(v=vs.90).aspx Microsoft. (n.d.). File Mapping (Windows). Retrieved 04 08, 2015, from https://msdn.microsoft.com/en-us/library/windows/desktop/aa366556(v=vs.85).aspx Microsoft. (n.d.). Multithread Programs. Retrieved 04 08, 2015, from https://msdn.microsoft.com/en-us/library/3c8c4cxa(v=vs.80).aspx Microsoft. (n.d.). Ping. Retrieved 02 12, 2014, from http://technet.microsoft.com/en-us/library/bb490968.aspx Microsoft. (n.d.). recv function (Windows). Retrieved 04 09, 2015, from https://msdn.microsoft.com/en-us/library/windows/desktop/ms740121(v=vs.85).aspx Microsoft. (n.d.). send function (Windows). Retrieved 04 09, 2015, from https://msdn.microsoft.com/en-us/library/windows/desktop/ms740149(v=vs.85).aspx Microsoft. (n.d.). setsockopt function (Windows). Retrieved 04 07, 2015, from http://msdn.microsoft.com/en-us/library/windows/desktop/ms740476(v=vs.85).aspx Microsoft. (n.d.). TCP/IP Characteristics (Windows). Retrieved 04 01, 2015, from http://msdn.microsoft.com/en-us/library/windows/desktop/ms740546(v=vs.85).aspx Microsoft. (n.d.). TCP/IP Protocol Architecture. Retrieved 02 11, 2014, from http://technet.microsoft.com/en-us/library/cc958821.aspx Microsoft. (n.d.). User Datagram Protocol (UDP). Retrieved 02 12, 2014, from http://msdn.microsoft.com/en-us/library/aa915632.aspx Microsoft. (n.d.). Windows Forms Overview. Retrieved 04 09, 2015, from https://msdn.microsoft.com/en-us/library/8bxxy49h(v=vs.110).aspx Mumtaz, S., & Rodriguez, J. (March 2013). Green Communications for 4G Wireless Systems. River Publishers, ISBN 9788792982056. NOMOR research. (n.d.). LTE eNB Emulator - NPT3081: Powerful eNB emulator to support your protocol development and optimization. Olsson, M., Sultana, S., Rommer, S., Frid, L., & Mulligan, C. (2009). SAE and the Evolved Packet Core. Linacre House, Jordan Hill, Oxford OX2 8DP, UK: Elsevier Ltd. Pereira, L., Mateus, F., Monteiro, V., Rodriguez, J., Lage, W., Gomes, A., & Feitosa, M. (2014). Platform for Quality of Experience Evaluation in Real Time Applications over LTE networks. WICON. Lisbon. Polaris Networks. (2014). Long Term Evolution Functional Testers. Retrieved 02 27, 2015, from http://www.polarisnetworks.net/enodeb-functional-tester.html Polaris Networks. (2015). EPC Emulator. Retrieved 02 27, 2015, from http://www.polarisnetworks.net/epc-emulators.html

Platform for Quality of Experience Evaluation in Real Time Applications over LTE networks
103
Polaris Networks. (n.d.). Company Overview - Polaris Networks. Retrieved 04 20, 2015, from http://www.polarisnetworks.net/company_overview.html Postel, J. (September 1981). Internet Protocol. RFC 791. Programming, R. (n.d.). Blocking vs. non-blocking sockets. Retrieved 04 07, 2015, from http://www.scottklement.com/rpg/socktut/nonblocking.html SCALABLE Network Technologies, Inc. (n.d.). QualNet | SCALABLE Network Technologies. Retrieved 04 20, 2015, from http://web.scalable-networks.com/content/qualnet The WinPcap Team. (n.d.). WinPcap. Retrieved 02 11, 2014, from http://www.winpcap.org/ Tutorialspoint. (2015). LTE Radio Protocol Architecture. Retrieved 03 30, 2015, from http://www.tutorialspoint.com/lte/lte_radio_protocol_architecture.htm Vienna University of Technology. (n.d.). TC: Vienna LTE-A Simulators. Retrieved 04 20, 2015, from http://www.nt.tuwien.ac.at/research/mobile-communications/vienna-lte-a-simulators/

Luis Pereira
104
Platform for Quality of Experience Evaluation in Real Time Applications over LTE networks
105
8 Anexes In this section it is presented one Green-T project paper (Pereira, et al., 2014). This paper
was presented at WICON - 8th International Wireless Internet Conference (www.wicon.org)
that was held in Lisbon 2015.
8.1 Paper Green-T

Luis Pereira
106
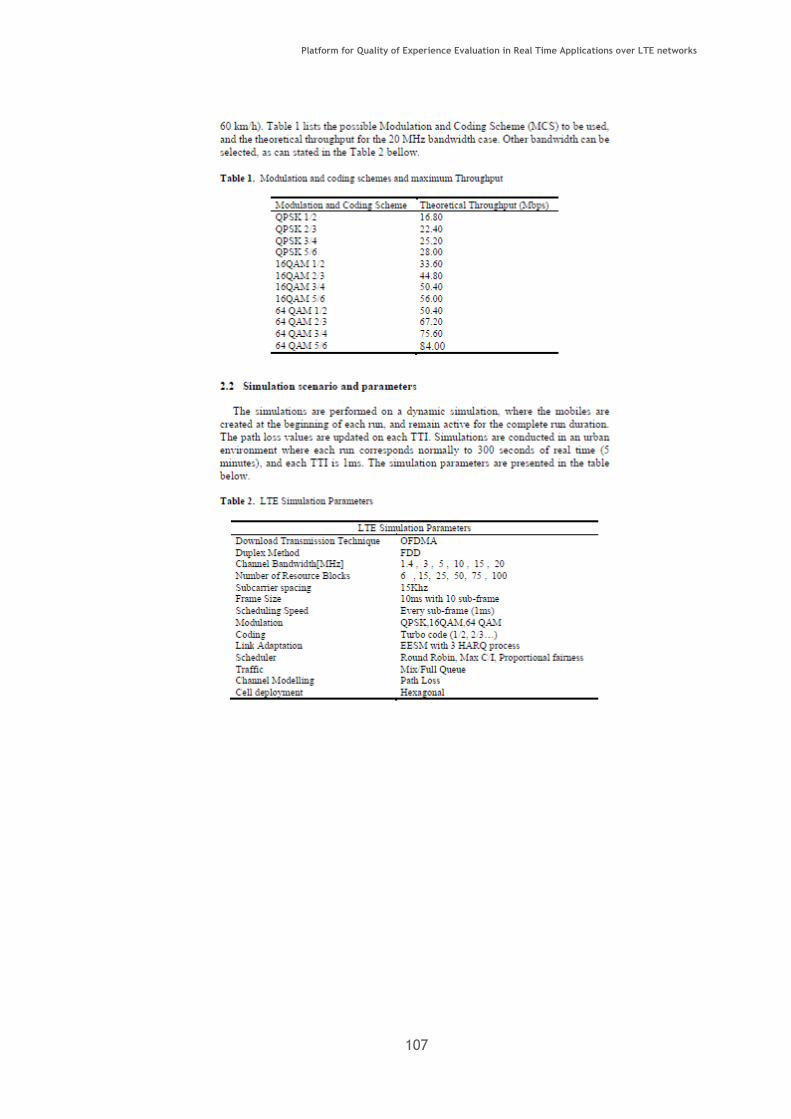
Platform for Quality of Experience Evaluation in Real Time Applications over LTE networks
107

Luis Pereira
108

Platform for Quality of Experience Evaluation in Real Time Applications over LTE networks
109

Luis Pereira
110
![BLASTN 2.2.8 [Jan-05-2004] Reference: Altschul, Stephen F ...](https://static.fdocuments.us/doc/165x107/6169f88511a7b741a34d64e8/blastn-228-jan-05-2004-reference-altschul-stephen-f-.jpg)