Plate Motion Models From Space Geodesy: The Case of …
27
Plate Motion Models From Space Geodesy: The Case of ITRF2008 Colloque G2 – ENSG, Marne la Vallée – 7 Novembre 2011 1 Zuheir Altamimi , Laurent Métivier, Xavier Collilieux Laboratoire de Recherche en Géodésie Institut Géographique National, France E-mail: [email protected]
Transcript of Plate Motion Models From Space Geodesy: The Case of …

Plate Motion Models From Space Geodesy: The Case of ITRF2008
Colloque G2 – ENSG, Marne la Vallée – 7 Novembre 2011 1
Zuheir Altamimi , Laurent Métivier, Xavier CollilieuxLaboratoire de Recherche en Géodésie Institut Géographique National, France
E-mail: [email protected]
Outline
• Introduction
• ITRF2008 Plate Motion Model (ITRF2008-PMM)– Site selection– Plate Motion and Post Glacial Rebound
Colloque G2 – ENSG, Marne la Vallée – 7 Novembre 2011 2
– Plate Motion and Post Glacial Rebound– ITRF2008-PMM & origin rate bias– Comparisons to geological models – No Net Rotation Condition
• Conclusion

ITRF2008
580 sites (934 stations)
463 Sites North111 Sites South
Reprocessed solutions of 4 techniques
Colloque G2 – ENSG, Marne la Vallée – 7 Novembre 2011 3
Precision gain:

Introduction• Ex. of Geological tectonic relative plate motion models
– RM2 (Minster and Jordan, 1978)– NUVEL-1 & 1A (Demets et al. 1990, 1994)– Bird (2003)– MORVEL (Demets et al. 2010)
• Average lithosphere motion over ~0.78 to 3.16 Ma• Assume rigid plates
Colloque G2 – ENSG, Marne la Vallée – 7 Novembre 2011 4
• Assume rigid plates• Absolute NNR models were derived from the above, e.g.:
– AM02 (Minster & Jordan, 1978)– NNR-NUVEL-1A (Argus et al. 1991)– NNR-MORVEL56 (Argus et al. 2011)
• Space Geodesy provides site velocities which are then used to estimate plate angular velocities

Our Continents
Colloque G2 – ENSG, Marne la Vallée – 7 Novembre 2011 5

Plate boundaries: Bird (2003) and MORVEL (2010)
Colloque G2 – ENSG, Marne la Vallée – 7 Novembre 2011 6

Plate boundaries: Bird (2003) and MORVEL (2010)
Eurasia
NubiaCARB
Colloque G2 – ENSG, Marne la Vallée – 7 Novembre 2011 7
Nubia
Australia
Pacific
Antarctica
Naz
ca

Site Selection Criteria
• Time span > 3 years
• Far from plate boundaries: 100km from Bird (2003) boundaries
• Exclude sites in deformation zones (Kreemer et al., 2006)
Colloque G2 – ENSG, Marne la Vallée – 7 Novembre 2011 8
al., 2006)
• Reject points from area of Post Glacial Rebound
• Reject points with post-fit residuals > threshold
• The selected velocity field should have minimum Origin Rate Bias (ORB)

ALL ITRF2008 Site Velocities:time-span > 3 yrs
509 sites
Colloque G2 – ENSG, Marne la Vallée – 7 Novembre 2011 9

Selected ITRF2008 Site Velocities:Far from Plate Boundaries and deformation zones
316 sites
Colloque G2 – ENSG, Marne la Vallée – 7 Novembre 2011 10

Selected ITRF2008 Site Velocities:Plate ang. vel. post-fit residuals < 1.5 mm/yr
253 sites
Colloque G2 – ENSG, Marne la Vallée – 7 Novembre 2011 11

Selected ITRF2008 Site VelocitiesPlate ang. vel. post-fit residuals < 1 mm/yr
205 sites
Colloque G2 – ENSG, Marne la Vallée – 7 Novembre 2011 12

ITRF2008 Site Velocities: Final Selection�Post-fit residuals < 0.7 mm/yr for EURA and NOAM� and < 1 mm/yr for the other plates
154 sites
Colloque G2 – ENSG, Marne la Vallée – 7 Novembre 2011 13

Selected Site VelocitiesPlate angular velocity is estimated by:
Colloque G2 – ENSG, Marne la Vallée – 7 Novembre 2011 14
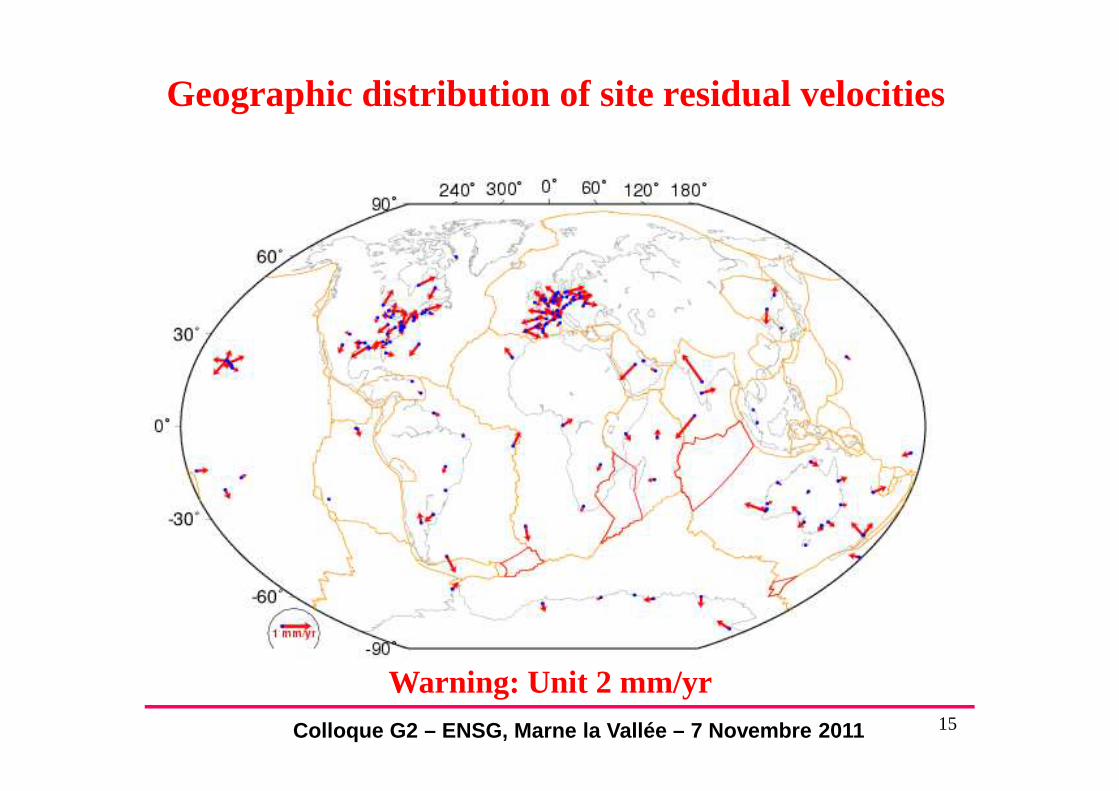
Geographic distribution of site residual velocities
Colloque G2 – ENSG, Marne la Vallée – 7 Novembre 2011 15
Warning: Unit 2 mm/yr

Site residual velocities
Colloque G2 – ENSG, Marne la Vallée – 7 Novembre 2011 16

WRMS (mm/a) per plate
East North
Colloque G2 – ENSG, Marne la Vallée – 7 Novembre 2011 17
0.3 mm/a

Plate motion and Post Glacial ReboundResiduals after removing EURA rotation pole
Blue : points usedRed : points rejected
We tested three models• Schotman and Vermeersen [2005]improves the fit in EURA, but degrads in NOAM & ANTA
Colloque G2 – ENSG, Marne la Vallée – 7 Novembre 2011 18
• VM2 & VM4 [Peltier 2004] improves partially the fit in EURA & degrads in NOAM & ANTA

ITRF2008 PMM and origin stability• Z-translation rate induces a north velocity change by:
• Plate angular velocity is estimated by:
• In order to evaluate the velocity field origin stability,an Origin Rate Bias (ORB), , could be added, so that:
Colloque G2 – ENSG, Marne la Vallée – 7 Novembre 2011 19
an Origin Rate Bias (ORB), , could be added, so that:
• Similar appoach used by Argus et al. (2010) & Kogan & Steblov (2008) & found different values for ORB
• ITRF2008 ORB is ~0.5 mm/yr (Wu et al., 2011)• But, the ORB is subject to the network geometry and residual distribution, see next.

Translation rates
Residuals < 1.5 mm/a
Residuals < 1.0 mm/a
Colloque G2 – ENSG, Marne la Vallée – 7 Novembre 2011 20
Residuals < 1.0 mm/a
Residuals < 1.0 0.7 0.7
Residuals < 1.0 0.7 0.7& reject 14 sites

Comparison btw NNR-NUVEL-1A and NNR-MORVEL56
Raw velocity differencesAfter rotation rate
transformation
Colloque G2 – ENSG, Marne la Vallée – 7 Novembre 2011 21
RMS:East : 2.2 mm/yrNorth: 1.5 mm/yr
RMS:East : 2.1 mm/yrNorth: 1.4 mm/yr
Green: 1-2 mm/yrBlue : 2-3 mm/yrOrange: 3-4 mm/yrRed : 4-5 mm/yrBlack : > 5 mm/yr

Comparison btw ITRF2008 and NNR-NUVEL-1A and NNR-MORVEL56
Raw velocity differences
Colloque G2 – ENSG, Marne la Vallée – 7 Novembre 2011 22
NNR-NUVEL-1ARMS:East : 2.4 mm/yrNorth: 1.9 mm/yr
NNR-MORVEL56RMS:East : 1.9 mm/yrNorth: 2.1 mm/yr
Green: 1-2 mm/yrBlue : 2-3 mm/yrOrange: 3-4 mm/yrRed : 4-5 mm/yrBlack : > 5 mm/yr
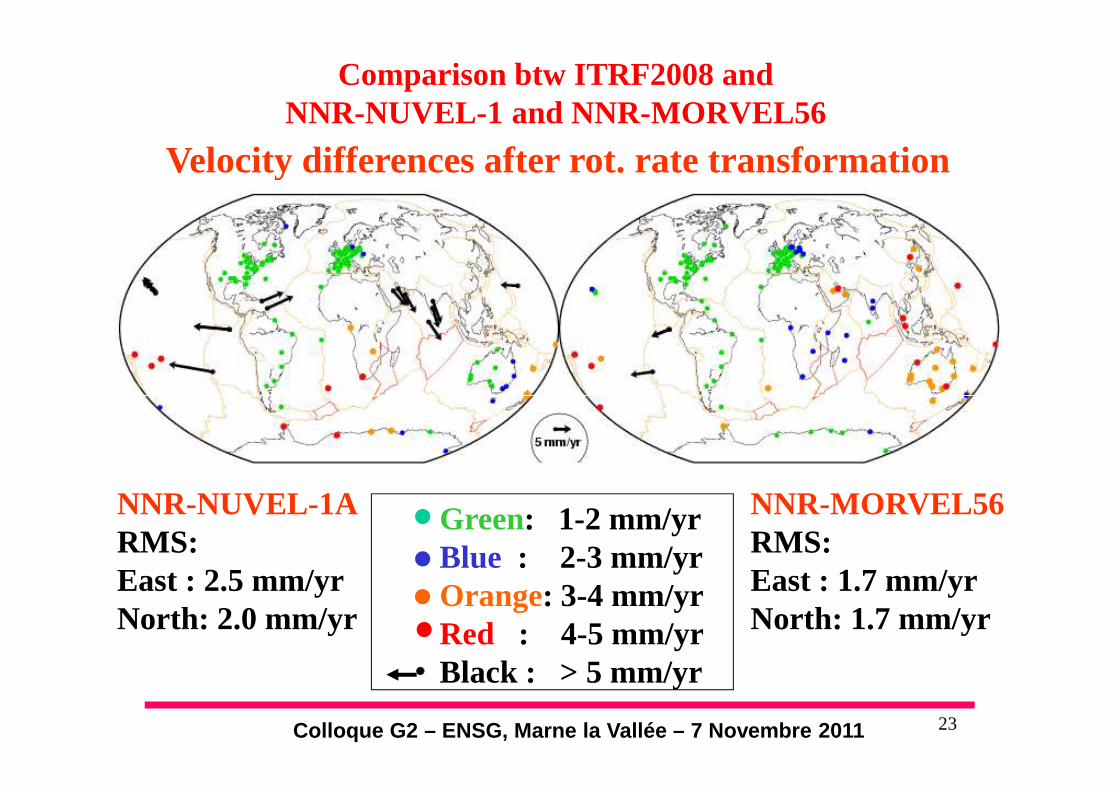
Comparison btw ITRF2008 and NNR-NUVEL-1 and NNR-MORVEL56
Velocity differences after rot. rate transformation
Colloque G2 – ENSG, Marne la Vallée – 7 Novembre 2011 23
NNR-NUVEL-1ARMS:East : 2.5 mm/yrNorth: 2.0 mm/yr
NNR-MORVEL56RMS:East : 1.7 mm/yrNorth: 1.7 mm/yr
Green: 1-2 mm/yrBlue : 2-3 mm/yrOrange: 3-4 mm/yrRed : 4-5 mm/yrBlack : > 5 mm/yr

Summary of comparisons btw ITRF2008 and NNR-NUVEL-1A and NNR-MORVEL56
RotationRatemm/a
#Sites
RMS East
mm/a
RMS Northmm/a
#Plates
NNR-NUVEL-1A –NNR-MORVEL56
~1.8 118/146 2.1 1.4 7/11
Colloque G2 – ENSG, Marne la Vallée – 7 Novembre 2011 24
NNR-NUVEL-1A –
ITRF2008 PMM
~1.0 112/146 2.5 2.0 7/11
NNR-MORVEL –ITR2008 PMM
~2.5 119/154 1.7 1.7 10/14
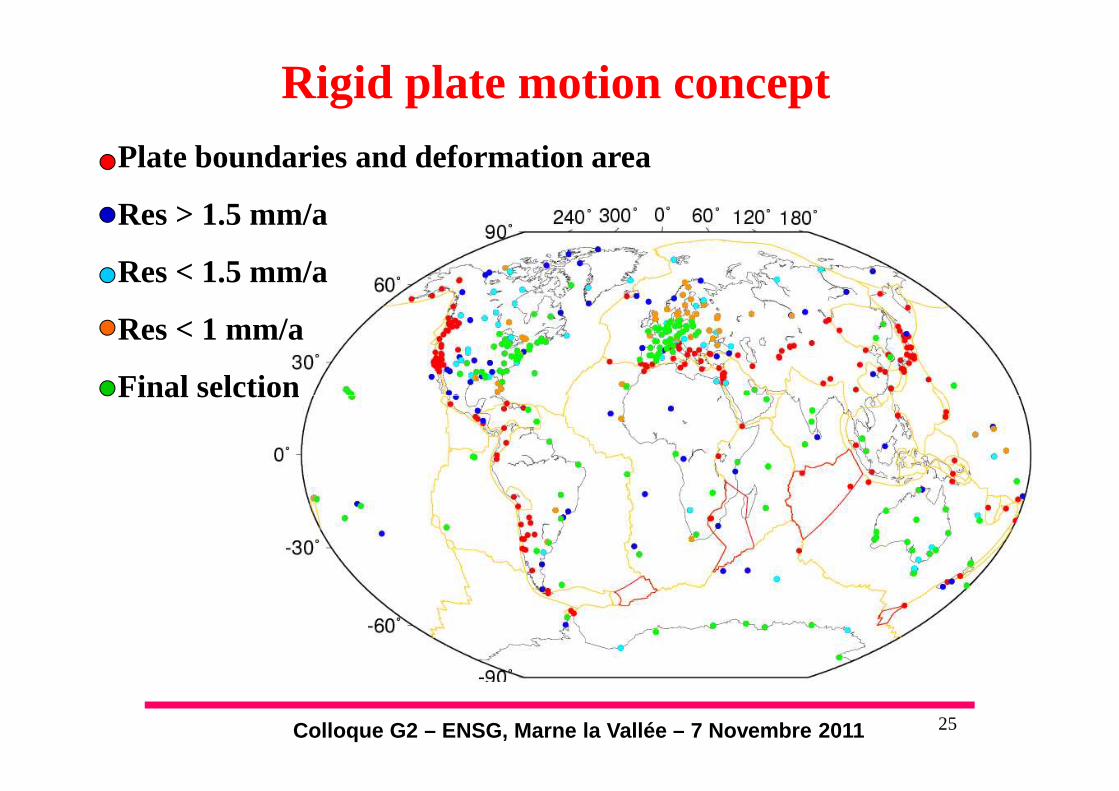
Rigid plate motion concept
Plate boundaries and deformation area
Res > 1.5 mm/a
Res < 1.5 mm/a
Res < 1 mm/a
Final selction
Colloque G2 – ENSG, Marne la Vallée – 7 Novembre 2011 25
Final selction
Colloque G2 – ENSG, Marne la Vallée – 7 Novembre 2011 26
Conclusion
• Estimation of a precise plate motion model consistent with ITRF2008: WRMS 0.3 mm/a
• ITRF2008-PMM has negligible Origin Rate Bias• Comparison to geological models (using our site selection)
– X-rotation rate of 1.8 mm/abtw NNR-MORVEL56 & NNR-NUVEL-1A
– Comparisons btw ITRF2008-PMM &
Colloque G2 – ENSG, Marne la Vallée – 7 Novembre 2011 27
– Comparisons btw ITRF2008-PMM & • NNR-NUVEL-1A Rot.: 1 mm/a RMS 2.5 mm/a• NNR-MORVEL56 Rot.: 2.5 mm/a RMS 1.7 mm/a
– Australia plate in NNR-MORVEL56 has large site residual velocities up to 4.6 mm/a, when compared to NNR-NUVEL-1A or ITRF2008-PMM
– ITRF2008 implicit realization of the No-Net-Rotation Condition is not better than ~ 2 mm/a