Plasmonic Gold Nanoparticle for Detection of Fungi and ...
27
Technological University Dublin Technological University Dublin ARROW@TU Dublin ARROW@TU Dublin Articles School of Food Science and Environmental Health 2017-06-02 Plasmonic Gold Nanoparticle for Detection of Fungi and Human Plasmonic Gold Nanoparticle for Detection of Fungi and Human Cutaneous Fungal Infections Cutaneous Fungal Infections Tobiloba Sojinrin Technological University Dublin, [email protected] Kangze Liu Technological University Dublin, [email protected] Joao Conde Massachusetts Institute of Technology See next page for additional authors Follow this and additional works at: https://arrow.tudublin.ie/schfsehart Part of the Clinical Epidemiology Commons, Medical Microbiology Commons, Microbiology Commons, Nanotechnology Commons, and the Skin and Connective Tissue Diseases Commons Recommended Citation Recommended Citation Sojinrin T., Conde, J, Liu, K., Curtin, J., Byrne, H., Cui, D., Tian, F. (2017). Plasmonic gold nanoparticle for detection of fungi and human cutaneous fungal infections. , vo.409 (9), pp.4647-4658. This Article is brought to you for free and open access by the School of Food Science and Environmental Health at ARROW@TU Dublin. It has been accepted for inclusion in Articles by an authorized administrator of ARROW@TU Dublin. For more information, please contact [email protected], [email protected]. This work is licensed under a Creative Commons Attribution-Noncommercial-Share Alike 4.0 License Funder: Fiosraigh Scholarship Programme from Dublin Institute Technology and Enterprise Ireland
Transcript of Plasmonic Gold Nanoparticle for Detection of Fungi and ...

Technological University Dublin Technological University Dublin
ARROW@TU Dublin ARROW@TU Dublin
Articles School of Food Science and Environmental Health
2017-06-02
Plasmonic Gold Nanoparticle for Detection of Fungi and Human Plasmonic Gold Nanoparticle for Detection of Fungi and Human
Cutaneous Fungal Infections Cutaneous Fungal Infections
Tobiloba Sojinrin Technological University Dublin, [email protected]
Kangze Liu Technological University Dublin, [email protected]
Joao Conde Massachusetts Institute of Technology
See next page for additional authors
Follow this and additional works at: https://arrow.tudublin.ie/schfsehart
Part of the Clinical Epidemiology Commons, Medical Microbiology Commons, Microbiology
Commons, Nanotechnology Commons, and the Skin and Connective Tissue Diseases Commons
Recommended Citation Recommended Citation Sojinrin T., Conde, J, Liu, K., Curtin, J., Byrne, H., Cui, D., Tian, F. (2017). Plasmonic gold nanoparticle for detection of fungi and human cutaneous fungal infections. , vo.409 (9), pp.4647-4658.
This Article is brought to you for free and open access by the School of Food Science and Environmental Health at ARROW@TU Dublin. It has been accepted for inclusion in Articles by an authorized administrator of ARROW@TU Dublin. For more information, please contact [email protected], [email protected].
This work is licensed under a Creative Commons Attribution-Noncommercial-Share Alike 4.0 License Funder: Fiosraigh Scholarship Programme from Dublin Institute Technology and Enterprise Ireland

Authors Authors Tobiloba Sojinrin, Kangze Liu, Joao Conde, Hugh Byrne, James Curtin, Daxiang Cui, and Furong Tian
This article is available at ARROW@TU Dublin: https://arrow.tudublin.ie/schfsehart/249

1
Plasmonic gold nanoparticle for detection of fungi and human
cutaneous fungal infections
Tobiloba Sojinrin1, João Conde2,3,*, Kangze Liu1, James Curtin1, Hugh J Byrne4, Daxiang Cui5 and
Furong Tian1,*
1 Environmental Sustainability and Health Institute, School of Food Science and Environmental
Health, College of Sciences and Health, Dublin Institute of Technology, Cathal Brugha Street, Dublin
1, Republic of Ireland.
2 Massachusetts Institute of Technology, Institute for Medical Engineering and Science, Harvard-MIT
Division for Health Sciences and Technology, Cambridge, Massachusetts, USA.
3 School of Engineering and Materials Science, Queen Mary University of London, London, UK.
4 FOCAS Research Institute, Dublin Institute of Technology, Camden Row, Dublin 8, Republic of
Ireland.
5 Institute of Nano Biomedicine and Engineering, Key Lab for Thin Film and Microfabrication
Technology of Education Ministry, Department of Instrument Science and Engineering, National
Center for Translational Medicine, Shanghai Jiao tong university 800 Dongchuan road, shanghai
200240, P. R. China.
* Corresponding authors: João Conde, [email protected] and Furong Tian, [email protected]
ABSTRACT
Fungi, which are common in the environment, can cause a multitude of diseases. Warm, humid
conditions allow fungi to grow and infect humans via the respiratory, digestive and reproductive tracts,
genital area and other bodily interfaces. Fungi can be detected directly by microscopy, using the
potassium hydroxide (KOH) test, which is the gold standard and most popular method for fungal
screening. However, this test requires trained personnel operating specialist equipment, including a
fluorescent microscope and culture facilities. As most acutely infected patients seek medical attention
within the first few days of symptoms, the optimal diagnostic test would be rapid and self-diagnostic

2
simplifying and improving the therapeutic outcome. In suspensions of gold nanoparticles, Aspergillus
niger can cause a colour change from red to blue within 2 minutes, as a result of changes in nanoparticle
shape. A similar colour change was observed in the supernatant of samples of human toenails dispersed
in water. Scanning electron microscopy, UV/Vis and Raman spectroscopy were employed to monitor
the changes in morphology and surface plasmon resonance of the nanoparticles. The correlation of
colour change with the fungal infection was analysed using the absorbance ratio at 520nm/620nm. We
found a decrease in the ratio when the fungi concentration increased from 1 to 16 CFU/mL, with a
detection limit of 10 CFU/mL. The test had an 80% sensitivity and a 95% Specificity value for the
diagnosis of Athlete’s foot in human patients. This plasmonic gold nanoparticle based system for
detection of fungal infections measures the change in shape of gold nanoparticles and generates
coloured solutions with distinct tonality. Our application has the potential to contribute to self-
diagnosis and hygiene control in laboratories/hospitals with fewer resources, just using the naked eye.
Keywords: Fungi, gold nanoparticles, plasmonic assay, self-diagnostic.
INTRODUCTION
Fungi are ubiquitous in nature and can occur as unicellular yeast or filamentous bodies, as well as
multicellular moulds [1]. When the climate is mild, moist and changeable with abundant rainfall in
summer, the high humidity level allows fungi to grow on the surface of materials, causing human
infections such as onychomycosis and Tinea pedis [2]. People with onychomycosis may experience
significant psychosocial problems due to the appearance of the nail, particularly when fingers are
infected [3, 4]. Onychomycosis is primarily caused by Dermatophytes (mainly Trichophyton
rubrum and T. mentagrophytes) and to a lesser extent by nondermatophyte fungi such
as Acremonium spp., Aspergillus spp., Fusarium spp., Scopulariopsis brevicaulis, C. albicans, and C.
parapsilosis [5-13]. Tinea pedis (Athlete's foot) is another example of disease inflicted by Aspergillus
fungi in humid weather. This disease may cause foot itching, burning, pain, and can be spread from
person to person or by walking on contaminated objects and floors [1]. The genus Aspergillus is
comprised of several hundred species that are ubiquitous in the environment [3]. The most common
fungi are Aspergillus fumigatus, Aspergillus flavus, Aspergillus niger, and Aspergillus terreus [4].

3
Several non-dematiaceous fungi may also cause fungal melanonychia, including Trichophyton
rubrum.
Despite their widespread occurrence, little attention has been given to the development of new methods
to detect the presence of such fungi [2]. Currently available diagnostic tools for detecting fungal
infection include polymerase chain reactions (PCR) and enzymes [14]. However, PCR protocols have
their own drawbacks, which limit their widespread application. Unfortunately, false-positive results
occur in 5.7%–14.0% of adults and as high as 83% in neonates [5]. On the other hand, the use of PCR
to detect fungal DNA is possible in research laboratories, but is not standardized or FDA approved
[15]. Notably, the sensitivity of PCR is higher in in vitro colonization than in patient infections and
may cause false positives [15]. Microbiological cultures of biological fluids and tissue for the detection
of an invasive fungal infection require multiple days and occasionally weeks for the identification of
a specific fungal pathogen [16, 17]. Serological diagnosis using PCR, antibody, and toxins requires a
modern medical infrastructure including expensive equipment, costly materials and well-trained
specialists to operate the system [18, 19]. The gold standard procedure for fungal screening is directly
by microscopy using a potassium hydroxide (KOH) test [19]. The KOH test is usually conducted on
an outpatient basis. Results are usually available while the patient waits or on the next day, if sent to a
clinical laboratory [19]. However, it requires fluorescence microscopy, as well as specialised culture
conditions, which makes this method time consuming and requires specific training. As most acutely
infected patients seek medical attention within the first few days of illness, a cheap, fast and simple
test would allow simple home diagnosis and would support identification and intervention in regions
with underdeveloped medical systems or access to clinical testing.
Gold nanoparticles have been extensively investigated for cancer diagnosis [20-28]. Recently, an assay
has been developed for HIV detection with the naked eye based on gold nanoparticle formulation [29].
The temperature, pH value and salt concentration have been intensively studied to examine their
impact on the process of gold nano particle formulation on Rhizopus oryzae protein extract [30,31].
Here, we describe the development of a protocol to formulate gold nanoparticles, which react with
spore forming fungi e.g. Aspergillus niger, Aspergillus Oryzae , Penicillium Chrysogenum and Mucor
Hiemalis resulting in changes of gold nanoparticles’ (GNPs) shape and therefore colour, detectable
4
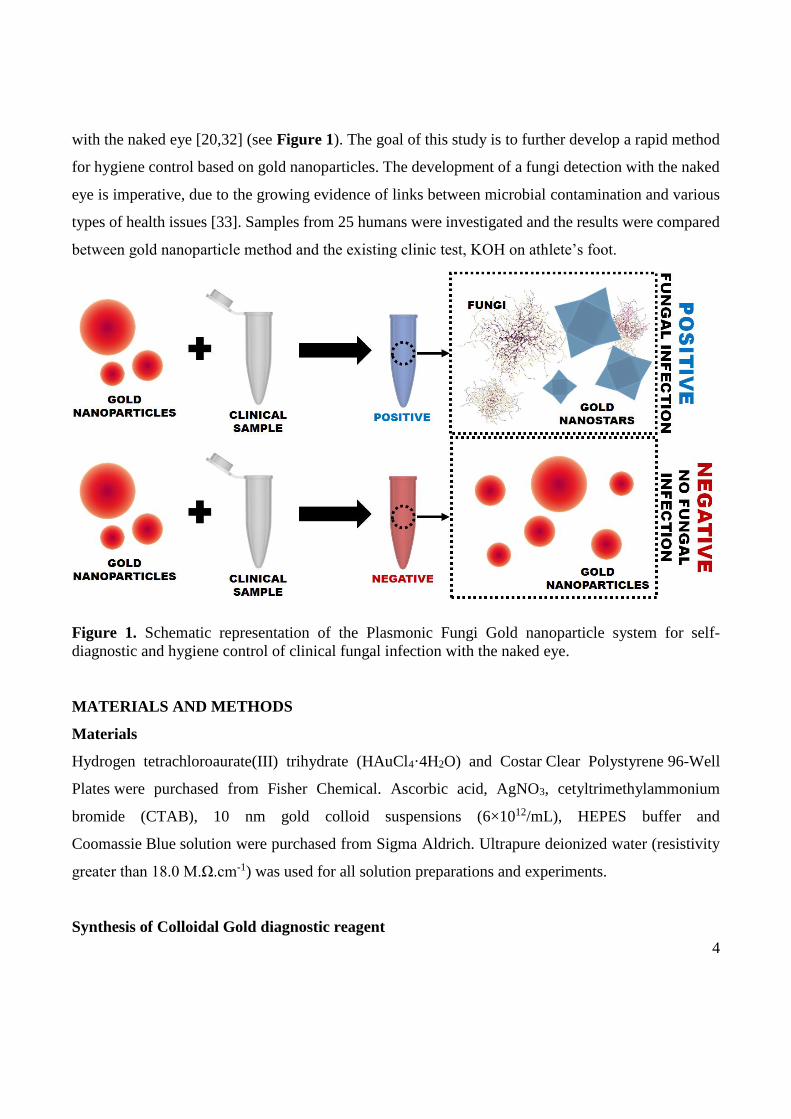
with the naked eye [20,32] (see Figure 1). The goal of this study is to further develop a rapid method
for hygiene control based on gold nanoparticles. The development of a fungi detection with the naked
eye is imperative, due to the growing evidence of links between microbial contamination and various
types of health issues [33]. Samples from 25 humans were investigated and the results were compared
between gold nanoparticle method and the existing clinic test, KOH on athlete’s foot.
Figure 1. Schematic representation of the Plasmonic Fungi Gold nanoparticle system for self-
diagnostic and hygiene control of clinical fungal infection with the naked eye.
MATERIALS AND METHODS
Materials
Hydrogen tetrachloroaurate(III) trihydrate (HAuCl4·4H2O) and Costar Clear Polystyrene 96-Well
Plates were purchased from Fisher Chemical. Ascorbic acid, AgNO3, cetyltrimethylammonium
bromide (CTAB), 10 nm gold colloid suspensions (6×10¹²/mL), HEPES buffer and
Coomassie Blue solution were purchased from Sigma Aldrich. Ultrapure deionized water (resistivity
greater than 18.0 M.Ω.cm-1) was used for all solution preparations and experiments.
Synthesis of Colloidal Gold diagnostic reagent

5
In order to produce a rapid test, the evolution of gold nano particle formulation was considered. The
formulation should be rapid and the colour difference identifiable and distinguishable with the naked
eye.
Initially. the GNP formation process was studied in the absence of fungal samples. Stock solutions of
2 mM Chloroauric acid and 0.1 M HEPES buffer (Sigma-Aldrich) in deionized water were prepared.
10 µl of the 2 mM Chloroauric acid stock solutions were added to a 96 well plate and mixed with 2 µl
of the HEPES buffer in 88 µl distilled water. The colour of the solution changed from pale yellow to
pink (indicating the formation of gold nanoparticles). The stability of the gold diagnostic reagent
solution was tested over 6 months at room temperature (20 °C). In addition, different concentrations
of NaNO3 in the range 0-200 mM were tested for salt stability of the gold nano particle formation rate
in Chloroauric acid and HEPES buffer solution.
GNP formulation was also studied in the presence of fungal cultures and human toenail samples. The
pH values of Chloroauric acid and HEPES buffer solution were adjusted by addition of HCl. A range
of pH values from 2.5 to 7.5 was employed in the GNP formulation in Chloroauric acid and HEPES
buffer solution in the presence of fungi. The rate of GNP formulation was monitored.
Characterisation of Colloidal Gold diagnostic reagent
A Perkin Elmer Lambda 900 UV/VIS/NIR Spectrometer was used to measure the absorbance and to
observe the formation and stability of GNPs. A Zetasizer Nano ZS analyser (Malvern Instruments,
Worcestershire, UK) was used to measure the hydrodynamic particle size and zeta potentials of the
nanoparticles. Six replicates have been measured for each data point.
Preparation of samples of fungal infection for testing
Toenails: All the experiments used in this study complied with current ethical considerations: Approval
(SYXK-2007-0025) of the Ethical Committee of Shanghai Jiao Tong University (Shanghai, China).
In this study, verbal informed consent was provided from participants, clients of nail salons. As some
salons may not uphold optimum sanitary conditions, a customer with a fungal infection may
unknowingly spread the infection causing a serious hygiene issue to the other customers. This may
6
cause discrimination, embarrassment and damage to a customer’s self-esteem. The participants were
informed that the study is scientifically relevant and not invasive and their actions would contribute to
developing a cheap, fast and simple test, which will improve population living standards. The
participants agreed to join the research test anonymously. The participants and the ethic committees
approved this consent procedure.
Ten nail clippings from each of the 25 anonymous volunteers in nail salons of foot spas were carefully
collected in sterile Eppendorf tubes at room temperature. The same day, the samples were transferred
to the laboratory, for gold nanoparticle method, KOH staining and routine fungal culturing. 1.5 mL of
Ultrapure deionized water was added and the Eppendorf tubes were shaken. The supernatants were
mixed with Chloroauric acid and HEPES buffer for two mins to observe the results. The nails clippings
were left in the Eppendorf tubes for the KOH experiment.
KOH assay for detecting fungal infection in a human sample
1 ml of 10% potassium hydroxide was added to the nail clippings Eppendorf and they were incubated
at room temperature for fifteen minutes. The nail clippings were then placed onto a microscope slide.
Fungi are transparent and therefore, to make them more visible, 10% lactophenol cotton blue stain was
added and the slides were observed under bright field microscopy. A fluorescence microscope was
used for fungal detection according to the KOH method.
Fungi culture
Aspergillus niger ATCC 16404, Aspergillus oryzae LZB125, Penicillium Chrysogenum LZB 141 and
Mucor hiemalis LZB 136 strains were supplied by Blades Biological Ltd. 100 µl of fungi liquid was
spread and incubated in a sterile container for inoculation on Sabouraud dextrose agar (SDA) at 25ºC
for 5 days. Fungi were harvested in the sterile ultrapure deionized water and centrifuged at 8,720xg
for 10 min. The fungi pellet was washed twice with sterile ultrapure deionized water. The pellet was
re-suspended in sterile ultrapure deionized water, at a concentration of 1-100 CFU/mL, The
Aspergillus niger colonies were counted to obtain an optimal concentration of fungi [34]. The re-
suspended fungi in sterile ultrapure deionized water was mixed with 2 mM Chloroauric acid and
7
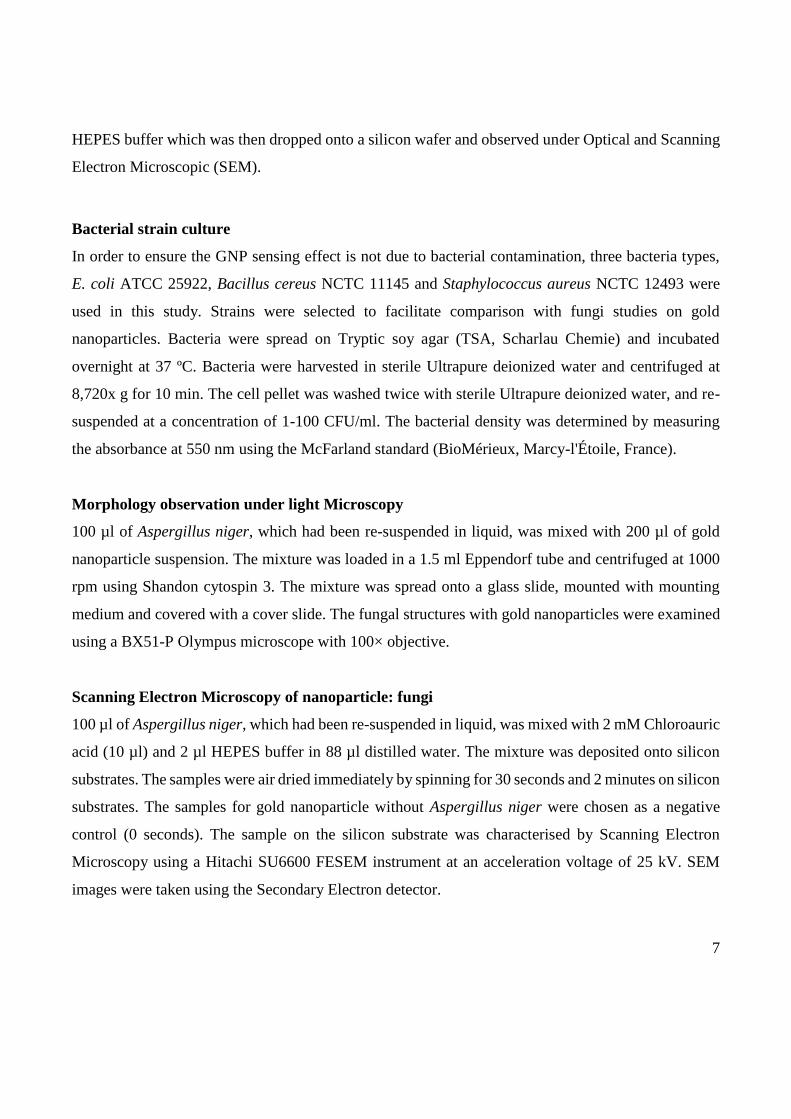
HEPES buffer which was then dropped onto a silicon wafer and observed under Optical and Scanning
Electron Microscopic (SEM).
Bacterial strain culture
In order to ensure the GNP sensing effect is not due to bacterial contamination, three bacteria types,
E. coli ATCC 25922, Bacillus cereus NCTC 11145 and Staphylococcus aureus NCTC 12493 were
used in this study. Strains were selected to facilitate comparison with fungi studies on gold
nanoparticles. Bacteria were spread on Tryptic soy agar (TSA, Scharlau Chemie) and incubated
overnight at 37 ºC. Bacteria were harvested in sterile Ultrapure deionized water and centrifuged at
8,720x g for 10 min. The cell pellet was washed twice with sterile Ultrapure deionized water, and re-
suspended at a concentration of 1-100 CFU/ml. The bacterial density was determined by measuring
the absorbance at 550 nm using the McFarland standard (BioMérieux, Marcy-l'Étoile, France).
Morphology observation under light Microscopy
100 µl of Aspergillus niger, which had been re-suspended in liquid, was mixed with 200 µl of gold
nanoparticle suspension. The mixture was loaded in a 1.5 ml Eppendorf tube and centrifuged at 1000
rpm using Shandon cytospin 3. The mixture was spread onto a glass slide, mounted with mounting
medium and covered with a cover slide. The fungal structures with gold nanoparticles were examined
using a BX51-P Olympus microscope with 100× objective.
Scanning Electron Microscopy of nanoparticle: fungi
100 µl of Aspergillus niger, which had been re-suspended in liquid, was mixed with 2 mM Chloroauric
acid (10 µl) and 2 µl HEPES buffer in 88 µl distilled water. The mixture was deposited onto silicon
substrates. The samples were air dried immediately by spinning for 30 seconds and 2 minutes on silicon
substrates. The samples for gold nanoparticle without Aspergillus niger were chosen as a negative
control (0 seconds). The sample on the silicon substrate was characterised by Scanning Electron
Microscopy using a Hitachi SU6600 FESEM instrument at an acceleration voltage of 25 kV. SEM
images were taken using the Secondary Electron detector.
8
Layout of concentration of fungi and bacteria on 96 well plates
The mixture with 2 mM Chloroauric acid (10 µl) and 2 µl HEPES buffer in 88 µl distilled water was
added to the 96 well plate. The wells of the first row were blank, containing 100 µl Ultrapure deionized
water. The wells from the second to fifth row were filled with 100 µl fungi suspensions. The
concentration of fungi were 0, 1, 2, 4, 6, 8, 10, 12, 14, 16 CFU/ml from left to right in each row. The
wells from second to fifth row were replicas for each fungi 96-well plate. Four replicates have been
measured for each data point. A plate layout of four fungi together from top to bottom was comprised
of A.niger in the second row A.oryzae in the third, P.chrysogenum in the fourth and the fifth with
M.hiemalis. The plate layout of three bacterial samples starting from the second row to fourth row
were Escherichia coli, Bacillus cereus and Staphylococcus aureus.
Surface Plasmon resonance analysis of nanoparticle: fungi
A Perkin Elmer Lambda 900 UV/VIS/NIR Spectrometer and Zetasizer Nano ZS analyser (Malvern
Instruments, Worcestershire, UK) were used to measure the absorbance, hydrodynamic particle size
and zeta potentials of the nanoparticles and to observe the formation and stability of GNPs. The
diameter, Zeta Potential and Surface Plasmon Resonance of the colloidal gold diagnostic reagent
solutions were measured immediately after the Aspergillus niger supernatant liquids were added into
the Chloroauric acid and HEPES buffer solution.
Raman spectral analysis to confirm fungal contamination
Raman spectroscopy was performed with a HORIBA Jobin Yvon HR800 spectrometer with 785 nm
diode laser as source. Spectral data was collected using a 10× microscope objective over the range
400-1800 cm−1 with a 10 sec integration time. The detector used was a 16-bit dynamic range Peltier
cooled CCD detector. Mixtures of gold nanoparticles and re-suspended cultured fungi solutions were
dropped onto CaF2 substrates and measured immediately. For comparison, spectra of GNPs alone were
recorded.
It has been shown that the spectrum of Mycotoxin can be achieved using GNPs and SERS within a
few minutes [35, 36]. In order to confirm fungal infection by Raman spectroscopy, Surface Enhanced

9
Raman of gold nanoparticles incubated with fungi were measured according to the preview methods
of gold nanostars for surface-enhanced Raman scattering [35, 36, 37].
Statistical Analysis
Two-tail analysis with Fisher’s test was employed to evaluate the prediction given, indicating that the
method can successfully predict the outcome. The sensitivity and specificity of the gold nanoparticle
test and the gold standard KOH method for fungal infection was employed to compare these two
assays.
RESULTS AND DISCUSSION
Physico-chemical characterisation of Gold Nanosphere
In the absence of fungi, the colour of solution changes from pale yellow to pink in 10 mins, consistent
with gold nanosphere particle formulation. At, Figure 2A shows a scanning electron microscopy
image of pristine 35 nm gold nanospheres, precipitated from suspension after the colour change has
stabilised (t=0) (left panel of Figure 2A). UV/visible spectra of nanoparticles present a single peak at
a wavelength of 520 nm (left panel of Figure 2B), which is consistent with the Surface Plasmon
Resonance (SPR) of spherically shaped gold nanoparticles.
Table 1 presents the key physico-chemical characteristics of nanoparticles used in the first GNP
formulation study, as determined by a combination of DLS, zeta potential and UV/visible absorption
spectroscopy. In the absence of fungi, the DLS of the GNP solutions indicates a monomodal dispersion
with a hydrodynamic diameter of 35.4-38.1 nm and a zeta potential of 25.5-26.3 mV. The stability of
the spherical shaped colloidal gold diagnostic reagent solution in individual and batch forms was tested
and they were seen to remain stable over 6 months at room temperature (Table1).

10
Figure 2. Surface plasmon resonance and stability assays of gold nanoparticles after incubation
with Aspergillus niger and no Aspergillus niger.
(A) SEM images of the formation of gold nanoparticles, deposited on a silicon substrate. In the absence
of Aspergillus niger fungi (t=0 min), the gold nanoparticles are seen to be spherical shaped under SEM.
After 30 seconds incubation with fungi, some aggregation is observed, and after 2 minutes, a change
in shape to nanostar like particles is observed. (B) Surface Plasmon Resonance spectra of nanoparticles
with increasing incubation times is shown; red, nanospheres at (t=0), purple nano-aggregates at
(t=0.5min) and blue, nanostars at (t=2min). (C) Gold nanoparticle formulation in the presence of

11
NaNO3. (D) Dependence of Gold nanoparticle formulation on pH value. (E) Dependence of the
duration of gold nanoparticle formulation time on pH (red) and NaNO3 concentration (green) (N=6).
Table 1. Physico-chemical characteristics of Gold nanoparticles. (N=6)
Gold
nanoparticle
Hydrodynamic
Diameter (nm)
Zeta
Potential (mv) λmaxξ (nm)
Month 0 37.7±3.2 26.1±1.5 530±9
Month 1 35.5±3.3 25.2±1.8 529±11
Month 2 38.1±3.4 26.3±2.1 530±15
Month 3 34.7±3.1 25.7±1.9 528±17
Month 4 35.4±2.8 26.2±1.7 529±12
Month 5 37.2±3.0 25.9±1.5 530±17
Month 6 36.6±1.9 25.5±2.1 530±18
Characterization of Plasmonic Colloidal Gold diagnostic reagents present in the presence of
Aspergillus niger cultures
When 100 µL of Aspergillus niger at a concentration of 100 CFU/mL were added to the 100 µL of
Chloroauric acid and HEPES buffer, the particles began to form aggregates and the spherical shape
became distorted on the silicon wafer substrate (Figure 2A, t=0.5 mins). This is consistent with the
observed dramatic change in the positioning of the surface plasmon resonance, which now exhibits a
maximum at a wavelength of 560 nm. When the incubation time is increased to 2 mins, the
nanoparticles precipitated onto the silicon substrate develop distinct pointed features and have
dimensions of ~35 nm (Figure 2A, t=2 mins), a form which is commonly referred to as “nanostars”.
They are characterised by a doubly peaked Surface Plasmon Resonance spectrum, with maxima at
wavelengths of 620 nm and 720 nm. The change in the surface plasmon resonance peak from 520 to
620/720 nm corresponds to a striking, visible colour change from orange/red to blue (Figure 2B).
The formation processes can be visualised by monitoring the absorbance ratio 520nm/620nm, as
shown in Figure S4. For the case of 100 µL of Aspergillus niger at a concentration of 100 CFU/mL
and a pH of 5.5., this ratio is seen to stabilise at a value of 0.8 after 2 minutes. This point of stabilisation
can be used as a characteristic formation time, and Figure 2E demonstrates that, as a function of pH,

12
this formation time is strongly pH dependent. In the presence of 16 CFU/ml Aspergillus niger, when
the pH value of the Chloroauric acid and HEPES buffer suspension is below 5.0, DLS measurements
indicate that the size of gold nanoparticle increases. The Zeta potential changed from 26mV at pH 5.5
to 16 mV at pH 5. This result is consistent with literature results on the relationship of gold nanoparticle
size with pH value and Zeta potential [30, 31]. Notably, there is a lowest time point at pH 5.5 for the
duration of gold nanoparticle formulation. The colour is easily identified and distinguishable with the
naked eye, as it turns a blue in colour within 2 min. The duration is optimized to produce a rapid test
in 2 mins. The pH is set at 5.5 in the following experiment for fungi detection.
The aggregation process can also be induced by 5 mM NaNO3 (Figure 2E). DLS measurements show
an increase in the average particle size from 35.0 ±5.6 to 402±29 nm as NaNO3 concentration is
increased from 0-200 mM. The Zeta potential changes from 26mV to 6 mV when NaNO3 concentration
is increased over the same range. Notably, however, the gold nanoparticle formulation time also
increases significantly. When the NaNO3 concentration is equal to 0, the particle formulation takes 10
mins (Figure 2E). When the NaNO3 concentration is increased, it takes over 200 mins to form large
nanoparticles (400 nm in diameter, see Figure 2E and S5). The salt-induced aggregation arises due to
shielding of the electrostatic repulsion between the negatively charged nanoconjugate systems. The
electrostatic repulsion is mediated by formation of an electrical double layer to form a large
nanoparticle [30, 31]. The colour of the solution appears grey or transparent due to large nanoparticle
formulation [20].
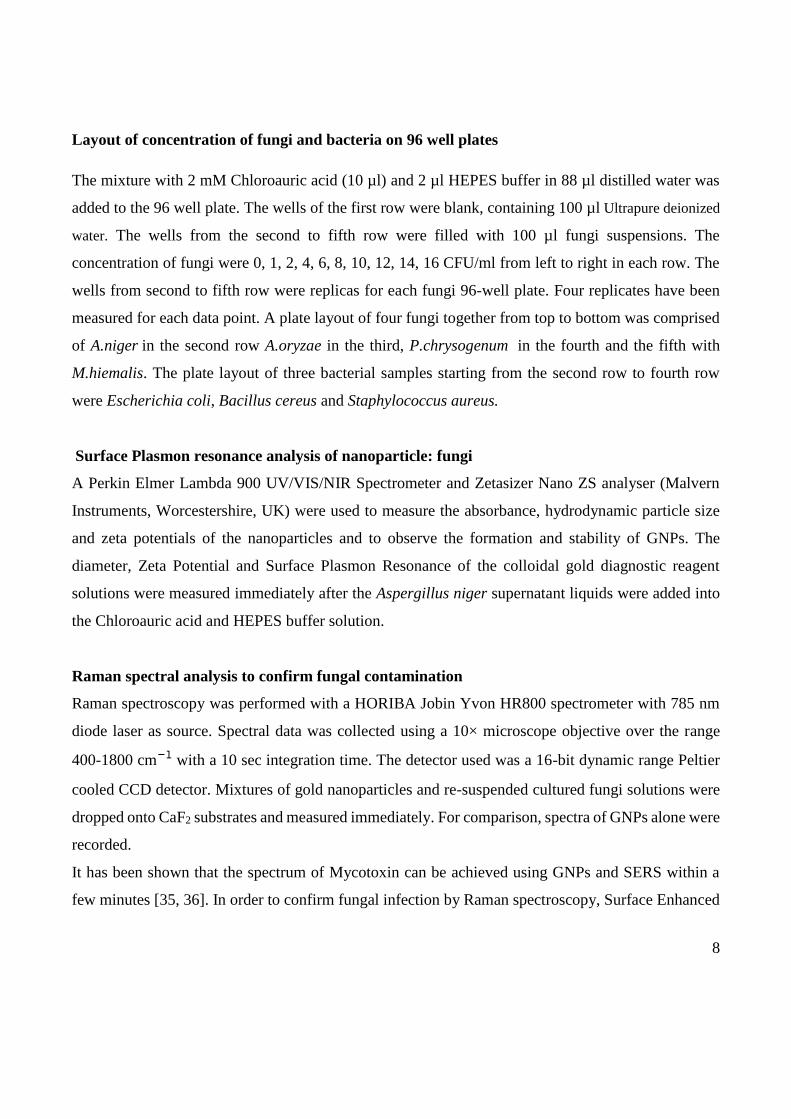
The images of living fungi typically exhibit many long hyphae connected on the core of Aspergillus
niger. Gold nanoparticles are deposited on the glass substrate or trapped between hyphae (Figure 3B-
D). Some gold nanoparticles have been found also on the fungi hypha mixing fungi with Chloroauric
acid and HEPES buffer after 2 minutes of incubation (Figures 3A). An enlargement of the rectangular
area shows star shaped gold nanoparticle on of the fungi hyphae (Figure 3A). The right side of the
panel shows the rectangular area of the left panel of Figure 3A.
13

14
Figure 3. (A) SEM images of hyphae of Aspergillus niger growing in gold nanoparticle solution after
2 minutes of incubation. The right side of the panel shows the nanoparticles’ morphology on the
hyphae of Aspergillus niger. Images of Aspergillus niger and gold nanoparticles under light
microscopy, under a 4× microscope objective, (B) 10× microscope objective and (C) 100× microscope
objective (D). The images of living fungi typically exhibit several long hyphae connected on the core
of fungi (B, C).
Generation of coloured solutions for Aspergillus niger detection with the naked eye
A change in colour from red to blue was detected in a number of human samples, indicating the
presence of fungal infection. The efficiency of the colloidal gold diagnostic reagent in detecting
Aspergillus niger contamination is 100% in comparison to microscopy observation. A blue colour
indicated fungi contamination (from top second to third line in the of the 96-well plate image in Figure
4A). Detection with the naked eye seems perfectly suited for analyses in laboratories or public places
with fewer resources. The colour changed from bright red to blue (indicating the nano star formation)
in 120 seconds. These results show that the red colour is directly attributable to the sphere shaped gold
nanoparticles, whereas, when in contact with the Aspergillus niger, the spherical shaped nanoparticles
change to star shaped with a concomitant change in colour from red to blue. Therefore, it is deemed
possible to measure fungi contamination by controlling the colour of the nanoparticle solution from
red to blue (Figure 4A and 4B).
Notably, Escherichia coli, Bacillus cereus and Staphylococcus aureus show different colour changes
at the same concentration and same bacterial concentration (S2). Bacterial experiments have the same
order as fungi in 96 well plates and use same concentration as in the fungi experiments, from 0 CFU
to 16 CFU/mL. The colour of the solution in bacteria samples changes from pale yellow to pink in 50
mins, at the same concentration as that of the fungi experiment (Supplement material S2). Since the
difference in biomass of fungi and bacteria is large, it is difficult to compare the bacteria and fungi
mechanism of gold nanoparticle formulation [38,39]. Particularly at low pH, biosorption on fungal
biomass is higher than on bacteria [40, 41].
15
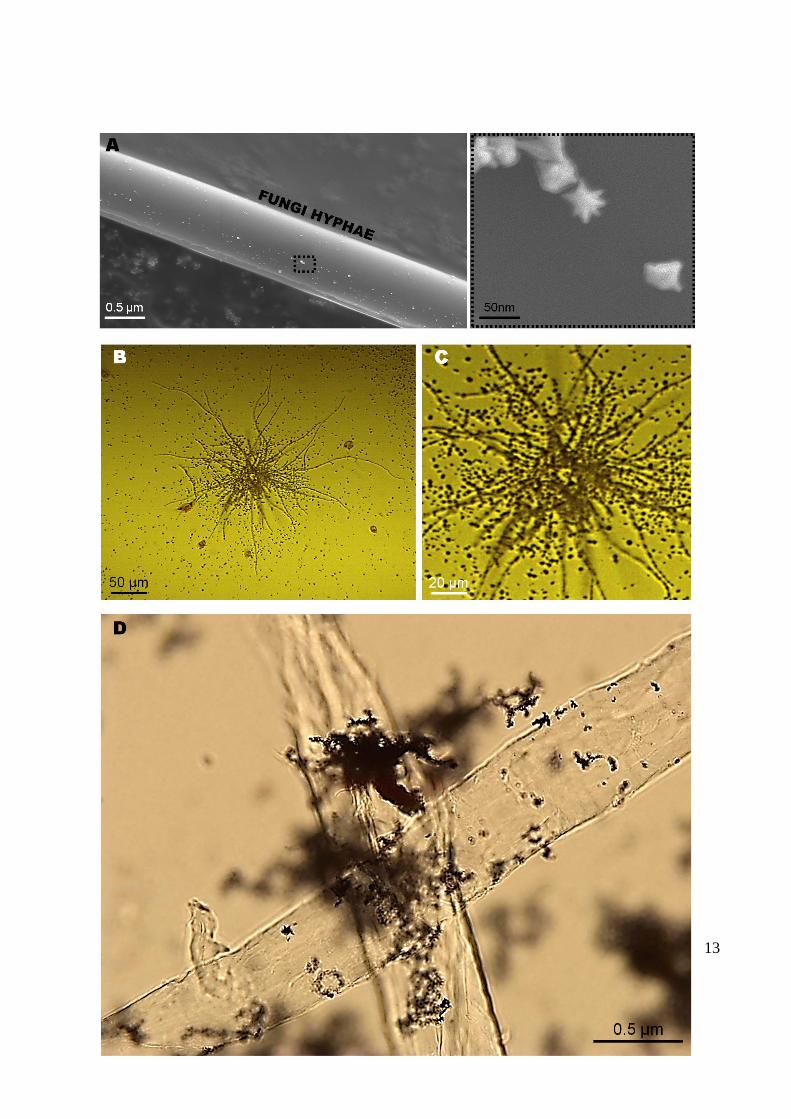
Figure 4. The correlation between colorimetric, surface plasmon resonance and Raman
spectroscopy of Plasmonic fungi Gold nanoparticle. (A) Colorimetric assay of Gold nanoparticle in
96 well plate. (Upper panel) The concentration of fungi increases from left to right from 0 to 16
CFU/mL. And Aspergillus niger, Aspergillus oryzae, Penicillium chrysogenum and Mucor hiemalis
were loaded from top to bottom, respectively. (Lower panel) The concentration of Aspergillus niger
increases from left to right from 0 to 16 CFU/mL and the wells from 2nd row to 5th row are replicates.
The colour changes from red to pink-purple and to blue indicated the increase in fungi concentration.
(B) The surface plasmon resonance spectra under spectrometer reader of negative and positive samples
for fungal infection. The negative one shows red colour and the positive shows blue colour. (C) Ratio
between non-aggregated/negative sample (at 520 nm) and aggregated/positive GNPs (at 620 nm). The
ratio of absorbances exhibits a plateau below ~ 4 CFU/mL, and above 10 CFU/mL, which define the
limits of detectability, which an approximately linear region in between. (D) Raman spectra of a Blank,
Negative and Positive samples. No Raman spectra is present in the Blank and Negative samples;
however an intensive Raman spectra can be observed in Positive samples.
16
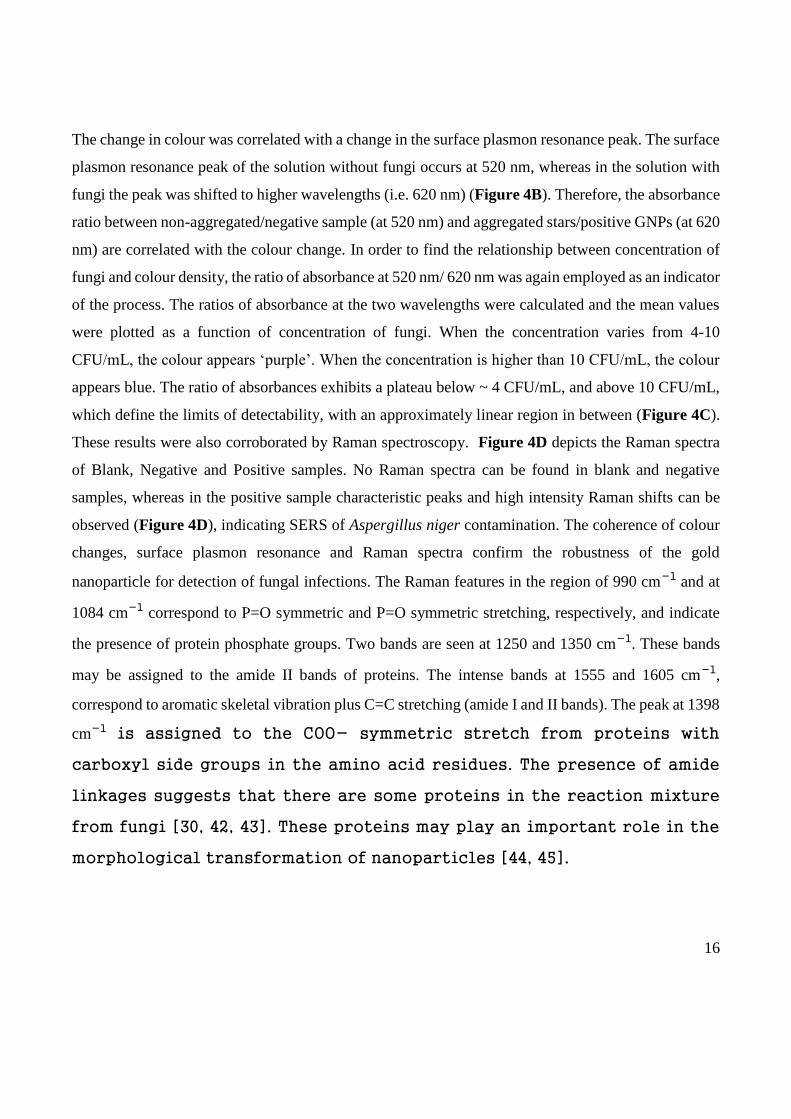
The change in colour was correlated with a change in the surface plasmon resonance peak. The surface
plasmon resonance peak of the solution without fungi occurs at 520 nm, whereas in the solution with
fungi the peak was shifted to higher wavelengths (i.e. 620 nm) (Figure 4B). Therefore, the absorbance
ratio between non-aggregated/negative sample (at 520 nm) and aggregated stars/positive GNPs (at 620
nm) are correlated with the colour change. In order to find the relationship between concentration of
fungi and colour density, the ratio of absorbance at 520 nm/ 620 nm was again employed as an indicator
of the process. The ratios of absorbance at the two wavelengths were calculated and the mean values
were plotted as a function of concentration of fungi. When the concentration varies from 4-10
CFU/mL, the colour appears ‘purple’. When the concentration is higher than 10 CFU/mL, the colour
appears blue. The ratio of absorbances exhibits a plateau below ~ 4 CFU/mL, and above 10 CFU/mL,
which define the limits of detectability, with an approximately linear region in between (Figure 4C).
These results were also corroborated by Raman spectroscopy. Figure 4D depicts the Raman spectra
of Blank, Negative and Positive samples. No Raman spectra can be found in blank and negative
samples, whereas in the positive sample characteristic peaks and high intensity Raman shifts can be
observed (Figure 4D), indicating SERS of Aspergillus niger contamination. The coherence of colour
changes, surface plasmon resonance and Raman spectra confirm the robustness of the gold
nanoparticle for detection of fungal infections. The Raman features in the region of 990 cm−1 and at
1084 cm−1 correspond to P=O symmetric and P=O symmetric stretching, respectively, and indicate
the presence of protein phosphate groups. Two bands are seen at 1250 and 1350 cm−1. These bands
may be assigned to the amide II bands of proteins. The intense bands at 1555 and 1605 cm−1,
correspond to aromatic skeletal vibration plus C=C stretching (amide I and II bands). The peak at 1398
cm−1 is assigned to the COO− symmetric stretch from proteins with
carboxyl side groups in the amino acid residues. The presence of amide
linkages suggests that there are some proteins in the reaction mixture
from fungi [30, 42, 43]. These proteins may play an important role in the
morphological transformation of nanoparticles [44, 45].

17
Comparison of four fungi on gold nano particle formulation
Table 2. Physico-chemical characteristics of gold nanoparticles mixing different fungi (N=4)
Samples Hydrodynamic
Diameter (nm)
Zeta
Potential (mV)
λmax (nm)
Aspergillus niger
40±9.2
7.5±0.4
560±8
Aspergillus oryzae
38±7.1 7.8±0.2 560±12
Penicillium chrysogenum
40±13 11.6±1.9 563±12
Mucor hiemalis
51±11 9.6±3.6 565±15
Hydrodynamic diameters of gold nanoparticles were measured from mixing different fungi at a
concentration of 16 CFU/ml with Chloroauric acid and HEPES buffer after 2 minutes of incubation.
The average sizes range from 38±7.1 nm to 51±11 nm (Table 2). The zeta potential of four types of
gold nanoparticles is around 7.5 mV to 11.6 mV. The peaks of surface plasma resonance are from 560
nm to 565 nm (Table 2). Bhambure and co-authors have employed Aspergillus niger with uric chloride
to produce gold nanoparticles at diameter of 12.79 nm [42]. The particle formulation is related with
pH value [30, 31]. The Aspergillus niger had a rather narrow pH optimum around pH 5.5 to active
phytase [46]. In this experiment, a pH value equal to 5.5 is optimized to shorten the synthesis time and
aimed a rapid colour changing.
Since A.niger and A.oryzae are all aspergillus, the colour changes observed are the same
(Supplementary Figure S1). The wells of 4th row are P.chrysogenum and 5th rows are M.hiemalis
(Figure 4A). Different fungi have different impact on the gold nanoparticle formulation. The
composition of protein phosphate groups and amino acid are large different on fungi. Aspergillus
fumigatus, Emericella nidulans, and Myceliophthora thermophila phytases exhibited considerable

18
activity with a broad range of phosphate compounds. It has been considered that more phosphate is
liberated by the A. fumigatus phytase than by the A. niger phytase [46]. The different enzyme activity
from different fungi cause gold nanoparticle formulation slight different, but all of fungi, such as
A.niger , A.oryzae and M.hiemalis, are able to detect at the concentration of 10 CFU/mL.
Comparison between Gold nanoparticle and KOH on Athlete’s foot from human patients
The current gold standard for the screening of superficial fungal infections is the KOH test. The
infected sample incubated with potassium hydroxide can be observed under a fluorescence
microscope.
Standard fungi cultures with agar plates are accurate but can take up to seven days to positively identify
the contaminating fungus. The diagnosis of infection versus colonization with these fungi is time
consuming. The agar plate incubation is slow and expensive, but useful to confirm the diagnosis of
onychomycosis when long-term oral therapy is being considered. The culture usually takes 5 days to
be declared positive; it must be held for 21 days until being declared negative. If fungal infections are
mistreated as other diseases, the different drugs used may cause fungal resistance and will challenge
the treatment. ELISA and Real-time PCR are much faster but require expensive equipment and
reagents [19].
Notably, the GNPs method is much simpler and faster, and most importantly revealed no statistical
difference between this method and the existing KOH method (Table 3). In fact, specificity and
sensitivity of GNPs have been evaluated against the existing clinic method, KOH, on the same
samples. The KOH test has 71.3% sensitivity and a 94.4% specificity for the diagnosis of Athlete’s
foot, compared with an 80 % sensitivity and 95% specificity for gold nanoparticle method (Table 3).
The negative predictive value (NPV) is the percentage of patients with a negative test who do not have
the disease. In 2×2 table (Table 3), Cell “d” are the “True Negatives” and Cell “c” are the “False
Negatives”. NPV tells us how many of the test negatives true negatives are; and if this number is 90%,
then it suggests that this new test is doing as well as the “Gold Standard”. Moreover, the GNPs (200
µl per test) represent a dramatic reduction in the cost of generating results, and the GNPs delivers
precise results of fungi detection after 2 minutes of incubation only.
19
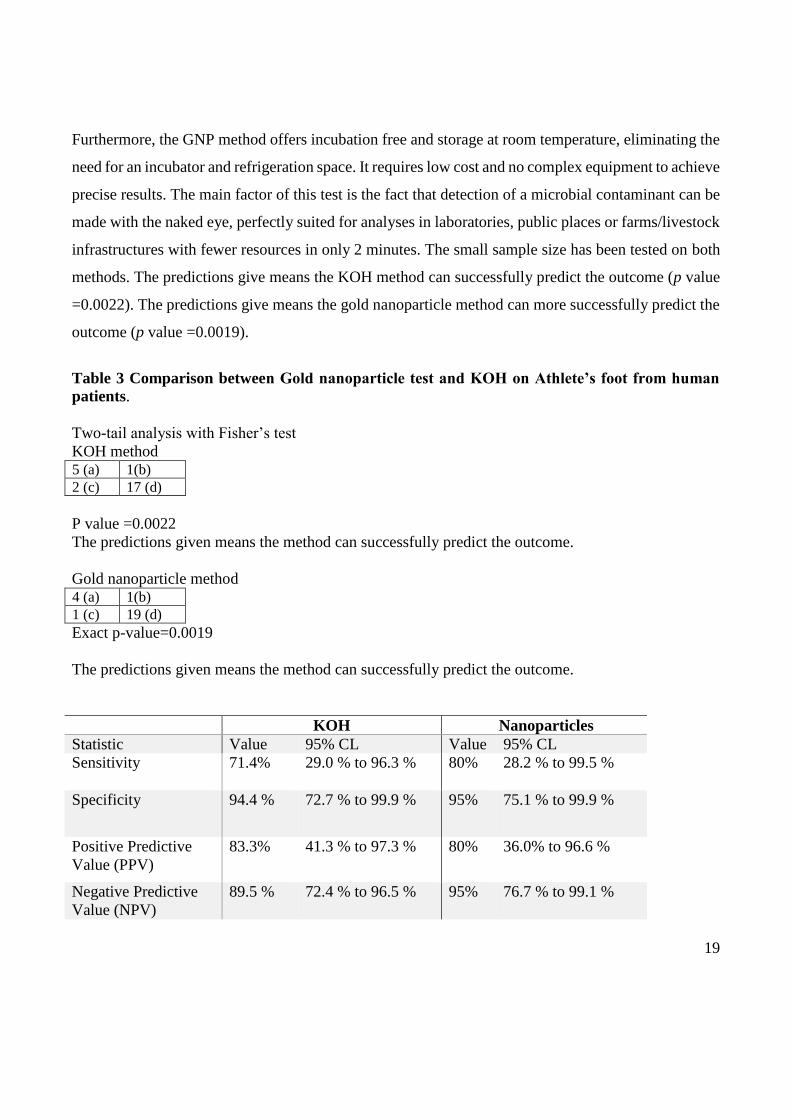
Furthermore, the GNP method offers incubation free and storage at room temperature, eliminating the
need for an incubator and refrigeration space. It requires low cost and no complex equipment to achieve
precise results. The main factor of this test is the fact that detection of a microbial contaminant can be
made with the naked eye, perfectly suited for analyses in laboratories, public places or farms/livestock
infrastructures with fewer resources in only 2 minutes. The small sample size has been tested on both
methods. The predictions give means the KOH method can successfully predict the outcome (p value
=0.0022). The predictions give means the gold nanoparticle method can more successfully predict the
outcome (p value =0.0019).
Table 3 Comparison between Gold nanoparticle test and KOH on Athlete’s foot from human
patients.
Two-tail analysis with Fisher’s test
KOH method 5 (a) 1(b) 2 (c) 17 (d)
P value =0.0022
The predictions given means the method can successfully predict the outcome.
Gold nanoparticle method 4 (a) 1(b) 1 (c) 19 (d)
Exact p-value=0.0019
The predictions given means the method can successfully predict the outcome.
KOH Nanoparticles
Statistic Value 95% CL Value 95% CL
Sensitivity 71.4% 29.0 % to 96.3 % 80% 28.2 % to 99.5 %
Specificity 94.4 % 72.7 % to 99.9 % 95% 75.1 % to 99.9 %
Positive Predictive
Value (PPV)
83.3% 41.3 % to 97.3 % 80% 36.0% to 96.6 %
Negative Predictive
Value (NPV)
89.5 % 72.4 % to 96.5 % 95% 76.7 % to 99.1 %

20
It is known that microorganisms such as bacteria [39] and fungus [40] are capable of producing gold
nanoparticles from solutions containing ionic gold. Notably, while the time required for the process in
the presence of bacteria ranges from 24 to 48 h [39]. The mechanism of gold nanoparticles formation
in the presence of fungi/bacteria is still not well known, however. Raman spectroscopy shows there
are phosphate, aromatic and carboxyl side groups in amino acid residues in the reaction mixture of
fungi, consistent with literature [30,45,46]. These amino acid residues may play an important role in
the formation and morphological transformation of nanoparticles [47,48].
The differing spectral evolution patterns for fungal pathogens compared to bacteria and other factors
such as salt concentrations, render the test specific to such infections. Table 3 demonstrates that the
test is comparable in terms of specificity to the KOH test, but has the advantage of being significantly
more rapid and convenient. Neither the KOH test nor the GNPs method allows specific identification
of a specific fungal pathogen. Further microbiological testing must be performed to permit
identification of a specific pathogen. However, the knowledge can be transferable and applicable to
other health problems related to fungal infections as well. The system described here has been initially
developed, tested and implemented for athlete’s foot. The sensitivity (10 CFU/ml) achieved with the
GNPs is not only sufficient to diagnose athlete’s foot in order to target bathing water regulations, but
can also provide information on waterborne disease outbreaks [47,48].
Aspergillus fumigatus, Emericella nidulans, and Myceliophthora thermophila phytases exhibited
considerable activity with a broad range of phosphate compounds. The Aspergillus niger had a rather
narrow pH optimum around pH 5.5 to active phytase [46]. However, the knowledge of the interaction
between fungal enzyme activities with gold nanoparticle is still at an early stage. The large and
relatively unexplored fungal enzyme activity is an advantage because of the role that extracellular
proteins and enzymes have in Au reduction and GNP capping. We plan to implement a systematic
study such as protein phosphate groups and amino acid on mechanism of fungi on colour changing of
gold nanoparticles in the near future.
CONCLUSIONS

21
A novel Gold nanoparticle based, rapid detection system has been developed to diagnose fungi
infection in a fast and simple way. The correlation of the colour change (absorbance of 520nm/620nm)
is related to fungi concentration. The cut of ration is 0.8 on 520nm/620 nm. There was a significant
colour change from red to blue when the fungi concentration increased from 0 to 16 CFU/mL. When
the fungi concentration at 10 CFU/mL, the ration of 520nm/620nm was significant decrease. When
the bacterial concentration increase, the ration of 520nm/620nm was slowly decrease. There is a linear
relationship between concentration of E.coli and the ration from 0-16 CFU/mL with a low slope on
the curve. The resolution of this test was 10 CFU/mL. The current gold standard KOH was compared
with the GNP method for the diagnosis of fungal infection. The GNP method has an 80% sensitivity
and a 95% negative predictive value for the diagnosis of athlete’s foot from human donors. We found
no statistical difference between our method and the gold standard method KOH. The gold
nanoparticles application has an outstanding potential to contribute for surface hygiene at home or
public places simply by monitoring a colour change with naked eye.
This approach requires no extraneous instrumentation or prior sample preparation and has a rapid and
simple diagnostic readout that could be used in clinical settings for testing patient samples or in field
tests to monitor food and water sources.
AUTHOR CONTRIBUTIONS
Conceived and designed the experiments: TS, JC, KL, JC, FT. Analysed the data: TS, JC, KL, FT.
Contributed reagents/materials/analysis tools: JC, DC, FT. Wrote the paper: KL, JC, HJB, FT, TS.
ACKNOWLEDGMENTS
TS and KL thanks Fiosraigh Scholarship Programme from Dublin Institute Technology. FT
acknowledges Enterprise Ireland CF-2015-0269-Y. This work is supported by National Natural
Scientific Fund (No.81225010), 863 Project of China (2014AA020700), Shanghai Science and
Technology Fund (No.13NM1401500), Shanghai Jiao Tong University Innovation Fund for
Postgraduates (No. AE340011).
22
ETHICAL COMMITTEE APPROVAL
Clinical specimen experiments were performed according to Guidelines for Ethical Committee,
Shanghai Jiao Tong University. All the experiments used in this study were complied with current
ethical considerations: Approval (SYXK-2007-0025) of Ethical Committee of Shanghai Jiao Tong
University (Shanghai, China).
DECLARATION ON CONFLICT OF INTEREST
The Authors declare that there is no conflict of interest.
STATEMENT CONSENT
This is a research study investigating your nails with gold nanoparticles. The nails collected will be
anonymous, aggregated and encrypted. Your voluntary participation (or not) will have no effect on
your standing with the researchers. You can withdraw at any time and you can contact the researchers
by email ([email protected]) to withdraw or to seek clarification on any aspect of the study. By
proceeding to the nail collection you consent to your responses being used as part of the academic
study; the data may be published and disseminated through appropriate academic conferences and/or
journals. By signing the statement consent, you agree to take part in this test and have reviewed the
ethical considerations above.
REFERENCES
1. Bergman J (2002) Current Diagnosis and Treatment in Infectious Diseases. J Am Board Fam Med.
15 (2):175-176.
2. Kirk P, Cannon P, David J, Stalpers J (2001) Ainsworth and Bisby's dictionary of the fungi.
Ainsworth and Bisby's dictionary of the fungi: 9th edition (Ed. 9).
3. Fleming RV, Walsh TJ, Anaissie EJ (2002) Emerging and less common fungal pathogens. Infect
Dis Clin North Am. 16 (4):915-933.
23
4. McNeil MM, Nash SL, Hajjeh RA, Phelan MA, Conn LA, Plikaytis BD, Warnock DW (2001)
Trends in mortality due to invasive mycotic diseases in the United States, 1980–1997. Clin Infect Dis.
33 (5):641-647.
5. Elewski BE (1998) Onychomycosis: pathogenesis, diagnosis, and management. Clin Microbiol Rev.
11 (3):415-429.
6. Vélez A, Linares MJ, Fenández-Roldán JC, Casal M (1997) Study of onychomycosis in Cordoba,
Spain: prevailing fungi and pattern of infection. Mycopathologia. 137 (1):1-8.
7. Godoy P, Nunes F, Silva V, Tomimori-Yamashita J, Zaror L, Fischman O (2004) Onychomycosis
caused by Fusarium solani and Fusarium oxysporum in Sao Paulo, Brazil. Mycopathologia. 157
(3):287-290.
8. Kemna ME, Elewski BE (1996) A US epidemiologic survey of superficial fungal diseases. J Am
Acad Dermatol. 35 (4):539-542.
9. Sellami A, Sellami H, Makni F, Mezghani S, Cheikh-Rouhou F, Marrekchi S, Turki H, Ayadi A
(2008) Childhood dermatomycoses study in Sfax hospital, Tunisia. Mycoses. 51 (5):451-454.
10. Svejgaard E, Nilsson J (2004) Onychomycosis in Denmark: prevalence of fungal nail infection in
general practice. Mycoses. 47 (3-4):131-135.
11. Baran R (2011) The nail in the elderly. Clin Dermatol. 29 (1):54-60.
12. Baran R, Haneke E, Hay RJ, Piraccini BM, Tosti A (1999) Onychomycosis: the current approach
to diagnosis and therapy. CRC Press.
13. Bontems O, Hauser P, Monod M (2009) Evaluation of a polymerase chain reaction‐ restriction
fragment length polymorphism assay for dermatophyte and nondermatophyte identification in
onychomycosis. Br J Dermatol. 161 (4):791-796.
14. Kitching M, Ramani M, Marsili E (2015) Fungal biosynthesis of gold nanoparticles: mechanism
and scale up. Microb Biotechnol. 8 (6):904-917.
15. Han HW, Hsu MM-L, Choi JS, Hsu C-K, Hsieh HY, Li HC, Chang HC, Chang TC (2014) Rapid
detection of dermatophytes and Candida albicans in onychomycosis specimens by an oligonucleotide
array. BMC Infect Dis. 14 (1):1.
16. Pickering JW, Sant HW, Bowles CA, Roberts WL, Woods GL (2005) Evaluation of a (1→ 3)-β-d-glucan assay for diagnosis of invasive fungal infections. J Clin Microbiol. 43 (12):5957-5962. 17. Van Thiel DH, George M, Moore CM (2012) Fungal infections: their diagnosis and treatment in
transplant recipients. Int J Hepatol. 2012.
18. Guarner J, Brandt ME (2011) Histopathologic diagnosis of fungal infections in the 21st century.
Clin Microbiol Rev. 24 (2):247-280. doi:10.1128/CMR.00053-10.
19. Andrews MD, Burns M (2008) Common tinea infections in children. Am Fam Physician. 77
(10):1415-1420.
20. Sugunan A, Melin P, Schnurer J, Hilborn JG, Dutta J (2007) Nutrition-driven assembly of colloidal
nanoparticles: growing fungi assemble gold nanoparticles as microwires. Adv Mater. 19 (1):77-81.
21. Li Z, Chung SW, Nam JM, Ginger DS, Mirkin CA (2003) Living templates for the hierarchical
assembly of gold nanoparticles. Angew Chem Int Ed Engl. 42 (20):2306-2309.
doi:10.1002/anie.200351231.
24
22. Conde J, Bao C, Cui D, Baptista PV, Tian F (2014) Antibody-drug gold nanoantennas with Raman
spectroscopic fingerprints for in vivo tumour theranostics. J Control Release. 183:87-93.
doi:10.1016/j.jconrel.2014.03.045.
23. Bao C, Chen L, Wang T, Lei C, Tian F, Cui D, Zhou Y (2013) One Step Quick Detection of Cancer
Cell Surface Marker by Integrated NiFe-based Magnetic Biosensing Cell Cultural Chip. Nano-Micro
Lett. 5 (3):213-222.
24. Conde J, Tian F, Hernandez Y, Bao C, Cui D, Janssen KP, Ibarra MR, Baptista PV, Stoeger T, de
la Fuente JM (2013) In vivo tumor targeting via nanoparticle-mediated therapeutic siRNA coupled to
inflammatory response in lung cancer mouse models. Biomaterials. 34 (31):7744-7753.
doi:10.1016/j.biomaterials.2013.06.041.
25. Conde J, Ambrosone A, Sanz V, Hernandez Y, Marchesano V, Tian F, Child H, Berry CC, Ibarra
MR, Baptista PV, Tortiglione C, de la Fuente JM (2012) Design of multifunctional gold nanoparticles
for in vitro and in vivo gene silencing. ACS Nano. 6 (9):8316-8324. doi:10.1021/nn3030223.
26. Bao C, Beziere N, del Pino P, Pelaz B, Estrada G, Tian F, Ntziachristos V, de la Fuente JM, Cui D
(2013) Gold nanoprisms as optoacoustic signal nanoamplifiers for in vivo bioimaging of
gastrointestinal cancers. Small. 9 (1):68-74.
27. Bhaskar S, Tian F, Stoeger T, Kreyling W, de la Fuente JM, Grazu V, Borm P, Estrada G,
Ntziachristos V, Razansky D (2010) Multifunctional Nanocarriers for diagnostics, drug delivery and
targeted treatment across blood-brain barrier: perspectives on tracking and neuroimaging. Part Fibre
Toxicol. 7:3. doi:10.1186/1743-8977-7-3.
28. Bao C, Tian F, Estrada G (2011) Improved visualisation of internalised carbon nanotubes by
maximising cell spreading on nanostructured substrates. Nano Biomed Eng. 2 (4):201-210.
29. De La Rica R, Stevens MM (2012) Plasmonic ELISA for the ultrasensitive detection of disease
biomarkers with the naked eye. Nat Nanotechnol. 7 (12):821-824.
30. Das SK, Dickinson C, Lafir F, Brougham DF, Marsili E (2012) Synthesis, characterization and
catalytic activity of gold nanoparticles biosynthesized with Rhizopus oryzae protein extract. Green
Chem. 14 (5):1322-1334.
31. Tian F, Bonnier F, Casey A, Shanahan AE, Byrne HJ (2014) Surface enhanced Raman scattering
with gold nanoparticles: effect of particle shape. Anal Method. 6 (22):9116-9123.
32. Mukherjee P, Senapati S, Mandal D, Ahmad A, Khan MI, Kumar R, Sastry M (2002) Extracellular
synthesis of gold nanoparticles by the fungus Fusarium oxysporum. ChemBioChem. 3 (5):461-463.
doi:10.1002/1439-7633(20020503)3:5<461::AID-CBIC461>3.0.CO;2-X.
33. Cohen R, Persky L, Hadar Y (2002) Biotechnological applications and potential of wood-
degrading mushrooms of the genus Pleurotus. Appl Microbiol Biot. 58 (5):582-594.
34. Fischbach FT, Dunning MB (2009) A manual of laboratory and diagnostic tests. Lippincott
Williams & Wilkins.
35. Tian F, Conde J, Bao C, Chen Y, Curtin J, Cui D (2016) Gold nanostars for efficient in vitro and
in vivo real-time SERS detection and drug delivery via plasmonic-tunable Raman/FTIR imaging.
Biomaterials. 106:87-97.
36. Singh DK, Ganbold E-O, Cho E-M, Cho K-H, Kim D, Choo J, Kim S, Lee CM, Yang SI, Joo S-
W (2014) Detection of the mycotoxin citrinin using silver substrates and Raman spectroscopy. J
Hazard Mater. 265:89-95.
37. Khoury CG, Vo-Dinh T (2008) Gold nanostars for surface-enhanced Raman scattering: synthesis,
characterization and optimization. J Phys Chem C. 112 (48):18849-18859.

25
38. Kuyucak N, Volesky B (1988) Biosorbents for recovery of metals from industrial solutions.
Biotechnol Lett. 10 (2):137-142.
39. Tsuruta T (2004) Biosorption and recycling of gold using various microorganisms. J Gen Appl
Microbiol. 50 (4):221-228.
40. Taherzadeh MJ, Fox M, Hjorth H, Edebo L (2003) Production of mycelium biomass and ethanol
from paper pulp sulfite liquor by Rhizopus oryzae. Bioresource Technol. 88 (3):167-177.
41. Xu B, Jahic M, Blomsten G, Enfors S-O (1999) Glucose overflow metabolism and mixed-acid
fermentation in aerobic large-scale fed-batch processes with Escherichia coli. Appl Microbiol
Biotechnol. 51 (5):564-571.
42. Bhambure R, Bule M, Shaligram N, Kamat M, Singhal R (2009) Extracellular biosynthesis of gold
nanoparticles using Aspergillus niger–its characterization and stability. Chem Eng Technol. 32
(7):1036-1041.
43. Binupriya A, Sathishkumar M, Vijayaraghavan K, Yun S-I (2010) Bioreduction of trivalent aurum
to nano-crystalline gold particles by active and inactive cells and cell-free extract of Aspergillus oryzae
var. viridis. J Hazard Mater. 177 (1):539-545.
44. Gole A, Dash C, Ramakrishnan V, Sainkar S, Mandale A, Rao M, Sastry M (2001) Pepsin-gold
colloid conjugates: preparation, characterization, and enzymatic activity. Langmuir. 17 (5):1674-1679.
45. Vigneshwaran N, Kathe AA, Varadarajan PV, Nachane RP, Balasubramanya RH (2007) Silver-
protein (core-shell) nanoparticle production using spent mushroom substrate. Langmuir. 23 (13):7113-
7117.
46. Wyss M, Brugger R, Kronenberger A, Rémy R, Fimbel R, Oesterhelt G, Lehmann M, van Loon
AP (1999) Biochemical characterization of fungal phytases (myo-inositol hexakisphosphate
phosphohydrolases): catalytic properties. Appl Environ Microbiol. 65 (2):367-373.
47. European Union (Drinking Water) Regulations (2014). S.I. No. 122/2014. Irish Statute Book,
Ireland.
48. Bathing Water Quality Regulations (2008). S.I. No. 79/2008. Irish Statute Book, Ireland.
![[Electronic Supplementary Information] surface … · The controlled synthesis of plasmonic nanoparticle clusters for efficient surface-enhanced Raman scattering platforms ... (ANDOR,](https://static.fdocuments.us/doc/165x107/5b7496f87f8b9a924c8c4798/electronic-supplementary-information-surface-the-controlled-synthesis-of-plasmonic.jpg)