Comparative Effects of Alpha Hydroxy Acids Int J Cosmet Sci Vol 18PP-75-831996
The Astrophysical Journal, 767:168 (18pp), 2013 April 20 doi:10.1088/0004-637X/767/2/168C© 2013. The American Astronomical Society. All rights reserved. Printed in the U.S.A.
PLASMOID EJECTIONS AND LOOP CONTRACTIONS IN AN ERUPTIVE M7.7 SOLAR FLARE: EVIDENCEOF PARTICLE ACCELERATION AND HEATING IN MAGNETIC RECONNECTION OUTFLOWS
Wei Liu1,2, Qingrong Chen3, and Vahe Petrosian31 Lockheed Martin Solar and Astrophysics Laboratory, Building 252, 3251 Hanover Street, Palo Alto, CA 94304, USA
2 W. W. Hansen Experimental Physics Laboratory, Stanford University, Stanford, CA 94305, USA3 Department of Physics, Stanford University, Stanford, CA 94305, USA
Received 2013 January 14; accepted 2013 March 4; published 2013 April 8
ABSTRACT
Where particle acceleration and plasma heating take place in relation to magnetic reconnection is a fundamentalquestion for solar flares. We report analysis of an M7.7 flare on 2012 July 19 observed by SDO/AIA and RHESSI.Bi-directional outflows in forms of plasmoid ejections and contracting cusp-shaped loops originate between anerupting flux rope and underlying flare loops at speeds of typically 200–300 km s−1 up to 1050 km s−1. Theseoutflows are associated with spatially separated double coronal X-ray sources with centroid separation decreasingwith energy. The highest temperature is located near the nonthermal X-ray loop-top source well below the originalheights of contracting cusps near the inferred reconnection site. These observations suggest that the primary lociof particle acceleration and plasma heating are in the reconnection outflow regions, rather than the reconnectionsite itself. In addition, there is an initial ascent of the X-ray and EUV loop-top source prior to its recentlyrecognized descent, which we ascribe to the interplay among multiple processes including the upward developmentof reconnection and the downward contractions of reconnected loops. The impulsive phase onset is delayed by10 minutes from the start of the descent, but coincides with the rapid speed increases of the upward plasmoids, theindividual loop shrinkages, and the overall loop-top descent, suggestive of an intimate relation of the energy releaserate and reconnection outflow speed.
Key words: acceleration of particles – Sun: flares – Sun: UV radiation – Sun: X-rays, gamma rays
Online-only material: animations, color figures
1. INTRODUCTION
Magnetic reconnection is believed to be the primary energyrelease mechanism during solar flares, but where and how thereleased energy is transformed to heat the plasma and accelerateparticles remains unclear (for reviews, see Holman et al. 2011;Fletcher et al. 2011; Petrosian 2012; Raymond et al. 2012).Evidence of magnetic reconnection and current sheets on theSun has been observed in various situations and wavelengths.
A major advance in the last decade was the discovery of asecond coronal source above a commonly observed loop-topsource in X-rays and radio wavelengths (Sui & Holman 2003;Sui et al. 2004; Pick et al. 2005; Veronig et al. 2006; Li &Gan 2007; Liu et al. 2008, 2009c; Chen & Petrosian 2012; Suet al. 2012; Bain et al. 2012; Glesener et al. 2012). Such doublesources often exhibit higher-energy emission being closer toeach other, indicating higher temperatures or harder spectra ofaccelerated electrons in the inner region nearer to the presumablemagnetic reconnection site.
Another surprise has been the descent of the loop-top X-raysource at typically 10–40 km s−1 early in the impulsive phasebefore its common ascent through the decay phase (Sui &Holman 2003; Sui et al. 2004; Liu et al. 2004; Shen et al. 2008).The upper coronal source, however, usually keeps ascending allthe time.
Shrinkages of entire flare loops (Svestka et al. 1987) at speedson the order of 10 km s−1 have been observed in soft X-rays(SXRs; Forbes & Acton 1996; Reeves et al. 2008), extremeultraviolet (EUV; Li & Gan 2006), and microwaves (Li &Gan 2005; Reznikova et al. 2010). They were interpreted ascontractions of newly reconnected loops due to magnetic tensionas they evolve from initially cusp shapes toward more relaxedround shapes.
Often after the impulsive phase, bright loops and dark voidsseen in SXR or EUV descend onto a flare arcade from aboveat greater speeds of typically 150 km s−1 (McKenzie & Hudson1999; Savage & McKenzie 2011). At even greater heights ofa few R�, similar descending loops are seen in white-lightcoronagraphs, usually hours after a coronal mass ejection (CME;Wang et al. 1999; Sheeley et al. 2004). These features arealso interpreted as contracting post-reconnection loops, but theirobserved speeds are only a small fraction of the expected coronalAlfven speed on the order of ∼1000 km s−1.
Imaging and Doppler observations have also revealed bi-directional magnetic reconnection inflows (Yokoyama et al.2001; Milligan et al. 2010; Liu et al. 2010), outflows (Inneset al. 1997; Ko et al. 2003; Wang et al. 2007; Nishizuka et al.2010; Hara et al. 2011; Watanabe et al. 2012), or both (Lin et al.2005; Takasao et al. 2012; Savage et al. 2012).
The physics behind descending X-ray loop-top sources andtheir relationship with slow loop shrinkages, fast supra-arcadeloop contractions, and reconnection outflows remain unclear, al-though some models have been proposed (e.g., Somov & Kosugi1997; Karlicky & Kosugi 2004). To fill this gap, we present hereobservations of a recent eruptive M7.7 flare from the ReuvenRamaty High Energy Solar Spectroscopic Imager (RHESSI;Lin et al. 2002) and Solar Dynamics Observatory/AtmosphericImaging Assembly (SDO/AIA; Lemen et al. 2012). We find inthis flare all the above interrelated phenomena, which can be un-derstood in a unified picture as contractions of post-reconnectionloops modulated by the interplay between energy releaseand cooling. The observed highest speed of ∼1000 km s−1
of loop contractions is comparable to the expected Alfvenspeed. The maximum temperature and nonthermal loop-topemission being away from the inferred reconnection sitesuggest that primary heating and particle acceleration take
1
The Astrophysical Journal, 767:168 (18pp), 2013 April 20 Liu, Chen, & Petrosian
Table 1Event Time Line (2012 July 18–19)
22:18, 07/18 Peak of the earlier C4.5 flare04:17, 07/19 Onset of the M7.7 flare and initial ascent
of the overall X-ray and EUV loop-top source
05:02–05:07 Onset of overall X-ray and EUV loop-top descentand transition from slow to fast rise of the flux rope CME
05:15 Max. velocity (1050 km s−1) of upward ejections05:16 Max. velocity (−58 km s−1) of downward loop shrinkages05:15–05:20 Max. velocity (−7 to −23 km s−1) of overall
X-ray and EUV loop-top descent05:16–05:43 Flare impulsive phase, hard X-ray burst05:21–05:31 Min. height of overall X-ray and EUV loop-top descent
and onset of the second ascent04:17–05:20 Upward ejections; downward, low-altitude fast contractions05:20–16:00 Downward, high-altitude fast loop contractions04:17–16:00 Downward slow loop shrinkages06:52 Max. velocity (−918 km s−1) of downward fast contractions
place in the outflow regions, rather than the reconnection siteitself.
After an observational overview in Section 2, we presentmotions of the overall X-ray and EUV emission in Section 3.We examine bi-directional outflows in forms of plasmoidsand contracting loops in Section 4. In Section 5, we analyzethe spatial distribution of energy- and temperature-dependentemission, including double coronal X-ray sources. We concludein Section 6, followed by Appendices A and B on supplementaryAIA and STEREO observations.
2. OVERVIEW OF OBSERVATIONS
The event under study was an M7.7 flare that occurred at∼04:17 UT on 2012 July 19 in NOAA active region (AR) 11520on the southwest limb. It was well observed by RHESSI andSDO/AIA, but it was not detected by Fermi and its impulsivephase was missed by the X-Ray Telescope on Hinode. Table 1summarizes the event time line that will be discussed in detail.
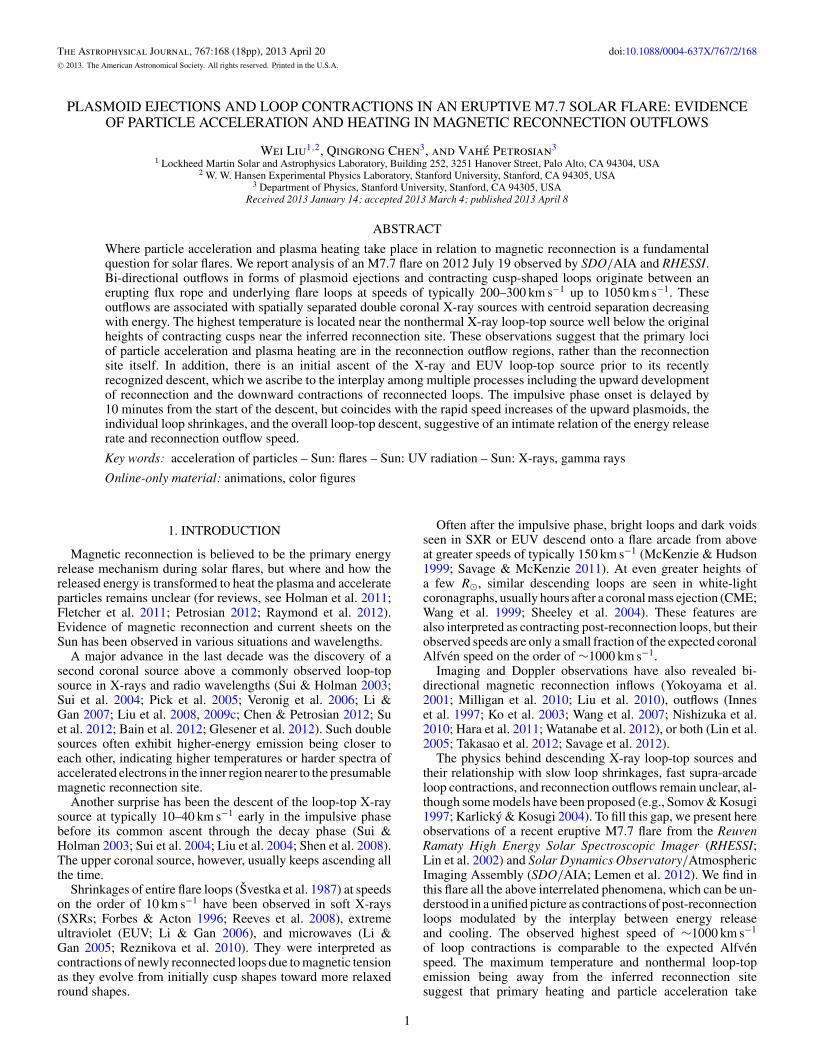
Figure 1 shows the history of the flare emission. TheGOES 1–8 Å flux peaks at 05:58 UT followed by a slow decaylasting almost 1 day. We define the interval of 05:16–05:43 UTas the impulsive phase, as marked by the two vertical dashedlines, which starts at the sudden rise of the RHESSI 25–50 keVflux and ends (during RHESSI night) when the time deriva-tive of the GOES 1–8 Å flux drops to its level at the impulsivephase onset, assuming the Neupert (1968) effect at work. Wecall the intervals before and after the impulsive phase the pre-impulsive and decay phases. RHESSI has good coverage exceptfor the late impulsive and early decay phases.
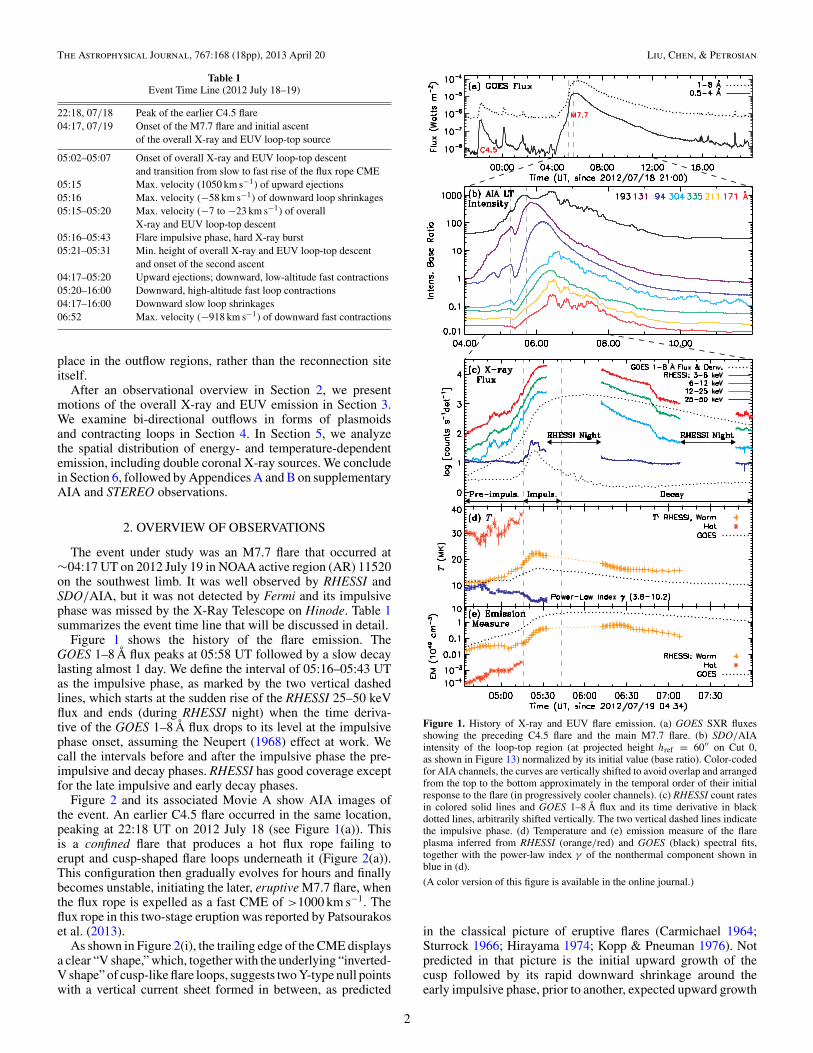
Figure 2 and its associated Movie A show AIA images ofthe event. An earlier C4.5 flare occurred in the same location,peaking at 22:18 UT on 2012 July 18 (see Figure 1(a)). Thisis a confined flare that produces a hot flux rope failing toerupt and cusp-shaped flare loops underneath it (Figure 2(a)).This configuration then gradually evolves for hours and finallybecomes unstable, initiating the later, eruptive M7.7 flare, whenthe flux rope is expelled as a fast CME of >1000 km s−1. Theflux rope in this two-stage eruption was reported by Patsourakoset al. (2013).
As shown in Figure 2(i), the trailing edge of the CME displaysa clear “V shape,” which, together with the underlying “inverted-V shape” of cusp-like flare loops, suggests two Y-type null pointswith a vertical current sheet formed in between, as predicted
Figure 1. History of X-ray and EUV flare emission. (a) GOES SXR fluxesshowing the preceding C4.5 flare and the main M7.7 flare. (b) SDO/AIAintensity of the loop-top region (at projected height href = 60′′ on Cut 0,as shown in Figure 13) normalized by its initial value (base ratio). Color-codedfor AIA channels, the curves are vertically shifted to avoid overlap and arrangedfrom the top to the bottom approximately in the temporal order of their initialresponse to the flare (in progressively cooler channels). (c) RHESSI count ratesin colored solid lines and GOES 1–8 Å flux and its time derivative in blackdotted lines, arbitrarily shifted vertically. The two vertical dashed lines indicatethe impulsive phase. (d) Temperature and (e) emission measure of the flareplasma inferred from RHESSI (orange/red) and GOES (black) spectral fits,together with the power-law index γ of the nonthermal component shown inblue in (d).
(A color version of this figure is available in the online journal.)
in the classical picture of eruptive flares (Carmichael 1964;Sturrock 1966; Hirayama 1974; Kopp & Pneuman 1976). Notpredicted in that picture is the initial upward growth of thecusp followed by its rapid downward shrinkage around theearly impulsive phase, prior to another, expected upward growth
2
The Astrophysical Journal, 767:168 (18pp), 2013 April 20 Liu, Chen, & Petrosian
Figure 2. AIA images of the event, rotated to the solar west up. Top: 94 Å image sequence of the earlier C4.5 flare and the M7.7 flare under study (see the associatedonline Movie A for composite 94 (red) and 335 Å (green) images). The brackets in (c) and (e) mark the enlarged fields of view (FOV) of the middle and bottom panels,respectively. The numbered dotted lines in (f) mark the cuts for obtaining space-time plots presented in this paper. Middle: detailed 131 Å image sequence showing theupward growth of the flare cusp, followed by its rapid shrinkage around the early impulsive phase. The horizontal dotted line marks the highest position of the earlycusp. Bottom: 131 Å image sequence showing an example of pointed cusps contracting from a ray-like structure, presumably a reconnecting current sheet (see theassociated Movie B). The first panel is an original image and the rest are running difference images. The slanted dashed line indicates an average contraction velocityof −151 km s−1.
(Animations and a color version of this figure are available in the online journal.)
through the decay phase in a commonly observed candle-flameshape (Figures 2(a)–(l)). The initial growth and shrinkage areaccompanied by the gradual rise and impulsive eruption ofthe overlying flux rope, respectively. Equally interesting arehigh-speed bi-directional outflows involving upward-movingplasmoids and downward-contracting pointed cusps (Figure 2,bottom; Figure 5). We examine these and related featuresobserved by RHESSI and AIA in the next several sections.
3. OVERALL X-RAY AND EUV SOURCE MOTIONS
We first follow the evolution of the morphologies and posi-tions of overall X-ray and EUV sources.
3.1. X-Ray Source Morphology
We reconstructed RHESSI X-ray images in energy bands from3 to 50 keV using the CLEAN algorithm and detectors 3–9.
3
The Astrophysical Journal, 767:168 (18pp), 2013 April 20 Liu, Chen, & Petrosian
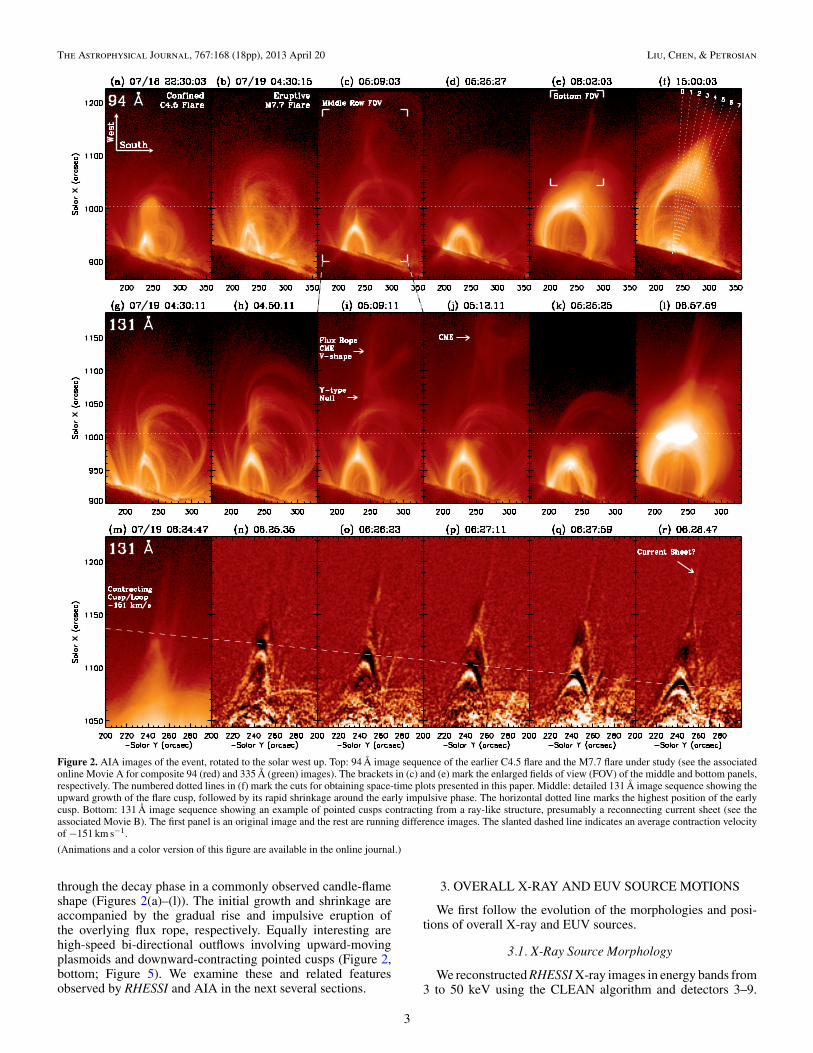
Figure 3. (a)–(f) Evolution of RHESSI 6–10 keV sources (green contours at 31% and 90% of the maximum) overlaid on concurrent AIA 131 Å images (see theaccompanying movie). The blue contours show 25–50 keV emission, for both the C4.5 and M7.7 flares, at the footpoint(s) and the Masuda-type coronal source 20′′above the SXR and EUV loops. (g) Color-coded temporal migration of the 6–10 keV loop-top centroid as marked by the plus sign on the left. The red arrows indicatean initial ascent followed by a descent and then another ascent. The dotted line marks the fiducial line (Cut 0) for obtaining projected heights shown in Figure 4. Thefirst and last panels are enlarged from the bracketed regions shown in their adjacent panels.
(An animation and a color version of this figure are available in the online journal.)
Depending on the count rate, we chose variable integration timeranging from 20 s during the impulsive phase to 4 minutes duringthe decay phase.
Figure 3 and its accompanying movie show examples ofRHESSI contours overlaid on AIA images. There is a persistentloop-top source at 6–10 keV (green) near the apex of the cusp-shaped EUV loops. Accompanying the evolution of the EUVloops mentioned above, this loop-top source undergoes a gradualascent followed by a descent and then another ascent. This canbe best seen in the last panel showing the temporal migrationof the emission centroid obtained from a contour at 70% ofthe maximum of each image. Early descents of loop-top X-raysources have been recognized (e.g., Sui et al. 2004), but this isthe first time that an evident preceding ascent is observed.
Early in the event there is an additional, weaker coronal X-raysource (panel (b)) located in the lower portion of the overlyingflux rope. It later falls below detection with the eruption ofthe flux rope. During the impulsive phase (panel (e)) at higherenergies (25–50 keV), there are double footpoint sources and aMasuda-type (e.g., Masuda et al. 1994; Nitta et al. 2010) coronalsource located 20′′ = 15 Mm above the SXR (6–10 keV) looptop. This separation is twice that of the Masuda case.
The earlier C4.5 flare (panel (a)), though more compact,exhibits surprisingly similar emission, including the additionalX-ray source within the flux rope and the Masuda-type hardX-ray (HXR) source. This suggests that the end state of thefirst, confined flare of a failed eruption serves as the initial stateof the second, eruptive flare, making them homologous flares.Note that the weaker, southern footpoint emission is (partially)occulted by the limb, especially for the first flare.
3.2. X-Ray and EUV Height–Time History
To track various moving features, we placed eight cuts of10′′ wide centered on the limb, as shown in Figure 2(f). Cut 0is positioned along the presumable current sheet between theinitial flare cusp and erupting flux rope, and is used as thefiducial line for obtaining projected heights up to ∼08:00 UT.Subsequent cuts are evenly spaced by 3◦ to capture the cusp atdifferent stages as it gradually turns toward the south. For eachcut, we averaged pixels of an AIA image sequence within it inthe perpendicular direction to obtain a space-time plot.
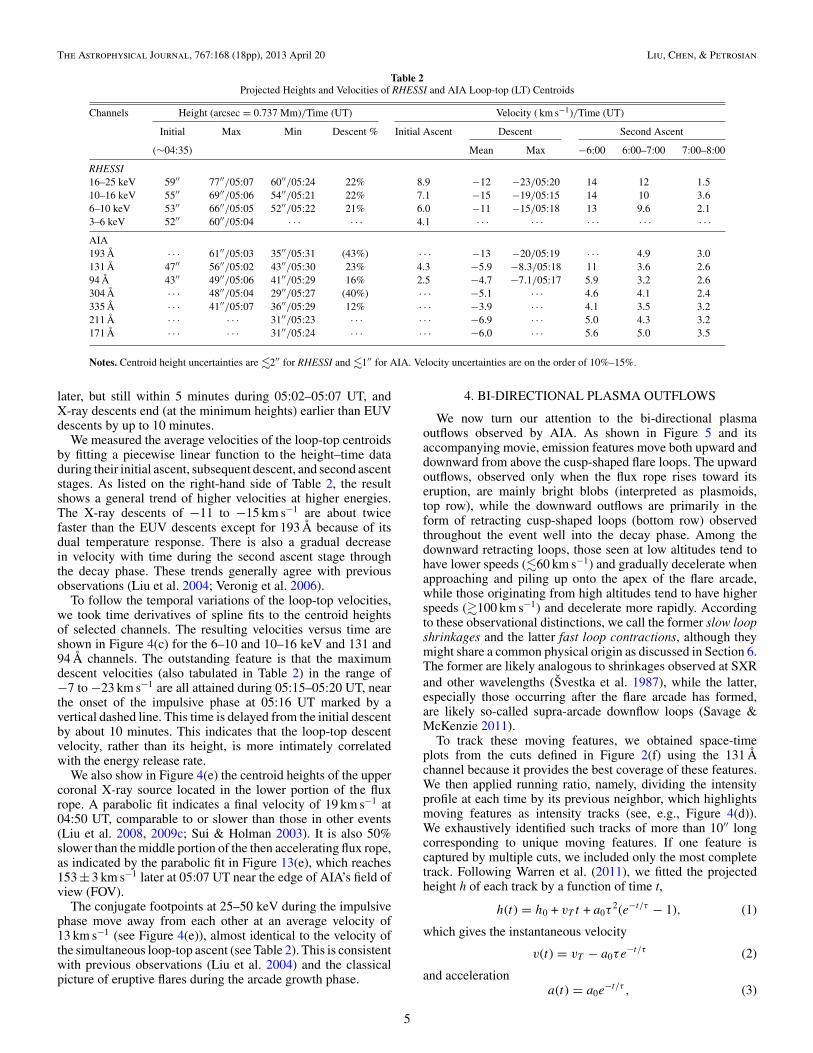
Figure 4(c) shows, for example, a base-ratio (i.e., normalizedby the initial intensity profile) space-time plot from Cut 0 at131 Å. It shows the eruption of the flux rope and the three-stagedevelopment (upward, downward, and upward again) of theunderlying flare cusp. The peak emission at each time, markedby the small purple symbols, evidently exhibits this motion.Space-time plots of other AIA channels are shown in Figure 13and described in Appendix A.
Figure 4(e) shows the height–time history of the loop-topemission centroids in four RHESSI X-ray bands from 3 to 25 keVand in all AIA EUV channels. (From now on, we refer to bothX-ray centroids and EUV peaks as centroids.) We find that allloop-top centroids follow the same three-stage motions. TheAIA 131 and 94 Å channels best exhibit this trend continuously,while in cooler channels, especially 211 and 171 Å, the initialascent and subsequent descent become obscure. Note that the3–6 keV centroid (red diamonds) cannot be identified since theimpulsive phase because the RHESSI thin attenuator moves inand raises the energy threshold to 6 keV.
We also notice a clear energy dispersion that the loop-topemissions at higher temperatures or photon energies are locatedat greater heights, with all X-ray centroids situated aboveEUV centroids. For example, at its greatest height prior to theimpulsive phase, the 16–25 keV centroid is 35′′ = 26 Mm aboveits 335 Å counterpart. This energy dispersion is consistent withprevious observations (e.g., Veronig et al. 2006) and in linewith the expected picture that higher loops are newly energizedand thus are hotter and/or host nonthermal electrons of harderspectra, while lower loops are previously energized and haveundergone cooling. We suggest that the so-called above-the-loop-top Masuda-type sources, including the 25–50 keV coronalsource in Figure 3(d), could be extreme cases of this generaltrend.
In Table 2, we list the initial heights of X-ray and EUV loop-top centroids around 04:35 UT, together with the maximumand minimum heights during their descents and the percentageheight reductions. In general, the above noted energy dispersionpersists and the 10%–20% descents are in agreement withearlier reports (Veronig et al. 2006). An exception is the 193and 304 Å channels because of their response to both hot andcool emissions (see Appendix A). There is a weak trend thathigher energy X-ray descents start (at the maximum heights)
4
The Astrophysical Journal, 767:168 (18pp), 2013 April 20 Liu, Chen, & Petrosian
Table 2Projected Heights and Velocities of RHESSI and AIA Loop-top (LT) Centroids
Channels Height (arcsec = 0.737 Mm)/Time (UT) Velocity ( km s−1)/Time (UT)
Initial Max Min Descent % Initial Ascent Descent Second Ascent
(∼04:35) Mean Max −6:00 6:00–7:00 7:00–8:00
RHESSI16–25 keV 59′′ 77′′/05:07 60′′/05:24 22% 8.9 −12 −23/05:20 14 12 1.510–16 keV 55′′ 69′′/05:06 54′′/05:21 22% 7.1 −15 −19/05:15 14 10 3.66–10 keV 53′′ 66′′/05:05 52′′/05:22 21% 6.0 −11 −15/05:18 13 9.6 2.13–6 keV 52′′ 60′′/05:04 · · · · · · 4.1 · · · · · · · · · · · · · · ·AIA193 Å · · · 61′′/05:03 35′′/05:31 (43%) · · · −13 −20/05:19 · · · 4.9 3.0131 Å 47′′ 56′′/05:02 43′′/05:30 23% 4.3 −5.9 −8.3/05:18 11 3.6 2.694 Å 43′′ 49′′/05:06 41′′/05:29 16% 2.5 −4.7 −7.1/05:17 5.9 3.2 2.6304 Å · · · 48′′/05:04 29′′/05:27 (40%) · · · −5.1 · · · 4.6 4.1 2.4335 Å · · · 41′′/05:07 36′′/05:29 12% · · · −3.9 · · · 4.1 3.5 3.2211 Å · · · · · · 31′′/05:23 · · · · · · −6.9 · · · 5.0 4.3 3.2171 Å · · · · · · 31′′/05:24 · · · · · · −6.0 · · · 5.6 5.0 3.5
Notes. Centroid height uncertainties are �2′′ for RHESSI and �1′′ for AIA. Velocity uncertainties are on the order of 10%–15%.
later, but still within 5 minutes during 05:02–05:07 UT, andX-ray descents end (at the minimum heights) earlier than EUVdescents by up to 10 minutes.
We measured the average velocities of the loop-top centroidsby fitting a piecewise linear function to the height–time dataduring their initial ascent, subsequent descent, and second ascentstages. As listed on the right-hand side of Table 2, the resultshows a general trend of higher velocities at higher energies.The X-ray descents of −11 to −15 km s−1 are about twicefaster than the EUV descents except for 193 Å because of itsdual temperature response. There is also a gradual decreasein velocity with time during the second ascent stage throughthe decay phase. These trends generally agree with previousobservations (Liu et al. 2004; Veronig et al. 2006).
To follow the temporal variations of the loop-top velocities,we took time derivatives of spline fits to the centroid heightsof selected channels. The resulting velocities versus time areshown in Figure 4(c) for the 6–10 and 10–16 keV and 131 and94 Å channels. The outstanding feature is that the maximumdescent velocities (also tabulated in Table 2) in the range of−7 to −23 km s−1 are all attained during 05:15–05:20 UT, nearthe onset of the impulsive phase at 05:16 UT marked by avertical dashed line. This time is delayed from the initial descentby about 10 minutes. This indicates that the loop-top descentvelocity, rather than its height, is more intimately correlatedwith the energy release rate.
We also show in Figure 4(e) the centroid heights of the uppercoronal X-ray source located in the lower portion of the fluxrope. A parabolic fit indicates a final velocity of 19 km s−1 at04:50 UT, comparable to or slower than those in other events(Liu et al. 2008, 2009c; Sui & Holman 2003). It is also 50%slower than the middle portion of the then accelerating flux rope,as indicated by the parabolic fit in Figure 13(e), which reaches153 ± 3 km s−1 later at 05:07 UT near the edge of AIA’s field ofview (FOV).
The conjugate footpoints at 25–50 keV during the impulsivephase move away from each other at an average velocity of13 km s−1 (see Figure 4(e)), almost identical to the velocity ofthe simultaneous loop-top ascent (see Table 2). This is consistentwith previous observations (Liu et al. 2004) and the classicalpicture of eruptive flares during the arcade growth phase.
4. BI-DIRECTIONAL PLASMA OUTFLOWS
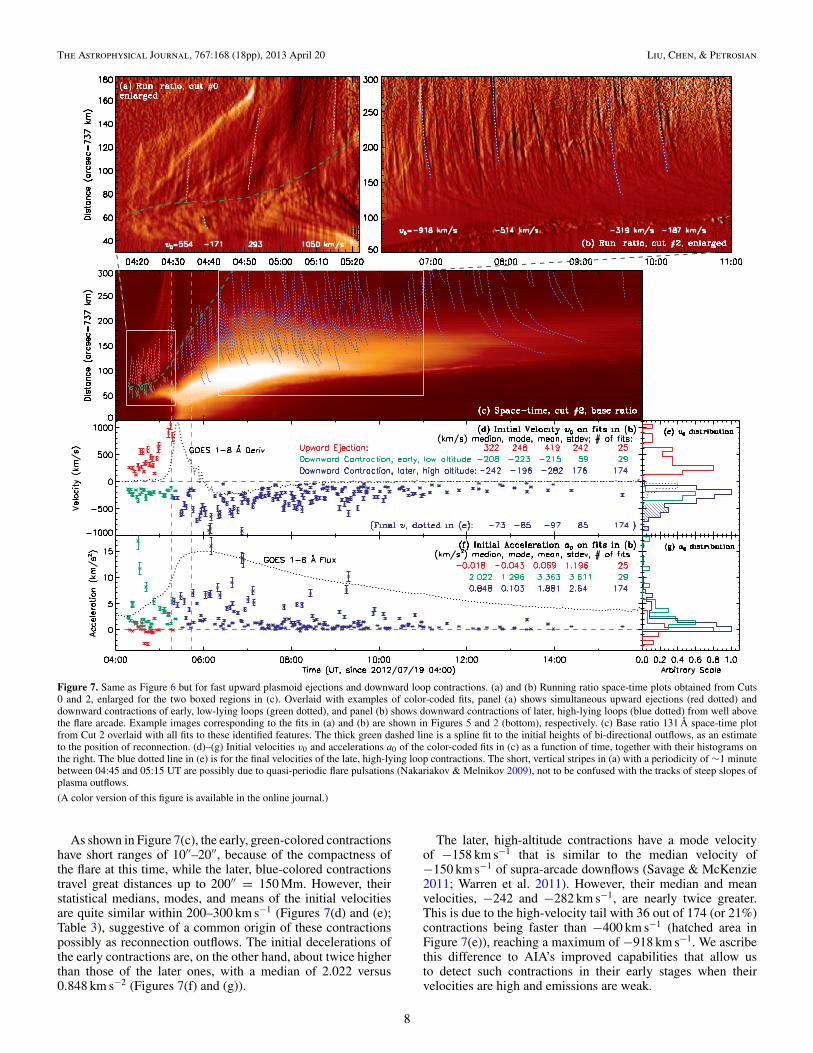
We now turn our attention to the bi-directional plasmaoutflows observed by AIA. As shown in Figure 5 and itsaccompanying movie, emission features move both upward anddownward from above the cusp-shaped flare loops. The upwardoutflows, observed only when the flux rope rises toward itseruption, are mainly bright blobs (interpreted as plasmoids,top row), while the downward outflows are primarily in theform of retracting cusp-shaped loops (bottom row) observedthroughout the event well into the decay phase. Among thedownward retracting loops, those seen at low altitudes tend tohave lower speeds (�60 km s−1) and gradually decelerate whenapproaching and piling up onto the apex of the flare arcade,while those originating from high altitudes tend to have higherspeeds (�100 km s−1) and decelerate more rapidly. Accordingto these observational distinctions, we call the former slow loopshrinkages and the latter fast loop contractions, although theymight share a common physical origin as discussed in Section 6.The former are likely analogous to shrinkages observed at SXRand other wavelengths (Svestka et al. 1987), while the latter,especially those occurring after the flare arcade has formed,are likely so-called supra-arcade downflow loops (Savage &McKenzie 2011).
To track these moving features, we obtained space-timeplots from the cuts defined in Figure 2(f) using the 131 Åchannel because it provides the best coverage of these features.We then applied running ratio, namely, dividing the intensityprofile at each time by its previous neighbor, which highlightsmoving features as intensity tracks (see, e.g., Figure 4(d)).We exhaustively identified such tracks of more than 10′′ longcorresponding to unique moving features. If one feature iscaptured by multiple cuts, we included only the most completetrack. Following Warren et al. (2011), we fitted the projectedheight h of each track by a function of time t,
h(t) = h0 + vT t + a0τ2(e−t/τ − 1), (1)
which gives the instantaneous velocity
v(t) = vT − a0τe−t/τ (2)
and accelerationa(t) = a0e
−t/τ , (3)
5
The Astrophysical Journal, 767:168 (18pp), 2013 April 20 Liu, Chen, & Petrosian
Figure 4. X-ray and EUV source motions. (a) and (b) Subsets of light curvesfrom Figures 1(b) and (c). (c) and (d) Base and running ratio space-time plotsof the AIA 131 Å channel from Cut 0, overlaid with selected centroid positionsfrom (e). (e) Projected heights of the emission centroids of the upper andlower coronal sources from RHESSI (large symbols, greater heights) and ofthe loop-top peaks from AIA (small symbols, lower heights). Also shown isthe 25–50 keV footpoint separation (purple squares) shifted upward by 30′′.(f) Velocity of centroids from spline fits to selected channels in (e). The bluesymbols are the initial velocities of individual loop shrinkages but rescaled bya factor of 0.5.
(A color version of this figure is available in the online journal.)
Figure 5. AIA 131 Å images (see the accompanying movie) showing upwardmoving blobs (top, labeled A and B), V shapes (middle), and downwardcontracting cusps (bottom). Their space-time fits are shown in Figure 7(a). Thegreen contours show two distinct 8–10 keV RHESSI sources from Figure 10(c).The first row and column are original images and the rest are running differenceimages.
(An animation and a color version of this figure are available in the onlinejournal.)
where h0 and a0 are the initial height and acceleration, vT
is the terminal velocity, and τ is the e-folding decay timethat characterizes the observed decreasing acceleration (ordeceleration) with time. We present below the kinematics of thefeatures categorized above and focus on their initial velocitiesv0 = vT − a0τ and accelerations a0.
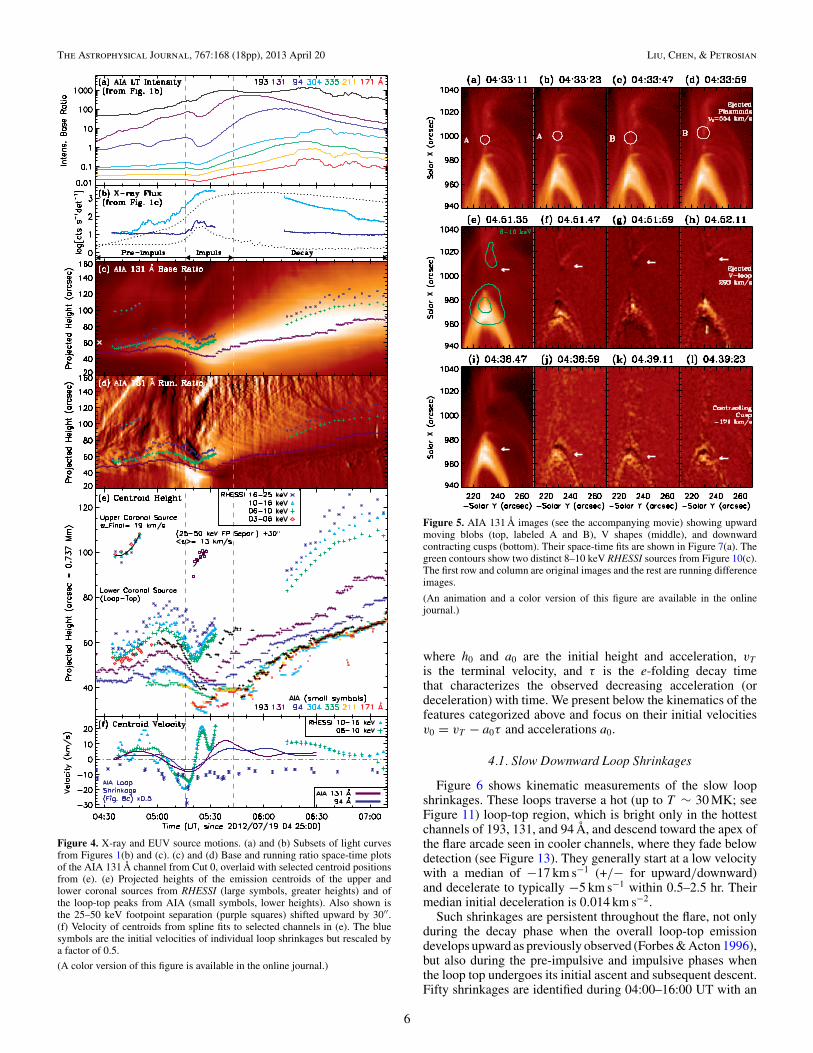
4.1. Slow Downward Loop Shrinkages
Figure 6 shows kinematic measurements of the slow loopshrinkages. These loops traverse a hot (up to T ∼ 30 MK; seeFigure 11) loop-top region, which is bright only in the hottestchannels of 193, 131, and 94 Å, and descend toward the apex ofthe flare arcade seen in cooler channels, where they fade belowdetection (see Figure 13). They generally start at a low velocitywith a median of −17 km s−1 (+/− for upward/downward)and decelerate to typically −5 km s−1 within 0.5–2.5 hr. Theirmedian initial deceleration is 0.014 km s−2.
Such shrinkages are persistent throughout the flare, not onlyduring the decay phase when the overall loop-top emissiondevelops upward as previously observed (Forbes & Acton 1996),but also during the pre-impulsive and impulsive phases whenthe loop top undergoes its initial ascent and subsequent descent.Fifty shrinkages are identified during 04:00–16:00 UT with an
6
The Astrophysical Journal, 767:168 (18pp), 2013 April 20 Liu, Chen, & Petrosian
Figure 6. Kinematic measurements of slow loop shrinkages. (a) Running ratio space-time plot enlarged for the boxed region in (b), overlaid with examples of fits toshrinkage tracks labeled with their initial velocities. (b) Base ratio 131 Å space-time plot from Cut 0 overlaid with all 50 fits performed. (c) Initial velocities v0 of thefitted tracks in (b) as a function of time. (d) Histograms of v0 (solid) and the final velocity vf (dotted) measured at the end of each track, with their statistical properties(median, mode, mean, standard deviation, and the total number of fits) listed in (c). Panels (e) and (f) are same as (c) and (d), but for the initial acceleration a0. Theblack dotted lines in (c) and (e) are the time derivative (inverted) and original GOES 1–8 Å flux. The two vertical dashed lines mark the impulsive phase.
(A color version of this figure is available in the online journal.)
average occurrence rate of once per 7.7 minutes up to 10:00 UTbut more frequent around the impulsive phase (Figure 6(b)).
Regardless of the direction of motion of the loop-top emis-sion, the initial height of loop shrinkage generally increases withtime. The initial velocity v0 exhibits more variability, as shownin Figure 6(c), and appears to be positively correlated withthe flare energy release rate indicated by the time derivative ofthe GOES flux (black dotted line). In particular, near the onsetof the impulsive phase at 05:16 UT (vertical dashed line), v0increases rapidly and reaches a maximum of −58 km s−1. Thereis a similar temporal correlation with the initial deceleration a0(panel (d)) that also generally correlates with v0.
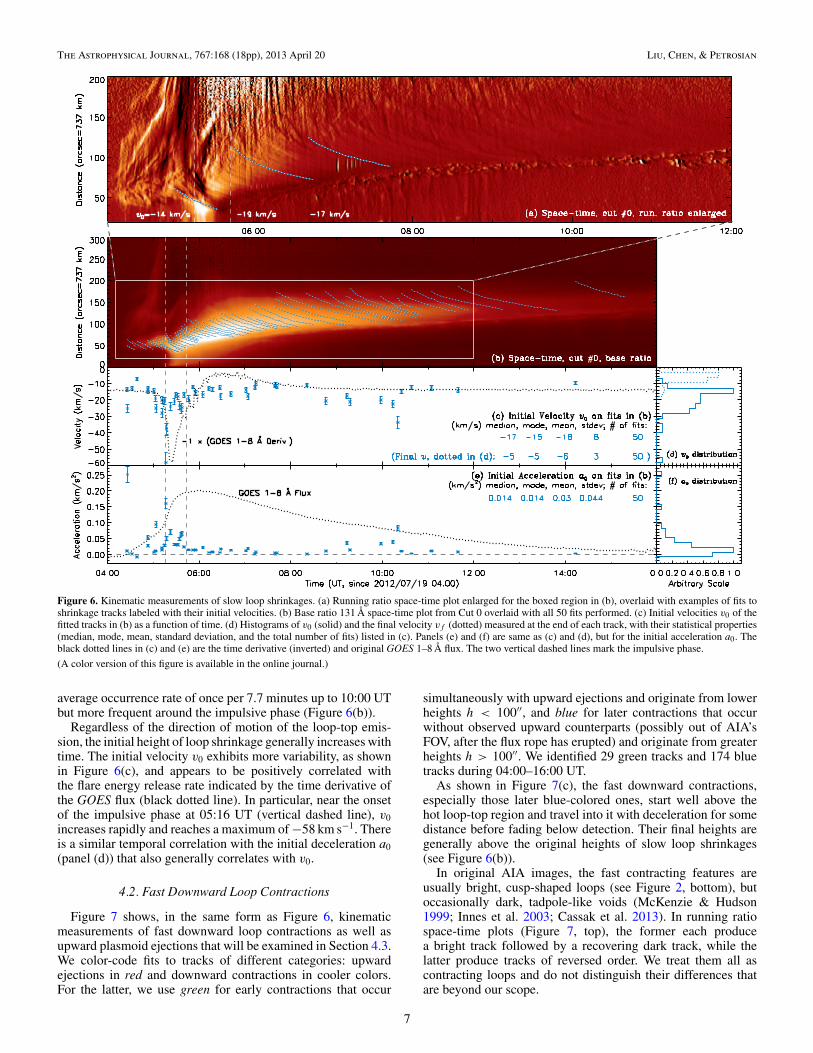
4.2. Fast Downward Loop Contractions
Figure 7 shows, in the same form as Figure 6, kinematicmeasurements of fast downward loop contractions as well asupward plasmoid ejections that will be examined in Section 4.3.We color-code fits to tracks of different categories: upwardejections in red and downward contractions in cooler colors.For the latter, we use green for early contractions that occur
simultaneously with upward ejections and originate from lowerheights h < 100′′, and blue for later contractions that occurwithout observed upward counterparts (possibly out of AIA’sFOV, after the flux rope has erupted) and originate from greaterheights h > 100′′. We identified 29 green tracks and 174 bluetracks during 04:00–16:00 UT.
As shown in Figure 7(c), the fast downward contractions,especially those later blue-colored ones, start well above thehot loop-top region and travel into it with deceleration for somedistance before fading below detection. Their final heights aregenerally above the original heights of slow loop shrinkages(see Figure 6(b)).
In original AIA images, the fast contracting features areusually bright, cusp-shaped loops (see Figure 2, bottom), butoccasionally dark, tadpole-like voids (McKenzie & Hudson1999; Innes et al. 2003; Cassak et al. 2013). In running ratiospace-time plots (Figure 7, top), the former each producea bright track followed by a recovering dark track, while thelatter produce tracks of reversed order. We treat them all ascontracting loops and do not distinguish their differences thatare beyond our scope.
7
The Astrophysical Journal, 767:168 (18pp), 2013 April 20 Liu, Chen, & Petrosian
Figure 7. Same as Figure 6 but for fast upward plasmoid ejections and downward loop contractions. (a) and (b) Running ratio space-time plots obtained from Cuts0 and 2, enlarged for the two boxed regions in (c). Overlaid with examples of color-coded fits, panel (a) shows simultaneous upward ejections (red dotted) anddownward contractions of early, low-lying loops (green dotted), and panel (b) shows downward contractions of later, high-lying loops (blue dotted) from well abovethe flare arcade. Example images corresponding to the fits in (a) and (b) are shown in Figures 5 and 2 (bottom), respectively. (c) Base ratio 131 Å space-time plotfrom Cut 2 overlaid with all fits to these identified features. The thick green dashed line is a spline fit to the initial heights of bi-directional outflows, as an estimateto the position of reconnection. (d)–(g) Initial velocities v0 and accelerations a0 of the color-coded fits in (c) as a function of time, together with their histograms onthe right. The blue dotted line in (e) is for the final velocities of the late, high-lying loop contractions. The short, vertical stripes in (a) with a periodicity of ∼1 minutebetween 04:45 and 05:15 UT are possibly due to quasi-periodic flare pulsations (Nakariakov & Melnikov 2009), not to be confused with the tracks of steep slopes ofplasma outflows.
(A color version of this figure is available in the online journal.)
As shown in Figure 7(c), the early, green-colored contractionshave short ranges of 10′′–20′′, because of the compactness ofthe flare at this time, while the later, blue-colored contractionstravel great distances up to 200′′ = 150 Mm. However, theirstatistical medians, modes, and means of the initial velocitiesare quite similar within 200–300 km s−1 (Figures 7(d) and (e);Table 3), suggestive of a common origin of these contractionspossibly as reconnection outflows. The initial decelerations ofthe early contractions are, on the other hand, about twice higherthan those of the later ones, with a median of 2.022 versus0.848 km s−2 (Figures 7(f) and (g)).
The later, high-altitude contractions have a mode velocityof −158 km s−1 that is similar to the median velocity of−150 km s−1 of supra-arcade downflows (Savage & McKenzie2011; Warren et al. 2011). However, their median and meanvelocities, −242 and −282 km s−1, are nearly twice greater.This is due to the high-velocity tail with 36 out of 174 (or 21%)contractions being faster than −400 km s−1 (hatched area inFigure 7(e)), reaching a maximum of −918 km s−1. We ascribethis difference to AIA’s improved capabilities that allow usto detect such contractions in their early stages when theirvelocities are high and emissions are weak.
8
The Astrophysical Journal, 767:168 (18pp), 2013 April 20 Liu, Chen, & Petrosian
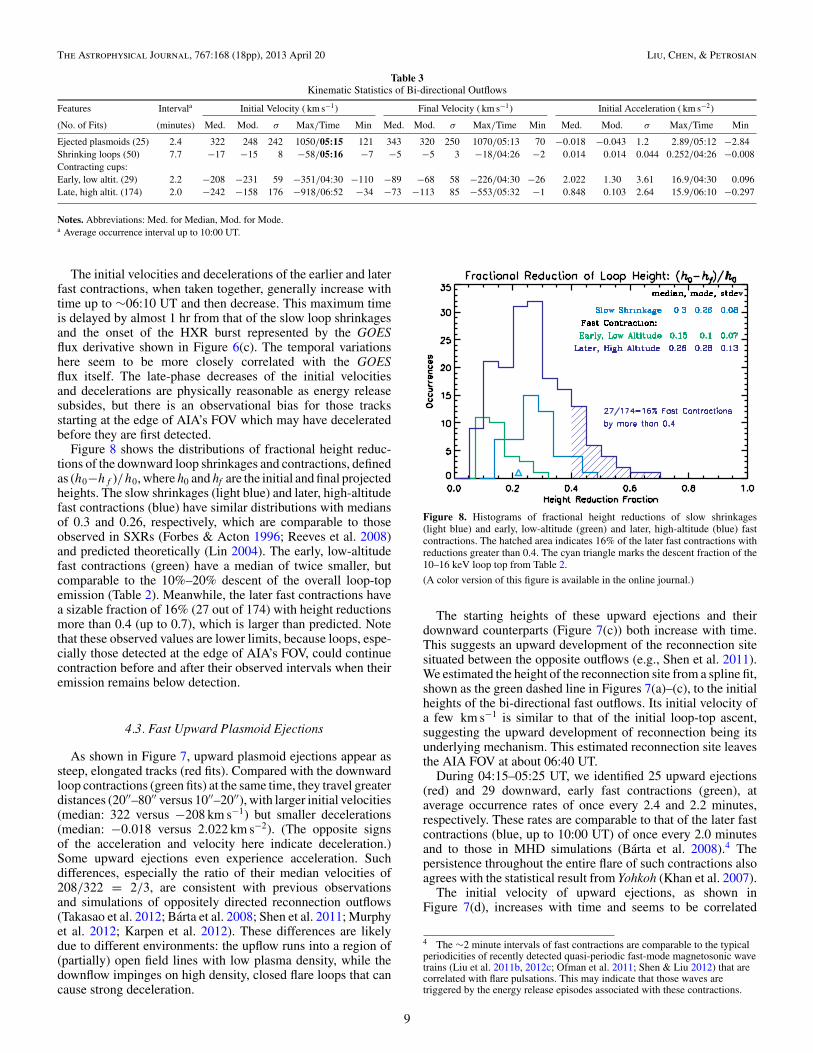
Table 3Kinematic Statistics of Bi-directional Outflows
Features Intervala Initial Velocity ( km s−1) Final Velocity ( km s−1) Initial Acceleration ( km s−2)
(No. of Fits) (minutes) Med. Mod. σ Max/Time Min Med. Mod. σ Max/Time Min Med. Mod. σ Max/Time Min
Ejected plasmoids (25) 2.4 322 248 242 1050/05:15 121 343 320 250 1070/05:13 70 −0.018 −0.043 1.2 2.89/05:12 −2.84Shrinking loops (50) 7.7 −17 −15 8 −58/05:16 −7 −5 −5 3 −18/04:26 −2 0.014 0.014 0.044 0.252/04:26 −0.008Contracting cups:Early, low altit. (29) 2.2 −208 −231 59 −351/04:30 −110 −89 −68 58 −226/04:30 −26 2.022 1.30 3.61 16.9/04:30 0.096Late, high altit. (174) 2.0 −242 −158 176 −918/06:52 −34 −73 −113 85 −553/05:32 −1 0.848 0.103 2.64 15.9/06:10 −0.297
Notes. Abbreviations: Med. for Median, Mod. for Mode.a Average occurrence interval up to 10:00 UT.
The initial velocities and decelerations of the earlier and laterfast contractions, when taken together, generally increase withtime up to ∼06:10 UT and then decrease. This maximum timeis delayed by almost 1 hr from that of the slow loop shrinkagesand the onset of the HXR burst represented by the GOESflux derivative shown in Figure 6(c). The temporal variationshere seem to be more closely correlated with the GOESflux itself. The late-phase decreases of the initial velocitiesand decelerations are physically reasonable as energy releasesubsides, but there is an observational bias for those tracksstarting at the edge of AIA’s FOV which may have deceleratedbefore they are first detected.
Figure 8 shows the distributions of fractional height reduc-tions of the downward loop shrinkages and contractions, definedas (h0−hf )/h0, where h0 and hf are the initial and final projectedheights. The slow shrinkages (light blue) and later, high-altitudefast contractions (blue) have similar distributions with mediansof 0.3 and 0.26, respectively, which are comparable to thoseobserved in SXRs (Forbes & Acton 1996; Reeves et al. 2008)and predicted theoretically (Lin 2004). The early, low-altitudefast contractions (green) have a median of twice smaller, butcomparable to the 10%–20% descent of the overall loop-topemission (Table 2). Meanwhile, the later fast contractions havea sizable fraction of 16% (27 out of 174) with height reductionsmore than 0.4 (up to 0.7), which is larger than predicted. Notethat these observed values are lower limits, because loops, espe-cially those detected at the edge of AIA’s FOV, could continuecontraction before and after their observed intervals when theiremission remains below detection.
4.3. Fast Upward Plasmoid Ejections
As shown in Figure 7, upward plasmoid ejections appear assteep, elongated tracks (red fits). Compared with the downwardloop contractions (green fits) at the same time, they travel greaterdistances (20′′–80′′ versus 10′′–20′′), with larger initial velocities(median: 322 versus −208 km s−1) but smaller decelerations(median: −0.018 versus 2.022 km s−2). (The opposite signsof the acceleration and velocity here indicate deceleration.)Some upward ejections even experience acceleration. Suchdifferences, especially the ratio of their median velocities of208/322 = 2/3, are consistent with previous observationsand simulations of oppositely directed reconnection outflows(Takasao et al. 2012; Barta et al. 2008; Shen et al. 2011; Murphyet al. 2012; Karpen et al. 2012). These differences are likelydue to different environments: the upflow runs into a region of(partially) open field lines with low plasma density, while thedownflow impinges on high density, closed flare loops that cancause strong deceleration.
Figure 8. Histograms of fractional height reductions of slow shrinkages(light blue) and early, low-altitude (green) and later, high-altitude (blue) fastcontractions. The hatched area indicates 16% of the later fast contractions withreductions greater than 0.4. The cyan triangle marks the descent fraction of the10–16 keV loop top from Table 2.
(A color version of this figure is available in the online journal.)
The starting heights of these upward ejections and theirdownward counterparts (Figure 7(c)) both increase with time.This suggests an upward development of the reconnection sitesituated between the opposite outflows (e.g., Shen et al. 2011).We estimated the height of the reconnection site from a spline fit,shown as the green dashed line in Figures 7(a)–(c), to the initialheights of the bi-directional fast outflows. Its initial velocity ofa few km s−1 is similar to that of the initial loop-top ascent,suggesting the upward development of reconnection being itsunderlying mechanism. This estimated reconnection site leavesthe AIA FOV at about 06:40 UT.
During 04:15–05:25 UT, we identified 25 upward ejections(red) and 29 downward, early fast contractions (green), ataverage occurrence rates of once every 2.4 and 2.2 minutes,respectively. These rates are comparable to that of the later fastcontractions (blue, up to 10:00 UT) of once every 2.0 minutesand to those in MHD simulations (Barta et al. 2008).4 Thepersistence throughout the entire flare of such contractions alsoagrees with the statistical result from Yohkoh (Khan et al. 2007).
The initial velocity of upward ejections, as shown inFigure 7(d), increases with time and seems to be correlated
4 The ∼2 minute intervals of fast contractions are comparable to the typicalperiodicities of recently detected quasi-periodic fast-mode magnetosonic wavetrains (Liu et al. 2011b, 2012c; Ofman et al. 2011; Shen & Liu 2012) that arecorrelated with flare pulsations. This may indicate that those waves aretriggered by the energy release episodes associated with these contractions.
9
The Astrophysical Journal, 767:168 (18pp), 2013 April 20 Liu, Chen, & Petrosian
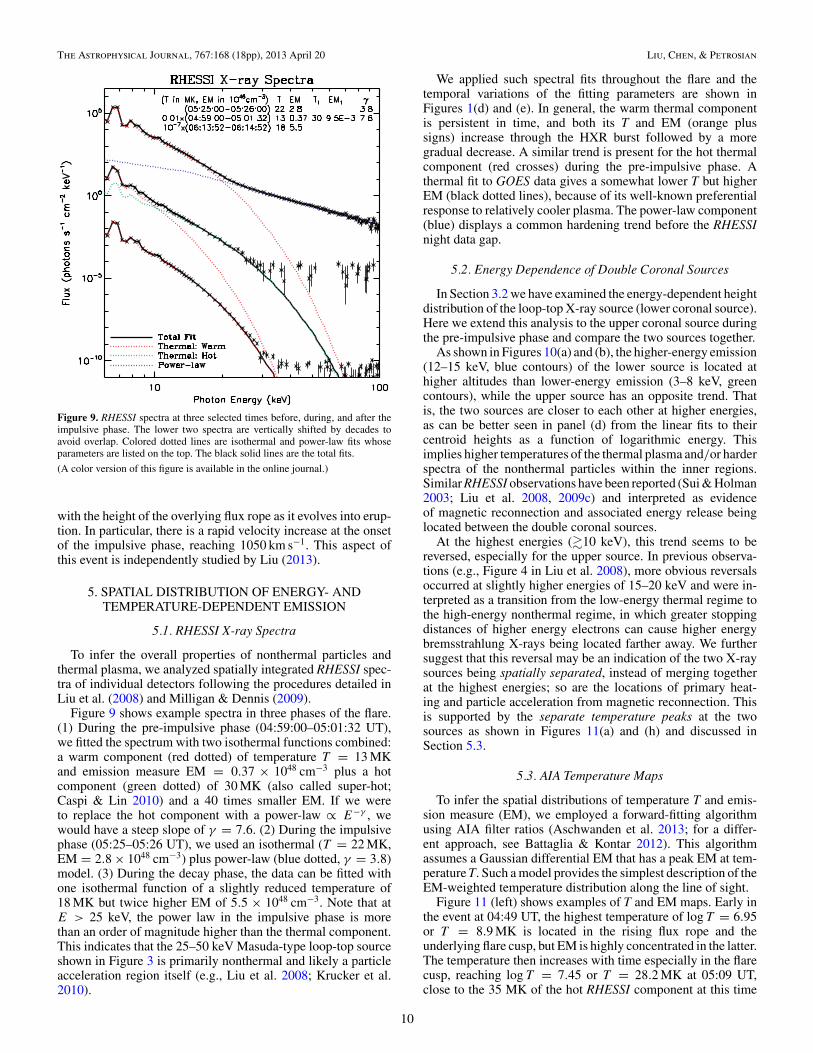
Figure 9. RHESSI spectra at three selected times before, during, and after theimpulsive phase. The lower two spectra are vertically shifted by decades toavoid overlap. Colored dotted lines are isothermal and power-law fits whoseparameters are listed on the top. The black solid lines are the total fits.
(A color version of this figure is available in the online journal.)
with the height of the overlying flux rope as it evolves into erup-tion. In particular, there is a rapid velocity increase at the onsetof the impulsive phase, reaching 1050 km s−1. This aspect ofthis event is independently studied by Liu (2013).
5. SPATIAL DISTRIBUTION OF ENERGY- ANDTEMPERATURE-DEPENDENT EMISSION
5.1. RHESSI X-ray Spectra
To infer the overall properties of nonthermal particles andthermal plasma, we analyzed spatially integrated RHESSI spec-tra of individual detectors following the procedures detailed inLiu et al. (2008) and Milligan & Dennis (2009).
Figure 9 shows example spectra in three phases of the flare.(1) During the pre-impulsive phase (04:59:00–05:01:32 UT),we fitted the spectrum with two isothermal functions combined:a warm component (red dotted) of temperature T = 13 MKand emission measure EM = 0.37 × 1048 cm−3 plus a hotcomponent (green dotted) of 30 MK (also called super-hot;Caspi & Lin 2010) and a 40 times smaller EM. If we wereto replace the hot component with a power-law ∝ E−γ , wewould have a steep slope of γ = 7.6. (2) During the impulsivephase (05:25–05:26 UT), we used an isothermal (T = 22 MK,EM = 2.8 × 1048 cm−3) plus power-law (blue dotted, γ = 3.8)model. (3) During the decay phase, the data can be fitted withone isothermal function of a slightly reduced temperature of18 MK but twice higher EM of 5.5 × 1048 cm−3. Note that atE > 25 keV, the power law in the impulsive phase is morethan an order of magnitude higher than the thermal component.This indicates that the 25–50 keV Masuda-type loop-top sourceshown in Figure 3 is primarily nonthermal and likely a particleacceleration region itself (e.g., Liu et al. 2008; Krucker et al.2010).
We applied such spectral fits throughout the flare and thetemporal variations of the fitting parameters are shown inFigures 1(d) and (e). In general, the warm thermal componentis persistent in time, and both its T and EM (orange plussigns) increase through the HXR burst followed by a moregradual decrease. A similar trend is present for the hot thermalcomponent (red crosses) during the pre-impulsive phase. Athermal fit to GOES data gives a somewhat lower T but higherEM (black dotted lines), because of its well-known preferentialresponse to relatively cooler plasma. The power-law component(blue) displays a common hardening trend before the RHESSInight data gap.
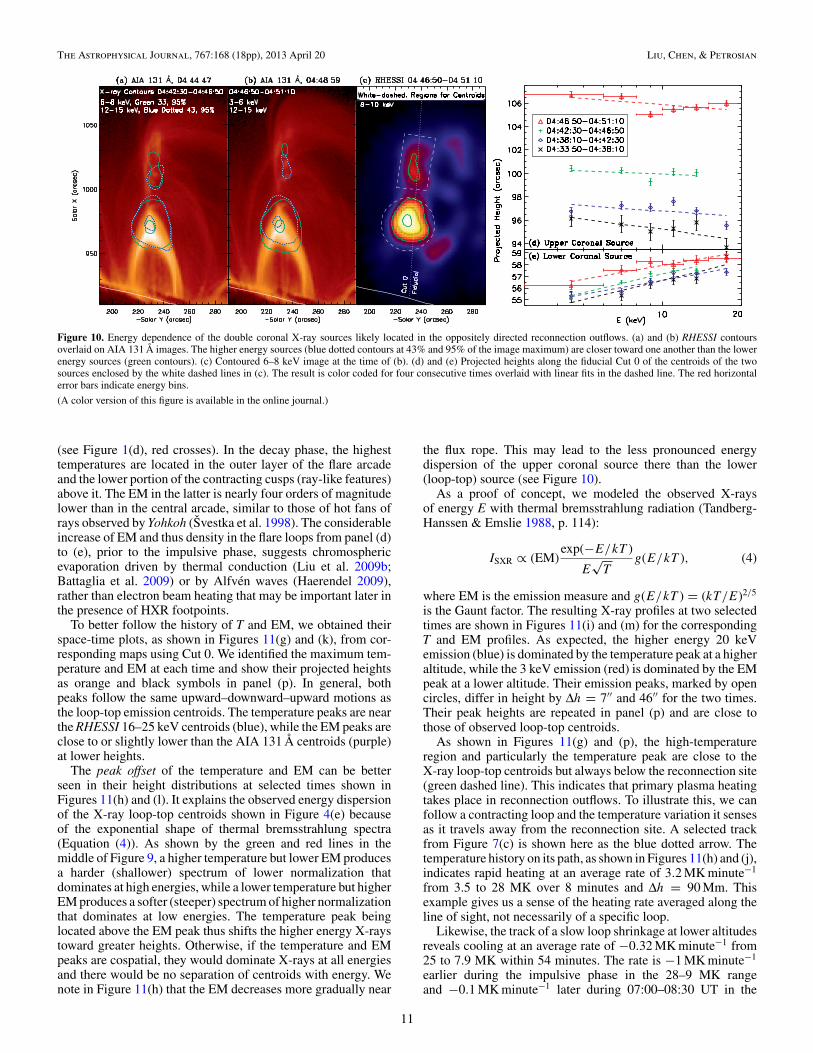
5.2. Energy Dependence of Double Coronal Sources
In Section 3.2 we have examined the energy-dependent heightdistribution of the loop-top X-ray source (lower coronal source).Here we extend this analysis to the upper coronal source duringthe pre-impulsive phase and compare the two sources together.
As shown in Figures 10(a) and (b), the higher-energy emission(12–15 keV, blue contours) of the lower source is located athigher altitudes than lower-energy emission (3–8 keV, greencontours), while the upper source has an opposite trend. Thatis, the two sources are closer to each other at higher energies,as can be better seen in panel (d) from the linear fits to theircentroid heights as a function of logarithmic energy. Thisimplies higher temperatures of the thermal plasma and/or harderspectra of the nonthermal particles within the inner regions.Similar RHESSI observations have been reported (Sui & Holman2003; Liu et al. 2008, 2009c) and interpreted as evidenceof magnetic reconnection and associated energy release beinglocated between the double coronal sources.
At the highest energies (�10 keV), this trend seems to bereversed, especially for the upper source. In previous observa-tions (e.g., Figure 4 in Liu et al. 2008), more obvious reversalsoccurred at slightly higher energies of 15–20 keV and were in-terpreted as a transition from the low-energy thermal regime tothe high-energy nonthermal regime, in which greater stoppingdistances of higher energy electrons can cause higher energybremsstrahlung X-rays being located farther away. We furthersuggest that this reversal may be an indication of the two X-raysources being spatially separated, instead of merging togetherat the highest energies; so are the locations of primary heat-ing and particle acceleration from magnetic reconnection. Thisis supported by the separate temperature peaks at the twosources as shown in Figures 11(a) and (h) and discussed inSection 5.3.
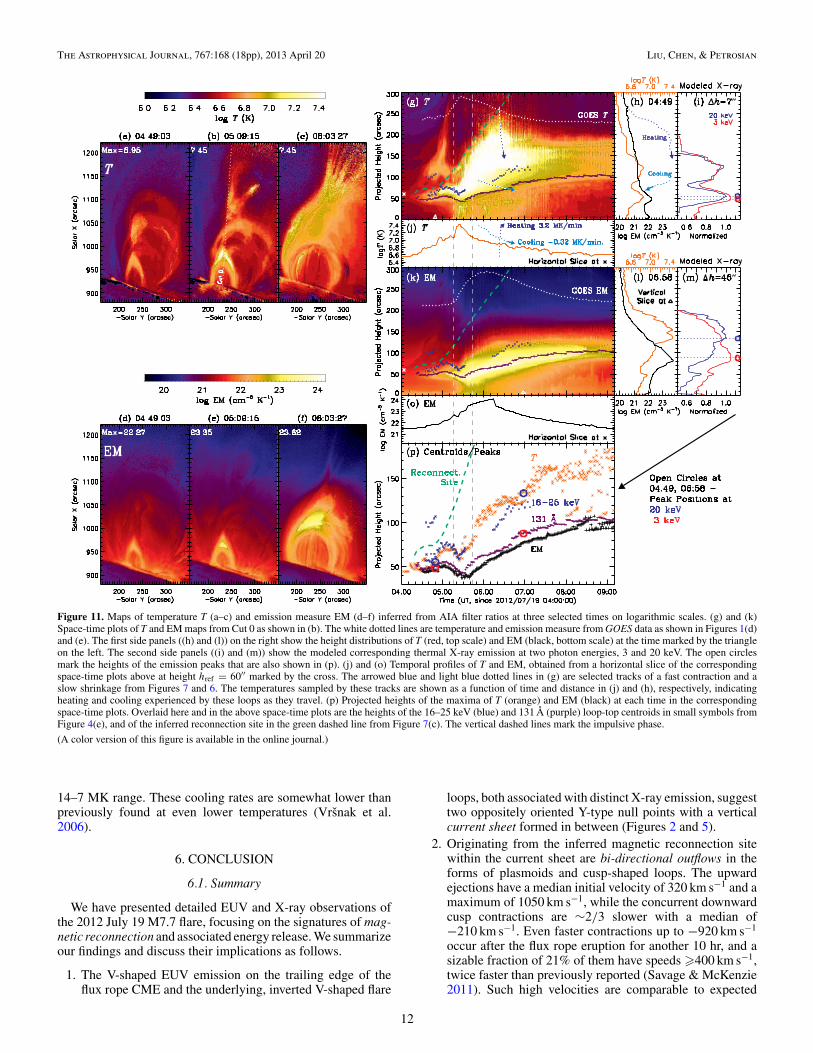
5.3. AIA Temperature Maps
To infer the spatial distributions of temperature T and emis-sion measure (EM), we employed a forward-fitting algorithmusing AIA filter ratios (Aschwanden et al. 2013; for a differ-ent approach, see Battaglia & Kontar 2012). This algorithmassumes a Gaussian differential EM that has a peak EM at tem-perature T. Such a model provides the simplest description of theEM-weighted temperature distribution along the line of sight.
Figure 11 (left) shows examples of T and EM maps. Early inthe event at 04:49 UT, the highest temperature of log T = 6.95or T = 8.9 MK is located in the rising flux rope and theunderlying flare cusp, but EM is highly concentrated in the latter.The temperature then increases with time especially in the flarecusp, reaching log T = 7.45 or T = 28.2 MK at 05:09 UT,close to the 35 MK of the hot RHESSI component at this time
10
The Astrophysical Journal, 767:168 (18pp), 2013 April 20 Liu, Chen, & Petrosian
Figure 10. Energy dependence of the double coronal X-ray sources likely located in the oppositely directed reconnection outflows. (a) and (b) RHESSI contoursoverlaid on AIA 131 Å images. The higher energy sources (blue dotted contours at 43% and 95% of the image maximum) are closer toward one another than the lowerenergy sources (green contours). (c) Contoured 6–8 keV image at the time of (b). (d) and (e) Projected heights along the fiducial Cut 0 of the centroids of the twosources enclosed by the white dashed lines in (c). The result is color coded for four consecutive times overlaid with linear fits in the dashed line. The red horizontalerror bars indicate energy bins.
(A color version of this figure is available in the online journal.)
(see Figure 1(d), red crosses). In the decay phase, the highesttemperatures are located in the outer layer of the flare arcadeand the lower portion of the contracting cusps (ray-like features)above it. The EM in the latter is nearly four orders of magnitudelower than in the central arcade, similar to those of hot fans ofrays observed by Yohkoh (Svestka et al. 1998). The considerableincrease of EM and thus density in the flare loops from panel (d)to (e), prior to the impulsive phase, suggests chromosphericevaporation driven by thermal conduction (Liu et al. 2009b;Battaglia et al. 2009) or by Alfven waves (Haerendel 2009),rather than electron beam heating that may be important later inthe presence of HXR footpoints.
To better follow the history of T and EM, we obtained theirspace-time plots, as shown in Figures 11(g) and (k), from cor-responding maps using Cut 0. We identified the maximum tem-perature and EM at each time and show their projected heightsas orange and black symbols in panel (p). In general, bothpeaks follow the same upward–downward–upward motions asthe loop-top emission centroids. The temperature peaks are nearthe RHESSI 16–25 keV centroids (blue), while the EM peaks areclose to or slightly lower than the AIA 131 Å centroids (purple)at lower heights.
The peak offset of the temperature and EM can be betterseen in their height distributions at selected times shown inFigures 11(h) and (l). It explains the observed energy dispersionof the X-ray loop-top centroids shown in Figure 4(e) becauseof the exponential shape of thermal bremsstrahlung spectra(Equation (4)). As shown by the green and red lines in themiddle of Figure 9, a higher temperature but lower EM producesa harder (shallower) spectrum of lower normalization thatdominates at high energies, while a lower temperature but higherEM produces a softer (steeper) spectrum of higher normalizationthat dominates at low energies. The temperature peak beinglocated above the EM peak thus shifts the higher energy X-raystoward greater heights. Otherwise, if the temperature and EMpeaks are cospatial, they would dominate X-rays at all energiesand there would be no separation of centroids with energy. Wenote in Figure 11(h) that the EM decreases more gradually near
the flux rope. This may lead to the less pronounced energydispersion of the upper coronal source there than the lower(loop-top) source (see Figure 10).
As a proof of concept, we modeled the observed X-raysof energy E with thermal bremsstrahlung radiation (Tandberg-Hanssen & Emslie 1988, p. 114):
ISXR ∝ (EM)exp(−E/kT )
E√
Tg(E/kT ), (4)
where EM is the emission measure and g(E/kT ) = (kT /E)2/5
is the Gaunt factor. The resulting X-ray profiles at two selectedtimes are shown in Figures 11(i) and (m) for the correspondingT and EM profiles. As expected, the higher energy 20 keVemission (blue) is dominated by the temperature peak at a higheraltitude, while the 3 keV emission (red) is dominated by the EMpeak at a lower altitude. Their emission peaks, marked by opencircles, differ in height by Δh = 7′′ and 46′′ for the two times.Their peak heights are repeated in panel (p) and are close tothose of observed loop-top centroids.
As shown in Figures 11(g) and (p), the high-temperatureregion and particularly the temperature peak are close to theX-ray loop-top centroids but always below the reconnection site(green dashed line). This indicates that primary plasma heatingtakes place in reconnection outflows. To illustrate this, we canfollow a contracting loop and the temperature variation it sensesas it travels away from the reconnection site. A selected trackfrom Figure 7(c) is shown here as the blue dotted arrow. Thetemperature history on its path, as shown in Figures 11(h) and (j),indicates rapid heating at an average rate of 3.2 MK minute−1
from 3.5 to 28 MK over 8 minutes and Δh = 90 Mm. Thisexample gives us a sense of the heating rate averaged along theline of sight, not necessarily of a specific loop.
Likewise, the track of a slow loop shrinkage at lower altitudesreveals cooling at an average rate of −0.32 MK minute−1 from25 to 7.9 MK within 54 minutes. The rate is −1 MK minute−1
earlier during the impulsive phase in the 28–9 MK rangeand −0.1 MK minute−1 later during 07:00–08:30 UT in the
11
The Astrophysical Journal, 767:168 (18pp), 2013 April 20 Liu, Chen, & Petrosian
Figure 11. Maps of temperature T (a–c) and emission measure EM (d–f) inferred from AIA filter ratios at three selected times on logarithmic scales. (g) and (k)Space-time plots of T and EM maps from Cut 0 as shown in (b). The white dotted lines are temperature and emission measure from GOES data as shown in Figures 1(d)and (e). The first side panels ((h) and (l)) on the right show the height distributions of T (red, top scale) and EM (black, bottom scale) at the time marked by the triangleon the left. The second side panels ((i) and (m)) show the modeled corresponding thermal X-ray emission at two photon energies, 3 and 20 keV. The open circlesmark the heights of the emission peaks that are also shown in (p). (j) and (o) Temporal profiles of T and EM, obtained from a horizontal slice of the correspondingspace-time plots above at height href = 60′′ marked by the cross. The arrowed blue and light blue dotted lines in (g) are selected tracks of a fast contraction and aslow shrinkage from Figures 7 and 6. The temperatures sampled by these tracks are shown as a function of time and distance in (j) and (h), respectively, indicatingheating and cooling experienced by these loops as they travel. (p) Projected heights of the maxima of T (orange) and EM (black) at each time in the correspondingspace-time plots. Overlaid here and in the above space-time plots are the heights of the 16–25 keV (blue) and 131 Å (purple) loop-top centroids in small symbols fromFigure 4(e), and of the inferred reconnection site in the green dashed line from Figure 7(c). The vertical dashed lines mark the impulsive phase.
(A color version of this figure is available in the online journal.)
14–7 MK range. These cooling rates are somewhat lower thanpreviously found at even lower temperatures (Vrsnak et al.2006).
6. CONCLUSION
6.1. Summary
We have presented detailed EUV and X-ray observations ofthe 2012 July 19 M7.7 flare, focusing on the signatures of mag-netic reconnection and associated energy release. We summarizeour findings and discuss their implications as follows.
1. The V-shaped EUV emission on the trailing edge of theflux rope CME and the underlying, inverted V-shaped flare
loops, both associated with distinct X-ray emission, suggesttwo oppositely oriented Y-type null points with a verticalcurrent sheet formed in between (Figures 2 and 5).
2. Originating from the inferred magnetic reconnection sitewithin the current sheet are bi-directional outflows in theforms of plasmoids and cusp-shaped loops. The upwardejections have a median initial velocity of 320 km s−1 and amaximum of 1050 km s−1, while the concurrent downwardcusp contractions are ∼2/3 slower with a median of−210 km s−1. Even faster contractions up to −920 km s−1
occur after the flux rope eruption for another 10 hr, and asizable fraction of 21% of them have speeds �400 km s−1,twice faster than previously reported (Savage & McKenzie2011). Such high velocities are comparable to expected
12

The Astrophysical Journal, 767:168 (18pp), 2013 April 20 Liu, Chen, & Petrosian
at X−PointReconnection
Outflows:Plasmoids
Coronal X−ray SourcesAcceleration, Heating:
Collasping TrapShockTurbulence
Loop Contractions
Thick−Target Footpoints
(a)
Cooler but Denser Loops
(b)
XX−Point
Loop−top(LT)X−raySource
Top of AIA FOV
X
(c)Pre−impulsive PhaseLT Source Ascent
Faster Contraction
X
Impulsive Phase(d)
LT Source Descent
X
Decay Phase, LT Ascent(e)
Figure 12. (a) Schematic of the proposed flare model in which particle acceleration and plasma heating take place in the reconnection outflow regions away fromthe reconnection site. (b)–(e) Temporal development of reconnection and the up–down–up three-stage motion of the loop-top (LT) X-ray source. We show only theportions of reconnected magnetic field lines near the reconnection site, above and below which each pair of field lines is identified by the same color during theirrelaxations. Note that the higher contraction speeds (e.g., of the green loop) from (c) to (d) are associated with the loop-top source descent. The upper coronal sourceis not hatched during the impulsive and decay phases, indicating its non-detection due to weak emission. We assume that bi-directional reconnection outflows andrelaxations of field lines persist throughout the event, but the upward component is beyond the AIA FOV during the late phase and thus not observed.
(A color version of this figure is available in the online journal.)
coronal Alfven speeds of ∼1000 km s−1 and sound speedsof 520–910 km s−1 for a 10–30 MK flaring plasma. Atlower altitudes, flare loops persistently shrink at a typicalinitial velocity of −17 km s−1 and gradually decelerate toabout −5 km s−1 within 0.5–2.5 hr. They are all evidenceof reconnection outflows during different stages (Figures 6and 7).
3. The double coronal X-ray sources are spatially separatedand located in the regions of bi-directional plasma outflows.The highest temperature is found near the loop-top X-raysource well below the reconnection site. This suggeststhat primary plasma heating and particle acceleration takeplace in the reconnection outflow regions (Holman 2012),rather than at the reconnection site itself. Models with thisingredient were proposed long ago (e.g., Forbes & Priest1983), but solid observational evidence as presented herehas been lacking (Figures 10 and 11).
4. An energy dispersion is present in the loop-top positionwith higher-energy X-ray and hotter EUV emission locatedat greater heights over a large range of Δh � 26 Mm. The25–50 keV nonthermal emission lies 15 Mm (twice that ofthe Masuda flare) above the 6–10 keV thermal emission.This agrees with the expected trend of softer electronspectra in the nonthermal regime and lower temperatures inthe thermal regime being associated with earlier energizedloops, which are located further below the primary locusof energy release. The upper coronal X-ray source hasan opposite trend because it is located in the oppositelydirected reconnection outflow (Figures 3, 4, and 10).
5. Prior to the recently recognized descent followed by a con-tinuous ascent, the overall loop-top emission experiencesan initial ascent for nearly an hour. This is the first timethat such motions, including the descent, are observed si-multaneously from EUV to HXRs covering a wide rangeof temperatures of 1–30 MK. The transition from ascentto descent coincides with the rapid acceleration of the flux
rope CME. The loop-top descends at ∼10 km s−1, about50% slower in EUV than in X-ray (Figure 4).
6. The flare impulsive phase starts when rapid velocity in-creases occur for the overall loop-top descent, the individualloop shrinkages, and the upward plasmoid ejections. Thisis delayed by 10 minutes from the initial loop-top descent,implying that the energy release rate is more intimatelycorrelated with these velocities than the loop-top position(Figure 4).
6.2. Proposed Physical Picture
We propose the following physical picture to tie togetherthe observations. The major points, including the location ofparticle acceleration and the three-stage (up–down–up) motionof the loop-top X-ray source, are sketched in Figure 12.
The earlier confined C4.5 flare leads to the formation of a fluxrope and cusp-shaped loops underneath it. After 6 hr of slowevolution, the flux rope becomes unstable and rises (Patsourakoset al. 2013). A vertical current sheet forms between two Y-typenull points at the lower tip of the flux rope and the upper tip ofthe underlying cusp. Magnetic reconnection ensues within thecurrent sheet, leading to the eruptive M7.7 flare.
Magnetic reconnection produces bi-directional outflows inthe forms of the observed plasmoids and contracting loops.Plasmoids are flux tubes formed by the tearing mode (Furthet al. 1963) with a guiding field along the current sheet. Theyare magnetic islands in two dimensions or when the currentsheet is seen edge-on. These outflows are driven by the magnetictension force of the highly bent, newly reconnected field lines,as in those pointed cusps. The outflows generally decelerate,as observed here, when they run into the ambient corona andwhen the contracting loops relax to less bent shapes withreduced magnetic tension. This implies that the low-altitudeslow shrinkages could be the late stages of decelerated high-altitude fast contractions.
13
The Astrophysical Journal, 767:168 (18pp), 2013 April 20 Liu, Chen, & Petrosian
Several mechanisms can operate in the reconnection outflowsand contribute to particle acceleration and plasma heating.Turbulence or plasma waves, for example, can be generated bythe interaction of the high-speed flows with the ambient corona.Upon cascading to smaller scales (comparable to the gyro-radiiof background particles) at some distance from the reconnectionsite, turbulence can accelerate the particles and heat the plasma(Hamilton & Petrosian 1992; Miller et al. 1996; Chandran 2003;Petrosian & Liu 2004; Petrosian et al. 2006; Jiang et al. 2009;Fleishman & Toptygin 2013). Additional contribution to particleacceleration and/or heating can come from fast-mode shocks inthe outflow regions (Forbes & Priest 1983; Tsuneta & Naito1998; Guo & Giacalone 2012; Nishizuka & Shibata 2013),gas dynamic shocks within contracting flux tubes (Longcopeet al. 2009), and the first-order Fermi and betatron mechanismswithin the collapsing traps formed by contracting loops (Somov& Kosugi 1997; Karlicky & Kosugi 2004; Karlicky 2006; Gradyet al. 2012).
As the flux rope evolves into its fast rise and eruption stage, thecurrent sheet could become sufficiently long causing significanttearing instability (e.g., Barta et al. 2008), and/or becomethinner than the ion skin depth leading to a transition fromSweet–Parker reconnection to collisionless Hall reconnection(Cassak et al. 2006). Both can result in enhanced rates ofreconnection and energy release. The outflow velocity will alsoincrease, producing stronger heating and particle accelerationby one or a combination of the above three mechanisms(turbulence, shock, and betatron) whose efficiency is expected tobe positively correlated with the outflow velocity. For example,faster outflows can generate stronger turbulence that can leadto stronger particle acceleration (see Petrosian 2012, for acomparison between acceleration by turbulence and shocks).This explains the observed temporal correlation of the increasein outflow velocity and the onset of the impulse phase and HXRburst.
The loop-top source seen in X-ray and EUV represents thecollective emission of the ensemble of flare loops, each ofwhich undergoes post-reconnection contraction or shrinkage.The loop-top emission centroid is the average position of thisensemble, which in the thermal regime is determined by theconvolution of the spatial distributions of temperature andEM. Such distributions are influenced by several competingprocesses, including energization of new loops produced by theupward developing reconnection, and downward contractionsand cooling of previously reconnected loops. We suggest thatthe interplay of these processes results in the up–down–upmigration of the loop-top source. Around the early impulsivephase, the observed higher velocities of loop contractions tendto shift the overall loop-top source downward, as depicted inFigures 12(c) and (d). Within the contracting loops, conductivecooling can be considerably reduced by stronger turbulenceproduced by faster reconnection outflows (Chandran & Cowley1998; Jiang et al. 2006). Slower cooling helps the X-ray/EUVemission of these hot loops last longer during their contractionsand further contribute to the loop-top descent. Before and afterthe early impulsive phase, the situation could be different. Loopcontractions are slower and associated faster cooling can makethese loops cool below the instrumental temperature passbandmore rapidly. The upward development of reconnection couldthus dominate, leading to the upward loop-top migration. Thisinterpretation is supported by the observed temporal coincidenceof the highest velocities of individual loop shrinkages and of theloop-top descent at the impulsive phase onset. Like cooling,
chromospheric evaporation can also play a role. After theinitial chromospheric evaporation associated with energizationof newly reconnected loops, if it continues operating during thesubsequent loop contractions, the densities and thus EMs ofthese loops would keep rising and contribute to the downwardloop-top drift. Otherwise, if it rapidly subsides, it would assistthe upward loop-top drift. Investigating such a complex interplaywould require detailed numerical modeling, which is beyond ourscope here.
6.3. Discussion
The fast downward contractions of EUV loops are best seenduring the decay phase, likely because of their greater distancestraveled making them easier to be detected. Likewise, differentenvironments may explain the factor of two difference in themedian deceleration between the early and later fast contractions(Figures 7(f) and (g)). The earlier, compact flare loops ofstronger magnetic field can produce stronger resistance (e.g.,by the Lorentz force from a reverse current; Barta et al. 2008)to quickly brake the contracting loops impinging on them fromabove, while the later, large flare arcade of weaker field at greaterheights and greater travel distances may allow more gradualdeceleration.
The X-ray spectra are essentially thermal during the decayphase. This suggests that the late phase contractions are associ-ated with plasma heating rather than particle acceleration. Thisis expected because the magnetic field strength decreases withheight, and so does the available magnetic energy to be releasedby reconnection. Such prolonged heating may contribute to thewell-known slower than expected cooling of flare plasma (seeFigure 1(d); McTiernan et al. 1993; Jiang et al. 2006).
The fast high-altitude contractions and slow low-altitudeshrinkages appear as two statistically distinct populations.The median final velocity of the former is more than fourtimes the median initial velocity of the latter (−73 versus−17 km s−1; Figures 6 and 7). We have interpreted the latteras the late stages of the former that have decelerated, but werarely see a continuous track decelerating from >400 km s−1
to a few km s−1. Alternatively, this distinction may be dueto inhomogeneity of reconnection (see, e.g., Asai et al. 2004)in the current sheet above the flare arcade that is primarilyoriented along the line of sight. The persistent slow shrinkagescould result from reconnection at a moderate rate throughout thecurrent sheet, which produces flare loops forming the arcade anddouble ribbons at their footpoints. The episodic fast contractionscould be signatures of plasmoids within the current sheet,associated with enhanced reconnection and energy release rates.These fast contracting loops are dispersed along the line of sightamidst slowly shrinking loops, producing the observed effects(e.g., Figure 7(b)).
There are other physically different (though not necessarilyunrelated) phenomena that share similar observational signa-tures and should not be confused with the contractions of newlyreconnected loops studied here. For example, pre-existing coro-nal loops can contract at typical speeds <100 km s−1 duringeruptions (Liu & Wang 2010; Liu et al. 2012a; Sun et al. 2012),interpreted as implosion (Hudson 2000; Janse & Low 2007)due to the rapid release of magnetic energy and thus reduc-tion of magnetic pressure within the eruption volume. Whena CME eruption initiates at an elevated height, it can producea downward push to displace ambient coronal loops (e.g., Liuet al. 2012c, see their Figure 12(h), at −60 km s−1). Even slower
14
The Astrophysical Journal, 767:168 (18pp), 2013 April 20 Liu, Chen, & Petrosian
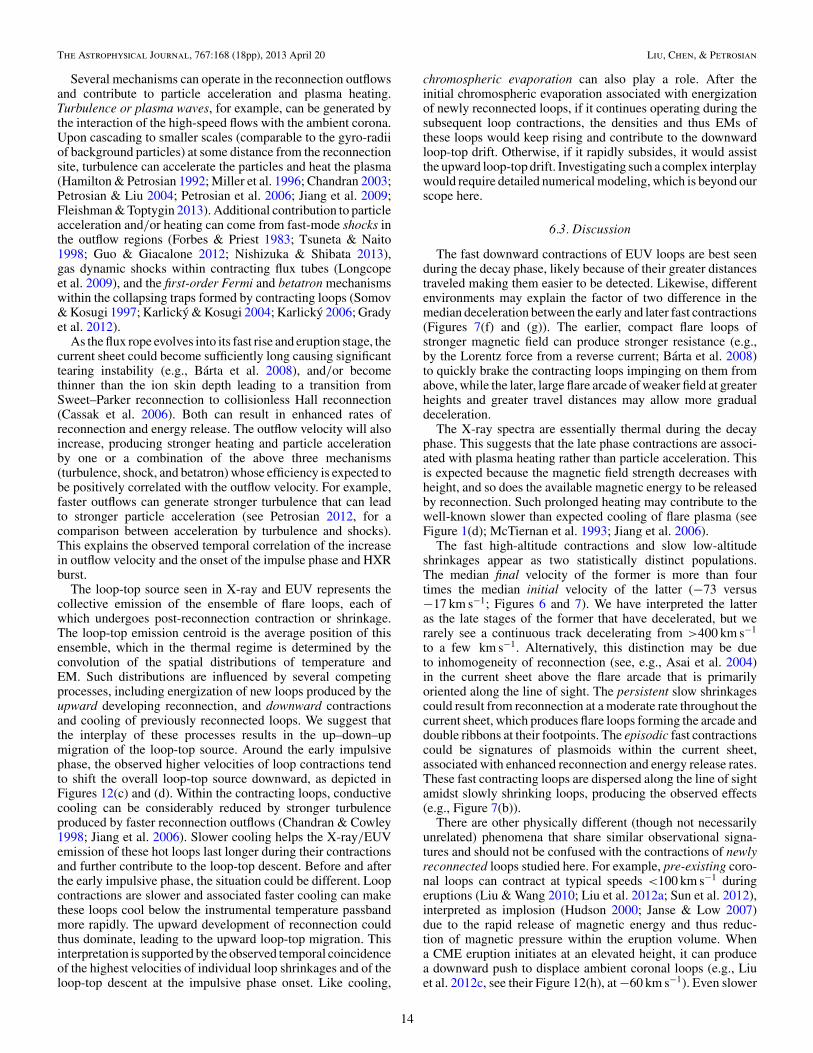
Figure 13. Top: temperature response of AIA EUV channels. Other panels: space-time plots of all AIA EUV channels in base ratio from Cut 0 on the left and inrunning ratio from Cut 3 on the right. The panels are arranged approximately in the order from high-to-low-temperature response. The cross and horizontal dash lineson the left mark the slice for obtaining the temporal profiles shown in Figure 1(b). The dotted line in (e) is a parabolic fit to the central portion of the erupting flux ropeCME that has an average acceleration of a = 0.114 ± 0.002 km s−2 and achieves a velocity of vf = 153 ± 3 km s−1 at the edge of AIA’s FOV.
(A color version of this figure is available in the online journal.)
15
The Astrophysical Journal, 767:168 (18pp), 2013 April 20 Liu, Chen, & Petrosian
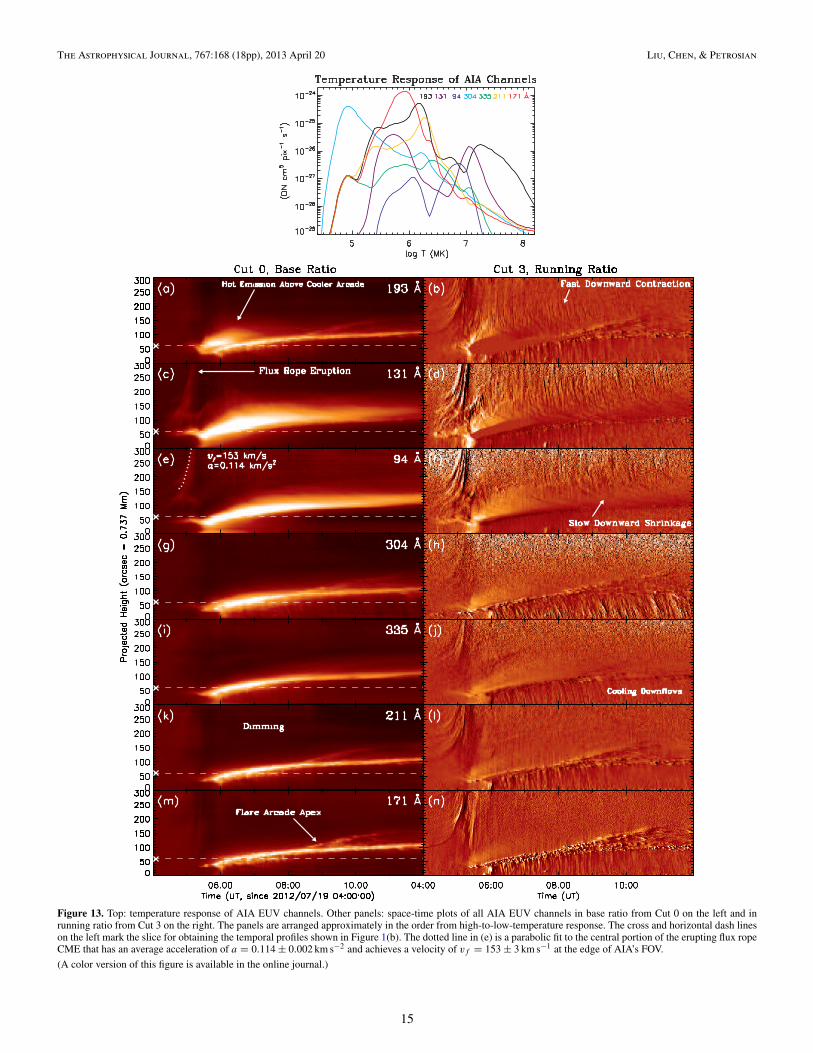
Figure 14. Comparison of SDO/AIA 193 Å (top) and STEREO-A 195 Å (bottom) images of the flare. The STEREO images are scaled as if they were viewed fromthe same heliocentric distance as SDO. The heliographic grids are spaced at 5◦. Note the compact brightening at the impulsive phase onset (pointed by the arrow), incontrast to the extended arcade system later.
(A color version of this figure is available in the online journal.)
shrinkage at −3 km s−1 can occur in AR loops due to gradualcooling (Wang et al. 1997). Sometimes, conjugate X-ray foot-points approach each other while the loop-top source descends(Ji et al. 2006; Liu et al. 2009a; Yang et al. 2009), likely be-cause of reconnection progressing toward less sheared loops atlower altitudes. We have not found these signatures in the flareunder study here, except for a few overlying existing loopsthat contract at about −150 km s−1 during 05:40–05:50 UTnear the end of the impulsive phase. In addition, some high-lying loops continue to expand and erupt at ∼100 km s−1 up to08:00 UT, 3 hr after the original flux rope eruption. Examinationof such features and quantitative comparison of these observa-tions with particle acceleration models will be subjects of futureinvestigations.
W.L. was supported by NASA SDO/AIA contractNNG04EA00C and LWS/TR&T contract NNX11AO68G.Q.R.C. and V.P. were supported by NASA grants NNX10AC06Gand NNX13AF79G. W.L. thanks Marian Karlicky, PaulCassak, Hugh Hudson, Sasha Kosovichev, Judy Karpen, RickDeVore, Greg Slater, Tom Berger, and Mark Cheung for usefuldiscussions.
APPENDIX A
OBSERVATIONS OF ALL AIA CHANNELS
In the main text, we focused on the 131 Å channel. For acomplete temperature coverage, we examine all AIA channelshere. As shown in Figure 13 (top), each channel has a generallybroad response with one to a few peaks. In the order ofapproximately decreasing temperature response are 193, 131,94, 304, 335, 211, and 171 Å channels.
Figure 13 shows space-time plots of all EUV channels. Onthe left is base ratio from every other frame of short exposure so
that bright flare loops are not over-exposed, while on the rightis running ratio from frames of regular exposure that is neededfor detecting faint emission, including fast loop contractions,above the flare arcade. On the left, the 131 and 94 Å channelscapture the hot, diffuse loop-top emission, while the flare arcadeunderneath it is best seen in cooler channels. Both regions appearin the 193 Å channel because of its dual response to hot Fe xxivemission peaking at 18 MK and cool Fe xii emission at 1.6 MK(O’Dwyer et al. 2010). On the right-hand side, downward fastcontractions and slow shrinkages can be identified in the threehottest channels. In cooler channels, cooling condensations raindown the arcade loops since 06:00 UT at up to ∼170 km s−1
or 90% of the free fall speed, faster than typical coronal rain(Antolin & Rouppe van der Voort 2012).
In Figure 13 (left), the erupting flux rope is best seen in the hot131 and 94 Å channels as a bright, accelerating track, indicatingits high temperature, as also shown in Figure 11. Its evolutionfrom gradual rise to impulsive eruption is accompanied by therapid increase in X-ray flux and the loop-top’s ascent-to-descenttransition. This is in line with observed synchronous eruptionaccelerations and flare onsets (Zhang et al. 2001, 2002; Temmeret al. 2008; Liu et al. 2011a).
Figures 1(b) and 4(a) show temporal emission profiles takenfrom the base-ratio space-time plots at href = 60′′ marked by across. Since 04:17 UT, the 131 and 94 Å emission increasesconsiderably, while other emission remains essentially flat.This indicates gentle heating early in the flare, as seen in thetemperature history at this position shown in Figure 11(j). Thedip in all channels at the onset of the impulsive phase (verticaldashed line) is due to the descent of the loop-top source. Thelarge hump afterward results from the growth of the flare arcadetoward greater heights. This hump generally progresses towardcooler channels, indicating a cooling sequence, similar tothose recently observed in flares, AR loops, and prominence
16

The Astrophysical Journal, 767:168 (18pp), 2013 April 20 Liu, Chen, & Petrosian
condensations (Woods et al. 2011; Viall & Klimchuk 2012; Liuet al. 2012b; Berger et al. 2012). The double humps at 193 Å areagain due to its dual temperature response.
Like 193 Å, the 304 Å channel responds to both hot Ca xviiiemission at 7.1 MK and cool He ii emission at 0.05 MK. Thedual response of these two channels leads to their unusually largedescent of about 40% of the loop-top centroids (see Table 2).This is because their maximum loop-top heights are dominatedby hot emission, while the minimum heights are dominated bycool emission at even lower heights (Figure 4).
APPENDIX B
DISAMBIGUATION WITH STEREO OBSERVATIONS
The limb view of SDO/AIA leaves an alternative possibilityof the loop-top descent as the progression of energization fromhigh- to low-lying loops along the arcade in the east–westdirection. This possibility is not supported by STEREO-A (STA)that was 121◦ ahead of the Earth and observed the flare on thedisk. When the X-ray loop-top descent occurs, the STA 195 Åimage (Figure 14(d)) shows a compact cusp-shaped loop, whilethe arcade system develops later (panels (e) and (f)). One couldfurther argue that a temperature effect, i.e., cooling or heating,can make a progression appear as a compact source rather thanan arcade. If so, the loops being cooled or heated would haveappeared at the same location and been captured by AIA incooler or hotter EUV channels or by RHESSI in X-rays. Instead,all available EUV and X-ray data covering a wide temperaturerange of 105–107 K show a consistent loop-top descent, whichmust be a real mass motion.
REFERENCES
Antolin, P., & Rouppe van der Voort, L. 2012, ApJ, 745, 152Asai, A., Yokoyama, T., Shimojo, M., & Shibata, K. 2004, ApJL, 605, L77Aschwanden, M. J., Boerner, P., Schrijver, C. J., & Malanushenko, A.
2013, SoPh, 283, 5Bain, H. M., Krucker, S., Glesener, L., & Lin, R. P. 2012, ApJ, 750, 44Barta, M., Vrsnak, B., & Karlicky, M. 2008, A&A, 477, 649Battaglia, M., Fletcher, L., & Benz, A. O. 2009, A&A, 498, 891Battaglia, M., & Kontar, E. P. 2012, ApJ, 760, 142Berger, T. E., Liu, W., & Low, B. C. 2012, ApJL, 758, L37Carmichael, H. 1964, in The Physics of Solar Flares (NASA SP-50), ed. W. N.
Hess (Washington, DC: NASA), 451Caspi, A., & Lin, R. P. 2010, ApJL, 725, L161Cassak, P. A., Drake, J. F., Gosling, J. T., et al. 2013, ApJ, submittedCassak, P. A., Drake, J. F., & Shay, M. A. 2006, ApJL, 644, L145Chandran, B. D. G. 2003, ApJ, 599, 1426Chandran, B. D. G., & Cowley, S. C. 1998, PhRvL, 80, 3077Chen, Q., & Petrosian, V. 2012, ApJ, 748, 33Fleishman, G. D., & Toptygin, I. N. 2013, MNRAS, 429, 2515Fletcher, L., Dennis, B. R., Hudson, H. S., et al. 2011, SSRv, 159, 19Forbes, T. G., & Acton, L. W. 1996, ApJ, 459, 330Forbes, T. G., & Priest, E. R. 1983, SoPh, 84, 169Furth, H. P., Killeen, J., & Rosenbluth, M. N. 1963, PhFl, 6, 459Glesener, L., Krucker, S., & Lin, R. P. 2012, ApJ, 754, 9Grady, K. J., Neukirch, T., & Giuliani, P. 2012, A&A, 546, A85Guo, F., & Giacalone, J. 2012, ApJ, 753, 28Haerendel, G. 2009, ApJ, 707, 903Hamilton, R. J., & Petrosian, V. 1992, ApJ, 398, 350Hara, H., Watanabe, T., Harra, L. K., Culhane, J. L., & Young, P. R. 2011, ApJ,
741, 107Hirayama, T. 1974, SoPh, 34, 323Holman, G. D. 2012, PhT, 65, 56Holman, G. D., Aschwanden, M. J., Aurass, H., et al. 2011, SSRv, 159, 107Hudson, H. S. 2000, ApJL, 531, L75Innes, D. E., Inhester, B., Axford, W. I., & Wilhelm, K. 1997, Natur, 386, 811Innes, D. E., McKenzie, D. E., & Wang, T. 2003, SoPh, 217, 247Janse, Å. M., & Low, B. C. 2007, A&A, 472, 957Ji, H., Huang, G., Wang, H., et al. 2006, ApJL, 636, L173
Jiang, Y. W., Liu, S., Liu, W., & Petrosian, V. 2006, ApJ, 638, 1140Jiang, Y. W., Liu, S., & Petrosian, V. 2009, ApJ, 698, 163Karlicky, M. 2006, SSRv, 122, 161Karlicky, M., & Kosugi, T. 2004, A&A, 419, 1159Karpen, J. T., Antiochos, S. K., & DeVore, C. R. 2012, ApJ, 760, 81Khan, J. I., Bain, H. M., & Fletcher, L. 2007, A&A, 475, 333Ko, Y.-K., Raymond, J. C., Lin, J., et al. 2003, ApJ, 594, 1068Kopp, R. A., & Pneuman, G. W. 1976, SoPh, 50, 85Krucker, S., Hudson, H. S., Glesener, L., et al. 2010, ApJ, 714, 1108Lemen, J. R., Title, A. M., Akin, D. J., et al. 2012, SoPh, 275, 17Li, Y. P., & Gan, W. Q. 2005, ApJL, 629, L137Li, Y. P., & Gan, W. Q. 2006, ApJL, 644, L97Li, Y. P., & Gan, W. Q. 2007, AdSpR, 39, 1389Lin, J. 2004, SoPh, 222, 115Lin, J., Ko, Y.-K., Sui, L., et al. 2005, ApJ, 622, 1251Lin, R. P., Dennis, B. R., Hurford, G. J., et al. 2002, SoPh, 210, 3Liu, R. 2013, ApJ, submittedLiu, R., Lee, J., Wang, T., et al. 2010, ApJL, 723, L28Liu, R., Liu, C., Torok, T., Wang, Y., & Wang, H. 2012a, ApJ, 757, 150Liu, R., & Wang, H. 2010, ApJL, 714, L41Liu, W., Berger, T. E., & Low, B. C. 2012b, ApJL, 745, L21Liu, W., Berger, T. E., Title, A. M., Tarbell, T. D., & Low, B. C. 2011a, ApJ,
728, 103Liu, W., Jiang, Y. W., Liu, S., & Petrosian, V. 2004, ApJL, 611, L53Liu, W., Ofman, L., Nitta, N. V., et al. 2012c, ApJ, 753, 52Liu, W., Petrosian, V., Dennis, B. R., & Holman, G. D. 2009a, ApJ, 693, 847Liu, W., Petrosian, V., Dennis, B. R., & Jiang, Y. W. 2008, ApJ, 676, 704Liu, W., Petrosian, V., & Mariska, J. T. 2009b, ApJ, 702, 1553Liu, W., Title, A. M., Zhao, J., et al. 2011b, ApJL, 736, L13Liu, W., Wang, T.-J., Dennis, B. R., & Holman, G. D. 2009c, ApJ, 698, 632Longcope, D. W., Guidoni, S. E., & Linton, M. G. 2009, ApJL, 690, L18Masuda, S., Kosugi, T., Hara, H., Tsuneta, S., & Ogawara, Y. 1994, Natur,
371, 495McKenzie, D. E., & Hudson, H. S. 1999, ApJL, 519, L93McTiernan, J. M., Kane, S. R., Loran, J. M., et al. 1993, ApJL, 416, L91Miller, J. A., Larosa, T. N., & Moore, R. L. 1996, ApJ, 461, 445Milligan, R. O., & Dennis, B. R. 2009, ApJ, 699, 968Milligan, R. O., McAteer, R. T. J., Dennis, B. R., & Young, C. A. 2010, ApJ,
713, 1292Murphy, N. A., Miralles, M. P., Pope, C. L., et al. 2012, ApJ, 751, 56Nakariakov, V. M., & Melnikov, V. F. 2009, SSRv, 149, 119Neupert, W. M. 1968, ApJL, 153, L59Nishizuka, N., & Shibata, K. 2013, PhRvL, 110, 051101Nishizuka, N., Takasaki, H., Asai, A., & Shibata, K. 2010, ApJ, 711, 1062Nitta, N. V., Freeland, S. L., & Liu, W. 2010, ApJL, 725, L28O’Dwyer, B., Del Zanna, G., Mason, H. E., Weber, M. A., & Tripathi, D.
2010, A&A, 521, A21Ofman, L., Liu, W., Title, A., & Aschwanden, M. 2011, ApJL, 740, L33Patsourakos, S., Vourlidas, A., & Stenborg, G. 2013, ApJ, 764, 125Petrosian, V. 2012, SSRv, 173, 535Petrosian, V., & Liu, S. 2004, ApJ, 610, 550Petrosian, V., Yan, H., & Lazarian, A. 2006, ApJ, 644, 603Pick, M., Demoulin, P., Krucker, S., Malandraki, O., & Maia, D. 2005, ApJ,
625, 1019Raymond, J. C., Krucker, S., Lin, R. P., & Petrosian, V. 2012, SSRv, 173, 197Reeves, K. K., Seaton, D. B., & Forbes, T. G. 2008, ApJ, 675, 868Reznikova, V. E., Melnikov, V. F., Ji, H., & Shibasaki, K. 2010, ApJ, 724, 171Savage, S. L., Holman, G., Reeves, K. K., et al. 2012, ApJ, 754, 13Savage, S. L., & McKenzie, D. E. 2011, ApJ, 730, 98Sheeley, N. R., Jr., Warren, H. P., & Wang, Y.-M. 2004, ApJ, 616, 1224Shen, C., Lin, J., & Murphy, N. A. 2011, ApJ, 737, 14Shen, J., Zhou, T., Ji, H., et al. 2008, ApJL, 686, L37Shen, Y., & Liu, Y. 2012, ApJ, 753, 53Somov, B. V., & Kosugi, T. 1997, ApJ, 485, 859Sturrock, P. A. 1966, Natur, 211, 695Su, Y., Dennis, B. R., Holman, G. D., et al. 2012, ApJL, 746, L5Sui, L., & Holman, G. D. 2003, ApJL, 596, L251Sui, L., Holman, G. D., & Dennis, B. R. 2004, ApJ, 612, 546Sun, X., Hoeksema, J. T., Liu, Y., et al. 2012, ApJ, 748, 77Svestka, Z., Farnık, F., Hudson, H. S., & Hick, P. 1998, SoPh, 182, 179Svestka, Z. F., Fontenla, J. M., Machado, M. E., Martin, S. F., & Neidig, D. F.
1987, SoPh, 108, 237Takasao, S., Asai, A., Isobe, H., & Shibata, K. 2012, ApJL, 745, L6Tandberg-Hanssen, E., & Emslie, A. G. 1988, The Physics of Solar Flares
(Cambridge: Cambridge Univ. Press), 286Temmer, M., Veronig, A. M., Vrsnak, B., et al. 2008, ApJL, 673, L95Tsuneta, S., & Naito, T. 1998, ApJL, 495, L67
17

The Astrophysical Journal, 767:168 (18pp), 2013 April 20 Liu, Chen, & Petrosian
Veronig, A. M., Karlicky, M., Vrsnak, B., et al. 2006, A&A, 446, 675Viall, N. M., & Klimchuk, J. A. 2012, ApJ, 753, 35Vrsnak, B., Temmer, M., Veronig, A., Karlicky, M., & Lin, J. 2006, SoPh,
234, 273Wang, J., Shibata, K., Nitta, N., et al. 1997, ApJL, 478, L41Wang, T. J., Sui, L., & Qiu, J. 2007, ApJL, 661, L207Wang, Y.-M., Sheeley, N. R., Howard, R. A., St. Cyr, O. C., & Simnett, G. M.
1999, GeoRL, 26, 1203Warren, H. P., O’Brien, C. M., & Sheeley, N. R., Jr. 2011, ApJ, 742, 92
Watanabe, T., Hara, H., Sterling, A. C., & Harra, L. K. 2012, SoPh, 281, 87Woods, T. N., Hock, R., Eparvier, F., et al. 2011, ApJ, 739, 59Yang, Y.-H., Cheng, C. Z., Krucker, S., Lin, R. P., & Ip, W. H. 2009, ApJ,
693, 132Yokoyama, T., Akita, K., Morimoto, T., Inoue, K., & Newmark, J. 2001, ApJL,
546, L69Zhang, J., Dere, K. P., Howard, R. A., Kundu, M. R., & White, S. M. 2001, ApJ,
559, 452Zhang, M., Golub, L., DeLuca, E., & Burkepile, J. 2002, ApJL, 574, L97
18