Plant Lab Second Draft Two
21
Effects on Population Growth of Lemna minor and Salvinia minima with Excess Nutrients and Interspecific Competition Chelsea Schwartz BIO 220W Section 006 3/14/13 TA: Lauren Smith
Transcript of Plant Lab Second Draft Two

Effects on Population Growth of Lemna minor and Salvinia minima with Excess Nutrients and
Interspecific Competition
Chelsea Schwartz
BIO 220W
Section 006
3/14/13
TA: Lauren Smith

INTRODUCTION:
Contamination is a major issue in many waterways throughout the world, such as the Chesapeake
Bay Watershed. One of the main sources of contamination is eutrophication, which is an abundance of
organic matter in an ecosystem, in some cases with excess nitrogen and phosphorous. Even though
nitrogen and phosphorous are needed for growth, in excess, they feed algae, which block the sunlight
from other organisms. This excess of nitrogen and phosphorous due to sewage treatment plants, urban and
suburban areas, agriculture run off, air pollution, and power plants (Nitrogen and Phoshorus). To help
with this problem, phytoremediation is one technique that is being experimented with and used.
Phytoremediation uses different types of plants to remove pollutants from the environment without
harming the plant itself (Hass et al., 2013). One of the goals of this experiment is to use two plants
species, Lemna minor and Salvinia minima, in the technique of phytoremediation. Lemna minor, common
name duckweed, are very small flowering plants that rapidly expand on still water surfaces. It can be
found all over the world and grows best in cool temperatures during spring and fall (Lemna minor).
Salvinia minima are aquatic ferns that float on still water as well and slow flowing streams. They are
commonly known as water spangles, have green oval shaped leaves, and need sunlight to grow (Salvinia
minima).
Not only do excessive nutrients play a role in population growth, but interspecific competition
does as well. Interspecific competition is when two or more different species are competing for resources.
Interspecific competition is important because it influences communities, evolution and species
distribution. Intraspecific competition also plays a role in this experiment. Intraspecific competition is
when two or more individuals of the same species are competing for resources. For example, in this
experiment, the same plant species in the same habitat will be competing for space, water, and sunlight.
Overall, the goals in this experiment are to have a control of each plant species normal growth
patterns without nutrients or competition. Also, it is necessary to analyze the population growth of Lemna

minor and Salvinia minima. Seeing how adding nitrogen and phosphorous affect their growth, along with
seeing the effects of competition by having both plant species share a habitat, did this.
The hypothesis, specifically for the population growth of Salvinia, is that Salvinia will have
continuous growth initially and then when it reaches its carrying capacity, it will become stable. The
hypothesis, specifically for the competition between Lemna and Salvinia, is that Lemna will win the
competition between the two species because there are more of them in general. Furthermore, the Lemna
would take up more resources that will inhibit the population growth of the Salvinia, but the Lemna will
eventually reach its carrying capacity and then have a stable growth rate.
METHODS:
This experiment was broken down into two parts. The first part was to analyze the individual
species growth dynamics in standard pond water, specifically Salvinia. Two 10oz plastic containers were
obtained and filled with artificial pond water. Using forceps, 12 Salvinia were placed in one container and
24 were placed in the other. To determine the number of each plant species it was important to look at a
leaf unit that was over 1.5mm for Lemna and a frond at least 3mm for Salvinia. It was important to dunk
the Salvinia in pond water to remove the duckweed because it tended to stick. Also, the lightest green
Salvinia leaves were chosen because they are the healthiest. To obtain the Salvinia, thalli were looked for
and if it was at least 3mm that was considered one Salvinia plant. After the Salvinia were placed in their
containers, the number of plants was counted along with the number of fronds (Hass et al., 2013).
The next step of the experiment was to investigate the competition between Lemna and Salvinia.
Three 10oz containers were obtained and each filled with artificial pond water. Each container was
labeled. In each container 12 Salvinia and 12 Lemna plants were added using forceps and dunking each
plant in pond wonder to remove any sticking of the other. For Lemna the darkest green plants were the
healthiest and were chosen. The Salvinia and Lemna plants along with their leaves were each counted for
each of the three containers (Hass et al., 2013).

Finally, the containers were taken to the greenhouse to grow and be taken care of. A weekly
schedule was produced so each individual in each group would either count and record the leaf amounts
or check on the plant by watering them and removing algae (Hass et al., 2013).
Data analysis was the final step of this experiment. For experiment 1, the exponential population
growth equation was used which is, dN/dt= rN. The data for this experiment was plotted on a graph to be
able to analyze the population growth rate of Salvinia alone. Also, for experiment 3 the interspecific
competition growth model was used which is, species 1- dN1/dt=Nr[K1-N1-aN2/K1] and species 2-
dN2/dt= Nr[K2-N2-BN1/K2]. This data was plotted on a graph to be able to analyze the population
growth rate of both Lemna and Salvinia in the same habitat (Hass et al., 2013).
RESULTS:
In both experiments (1 and 3) the Salvinia over reached its carrying capacity of 207.46. In
experiment 3 the Lemna and Salvinia were both constantly increasing in population growth. The Salvinia
continued to grow and over reached its carrying capacity, while the Lemna continued to grow but never
reached its carry capacity of 1452.25. The mode of the growth was exponential because it is showing a
continuous and unlimited growth pattern. Also, the rmax is the intrinsic rate of population increase and
when a population is growing under normal conditions, it is the rate of the growth of a population, also
the slope of the graph of the ln(N) vs time. Specifically for this experiment rmax was 3.0164.
Competition can be seen in experiment three because the Lemna never reach its carry capacity, while the
Salivina out grew its carrying capacity and the Lemna.
CONTAINER
1
Number of
Leaves
Week 1 Week 2 Week 3 Week 4
34 87 187 326
28 95 211 390
35 120 264 688
AVERAGE 32.33333333 100.6667 220.6667 468
CONTAINER
2
Number of
Leaves
Week 1 Week 2 Week 3 Week 4
49 126 272 441
54 196 285 341
81 218 676 756
AVERAGE 61.33333 180 411.333 512.667
TABLE 1: Shows experiment 1 data of the population growth of 12 Salvinia plants growing alone. This is a monoculture.
TABLE 2: Shows experiment 1 data of the population growth of 24 Salvinia plants growing alone. This is a monoculture.

0.5 1 1.5 2 2.5 3 3.5 4 4.50
100200300400500600700800
f(x) = 15.2520155956942 exp( 0.865679956228956 x )
N (number of leaves) vs Time (weeks)Experiment 1 - 12 Salvinia Plants
Time (weeks)
N (n
umbe
r of l
eave
s)
0.5 1 1.5 2 2.5 3 3.5 4 4.501234567
f(x) = 3.01644824141749 exp( 0.184368832289608 x )
ln(N) vs Time (weeks) Experiment 1 - 12 Salvinia Plants
Time (weeks)
ln(N
)
FIGURE 1
Shows the graph of the population of 12 Salvinia plants over a 4 week period of time growing alone.
FIGURE 2
The natural log of the number of leaves vs time during a four week period of the population growth of Salvinia. The slope is rmax, which is 3.0164.

0 100 200 300 400 500 600 700 80005
1015202530354045
f(x) = 16.5610035366183 ln(x) − 60.80661411483
λ vs N (leaves) Experiment 1- 12 Salvinia
N (leaves)
λ
-Carrying capacity of Salvinia
Area of container/ area of Salvinia = 5809mm2 / 28mm2 = 207.46
-Carrying capacity of Lemna
Area of container/ area of Lemna = 5809mm2/ 4mm2 = 1452.25
λ=ermax
rmax= slope of ln(N) vs time
FIGURE 3
The number of leaves of the 12 Salvinia plants from Experiment 1 compared to lambda over intervals of time for a four week time period.

CONTAINER 1
Number of
Leaves
Week 1 Week
2
Week 3 Week 4
20 108 212 297
16 129 480 1020
19 156 412 830
AVERAGE 18.33333 131 368 715.6666667
0.5 1 1.5 2 2.5 3 3.5 4 4.50
200
400
600
800
1000
1200
f(x) = 8.26834173985516 exp( 1.16164878006408 x )
N (number of leaves) vs Time (week)Experiment 1- 12 Lemna Plants
Time (weeks)
N (n
umbe
r of l
eave
s)
Number of Week 1 Week 2 Week 3 Week 4
Table 3 : Shows the number of leaves of Lemna during a four week time period when living alone during experiment 1. This was monoculture.
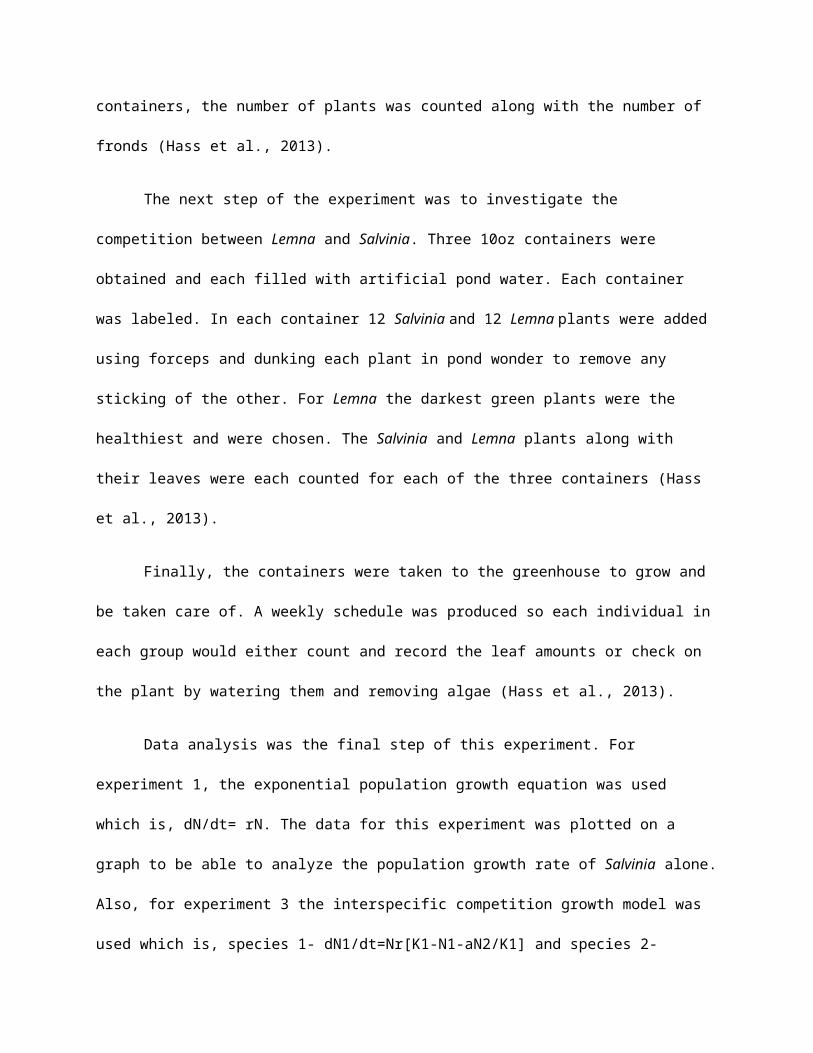
Figure 4
The graph of the number of leaves of Lemna over a four week time period as a monoculture.

leaves
31 97 356 680
30 86 396 748
30 100 296 664
AVERAGE 30.33333 94.33333 349.3333 697.3333
0.5 1 1.5 2 2.5 3 3.5 4 4.50
100200300400500600700800
f(x) = 11.1510732081229 exp( 1.07055546030401 x )
N (number of leaves) vs Time (weeks)Experiment 3 - 12 Salvinia Plants
Time (weeks)
N (n
umbe
r of l
eave
s)
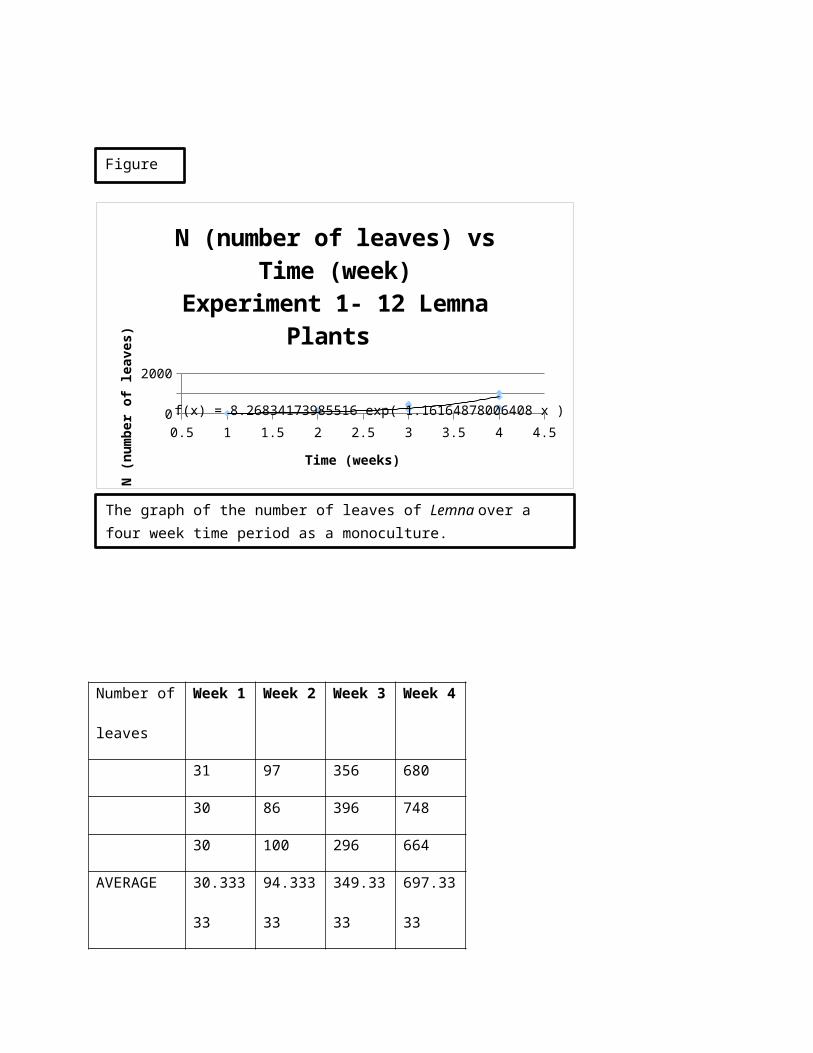
Number of Week 1 Week 2 Week 3 Week 4
TABLE 4: Shows the number of leaves of Salvinia during experiment 3 when living with Lemna for four weeks in the same container. This was a mixed culture.
FIGURE 5
The number of leaves of Salvinia during experiment 3 when living with Lemna for four weeks in the same container. This was a mixed culture.

leaves
31 168 404 608
21 161 452 688
21 140 652 976
AVERAGE 24.33333 156.3333 502.66667 757.3333333
0.5 1 1.5 2 2.5 3 3.5 4 4.50
200
400
600
800
1000
1200
f(x) = 10.9602464775154 exp( 1.14537711772883 x )
N (number of leaves) vs Time (weeks)Experiment 3- 12 Lemna Plants
Time (weeks)
N (n
umbe
r of l
eave
s)
TABLE 5: Shows the number of leaves of Lemna during experiment 3 when living with Salvinia for four weeks in the same container. This was a mixed culture.
FIGURE 6
The number of leaves of Lemna during experiment 3 when living with Salvinia for four weeks in the same container. This was a mixed culture.
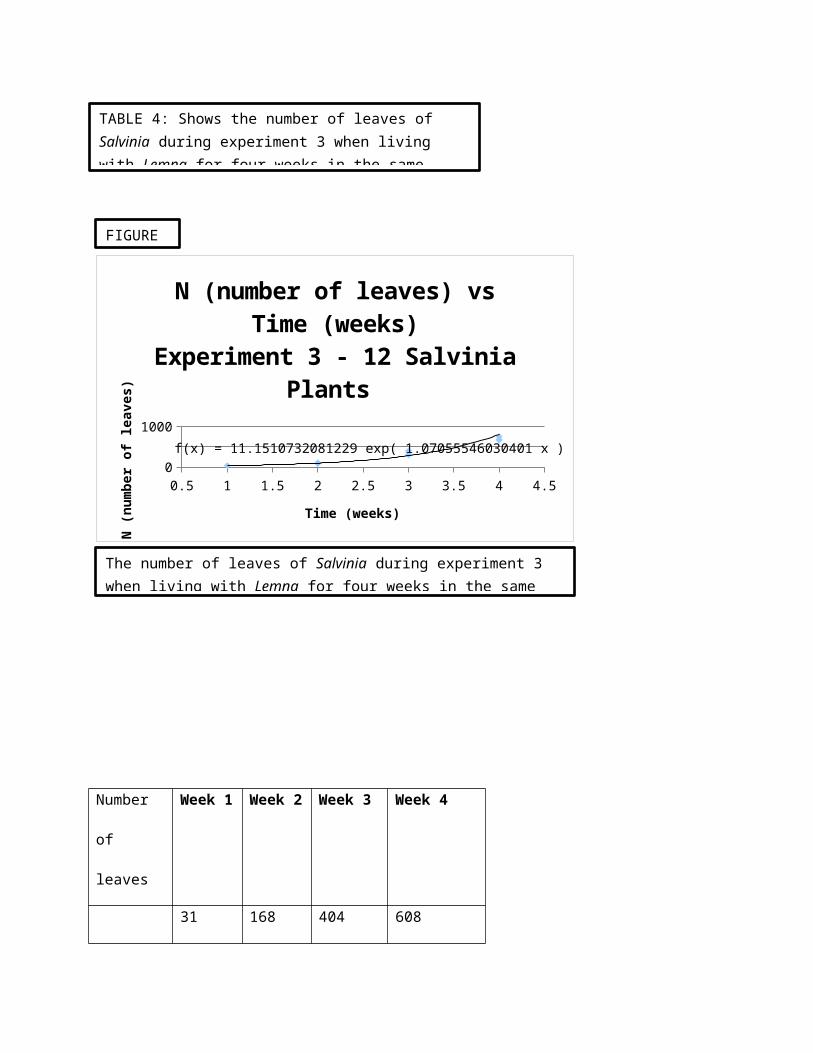
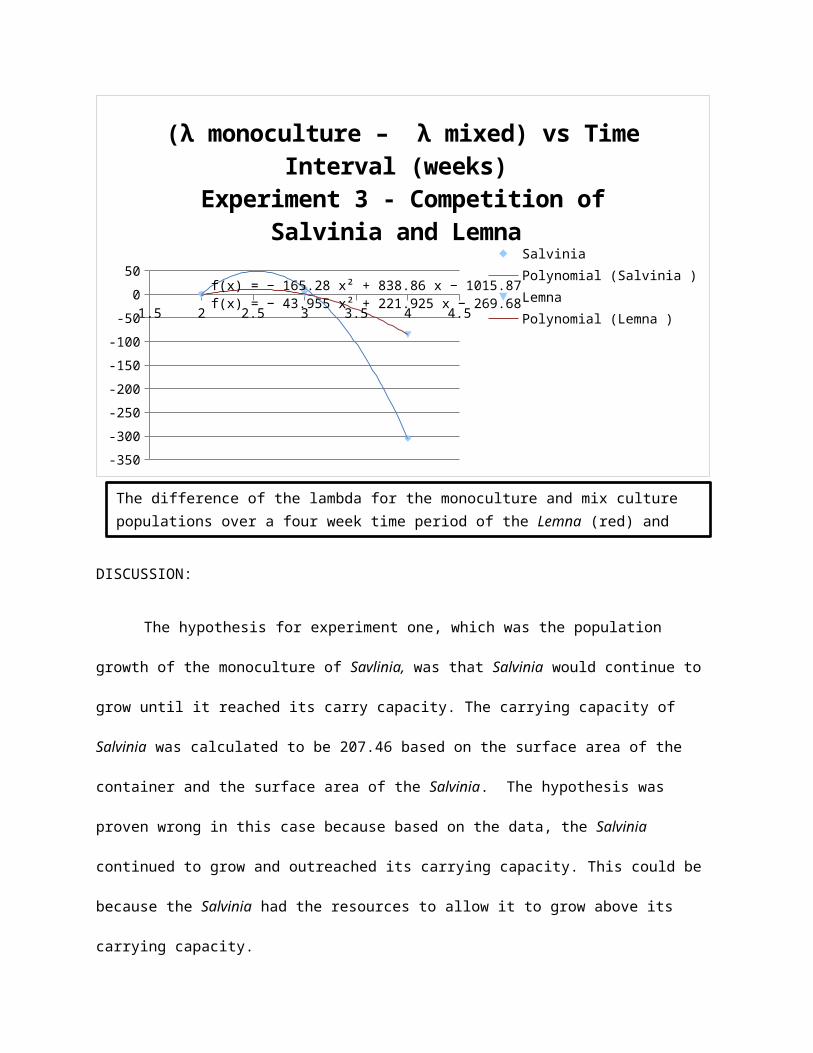
FIGURE 7
1.5 2 2.5 3 3.5 4 4.5
-350
-300
-250
-200
-150
-100
-50
0
50
f(x) = − 43.955 x² + 221.925 x − 269.68
f(x) = − 165.28 x² + 838.86 x − 1015.87
(λ monoculture – λ mixed) vs Time Interval (weeks)
Experiment 3 - Competition of Salvinia and Lemna
Salvinia Polynomial (Salvinia )Lemna Polynomial (Lemna )
DISCUSSION:
The hypothesis for experiment one, which was the population growth of the monoculture of
Savlinia, was that Salvinia would continue to grow until it reached its carry capacity. The carrying
capacity of Salvinia was calculated to be 207.46 based on the surface area of the container and the surface
area of the Salvinia. The hypothesis was proven wrong in this case because based on the data, the
Salvinia continued to grow and outreached its carrying capacity. This could be because the Salvinia had
the resources to allow it to grow above its carrying capacity.
The hypothesis of experiment three, which the competition between Lemna and Salvinia, was that
Lemna would win the competition between the two species because there are more of them and therefore
taking up more resources that will inhibit the population growth of the Salvinia. The Lemna will
eventually reach its carrying capacity and then have a stable growth rate. The hypothesis was proven
The difference of the lambda for the monoculture and mix culture populations over a four week time period of the Lemna (red) and Salvinia (blue).
wrong based on the data because the Salvinia eventually took over and out grew the Lemna. Also, the
Salvinia over grew its carrying capacity, while the Lemna never reached its carrying capacity of 1452.25.
In general, the Salvinia in both experiments continued to grow and outgrew their carrying
capacity. In experiment three the Lemna and Salvinia both continued to grow, but the Salvinia out grew
its carrying capacity of 207.46 and the Lemna never reached its carrying capacity of 1452.25. This
provides evidence that competition was taking place between Lemna and Salvinia and the Salvinia would
eventually win.
Experiment two dealt with adding nutrients, phosphorous and nitrogen, to the plants to see the
effect they had on the population growth of Lemna and Salvinia. In general, the data from this experiment
were the plants that contained the nutrients had a slower growth rate than the plant growing alone without
any nutrients added. This is associated with the concept of phytoremediation, which is when plants are
used to remove pollutants. The excessive nutrients could be a factor in the plants slower growth rate
compared to the control.
The major source of error in this experiment would be the growth of algae in the same containers
as the plants. This is a problem because in the case of the Lemna or Salvinia growing alone, the algae is
creating competition between the plant and the algae, which provided from the data, competition has an
effect on population growth. This would decrease the accuracy of the data because this experiment was
focused on the growth of the plant alone without any other factors, such as competition or nutrients
added. Furthermore, in the experiment dealing with the competition between Lemna and Salvinia, the
growth of algae would also be a factor in the population growth because it will be creating competition
between all three organisms instead of between the Salvinia and Lemna. This would also decrease the
accuracy of the data because the focus of this experiment was the population growth of just the
competition between Lemna and Salvinia.

On the other hand, this experiment has many advantages. The experiment contained many
specific controls that allowed analysis of one specific variable. The controls were the number of plants in
each container, the time and day of the week the plants were checked on, the person who took each role in
the experiment ( watering, providing the nutrient, cleaning the container, and counting the leaves), and
the pond water. This allowed for a good controlled experiment to take place allowing the dependent
variables to be analyzed more accurately with less sources of error.
A similar study was done by Richard M Harvey and Jackson L Fox where they used Lemna
minor to remove nutrients, phosphorus and nitrogen. Their study showed that nitrogen continued to
increase without Lemna present, but the percent of nitrogen removed with Lemna present decreased
dramatically over a ten day time period. The same data was obtained when looking at phosphorous; with
Lemna present, the percent of phosphorous removed decreased dramatically over a ten day period. For
this to occur, the plant has to have a high tissue- nutrient content. Although, their findings contradicted
the data of the growth rate in this experiment when the nutrients were added. They found that Lemna
doubled in frond number and area every four days (Harvey and Fox, 1973). The results from this
experiment were that the growth rate of Lemna and Salvinia was slower with nutrients added compared to
the control.
Another similar study was done by J.N Caltworthy and John L. Harper. They focused on the
competition of multiple Lemna and multiple Salvinia species. They also analyzed the population growth
rate of both plants in the same culture. They found that Salvinia had an advantage of Lemna while
growing in the same culture. They suggested that the factors that influence population growth are the
density and shortage of nutrients, amount of light, along with toxic substances (Clathworthy and Harper,
1961).
This experiment and similar experiments are important for future research because to be able to
help the environment there needs to be a clear understanding how plants grow in certain circumstances.
For pollution specifically, this research can help the future by having a better understanding on how these
specific plants absorb the nutrients. This research could lead to similar experiments dealing with other
plants to see if they have similar characteristics to Lemna and Salvinia, which could be beneficial to the
environment.
In conclusion, this experiment is important because it helps understand competition and
phytoremediation, which could be beneficial in reducing the amount of pollution in highly polluted bodies
of water and preventing the mortality of organisms. The data showed that Salvinia continued to grow in
all experiments and over grew its carrying capacity. In experiment two, the plants with nutrients had a
slower growth rate compared to their controls, and in experiment three the Salvinia and Lemna both
continued to grow, but the Lemna never reached its carrying capacity, therefore it can be inferred that the
Salvinia would eventually win.
REFERENCES
. Clatworthy, J.N., Harper, John L. 1961. The Comparative Biology of Closely Related Species Living in
the Same Area. Journal of Experimental Botany 13: 307-324
Harvey, Richard M., Fox, Jackson L. 1973 Nutrient Removal Using Lemna Minor. Water Pollution
Control Federation. 4: 1928-1938
Hass, C.A., D. Burpee, R. Meisel, and A. Ward. 2013. A Preliminary Study of the Effects of Excess
Nutrients and Interspecies Competition on Population Growth of Lemna minor and Salvinia
minima In A Laboratory Manual for Biology 220W: Populations and Communities. (Burpee, D.
and C. Hass, eds.) Department of Biology, The Pennsylvania State University, University Park,
PA. Adapated from Beiswenger, J. M. 1993. Experiments To Teach Ecology. A Project of the
Education Committee of the Ecological Society of America. Ecological Society of America,
Tempe, AZ. pp. 83-105
"INTERSPECIFIC COMPETITION." INTERSPECIFIC COMPETITION. N.p., n.d. Web. 04 Apr. 2013.
<http://www.tiem.utk.edu/~gross/bioed/bealsmodules/competition.html>.

"Lemna Minor." Lemna Minor. N.p., n.d. Web. 04 Apr. 2013.
<http://www.missouribotanicalgarden.org/gardens-gardening/your-garden/plant-finder/plant-
details/kc/a622/lemna-minor.aspx>.
"Nitrogen and Phosphorus." Chesapeake Bay Foundation. Chesapeake Bay Foundation, 2012. Web. 27
Mar. 2013. <http://www.cbf.org/how-we-save-the-bay/issues/dead-zones/nitrogen-phosphorus>.
"Salvinia Minima." Salvinia Minima. N.p., n.d. Web. 04 Apr. 2013.
<http://www.aquascapingworld.com/plantpedia/full_view_plant.php?item_id=49>.