Planning Permissions and Housing Output -...
26
Stock and Flow Planning Permissions and Housing Output January 2017 TRIP Targeted Research & Intelligence Programme
-
Upload
truongtruc -
Category
Documents
-
view
231 -
download
1
Transcript of Planning Permissions and Housing Output -...
Stock and Flow Planning Permissions and Housing OutputJanuary 2017
TRIPTargeted Research & Intelligence Programme

Executive Summary
of planning permissions – which shows that not all output is built out in the first year of construction. This means any period in which an increase in output is sought will necessitate a significant increase in permissions to deliver the required boost in supply.
Based on this, our modelling shows – ceteris paribus (and assuming the construction sector can deliver) – that the Government’s one million homes target is on track to be achieved. To do this will necessitate a stock of just under 590,000 units with permission being maintained at any one time and a flow of new permissions being maintained at around the current level.
However, to achieve a long term average of 300,000 new homes per annum, a constant stock of around 0.9–1.1m dwellings in implementable planning permissions will be required, which means increasing the rate of permissions to between 410,000–460,000 units in the short term and then sustaining at just under 400,000 long term. In this context, the LGA’s estimate of 475,000 units with permission is evidence not of land banking, but an acute shortage of permissions.
We note the current debate on possible policy levers to prevent land banking (insofar as it exists) – such as taking account of the past performance of developers and imposing conditions requiring build out rates. Both may be legitimate approaches for public sector land disposals, but in the private land market, they could be counter-productive by dis-incentivising the promotion of land. Of more practical benefit will be an effective plan-led system that drives the release of sufficient land and reduces the barriers to entry of the new and smaller players.
Pending an eagerly anticipated Housing White Paper, this research report unpacks the relationship between planning permissions and the output of new housing. Permission was granted for 261,644 new homes in 2015 in England, whilst net completions in 2015–16 amounted to 189,650 (of which 163,940 were new build), just under the 200,000 figure the Government needs to meet its target of delivering 1m homes in this Parliament.
This boost in the pipeline of planning permissions has raised questions as to why housing supply has yet to hit the Government’s annual target, let alone come close to the 300,000 dwellings per annum figure that many believe is necessary over the long term to meet need. Alongside this is the charge – fiercely contested – of ‘land banking’, whereby developers are accused of hoarding land and holding back development.
This research report looks at the business models of house builders and land promoters and relates this to the various risks inherent in bringing new homes forward through the planning system. It seeks to identify whether land banking of the sort purported is consistent with the commercial drivers of those who bring land forward for development. The conclusions are that – given the significant costs and risks involved in land promotion, construction and sales (particularly over an economic cycle) – there is unlikely to be a business case for active land banking that ‘games’ the system in order to suppress housing supply.
The report also looks at how many planning permissions are likely to be required to secure the housing supply necessary to meet long term needs. We have modelled the build profile

Stock and Flow
iii
The Review in FiguresHomes granted planning permissions in 2015
Net completions (of which 163,940 were new build)
The per annum target required to deliver 1 million homes in the current parliament
Across the stock of permissions, the percentage of dwellings expected to be completed in the first year of construction
The stock of dwellings with planning permission the LGA said in 2016 was evidence of ‘land banking’
The stock required to support annual delivery of 200,000 net additions to secure 1m homes in this Parliament
The stock required to support annual delivery of 300,000 net additions required in the long term
The flow of dwellings with new planning permissions required each year to ramp up output to 300,000 net additions per annum.
261,644189,650
200,000
50%
475,000
590,000
900,000 410,000 - 460,000

Stock and Flow
1
Back in 2009, during the financial crisis, the housebuilding sector was in significant trouble. House prices fell. Stocks plummeted. In England, planning permission was granted for just 162,204 new homes, and net completions were 128,680 (of which just 124,000 were new build)1.
Skip forward to 2016, and the picture is more healthy. Prices are recovering in most parts of the country with real house prices in some regions above the level seen before the downturn. Most housebuilders have increased their volume and are now delivering returns to shareholders. Permission was granted for 261,644 new homes in 20152, and net completions for 2015–16 amounted to 189,650 (of which 163,940 were new build),
Introduction
just under the 200,000 figure the Government needs to meet its target of delivering 1m homes in this Parliament3.
But with this recovery has come the charge of ‘landbanking’. Why, people ask, do we still have a shortage in housing supply when so many new permissions are being granted? Is it that developers are just ‘hoarding’ land with planning permission and waiting for land prices to rise to maximise profits? These accusations have been fuelled by increased media attention. Even the Government has suggested house builders have a “stranglehold” on supply4. Its response in a Housing White Paper is eagerly awaited.
1. DCLG Net Additional Dwellings Statistics
2. Home Builders Federation – New Housing Pipeline – July 2016
3. DCLG Net Additional Dwellings Statistics
4. Daily Telegraph “It's time to get building: Sajid Javid pledges to break the housebuilding logjam”, 7th November 2016

Stock and Flow
2
5. House of Lords Economic Affairs Committee: “Building more homes” 1st Report of Session 2016–17 – published 15 July 2016 – HL Paper 20. This figure is one considered necessary to improve affordability.
Even if one doesn’t believe the charge of land banking, there is still the question of how many planning permissions need to be granted to secure supply of the number of new homes required over the long term. Recent estimates put the need for homes at 300,000 dwellings per annum5.
As one of the largest independent planning consultancies, Nathaniel Lichfield & Partners (NLP) regularly confronts these issues in the work we carry out for local authorities and developers. We consider that, at its heart, the debate is undermined by insufficient understanding of the relationship between planning permissions and completions and of the commercial drivers of land promoters, house builders and other developers who bring forward land for housing development.
In this research report, we seek to unpack these issues. We explain why land banking is not rational behaviour for developers, and draw upon our experience of working with those in the development industry on specific projects and more widely to look at the important but different roles of land promoters and housebuilders. We explore why some of the previous research on this topic might have led to incorrect conclusions, and we use available data to model the number of planning permissions that would be necessary to deliver the number of homes required.

Stock and Flow
3
Factors Affecting Housing Delivery
There are two distinct factors that need to be understood in order to test the concept of land banking: 1. Securing planning permission for housing; and 2. Building homes on site. To unpack these two issues, it is necessary to be clear on key definitions, and also to understand the various factors that have an impact on whether – and how fast – sites come forward for housing. At the heart of this is a need to recognise that developing homes is a time-consuming, complex and – despite rising house prices in many areas – risky business.
What is involved in building out a housing site?To understand the relationship between land and housing development, one needs first of all to distil the stages involved in taking a piece of land and being able to build and then sell houses on it, as illustrated in Figure 1. At each stage there is an element of risk, and it evolves from land promotion activity towards the building and sale of new homes.
Although many house builders do promote their own ‘strategic’ land, they also rely on acquisition of land with an allocation or a planning permission that has first been secured by land promoter developers – organisations specialising in managing the planning and land risks inherent in taking sites through the
What is land banking?All house builders need a land bank – that is, a supply of land that they have assembled and then secured a planning permission on for new homes.
The common definition of ‘land banking’ in a planning and development context6 is the charge that developers who control land are choosing not to promote or build out sites, and instead sitting back and watching the value of the land grow, before eventually building new homes, or selling the site on at an inflated price to another party. In some cases, developers are accused of sitting on an asset interminably. Developers, however, argue there is no business rationale to sit on land without developing it.
A nuance to the charge of land banking, is the accusation that developers are choosing to build new homes on sites more slowly than they otherwise could in an attempt to drive up home values in the local area and thus increase margins. House builders tend to respond that they are ‘price takers’ rather than ‘price setters’.
6. ‘Land banking’ can also refer to investment schemes run by land banking companies who divide land into smaller plots to sell it to investors on the basis that once it is available for development it will increase in value. This definition is not relevant to this research.
Source: NLP analysis
LAND
PR
OM
OTIO
NHO
US
E BU
ILDIN
GKey Activity
!
!
!
!
Planning Risk
Land Disposal Risks
Construction Risks
Sales Risks
Establishing the principle of development
Securing a detailed planning approval
Opening up the site and putting in infrastructure
Construction of homes
Sale of completed homes
planning system. So, in looking at the process in Figure 1, for many sites there will be a transfer of ownership or control (from a land promoter to a house builder) a process which itself carries an element of commercial risk for both parties.
Figure 1: Stages of the Development Process

Stock and Flow
4
The complicated process by which homes are planned and built is underpinned at many stages by contracts. There are those contracts that relate to promoting the land to secure the best (market) price for the land, and there are those contracts that purchase land in order to build homes. These contracts, determined by the market, create commercial pressures and incentives to bring land forward and to build homes.
We explore the issues and key risks surrounding these stages below. It is worth emphasising that whilst there are some common features across the industry, no developer is the same; each has its own business model and drivers, so there will always be exceptions and distinct approaches.
Establishing the principle and securing a planning approvalTo build on land, one needs planning permission, with all details approved and pre-commencement conditions discharged. Despite numerous attempts by Government to streamline the system, securing a planning permission remains a risk for most sites, and carries significant cost.
Some analysis on alleged land banking has referred to the ‘strategic land banks’ of developers7 but it is important to be clear that this is generally not land that the developer has any immediate prospect of developing – although, of course, some sites may have short-term prospects such as in places without a five year land supply (although this is often contested) – and it is thus not being ‘hoarded’ or held back if it is not being developed. It is land that the developer has an option or other equivalent agreement with the landowner to promote for development. It can only be developed if a local authority agrees to allocate the land and/or grant planning permission. And for the vast majority of the sites in these strategic land banks, it will prove extremely difficult and costly to move through the planning process. For many sites, they will not be successful at all.
Thus the decision by a developer on whether and how vigorously to promote a site has to be justified by a realistic view on its planning risks and
prospects. Simply having an option is no guarantee it can be developed, which is why perceptions of ‘land banking’ based on site of size of ‘strategic land banks’ or land ‘under option’ are not accurate. Strategic Housing Land Availability Assessments will often appraise sites and conclude that, in the local authority’s view, it is not suitable for development. It is rare that a local authority finds it has insufficient sites put forward by developers from which to chose for inclusion in its plan.
The process generally starts with the need for an allocation as a development site in a Local Plan – although there are alternative beginnings such as prioritising those places without a five year land supply, which dramatically reduces planning risk. To be allocated, a site has to be promoted and the local authority has to select it as one it wishes to see developed. Failing that, a developer must challenge the local plan through the various stages of consultation, and then, ultimately, at an Examination in Public (EIP). It is widely recognised that the Local Plan process takes far too long8, and even now – over four years on from the NPPF – just one third of local authorities outside London have an up-to-date Local Plan9. The cost to developers of engaging with a long drawn out plan process – including successive rounds of consultations (at Regulation 18 and 19 stage) and then with the EIP process – can be a significant one, and with no certainty that they will be successful in securing an allocation.
Even if a site is allocated in a local plan, this does not guarantee a planning permission10. And securing permission carries with it costs and timescales.
There are two routes to securing planning permission:
1. detailed planning application; or
2. outline planning followed by reserved matters.
For large sites, a hybrid between the two also exists, where a planning application can be made with an early phase worked up in detail, and the remainder in outline.
7. An example is at http://blog.shelter.org.uk/2016/12/land-banking-whats-the-story-part-1/
8. For example, the analysis by the Local Plans Expert Group www.lpeg.org.uk
9. Source: Planning Inspectorate (PINS) data, analysed by NLP
10. A famous example is the refusal by Northampton Borough Council of a planning application for 1,000 dwellings on the Northampton South Sustainable Urban Extension, refused in February 2015 despite it being allocated in a the recently adopted West Northamptonshire Joint Core Strategy adopted in December 2014. A subsequent appeal was allowed by the Secretary of State in August 2016, with an award of costs (APP/V2825/W/15/3028151).

Stock and Flow
5
Depending on the location and size of the site, a significant body of technical evidence and other work needs to be provided with the application. Pre-application discussions are necessary. For larger sites and those in more sensitive locations, an Environmental Impact Assessment will be required. For these reasons, the timescales involved in preparing large complex applications will often extend to many months, with associated costs.
Planning permissions can of course be refused11, in many cases based on reasonable planning judgements made by a planning officer. But in some cases decisions are made – unexpectedly – against officer recommendations. Any requirement to challenge a refusal of planning permission at appeal carries further cost and will extend timescales further12, again without certainty of success.
Once planning permission is granted, pre-commencement conditions need to be discharged before building can start on site. These can often generate weeks or even months of work.
How long does all of this take? This will vary. Our recent research – From Start to Finish13 – found that it took on average 3.9 years from first identification of the site in a draft local planning document to get to a submission of an initial planning application. And once applications are submitted, the bigger the site, the longer it takes to secure a permission.
On average, sites of between 100 and 499 units took just under 2.5 years between application submission and permission, while sites of over 2,000 units needed around six years. This is unsurprising: larger sites are complicated, and the biggest may have more than one developer on site which complicates matters. However, the time taken is significant and costly.
Smaller sites are quicker, but there is still a lead-in time from permission being granted to the first completion on site. This is the period during which pre-commencement conditions are discharged, and – in some cases – when sites are sold by or via the ‘land promoter’ (who has taken the planning risk) to a house builder, who might then need to ‘re-plan’ to secure a permission that fits its product. Some sites need significant up-front infrastructure – such as access roads – with associated construction cost risks. Combined, this takes on average just under two years for sites of between 100 and 499 units.
At every stage, this process of securing an implementable planning permission requires investment – with no guarantee of a return (until, arguably, full planning permission is granted) – and time – with the prospect that economic/market cycles will increase risk of a downturn.
Only some developers have the risk appetite to engage in this process, with all its uncertainties. And this is where the land promoters are invaluable. They may not build homes themselves, but they bring land forward for development in circumstances where house builders may not.
How quickly do sites build out?Our research on large-scale housing site delivery found that build rates are based on assumptions around market absorption rates, and then influenced by a numerous, site-related factors:
1. Site size is positively correlated with annual delivery – larger sites deliver more homes per year than smaller sites (see Figure 2). Each sales outlet on a development will typically generate 30–40 sales per annum, depending on the market, so the more outlets (with differential brands and types of product) on a site, the greater the number of sales, although this is not a ‘straight line’ relationship: our research found that site of 2,000 units will deliver two and a half times as many completions as a site of 500 units, rather than four times the number. The ability to have multiple outlets and developers will be influenced by the size, form and housing mix of the development. Larger sites may also indicate those places where demand is higher which will increase the absorption rate meaning homes are built quicker.
2. Sites with higher rates of affordable housing (or potentially other types of tenure) are associated with greater build rates (See Figure 3). While worth less per unit than a full-market property, affordable housing clearly taps into a different customer segment (not displacing market demand), and a different customer purchasing multiple properties can support cash flow and may decrease risk;
3. Markets Matter – places outside of London that have higher land values have, on average, higher annual delivery (See Figure 4). Relatively weaker areas may not be able generate the higher build-out rates.
11. 20% of ‘major’ planning applications for residential development were refused in the year ending June 2016. Source: PINS data.
12. The latest PINS date indicates the average appeal period involving public inquires is 43 weeks to secure a decision, with some appeals taking longer, particularly if recovered by the Secretary of State.
13. Nathaniel Lichfield & Partners (2016) Start to Finish: How Quickly do Large-Scale Housing Sites Deliver? http://nlpplanning.com/uploads/ffiles/2016/11/649353.pdf

Stock and Flow
6
Source: NLP analysis and CLG Post-permission residential land value estimates (£/ha) by Local Authorities (February 2015)
Figure 4: Average Annual Build-out Rates of sites compared to Land Values as at 2014
Land value (£m/ha)
Hou
sing
del
iver
y (u
nits
per
yea
r)
00
50
100
150
200
250
300
350
1 2 3 4 5 6
Site size (units)
Hou
sing
del
iver
y (u
nits
per
yea
r)
0-99
100-499
500-999
1,000-1,499
1,500-1,9992,000+
0
20
40
60
80
100
120
160
180
140
Figure 3: Affordable housing provision and housing outputFigure 2: Average annual build rate by site size
Source: NLP analysisSource: NLP analysis
Affordable housing on site (%)
Hou
sing
del
iver
y (u
nits
per
yea
r)
10-1920-29
30-3940+
0
20
40
60
80
100
120
140
160

Stock and Flow
7
face pressure on the factors that will give the landowner the highest price: higher densities, reduced development costs, and achieving good sales revenues consistent with the local market and absorption rates.
It is this – the assumed sales rates and values that sustain the price paid for the land – that is important. And it explains why house builders will rarely have the option of building out sites more quickly than the natural absorption rate for their product on that site. If a company sought to increase its supply of homes on a site faster than the rate consistent with market values, it would either:
• Not secure land in the face of competition from other house builders; or
• Have sales values inconsistent with its agreed land price, thus eroding its site margins. If this happened consistently across a business, this reduces the margin of cover each site provides for the portfolio in case of build cost overruns which will hit confidence and share prices, which in turn reduces the amount it can investment in acquiring land.
This does not of course mean there is a limit on the amount of private house building that can take place or that prices can never be affected by supply. Releasing more sites for development will in many locations increase competitive pressures in local land markets and moderate land values (as we explore later in this report) and in turn help to stabilise house price inflation.
Why can’t developers reduce their sales prices and build out more quickly?As it stands, a house builder who sought to achieve this would find it difficult to secure sufficient land.
This is because house builders typically use the residual land value model as the basis for competing to secure development land from landowners/land promoters. A house builder estimates the number of homes that could be built on site – alongside other community and infrastructure provisions – and the price at which these homes could be sold – which is set by the second hand market plus any new build premium.
The developer then estimates development costs (e.g. construction) and profit (which will reflect the risk of developing a site over several years). On sites built out over a longer term period and those requiring up-front infrastructure or remediation works, there are costs of capital. The profit level per site (typically assumed to be 20–25% of Gross Development Value) needs to reflect the risks associated with each site, and also the fact that the developer has costs – for example on abortive work promoting other sites that are unsuccessful in securing planning permission – to cover.
If there is value left (a residual), this is the maximum amount offered to a landowner to purchase the site. Because house builders often secure land in competition and/or are negotiating with well-informed landowners, they will often
Stock and Flow
8
Is there a business case for developers to land bank in reality?
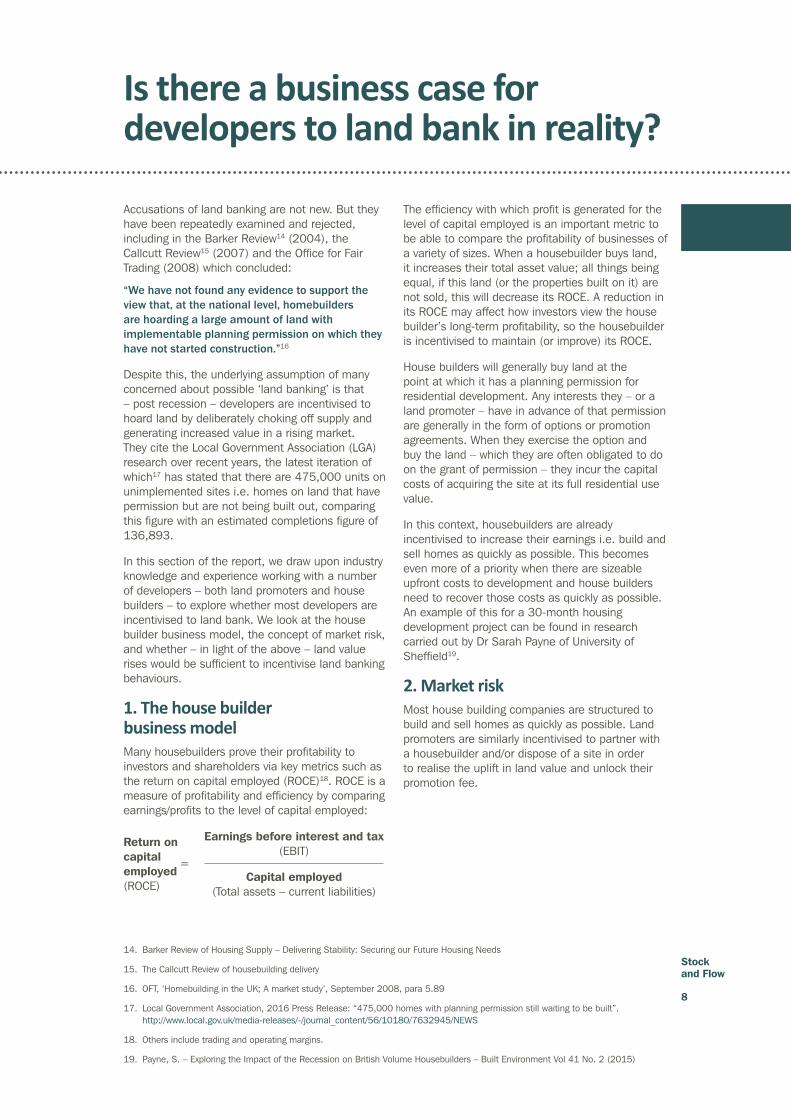
Accusations of land banking are not new. But they have been repeatedly examined and rejected, including in the Barker Review14 (2004), the Callcutt Review15 (2007) and the Office for Fair Trading (2008) which concluded:
“We have not found any evidence to support the view that, at the national level, homebuilders are hoarding a large amount of land with implementable planning permission on which they have not started construction.”16
Despite this, the underlying assumption of many concerned about possible ‘land banking’ is that – post recession – developers are incentivised to hoard land by deliberately choking off supply and generating increased value in a rising market. They cite the Local Government Association (LGA) research over recent years, the latest iteration of which17 has stated that there are 475,000 units on unimplemented sites i.e. homes on land that have permission but are not being built out, comparing this figure with an estimated completions figure of 136,893.
In this section of the report, we draw upon industry knowledge and experience working with a number of developers – both land promoters and house builders – to explore whether most developers are incentivised to land bank. We look at the house builder business model, the concept of market risk, and whether – in light of the above – land value rises would be sufficient to incentivise land banking behaviours.
1. The house builder business modelMany housebuilders prove their profitability to investors and shareholders via key metrics such as the return on capital employed (ROCE)18. ROCE is a measure of profitability and efficiency by comparing earnings/profits to the level of capital employed:
The efficiency with which profit is generated for the level of capital employed is an important metric to be able to compare the profitability of businesses of a variety of sizes. When a housebuilder buys land, it increases their total asset value; all things being equal, if this land (or the properties built on it) are not sold, this will decrease its ROCE. A reduction in its ROCE may affect how investors view the house builder’s long-term profitability, so the housebuilder is incentivised to maintain (or improve) its ROCE.
House builders will generally buy land at the point at which it has a planning permission for residential development. Any interests they – or a land promoter – have in advance of that permission are generally in the form of options or promotion agreements. When they exercise the option and buy the land – which they are often obligated to do on the grant of permission – they incur the capital costs of acquiring the site at its full residential use value.
In this context, housebuilders are already incentivised to increase their earnings i.e. build and sell homes as quickly as possible. This becomes even more of a priority when there are sizeable upfront costs to development and house builders need to recover those costs as quickly as possible. An example of this for a 30-month housing development project can be found in research carried out by Dr Sarah Payne of University of Sheffield19.
2. Market riskMost house building companies are structured to build and sell homes as quickly as possible. Land promoters are similarly incentivised to partner with a housebuilder and/or dispose of a site in order to realise the uplift in land value and unlock their promotion fee.
Earnings before interest and tax (EBIT)
Capital employed (Total assets – current liabilities)
Return on capital employed (ROCE)
=
14. Barker Review of Housing Supply – Delivering Stability: Securing our Future Housing Needs
15. The Callcutt Review of housebuilding delivery
16. OFT, ‘Homebuilding in the UK; A market study’, September 2008, para 5.89
17. Local Government Association, 2016 Press Release: “475,000 homes with planning permission still waiting to be built”. http://www.local.gov.uk/media-releases/-/journal_content/56/10180/7632945/NEWS
18. Others include trading and operating margins.
19. Payne, S. – Exploring the Impact of the Recession on British Volume Housebuilders – Built Environment Vol 41 No. 2 (2015)
Stock and Flow
9
The risk of investing significant amounts of capital into land and planning fees (over an extended period of time as illustrated in the previous section) and not selling the land (or homes that sit on it) is significant. Depending on the size of the site, planning and development can take many years – the larger or more complex the site, the longer to completion and the higher the chance of the development coinciding with an economic downturn. To mitigate this risk, larger sites are bought on deferred terms and with tranche drawdown, but investment is significant.
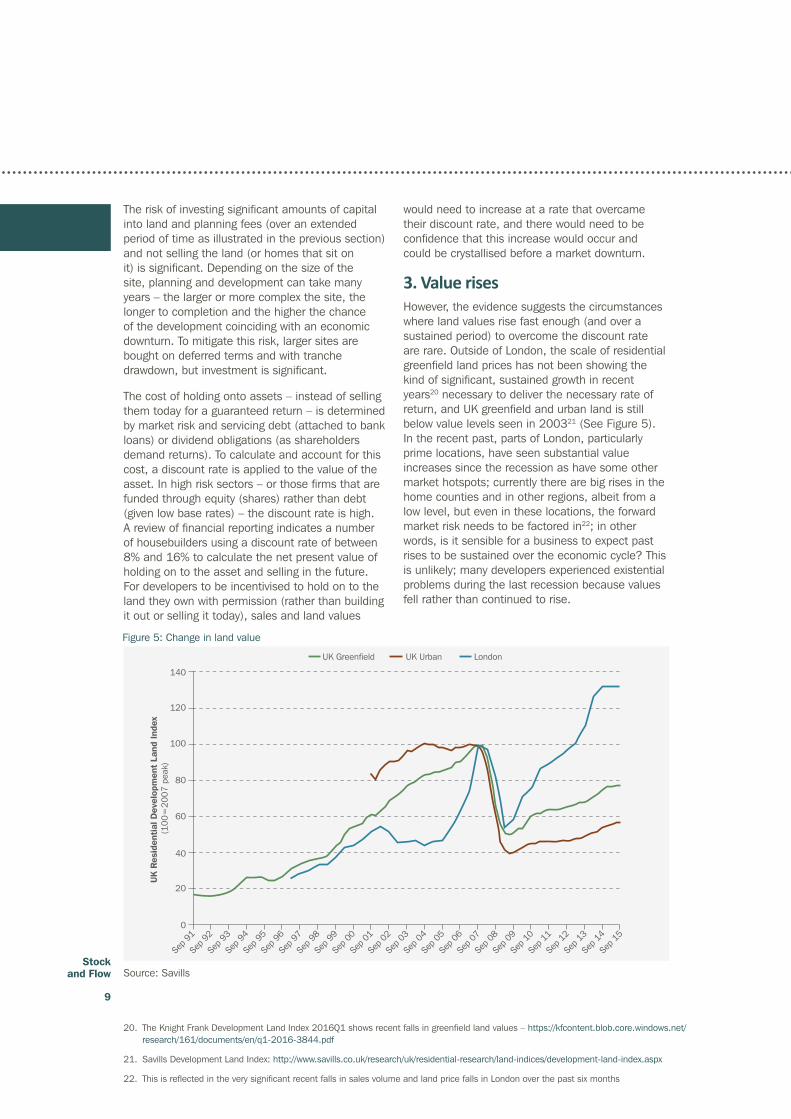
The cost of holding onto assets – instead of selling them today for a guaranteed return – is determined by market risk and servicing debt (attached to bank loans) or dividend obligations (as shareholders demand returns). To calculate and account for this cost, a discount rate is applied to the value of the asset. In high risk sectors – or those firms that are funded through equity (shares) rather than debt (given low base rates) – the discount rate is high. A review of financial reporting indicates a number of housebuilders using a discount rate of between 8% and 16% to calculate the net present value of holding on to the asset and selling in the future. For developers to be incentivised to hold on to the land they own with permission (rather than building it out or selling it today), sales and land values
Source: Savills
20. The Knight Frank Development Land Index 2016Q1 shows recent falls in greenfield land values – https://kfcontent.blob.core.windows.net/research/161/documents/en/q1-2016-3844.pdf
21. Savills Development Land Index: http://www.savills.co.uk/research/uk/residential-research/land-indices/development-land-index.aspx
22. This is reflected in the very significant recent falls in sales volume and land price falls in London over the past six months
Figure 5: Change in land value
140
120
100
80
60
40
UK
Res
iden
tial
Dev
elop
men
t La
nd In
dex
(100
=20
07 p
eak)
UK Greenfield UK Urban London
20
0
Sep 9
1
Sep 9
2
Sep 9
3
Sep 9
4
Sep 9
5
Sep 9
6
Sep 9
7
Sep 9
9
Sep 9
8
Sep 0
0
Sep 0
1
Sep 0
2
Sep 0
3
Sep 0
4
Sep 0
5
Sep 0
6
Sep 0
7
Sep 0
8
Sep 0
9
Sep 1
0
Sep 1
1
Sep 1
2
Sep 1
3
Sep 1
4
Sep 1
5
would need to increase at a rate that overcame their discount rate, and there would need to be confidence that this increase would occur and could be crystallised before a market downturn.
3. Value risesHowever, the evidence suggests the circumstances where land values rise fast enough (and over a sustained period) to overcome the discount rate are rare. Outside of London, the scale of residential greenfield land prices has not been showing the kind of significant, sustained growth in recent years20 necessary to deliver the necessary rate of return, and UK greenfield and urban land is still below value levels seen in 200321 (See Figure 5). In the recent past, parts of London, particularly prime locations, have seen substantial value increases since the recession as have some other market hotspots; currently there are big rises in the home counties and in other regions, albeit from a low level, but even in these locations, the forward market risk needs to be factored in22; in other words, is it sensible for a business to expect past rises to be sustained over the economic cycle? This is unlikely; many developers experienced existential problems during the last recession because values fell rather than continued to rise.

Stock and Flow
10
4. What about non-house builders?Of course, not all planning permissions are sought by those who actually construct and sell homes.
Many allocations are sought and planning applications are submitted in order to establish the principle of residential development on a site, often in the form of outline planning applications, where detailed matters are reserved to be dealt with later. This allows the applicant and the local planning authority to focus determination on whether the principle of residential development is acceptable, taking account of the existing circumstances of the site (for example it might be allocated for a different use, such as employment, or sit outside existing settlement limits) before then looking at the detailed design of the proposal. If an outline permission is granted, further work (and detailed approvals) will still be needed before development can commence. In many cases, this is only done once the site (in whole or a specific phase) has been sold or transferred to a house builder which will have its own design approaches and products.
It is tackling these up-front strategic planning issues – through local plans and outline applications – where land promoters play their vital role. They operate in the land market differently to house builders. Land promoters derive their return from the granting of permission achieving a residential land value (with profit reflecting planning and land disposal risk) rather than the margin on the sale of houses (construction and sales risk). Although a lot of debate focuses on the housebuilders – most of whom do promote some of their land through planning – there is a very significant role for land promoters23 in absorbing this up-front risk and bringing land to the market.
Analysis by NLP of Glenigan data for sites outside London with ‘live’ outline planning permission shows that just 21% of units with outline permission are on sites of over 100 units where permission was obtained by volume house builders. Interestingly, the public sector itself (such as the HCA, NHS Trusts) has 15% of ‘live’ outline permissions. Well over half of units with outline permission were secured by non-house builders with the intention to sell to a house builder. If these land promoters did not bring forward land through outline permissions there is a real possibility that the flow of land for development would diminish.
23. Generally a mixture land owners, developers, institutions and land promoters
24. Typically via an option or a promotion agreement (or sometimes a hybrid of the two)
Land promoters are similarly motivated to convert their outline permission into an implementable scheme (or for the site or phases to be sold to a house builder and be built out) because this is what triggers a realisation of the residential land value, and their percentage share of it. For the land promoters, their return will depend on what basis they have agreed to promote the land for the landowner24. Most agreements between landowners and land promoters require regular monitoring and review of promotion strategies to ensure the land is being actively pursued in pursuit of an implementable planning permission, where there are good prospects of securing this.
Whether it is an option or a promotion agreement (or a hybrid), the land promoter will have born the risk of the significant costs necessary to secure that permission (as identified in Section 2.0), and they will thus want a return that they can then recycle to invest in promoting further projects. Unless there has been an unrealistic expectation of land value increase at the outset (such that the landowner is no longer willing to sell), trends in the land market (as identified above) do not support the concept that land promoters would take the risk of waiting for land values to rise in the medium to long term rather than realise a return in the short term.
There are of course circumstances in which planning permissions lapse and are not implemented – which we discuss in the next section – but this does not generally arise from a deliberate decision to hoard land in anticipation of the land rising in value over time. However, there are undoubtedly some circumstances in which permissions are sought without the intention to develop that specific permission:
1. Where a landowner (generally in an urban context) applies for a planning permission for residential development to increase the ‘book value’ of their land or premises to use this as security for a loan to invest in their own business.
2. Where a landowner secures a planning permission in order to establish the principle of residential development on site but the intention of trading this site to a developer with the expectation that they will re-engineer the scheme to increase its value – for example, by adopting a different design or increasing densities. The research by the Mayor of London suggests higher lapse rates in the capital may be explained by this.

Stock and Flow
11

Stock and Flow
12
Permissions, lapse rates and output
There have been attempts to suggest – notwithstanding the factors identified in the preceding sections – that developers are simply hoarding permissions and land. The LGA research referred to earlier has over successive years identified a stock of 475,000 housing units on unimplemented sites i.e. homes on land that have permission but are not being built out.
We explore the relationship between planning permissions and housing output below, but there are two observations to be made here on the 475,000 figure:
1. Even if it did not have any methodology issues, it is actually a relatively small number considering the number of homes built each year, the length of time the variety of sites take to develop, and the number of sites in the pipeline required to signal to investors that developers are worth investing in; and
2. At the time it was calculated, it was certainly an overestimate because of how the data is collected. The data comes from Glenigan – a company that collects data on sites at planning and contract stages, but does not monitored actual completions. As a result, ‘unimplemented’ here refers to units on sites where either the entire site has not been fully developed or the planning permission has lapsed. As a result, a site which has built 99% of homes would show up in the LGA’s analysis as 100% of units being ‘unimplemented’.
Recent analysis by Civitas used stock analysis comparing the number of units with planning permission and housing starts on site. While this – and the LGA work – produced newsworthy headlines by demonstrating a perceived ‘gap’ between permissions and starts, it did not cater for a number of issues:
1. Recognised lapse rates
2. Time periods between a new permission being granted and when a site can practically be started.
The time required to plan and deliver homes depends on a variety of factors – site size; site location; planning policy; planning obligations; market cycles; investment appetite; and political priorities, to name a few. As there are so many factors, it is important to recognise the difference between the stock and flow of planning permissions and starts on site.
In this section we explore the existing evidence surrounding the relationship between planning permissions and starts and completions on site, beginning with lapse rates.
Lapse RatesIt is generally accepted that for a variety of legitimate reasons, not every home that gets planning permission will be built. As such it is not realistic or appropriate to expect that 100% of homes will be delivered from 100% of planning permission granted in any given location.
Planning permissions can lapse for a number of reasons including:
• an existing occupier of the land/building sought planning permission for reasons other than to build out the site;
• the landowner cannot get the price for the site that will justify the disposal of the asset;
• a developer cannot secure finance or meet the terms of an option;
• the development is not considered to be financially worthwhile;
• the priorities of a landowner/developer may change;
• the site is sold to a new developer who wants to re-plan the proposal requiring a new permission; and
• pre-commencement conditions take longer than anticipated to discharge.
At the national level, the Department for Communities and Local Government has identified25
a 30–40% gap between planning permissions granted for housing and housing starts on site. They suggest that 10–20% of permissions do not materialise into a start on site at all and, in addition, an estimated 15–20% of permissions are re-engineered with a permission re-sought, which would have the effect of delaying completions and increasing the overall lead in time of the scheme and potentially altering the total number of dwellings delivered.
25. DCLG Presentations to the HBF Planning Conference (September 2015)

Stock and Flow
13
However, this national position is undoubtedly skewed by the very high lapse rates which occur in London. Research for the GLA in 201426 looked at sites of 20 dwellings or more and reported that only about half of the total number of dwellings granted planning permission every year are built; a lapse rate of circa 50% across London. Similar analysis was also considered in the London SHLAA (2013) which identified that completions ran at only circa 42% of (all) permissions over the period 2004–2012 and remained steady over the period 2008–2012. This would indicate a lapse rates of more than 50%. Both of these findings referred to by the Inspector reporting on the Further Alterations to the London Plan highlighting that it is delivery which is critical to meeting the pressing need for new housing in London. He goes on to state “It is not enough to grant planning permissions, homes have to be built…”
Stock and FlowAs a result of the numerous factors affecting planning and development timescales, it is important to look at the flow – rather than stock – of permissions and output. As confidence within the sector grows and developers feel secure to take on planning and development risk, applications and permissions have increased. Some commentators have pointed to the number of ‘starts’ being lower than the number of new permissions being granted (see Figure 6).
26. Molier: Barriers to Housing Delivery – Update of July 2014
Figure 6: New units with permission and starts on site in each year from 2011-2015
Source: DCLG; HBF/Glenigan; NLP analysis
0
50,000
100,000
150,000
200,000
250,000
300,000
2011 2012 2013 2014 2015
Uni
ts p
er y
ear
Units with permission (England) Starts

Stock and Flow
14
However, in addition to the point about lapse rates, while entire sites (and their units) are granted permission in one year, development of the site will not occur in the same year (given lead-in times) and may happen over a number of years, given the size site and the number of outlets on the development.
To consider this issue further, NLP has reviewed data on planning permissions held by Glenigan. This live project database holds a total of over 80,000 live projects of which around 40,000 projects were eligible to be used for this analysis. Our analysis includes the ‘live’ sites with full detailed planning permission and those sites with agreed reserved matters. The Glenigan database identifies a contract start date for its live projects which for this analysis is taken as the proxy for the year when a permission will begin delivering completed
homes. To this start-date we have then applied the projected rate of delivery to the number of new homes for which the detailed permission provides based on rates identified in NLP’s research – Start to Finish – to which we have previously referred. Based on the sizes of permissions (in which larger permissions will typically have contracts extending over more than one year), and a notional lapse rate, this creates a ‘trajectory’ of actual housing delivery for any given stock of permissions granted. This is highly likely to be a ‘best case’ in that not all permissions that get implemented will necessarily start at the beginning of the year immediately following the grant of permission, which is the assumption we make here.
Figure 7 (below) shows the notional trajectory – using our assumptions above – of the actual number of units with permission in 2015.
Figure 7: New annual permitted units and projected output
Source: Glenigan; NLP analysis
What this shows is that for any 100,000 dwellings granted permission and which do not lapse, just c.50,000 could be expected to be completed in year one of the development, c.25,000 in year two, c.14,000 in year three and so on. This reflects that for over half of all units with permission, they are on sites that are expected to build out over more than one year. Thus a year’s worth of permissions would inevitably not translate into the same number of
housing completions the following year, but would result in a staggered output as the larger sites are built out.
In light of the above, the next section of this report considers what this means for a notional national housing trajectory if we are to meet current and prospective targets for new housing supply.
0
50,000
100,000
150,000
200,000
250,000
300,000
2015 2016 2017 2018 2019 2020 Post-2020
Unitsgranted
permissionOutput Lapsed
Uni
ts

Stock and Flow
15
How many permissions are needed to build the number of homes we need?
Central to the current housing debate is the undersupply of homes – we are not building enough homes to keep up with demand. Given the complexity, variation and inherent risk of planning and building homes, it is vital to understand that if we want to increase the number of homes built each year, the number of permissions also needs to increase. To do this we need to move away from simplistic comparisons of the number of permissions with either starts or completions in any given year.
Using a more sophisticated flow model of permissions and output in order to determine the correlation – where permissions is the ‘live’ number of permissions calculated by adding the number of units with new permission granted in that year plus any unbuilt permissions from previous years; and output is the assumed housing delivery based on an equal number of homes built in each year of the contract period – we can estimate the number of ‘live’ permissions required to build a certain number of homes.
Because planning permission and housing delivery requires analysis of flow rather than stock, the question of how many new, additional homes need to be granted permission each year in order to reach a certain target (and indeed of the total stock of permissions required) is a function not just of permissions granted that year, but the stock of extant permissions from previous years, the build out of units from those permissions, and the expiry of permissions (the lapse rate).
Covering the period 2016 to 2025, we have explored two scenarios:
1. Meeting the current ‘target’ of delivering 1 million homes during this Parliament (2015–2020), before then increasing output to achieve 300,000 net additional dwellings per annum by 2023 and maintaining it thereafter. This equates to an average of 245,000 net additions per annum over the ten year period, slightly above the 219,000 figure implied by current household projections27.
2. Achieving 300,000 dwellings per annum over the period 2016–2025 – the figure identified as necessary by the House of Lords Economic Affairs Committee, with stepped increases up from 200,000 per annum in 2016 to averages of 360,000 per annum from 2023–25.
Both scenarios assume a long term average rate of net additional dwelling completions beyond 2025 of 300,000 per annum. Both scenarios assume a conservative, notional lapse rate of 25%, that demolitions continue at 10,420 per annum (as per the most recent year), and that permitted development completions continue at the current rate of 30,600 for three years before reducing down to 20,000 per annum by 2020 and sticking at that rate. The modest under-supply against the 200,000 target in 2015 is assumed to be made up by 2020.
The output is influenced by what has been granted in previous years, so the total number of units granted permission since 2011 is applied in the model (see Table 1). By virtue of the trajectory identified in the preceding section, sites granted permission in 2011 will generate their fifth year of output in 2016.
27. 2014-based household projections which show household growth of 210,000 by 2037, which with an assumed vacancy and second homes rate equates to 219,000 dwellings per annum.
Table 1: Number of dwellings granted permission
Year Dwellings
2008 219,849
2009 162,204
2010 178,917
2011 176,209
2012 195,300
2013 217,488
2014 239,310
2015 261,644
Source: DCLG
The results of the modelling are shown in Table 2 below and illustrated on the two charts in Figures 8 and 9.

Stock and Flow
16
Table 2: Trajectory of Permissions and Output (000s)
Scenario Average Stock Additions 20
16
2017
2018
2019
2020
2021
2022
2023
2024
2025
1 245
New Permissions
220 245 240 318 346 375 409 375 377 379
Stock of Permissions
559 576 576 648 729 807 896 907 913 914
Net New Homes Built
208 200 200 200 225 250 275 300 300 300
2300
New Permissions
286 343 369 415 442 474 469 456 458 302
Stock of Permissions
625 714 794 888 973 1,052 1,094 1,102 1,105 944
Net New Homes Built
208 225 250 275 300 325 350 360 360 360
Source: NLP analysis
Source: NLP analysis
Source: NLP analysis
Figure 8: Trajectory of Permissions and Output – Scenario 1
Figure 9: Trajectory of Permissions and Output – Scenario 2
-
200,000
400,000
600,000
800,000
1,000,000
2016 2017 2018 2019 2020 2021 2022 2023 2024 2025
Year 1 Output Year 3 Output Year 5 Output
Year 2 Output Year 4 Output Conversions, PD, demolitions
New Permissions Total Stock of Permissions
-
200,000
400,000
600,000
800,000
1,000,000
1,200,000
2016 2017 2018 2019 2020 2021 2022 2023 2024 2025
Year 1 Output Year 3 Output Year 5 OutputYear 2 Output Year 4 Output Conversions,
PD, demolitionsNew Permissions Total Stock of Permissions
Stock and Flow
17
Scenario 1 shows that for the Government to reach its target of 200,000 homes each year by 2020 and then increase the rate towards a long term average of 300,000 by 2023 (with an average over this ten year period of 245,000), the annual flow of permissions will need be sustained at over 240,000 dwellings over the next couple of years, and then increase to around 410,000 by 2022 before stabilising at around 380,000. This is necessary to maintain a total stock of live implementable permissions of around 900,000 dwellings.
Scenario 2 shows that to ramp up output to an average of 300,000 per annum over the 2015–2025 the flow of permissions will need to increase gradually to around 460,000 dwellings per annum, reflecting an increase to achieve 300,000 net additions by 2020, and then a further increase to 360,000 by 2023. The total stock of permissions would need to be maintained at 1.1m before gradually reducing around 900,000 to maintain the 300,000 long term average.
A key finding from our modelling is that the actual figure of 163,940 of new build completions achieved in 2015/16 (which with other sources of supply, equated to 189,650 net additions) is strikingly comparable to the number of units our modelling of permissions granted in the five year prior projected for that year (166,219). Further, with permissions granted for 239,310 new build dwellings in 2014 and 261,644 in 2015, there is good reason to be confident – all things being equal (and assuming the construction sector can deliver) – of achieving the Government’s one million
homes target during this Parliament. Maintaining this will however necessitate a stock of permissions equivalent to around 590,000 dwellings.
What a stock and flow analysis will reveal is that as the number of permissions grows in response to an economic recovery, there is a natural lag before this translates to completions on the ground. Moreover, if there is a deliberate effort made to increase housing output – say, to 300,000 dwellings per annum, this will require a significant increase in permissions being granted to achieve this, with the ratio of annual completions to permissions in each year reducing (e.g. to 0.66) before it increases to a long term equilibrium of 0.8 necessary to sustain 300,000 dwellings per annum. This is illustrated for the two scenarios in Figures 10 and 11 below.
Figure 11 also illustrates (purely hypothetically) how a sharp reduction in output (for example, due in Scenario 2 to a reduction in output from 360,000 down to a long term average of 300,000 after 2025 would sharply increase the ratio to 1.2 as the need for new permissions in that year reduces.
Finally, given the total stock of permissions that is implied by both trajectories – of 0.9m to 1.1m – there is a need to be much more realistic about how many permissions should be maintained to ensure a steady flow of supply. The LGA figure of 475,000 dwellings is not, as suggested, evidence of landbanking, but evidence of the need for many more permissions to be granted.

Stock and Flow
18
Source: NLP analysis
Figure 11: Ratio of Net Additions to Permissions – Scenario 2
0.00
0.20
0.40
0.60
0.80
1.00
1.20
1.40
0
2008
2009
2010
2011
2012
2013
2014
2015
2016
2017
2018
2019
2020
2021
2022
2023
2024
2025
100,000
200,000
300,000
400,000
500,000
Rat
io o
f P
erm
issi
on
to N
et C
ompl
etio
ns
Num
ber
of D
wel
lings
Output Permissions (actual)Permissions (modelled) Ratio of Net Additions to Permissions
Figure 10: Ratio of Net Additions to Permissions – Scenario 1
Source: NLP analysis
0.00
0.20
0.40
0.60
0.80
1.00
0
100,000
200,000
300,000
400,000
Rat
io o
f P
erm
issi
on
to N
et C
ompl
etio
ns
Num
ber
of D
wel
lings
Output Permissions (actual)Permissions (modelled) Ratio of Net Additions to Permissions
2008
2009
2010
2011
2012
2013
2014
2015
2016
2017
2018
2019
2020
2021
2022
2023
2024
2025
Implications for Policy
Understanding the factors that affect housing delivery and its relationship with planning permission is crucial to ensuring efficient housing supply. Indeed, the Government feels that ensuring there are ‘carrots and sticks’ for private developers is the way to improve the system – the Housing Minister has suggested the need to take into account developers’ past record on building out scheme when assessing new applications while the Secretary of State has recently stated that “it’s time to stop sitting on land banks and stop delaying build-out. The homebuyers must come first”.
As it prepares its White Paper, the perceived problem of landbanking is attracting attention from Government but it must tread carefully so that any changes are proportionate to the scale of the issue (such as it is) and do not result in unintended consequences or act as a disincentive to securing planning permissions and building and selling houses, particularly on marginal (more risky) sites.
Moreover, as our research has shown, across most of the country – particularly outside of London – there is simply no incentive to landbank given current market trends. While it is true that a snapshot in time shows the number of units with permission is higher than its output, we must recognise that not all units are built in the year that permission is granted; understanding the stock and flow of permissions and output is crucial to unpicking the land banking discussion.
In a private land market, the Government needs to be careful: two measures have been suggested for dealing with the perceived problem of land banking:
1. Making a developer’s past performance on implementing developments a factor in determining planning applications;
2. Imposing conditions on planning permissions requiring implementation and a given rate of completions28.
Because the land market and development sector is largely a private enterprise in the UK, there are some crucial factors to consider. The risks of poorly-focused approach are high, particularly if it has the effect of making the risky exercise of securing permission and then building homes less attractive, and creating further barriers to new market entrants and for small and medium sized developers to grow their volume.
In looking at past performance it is important to recognise that planning and land disposal risks are often separated from construction and sales risks: a model of delivery that works well for both land promoters (which includes the public sector which is a significant holder of outline permissions) and for house builders given their respective business models and expertise. Outline permissions are often sought in outline by the land promoter, but in full/reserved matters by a housebuilder. At which stage is past performance relevant? Should a land promoting developer be penalised if a previous site for which permission was achieved was not implemented for reasons outside their control (e.g. economic downturn, infrastructure constraint, or if the house builder to whom it sold the site did not deliver at the rate anticipated)? How is the track record of new entrants to the market or special purpose vehicles to be considered? If land promoters are deterred from securing permissions, this will simply result in a diminution of planning applications and in due course output.
28. This has been imposed in certain situations where five year land supply has been a factor in favour of the grant of permission.

Stock and Flow
20
Endnotes
Imposing conditions on planning permissions to require a specified delivery has worked in practice in a handful of five year land supply situations, but there are real risks in applying this approach more generally. Any expectations set on delivery would need to be realistic and attuned to the circumstances of each site. The increased risk of being obliged to build out at a specific rate (particularly if delivery extended beyond the immediate economic horizon – which is short at the current time) would need to be priced-in with commensurate increases in margin and would put downward pressure on viability and/or the ability of sites to deliver on planning obligations such as affordable housing.
Until the specified build rate is known – which is unlikely to be possible (if at all) until later in the planning process – pricing accurately into land and promotion agreements will prove difficult, giving rise to the same kinds of downstream delays that currently feature in resolving affordable housing and other s.106 obligations. Such an approach may also cause a hiatus in land coming forward while the increased commercial risks are priced into existing and emerging land deals. Imposing a specified build rate may well be something that it is possible to incorporate into disposals and joint ventures on publicly-owned land – where the build rate can be specified in the development agreement – but this may well be at the expense of public receipts and/or other social gain arising from development.
In the context of a land banking problem that appears largely illusory, and where the risks associated with planning and development are relatively high, we see significant problems in the imposition of what might initially seem attractive ‘stick’ measures. Rather than concentrating policy in specific areas of the process – which may have unintended consequences - a more pragmatic solution would be to focus on the structural mechanisms of plan making and house building and encouraging pro-active tools to augment existing housing delivery.
For example, this could focus on:
1. A national planning policy and regulatory environment that seeks to de-risk planning, particularly in the south of England;
2. Encouraging effective and positive plan making, as it is this that will support more locally-led land release. This includes encouraging pro-active approaches to strategic housing land availability assessments to actively align planning strategies with land-owner promotion, and indeed use the former to encourage the latter;
3. The use of realistic assumptions in developing housing land supply trajectories;
4. Ensuring planning departments are sufficiently resourced to speed up planning and facilitate a more pro-active approach in removing barriers to development where they exist, for example through Compulsory Purchase;
5. Mechanisms – including funding and finance – for the public sector to support infrastructure delivery, particularly where this is holding up implementation of sites;
6. Effective use of public sector land for residential use where a more contractor-type of approach – with build rates and triggers - can be defined in development agreements and priced accordingly;
7. Supporting affordable housing delivery and other forms of alternative tenure – including private renting, where there is a market – to create a suitable mix of tenure and increase build rates; and
8. Ongoing support for the construction sector including access to the skills and labour required to boost construction activity.
These factors will help existing players do more, and help reduce barriers to entry for new participants in the residential development sector – including the public sector, housing associations, and SMEs – and in turn increase the plurality of supply of the new homes this country needs.

Stock and Flow
21

Stock and Flow
22
DevCapAssessing Environmental and Development Capacity
Nathaniel Lichfield & Partners (NLP) is an independent planning, economics and urban design consultancy, with offices in Bristol, Cardiff, Edinburgh, Leeds, London, Manchester, Newcastle and Thames Valley.
We are one of the largest independent planning consultancies in the UK and we offer the broadest range of skills of any specialist planning firm. This includes services in economics, spatial analytics, heritage, sustainability, urban design, graphics and sunlight and daylight, as well as a full range of planning skills. NLP was RTPI Planning Consultancy of the Year for three years running to 2014.
We prepare accessible and clear reports, underpinned by robust analysis and stakeholder engagement, and provide expert witness evidence to public inquiries and examinations.
Our targeted research reports explore current planning / economic issues and seek to offer practical ways forward.
Read MoreYou can find out more information on NLP and download copies of this report and the below documents at:
www.nlpplanning.com
ContactsFor more information, please contact us:
Bristol Andy Cockett 0117 403 1980 [email protected]
Cardiff Gareth Williams 0292 043 5880 [email protected]
Edinburgh Nicola Woodward 0131 285 0670 [email protected]
Leeds Justin Gartland 0113 397 1397 [email protected]
London Matthew Spry 0207 837 4477 [email protected]
Manchester Michael Watts 0161 837 6130 [email protected]
Newcastle Michael Hepburn 0191 261 5685 [email protected]
Thames Valley Daniel Lampard 0118 334 1920 [email protected]
This publication has been written in general terms and cannot be relied on to cover specific situations. We recommend that you obtain professional advice before acting or refraining from acting on any of the contents of this publication. NLP accepts no duty of care or liability for any loss occasioned to any person acting or refraining from acting as a result of any material in this publication.
Nathaniel Lichfield & Partners is the trading name of Nathaniel Lichfield & Partners Limited. Registered in England, no.2778116.
Registered office: 14 Regent’s Wharf, All Saints Street, London N1 9RL
© Nathaniel Lichfield & Partners Ltd 2017. All rights reserved.
Land SupplyAssessing five year housing land supply positions
HEaDROOMObjective Assessments of Local Housing Needs
UNLOCKStrategic & Residential Land Promotion
Evidencing Development Capacity
Assessing five year housing land supply positions
Objective Assessments of Local Housing Needs
Evidencing Economic Benefits
How NLP Can Help
Strategic & Residential Land Promotion
About NLP

TRIPTargeted Research & Intelligence Programme
nlpplanning.com
Applications & Appeals
Climate Change & SustainabilityCommunity Engagement
Daylight & Sunlight
Economics & Regeneration
Environmental Assessment
Expert Evidence
GIS & Graphics
Heritage
Property Economics
Site Finding & Land Assembly
Strategy & Appraisal
Urban Design
Planning Consultancy of the Year
2011-2014