Planning for total gridlock: a LOWER white paper
141
Planning for total gridlock: a LOWER white paper • Executive Summary: – 1. Transit in the DC Area handles an insignificant amount of transport demand but will receive the majority of money in the next quarter century. This misallocation must be changed. – 2. Metrorail is a White Elephant which must be maintained but not expanded – 3. Surface Congestion will become much worse if we don’t radically change what we build, and how we finance it. – 4. Fortunately, if we follow simple rules, we can defeat the Congestion Cartel and be able to move around again.
-
Upload
stella-finch -
Category
Documents
-
view
35 -
download
1
description
Planning for total gridlock: a LOWER white paper. Executive Summary: 1. Transit in the DC Area handles an insignificant amount of transport demand but will receive the majority of money in the next quarter century. This misallocation must be changed. - PowerPoint PPT Presentation
Transcript of Planning for total gridlock: a LOWER white paper

Planning for total gridlock: a LOWER white paper
• Executive Summary:– 1. Transit in the DC Area handles an insignificant amount
of transport demand but will receive the majority of money in the next quarter century. This misallocation must be changed.
– 2. Metrorail is a White Elephant which must be maintained but not expanded
– 3. Surface Congestion will become much worse if we don’t radically change what we build, and how we finance it.
– 4. Fortunately, if we follow simple rules, we can defeat the Congestion Cartel and be able to move around again.

LOWER’s role in the Transportation Planning Process
• Citizen’s Watchdog group
• “The Emperor has no clothes”
• Music Man: Harold Hill (read Bechtel) tours the small towns (read congested areas) to sell shoddy equipment (read rail expansion systems) to clueless local school boards (read clueless local politicians.)

What is the Real Issue?
• Mobility!• Because of the arbitrary “proffer” system, there is no
guarantee adequate transportation improvements will happen.
• Blind faith in “rail”– a 19th century technology which has proven beyond a doubt to be INEFFECTIVE in reducing surface congestion in modern cities.
• “Why can’t we just all get along?”– common attitude.
• Reason: $$$$$$$$

Metro a “White Elephant”pretty, but a financial drain
• Thailand: White elephants were property of the sovereign (king), but couldn’t be put to work. A royal gift to anyone who displeased him. Means a financially ruinous possession that can’t be disposed of.
• Phrase arrived in England in mid-18th century. Empire builders applied it to expensive but otherwise useless public buildings or monuments. These are now called “historic properties.”
• Punch drew a famous cartoon applying this label to the Uganda railway.
• Modern, techie term is “legacy system.”

Metrorail- A legacy system
• To be maintained, but not expanded.
• On books at $9 billion, would cost $20 billion to replicate.
• Historical result has been to 1) reduce carpooling, 2) reduce express buses, and 3) increase single occupancy driving.
• Has NOT reduced surface congestion.
• Does NOT deserve a dedicated source of funding. Public sector monopolies must be held accountable every budget cycle.
• Would not be built if didn’t exist already


“The White Elephant (Uganda), illustration by John Tenniel. Caption reads: “Present Proprietor: See Here, Governor: He’s a likely looking animal, but I can’t manage him… If you won’t take him, I must let him go.” This issue was whether John Bull would finance building the Uganda Railroad to Lake Victoria to hold on to the territory– which it did.


Transit60%
Roads40%
Roads Transit
Allocation of Transportation Funds, 2005-2030: of $93 billion, transit to receive 60% of funding

Roads 97%
Transit3%
Roads Transit
2030, Demand by mode share, roads versus transit

Transit4%
Roads96%
Roads Transit
2005, transportation mode share, roads versus transit

Non-Rail2005 Non-Rail
2030 WMATARail 2005 WMATA
Rail 2030
0
20
40
60
80
100
WMATA Heavy Rail’s Mode share declines from 2.7% to 2% from 2005 to 2030

The “True Story” of Transit

Population Growth need NOT cause congestion

• Freeways comprise just 6% of our total road system yet carry 45 percent of all trips.
• Principal arterials comprise 6% of our road system yet carry 20% of all trips.

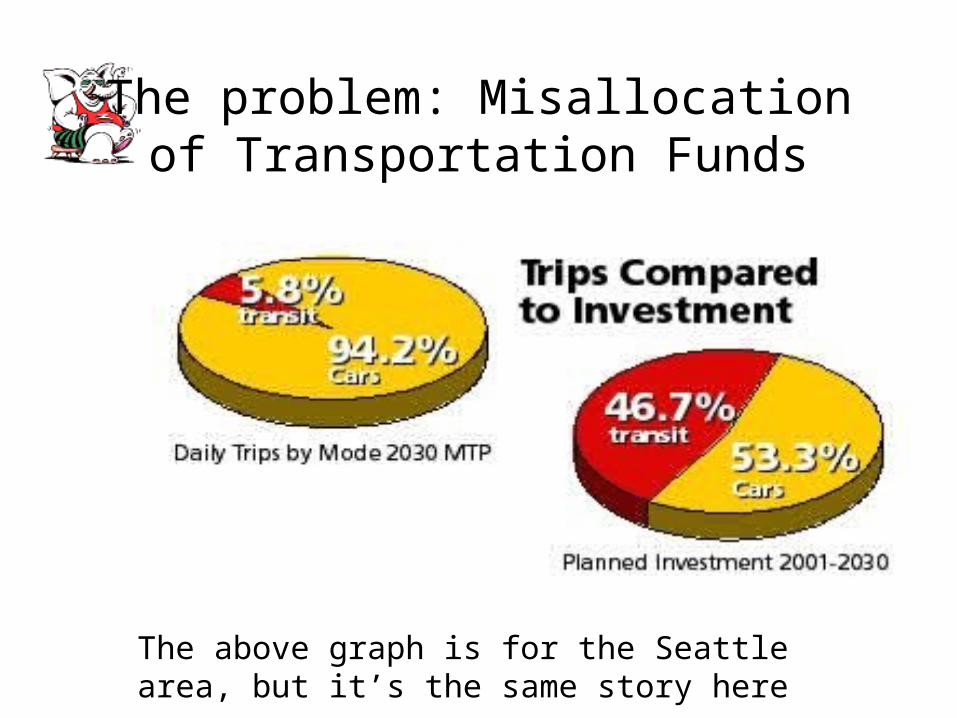
The problem: Misallocation of Transportation Funds
The above graph is for the Seattle area, but it’s the same story here

New Transportation Technology starved!
A Nationwide Problem.
• Of nation’s 19 largest metro areas, 10 plan to allocate more than one half of their projected 20-25 year surface transportation budgets for transit capital and operating costs; 7 others plan to allocate between one-third and one-half. 17 out of 19!
• Source: Federal Highway Administration, Federal Transit Administration; 2002
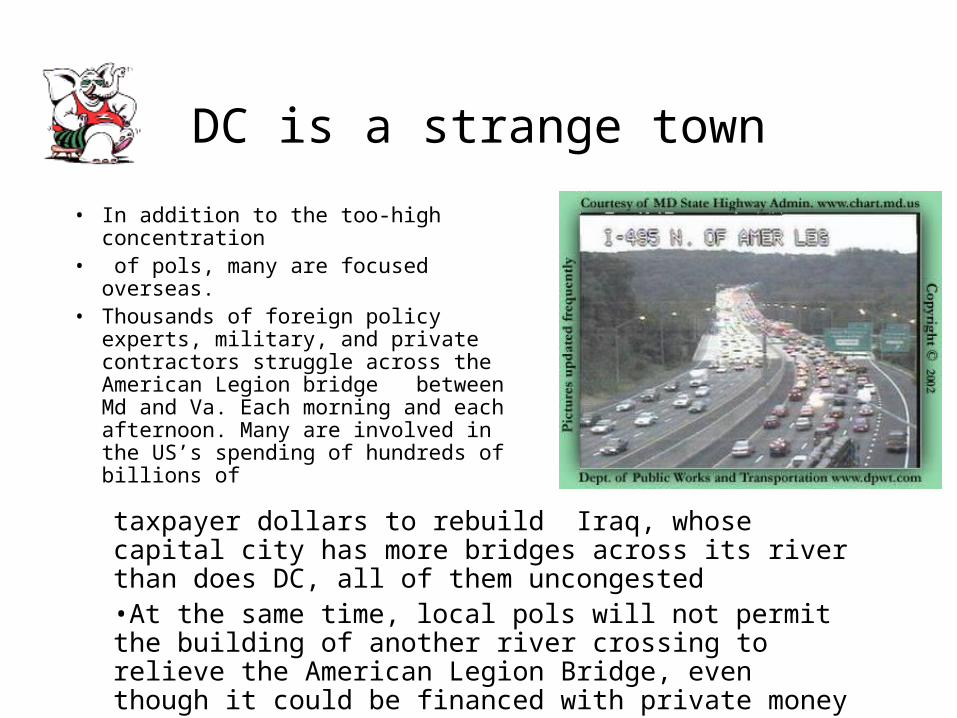
DC is a strange town
• In addition to the too-high concentration
• of pols, many are focused overseas.• Thousands of foreign policy experts,
military, and private contractors struggle across the American Legion bridge between Md and Va. Each morning and each afternoon. Many are involved in the US’s spending of hundreds of billions of
taxpayer dollars to rebuild Iraq, whose capital city has more bridges across its river than does DC, all of them uncongested•At the same time, local pols will not permit the building of another river crossing to relieve the American Legion Bridge, even though it could be financed with private money

DC has a special problem..
• Three jurisdictions, including an odd one, the District of Columbia
• Plus the National Government• High Number of ambitious politicians, all
busy fund raising with other priorities is not a recipe for coherence
• Transportation is an area where perceived competence exceeds actual understanding
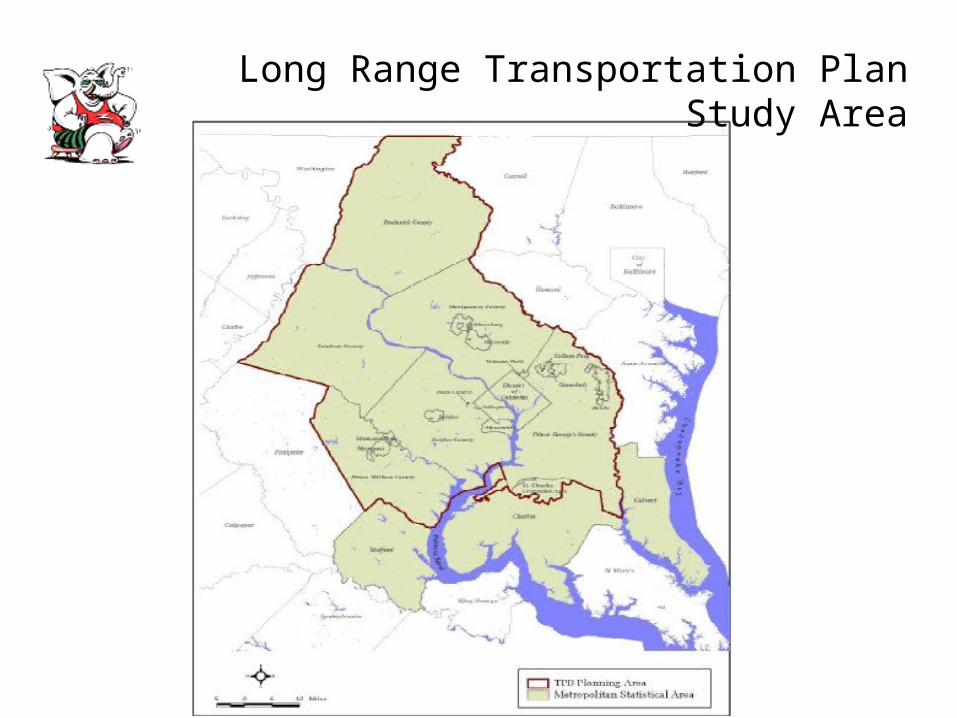
Long Range Transportation Plan Study Area

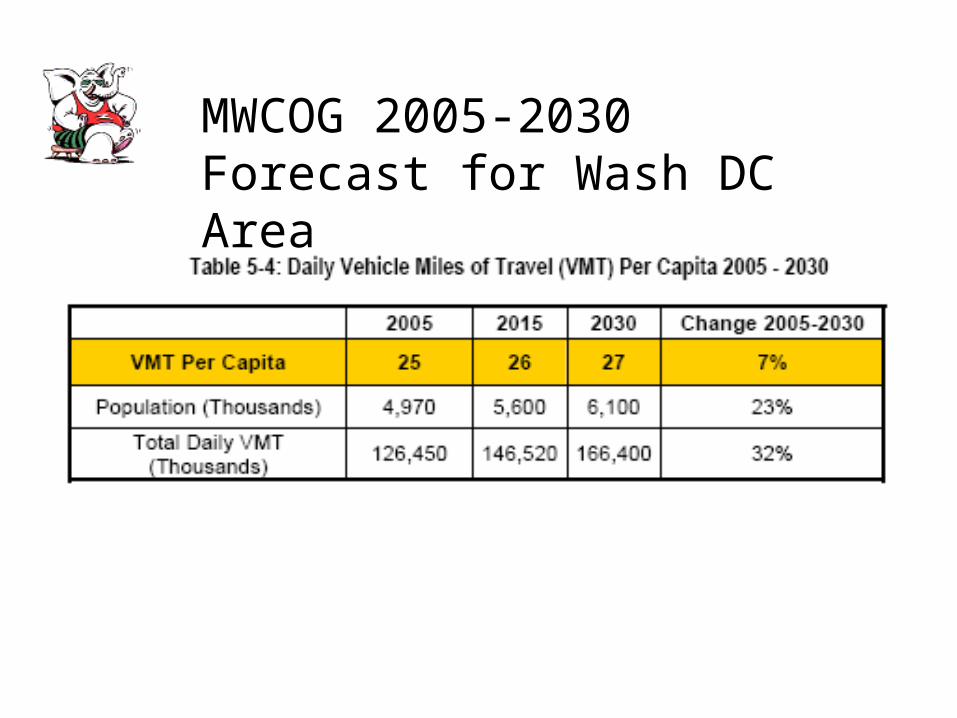
MWCOG 2005-2030 Forecast for Wash DC Area


Congestion Forecast to be MUCH Worse in 2030

Road Use Projected to Grow faster than Transit Use


Metro Matters, but not much
• Originally supposed to generate an operating profit, but now runs a 6% deficit on book value– $300,000,000 a year in operating deficits, and an equal amount in depreciation/amortization of capital costs
• Metro accounting would land its managers in jail if done in the private sector
• “Deferred maintenance” of $12 billion being promoted by Metro’s public relations machine

WMATA’s PR take on their predicament. The truth is that we are OVER invested in Metro and have to keep feeding the bloated beast even though it hasn’t worked well enough to justify building it in the first place.

Transit’s Market Share Insignificant– the tail that seems to be wagging the dog
WMATA Rail currently handles about 600,000 trips a day. At 5.8 miles per average trip (National Transit Database), that’s about 3,500,000 passenger miles per day.
Current daily Vehicle Miles in the COG study area is 126,000,000.
Metrorail is 2.67% of current travel. Adding other transit modes brings the grand total up to 4%. (Source: 2002 National Transit Database).
To address the requirement that the plan be financially realistic, the TPB hired a consultant to conduct a study in 2003. The study projected the revenues that each state would have available for transportation through the year 2030 and compared the projected revenues to the estimated costs of maintaining and operating the current transportation system together with the expected costs of implementing the long-range plan. The total expenditures over the 25 years of the plan are equal to the total expected revenues or $93.3 billion. Overall, almost $72 billion or 77 percent of the total expenditures is for operations and preservation of the region’s transportation system. About $22 billion, or 23 percent is for expanding the transportation system. Transit expenditures are $56 billion or 60 percent of the total and highway expenditures are $37 billion or 40 percent.
2005-2030 Long Range Transportation Plan for DC Area
Transit Share of Future Demand even smaller
COG forecasts that total daily Vehicle Miles Traveled will increase 40,000,000 by 2030—126,000,000 to 166,000,000 vehicle miles per day (or 32%). Average auto occupancy is 1.13. This is then 45,200,000 passenger miles.
Metrorail Miles is projected to increase 24%, or 840,000 (from 3,500,000 to 4,340,000)
Metrorail is thus capturing 840,000/45,200,000 or 1.86% of new travel demand 2005-2030. The nonrail share will increase transit modal share in toto to around 3.0% of new demand.
Thus, the rail share will decline to 1.86% from its current 2.67%, and overall transit share to 3.0% from its current 4.0%.

The Grim Truth…Metro really doesn’t matter
Rail, at 2.67% of today’s transport mode, and below 2% of tomorrow’s mode, is too small to make any real difference.
If rail shut down tomorrow, between carpooling at previous rates and express buses, life would go on pretty much the same. Even for downtown commuters.
Metro would never be built again by rational people-it is a White Elephant. And it hasn’t been duplicated, either.
The money would be much better invested to reduce surface congestion– such as time of day tolled express lanes, and bus rapid transit on key corridors.
Congestion is much worse today than if the money that went into Metro had instead been invested in filling out our highway links– which were cancelled to pay for the White Elephant we have to keep feeding.
It was an experiment that failed.

Promise Keepers (just kidding, but it’s our money)
WMATA heavy rail numbers: Promotion versus Reality
Projected Cost (1974): $2.98 billion
Actual Cost: $9 billion ($24 billion replacement cost)
Projected Daily Trips (1990): 1,300,000
Actual Trips: 600,000
Projected Income Statement: Operating Surplus after allowance for depreciation/amortization
Actual Income Statement: $300 million annual cash deficit, ignoring depreciation/amortization

Public versus Private Investment
• Private:– Costs are bad, revenues are not the test– Profit is the goal: a sign of good management.
• Public:– Costs are good, revenues good: let’s expand the bureaucracy!– “Profit” concept not in lexicon
• Result: With political allocation of capital, “it’s a benefits regime that distributes jobs, contracts and influence: the costs are the benefit.”
-------- quote: James Dunn, Rutgers political scientist who studies transit
Another illustration: Federal transportation bill reauthorization, which now contains 4,000 earmarks, almost all of which don’t appear in any state’s transportation wish list for needed improvements.

Power of Pork
• Metro’s public relations empire– 18 or so lawyers
• At least 180 people now on Dulles Rail payroll• $500,000 slick paid media campaign to “sell” toll
increases• More money spent on study and design of extension than
spent to build original Toll Road, even adjusted for inflation- around $80 million.
• A few percent of this “consulting” money finds its way back into the campaigns chests of local pols: Cliff Slater’s study in Honolulu says about 3% on average.

Dulles Rail?
• Current cost is $4 billion for 20 miles, or $200 million per mile
• Adding a pair of lanes to Toll Road (10 miles) would run about $100 million, and provide greater capacity
• Tysons better served with loop connecting to West Falls Church via straight (Route 7) routing– one of the few people-moving opportunities in the U.S. outside of airports.

The “Promise” of Dulles Rail
• Increase in modal share of passenger miles in Fairfax County from 1% overall to 2%
• No congestion relief on any road in Northern Virginia• No affect on faster growing outlying counties of
Prince William, Loudoun, Stafford• $100 million a year increase in tolls on the Toll Road• Subsidies per new rider equal to gross annual income
of poorest 30% of Fairfax County Residents

More Dulles Rail “Promises”
• Spillover of failed freeways onto local arterials such as Rt 123, Lewinsville, 7
• Depletion of highway budget: Dulles Rail will cost more than Springfield Bypass/Wilson Bridge put together
• Will guarantee failure of ETL (HOT) lanes on I-495 (Reason: no place for express traffic to merge onto Dulles Toll Road).
• Bottom Line: I-66 level performance, only with ever escalating tolls.
• Obviously, this “vision” is a disaster.

Dateline, May 2005: Low-income residents of Oakland are suing the Metropolitan Transportation Commission, charging discrimination because the commission gives most available funds to rail transit to affluent white neighborhoods while bus transit in poor minority neighborhoods are starved for funds. The Metropolitan Transportation Commission (MTC) is the regional organization that distributes federal transportation funds to Bay Area transit and highway agencies.
The suit points out that MTC's regional transportation plan failed to provide $700,000 for bus transit improvements in a black neighborhood, but it did fund $1.5 billion for commuter trains and $4 billion for a BART extension to San Jose. MTC's own analysis said that the unfunded bus service would have added new passengers at a cost of just 75 cents a ride, while the commuter trains would cost $26 per new ride and the BART extension would cost up to $100 per new ride. [JUST LIKE DULLES RAIL]
Monopoly transit agency pursues “choice” suburban rail riders by ignoring their base-
San Francisco BART version
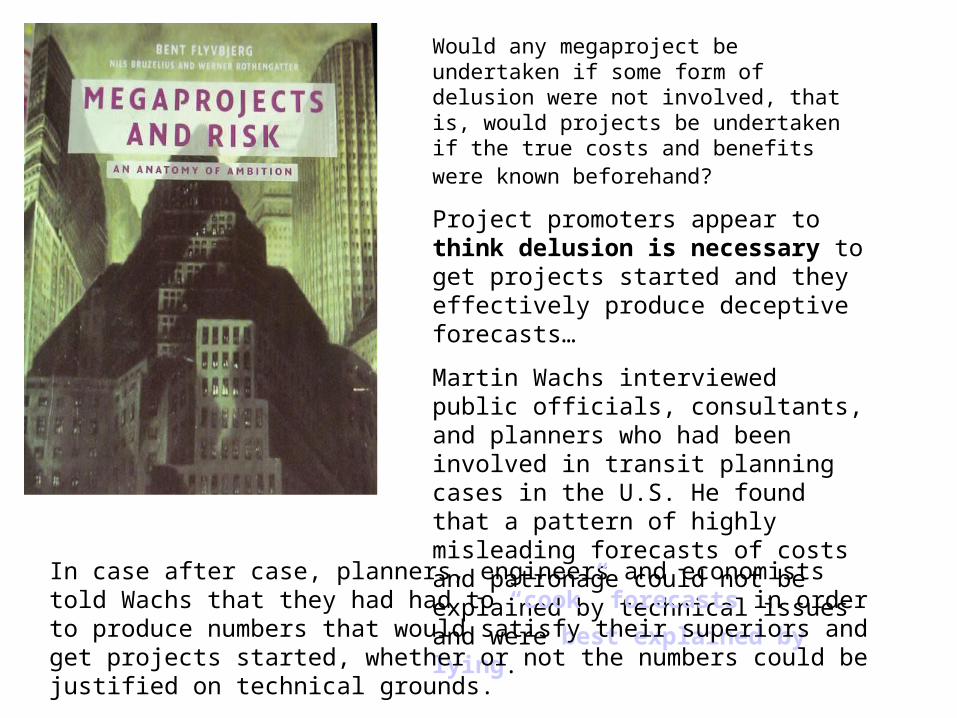
Would any megaproject be undertaken if some form of delusion were not involved, that is, would projects be undertaken if the true costs and benefits were known beforehand?
Project promoters appear to think delusion is necessary to get projects started and they effectively produce deceptive forecasts…
Martin Wachs interviewed public officials, consultants, and planners who had been involved in transit planning cases in the U.S. He found that a pattern of highly misleading forecasts of costs and patronage could not be explained by technical issues and were best explained by lying.
In case after case, planners, engineers and economists told Wachs that they had had to “cook” forecasts in order to produce numbers that would satisfy their superiors and get projects started, whether or not the numbers could be justified on technical grounds.

…WE find with a very high level of significance that rail passenger forecasts are more biased (inflated) than road vehicle forecasts.”…We conclude that the traffic estimates used in decision making for rail infrastructure development are highly, systematically and significantly misleading. Rail passenger traffic forecasts are consistently and significantly inflated. For road projects the problem of misleading forecasts is less severe and less one-sided than for rail.

Core Issue
• Why should the average, poorer taxpayer be subsidizing a richer commuter traveling to a higher paying job outside the jurisdiction where he/she lives?
• This issue was litigated in Los Angeles, where the transit agency wanted to cancel bus service and force use of rail: it was demonstrated that this procedure, which WMATA subscribes to, discriminated against the poorer bus riders.
• In Denver, with the “fast track” light rail proposal on the ballot, the no-growthers questioned whether subsidized transit would encourage “sprawl.”

Upper Class welfare: The poor subsidizing the rich
• The average subsidy to a new rider on Dulles Rail exceeds the per-capital income of the lower 30% of the population of Loudoun/Fairfax Counties
• New Rail Rider much better off than motorists subsidizing the operation at the Toll Plazas
• Very expensive to pull suburbanites out of their cars: these are so-called “choice customers” for the transit agencies.
• MUCH cheaper to give each new rider a brand new Lexus.

“Worst of all Worlds” scenario
• By 2025, Tysons/Dulles Corridor will have the unique disadvantage of:
• Highest property taxes in Virginia (special tax district)
• Only full-time tolled freeway in area• Service Level “F” (failure) on every major
freeway/arterial• Like I-66, only with full time tolls• Beltway even worse than today
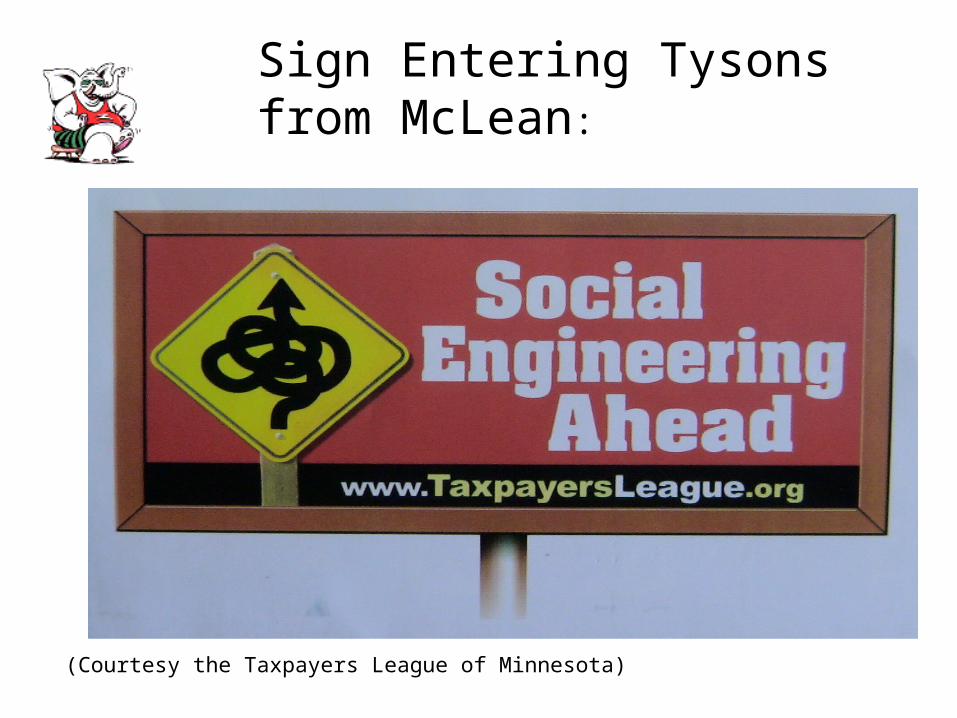
Sign Entering Tysons from McLean:
(Courtesy the Taxpayers League of Minnesota)

Dulles Super-Toll Road Gridlocked….

Dulles Rail- NO Congestion Relief!
Source: Dulles Rail EIS, table 6.2-1
Toll Road Relief?
• Heavy rail typically relieves 1 ½ years of traffic growth on adjoining corridor.
• Dulles Corridor, about 150,000 cars per day; rail will offload about 6,000 cars
• But we are paying for rail with higher tolls and subsidies for the rest of our lives
• This makes no sense

How we got here….
Tysons current zoning incentive is the product of a false assumption… today’s density multiplied by x if bus rapid transit and 2x if rail. Kate Hanley’s core proposition. Absolutely no evidence any of this assumption has real world validity.
Logic 101: if you start with a false premise, you can logically prove anything.
West Group is out of building density, this is fueling the ruinously expensive Dulles Rail proposal (the desire to get higher density).
Best results will result from decoupling misguided density/ transit assumptions from one another and looking at the whole issue afresh.
Historically the best pedestrian “places” have resulted from planning flexibility: Disney World, downtown Atlanta, Reston Town Center, National Harbor (Prince Georges County), Rouse urban shopping centers (e.g. Baltimore Harbor) . Almost all these had no transit at the time they were put in place, and none rely on transit today for their success.
Traffic and Density
• Up to densities of 30,000 per square mile, linear increase of roadway use.
• At higher densities, per capita roadway use declines.• Tysons population density is currently about 5,000 per
square mile (20,000 over 4 square miles)• Conclusion: Tysons would have to densify more than 6
times current level to have any “transit related effect” and 12 times current level before significant lessening of per capita highway use (60,000 people per square mile)
• Question: Who is adding to highway capacity?– Kemper Freeman research, Seattle:
http://www.letsgetwashingtonmoving.com/pages/KemperQ&A.doc
Suggested position
• Insist on “no degradation” policy– any new building permits will be based on actual measurements of arterial/freeway flows and plans to alleviate them funded prior to permits
• Reston Town Center history• Let Tysons redevelopers worry about the
transit/roads mix• Impacts of densification should be paid for by the
densifiers, not by taxpayers in general

No degradation policy continued…
• Idea is to get developer to assure there is enough “private” funds to take care of externalities, BUT
• Ffx county is lousy with followup.• Developer resists since his cost of capital is much higher than public’s.• Solution: utilize existing Tysons tax district for ANY transportation
improvements within and surrounding Tysons. Let redevelopers pick the mix. Improvements will be paid for with tax-exempt revenue bonds, deductible by owners against income as a local tax.
• Advantage: Since actual measurable real-world impact is the test, redevelopers will pay close attention to cost-effectiveness. It’s THEIR money, not someone else’s. If McLean is impacted, they are on the hook to actually implement a solution. Since rail doesn’t solve the problem, that approach will be dropped.
• This format has been widely used in California post Prop-13 and elsewhere and is being proposed in Loudoun County.

As for actual plans to redevelop….
• I would remain agnostic. Tysons could and should look and function better than it does now.
• Some very attractive pedestrian oriented pseudo-urban cores have been put in place in various places… but they are hard to do. The usual pedestrian zone laid over traditional “center city” shopping streets usually hasn’t worked.

Densification not bad per se, but….
Remember that Tysons must go from 20,000 population to 120,000 population before any mitigation due to transit will kick in.
Since it took Tysons 45 years to get to 20,000 population, this process will take decades, if it ever happens.
The commutershed west to Leesburg will provide stiff competition for Tysons, and already is.

Impact on Dulles Airport
• Rail actually bad for airport– $3 per ticket surcharge for everyone; around 3% of users will take
rail. Equivalent to a $100 per ride subsidy for trip to airport. Much cheaper to give a voucher for 50% of taxi ride.
– Configuration of free and uncongested inner lanes encourages commuters to take the extra five minutes to drive around the airport and avoid tolls and congestion. This is poor design and the wrong economic incentive.
– Recent rail links to international airports have dismal patronage: JFK, Newark, Shanghai, San Francisco
– Dulles rated the third-worst medium size airport worldwide in terms of passenger satisfaction (2004 JD Powers study). Last thing it needs is higher cost structure. Airport now gets more traffic from congested Route 28 N/S and roads west than from the Dulles Corridor.

Virginia: Poor Leadership
• Governor Warner: Symbolic activity only, gave up after tax referendum
• Karen Rae, Texas export: “Nothing we will do will reduce congestion.” Carrying this slogan into practice, at our expense.
• Vincent Callahan, House of Delegates: no idea what to do.
• Gerry Connolly, et al. on Fairfax Board: Have spent almost nothing on roads during their two-term majority.

Deception! Lying! Dishonesty!A Weakness in our System of Government
Study of 258 government projects, reported in the Journal of the American Planning Association.
Nine out of ten projects in their sample had cost overruns, with an average of 28%. The study concluded that intentional deception by public intentional deception by public officialsofficials was the source of the problem. “Project promoters routinely ignore, hide, or otherwise leave out important project costs and risks in order to make total costs appear low.” Politicians use “salami tactics” whereby costs are revealed to taxpayers one slice at a time in the hope that the project is too far along to turn back when true costs are revealed.”
Data Point: Fairfax County Public Safety project: Bond language said $29 million, now we learn cost is $120 million

Citizen Apathy…does anyone care?
• Largest tax increase in Va. History last year, 10% rise in state income
• Fairfax, Loudoun, Montgomery Counties increase spending at 10% rates, much higher than population growth plus inflation
• Ehrlich’s experience in Maryland: business community is asleep, he is forced to backstop liberal legislature on his own (and the Md. Legislature is far to the left of the electorate).

Pressure Points
• On the Dulles Rail fiasco: it’s up to Tom Davis, Frank Wolf, and Jim Moran. Since this project is really a set aside in the federal pork category to the tune of $750 million, they can de-appropriate money or ask that it be reprogrammed.
• They believe (privately) that rail should stop in Tysons. In public, they dither.
• They and the Ffx board need to be encouraged take the position that “user pays” and that the Tysons densifiers should pay ALL the transportation costs associated with their plan– be it rail, bus, highway, monorail, helicopter, moving sidewalk, jetski, or whatever. Not toll road users or the rest of us in the form of lost time due to higher road congestion.

Transit Not Auto-Competitive

This is expensive congestion!
• Full time cost per new rider: $100,000 per year (same as S.F-San Jose proposed heavy rail)
• How much of this is coming from the fare box? – maybe $3,000
• Much cheaper to buy every new rider a Jaguar:
Why is this happening?
• A combination of “Emperor has no Clothes” and “The Music Man”
• $100,000,000 in study money– more than it cost to build the Dulles Toll Road in the first place
• Failed political system- lots of blame to go around
What can be done?
• Ask political candidates: “What do you propose to do about alleviating congestion?”
• Take future of Dulles-to-DC corridor to referendum in Fairfax/Loudoun counties
• Pay attention: Virginia and Fairfax spending has gone up almost 10% in past year– far in excess of inflation/population growth. Montgomery Cty MD the same
Do we know what to do? YES
• Maryland is showing the way. They have realistic leadership from the top.
• Technology is coming to the rescue with ETL/transponder applications. You will have a choice of:– Known price (0) , unknown travel time (today’s
highways); or– Known travel time, advertised price that varies
according to price selected to guarantee fast ride at time you enter the ETL lanes. It’s travel time insurance, purchasable when and if you need it.

What is going on here?
• “It’s not what we don’t know that hurts us, it’s what we think we know that isn’t true.”
• It doesn’t help when the myths are being repeated as propaganda by those with an axe to grind, or those too lazy to roll up their sleeves on solutions.

The debate over transportation has become as clogged with myths as I-495 is congested with traffic at rush hour. But there is a simple truth we should focus on — we can end gridlock if we want to.
MYTH: New roads only fill up with more traffic.
FACT:New road miles fill up with traffic because there was either a previously unfilled demand or because that roadway offers a quicker route. The general failure of our road system to keep pace with increasing traffic is the biggest reason why the few new road miles that have opened were quickly used to capacity.
MYTH: We must learn to live without cars.
FACT: Studies have always shown that commuters are willing to consider cost-effective and convenient transportation alternatives. However, even after spending billions of dollars on mass transit and requiring major businesses to encourage employees to use it, our roads continue to fill. An integrated transportation system should include options, but cannot ignore the need to expand road capacity to handle growth — for both commuters and truck traffic.
Transportation Myths and Facts-Part I
MYTH: More mass transit will clear roads.
FACT: Even if the mass transit we currently have, and are planning to build, was 100% utilized, it would not clear our roads. The problem isn’t a lack of buses, but the failure of our roads to provide sufficient capacity to handle the increasing number of cars, trucks, and yes, even buses, that want to use it. Pouring more dollars into transit while depending on a road system stuck in the 1990s simply doesn’t make sense.
MYTH: We cannot afford to build more roads.
FACT: For about $8 billion, we could construct a regional network of Express Toll Lanes that would give all of us another option for mobility. At the same time, transit would be greatly aided by this network of congestion free lanes– in effect, a free, unsubsidized right of way that is much faster (at 60 mph) than rail (at 35 mph). This network could be privately financed at the 75% level. For one-half the public Dulles Rail investment, we would build capacity at 30 times the passenger mile throughput, that would benefit the entire area.
Transportation Myths and Facts- Part II

Transportation Metrics- Don’t be fooled!
•Here are the choices in order of favorability for a monopoly center to suburb transit provider:
•Commuter share, peak hours•Commuter share•Passenger share•Peak Commuter Miles•All day Commuter Miles•Vehicle Miles, all types, all day (includes trucks)
WMATA’s Heavy Rail’s share in Fairfax County ranges from 6% to 1% from top to bottom--- not much. Dulles Rail will take the 1% to 2%, but total highway demand will swamp this slight increase

Heavy Rail Speed?
“Novelty”, shown here at the Manchester Museum of Industry and Science, hit 30 mph before the opening of the first commercial railroad, Liverpool to Manchester, in 1830.
Metro’s current average speed is 35 mph.

Conclusive Research
Danish reviewer Bent Flyvbjerg reviewed ALL urban rail projects worldwide for which data were available both for forecasts of cost and ridership, and actual costs and ridership
Conclusion:
U.S.: “Cost overruns averaging 50 per cent, with actual ridership 53 per cent lower than forecast..…Actual costs per passenger on the average 500 per cent higher than forecast costs (ranging from 190 to 870 per cent).
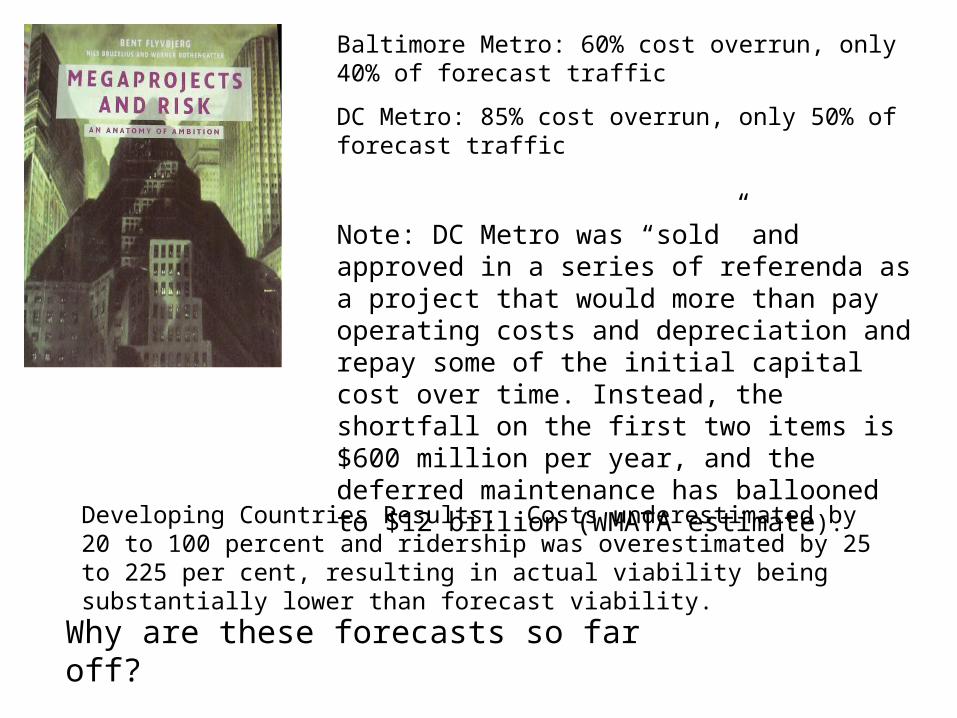
Developing Countries Results: Costs underestimated by 20 to 100 percent and ridership was overestimated by 25 to 225 per cent, resulting in actual viability being substantially lower than forecast viability.
Baltimore Metro: 60% cost overrun, only 40% of forecast traffic
DC Metro: 85% cost overrun, only 50% of forecast traffic
Note: DC Metro was “sold” and approved in a series of referenda as a project that would more than pay operating costs and depreciation and repay some of the initial capital cost over time. Instead, the shortfall on the first two items is $600 million per year, and the deferred maintenance has ballooned to $12 billion (WMATA estimate).
Why are these forecasts so far off?
“We lean in favor of enabling critics to initiate referendums of urban mega-projects.
While private rent-seekers and public entrepreneurs are invaluable sources of energy and ingenuity of urban mega-projects, local champions of environmental protection, of neighborhood preservation, and of fiscal sobriety have no less valuable roles to play.
There are no good substitutes for representative democracy, empowered and required to approve all major projects, and a vibrant local pluralism.

Bent Flyvbjerg:
“Cost underestimation and overrun cannot be explained by error and seem to be best explained by strategic misrepresentation, namely lying, with a view to getting projects started.”
…We conclude that the cost estimates used in public debates, media coverage and decision making for transport infrastructure development are highly, systematically and significantly deceptive. So are the cost-benefit analyses into which cost estimates are routinely fed to calculate the viability and ranking of projects.

Virginia’s lady on the spot: Why is she getting $4 billion?

A sad example of pork…
• New Jersey River Line Light Rail
– $ 1 billion project, Trenton to Camden, 34 miles– 300% over projections, $476 million to design and build, $100 million for
consultants– Fare revenues are so low that collection costs exceed them, ride-for-free
seriously considered. Fare recovery of total costs is 2%, subsidy is $31 per trip
– Farebox receipts $1.4 million first year, operating and maintenance costs $18 million
– $48 million a year in debt service– Director of NJ Transit: “Light Rail line will have no noticeable effect on
traffic congestion.” “It’s just bankrupting New Jersey Transit.” (John Pucher, Rutgers transit expert).

Don’t laugh- Dulles Rail is even worse on some measures
• Total Cost: $4 billion plus $4 billion capitalized value of annual subsidy ($100 million for operating, $100 million for depreciation/amortization (3% of $4 billion) at 5% cap rate) plus 22-mile share of Metro rebuild (.22 times $10 billion) or another $2 billion. Total: $10 billion (prior to overruns).
• New riders: Projected 47,800 new systemwide trips is inflated number due to nonconsideration of deterioration of service on Orange/Blue/Yellow lines. It also assumes no replacement of obsolete 42 seat buses used in Fairfax County, no bus shelters, no posted schedules, measures which would boost ridership 30%. It also assumes no just in time ridesharing, which today serves 44,000 people on the Shirley Highway. A more realistic number is a 25,000 trip per day increment, or 12,500 round-trip commuters. (Historically rail projections have averaged more than twice actual patronage).
• At a 7% cost of capital (FTA assumption), the true $700 million per year incremental cost divided by 12,500 round trip commuters times 260 days per year (weekday/weekend average) gives a true cost of $200 per day per new rider, or $52,000 per year. How much of that will be recovered at the farebox?

These numbers aren’t atypical…
• Comparison: San Francisco BART extension, Millbrae (SFO airport) to San Jose.
• BART rhetoric: “Connect the largest city in the Bay Area (yes, it’s San Jose, not S.F.) to the BART system.” Sound familiar?
• The REAL DEAL Silicon Valley: Rt. 101 far more congested than the Dulles Corridor
• Study showed true cost of $100 per ride or $47,000 per year for a full time commuter.
• Airport hookup to BART system is completed: an architectural success, but only about 5,000 paying passengers– a patronage flop. Similar story at JFK and Newark with their extensions to transit, and likewise with the maglev line at Shanghai’s new airport.
Myth #6: “The Cost is the Benefit:” Rail Transit Reduces Traffic Congestion:
This enduring myth is the first refuge of the “railvangelists,” romantics and carpet bagging rail builders who try to sell their elixir from Portland to Sioux City (yes, Sioux City).
In fact,there is no evidence that new rail transit has materially reduced traffic congestion in any urban area, US or Western Europe. Building rail is justified principally by an irresistible urge to spend money --- our money. The cost is the benefit. Of course, the historic rail systems serving the pre-automobile cores of New York, Chicago, Paris, London, Tokyo or Hong Kong are essential. But Sioux City is not Hong Kong. Neither, for that matter,are Phoenix or Portland.
Wendell Cox on Rail Transit Myths
Myth #4: “Two Tail Pipes is Better than One:” Higher Densities Mean Less Air Pollution:
United States Environmental Protection Agency research says that air pollution emissions are higher where traffic speeds are slower (at least at urban speeds) and that emissions are higher where there is more “stop and go” traffic. Higher densities mean more traffic congestion (above), which in turn means slower traffic speeds and more stop and go operation. More tail pipes do not emit less pollution.
Wendell Cox, more Urban Myths
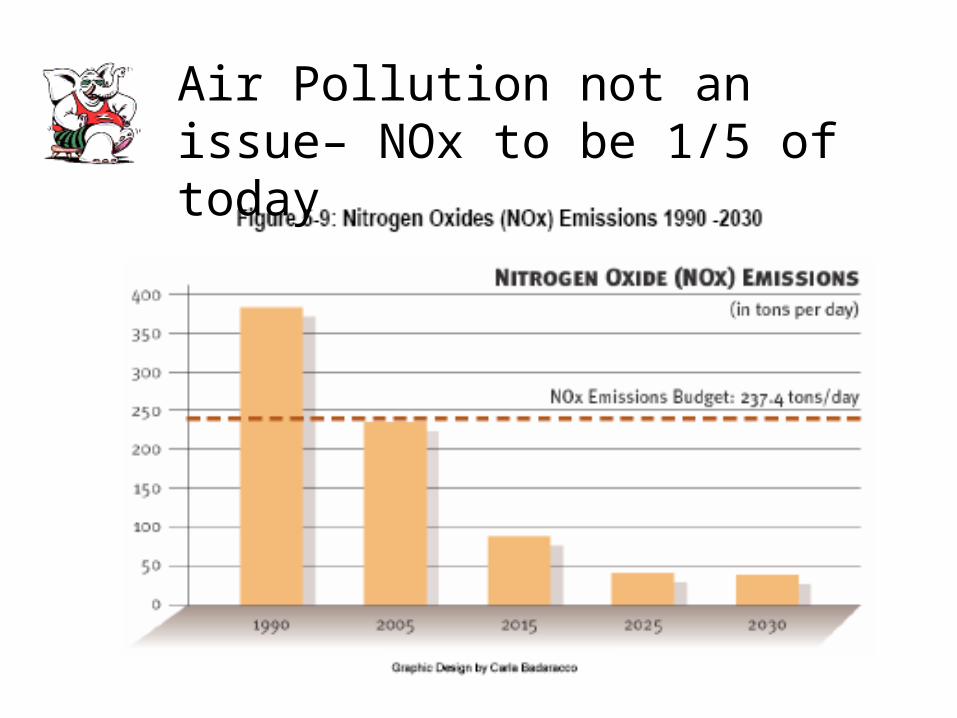
Air Pollution not an issue– NOx to be 1/5 of today
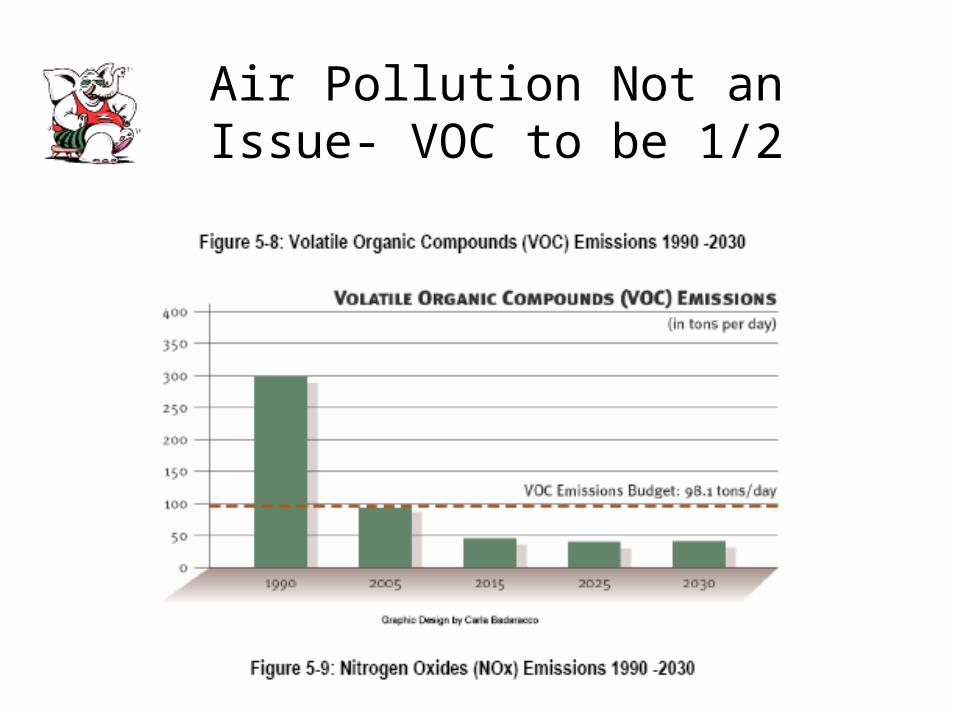
Air Pollution Not an Issue- VOC to be 1/2
BRAC (Base Realignment and Closure)- A Northern Virginia Transportation Non-Issue
Predictable response by Fairfax Board, get feds to fund a heavy rail line extension– Dana Kauffman wants two (Blue AND Yellow)!
Reality is that only 18,000 new jobs would be added to Fort Belvoir.
Military works non standard hours. Car-pool at average peak occupancy for Shirley highway (more than 3 occupants/car) is only 6,000 new cars per day, or 600 per peak hour. This is about one year’s annual growth in demand on I-95 exclusive of BRAC.
Capacity of a managed lane is 1,500 vehicles per hour. Take the hybrids off the reversible lanes, enforce the HOV restrictions, and we are there. The Route 1
connector will have to be enlarged, but that should be done anyway.
Better yet, add ETL (express toll lanes) to I-95. Virginia has two private sector proposals to do this. Each pair of lanes will more than suffice for Ft. Belvoir.
Mixing Bowl improvements assure that I-95/495 interchange will not fail.

Urban Myth #9: “Herding Cats:” The Jobs-Housing Balance.
This is one of the most fervently held doctrines. The idea is planners should design transportation and land use so that the distance between work and home is minimized. This may be the most bankrupt, and surely the most arrogant concept in the entire smart growth confession of faith.
Census data indicates that barely 20 percent of households consider proximity to the job location as the principle reason for selecting their neighborhood. This suggests that herding cats would have at least as high a probability of success. The problem is that a jobs-housing balance requires other balances as well --- a jobs-housing-education balance, a jobs-housing-interest balance and so on. In fact, there are hundreds of thousands of jobs closer to home that the one filled by the average American worker in a large urban area. And things are no different elsewhere. Hong Kong, the high-income world’s most dense urban areas (6,000,000 population in 75 square miles) has an average journey to work distance of six miles (at Hong Kong densities, the entire population of the city of Portland would be clustered within 1.5 miles of NE 23rd and Burnside). In Houston, with densities slightly less than even Portland, the average work trip travel distance is only 13 miles --- little more than double that of Hong Kong, with an urban land area more than 20 times as large. This folly of the jobs-housing balance cries out for an urban planner’s retraining program. Each devotee should be required to work, for at least a year, at the closest job, whether a convenience store, the custodial service or the fast food restaurant. That would put an end to this silliness.

The Oakland suit resembles a suit brought by the NAACP against the Los Angeles transit agency in the 1990s. That suit forced the agency to slow or halt its rail transit plans in order to restore bus service to minority neighborhoods. More information about this suit is available at http://tinyurl.com/8otrw.
For an interesting history of the Los Angeles Bus Riders' Union suit by one of the organization's leaders, see http://la.indymedia.org/news/2005/05/126280.php.
West Coast (SF and LA) Transit follies, continued

But we’re more enlightened here…Aren’t we?– the “No-Build bus scenario
Location: One block off Toll Road, Reston Pkwy, 50,000 cars/day
No shelter, no schedule, no marquis, fortunately water only 2 inches deep

Better in the summer… not exactly
Not exactly sure where the stop is, when the buses arrive, where they go
Location is ½ mile from office of local county supervisor who’s a rail fetishist

Beware Planning Assumptions
• Chicken and Egg: Does transit follow densification, or vice-versa?
• In post-automobile cities (built after 1910), no successful examples of density following expensive transit investment. E.g., Washington heavy rail stops.
• Plenty of examples of the opposite: Reston Town Center, Tysons, Columbia, Houston’s Post Oak, Dallas North end, Los Angeles nodes such as Century City, edge cities all over the U.S.
• Beware the argument that “if it is built, they will come” (Field of Dreams attitude): no evidence from WMATA, BART, or elsewhere this is true. “Transit Oriented Development” is a myth, much talked about, like Saddam’s weapons stockpiles, but nonexistent

Quick Relief In Sight
• Seattle Research, same story here:
• Study results: adding only 6 percent more lane miles, --half of which would be additional lanes on existing freeways, the other half would be additional lanes mostly on existing arterials—would reduce congestion from today’s level by 36 percent. And it would fully accommodate the 45 percent increase in trips expected over the next 30 years.
• What are we doing in DC instead with the money? Increasing the heavily subsidized heavy rail system 20%!

Role of Press in the debate
• Big City dailies usually support megaprojects: more activity, more advertising
• Post: “A Railroading to Dulles” editorial: “Before it’s too late, somebody should put the emergency brake so the public can get a good look at the landscape.”
• Pro-rail: Times community newspapers• Anti: Northern Virginia Journal • Many still undecided or deliberately neutral: Examiner,
Post, Connection community newspapers• Data Point: Denver’s Fast Tracks was supported by one
daily, opposed by the other

Three Tests for an Investment– Public or Private
1. Is It Cost-Effective?
2. If it is cost-effective, is there an alternative approach which is MORE cost-effective?
3. Regardless of the first two points, is there a technology which is emerging which will displace current alternatives?

Heavy Rail outside downtowns fails these three tests
1. Is is not cost effective– far cheaper to give a new Lexus to each new rider attracted.
2. More effective technologies exist– notably Express Toll Lanes which provide, in affect, guaranteed congestion-free right of way for free to all manner of vehicles, and which can be financed privately.
3. Emerging transponder/cell phone technologies will make possible closer correspondence between value and pricing of road use, offer instant, accurate information on public transit point-to-point connnections, and simplify the match process between rider and passenger for just in time carpoolers.

Reality Check– Look Around
1. If A Toll Road created (or perpetuated) to finance heavy rail down its median, why aren’t there more of them. (Can you think of another example?)
2. If Heavy Rail in general is a good idea, why isn’t it proposed more? (Reality: the only other heavy rail project at this stage proposed is the East Side subway in New York City, which Governor Pataki admits he has no idea how to fund.

How about the airport?
Outside the original EU countries, very few national capitals have rail links to their international airport. None in North or South America, Africa, or Asia, except for Tokyo, Seoul, and Kuala Lumpur. 3 out of 200 countries.
Recent rail links to non-capital cities– JFK, Newark, SFO, and Shanghai’s new Pudong facility– have had disappointing patronage, no more than a few thousand paying passengers a day.

Forget Farebox Recovery
• WMATA likes to brag about its “farebox recovery” percentage as if this is something good. What it really means is that the system is insolvent by any normal accounting standard since it cannot even cover its operating costs, much less repay original capital invested or replacement costs (and this is for a high capital cost enterprise).
• This is NOT what was promised when the system was sold to the voters in 1968.

A Little Promotional History on Capital Costs
In November 1968, WMATA bonds were approved in referenda in Prince Georges County, and Fairfax and Arlington Counties, and the Cities of Falls Church and Fairfax City. DC’s share was authorized by Congress (no home rule then). Montgomery County authorized its share via the County Council, and Alexandria was empowered to authorize bond issues without public referenda. These bonds covered 20% of the original $2.5 billion capital cost estimate, the rest coming from the feds.
From 1968 to 19711 the cost estimate “ballooned” to $2.98 billion, which included a built-in 7% per annum cost escalation. The local jurisdictions put in 1/3 of this increment.

Income Statement Promotional History
The estimated income and expense statement for 1990 showed:
Adjusted Gross Revenue--- 203.8 million
Operating and Maintenance Expenses---- (107.2)
Net Revenue before Depreciation 96.6
Depreciation (15.3)
Net Revenue after depreciation 81.3
In other words, the system was “sold” as covering its operating and maintenance costs, and after an allowance for depreciation/replacement, would generate sufficient capital to repay its initial cost at a 3% per annum rate.

Ridership/Operations Promotional History
By 1990, the rail system was supposed to carry 350 million riders annually- or 1,300,000 per day.
Two minute rush hour service was promised on main routes.
Maximum speeds were said to be 75 miles per hour.

As they say on Wall Street…
“Between the promise and reality….
Fell The Shadow.”

Acid Test….. is there surface congestion relief?
Surface congestion comes in many forms….
•Too many pedestrians (Stroget in Copenhagen, Orchard Road in Singapore)
•Too many pedalbikes (Shanghai, recently banned in center city)
•Too many pedal taxis (Jakarta, recently banned)
•Too many motorbikes (Vietnam cities)
•Too many buses, even double deckers (Dublin)
•Too many single occupancy cars (US, Europe, Japan)

So….
Unless it reduces surface congestion, a transportation infrastructure investment is not worth doing.
•Just because it’s expensive doesn’t prove anything. Bangkok suffers from chronic congestion, due to high densities and narrow roadways, but its expensive Skytrain elevated system attracted far too few passengers to make any difference. However, the enormous densities in a city of 12 million make underground transit worthwhile, despite the daunting task of building under the water table.
•Dulles Rail serves an area that even including Tysons is far below necessary densities and will have no noticeable impact on surface congestion. No one disputes this fact.

The logic behind rail boondoggles
It dates to Aristotle:
•If we don’t do something, congestion will get worse.
•Building rail is doing something.
•Therefore, let’s build rail.
•This is about as far as many clueless pols take the process, since they can “talk” about addressing the issue and leave the cost of feeding the while elephant to others after their watch.
•The fact that the logic is faulty (“denying the antecedent”) is of course irrelevant. (If not A, then B, if C, then A, doesn’t imply C in a rational world.)

Rail logic in a more colorful setting
The same logic applies to the seduction technique of Sinbad the Sailor:
•If I had forever, my darling, I could convince you of my love.
•But, my darling, I must be off to battle tomorrow, so we do not have forever.
•Since we may not have tomorrow, we must consummate our love tonight.
The result of this faulty syllogism is the same: both the fair maiden (and the traveling public) end up getting screwed.

How did we plan ourselves to gridlock? The bottom line
(details to follow)This is transportation researcher Randal O’Toole’s explanation:
Basically it results from a powerful transit lobby, a discredited and demoralized highway lobby, four decades of demonization of highways and autos, and a strong feeling that transit is more "moral" and less controversial than roads.

Planning for Gridlock, II:
In the 1960s, Congress decided to spend some transportation dollars on transit. It gave cities incentives to buy private transit systems that were profitable but admittedly on the rocks. We don't have complete data, but it is clear that subsidies per passenger mile were almost immediately greater for transit than for highways -- not that anyone in Congress cared.
Inflation in the 1970s led Congress to increase the gas tax. In 1981, I believe, transit advocates convinced Congress that 20 percent of all gas tax increases from then on should be dedicated to transit.
Transit advocates insisted this was necessary for "balanced transportation funding."
Since the 1950s, at least, all federal spending on roads came out of user fees. But many members of Congress don't understand the distinction between user fees and taxes. As far as they are concerned, money is money and theirs to spend. So it seemed to make sense to spend some of it on transit.
.

During the 80s the 20 percent formula held but the 1991 reauthorization act, ISTEA, created a new category of funds called "flexible funds." Cities were allowed to use these funds either for transit or roads. Transit still got its 20 percent minimum, and much beyond that out of flexible funds.
The picture is further complicated by "new starts"and other earmarks. Powerful members of Congress dedicate billions of dollars to pet projects. Too often these are transit projects because transit tends to be less controversial than roads.
Planning for Gridlock, III

Road versus transit subsidies?
In 2002, total SUBSIDIES to highways were about $16 billion including federal state and local funds. Subsidies to transit were about $29 billion. Highways carried about 4 trillion passenger miles and a trillion ton miles of freight. Transit carried about 50 billion passenger miles.
The Arithmetic is that ignoring the value of freight and trucking, federal road subsidies are 4 cents per passenger mile. Federal transit subsidies are 58 cents per passenger mile.
State and local taxes and licensing fees bring the road subsidy overall close to zero, while localities subsidize transit beyond the federal contribution.

Note on trucking costs
Germany has instituted a technically challenging system of billing trucks using their highways according to mileage tracked by a Geostationary Satellite System. The rate is 12.4 euro cents per kilometer, or about 25 U.S. cents per mile. I do not believe rates currently change by time of day to encourage off hour use (but they could).
The issue of trucking costs is beyond the scope of this paper, but it is worth noting that at an average load of two tons, 1 trillion ton miles is 500 billion truck miles, or 1/9 of overall highway use. To make up all of the $16 billion federal highway subsidy, trucks would have to be allocated only 3 cents per
mile– or 1/8 of what Germany is charging.
Highways are nice because they are multiuse corridors, unlike fixed guideway systems which only transport passengers.

Road versus Rail capacities
One of the most persistent lies spread by the rail lobby is that only their approach has the “capacity” to serve a particular corridor… equal to “x” additional lanes of highway (the “x” ranging from 3 to 6).
This particular fabrication has been repeated so often that most clueless pols will cite it as their rationale for supporting rail. Joseph Goebbels would be proud his techniques still prove effective.

Road versus Rail capacities, continued
In fact, congestion managed lanes have proven to have a people-moving capacity beyond the transit demand of any corridor in the US, and far higher than rail.
The proof is the SINGLE LANE busway which connects the New Jersey Turnpike to midtown Manhattan via the Lincoln Tunnel. It carries 700 buses per hour with an average occupancy per bus of 30, for over 20,000 people per hour. This is far from capacity… it could handle 2-3 times this level of traffic if demand existed.
That corridor is far from optimized. The pavement is in such bad shape that the speed limit is formally 35 mph. The busway is exclusive only in the morning, not the evening. It terminates is a on-line facility (The Port Authority Bus Terminal) instead of a series of off-line facilities, which would enhance the capacity of the lane even further.

But no good deed goes unpunished….
The Port Authority busway has been a transportation success since it started. It also permits access to Newark Airport from midtown Manhattan in ½ hour.
So……The Port Authority, being a typical governmental monopoly, has allowed the facility to run down. Signage is poor, the buses are old, and the Bus Terminal at 8th and 34th St. is rundown, being built in 1950 and not renovated since 1981. Instead…
The Port Authority recently spent close to $2 billion apiece to build rail links to Newark and JFK airports. Each train carries only a few thousand paying passengers per day…far below projections.
After all, though, the costs are the benefits, and enhancing bus service isn’t as sexy as building something new (like a “Skytrain”, with the pork that comes with it.

The “X” extra highway lane fallacy, I
The rail lobbyists compare apples and oranges by talking about bodies crammed into rail cars versus vehicles, mostly single occupant, in highway lanes. It’s bodies versus vehicles, essentially.
Their arithmetic begins with 8-car trains running peak hour frequencies of say 10 per hour. To seat everyone in a 64-seat rail car, that’s 5,000 passengers per hour. Standees will increase this number somewhat.
The reality is that very few corridors have this demand even during peak hours, and that only results from canceling often more convenient express bus service in favor of local rail.
Even so, we know that each lane of the Shirley Highway reversible lanes carries 5,500 persons per lane at peak hour– 11,000 per hour—and that corridor is far from optimized (between motorcycles, hybrids, and cheaters, probably half the capacity is wasted).

The “X” extra lane highway fallacy, II
The rail lobby also insists that the Dulles Corridor is “out” of expansion capacity. This is patently false.
The right of way of the Toll Road is a minimum of 380 feet and most often 400 feet, as is the I-66 connector road. At 12 feet per lane, this is enough right of way for 32 lanes. Take away shoulders, median structures, etc. and 24 lanes is good to go. This is twice what is in operation today.
Each pair of lanes will cost around $10 million per mile to build (given free right of way and no structures) versus $160 million per mile for heavy rail, and has HIGHER general purpose, trucking, AND transit capacity than rail.
The I-66 connector, a notorious bottleneck where five lanes merges into two, only devotes 24 feet of the 400 feet available to peak hour traffic. This is insane. And yet Washington motorists have put up with this absurdity for 25 years.
The “x” extra highway lane fallacy, III
Here are the real numbers from the National Transit Database (2001).
In the DC area, WMATA heavy rail carries 18,073 daily passengers per directional route mile.
Each freeway lane carries a calculated 29,000 daily passengers at an average occupancy of 1.6 persons per vehicle.
Thus, heavy rail operates at 62% of the capacity of a single extra freeway lane. This percentage is an overstatement, given that 1) highways also carry freight, and 2) passengers travel faster, on average, on a freeway than a rail system (which averages 35 mph).
A freeway lane can be built for between $5-15 million per mile, depending on overpasses/structures. Heavy rail costs $150-200 million per mile. Highways pay for themselves operationally, but rail must be heavily subsidized at around $3 million per mile per year, more if depreciation/amortization is included (as it should be).


Why Express Toll Lanes are the “next thing”
For highways with daily traffic above 100,000 vehicles, Express Toll Lanes have been shown to yield an operating profit in the $500,000 per lane mile per year range. This is a decent return on an assumed $4 million per lane mile capital cost.
Express Toll Lanes can be financed and operated by the private sector, taking the strain off state transport finances.
The beauty is that for such corridors, transit vehicles, using off-line terminals and collector routes, have a free uncongested right of way. Transit demand in reality is so low that less than 5% of the capacity of a single ETL is sufficient to meet demand (75 vehicles per hour versus 1,500 vehicle per hour lane capacity).

ETL’s should be solicited wherever possible
In US Cities, the 6% of highway lane miles that are limited access satisfy 45% of passenger mile demand. Since most of these highways are now saturated with traffic, particularly during peak hours, we need to figure out how to implement a seamless network of ETL lanes. Since a single bad intersection will bring down the entire system, this must be planned to interconnect.
How to do this– the combination of public franchising and private financing and operation– is the next challenge in urban transportation.

ETL Necessities
For ETL’s to succeed, the following must be laid in place:
•Access to tax exempt revenue financing
•A planned network that will interconnect so that failed intersections do not bring down the entire system
•A long term structure that will allow the emergence of a system of investor owned highway utilities, modeled after the electricity/water/telecom industries.
Planning for the Future
We know what won’t work… heavy rail is no solution to anything in the suburbs. Light rail doesn’t work either.
The future is unpredictable. In the 1980’s Europe planned its network of high speed intercity railways (Eurostar). They are operating far below projections. Shorter travel has been taken over by express buses…. ½ the price. Longer trips are handled now predominantly by discount airlines, which didn’t exist in Europe 15 years ago. Also ½ the price. Meantime, the EU bureaucrats who planned this expensive network, converging in Brussels, have so alienated their taxpayers that the EU constitution may fail.
Flexible, congestion managed multimodal road networks are today’s best answer to tomorrow’s uncertainty. Modern technology has just begun to be applied to this field, and is where we must focus our efforts.

How about “peak hours”
The WMATA heavy rail system was planned to ferry peak hour commuters from the suburbs to downtown jobs and back again.
Over the course of the day, a WMATA heavy rail line operates at an average of 62% of the capacity of a freeway lane. At peak hours, though, passenger demand will exceed the VEHICLE capacity of a freeway lane. But there is no reason to devote all highway use for free to mostly single occupancy vehicles.
We know from the Shirley Highway experience a pair of freeway lanes can handle 11,000 passengers per hour at 60 mph speeds… far greater than the peak demand for any of the WMATA routes (which operate at 35 mph, even less when you consider station access time/platform access time/waiting time). And that’s without any real optimization, since about one-half the capacity is not utilized. Even so, per vehicle occupancies are above 3.0– also the case for SR-91 in Orange County.

Even simpler solutions…
I-66 outside the Beltway is one of the most intensely utilized highways in the U.S. Yet less than 4 lanes out of a potential 12 are devoted to peak hour use on this radial facility. By simply using one or more shoulders, and reversing one or two lanes in the peak direction, capacity on I-66 could be effectively doubled with almost no extra cost.
As for transit, if just in time ridesharing were promoted and made easier to operate, one out of every ten drivers giving a ride to just one extra passenger during peak hours would obviate the need along those corridors for subsidized transit entirely.
The fact that these simple, low-tech solutions are not on the radar screen illustrates the bankruptcy of the transportation planning process that has grown up.
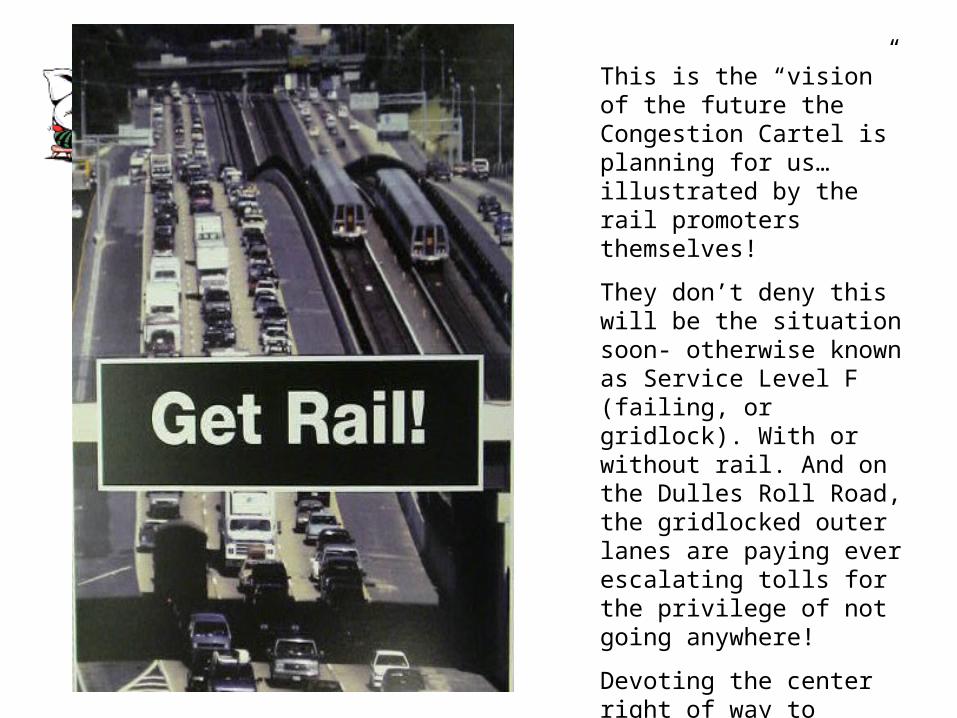
This is the “vision” of the future the Congestion Cartel is planning for us… illustrated by the rail promoters themselves!
They don’t deny this will be the situation soon- otherwise known as Service Level F (failing, or gridlock). With or without rail. And on the Dulles Roll Road, the gridlocked outer lanes are paying ever escalating tolls for the privilege of not going anywhere!
Devoting the center right of way to Express Toll Lanes will not only offer better transit service, it will relieve pressure on the outer (free) lanes.

Worst of All Worlds, another illustration
The Congestion Cartel just finished spending $500,000 of your tax money on a public relations campaign to promote the idea that paying higher tolls on the Dulles Toll Road on the way to Service Level F (total gridlock) was a really neat concept. As part of this Brave New World of higher taxes, higher tolls, and total congestion, they published this picture of their ideal world…highways so unusable that either walking or rail are the only practical alternatives. The rail cars are moving, but the autos aren’t.
Is this the world we want to live in? Is I-66 with tolls the future?

Demand, Induced or Otherwise
So-called “smart growthers” love to talk about “induced demand”, by which they mean more miles being driven when road capacity is added. However, there is almost no empirical evidence that people drive more than necessary. In the DC area, roads fill up since all of us want to travel on modern faster highways rather than congested local and neighborhood roads that have been forced to absorb regional traffic they were not designed for. And if supply has been constrained over the years, as it has here, it is no wonder that demand is there– it has been suppressed.
Another form of “induced demand” is when highway capacity is so restricted due to no-growth rhetoric that people are forced to abandon their preferred travel mode and stuff themselves into transit vehicles. This is the model for the Dulles rail advocates, with 128 passengers per rail car at peak hours (a level which WMATA otherwise calls “unsustainable”.
When we said transit monopoly, we weren’t kidding, kiddoo
The ride-sharing or “slugging” operation on Shirley Highway began when arrogant monopoly WMATA tried to force passengers to switch modes to slower rail when it cancelled express bus service to the inner core. The much admired system, which operates without government subsidies (and thus without pork), carries 44,000 passengers per day along that corridor– far more than the number of new riders Dulles Rail is projected to attract at a true all-in cost over $7 billion. Check it out for yourself: www.Slug-lines.com
How about this “travel alternative” that always guarantees a free seat? Here is what the same arrogant WMATA said about the same subject, long after the failure of heavy rail, and the success of slugging, has been apparent to any unbiased observer:
“The random pairing of drivers and passengers inherent in this form of commuting presents risks that most public agencies are not prepared to assume.” (FEIS, page J-6-21).

Technical Note on Federal Subsidy Calculations
To calculate road subsidies, I use table HF-10 from Highway Statistics. I simply subtract the diversions from the highway fund ("amount for nonhighway purposes" plus "amount for mass transportation," total of $18.4 billion in 2002) from the non-highway funds used for highways (property taxes, general funds, other taxes and fees, total of $34.4 billion in 2002). The result is $16 billion.
To calculate transit subsidies, add capital and operating costs and subtract fares. You can get these data from the National Transit Data Base or from the APTA.com web site. According to APTA.com, 2002 capital costs were $11.8 billion; operating costs were $24.8 billion; and fares were $8.6 billion, leaving $29.0 billion in subsidies. You can get these broken down by mode and by year from 1991 through 2002 from http://www.apta.com/research/stats/. For state-by-state, you have to go to the Transit Data Base or rely on what little data are in Highway Statistics.

Why Not a 21st Century System?
• Mix of High and Low Tech• Information signs, to include just in time
ridesharing information for upcoming zones• Just in time congestion pricing on new highway
capacity• Competition for transit– buses, vans, jitneys, taxis,
collective taxis, unionized, nonunionized, express, local, “public”, private

What is the answer?
• Briefly, more capacity:• HOT lanes/Express Toll Lanes can be added by
private sector, but need to interconnect• Privately run express buses and just in time
carpooling have demonstrated potential (Shirley Highway)
• “Fill in the Grid”– to-and-from the core plan obsolete, a grid is more efficient with transportation capacity
• Need second Potomac crossing

Why do Express Toll Lanes work?
Some basic principles
• User pays. Don’t subsidize one form of transportation over another.– Car users generally pay their way. At most, auto travel
is subsidized ½ cent per mile
– Transit is subsidized at least 50 cents per mile, much more for “choice” heavy rail riders in the suburbs.
• Not true that all transit must be subsidized. There are systems, and cities, where makes economic sense. Visit Wendell Cox’s website at http://Demographia.com

Conclusions-I• Investment:
– Calculate cost-effectiveness using either travel time savings or congestion relief (in DC Area, valued at around $15 per avoided hour).
– Private Sector investment to be given first priority since it is probably cost-effective: Express Toll Lanes, just in time ridesharing (slugging), walking, bicycling. Note: more people in our area walk and bicycle than take public transit.
– Rank all proposed investments by cost effectiveness.– According to latest research, highway forecasts of costs
and value are accurate. Rail is systematically oversold.
Conclusions-II
• Investments, con’d– A common investment threshhold must apply to all
expenditure of transportation funds. This may be lower than in the private sector since the cost of capital is lower, being tax preferred and well secured. But the threshhold should be the same across modes.
– Investments should NOT be subsidized. Transit needs to recover more from the farebox and spend less. Any subsidies should be from the demand side, not the supply side (ie Metrocheck vouchers). Transit pricing must allow for replacement of capital items (depreciation) just as in the private sector.

Conclusions--III• Investments
– In particular, the WMATA Heavy Rail must not be expanded. In the suburbs, the poor are subsidizing richer new rail riders as they travel to higher paying jobs outside the home jurisdiction. Dulles rail will be lucky to cover 1/3 of its operating costs while never paying back any capital costs. The White Elephant needs to be fed, but not to get fatter.
– WMATA deserves the absolute minimum necessary to keep the system safe and running. It is an open question whether some current suburban lines should be decommissioned in favor or dedicating the right of way to congestion managed surface use.
– WMATA needs to competitively contract out everything it can, and until it has done this, should not be given fresh money.
– WMATA’s board should consist of transit professionals, not the politicians who to date have simply fed the elephant more.

Conclusions-IV
• Investments– The Council of Governments needs to rank
order all projects on the Constrained Long Range Plan by cost-effectiveness.
– State and Local Governments and Transportation departments need to present their wish lists rank ordered by the same metrics prior to any request for funds.

Conclusions-V
• Funding– Generally, any project should be funded if it
passes cost-effectiveness criteria.– The 25 year plan calls for spending about $700
per capita per year on transportation infrastructure, maintenance and operating. We already spend more than $700 in annual congestion losses, so we have a lot of catch-up to do.

Conclusions-VI
• Funding: Sources– The best source is the USER. To the extent that the user can be
precisely billed for the market-clearing value of a scarce resource, such as rush hour highway capacity, that option should be chosen as economically efficient. The first application should be Express Toll Lanes. As road pricing technology develops further, it may be possible to apply the concept more widely.
– For transit, users need to pay fully allocated costs for travel and parking. Any subsidies should be on the demand side.
– Until more precise billing technology is available, the gas tax is a suitable proxy for use. It also has the virtue of billing larger vehicles for their more intensive use of the roadway.

Conclusions-VII
• Funding– More freeway capacity can be partly funded by Express Toll Lanes.
We need a seamless network of such facilities on all our urban interstates.
– Arterial and collector improvements should be funded by gas taxes.– Neighborhood streets part of new developments should be funded
by a tax district allowing developer access to tax advantaged revenue financing, allowing homeowners to deduct the debt service on such improvements as local taxes on their tax returns.
– The Virginia proffer system needs to be replaced by a scientifically calculated mobility impact fee financed not by expensive up-front developer money, but by cheap revenue improvement bonds. Otherwise, we will chronically underinvest in our infrastructure.

As for a dedicated source for WMATA.. NO!
• WMATA must not receive a dedicated source of funding beyond its current resources.
• To do so would relieve the pressure to operate the system efficiently and have the USER PAY.
• At 330,000,000 trips/year, WMATA simply needs to raise the price of its service $1 per transaction on the average to pay for operating deficits. $1.50 per transaction would provide money for capital upgrades. It can also trim down cost of operating by contracting out wherever possible.
• Since Heavy Rail is not cost effective, no money, new or old, should go for further rail expansion. If done right, Bus Rapid Transit can be profitable and that is a technology that WMATA needs to learn. Far better to combine express regional bus service with our emerging network of Express Toll Lanes, a mixed guideway system.

Advice for WMATA:
The good news in closing.
• Congestion is an entirely manageable issue, and can be solved with the application of classic economic principles.
• Don’t listen to those who say that congestion is here to stay and that we can’t build or plan our way out of it. Vote them out of office at the next opportunity.
• Remember, congestion is worse in states where term limits aren’t in place! And remember who got us into the mess in the first place.