PLANNING & DEVELOPMENT DEPARTMENT GOVERNMENT OF...
323
2015 BUREAU OF STATISTICS PLANNING & DEVELOPMENT DEPARTMENT GOVERNMENT OF SINDH KARACHI-75600
Transcript of PLANNING & DEVELOPMENT DEPARTMENT GOVERNMENT OF...
2015
BUREAU OF STATISTICS
PLANNING & DEVELOPMENT DEPARTMENT GOVERNMENT OF SINDH KARACHI-75600

FOR OFFICIAL USE ONLY
DDEEVVEELLOOPPMMEENNTT SSTTAATTIISSTTIICCSS
OOff
SSIINNDDHH 22001155

DIRECTOR GENERAL SECRETARIATE FAX: 99251254
Dr. Naseem-ul-Ghani Sahito Director General 99206674
99206672
ADMINISTRATION
Mr. Ali Ahmed Channa Director 99206680
Mr. Moin Alam Khan Deputy Director (Admin) 99206675
Mr. Muhammad Kashif Deputy Director (B&C) 99251008
DATA PROCESSING SECTION
Mr. Muneer Hussain Qureshi Programer 99251252
Mr. Muhammad Khaleeq KPVO -INDUSTRIES
i. CENSUS OF MANUFACTURING INDUSTRIES
Manufacturing (CMI) & Electricity, Gas and Mining, Mr. Muhammad Kazim Jaffri Deputy Director 99251259
ii. MONTHLY INDUSTRIALPRODUCTION & EMPLOYMENT (MIPE) Monthly Industrial Production Mr. Mazhar Hussain Statistical Officer -do- & Employment (MIPE)
PUBLICATION Mr. Moin Alam Khan Deputy Director 99206675Mr. Izat Ali Chachar Statistical Officer -
AGRICULTURE & HUMAN RURAL SETTLEMENT SURVEY
Climate, Agriculture, Fishery, Mr. Muhammad Akram Bhatti Deputy Director -
Forestry, Livestock, Food Grains Syed Talib Ali Statistical Officer -
& Storage
SOCIAL STATISTICS
Population, Public Finance, Mr. Arshad Maroof Deputy Director 99206679
Financial Institutions, Mrs. Sidrat-ul-Muntaha Statistical Officer - Transport and Communication, Mrs. Tather Zahera Statistical Officer - Education, Health & Crimes.
REGIONAL ACCOUNTS & GIS
Mr. Muhammad Nasir Khan Statistical Officer -
MULTIPLE INDICATOR CLUSTER SURVEY (MICS)
Mr. Muhammad Kazim Jaffri Deputy Director 99251259
SECTION / SECTOR / NAME DESIGNATION
SINDH BUREAU OF STATISTICS
ST-13, BLOCK-8, CHOUDRY KHALEEQ-UZ-ZAMAN ROAD
KEHKESHAN CLIFTON, KARACHI-75600
BUREAU OF STATISTICS COMPLEX

PREFACE
Bureau of Statistics has been releasing Development Statistics of Sindh since 1971. The
present Publication for the year 2015 is the latest issue in the series. It contains latest available
Statistics on socio-economic sectors (Climate, Population, Agriculture, Fishery, Forestry, Livestock,
Food, Gran, Manufacturing, Electricity, Gas, Mining, Public Finance, Financial Institutions, Transport
& Communication, Education Health and Crime) of the province. Information relating to National
Accounts, Banking and Foreign Trade has been given at National level. A statistical abstract showing
comparative picture of Pakistan and Sindh has also been given in the beginning of the publication.
I would like to place on record my appreciation for the hard work put in by the officers /
officials of Bureau in bringing out this Publication.
It is hoped that data contained in this publication will be of immense use for
administrators, planners, policy makers, research scholars and other users.
The information contained in this publication has been collected from various
Government Departments, Autonomous Bodies and Corporations functioning at Federal and Provincial
level. I gratefully acknowledge the departments for supplying data. We look forward to their
cooperation in future as well.
Suggestions for the improvement of format and contents of future issues of this
publication will be highly appreciated.
Dr. Nasim ul Ghani Sahito Director General BUREAU OF STATISTICS Government of Sindh, P.O. Box No. 3879 Kehkashan, Clifton, Karachi

To Convert Multiply by To Convert Multiply by
Inches to Centimetres 2.540 Cub. Centimetre to Cub. Inches 0.06102Centimetres to Inches 0.3937 Cub. Feet to Cub. Metres 0.02832Feet to Metres 0.3048 Cub. Metres to Cub. Feet 35.31Metres to Feet 3.281 Cub. Yards to Cub. Metres 0.7646Yards to Metres 0.9144 Cub. Metres to Cub. Yards 1.308Metres to Yards 1.094 Cub. Inches to Litres 0.01639Miles to Kilometres 1.609 Litres to Cub. Inches 61.03Kilometres to Miles 0.6214 Gallons to Litres 4.546Sq. Inches to Sq. Centimetres 6.452 Litres to Gallons 0.22Sq. Centimetres to Sq. Inches 1.155 Grains to Grams 0.0648Sq. Feet to Sq. Metres 0.0929 Grams to Grains 15.43Sq. Metres to Sq. Feet 10.76 Ounces to Grams 28.35Sq. Yards to Sq. Metres 0.8361 Grams to Ounces 0.03527Sq. Metres to Sq. Yards 1.196 Pounds to Grams 453.6Sq. Miles to Sq. Kilometres 2.590 Grams to Pounds 0.002205Sq. Kilometres to Sq. Miles 0.3861 Pounds to Kilograms 0.4536Acres to Hectares 0.4047 Kilograms to Pounds 2.205Hectares to Acres 2.471 Tons to Kilograms 1016.0Cub. Inches to Cub. Centimetre 16.39 Kilograms to Tons 0.0009842
1 Millimetre 1/25th of an Inch 1000 Kilograms About 1 Metric Ton
1 Centimetre 13/32nd of an Inch 1 Litre 1 3/4 Pints
1 Metre 39 1/2 Inches 1 Lb. avoir 453 1/2 Grams
1 Kilometre 1093 1/2 Yards 5 Kilograms About 11 Pounds
1 Foot About 30 Centimetre 1 Gram About 15 Grains
1 Kilogram About 2 Lbs. 1 Cwt. About 50 Kilograms
METRIC SYSTEM (Handy Conversion Rules)
vii
USEFUL MEMORANDA

viii
1. Calendar Year : 1st January to 31st December.
2. Fiscal Year : 1st July to 30th June.
3. Kharif Crop : Sown in last Spring on the beginning
of Summer and harvest in the Autumn.
4. Rabi Crop : Sown in Autumn and harvested in the
following Spring.
.. = Nil or insignificant Prod. = Product
- = Not available N.E.C = Not else where classified
P = Provisional Ex. = Except
R = Repeated Mach. = Machinery
T.V = Television Admn. = Administration
r = Revised M.Buses = Mini Buses
E = Estimated D.Vans = Delivery Vans
Sq. K.m. = Square Kilometre O.T.Assistant = Operation Theater Assistant
F.wr. = Foot Wear R.H.Centre = Rural Health Centre
Excld. = Excluding L.H.V. = Lady Health Visitors
Rub. = Rubber M.C.H.C = Mother Child Health Centre
Pub. = Publishing Misc. = Miscellaneous
Ind. = Industries S.B. Abad = Shaheed Benazir Abad
Pharma. = Pharmaceutical
In some tables totals may not tally due to rounding of figures.
SPECIFICATIONS & SYMBOLS
SYMBOLS AND EQUIVALENTS
ix
CONTENTS
SECTOR / TABLE NO.
T I T L E PAGE NO.
.. FOREWORD iii
.. PREFACE v
.. Metric System (Handy Conversion Rules) vii
.. Notes, Symbols and equivalents viii
.. STATISTICAL ABSTRACT xxvii-xL
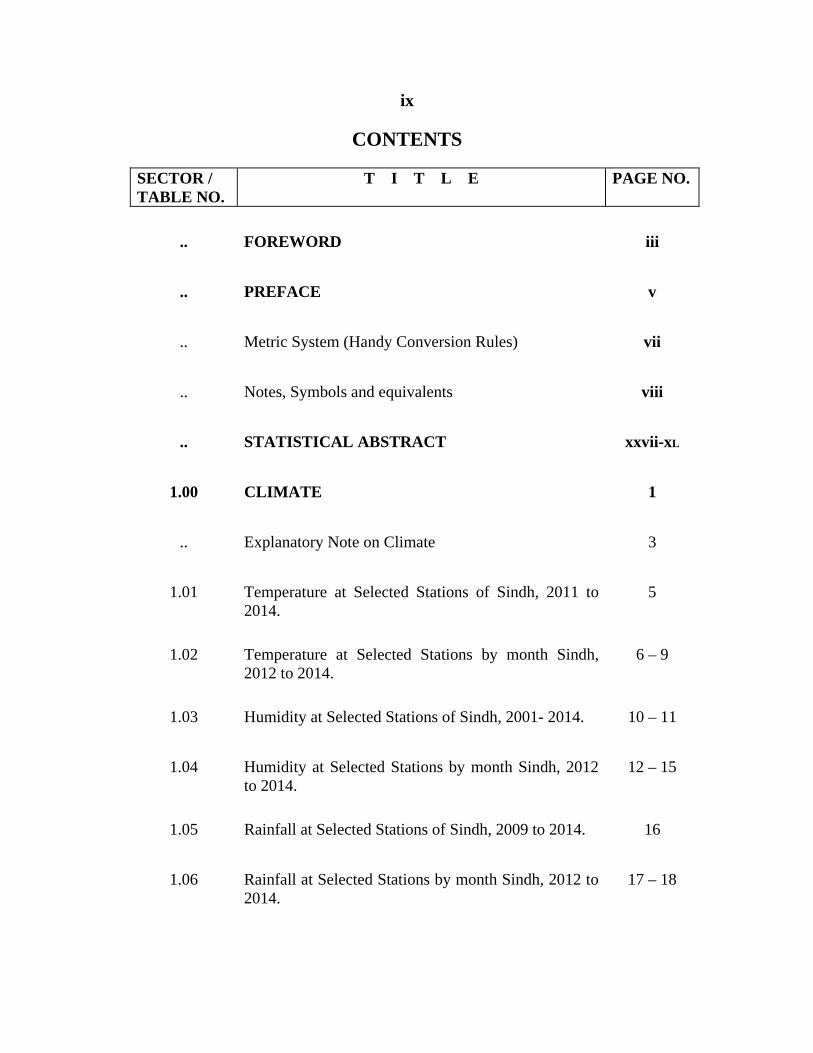
1.00 CLIMATE 1
.. Explanatory Note on Climate 3
1.01 Temperature at Selected Stations of Sindh, 2011 to 2014.
5
1.02 Temperature at Selected Stations by month Sindh, 2012 to 2014.
6 – 9
1.03 Humidity at Selected Stations of Sindh, 2001- 2014. 10 – 11
1.04 Humidity at Selected Stations by month Sindh, 2012 to 2014.
12 – 15
1.05 Rainfall at Selected Stations of Sindh, 2009 to 2014. 16
1.06 Rainfall at Selected Stations by month Sindh, 2012 to 2014.
17 – 18

x
CONTENTS
SECTOR / TABLE NO.
T I T L E PAGE NO.
2.00 POPULATION 19
.. Explanatory Note on Population. 21
2.01 Area, Population and Population Density by Province/Region, 1951, 1961, 1972, 1981 & 1998.
23
2.02 Population of Pakistan by Province/Region 1951, 1961, 1972, 1981 & 1998.
24
2.03 Population and Growth Rate by Province/Region (Urban/Rural) Areas of Pakistan, 1972, 1981 and 1998.
25
2.04 Population and Growth Rate by District in Sindh, 1941 to 1998 (Census).
26 – 27
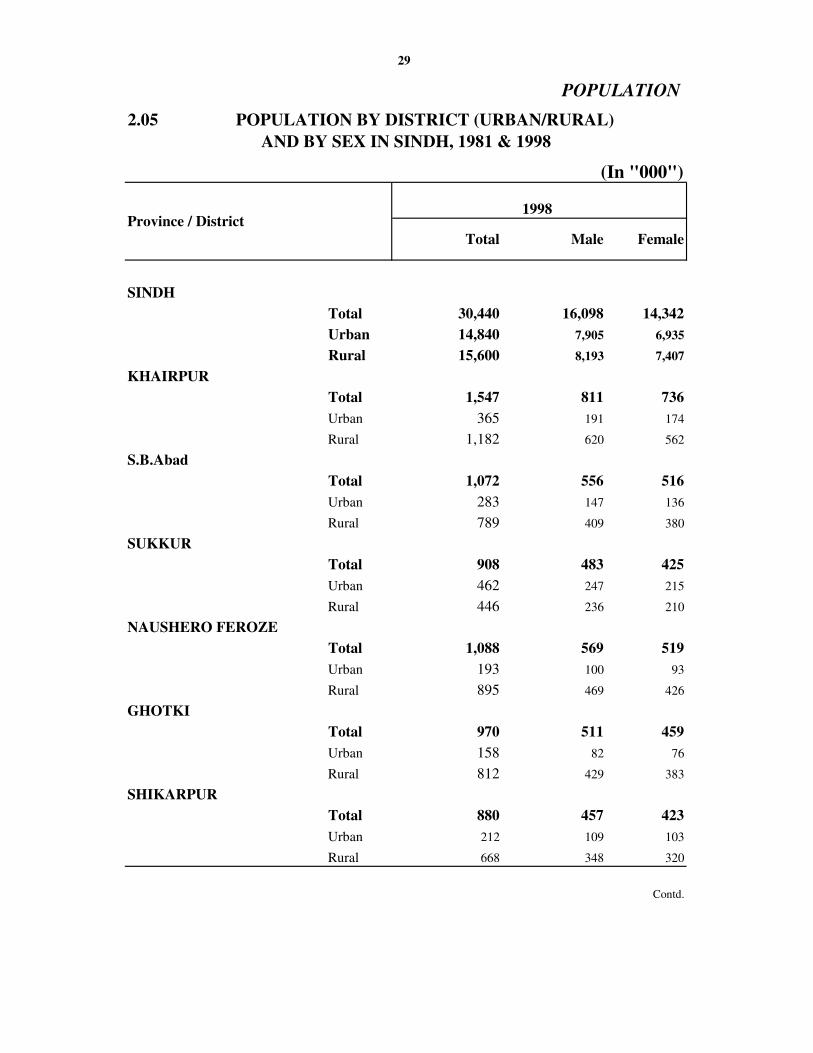
2.05 Population by District (Urban/Rural) and by Sex in Sindh, 1981 & 1998.
28 – 33
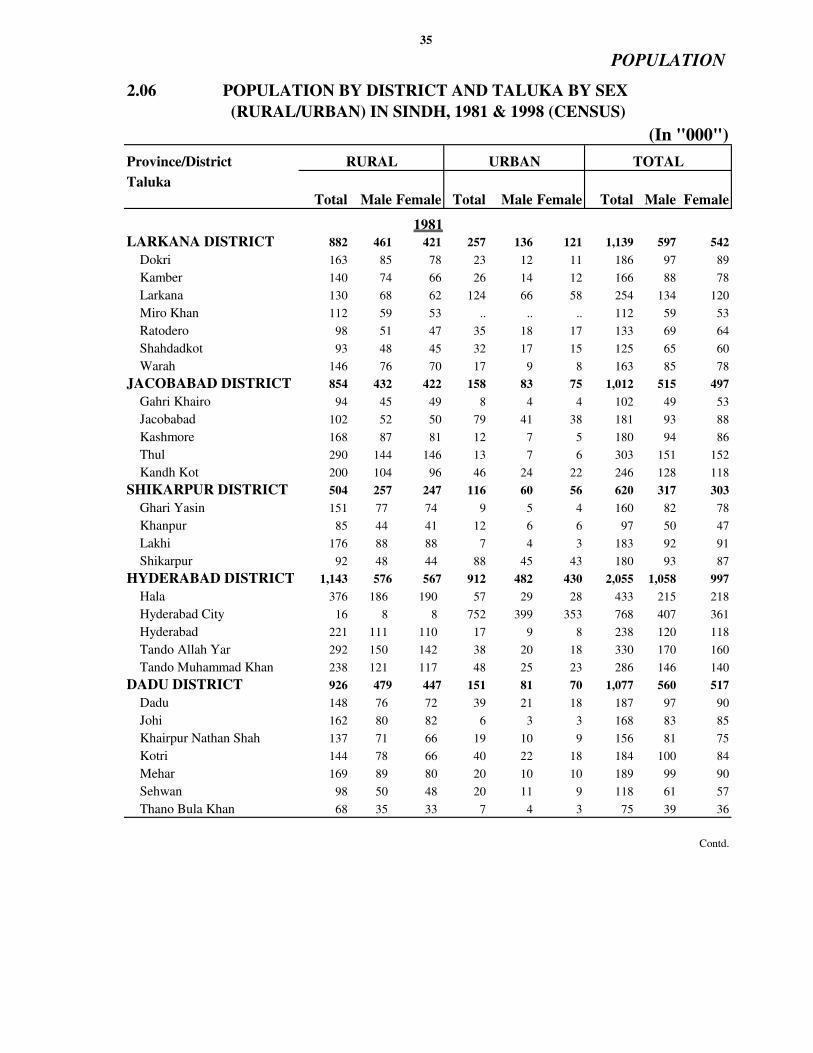
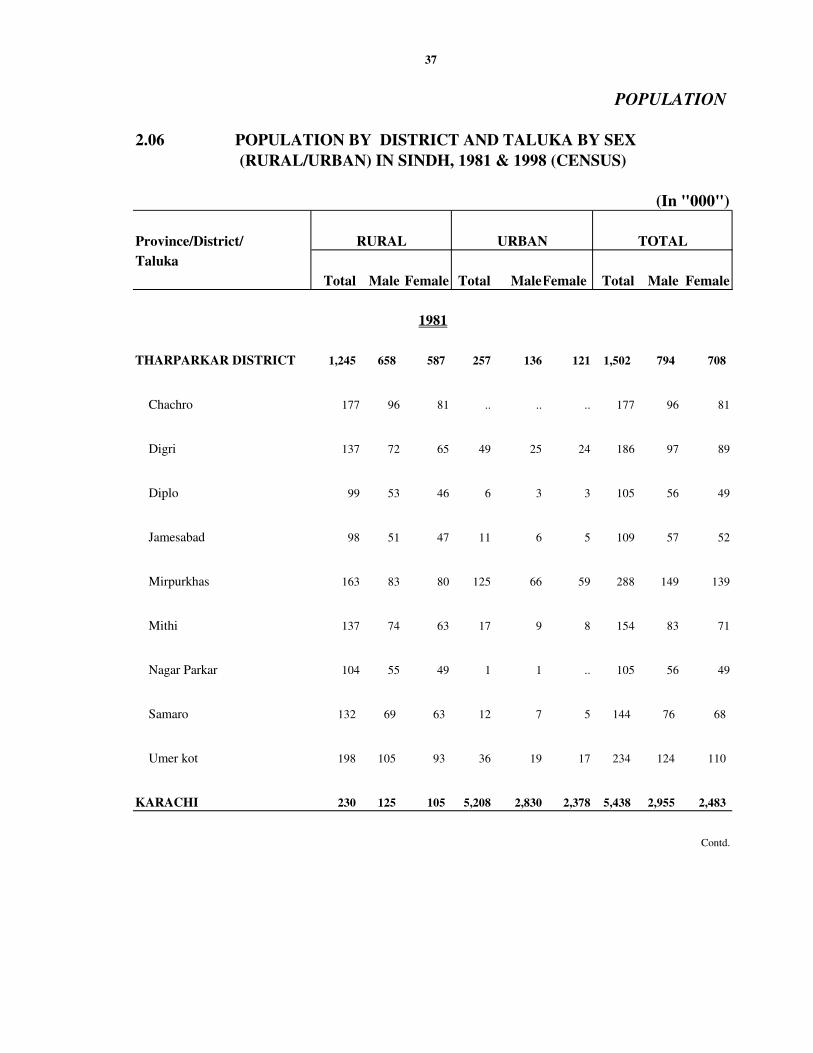
2.06 Population by District and Taluka by Sex (Rural /
Urban) in Sindh, 1981 & 1998 (Census).34 – 41
2.07 Population by District and Taluka in Sindh, 1998 Census (Adjusted Population of Newly created Districts after 1998 Census).
42 – 45
2.08 Population by age group, Sex and Rural / Urban in Sindh, 1998.
46
2.09 Projected Population by district of Sindh, 2011 to
2015. 47 – 48
- Chart of Population by Province/Regions of Pakistan,
1998. 49
xi
CONTENTS
SECTOR / TABLE NO.
T I T L E PAGE NO.
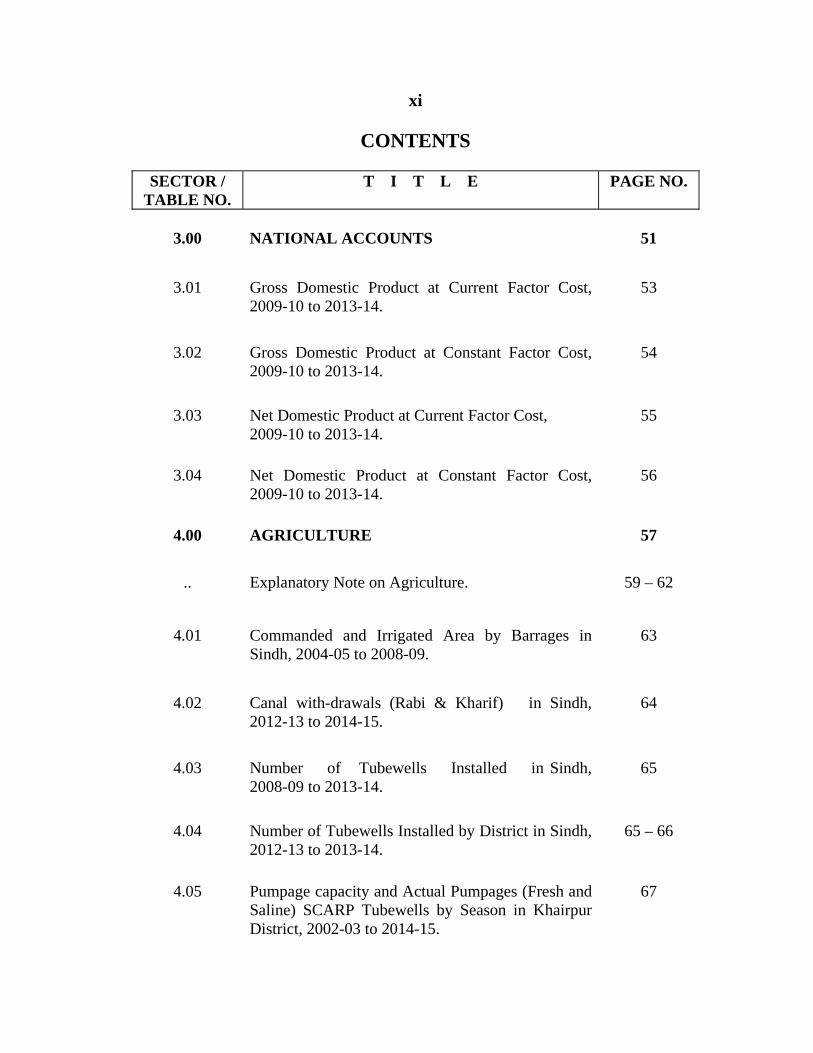
3.00 NATIONAL ACCOUNTS 51
3.01 Gross Domestic Product at Current Factor Cost,
2009-10 to 2013-14. 53
3.02 Gross Domestic Product at Constant Factor Cost, 2009-10 to 2013-14.
54
3.03 Net Domestic Product at Current Factor Cost, 2009-10 to 2013-14.
55
3.04 Net Domestic Product at Constant Factor Cost,
2009-10 to 2013-14.56
4.00 AGRICULTURE 57
.. Explanatory Note on Agriculture. 59 – 62
4.01 Commanded and Irrigated Area by Barrages in Sindh, 2004-05 to 2008-09.
63
4.02 Canal with-drawals (Rabi & Kharif) in Sindh, 2012-13 to 2014-15.
64
4.03 Number of Tubewells Installed in Sindh, 2008-09 to 2013-14.
65
4.04 Number of Tubewells Installed by District in Sindh, 2012-13 to 2013-14.
65 – 66
4.05
Pumpage capacity and Actual Pumpages (Fresh and Saline) SCARP Tubewells by Season in Khairpur District, 2002-03 to 2014-15.
67

xii
CONTENTS
SECTOR / TABLE NO.
T I T L E PAGE NO.
4.06 Number of Bulldozers by District in Sindh,
2009-10 to 2013-14.68
4.07 Sale of Fertilizer in Sindh, 2002-03 to 2013-14. 68
4.08 Sale of Fertilizer (Indigenous and Imported) by District in Sindh, 2010-11 to 2013-14.
69 – 70
4.09 Price of various Type of Fertilizer in Sindh, 2009-10 to 2013-14.
71
4.10 Quantity of Pesticides Sold in Sindh, 2007-08 to 2012-13.
72
4.11 Plant Protection (Curative Measures) by Crops in Sindh, 2001-02 to 2013-14.
73
4.12 Land Utilization in Sindh, 2001-02 to 2013-14. 74
4.13 Land Utilization by District in Sindh, 2012-13 to 2013-14.
75 – 78
4.14 Number & Area of Farm by Size in Sindh, 2000 & 2010 Census.
79 – 80
4.15 Private Farm and Farm Area by Tenure and Size of Farm in Sindh, 2000 & 2010 Census.
81 – 82
4.16 Quantum Index of Agriculture Production of Sindh, 2010-11 to 2012-13 (Base:-1985-86=100).
83

xiii
CONTENTS
SECTOR / TABLE NO.
T I T L E PAGE NO.
4.17 Area, Production & Yield of Major Crops of
Kharif Season in Sindh, 2001-02 to 2013-14.84
4.18 Area, Production and Yield of Major Crops of Rabi Season in Sindh, 2001-02 to 2013-14.
85
4.19 Area and Production of Rice by District in Sindh, 2011-12 to 2013-14.
86
4.20 Area and Production of Wheat by District in Sindh, 2011-12 to 2013-14.
87
4.21 Area and Production of Jowar by District in Sindh, 2011-12 to 2013-14.
88
4.22
Area and Production of Bajra by District in Sindh, 2011-12 to 2013-14.
89
4.23 Area and Production of Maize by District in Sindh, 2011-12 to 2013-14.
90
4.24 Area and Production of Gram by District in Sindh, 2011-12 to 2013-14.
91
4.25
Area and Production of Barley by District in Sindh, 2011-12 to 2013-14.
92
4.26 Area and Production of Rapeseed and Mustard by District in Sindh, 2011-12 to 2013-14.
93
4.27 Area and Production of Seasamum by District in
Sindh, 2011-12 to 2013-14.94
4.28 Area and Production of Sugarcane by District in
Sindh, 2011-12 to 2013-14. 95
xiv
CONTENTS
SECTOR / TABLE NO.
T I T L E PAGE NO.
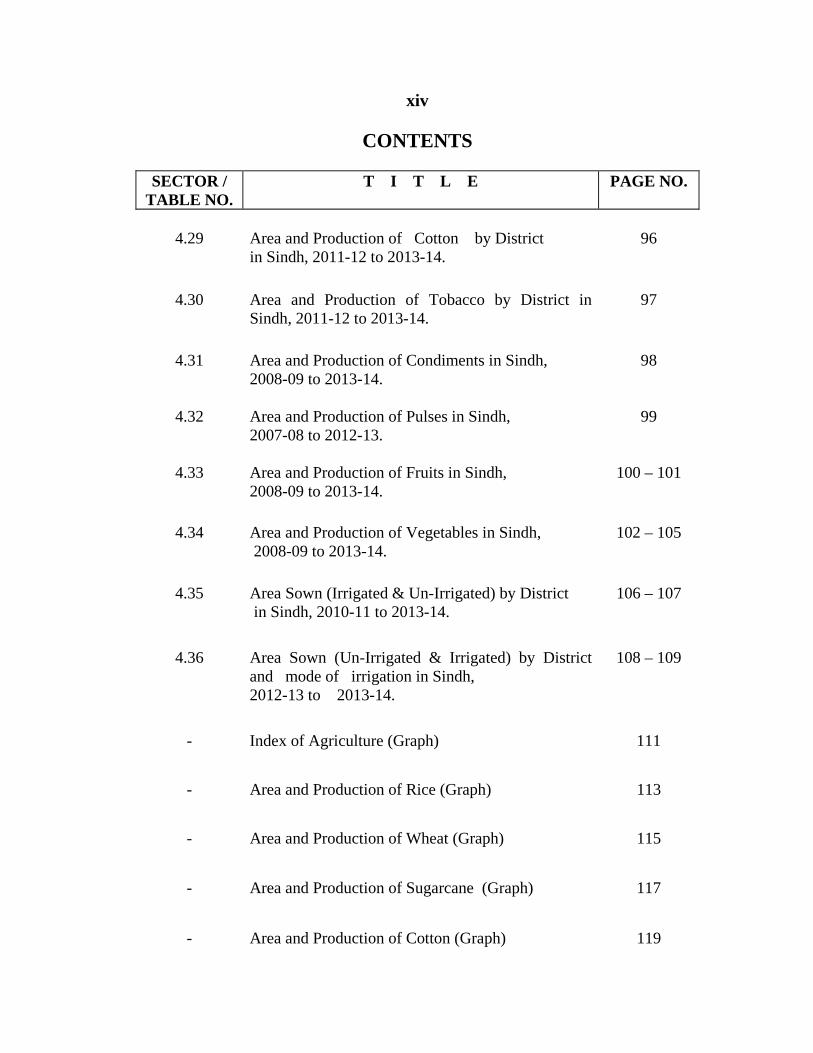
4.29 Area and Production of Cotton by District
in Sindh, 2011-12 to 2013-14.96
4.30 Area and Production of Tobacco by District in Sindh, 2011-12 to 2013-14.
97
4.31 Area and Production of Condiments in Sindh, 2008-09 to 2013-14.
98
4.32 Area and Production of Pulses in Sindh,
2007-08 to 2012-13.99
4.33 Area and Production of Fruits in Sindh,
2008-09 to 2013-14.100 – 101
4.34 Area and Production of Vegetables in Sindh,
2008-09 to 2013-14.102 – 105
4.35 Area Sown (Irrigated & Un-Irrigated) by District in Sindh, 2010-11 to 2013-14.
106 – 107
4.36 Area Sown (Un-Irrigated & Irrigated) by District and mode of irrigation in Sindh, 2012-13 to 2013-14.
108 – 109
- Index of Agriculture (Graph) 111
- Area and Production of Rice (Graph) 113
- Area and Production of Wheat (Graph) 115
- Area and Production of Sugarcane (Graph) 117
- Area and Production of Cotton (Graph) 119

xv
CONTENTS
SECTOR / TABLE NO.
T I T L E PAGE NO.
5.00 FISHERY, FORESTRY, LIVESTOCK, FOOD GRAINS AND STORAGE
121
5.01 Fish Production in Sindh, 2003 to 2014. 123
5.02 Marine Fish Production Variety wise in Sindh, 2009 to 2014 (Karachi and Sindh Coasts).
124
5.03 Fishing Crafts (Marine and Inland) in Sindh, 2003 to 2014.
125
5.04 Inland Fisheries Statistics in Sindh, 2003 to 2014. 126
5.05 Inland Fisheries Statistics by District in Sindh, 2013 to 2014.
127
5.06 Number of Livestock in Sindh, 1986, 1996 & 2006 (Census).
128
5.07 Number of Livestock by District in Sindh, 1996 and 2006 (Census).
129 -130
5.08 Livestock Slaughtered in Sindh, 2004-05 to 2013-14.
131
5.09 Livestock Slaughtered by District in Sindh, 2014-15 to 2015-16.
132 – 133
5.10 Recognized Slaughter Houses by District in Sindh, 2008-09 to 2014-15.
134

xvi
CONTENTS
SECTOR / TABLE NO.
T I T L E PAGE NO.
5.11 Number of Veterinary Hospitals, Dispensaries and Veterinary Centres by District in Sindh, 2011-12 to 2014-15.
135 – 136
5.12 Animals Vaccinated, Treated and Castrated in Sindh, 2001-02 to 2013-14.
137
5.13 Animals Vaccinated, Treated and Castrated by District in Sindh, 2011-12 to 2014-15.
138
5.14 Area Under Forest by District in Sindh, 2008-09 to 2012-13.
139
5.15 Out turn of Forest by District in Sindh, 2012-13 to 2013-14.
140 – 141
6.00 MANUFACTURING 143
.. Explanatory Note on Manufacturing Industries. 145 – 148
6.01 Census of Manufacturing Industries of Sindh, 1985-86 to 1991-92, 1995-96, 2000-01 and 2005-06.
149
6.02 Major Industry Groups for Census of Manufacturing Industries (C.M.I) in Sindh, 2005-06.
150 – 151
6.03 Major Industry Groups for Census of Manufacturing Industries (CMI) by District in Sindh, 2005-06.
152 – 153

xvii
CONTENTS
SECTOR /
TABLE NO. T I T L E PAGE NO.
6.04 Index of Industrial Production of Sindh,
2013-14 (Base: - 1980-81=100).154 – 155
6.05 Industrial Production of Selected Large Scale
Industries in Sindh, 2010-11 to 2013-14. 156 – 163
6.06 Number of Factories Covered, Total Employment and Production Workers in Selected Large Scale Industries in Sindh, 2010-11 to 2013-14.
164 – 165
- Index of Industrial Production (Graph) 167
7.00 ELECTRICITY, GAS & MINING 169
.. Explanatory Note on Electricity and Gas. 171-172
7.01 Electricity Consumption and Number of Consumers in Sindh, 2005-06 to 2013-14.
173 – 174
7.02 Electricity Consumption and Number of Consumers by Month in Sindh, 2012-13 to 2013-14.
175 – 176
7.03 Consumers of Electricity and Units Sold by Categories WAPDA in Sindh, 2003-04-2013-14
177 – 178
7.04 Consumption and No. of Consumers of
Electricity by Month WAPDA in Sindh, 2012-13 and 2013-14.
179 – 182
7.05 New Electricity Connections Given and Applications Pending with WAPDA by Consumers Groups in Sindh, 2003-04 to 2013-14.
181

xviii
CONTENTS
SECTOR /
TABLE NO. T I T L E PAGE NO.
7.06 Installed Generating Capacity of Power Statistics
National Grid WAPDA in Sindh, 2009-10 to 2013-14.
182
7.07 Consumption and Number of Consumers of Electricity by K.E in Sindh, 2003-04 to 2013-14.
183 – 184
7.08 Consumption and Number of Consumers of Electricity of K.E. by Month in Sindh, 2012-13 and 2013-14.
185 – 186
7.09 Consumption and Number of Consumers of Gas by Groups in Sindh, to 2003-04 to 2013-14 .
187
7.10 Consumption and Number of Consumers of Gas by
Month/Groups in Sindh, 2012-13 to 2013-14. 188
7.11 Consumption and Number of Consumers of Karachi
Gas by Month/Groups in Sindh, 2012-13 to 2013-14.
189
7.12 Consumption and Number of Consumers of Indus Gas by Month/Groups in Sindh, 2012-13 to 2013-14
190
7.13 Production of Selected Minerals in Sindh, 2009 to 2014.
191
8.00 PUBLIC FINANCE 193
8.01 Sector Wise Development Expenditure of Sindh Government Budget, 2010-11 to 2014-15.
195 – 196
8.02 Sectoral Distribution of Annual Development Programme of Sindh, 2013-14 to 2014-15.
197 –198

xix CONTENTS
SECTOR /
TABLE NO. T I T L E PAGE NO.
8.03 Summary Statement of Revenue Receipts of Sindh, 2011-12 to 2014-15.
199
8.04 Summary Statement of Revenue Expenditure of
Sindh, 2011-12 to 2014-15. 200
8.05 Summary Statement of Capital Receipts of Sindh,
2011-12 to 2014-15.201
8.06 Summary Statement of Capital Expenditure of Sindh, 2011-12 to 2014-15.
202
8.07 Central Excise Duty Recovered by Region in Sindh, 1994-95 to 2003-04.
203
8.08 Provincial Excise Duty and Taxes Recovered in Sindh, 2008-09 to 2012-13.
203
8.09 Provincial Excise Duty and Taxes Recovered by District in Sindh, 2012-13 to 2013-14.
204 – 209
- Sectoral distribution of Annual Development Programme (Graph).
211
9.00 FINANCIAL INSTITUTIONS 213
9.01 Zarai Taraqiati Bank Limited Financing in Sindh, 2001-02 to 2013-14
215
9.02 Zarai Taraqiati Bank Limited Financing by District
in Sindh, 2012-13 to 2013-14.216
9.03 Zarai Taraqiati Bank Limited Term wise
Composition of Loans Disbursed in Sindh, 2001-02 to 2013-14.
217

xx CONTENTS
SECTOR /
TABLE NO. T I T L E PAGE NO.
9.04 Zarai Taraqiati Bank Limited Loans Advances According to Size of Holdings and Loans Sanctioned in Sindh, 2011-12 to 2013-14.
218
9.05 Zarai Taraqiati Bank Limited Purpose wise Agriculture Credit Development & production Loans Disbursement in Sindh, 2011-12 to 2013-14.
219– 220
9.06 H.B.F.C. Loans Sanctioned, Disbursed and Recovered in Sindh, 2001-02 to 2013-14.
221
9.07 H.B.F.C Loans Sanctioned, Disbursed and Recovered by District in Sindh, 2012-13 to 2013-14.
222 – 224
10.00 BANKING
225
10.01 Liabilities and Assets of the State Bank of Pakistan Issue Department, 2010-11 to 2013-14.
227
10.02 Gold and Foreign Exchange Reserves of Pakistan, 2008-09 to 2013-14.
228
10.03 Classification of Scheduled Banks Advances by Size of Accounts of Commercial Banks of Pakistan, 2010 to 2014.
229
10.04 Schedule Banks Deposits Distributed by Size of Accounts of Pakistan, 2010 to 2014.
229
10.05 National Saving Scheme (Outstanding amount), 2003 to 2014.
230 – 232
xxi
CONTENTS
SECTOR /
TABLE NO. T I T L E PAGE NO.
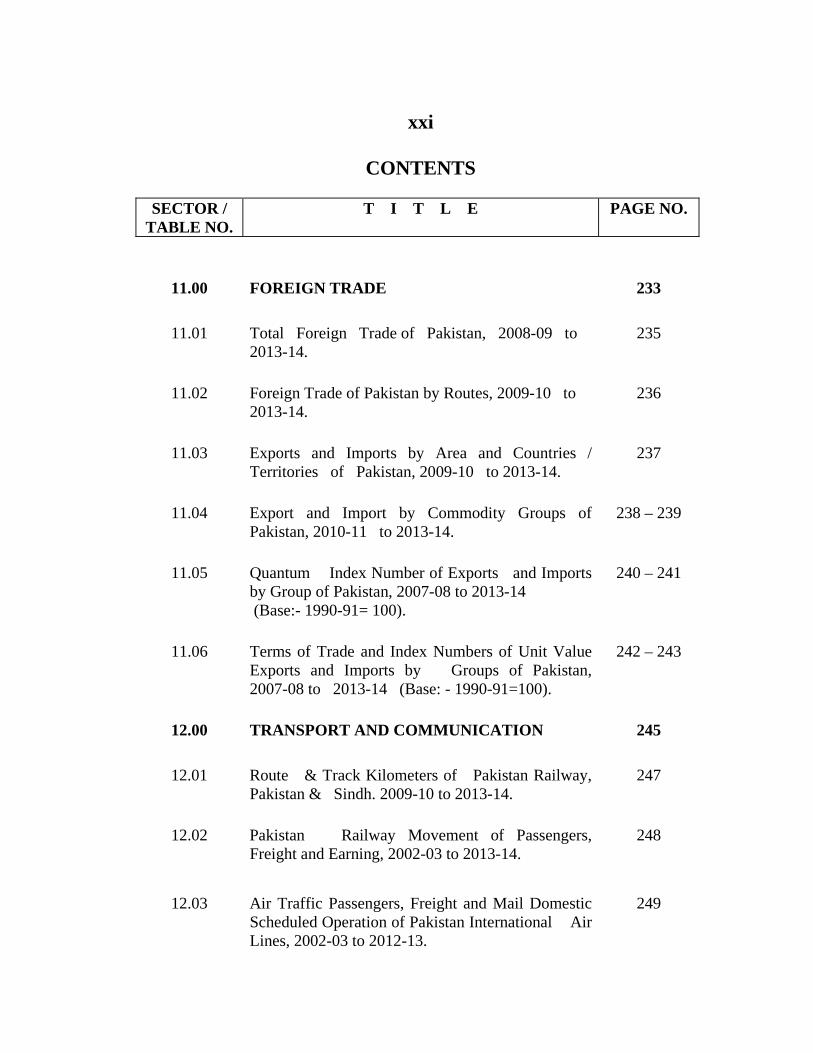
11.00 FOREIGN TRADE 233
11.01 Total Foreign Trade of Pakistan, 2008-09 to 2013-14.
235
11.02 Foreign Trade of Pakistan by Routes, 2009-10 to
2013-14. 236
11.03 Exports and Imports by Area and Countries / Territories of Pakistan, 2009-10 to 2013-14.
237
11.04 Export and Import by Commodity Groups of
Pakistan, 2010-11 to 2013-14.238 – 239
11.05 Quantum Index Number of Exports and Imports
by Group of Pakistan, 2007-08 to 2013-14 (Base:- 1990-91= 100).
240 – 241
11.06 Terms of Trade and Index Numbers of Unit Value
Exports and Imports by Groups of Pakistan, 2007-08 to 2013-14 (Base: - 1990-91=100).
242 – 243
12.00 TRANSPORT AND COMMUNICATION 245
12.01 Route & Track Kilometers of Pakistan Railway, Pakistan & Sindh. 2009-10 to 2013-14.
247
12.02 Pakistan Railway Movement of Passengers, Freight and Earning, 2002-03 to 2013-14.
248
12.03 Air Traffic Passengers, Freight and Mail Domestic Scheduled Operation of Pakistan International Air Lines, 2002-03 to 2012-13.
249

xxii CONTENTS
SECTOR /
TABLE NO. T I T L E PAGE NO.
12.04 Road Kilometers by Type in Pakistan,
2004 to 2013.249
12.05 Road Kilometres by Type in Sindh, 2009-10 to 2013-14.
250
12.06 Road Kilometers by District in Sindh,
2011-12 to 2013-14.250
12.07 Motor Vehicles “ON ROAD", “REGISTERED” &
“STOOD REGISTERED” in Sindh, 2010-11 to 2013-14.
251
12.08 Motor Vehicles "ON ROAD" by Type and District
in Sindh, 2012-13 to 2013-14.252 – 255
12.09 Radio and Television Licenses Estimated in Sindh,
1993-94 to 2013-14.256
12.10 Revenue Paid by T.V Set Holders in Sindh,
2001-02 to 2013-14.257
12.11 T.V Licenses Estimated by District in Sindh, 2011-12 to 2013-14.
257
- Motor Vehicles “On Road” (Graph). 259
13.00 EDUCATION 261 .. Explanatory Note on Education. 263 – 265
13.01 Number of Institutions, Enrolment and Teaching Staff in Sindh, 2012-13 to 2013-14.
267 – 268
13.02 Number of Primary Schools by Sex and District in Sindh, 2011-12 to 2013-14
269

xxiii CONTENTS
SECTOR /
TABLE NO. T I T L E PAGE NO.
13.03 Enrolment of Primary Schools by Sex and District in Sindh, 2011-12 to 2013-14.
270
13.04 Teaching Staff in Primary Schools by Sex and
District in Sindh, 2011-12 to 2013-14 271
13.05 Number of Middle Schools by Sex and District in
Sindh, 2011-12 to 2013-14. 272
13.06 Enrolment of Middle Schools by Sex and District in
Sindh, 2011-12 to 2013-14.273
13.07 Teaching Staff in Middle Schools by Sex and District in Sindh, 2011-12 to 2013-14.
274
13.08 Number of Secondary Schools by Sex and District in Sindh, 2011-12 to 2013-14.
275
13.09 Enrolment of Secondary Schools by Sex and District in Sindh, 2011-12 to 2013-14.
276
13.10 Teaching Staff in Secondary Schools by Sex and District in Sindh, 2011-12 to 2013-14.
277
13.11 Number of Intermediate Colleges by Sex and District in Sindh, 2011-12 to 2013-14.
278
13.12 Enrolment of Intermediate Colleges by Sex and District in Sindh, 2011-12 to 2013-14.
279
13.13 Teaching staff of Intermediate Colleges by Sex and District in Sindh, 2011-12 to 2013-14.
280
13.14 Number of Degree Collleges by Sex and District in Sindh, 2011-12 to 2013-14.
281

xxiv CONTENTS
SECTOR /
TABLE NO. T I T L E PAGE NO.
13.15
Enrolment of Degree Colleges by Sex and District in Sindh, 2011-12 to 2013-14.
282
13.16 Teaching Staff in Degree Colleges by Sex and District in Sindh, 2011-12 to 2013-14.
283
13.17 Number of Post graduate Colleges by Sex and District in Sindh, 2011-12 to 2013-14.
284
13.18 Enrolment of Post graduate Colleges by Sex and District in Sindh, 2011-12 to 2013-14.
285
13.19 Teaching Staff in Post graduate Colleges by Sex and District in Sindh, 2011-12 to 2013-14.
286
13.20 Number of Technical Colleges and Polytechnic / Mono-Technical Institutions by Sex and District in Sindh, 2011-12 to 2013-14.
287
13.21 Enrolment of Technical Colleges and Polytechnic/Mono-Technical Institutions by Sex and District in Sindh, 2011-12 to 2013-14.
288
13.22 Teaching Staff in Technical Colleges and Polytechnic / Mono-Technical Institutions by Sex and District in Sindh, 2011-12 to 2013-14.
289
13.23 Number of Commercial Training Institutions by Sex and District in Sindh, 2011-12 to 2013-14.
290
13.24 Enrolment of Commercial Training Institutions by Sex and District in Sindh, 2011-12 to 2013-14.
291

xxv
CONTENTS
SECTOR /
TABLE NO. T I T L E PAGE NO.
13.25 Teaching Staff in Commercial Training
Institutions by Sex and District in Sindh, 2011-12 to 2013-14.
292
13.26 Number of Vocational Institutions by Sex and District in Sindh, 2011-12 to 2013-14.
293
13.27 Enrolment of Vocational Institutions by Sex and District in Sindh, 2011-12 to 2013-14.
294
13.28 Teaching Staff in Vocational Institutions by Sex and District in Sindh, 2011-12 to 2013-14.
295
- No of Primary Schools, Enrolment & Teaching Staff (Graph).
297
14.00 HEALTH 299
.. Explanatory Note on Health. 301
14.01 Government Hospitals, Dispensaries, Rural Health Centers, T.B Clinics, Basic Health Units and Mother Child Health Centres with Bed Capacity in Sindh, 2010 to 2014.
303
14.02 Government Hospitals, Dispensaries, Rural Health Centers, T.B. Clinics, Basic Health Units and Mother Child Health Centres with Bed Capacity by District in Sindh, 2013 to 2014.
304 – 307
14.03 Medical & Paramedical Personnel (Government) by Category in Sindh, 2010 to 2014.
308
14.04 Medical & Para Medical Personnel (Government) by Category and District in Sindh, 2013 to 2014.
309 - 314

xxvi
CONTENTS
SECTOR /
TABLE NO. T I T L E PAGE NO.
15.00 CRIMES 315
15.01 Crimes Under Different Heads in Sindh,
2010 to 2014.317
15.02 Crimes Under Different Heads in Karachi
Region, 2010 to 2014.318
15.03 Crimes Under Different Heads in Hyderabad
Region, 2010 to 2014. 319
15.04 Crimes Under Different Heads in Sukkur
Region, 2010 to 2014.320
15.05 District wise break-up of serious crimes in Sindh,
2013 to 2014. 321 – 328
16.00 MISCELLANEOUS 329
16.01 Name of Officers / Organizational setup of
Bureau of Statistics as on March 31, 2016.331 – 332

STATISTICAL ABSTRACT

% CHANGE UNIT 2013-14 2014-15 IN 2014-15
OVER 2013-14
AGRICULTURE Million Rs. 5,976,217 6,562,832 9.82 Crops Do. 2,612,933 2,713,832 3.86 Livestock Do. 3,129,682 3,611,958 15.41 Forestry Do. 153,722 146,169 (4.91) Fishing Do. 79,880 90,873 13.76
INDUSTRIES Do. 5,040,094 5,217,366 3.52 Mining and Quarrying Do. 741,022 700,419 (5.48)MANUFACTURING Do. 3,408,468 3,507,017 2.89
Large scale Do. 2,824,463 2,850,224 0.91 Small scale Do. 327,030 373,317 14.15 Slaughtering Do. 256,975 283,476 10.31
Electricity & Gas Distribution Do. 406,192 474,335 16.78Construction Do. 484,412 535,595 10.57SERVICES Do. 13,012,582 14,359,582 10.35Wholesale & Retail Trade Do. 4,924,462 5,085,934 3.28Transport, Storage & Communication Do. 2,474,818 3,105,780 25.50Finance and Insurance Do. 584,074 605,108 3.60Housing Services (OD) Do. 1,229,106 1,371,454 11.58General Government Services Do. 1,660,434 1,818,474 9.52Other Private Services Do. 2,139,688 2,372,832 10.90Gross Domestic Product (FC) Do. 24,028,897 26,139,773 8.78Taxes Do. 1,480,099 1,633,881 10.39Subsidies Do. 340,191 280,549 (17.53)Gross Domestic Product (MP) Do. 25,168,805 27,493,105 9.23Net Factor Income from Abroad Do. 1,428,227 1,674,811 17.27Gross National Income Do. 26,597,032 29,167,916 9.67Population (In Million Numbers) Do. 186.00 190.00 2.15Per Capita Income Do. 142,849 153,620 7.54
PART- A PAKISTAN
GROSS DOMESTIC PRODUCT AT CURRENT FACTOR COST
ITEMS
xxix
STATISTICAL ABSTRACT OF PAKISTAN, 2013-14 AND 2014-15
STATISTICAL ABSTRACT

STATISTICAL ABSTRACT
% CHANGE UNIT 2013-14 2014-15 IN 2014-15
OVER 2013-14
A. AGRICULTURE SECTOR Million Rs. 2,156,117 13,429,373 522.85 1. Crops Do. 867,133 876,147 1.04 2. Livestock Do. 1,198,671 12,465,251 939.92 3. Forestry Do. 46,555 41,699 (10.43) 4. Fishery Do. 43,758 46,276 5.75
B. INDUSTRIAL SECTOR Do. 2,089,776 2,190,345 4.81 1. Mining and Quarrying Do. 298,856 310,715 3.97 2. MANUFACTURING Do. 1,387,556 1,441,679 3.90
Large Scale Do. 1,122,266 1,159,231 3.29 Small Scale Do. 169,677 183,628 8.22 Slaughtering Do. 95,613 98,820 3.35
3. Construction Do. 164,054 183,700 11.98 4. Electricity and Gas Distribution Do. 239,310 254,251 6.24 C. SERVICES SECTOR Do. 5,971,161 6,228,700 4.31Wholesale & Retail Trade Do. 1,894,410 1,944,253 2.63Transport, Storage & Communication Do. 1,355,570 1,421,265 4.85Finance and Insurance Do. 315,428 335,854 6.48Housing Services (OD) Do. 691,091 718,704 4.00General Government Services Do. 723,823 758,746 4.82Other Private Services Do. 990,839 1,049,878 5.96Gross Domestic Product (FC) Do. 10,217,056 10,629,661 4.04Taxes Do. 556,679 616,350 10.72Subsidies Do. 136,844 107,861 (21.18)Gross Domestic Product (MP) Do. 10,636,891 11,138,150 4.71Net Factor Income from Abroad Do. 4,740,016 548,902 (88.42)Gross National Income Do. 11,110,897 11,687,052 5.19Population (In Million) Do. 186.00 190.00 2.15Per Capita Income Do. 59,675 61,563 3.16
PART- A PAKISTAN
GROSS DOMESTIC PRODUCT AT CONSTANT FACTOR COST OF 2005-06
ITEMS
xxx
STATISTICAL ABSTRACT OF PAKISTAN, 2013-14 AND 2014-15

% CHANGE UNIT 2013-14 2014-15 IN 2012-13
OVER 2011-12
MAJOR EXPORTS Million Rs. 2,583,463.5 2,397,512.2 (7.20) Fish and Preparations Do. 37,917.9 35,429.4 (6.6) Rice Do. 222,906.7 206,266.3 (7.5) Molasses Do. 2,510.4 1,010.3 (59.8) Raw wool Do. 809.2 452.5 (44.1) Raw cotton Do. 21,352.5 14,932.7 (30.1) Cotton waste Do. 8,124.1 5,167.5 (36.4) Leather Do. 56,496.4 49,582.8 (12.2) Cotton yarn Do. 205,659.8 187,375.7 (8.9) Cotton thread Do. 1,540.1 1,239.7 (19.5) Cotton cloth Do. 285,130.2 248,430.9 (12.9) Petroleum & Petroluem products Do. 68,636.1 31,142.4 (54.6) Synthetic textiles Do. 39,507.9 33,484.6 (15.2) Footwear Do. 12,208.3 13,304.4 9.0 Animal casings Do. 4,673.2 2,535.6 (45.7) Vegetables & Fruits Do. 66,704.0 67,864.3 1.7 Guar and Products Do. 7,007.6 5,791.1 (17.4) Towels of cotton Do. 78,889.2 80,777.0 2.4 Paints and varnishes Do. 3,296.2 3,280.4 (0.5) Tobacco raw and manufactured Do. 2,447.0 1,517.4 (38.0) Readymade garments and hosiery Do. 431,762.5 456,552.0 5.7 Drugs and chemicals Do. 120,391.3 99,338.6 (17.5) Surgical instruments Do. 34,725.9 34,575.5 (0.4) Carpets and rugs Do. 12,616.2 11,772.5 (6.7) Sports goods Do. 37,259.6 34,293.6 (8.0) Others Do. 820,891.2 771,395.0 (6.0)
MAJOR EXPORTS AND IMPORTS
ITEMS
xxxi
STATISTICAL ABSTRACT OF PAKISTAN, 2013-14 AND 2014-15STATISTICAL ABSTRACT

STATISTICAL ABSTRACT
% CHANGE UNIT 2013-14 2014-15 IN 2014-15
OVER 2013-14
MAJOR IMPORTS Million Rs. 4,630,520.2 4,644,152.1 0.29
Chemicals Do. 498,340.0 532,197.4 6.79
Drugs & medicines Do. 81,399.1 96,182.7 553.81
Dyes & colours Do. 38,600.7 40,221.4 149.17
Chemical fertilizers Do. 73,057.6 92,641.5 (44.95)
Electrical goods Do. 114,784.4 122,183.5 (19.29)
Machinery non- electrical Do. 551,829.0 633,733.0 (77.86)
Transport equipments Do. 219,877.4 263,622.2 188.22
Paper, Paper board & stationery Do. 44,361.8 56,130.0 494.25
Tea Do. 30,827.2 34,532.5 12.02
Sugar refined Do. 635.4 631.4 (0.63)
Art-silk yarn Do. 63,596.2 69,028.3 8.54
Iron & steel and manufactures there of Do. 180,530.0 226,030.0 25.20
Non-ferous metals Do. 44,389.0 44,709.0 0.72
Petroleum and products Do. 1,527,753.2 1,195,025.4 (21.78)
Oil vegetables Do. 206,955.2 186,010.2 (10.12)
Grains, pulses and flour Do. 52,710.0 71,742.0 36.11
Others Do. 900,874.0 979,531.6 8.73
ITEMS
STATISTICAL ABSTRACT OF PAKISTAN, 2013-14 AND 2014-15
xxxii
xxxiii
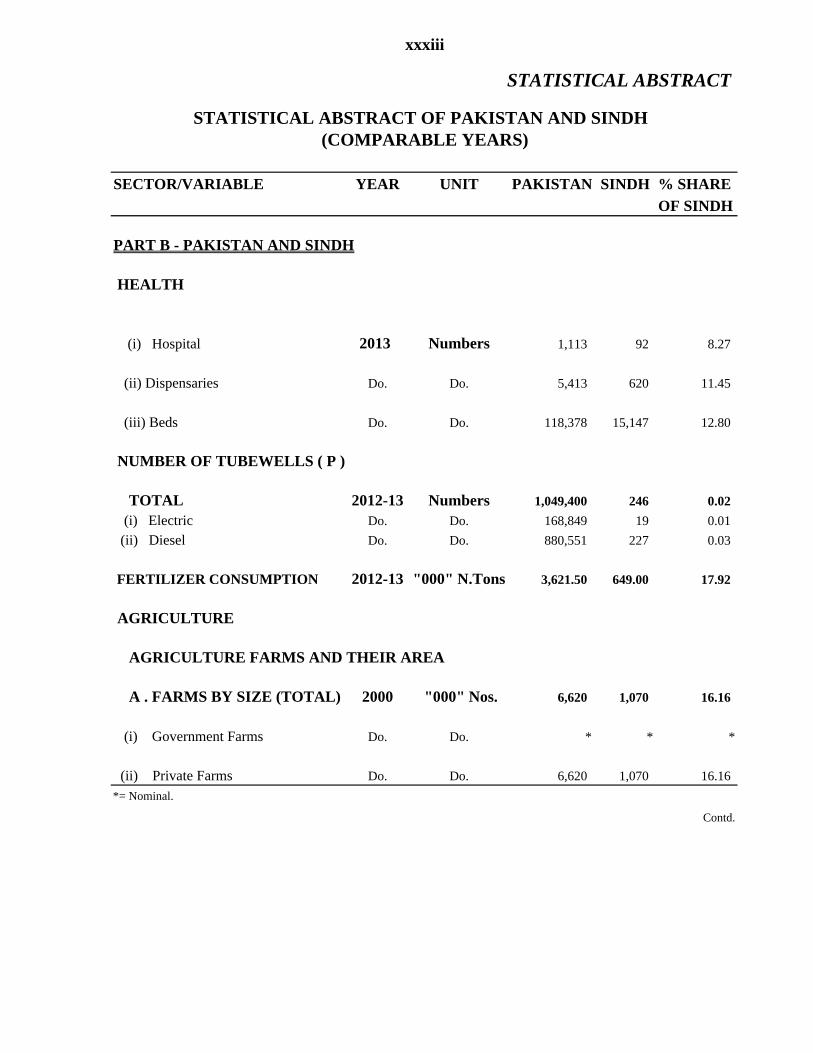
STATISTICAL ABSTRACT
STATISTICAL ABSTRACT OF PAKISTAN AND SINDH (COMPARABLE YEARS)
SECTOR/VARIABLE YEAR UNIT PAKISTAN SINDH % SHARE
OF SINDH
PART B - PAKISTAN AND SINDH
HEALTH
(i) Hospital 2013 Numbers 1,113 92 8.27
(ii) Dispensaries Do. Do. 5,413 620 11.45
(iii) Beds Do. Do. 118,378 15,147 12.80
NUMBER OF TUBEWELLS ( P )
TOTAL 2012-13 Numbers 1,049,400 246 0.02
(i) Electric Do. Do. 168,849 19 0.01
(ii) Diesel Do. Do. 880,551 227 0.03
FERTILIZER CONSUMPTION 2012-13 "000" N.Tons 3,621.50 649.00 17.92
AGRICULTURE
AGRICULTURE FARMS AND THEIR AREA
A . FARMS BY SIZE (TOTAL) 2000 "000" Nos. 6,620 1,070 16.16
(i) Government Farms Do. Do. * * *
(ii) Private Farms Do. Do. 6,620 1,070 16.16
*= Nominal.
Contd.

xxxiv
STATISTICAL ABSTRACT
STATISTICAL ABSTRACT OF PAKISTAN AND SINDH (COMPARABLE YEARS)
SECTOR/VARIABLE YEAR UNIT PAKISTAN SINDH % SHARE OF SINDH
Under 0.5 Hectares 2000 "000" Nos. 1,290 64 4.96 0.5 to under 1.0 Hectares Do. Do. 1,099 148 13.47 1.0 to under 2.0 Hectares Do. Do. 1,425 279 19.58 2.0 to under 3.0 Hectares Do. Do. 967 198 20.48 3.0 to under 5.0 Hectares Do. Do. 891 194 21.77 5.0 to under 10.0 Hectares Do. Do. 580 102 17.59 10.0 to under 20.0 Hectares Do. Do. 261 58 22.22 20.0 to under 40.0 Hectares Do. Do. 78 20 25.64 40.0 to under 60.0 Hectares Do. Do. 15 4 26.67 60.0 and above Do. Do. 14 4 28.57
B. PRIVATE FARMS BY TENURE TOTAL 2000 "000" Nos. 6,620 1,070 15.82 (i) Owner Farms Do. Do. 5,134 704 11.63 (ii) Owner Cum Tenant Farms Do. Do. 559 43 9.74 (iii) Tenant Farms Do. Do. 927 323 35.12
C. FARM AREA BY TENURE TOTAL FARMS AREA 2000 Thousand 20,438 4,327 18.14
Hectares Government Farms Area Do. Do. 31 2 10.68 Private Farms Area Do. Do. 20,407 4,325 18.189 (i) Owner Operated Area Do. Do. 14,961 3,283 16.59 (ii) Owner Cum Operated Area Do. Do. 2,964 298 11.58 (iii) Tenant Operated Area Do. Do. 2,482 744 32.39
LAND UTILIZATION (P)
(i) Geographical Area 2014-15 M. Hectares 79.61 14.09 17.70
(ii) Total Area Repoted (iii+iv+v+vi) Do. Do. 57.91 14.08 24.31
(iii) Forest Area Do. Do. 4.56 1.03 22.59
(iv) Not available for Cultivation Do. Do. 22.92 6.24 27.23
(v) Culturable Waste Do. Do. 8.26 1.60 19.37
(vi) Cultivated Area (vii+viii) Do. Do. 22.17 5.21 23.50
(vii) Current Fallows Do. Do. 6.60 2.67 40.45
(viii) Net Area Sown Do. Do. 15.57 2.54 16.31
(ix) Area Sown More than once Do. Do. 7.75 0.94 12.13
(x) Total Cropped Area (viii+ix) Do. Do. 23.32 3.48 14.92
Contd.

xxxv
STATISTICAL ABSTRACT
STATISTICAL ABSTRACT OF PAKISTAN AND SINDH (COMPARABLE YEARS)
SECTOR/VARIABLE YEAR UNIT PAKISTAN SINDH % SHAREOF SINDH
IRRIGATED AREA (TOTAL) 2013-14 M. Hectares 17.94 1.72 9.59
PRODUCTION OF PRINCIPAL CROPS2013-14 "000" Tons
(i) Wheat Do. Do. 25,979.4 4,002.71 15.41 (ii) Rice Do. Do. 6,798.1 2,617.3 38.50 (iii) Cotton Do. "000" Bales 12,768.0 3,523.4 27.60 (iv) Jowar Do. "000" M. Tons 118.9 12.0 10.09 (v) Maize Do. Do. 4,944.2 3.5 0.07 (vi) Bajra Do. Do. 300.9 23.2 7.71 (vii) Gram Do. Do. 398.9 15.5 3.89 (viii) Sugar-Cane Do. Do. 1,172.5 297.6 25.38 (ix) Barley Do. Do. 62.8 5.0 7.96 (x) Rape Seed and Mustard Do. Do. 220.1 54.9 24.94
PRODUCTION OF PRINCIPAL FRUITS2013-14 "000" Tons
(i) Mangoes Do. Do. 1658.51 402.5 24.27 (ii) Banana Do. Do. 118.7 100.8 84.92 (iii) Guava Do. Do. 496 72.3 14.58 (iv) Dates Do. Do. 526.8 270.5 51.35 (v) Citrus Do. Do. 2,001.70 30.9 1.54
FISHERIES FISH PRODUCTION 2013-14 "000" Tons 735.0 270.6 36.82
(i) Inland Do. Do. 265.0 74.0 27.92
(ii) Marine Do. Do. 470.0 196.6 41.83# V/ !
LIVESTOCK AND POULTRY 2012-13 "000" Heads (i) Cattle Do. Do. 39,743 6,925 17.42 (ii) Buffaloes Do. Do. 34,702 7,341 21.15 (iii) Sheeps Do. Do. 29,096 3,959 13.61 (iv) Goats Do. Do. 66,615 12,571 18.87 (v) Camels, Horses, Asses & Mules Do. Do. 6,395 1,347 21.06 (vi) Poultry Do. Do. 73,648 14,136 19.19
COMMUNICATIONS (i) Television Sets 2014 In "000" Nos. 14,245 2,663 18.69
ROADS KILOMETERS IN PAKISTAN TOTAL 2014 In "00" K.ms. 2,637 - - (i) High Type Do. Do. 1,841 - - (ii) Low Type Do. Do. 796 - -
Contd.

xxxvi
STATISTICAL ABSTRACT
STATISTICAL ABSTRACT OF PAKISTAN AND SINDH (COMPARABLE YEARS)
SECTOR/VARIABLE YEAR UNIT PAKISTAN SINDH % SHARE OF SINDH
EDUCATION (P) A. INSTITUTIONS (i) PRIMARY SCHOOLS
TOTAL 2013-14 Nos. 159,680 42,900 26.87 Male Do. Do. 99,367 36,636 36.87 Female Do. Do. 60,313 6,264 10.39 (ii) MIDDLE SCHOOLS TOTAL 2013-14 Nos. 42,147 2,429 5.76 Male Do. Do. 21,090 1,734 8.22 Female Do. Do. 21,057 695 3.30 (iii) SECONDARY SCHOOLS TOTAL 2013-14 Nos. 30,702 2,065 6.73
Male Do. Do. 18,095 1,432 7.91
Female Do. Do. 12,902 633 4.91
(iv) INTERMEDIATE AND DEGREE COLLEGES TOTAL 2012-13 Nos. 2,228 246 11.04 Male Do. Do. 1,455 148 10.17 Female Do. Do. 773 98 12.68
B. ENROLMENT
(i) PRIMARY STAGE (I TO V) TOTAL 2012-13 In "000" 28,057 2,964 10.56
Male Do. Do. 15,691 1,754 11.18
Female Do. Do. 12,366 1,210 9.78 (ii) MIDDLE SCHOOLS TOTAL 2012-13 In "000" 6,188 264 4.27
Male Do. Do. 3,535 129 3.65
Female Do. Do. 2,653 135 5.09 (iii) SECONDARY STAGE (VI to X) TOTAL 2012-13 In "000" 3,103 1,022 32.94
Male Do. Do. 1,847 607 32.86
Female Do. Do. 1,256 415 33.04 (iv) INTERMEDIATE AND DEGREE COLLEGES (XI to XIV) TOTAL 2012-13 In "000" 2,226 334 15.00
Male Do. Do. 1,279 193 15.09
Female Do. Do. 947 141 14.89
Contd.
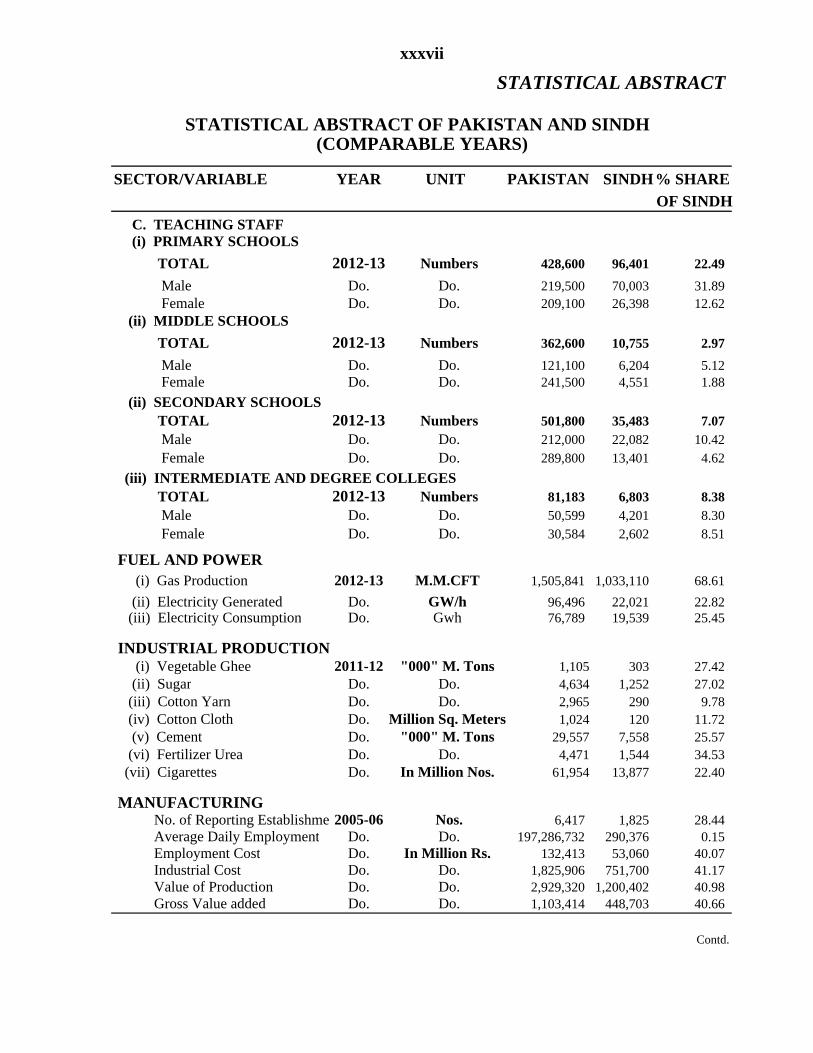
xxxvii
STATISTICAL ABSTRACT
STATISTICAL ABSTRACT OF PAKISTAN AND SINDH (COMPARABLE YEARS)
SECTOR/VARIABLE YEAR UNIT PAKISTAN SINDH% SHARE
OF SINDH
C. TEACHING STAFF (i) PRIMARY SCHOOLS
TOTAL 2012-13 Numbers 428,600 96,401 22.49
Male Do. Do. 219,500 70,003 31.89 Female Do. Do. 209,100 26,398 12.62 (ii) MIDDLE SCHOOLS
TOTAL 2012-13 Numbers 362,600 10,755 2.97
Male Do. Do. 121,100 6,204 5.12 Female Do. Do. 241,500 4,551 1.88
(ii) SECONDARY SCHOOLS TOTAL 2012-13 Numbers 501,800 35,483 7.07 Male Do. Do. 212,000 22,082 10.42 Female Do. Do. 289,800 13,401 4.62
(iii) INTERMEDIATE AND DEGREE COLLEGES TOTAL 2012-13 Numbers 81,183 6,803 8.38 Male Do. Do. 50,599 4,201 8.30 Female Do. Do. 30,584 2,602 8.51
FUEL AND POWER (i) Gas Production 2012-13 M.M.CFT 1,505,841 1,033,110 68.61
(ii) Electricity Generated Do. GW/h 96,496 22,021 22.82 (iii) Electricity Consumption Do. Gwh 76,789 19,539 25.45
INDUSTRIAL PRODUCTION (i) Vegetable Ghee 2011-12 "000" M. Tons 1,105 303 27.42 (ii) Sugar Do. Do. 4,634 1,252 27.02 (iii) Cotton Yarn Do. Do. 2,965 290 9.78 (iv) Cotton Cloth Do. Million Sq. Meters 1,024 120 11.72 (v) Cement Do. "000" M. Tons 29,557 7,558 25.57 (vi) Fertilizer Urea Do. Do. 4,471 1,544 34.53 (vii) Cigarettes Do. In Million Nos. 61,954 13,877 22.40
MANUFACTURING No. of Reporting Establishme 2005-06 Nos. 6,417 1,825 28.44 Average Daily Employment Do. Do. 197,286,732 290,376 0.15 Employment Cost Do. In Million Rs. 132,413 53,060 40.07 Industrial Cost Do. Do. 1,825,906 751,700 41.17 Value of Production Do. Do. 2,929,320 1,200,402 40.98 Gross Value added Do. Do. 1,103,414 448,703 40.66
Contd.
xxxviii
STATISTICAL ABSTRACT
STATISTICAL ABSTRACT OF PAKISTAN AND SINDH (COMPARABLE YEARS)
SECTOR/VARIABLE YEAR UNIT PAKISTAN SINDH % SHARE OF SINDH
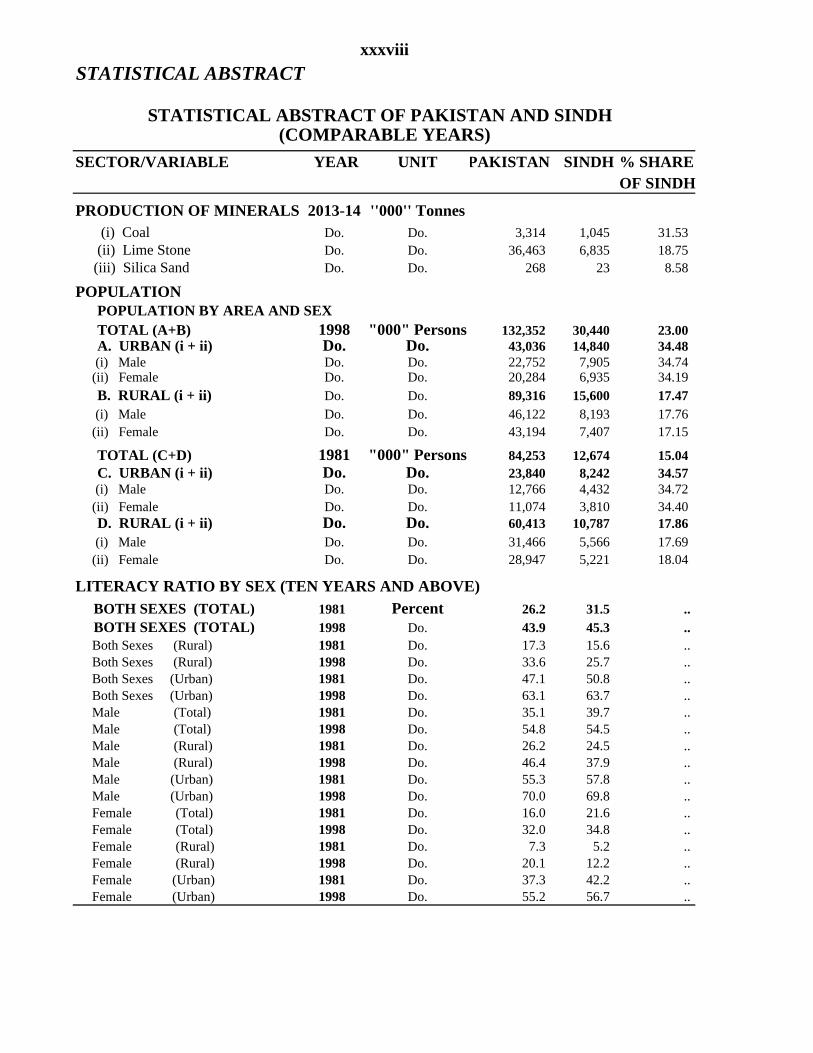
PRODUCTION OF MINERALS 2013-14 ''000'' Tonnes (i) Coal Do. Do. 3,314 1,045 31.53 (ii) Lime Stone Do. Do. 36,463 6,835 18.75 (iii) Silica Sand Do. Do. 268 23 8.58
POPULATION POPULATION BY AREA AND SEX TOTAL (A+B) 1998 "000" Persons 132,352 30,440 23.00 A. URBAN (i + ii) Do. Do. 43,036 14,840 34.48 (i) Male Do. Do. 22,752 7,905 34.74 (ii) Female Do. Do. 20,284 6,935 34.19 B. RURAL (i + ii) Do. Do. 89,316 15,600 17.47 (i) Male Do. Do. 46,122 8,193 17.76 (ii) Female Do. Do. 43,194 7,407 17.15
TOTAL (C+D) 1981 "000" Persons 84,253 12,674 15.04 C. URBAN (i + ii) Do. Do. 23,840 8,242 34.57 (i) Male Do. Do. 12,766 4,432 34.72 (ii) Female Do. Do. 11,074 3,810 34.40 D. RURAL (i + ii) Do. Do. 60,413 10,787 17.86 (i) Male Do. Do. 31,466 5,566 17.69 (ii) Female Do. Do. 28,947 5,221 18.04
LITERACY RATIO BY SEX (TEN YEARS AND ABOVE)
BOTH SEXES (TOTAL) 1981 Percent 26.2 31.5 .. BOTH SEXES (TOTAL) 1998 Do. 43.9 45.3 .. Both Sexes (Rural) 1981 Do. 17.3 15.6 .. Both Sexes (Rural) 1998 Do. 33.6 25.7 .. Both Sexes (Urban) 1981 Do. 47.1 50.8 .. Both Sexes (Urban) 1998 Do. 63.1 63.7 .. Male (Total) 1981 Do. 35.1 39.7 .. Male (Total) 1998 Do. 54.8 54.5 .. Male (Rural) 1981 Do. 26.2 24.5 .. Male (Rural) 1998 Do. 46.4 37.9 .. Male (Urban) 1981 Do. 55.3 57.8 .. Male (Urban) 1998 Do. 70.0 69.8 .. Female (Total) 1981 Do. 16.0 21.6 .. Female (Total) 1998 Do. 32.0 34.8 .. Female (Rural) 1981 Do. 7.3 5.2 .. Female (Rural) 1998 Do. 20.1 12.2 .. Female (Urban) 1981 Do. 37.3 42.2 .. Female (Urban) 1998 Do. 55.2 56.7 ..

xxxix
SECTOR/SUB SECTOR SOURCE OF INFORMATION
1. Gross National Product Pakistan Economic Survey 2014-15, Government of Pakistan.
Finance Division, Economic Advisor wing, Islamabad
2. Exports & Imports Pakistan Statistical Year Book 2014, Pakistan Bureau of Statistics,
Government of Pakistan, Islamabad.
PART - B PAKISTAN AND SINDH
3. Tractors Agriculture Machinery Census Organization.
Government of Pakistan,year 2000&2010.
4. Tube-wells Agriculture Machinery Census Organization.
Government of Pakistan,year 2000&2010.
5. Fertilizer Consumption Fertilizer Review by NDFC,
Government of Pakistan, Islamabad.
6. Agriculture Farms and Area Agriculture Machinery Census Organization,
Government of Pakistan,Lahore,year 2000&2010.
7. Land Utilization Minstry of National Food Security & Research.Crop Reporting Service Centre Sindh, Hyderabad.
8. Irrigated Area i.Chief Engineer Irrigation Department,ii.Crop Reporting Service Centre Sindh, Hyderabad
9. Production of Principal Crops i. Minstry of National Food Security & Research.
and Fruits. ii.Crop Reporting Service Centre Sindh, Hyderabad.
10. Fisheries i.Marine Fisheries Department , Government Of Pakistan,Karachi
ii.InLand Fisheries Department , Government Of Sindh,Hyderabad.
11. Food Grains Minstry of National Food Security & Research,
Government of Pakistan, Islamabad.
Contd.
PART-A PAKISTAN

XL
SECTOR/SUB SECTOR SOURCE OF INFORMATION
12. Livestock Directorate Of Annimal Husbandry Sindh , Hyderabad.
13. Communications i) Pakistan Statistical year book 2014, Pakistan Bureau of Statistics,
Government of Pakistan, Islamabad.
14. Education i) SEMIES, Education Department, Government of Sindh.
ii) Economic Survey 2014-15, Government of Pakistan,
Finance Division, Economic Advisor's wing, Islamabad.
15. Fuel and Power
(a) Gas Production Pakistan Statistical year book 2014, Pakistan Bureau of Statistics,
Government of Pakistan.
(b) Electricity Generated i) WAPDA/K.Eii) Economic Survey 2014-15, Government of Pakistan,
Finance Division, Economic Advisor's wing, Islamabad.
(c) Electricity Consumption WAPDA/K.E
16. Industrial Production Economic Survey 2014-15, Government of Pakistan,
Finance Division, Economic Advisor's wing, Islamabad.
17. Manufacturing Pakistan Statistical year book 2014, Pakistan Bureau of Statistics, Government of Pakistan.
18. Production of Minerals Pakistan Statistical year book 2014, Pakistan Bureau of Statistics,
Government of Pakistan.
19. Population i) Population Census Reports, 1981 & 1998.ii) Economic Survey 2014-15, Government of Pakistan, Finance Division
Economic Advisor's Wing, Islamabad.
20. Literacy Ratio i) Population Census Reports, 1981 & 1998.
ii) Pakistan Statistical year book 2014, Pakistan Bureau of Statistics,
Government of Pakistan.

1.00 CLIMATE
3
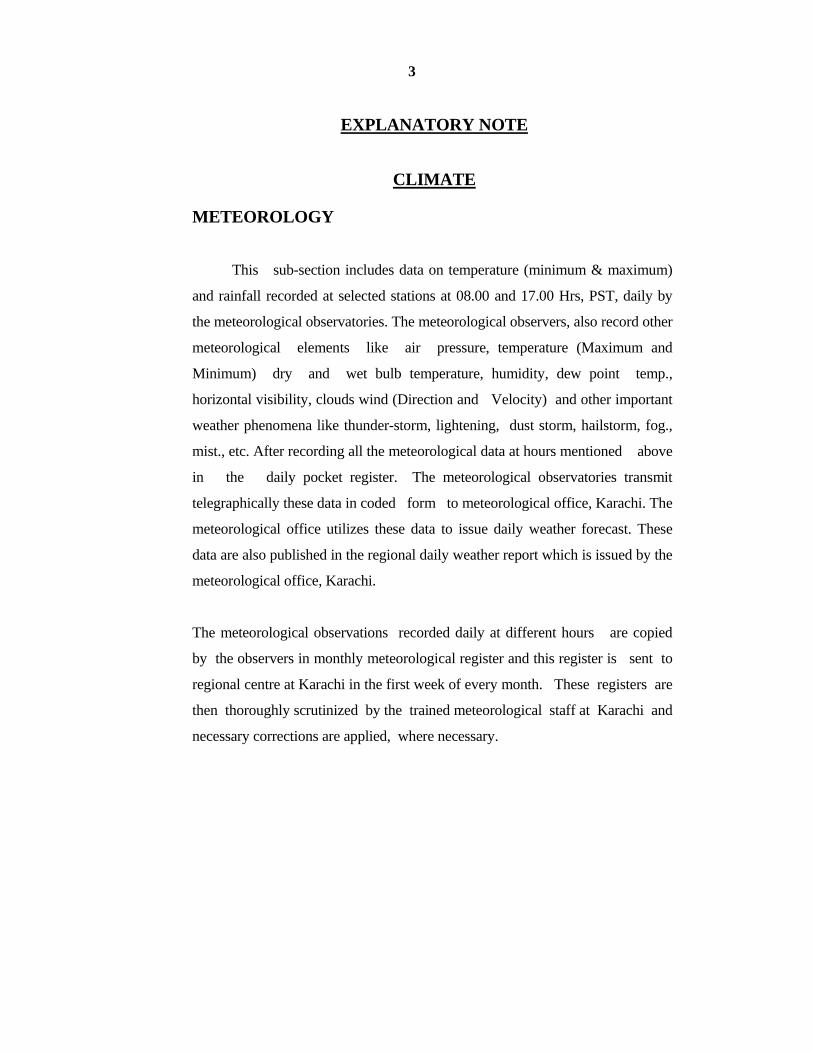
EXPLANATORY NOTE
CLIMATE
METEOROLOGY This sub-section includes data on temperature (minimum & maximum)
and rainfall recorded at selected stations at 08.00 and 17.00 Hrs, PST, daily by
the meteorological observatories. The meteorological observers, also record other
meteorological elements like air pressure, temperature (Maximum and
Minimum) dry and wet bulb temperature, humidity, dew point temp.,
horizontal visibility, clouds wind (Direction and Velocity) and other important
weather phenomena like thunder-storm, lightening, dust storm, hailstorm, fog.,
mist., etc. After recording all the meteorological data at hours mentioned above
in the daily pocket register. The meteorological observatories transmit
telegraphically these data in coded form to meteorological office, Karachi. The
meteorological office utilizes these data to issue daily weather forecast. These
data are also published in the regional daily weather report which is issued by the
meteorological office, Karachi.
The meteorological observations recorded daily at different hours are copied
by the observers in monthly meteorological register and this register is sent to
regional centre at Karachi in the first week of every month. These registers are
then thoroughly scrutinized by the trained meteorological staff at Karachi and
necessary corrections are applied, where necessary.

Karachi Airport 32.4 21.7 32.0 21.5 32.4 21.9 32.7 21.7
Hyderabad 33.6 20.7 33.9 20.0 33.9 20.7 34.5 20.6
Badin 33.0 21.5 33.0 21.2 33.3 20.8 33.6 20.7
Chhor 34.9 18.7 34.9 18.4 35.3 19.1 35.6 19.1
Padidan 34.1 19.5 34.0 19.0 33.9 19.8 34.1 19.2
S.B.Abad - - 35.3 18.8 34.8 19.5 35.8 19.0
Sukkur/Rohri 34.0 21.6 33.7 20.6 33.9 21.5 34.1 21.3
Jacobabad 33.6 20.6 33.5 20.2 33.7 20.8 34.0 19.1
Max. :- Represents Mean of Maximum Temperature of the Year.
Min. :- Represents Mean of Minimum Temperature of the Year.
- Data not Available
Max.
Source:- Meteorological Centre, Government of Pakistan, Karachi.
Min.Max.
2012 20142013
Min.Min.Min.
1.01 TEMPERATURE AT SELECTED STATIONS OF SINDH,
Max.
5
CENTRES/STATIONSMax.Max.
TEMPERATURE
2011 TO 2014
2011

6
(In Centigrades)
Karachi Airport Hyderabad Badin Chhor
Max. Min. Max. Min. Max. Min. Max. Min.
January 25.7 11.2 23.7 10.0 24.1 11.6 26.4 5.5February 26.9 11.9 25.4 10.8 25.7 11.9 28.2 6.9March 31.7 19.1 33.9 16.3 33.4 18.2 34.5 14.9April 35.1 24.5 38.9 22.5 38.0 23.2 39.4 22.1May 35.5 27.2 41.3 25.3 39.3 26.3 41.8 25.3June 34.6 28.0 39.8 26.8 37.9 27.9 40.0 27.4July 33.2 27.9 36.7 26.7 36.1 27.6 37.8 26.5August 32.7 26.9 37.4 25.8 34.5 26.1 36.4 26.2September 33.2 26.4 35.3 24.9 33.7 25.6 34.6 25.4October 35.0 22.7 35.8 21.0 34.8 23.1 36.9 19.4November 32.7 18.6 32.4 17.3 31.7 18.7 33.6 13.0December 28.2 14.2 26.1 12.2 26.7 13.6 28.7 8.5
Mean 32.0 21.5 33.9 20.0 33.0 21.2 34.9 18.4
January 26.7 11.6 24.8 10.7 25.5 11.0 26.9 26.9
February 28.0 15.1 26.6 13.2 27.5 13.9 29.1 10.9
March 33.3 19.2 33.6 18.0 33.9 18.2 35.8 16.2
April 34.0 24.2 37.3 22.1 36.9 22.3 38.6 21.5
May 35.1 27.1 41.8 24.7 39.6 25.6 42.1 25.1
June 36.5 29.3 39.4 27.2 38.6 27.6 40.4 27.9
July 33.8 28.0 37.6 27.0 35.4 26.9 37.2 27.1
August 32.1 26.6 34.9 25.7 33.8 26.0 35.0 25.3
September 33.0 25.5 37.0 25.7 35.0 25.3 37.6 24.9
October 35.7 25.4 36.9 24.3 35.2 24.1 38.3 22.5
November 32.3 18.1 30.6 17.5 31.1 16.2 33.5 13.2
December 28.3 13.0 25.8 12.4 27.1 12.6 28.7 8.1
Mean 32.4 21.9 33.9 20.7 33.3 20.8 35.3 20.8
Max.:- Represents Mean of Maximum Temperature of the Year.
Min.:- Represents Mean of Minimum Temperature of the Year.
Cont.
2013
MONTH
2012
TEMPERATURE
1.02 TEMPERATURE AT SELECTED STATIONS BY MONTHSINDH, 2012 TO 2014

7
TEMPERATURE
(In Centigrades)
Padidan S.B.Abad Sukkur / Rohri Jacobabad
Max. Min. Max. Min. Max. Min. Max. Min.
January 22.0 6.6 23.1 7.4 21.6 7.8 21.3 6.8
February 24.2 7.3 25.6 7.6 23.3 9.4 23.1 8.3
March 32.1 14.6 33.1 14.3 30.9 16.7 31.2 15.0
April 38.1 22.2 39.3 21.8 37.1 24.0 37.0 21.7
May 43.0 25.8 43.6 26.8 42.8 28.2 43.3 25.5
June 43.1 27.5 45.5 25.3 43.6 28.8 44.9 28.6
July 39.6 27.8 41.6 28.2 41.9 28.6 41.9 29.4
August 38.7 27.5 39.8 27.3 39.9 28.4 39.0 28.8
September 36.0 25.3 36.7 25.2 35.9 26.4 34.4 27.0
October 35.1 19.9 36.5 19.1 34.1 21.8 32.6 22.1
November 31.0 14.5 32.4 13.7 29.8 16.2 29.3 17.3
December 24.7 10.0 26.3 9.2 23.8 11.3 23.8 11.4
Mean 34.0 19.0 35.3 18.8 33.7 20.6 33.5 20.2
January 22.6 7.3 24.4 6.7 22.3 8.6 22.0 9.0
February 24.7 10.8 26.7 11.0 23.6 12.4 23.4 12.6
March 32.3 15.4 34.1 15.4 31.7 17.7 30.7 16.8
April 37.3 21.6 38.5 21.4 36.5 23.8 36.2 22.5
May 44.0 25.5 45.0 26.0 43.8 28.7 44.4 26.8
June 40.8 27.7 42.5 28.4 42.6 30.0 43.4 29.5
July 39.1 28.5 41.3 28.3 41.3 30.2 40.9 30.5
August 36.7 26.8 38.6 26.8 37.4 28.1 36.2 28.4
September 37.7 25.1 39.8 25.3 37.8 27.1 36.4 26.5
October 37.2 23.3 38.5 22.8 35.9 24.6 35.7 23.2
November 29.6 14.9 21.4 13.7 29.1 15.9 29.6 15.1
December 24.6 10.1 26.2 8.6 24.3 10.9 25.0 9.0
Mean 33.9 19.8 34.8 19.5 33.9 21.5 33.7 20.8
MONTH
2012
2013
1.02 TEMPERATURE AT SELECTED STATIONS BY MONTH OF SINDH, 2012 TO 2014

(In Centigrades)
Karachi Airport Hyderabad Chhor
Max. Min. Max. Min. Max. Min. Max. Min.
January 25.5 9.9 22.6 9.2 23.9 8.3 25.9 5.1
February 28.0 13.1 26.7 13.2 27.9 12.4 29.6 9.3
March 31.7 18.9 40.0 18.0 32.8 17.2 34.4 15.5
April 35.1 24.4 38.5 22.6 38.3 23.1 40.2 21.9
May 35.9 27.0 41.0 25.5 40.0 26.1 41.4 25.8
June 36.5 29.2 41.0 28.0 39.5 28.2 41.8 28.3
July 34.0 28.3 37.3 27.3 36.7 27.5 38.2 27.2
August 33.7 27.1 36.3 26.1 35.2 26.7 37.3 26.3
September 33.8 26.8 36.4 25.0 34.5 25.7 36.0 24.5
October 36.3 23.3 36.6 22.2 35.8 22.6 38.6 20.7
November 32.9 19.5 31.8 18.4 32.0 19.0 34.5 16.2
December 28.7 13.1 25.4 12.0 26.7 12.0 29.1 7.9
Mean 32.7 21.7 34.5 20.6 33.6 20.7 35.6 19.1
Contd.
2014
SINDH, 2012 TO 2014
8
MONTH
TEMPERATURE
1.02 TEMPERATURE AT SELECTED STATIONS BY MONTH
Badin

9
TEMPERATURE
(In Centigrades)
Sukkur / Rohri
Max. Min. Max. Min. Max. Min. Max. Min.
January 21.9 6.5 23.5 5.9 22.1 8.4 22.6 6.5
February 24.7 9.6 27.5 9.6 24.5 11.5 25.2 9.7
March 29.9 14.7 32.9 15.1 29.7 17.2 29.7 14.8
April 38.9 21.9 40.0 21.1 37.9 24.2 37.9 21.5
May 41.9 26.0 43.0 25.0 41.6 28.0 41.9 25.9
June 43.9 28.4 45.4 28.9 44.6 31.1 45.4 28.8
July 40.2 28.2 41.8 28.0 42.1 29.2 41.1 29.1
August 38.1 26.7 39.5 27.1 39.7 28.6 38.0 26.9
September 37.7 24.8 39.3 25.2 38.5 27.2 36.9 25.4
October 36.4 20.3 38.1 19.9 35.9 23.7 34.9 20.0
November 31.0 14.9 32.4 14.5 29.9 16.0 30.1 12.9
December 24.2 8.9 25.9 8.1 23.3 10.3 23.8 7.4
Mean 34.1 19.2 35.8 19.0 34.1 21.3 34.0 19.1
Source:- Meteorological Centre, Government of Pakistan, Karachi.
2014
1.02 TEMPERATURE AT SELECTED STATIONS BY MONTH
MONTHS.B.AbadPadidan Jacobabad
SINDH, 2012 TO 2014

10
(In Percentage)
Karachi Hyderabad Badin Chhor Airport
08.00 17.00 08.00 17.00 08.00 17.00 08.00 17.00 Hrs. Hrs. Hrs. Hrs. Hrs. Hrs. Hrs. Hrs.Pst. Pst. Pst. Pst. Pst. Pst. Pst. Pst.
2001 .. 48 .. 37 .. 40 .. 35
2002 .. 46 .. 32 .. 38 .. 33
2003 69 46 67 35 76 41 75 39
2004 70 .. 66 .. 76 .. 74 ..
2005 69 47 67 35 76 39 .. ..
2006 .. 51 .. 39 .. 44 .. 43
2007 74 49 70 35 78 41 80 43
2008 73 49 73 37 81 40 79 41
2009 72 49 69 36 76 40 78 41
2010 73 49 71 36 78 41 79 40
2011 72 50 72 40 78 45 82 51
2012 72 48 75 37 82 41 82 44
2013 73 48 74 38 82 41 82 43
2014 70 45 73 36 80 38 79 40
Hrs. = Hours. Pst. = Pakistan Standard Time.
Contd.
YEAR
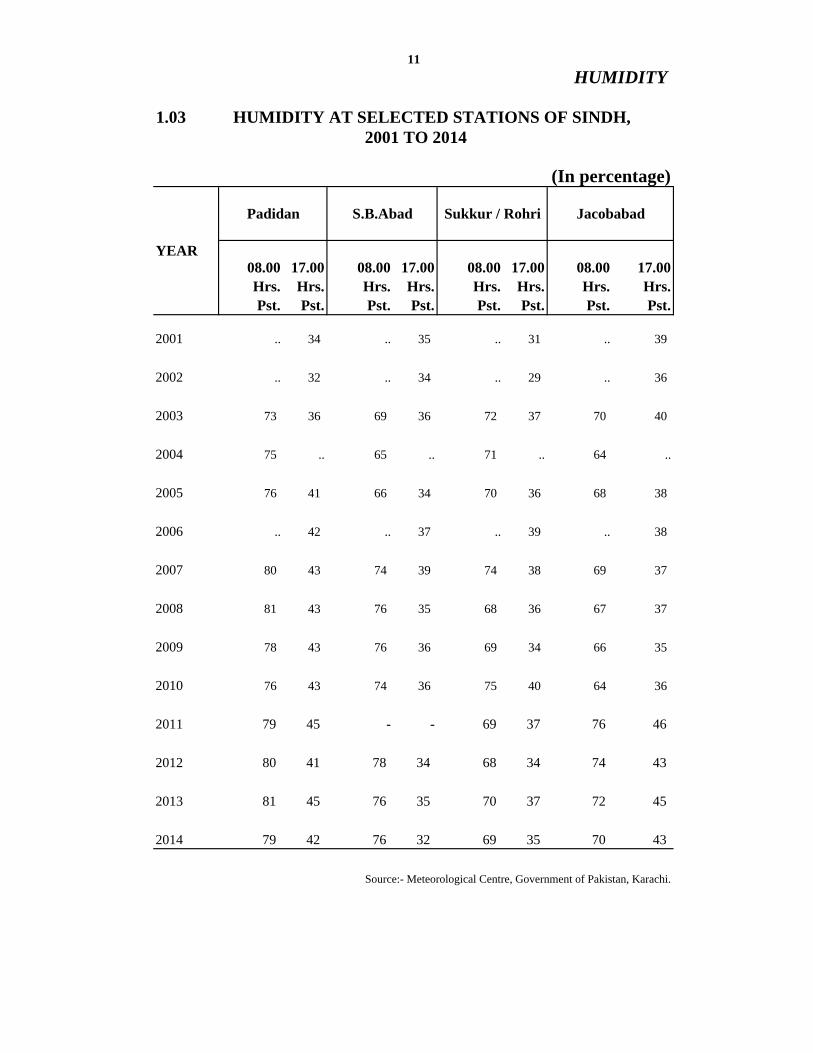
2001 TO 20141.03 HUMIDITY AT SELECTED STATIONS OF SINDH,
HUMIDITY
HUMIDITY
(In percentage)
Padidan S.B.Abad Sukkur / Rohri Jacobabad
08.00 17.00 08.00 17.00 08.00 17.00 08.00 17.00Hrs. Hrs. Hrs. Hrs. Hrs. Hrs. Hrs. Hrs.Pst. Pst. Pst. Pst. Pst. Pst. Pst. Pst.
2001 .. 34 .. 35 .. 31 .. 39
2002 .. 32 .. 34 .. 29 .. 36
2003 73 36 69 36 72 37 70 40
2004 75 .. 65 .. 71 .. 64 ..
2005 76 41 66 34 70 36 68 38
2006 .. 42 .. 37 .. 39 .. 38
2007 80 43 74 39 74 38 69 37
2008 81 43 76 35 68 36 67 37
2009 78 43 76 36 69 34 66 35
2010 76 43 74 36 75 40 64 36
2011 79 45 - - 69 37 76 46
2012 80 41 78 34 68 34 74 43
2013 81 45 76 35 70 37 72 45
2014 79 42 76 32 69 35 70 43
Source:- Meteorological Centre, Government of Pakistan, Karachi.
YEAR
11
1.03 HUMIDITY AT SELECTED STATIONS OF SINDH, 2001 TO 2014

(In Percentage)
Karachi Airport Hyderabad Badin Chhor
8.00 17.00 8.00 17.00 8.00 17.00 8.00 17.00Hrs. Hrs. Hrs. Hrs. Hrs. Hrs. Hrs. Hrs.Pst. Pst. Pst. Pst. Pst. Pst. Pst. Pst.
January 60.0 31.0 72.0 31.0 80.0 34.0 84.0 47.0
February 52.0 24.0 57.0 21.0 75.0 26.0 76.0 33.0
March 67.0 37.0 71.0 19.0 82.0 23.0 84.0 33.0
April 78.0 47.0 73.0 27.0 82.0 31.0 74.0 30.0
May 79.0 59.0 78.0 36.0 82.0 37.0 83.0 33.0
June 81.0 64.0 81.0 45.0 82.0 46.0 84.0 44.0
July 79.0 66.0 80.0 51.0 82.0 53.0 85.0 55.0
August 80.0 65.0 81.0 51.0 85.0 57.0 85.0 59.0
September 83.0 64.0 86.0 59.0 88.0 65.0 89.0 64.0
October 76.0 47.0 78.0 39.0 85.0 43.0 81.0 40.0
November 74.0 40.0 72.0 28.0 81.0 38.0 86.0 49.0
December 60.0 32.0 70.0 36.0 80.0 38.0 75.0 40.0
Mean 72.0 48.0 74.9 36.9 82.0 40.9 82.0 43.9
January 62.0 33.0 71.0 38.0 80.0 33.0 79.0 41.0
February 63.0 35.0 71.0 32.0 77.0 34.0 79.0 36.0
March 71.0 34.0 62.0 21.0 78.0 24.0 74.0 29.0
April 78.0 49.0 70.0 27.0 80.0 31.0 76.0 29.0
May 78.0 54.0 74.0 27.0 82.0 32.0 76.0 28.0
June 77.0 57.0 77.0 43.0 83.0 46.0 83.0 46.0
July 81.0 66.0 80.0 53.0 85.0 56.0 84.0 58.0
August 82.0 67.0 84.0 58.0 87.0 61.0 91.0 63.0
September 80.0 59.0 82.0 48.0 87.0 56.0 89.0 52.0
October 76.0 50.0 78.0 37.0 85.0 47.0 85.0 43.0
November 65.0 34.0 65.0 40.0 80.0 34.0 84.0 42.0
December 64.0 33.0 75.0 34.0 80.0 34.0 83.0 48.0
Mean 73.1 47.6 74.1 38.2 82.0 40.7 81.9 42.9
2013
2012
MONTH
12
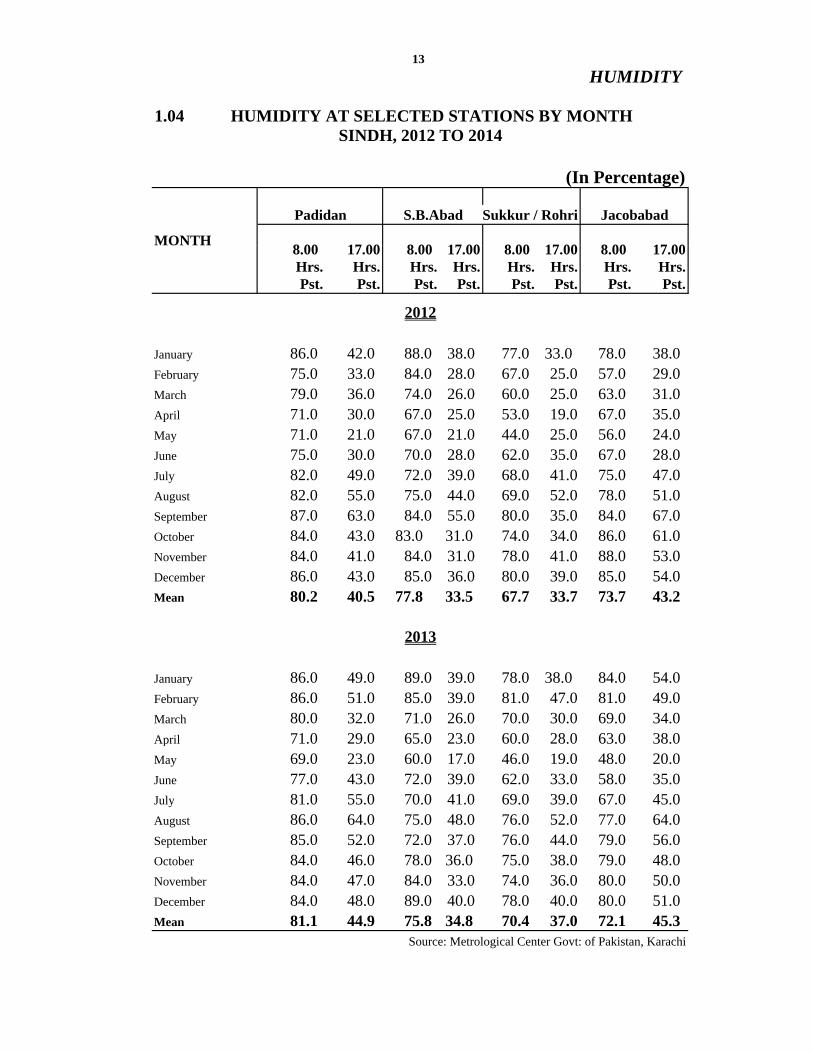
1.04 HUMIDITY AT SELECTED STATIONS BY MONTHSINDH, 2012 TO 2014
HUMIDITY
13
1.04 HUMIDITY AT SELECTED STATIONS BY MONTH
HUMIDITY
(In Percentage)
Padidan S.B.Abad Sukkur / Rohri Jacobabad
8 00 17 00 8 00 17 00 8 00 17 00 8 00 17 00MONTH
SINDH, 2012 TO 2014
8.00 17.00 8.00 17.00 8.00 17.00 8.00 17.00Hrs. Hrs. Hrs. Hrs. Hrs. Hrs. Hrs. Hrs.Pst. Pst. Pst. Pst. Pst. Pst. Pst. Pst.
January 86.0 42.0 88.0 38.0 77.0 33.0 78.0 38.075 0 33 0 84 0 28 0 67 0 25 0 57 0 29 0
2012
February 75.0 33.0 84.0 28.0 67.0 25.0 57.0 29.0March 79.0 36.0 74.0 26.0 60.0 25.0 63.0 31.0April 71.0 30.0 67.0 25.0 53.0 19.0 67.0 35.0May 71.0 21.0 67.0 21.0 44.0 25.0 56.0 24.0June 75.0 30.0 70.0 28.0 62.0 35.0 67.0 28.0July 82.0 49.0 72.0 39.0 68.0 41.0 75.0 47.0
82 0 55 0 75 0 44 0 69 0 52 0 78 0 51 0August 82.0 55.0 75.0 44.0 69.0 52.0 78.0 51.0September 87.0 63.0 84.0 55.0 80.0 35.0 84.0 67.0October 84.0 43.0 83.0 31.0 74.0 34.0 86.0 61.0November 84.0 41.0 84.0 31.0 78.0 41.0 88.0 53.0December 86.0 43.0 85.0 36.0 80.0 39.0 85.0 54.0Mean 80.2 40.5 77.8 33.5 67.7 33.7 73.7 43.2
January 86.0 49.0 89.0 39.0 78.0 38.0 84.0 54.0February 86.0 51.0 85.0 39.0 81.0 47.0 81.0 49.0March 80.0 32.0 71.0 26.0 70.0 30.0 69.0 34.0April 71 0 29 0 65 0 23 0 60 0 28 0 63 0 38 0
2013
April 71.0 29.0 65.0 23.0 60.0 28.0 63.0 38.0May 69.0 23.0 60.0 17.0 46.0 19.0 48.0 20.0June 77.0 43.0 72.0 39.0 62.0 33.0 58.0 35.0July 81.0 55.0 70.0 41.0 69.0 39.0 67.0 45.0August 86.0 64.0 75.0 48.0 76.0 52.0 77.0 64.0September 85.0 52.0 72.0 37.0 76.0 44.0 79.0 56.0October 84 0 46 0 78 0 36 0 75 0 38 0 79 0 48 0October 84.0 46.0 78.0 36.0 75.0 38.0 79.0 48.0November 84.0 47.0 84.0 33.0 74.0 36.0 80.0 50.0December 84.0 48.0 89.0 40.0 78.0 40.0 80.0 51.0Mean 81.1 44.9 75.8 34.8 70.4 37.0 72.1 45.3
Source: Metrological Center Govt: of Pakistan, Karachi
8.0 17.0 8.0 17.0 8.0 17.0 8.0 17.0
Hrs. Hrs. Hrs. Hrs. Hrs. Hrs. Hrs. Hrs.
Pst. Pst. Pst. Pst. Pst. Pst. Pst. Pst.
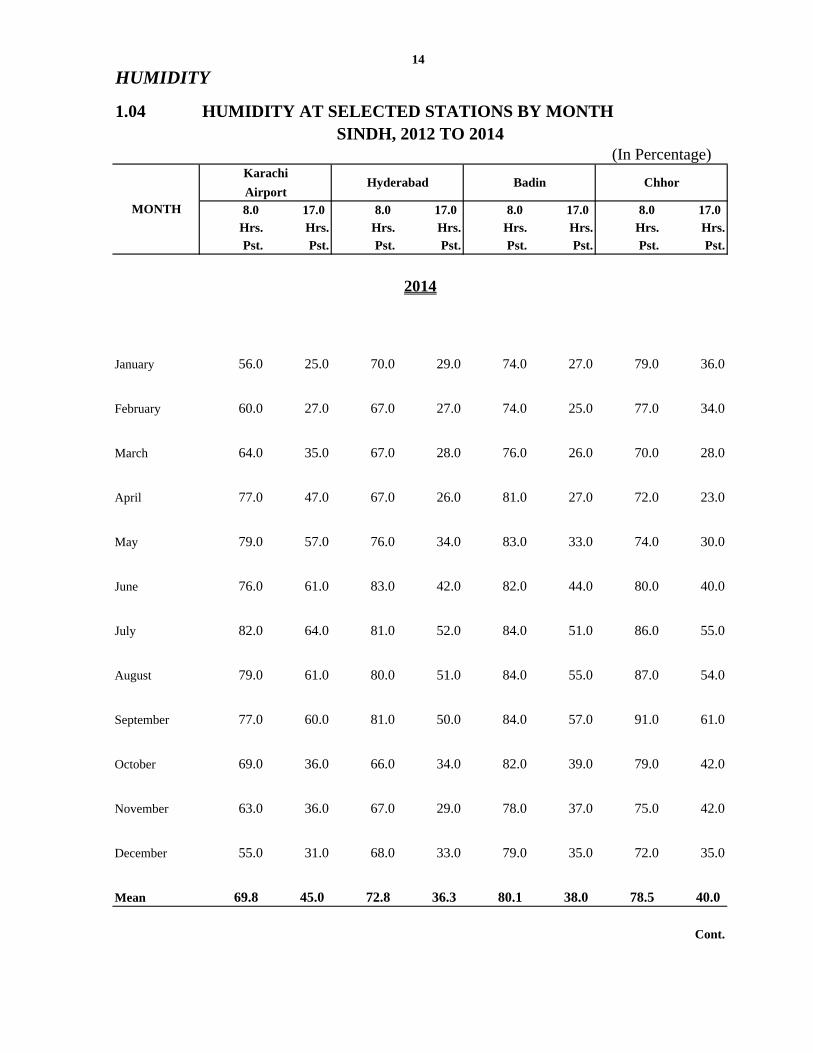
January 56.0 25.0 70.0 29.0 74.0 27.0 79.0 36.0
February 60.0 27.0 67.0 27.0 74.0 25.0 77.0 34.0
March 64.0 35.0 67.0 28.0 76.0 26.0 70.0 28.0
April 77.0 47.0 67.0 26.0 81.0 27.0 72.0 23.0
May 79.0 57.0 76.0 34.0 83.0 33.0 74.0 30.0
June 76.0 61.0 83.0 42.0 82.0 44.0 80.0 40.0
July 82.0 64.0 81.0 52.0 84.0 51.0 86.0 55.0
August 79.0 61.0 80.0 51.0 84.0 55.0 87.0 54.0
September 77.0 60.0 81.0 50.0 84.0 57.0 91.0 61.0
October 69.0 36.0 66.0 34.0 82.0 39.0 79.0 42.0
November 63.0 36.0 67.0 29.0 78.0 37.0 75.0 42.0
December 55.0 31.0 68.0 33.0 79.0 35.0 72.0 35.0
Mean 69.8 45.0 72.8 36.3 80.1 38.0 78.5 40.0
Cont.
Chhor
2014
14
HUMIDITY
1.04 HUMIDITY AT SELECTED STATIONS BY MONTHSINDH, 2012 TO 2014
(In Percentage)
Hyderabad
MONTH
BadinKarachi
Airport

8.0 17.0 8.0 17.0 8.0 17.0 8.0 17.0Hrs. Hrs. Hrs. Hrs. Hrs. Hrs. Hrs. Hrs.
Pst. Pst. Pst. Pst. Pst. Pst. Pst. Pst.
January 79.0 47.0 89.0 34.0 76.0 38.0 73.0 40.0
February 84.0 41.0 84.0 30.0 83.0 36.0 71.0 44.0
March 81.0 42.0 77.0 29.0 70.0 35.0 71.0 46.0
April 67.0 27.0 66.0 21.0 54.0 23.0 65.0 34.0
May 64.0 27.0 66.0 25.0 48.0 23.0 52.0 30.0
June 74.0 35.0 63.0 26.0 55.0 26.0 53.0 27.0
July 78.0 50.0 71.0 39.0 67.0 37.0 71.0 45.0
August 82.0 54.0 73.0 42.0 69.0 40.0 76.0 54.0
September 84.0 52.0 75.0 41.0 71.0 40.0 81.0 57.0
October 82.0 42.0 79.0 32.0 73.0 39.0 78.0 49.0
November 82.0 42.0 82.0 33.0 74.0 35.0 74.0 41.0
December 85.0 48.0 88.0 37.0 82.0 42.0 80.0 45.0
Mean 78.5 42.3 76.1 32.4 68.5 34.5 70.4 42.7
S.B.Abad Sukkur/Rohri JacobabadPadidan
Source: Metrological Center Govt: of Pakistan, Karachi
(In Percentage)
1.04 HUMIDITY AT SELECTED STATIONS BY MONTH SINDH,
15
HUMIDITY
2014
SINDH, 2012 TO 2014
MONTH

CENTRE/STATION 2009 2010 2011 2012 2013 2014
Karachi Airport 279.9 372.9 290.2 152.1 168.9 30.7
Hyderabad 202.2 213.7 71.4 121.0 108.9 24.2
Badin 217.7 348.0 662.5 173.4 141.8 89.3
Chhor 239.9 355.8 550.5 221.6 264.2 65.2
Padidan 13.8 200.4 444.9 104.8 184.3 17.2
S.B.Abad 106.8 342.6 -- 182.2 105.5 66.7
Sukkur/Rohri 75.4 88.0 168.5 215.0 175.4 21.4.
Jacobabad 42.6 146.2 293.3 583.8 345.3 21.3
(In Millimetres)
16
1.05 RAINFALL AT SELECTED STATIONS OF SINDH,
RAINFALL
Source:- Meteorological Centre, Government of Pakistan, Karachi.
2009 TO 2014

17
RAINFALL
(In Millimetres)
MONTH Karachi Hyderabad Badin Chhor Padidan S.B.Abad Sukkur/ JacobabadAirport Rohri
January 0.2 7.0 TR 0.0 0.0 0.0 0.0 1.0
February 0.0 0.0 TR 0.0 TR 0.0 0.0 2.0
March 0.0 0.0 0.0 0.0 0.0 0.0 0.0 1.4
April 0.0 11.4 19.0 TR 14.2 1.0 5.0 TR
May 0.0 0.0 0.0 0.0 0.0 2.5 0.0 1.0
June TR 0.0 0.0 1.0 0.0 0.0 0.0 0.0
July TR 3.2 TR 23.0 0.0 0.0 0.0 0.0
August 8.1 2.2 31.0 28.2 TR 15.2 0.0 0.0
September 121.0 96.0 116.4 169.4 90.6 163.5 210.0 577.9
October 0.0 0.0 0.0 0.0 0.0 0.0 0.0 0.0
November 0.0 0.0 0.0 0.0 0.0 0.0 0.0 0.0
December 22.8 1.0 7.0 0.0 0.0 0.0 0.0 0.5
TOTAL 152.1 121.0 173.4 221.6 104.8 182.2 215.0 583.8
January TR TR 0.0 0.0 1.7 3.0 0.0 3.0
February 20.0 4.4 1.0 24.1 22.3 30.2 32.0 36.1
March 2.8 0.0 0.0 0.0 0.0 1.0 1.0 1.0
April 30.0 28.2 3.0 15.0 6.3 TR 8.0 12.0
May 0.0 TR 0.0 0.0 0.0 0.0 0.0 0.0
June TR TR 17.0 49.0 96.4 19.0 29.0 52.0
July 5.5 2.5 8.6 20.5 14.0 7.5 10.0 0.0
August 105.4 61.8 69.7 143.4 43.6 39.0 95.4 241.2
September 4.0 12.0 29.5 12.2 TR 3.5 0.0 0.0
October 1.2 0.0 13.0 0.0 0.0 2.3 0.0 0.0
November 0.0 0.0 0.0 0.0 TR 0.0 TR TR
December 0.0 0.0 0.0 0.0 0.0 0.0 0.0 0.0
TOTAL 168.9 108.9 141.8 264.2 184.3 105.5 175.4 345.3
Source: Meteorological Centre, Government of Pakistan, Karachi.
2013
2012
1.06 RAINFALL AT SELECTED STATIONS BY MONTHSINDH, 2012 TO 2014
TR= Traceable = less than 0.1 millimetres

1.06 RAINFALL AT SELECTED STATIONS BY MONTH
(In Millimetres)
MONTH Karachi Hyderabad Badin Chhor Padidan S.B.Abad Sukkur/ Jacobabad
Airport Rohri
January TR 0.0 0.0 0.0 0.0 0.0 0.0 3.0
February 0.0 0.0 0.0 0.0 0.0 0.0 0.0 8.1
March 12.4 0.0 0.0 0.0 12.0 7.4 12.0 2.0
April 0.0 7.0 4.0 13.0 1.0 15.0 5.0 1.0
May 1.3 TR TR 0.0 4.2 31.6 1.4 3.2
June TR 0.0 0.0 0.0 0.0 0.0 0.0 0.0
July 1.1 16.0 3.0 0.0 TR 1.3 0.0 4.0
August 9.9 1.2 32.0 9.7 0.0 11.4 3.0 0.0
September 1.4 0.0 50.3 42.5 0.0 0.0 0.0 0.0
October 0.0 0.0 0.0 0.0 0.0 0.0 0.0 0.0
November 4.6 0.0 TR 0.0 0.0 0.0 0.0 0.0
December 0.0 0.0 0.0 0.0 0.0 0.0 0.0 0.0
TOTAL 30.7 24.2 89.3 65.2 17.2 66.7 21.4 21.3TR=Trace Less then 0.1mm
Source: Meteorological Centre, Government of Pakistan, Karachi.
SINDH, 2012 TO 2014
18
RAINFALL
2014

2.00 POPULATION
21
EXPLANATORY NOTE
POPULATION Since the inception of Pakistan five Censuses have been conducted, the first one in 1951, the
second one in 1961, the third one in 1972, fourth in 1981 and fifth census which was
scheduled to be conducted in 1991 has been conducted in March, 1998, detailed results have
been released. These Censuses were conducted by the Population Census Organization,
Government of Pakistan. Population Census Organization defines urban areas as follows:
Urban Areas: - The 1961 Census defined "Urban" as "All Municipalities, Civil Lines,
Cantonments and any other area inhabited by not less than 5,000 persons and consisting of a
continuous collection of houses". In applying this definition it has been found that almost all
urban areas are fully constituted Municipalities or areas administered by Notified Area
Committees. In few cases places having distinctly urban characteristics have been classified as
urban areas although their population falls a short of 5,000.
Note:- As a result of administrative changes, numbers of new districts were created by bifurcating
existing districts. Population figures in this publication are of the districts as stood in the year of
census. For instance Ghotki district was created from within Sukkur district in the year 1993.
This publication shows population of Ghotki in the year 1998 only.
Population Projection The inter-censal growth rates (1981-98) were applied to Provincial & District Projections by
using the following formula:
100
Where, Po = Population of base Census P1 = Population of latest Census r = Growth rate n = Time interval (in years) between two Census

POPULATION
Pakistan/ Area Persons per Sq. k.m.
Province/ (Sq.k.m.)
Region 1951 1961 1972 1981 1998 1951 1961 1972 1981 1998
PAKISTAN 796,096 33,740 42,880 65,310 84,253 132,352 42 54 82 106 166
% (100.00) (100.00) (100.00) (100.00) (100.00) (100.00)
SINDH 140,914 6,048 8,367 14,156 19,029 30,440 43 59 101 135 216
% 17.70 17.93 19.51 21.68 22.59 23.00
Punjab 205,345 20,541 25,464 37,610 47,292 73,621 100 124 183 231 359
% 25.79 60.88 59.38 57.59 56.13 55.63
KPK 74,521 4,556 5,731 8,389 11,061 17,744 61 76 112 148 238
% 9.36 13.50 13.37 12.84 13.13 13.41
Balochistan 347,190 1,167 1,353 2,429 4,332 6,566 3 4 7 12 19
% 43.61 3.46 3.16 3.72 5.14 4.96
F.A.T.A. 27,220 1,332 1,847 2,491 2,199 3,176 49 68 92 81 117
% 3.42 3.95 4.31 3.81 2.61 2.40
Islamabad 906 96 118 235 340 805 106 130 262 376 889
% 0.11 0.28 0.28 0.36 0.40 0.61
Source:- Population Census Organization Government of Pakistan.
Note:- Population Census were conducted in February 1951, June 1961, September 1972, March 1981 and 1998.
23
POPULATION (In ''000'')
2.01 AREA, POPULATION AND POPULATION DENSITY
BY PROVINCE / REGION 1951, 1961, 1972, 1981 & 1998
DENSITY

Pakistan/
Province/
Region 1951 1961 1972 1981 1998 1951 1961 1972 1981 1998
PAKISTAN 33,740 42,880 65,310 84,253 132,352 100.00 100.00 100.00 100.00 100.00
SINDH 6,048 8,367 14,156 19,029 30,440 17.92 19.51 21.68 22.59 23.00
Punjab 20,541 25,464 37,610 47,292 73,621 60.88 59.38 57.58 56.13 55.63
KPK 4,556 5,731 8,389 11,061 17,744 13.51 13.37 12.84 13.13 13.41
Balochistan 1,167 1,353 2,429 4,332 6,566 3.46 3.16 3.72 5.14 4.96
F.A.T.A. 1,332 1,847 2,491 2,199 3,176 3.95 4.31 3.81 2.61 2.40
Islamabad 96 118 235 340 805 0.28 0.27 0.37 0.40 0.61
Source:- Population Census Organization Government of Pakistan.
24
POPULATION (In ''000'') PERCENTAGE SHARE
2.02 POPULATION OF PAKISTAN BY PROVINCE/REGION
1951, 1961, 1972, 1981 AND 1998
POPULATION
(In "000")
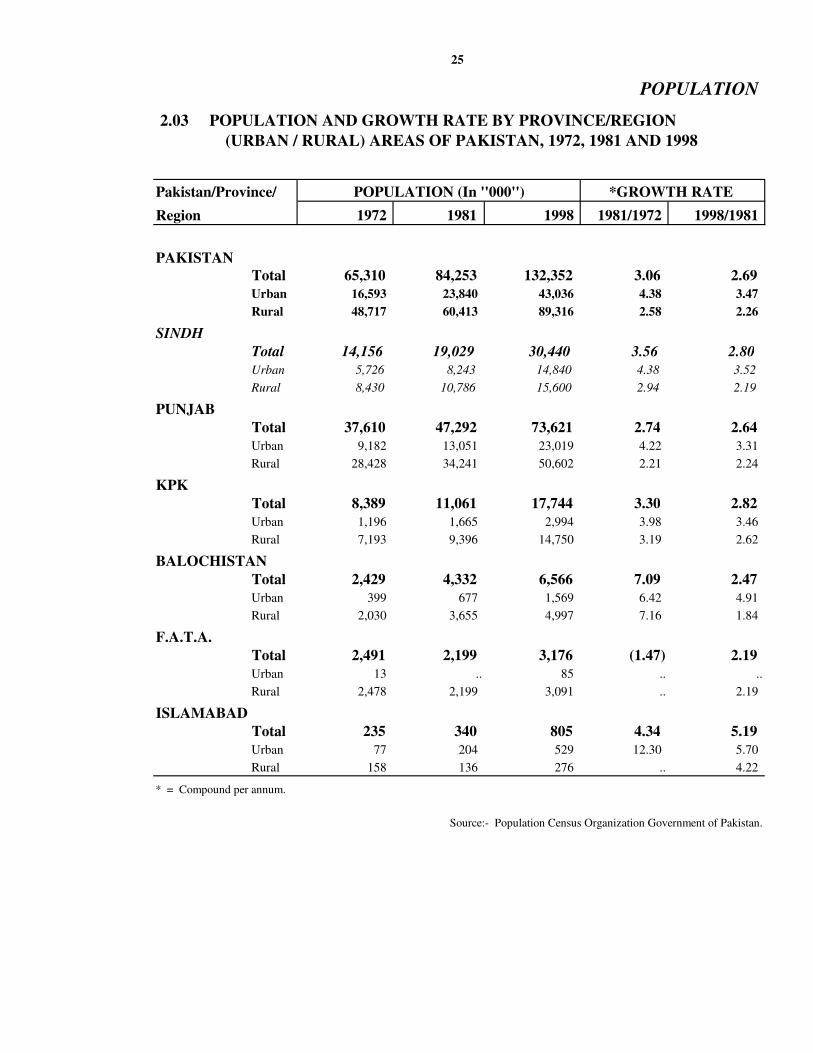
POPULATION
(URBAN / RURAL) AREAS OF PAKISTAN, 1972, 1981 AND 1998
Pakistan/Province/ POPULATION (In ''000'') *GROWTH RATE
Region 1972 1981 1998 1981/1972 1998/1981
PAKISTAN
Total 65,310 84,253 132,352 3.06 2.69
Urban 16,593 23,840 43,036 4.38 3.47
Rural 48,717 60,413 89,316 2.58 2.26
SINDH
Total 14,156 19,029 30,440 3.56 2.80
Urban 5,726 8,243 14,840 4.38 3.52
Rural 8,430 10,786 15,600 2.94 2.19
PUNJAB
Total 37,610 47,292 73,621 2.74 2.64
Urban 9,182 13,051 23,019 4.22 3.31
Rural 28,428 34,241 50,602 2.21 2.24
KPK
Total 8,389 11,061 17,744 3.30 2.82
Urban 1,196 1,665 2,994 3.98 3.46
Rural 7,193 9,396 14,750 3.19 2.62
BALOCHISTAN
Total 2,429 4,332 6,566 7.09 2.47
Urban 399 677 1,569 6.42 4.91
Rural 2,030 3,655 4,997 7.16 1.84
F.A.T.A.
Total 2,491 2,199 3,176 (1.47) 2.19
Urban 13 .. 85 .. ..
Rural 2,478 2,199 3,091 .. 2.19
ISLAMABAD
Total 235 340 805 4.34 5.19
Urban 77 204 529 12.30 5.70
Rural 158 136 276 .. 4.22
* = Compound per annum.
Source:- Population Census Organization Government of Pakistan.
25
2.03 POPULATION AND GROWTH RATE BY PROVINCE/REGION

IN SINDH, 1941 TO 1998 (CENSUS)
POPULATION (In ''000'') GROWTH RATE
1941 1951 1961 1941 1951 1961
SINDH 4,840 6,048 8,367 2.91 1.84 3.30
Khairpur 305 347 500 3.02 0.44 3.72
S.B.Abad 584 490 691 1.64 (1.76) 3.50
Sukkur 692 392 485 1.05 0.57 2.15
Naushero Feroze .. .. .. .. .. ..
Ghotki .. .. .. .. .. ..
Shikarpur .. 313 323 .. .. 0.31
Jacobabad 304 345 427 2.59 1.27 2.15
Larkana 511 502 605 1.31 (0.18) 1.88
Sanghar .. 321 430 .. .. 2.93
Mirpurkhas 581 605 728 2.19 3.48 1.88
Tharparkar .. .. .. .. .. ..
Dadu 389 416 486 1.41 0.68 1.53
Hyderabad 758 641 953 1.36 (1.64) 4.05
Badin .. 257 334 .. .. 2.66
Thatta 278 286 361 0.36 0.44 2.33
Karachi 435 1,133 2,044 3.78 10.07 6.08
Note: Figures have been rounded to nearest decimal place.
Contd.
26
Province/District
POPULATION
2.04 POPULATION AND GROWTH RATE BY DISTRICT
(In "000")

POPULATION
IN SINDH, 1941 TO 1998 (CENSUS)
POPULATION (In ''000'') GROWTH RATE
1972 1981 1998 1972 1981 1998
SINDH 14,156 19,029 30,440 4.57 3.56 2.80
Khairpur 725 981 1,547 3.20 3.62 2.71
S.B.Abad 1,354 802 1,072 5.90 2.24 1.63
Sukkur 838 1,098 908 4.79 3.23 2.88
Naushero Feroze .. 833 1,088 .. 2.24 1.61
Ghotki .. .. 970 .. .. 3.26
Shikarpur 547 620 880 4.61 1.48 2.32
Jacobabad 709 1,012 1,426 4.40 4.28 2.04
Larkana 921 1,139 1,927 3.70 2.53 3.14
Sanghar 694 971 1,453 4.16 4.05 2.74
Mirpurkhas 1,015 904 906 2.90 4.53 2.68
Tharparkar .. 577 914 .. 4.53 3.13
Dadu 806 1,085 1,689 4.40 3.54 2.65
Hyderabad 1,654 2,031 2,892 4.84 2.43 2.02
Badin 607 777 1,136 5.24 2.94 2.26
Thatta 676 761 1,113 5.53 1.40 2.26
Umerkot .. .. 663 .. .. 3.28
Karachi 3,610 5,437 9,856 4.97 4.95 3.56
Note: District Naushero Feroze, Ghotki and Umerkot was formed after 1981 Population Census.
Source: 1951-81 Population of Administrative Units Report and District Census reports, 1998
Population Census Organization Government of Pakistan.
Province/District
27
2.04 POPULATION AND GROWTH RATE BY DISTRICT
(In "000")
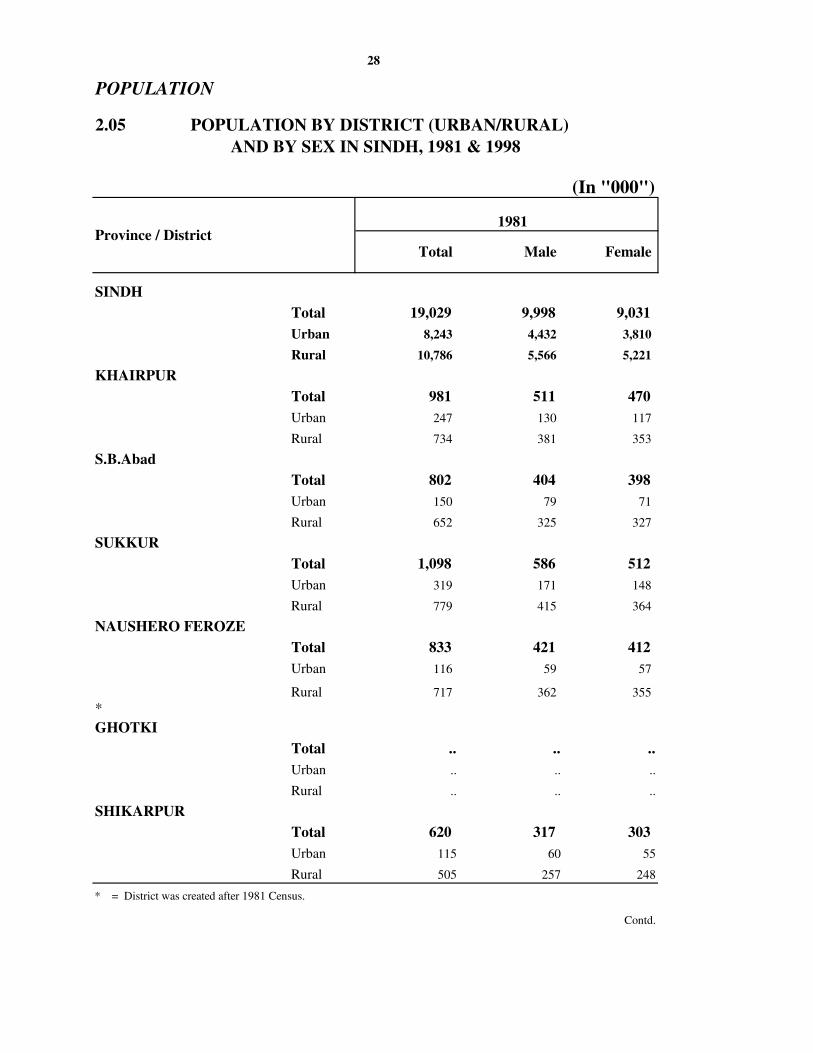
AND BY SEX IN SINDH, 1981 & 1998
(In "000")
1981
SINDH
Total 19,029 9,998 9,031
Urban 8,243 4,432 3,810
Rural 10,786 5,566 5,221
KHAIRPUR
Total 981 511 470
Urban 247 130 117
Rural 734 381 353
S.B.Abad
Total 802 404 398
Urban 150 79 71
Rural 652 325 327
SUKKUR
Total 1,098 586 512
Urban 319 171 148
Rural 779 415 364
NAUSHERO FEROZE
Total 833 421 412
Urban 116 59 57
Rural 717 362 355
*
GHOTKI
Total .. .. ..
Urban .. .. ..
Rural .. .. ..
SHIKARPUR
Total 620 317 303
Urban 115 60 55
Rural 505 257 248
* = District was created after 1981 Census.
Contd.
Province / District
28
POPULATION
Total Male Female
2.05 POPULATION BY DISTRICT (URBAN/RURAL)
POPULATION
AND BY SEX IN SINDH, 1981 & 1998
(In "000")
1998
SINDH
Total 30,440 16,098 14,342
Urban 14,840 7,905 6,935
Rural 15,600 8,193 7,407
KHAIRPUR
Total 1,547 811 736
Urban 365 191 174
Rural 1,182 620 562
S.B.Abad
Total 1,072 556 516
Urban 283 147 136
Rural 789 409 380
SUKKUR
Total 908 483 425
Urban 462 247 215
Rural 446 236 210
NAUSHERO FEROZE
Total 1,088 569 519
Urban 193 100 93
Rural 895 469 426
GHOTKI
Total 970 511 459
Urban 158 82 76
Rural 812 429 383
SHIKARPUR
Total 880 457 423
Urban 212 109 103
Rural 668 348 320
Contd.
Province / District
29
Total Male Female
2.05 POPULATION BY DISTRICT (URBAN/RURAL)

AND BY SEX IN SINDH, 1981 & 1998
(In "000")
JACOBABAD
Total 1,012 515 497
Urban 159 83 75
Rural 853 432 422
LARKANA
Total 1,139 597 542
Urban 256 135 121
Rural 883 462 421
SANGHAR
Total 971 508 463
Urban 198 104 94
Rural 773 404 369
MIRPURKHAS
Total 904 478 426
Urban 232 124 108
Rural 672 354 318
THARPARKAR
Total 577 305 272
Urban 25 14 11
Rural 552 291 261
DADU
Total 1,085 563 522
Urban 152 81 71
Rural 933 482 451
HYDERABAD
Total 2,031 1,046 985
Urban 911 481 430
Rural 1,120 565 555
Contd.
Province / District
30
POPULATION
Total Male Female
2.05 POPULATION BY DISTRICT (URBAN/RURAL)
1981

POPULATION
AND BY SEX IN SINDH, 1981 & 1998
(In "000")
JACOBABAD
Total 1,426 744 682
Urban 347 181 166
Rural 1,079 563 516
LARKANA
Total 1,927 993 934
Urban 557 288 269
Rural 1,370 705 665
SANGHAR
Total 1,453 762 691
Urban 331 173 158
Rural 1,122 589 533
MIRPURKHAS
Total 906 471 435
Urban 300 155 145
Rural 606 316 290
THARPARKAR
Total 914 500 414
Urban 40 21 19
Rural 874 479 395
DADU
Total 1,689 887 802
Urban 361 187 174
Rural 1,328 700 628
HYDERABAD
Total 2,892 1,511 1,381
Urban 1,469 770 699
Rural 1,423 741 682
Contd.
Province / District
31
Total Male Female
2.05 POPULATION BY DISTRICT (URBAN/RURAL)
1998

AND BY SEX IN SINDH, 1981 & 1998
(In "000")
BADIN
Total 777 401 376
Urban 82 44 38
Rural 695 357 338
THATTA
Total 761 392 369
Urban 73 38 35
Rural 688 354 334
KARACHI EAST
Total 1,885 1,024 861
Urban 1,697 922 775
Rural 188 102 86
KARACHI WEST
Total 931 506 425
Urban 889 483 406
Rural 42 23 19
KARACHI SOUTH
Total 1,264 687 577
Urban 1,264 687 577
Rural .. .. ..
KARACHI CENTRAL
Total 1,357 737 620
Urban 1,357 737 620
Rural .. .. ..
Contd.
Province / District
32
POPULATION
Total Male Female
2.05 POPULATION BY DISTRICT (URBAN/RURAL)
1981

POPULATION
AND BY SEX IN SINDH, 1981 & 1998
(In "000")
BADIN
Total 1,136 598 538
Urban 186 99 87
Rural 950 499 451
THATTA
Total 1,113 589 524
Urban 125 65 60
Rural 988 524 464
UMERKOT
Total 663 350 313
Urban 112 60 52
Rural 551 290 261
KARACHI EAST
Total 2,746 1,464 1,282
Urban 2,746 1,464 1,282
Rural .. .. ..
KARACHI WEST
Total 2,106 1,149 957
Urban 1,910 1,045 865
Rural 196 104 92
KARACHI SOUTH
Total 1,745 943 802
Urban 1,745 943 802
Rural .. .. ..
KARACHI CENTRAL
Total 2,278 1,201 1,077
Urban 2,278 1,201 1,077
Rural .. .. ..
MALIR
Total 981 549 432
Urban 660 377 283
Rural 321 172 149
Source:- Population Census Reports 1981 & 1998 Population Census Organization, Government of Pakistan.
33
Province / DistrictTotal Male Female
2.05 POPULATION BY DISTRICT (URBAN/RURAL)
1998
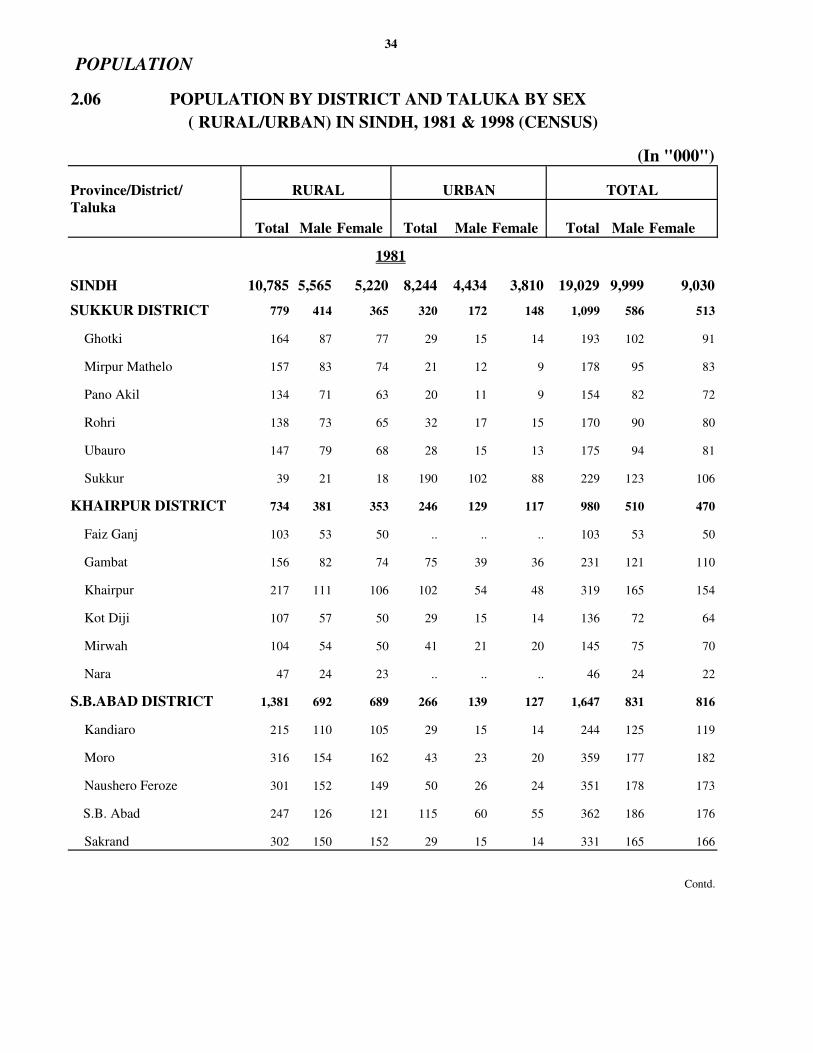
( RURAL/URBAN) IN SINDH, 1981 & 1998 (CENSUS)
(In "000")
Province/District/ RURAL URBAN TOTAL
Taluka
Total Male Female Total Male Female Total Male Female
SINDH 10,785 5,565 5,220 8,244 4,434 3,810 19,029 9,999 9,030
SUKKUR DISTRICT 779 414 365 320 172 148 1,099 586 513
Ghotki 164 87 77 29 15 14 193 102 91
Mirpur Mathelo 157 83 74 21 12 9 178 95 83
Pano Akil 134 71 63 20 11 9 154 82 72
Rohri 138 73 65 32 17 15 170 90 80
Ubauro 147 79 68 28 15 13 175 94 81
Sukkur 39 21 18 190 102 88 229 123 106
KHAIRPUR DISTRICT 734 381 353 246 129 117 980 510 470
Faiz Ganj 103 53 50 .. .. .. 103 53 50
Gambat 156 82 74 75 39 36 231 121 110
Khairpur 217 111 106 102 54 48 319 165 154
Kot Diji 107 57 50 29 15 14 136 72 64
Mirwah 104 54 50 41 21 20 145 75 70
Nara 47 24 23 .. .. .. 46 24 22
S.B.ABAD DISTRICT 1,381 692 689 266 139 127 1,647 831 816
Kandiaro 215 110 105 29 15 14 244 125 119
Moro 316 154 162 43 23 20 359 177 182
Naushero Feroze 301 152 149 50 26 24 351 178 173
S.B. Abad 247 126 121 115 60 55 362 186 176
Sakrand 302 150 152 29 15 14 331 165 166
Contd.
1981
34
POPULATION
2.06 POPULATION BY DISTRICT AND TALUKA BY SEX
POPULATION
(RURAL/URBAN) IN SINDH, 1981 & 1998 (CENSUS)
(In "000")
Province/District RURAL URBAN TOTAL
Taluka
Total Male Female Total Male Female Total Male Female
LARKANA DISTRICT 882 461 421 257 136 121 1,139 597 542
Dokri 163 85 78 23 12 11 186 97 89
Kamber 140 74 66 26 14 12 166 88 78
Larkana 130 68 62 124 66 58 254 134 120
Miro Khan 112 59 53 .. .. .. 112 59 53
Ratodero 98 51 47 35 18 17 133 69 64
Shahdadkot 93 48 45 32 17 15 125 65 60
Warah 146 76 70 17 9 8 163 85 78
JACOBABAD DISTRICT 854 432 422 158 83 75 1,012 515 497
Gahri Khairo 94 45 49 8 4 4 102 49 53
Jacobabad 102 52 50 79 41 38 181 93 88
Kashmore 168 87 81 12 7 5 180 94 86
Thul 290 144 146 13 7 6 303 151 152
Kandh Kot 200 104 96 46 24 22 246 128 118
SHIKARPUR DISTRICT 504 257 247 116 60 56 620 317 303
Ghari Yasin 151 77 74 9 5 4 160 82 78
Khanpur 85 44 41 12 6 6 97 50 47
Lakhi 176 88 88 7 4 3 183 92 91
Shikarpur 92 48 44 88 45 43 180 93 87
HYDERABAD DISTRICT 1,143 576 567 912 482 430 2,055 1,058 997
Hala 376 186 190 57 29 28 433 215 218
Hyderabad City 16 8 8 752 399 353 768 407 361
Hyderabad 221 111 110 17 9 8 238 120 118
Tando Allah Yar 292 150 142 38 20 18 330 170 160
Tando Muhammad Khan 238 121 117 48 25 23 286 146 140
DADU DISTRICT 926 479 447 151 81 70 1,077 560 517
Dadu 148 76 72 39 21 18 187 97 90
Johi 162 80 82 6 3 3 168 83 85
Khairpur Nathan Shah 137 71 66 19 10 9 156 81 75
Kotri 144 78 66 40 22 18 184 100 84
Mehar 169 89 80 20 10 10 189 99 90
Sehwan 98 50 48 20 11 9 118 61 57
Thano Bula Khan 68 35 33 7 4 3 75 39 36
Contd.
35
1981
2.06 POPULATION BY DISTRICT AND TALUKA BY SEX

(RURAL/URBAN) IN SINDH, 1981 & 1998 (CENSUS)
(In "000")
Province/District/ RURAL URBAN TOTAL
Taluka
Male Female Total Male Female Total Male Female
BADIN DISTRICT 694 357 337 82 44 38 776 401 375
Badin 194 100 94 37 20 17 231 120 111
Golarchi 134 70 64 3 2 1 137 72 65
Matli 182 92 90 32 16 16 214 108 106
Tando Bago 184 95 89 10 6 4 194 101 93
THATTA DISTRICT 688 354 334 73 38 35 761 392 369
Gohra Bari 74 37 37 1 1 .. 75 38 37
Jati 80 41 39 4 2 2 84 43 41
Keti Bunder 21 10 11 .. .. .. 21 10 11
Kharo Chan 17 9 8 .. .. .. 17 9 8
Mirpur Bathero 93 47 46 11 6 5 104 53 51
Mirpursakro 121 63 58 12 6 6 133 69 64
Shah Bunder 59 30 29 8 4 4 67 34 33
Sujawal 74 39 35 15 8 7 89 47 42
Thatta 149 78 71 22 11 11 171 89 82
SANGHAR DISTRICT 725 379 346 198 104 94 923 483 440
Khipro 191 100 91 15 8 7 206 108 98
Sanghar 126 67 59 30 16 14 156 83 73
Shahdadpur 163 84 79 61 32 29 224 116 108
Sinjhoro 144 76 68 22 11 11 166 87 79
Tando Adam 101 52 49 70 37 33 171 89 82
Contd.
36
POPULATION
2.06 POPULATION BY DISTRICT AND TALUKA BY SEX
1981
Total
POPULATION
(RURAL/URBAN) IN SINDH, 1981 & 1998 (CENSUS)
(In "000")
Province/District/ RURAL URBAN TOTAL
Taluka
Total Male Female Total MaleFemale Total Male Female
1981
THARPARKAR DISTRICT 1,245 658 587 257 136 121 1,502 794 708
Chachro 177 96 81 .. .. .. 177 96 81
Digri 137 72 65 49 25 24 186 97 89
Diplo 99 53 46 6 3 3 105 56 49
Jamesabad 98 51 47 11 6 5 109 57 52
Mirpurkhas 163 83 80 125 66 59 288 149 139
Mithi 137 74 63 17 9 8 154 83 71
Nagar Parkar 104 55 49 1 1 .. 105 56 49
Samaro 132 69 63 12 7 5 144 76 68
Umer kot 198 105 93 36 19 17 234 124 110
KARACHI 230 125 105 5,208 2,830 2,378 5,438 2,955 2,483
Contd.
37
2.06 POPULATION BY DISTRICT AND TALUKA BY SEX
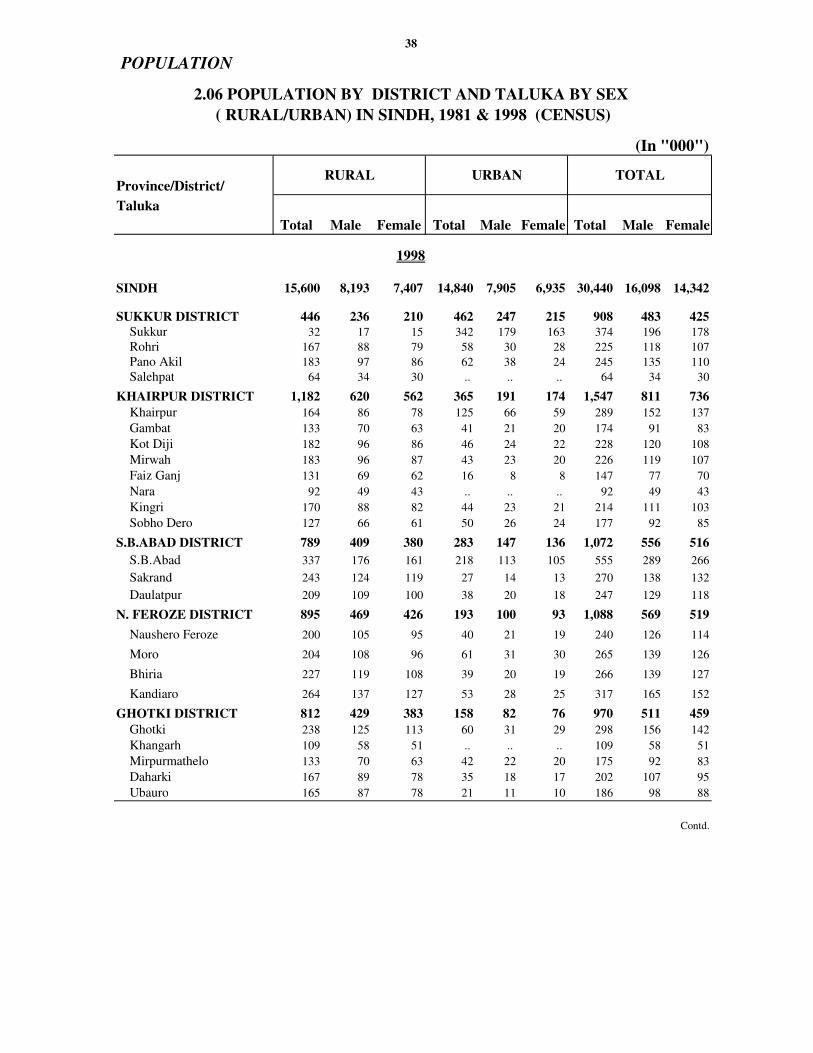
( RURAL/URBAN) IN SINDH, 1981 & 1998 (CENSUS)
(In "000")
Province/District/
Taluka
Total Male Female Total Male Female Total Male Female
1998
SINDH 15,600 8,193 7,407 14,840 7,905 6,935 30,440 16,098 14,342
SUKKUR DISTRICT 446 236 210 462 247 215 908 483 425
Sukkur 32 17 15 342 179 163 374 196 178
Rohri 167 88 79 58 30 28 225 118 107
Pano Akil 183 97 86 62 38 24 245 135 110
Salehpat 64 34 30 .. .. .. 64 34 30
KHAIRPUR DISTRICT 1,182 620 562 365 191 174 1,547 811 736
Khairpur 164 86 78 125 66 59 289 152 137
Gambat 133 70 63 41 21 20 174 91 83
Kot Diji 182 96 86 46 24 22 228 120 108
Mirwah 183 96 87 43 23 20 226 119 107
Faiz Ganj 131 69 62 16 8 8 147 77 70
Nara 92 49 43 .. .. .. 92 49 43
Kingri 170 88 82 44 23 21 214 111 103
Sobho Dero 127 66 61 50 26 24 177 92 85
S.B.ABAD DISTRICT 789 409 380 283 147 136 1,072 556 516
S.B.Abad 337 176 161 218 113 105 555 289 266
Sakrand 243 124 119 27 14 13 270 138 132
Daulatpur 209 109 100 38 20 18 247 129 118
N. FEROZE DISTRICT 895 469 426 193 100 93 1,088 569 519
Naushero Feroze 200 105 95 40 21 19 240 126 114
Moro 204 108 96 61 31 30 265 139 126
Bhiria 227 119 108 39 20 19 266 139 127
Kandiaro 264 137 127 53 28 25 317 165 152
GHOTKI DISTRICT 812 429 383 158 82 76 970 511 459
Ghotki 238 125 113 60 31 29 298 156 142
Khangarh 109 58 51 .. .. .. 109 58 51
Mirpurmathelo 133 70 63 42 22 20 175 92 83
Daharki 167 89 78 35 18 17 202 107 95
Ubauro 165 87 78 21 11 10 186 98 88
Contd.
38
POPULATION
2.06 POPULATION BY DISTRICT AND TALUKA BY SEX
RURAL URBAN TOTAL
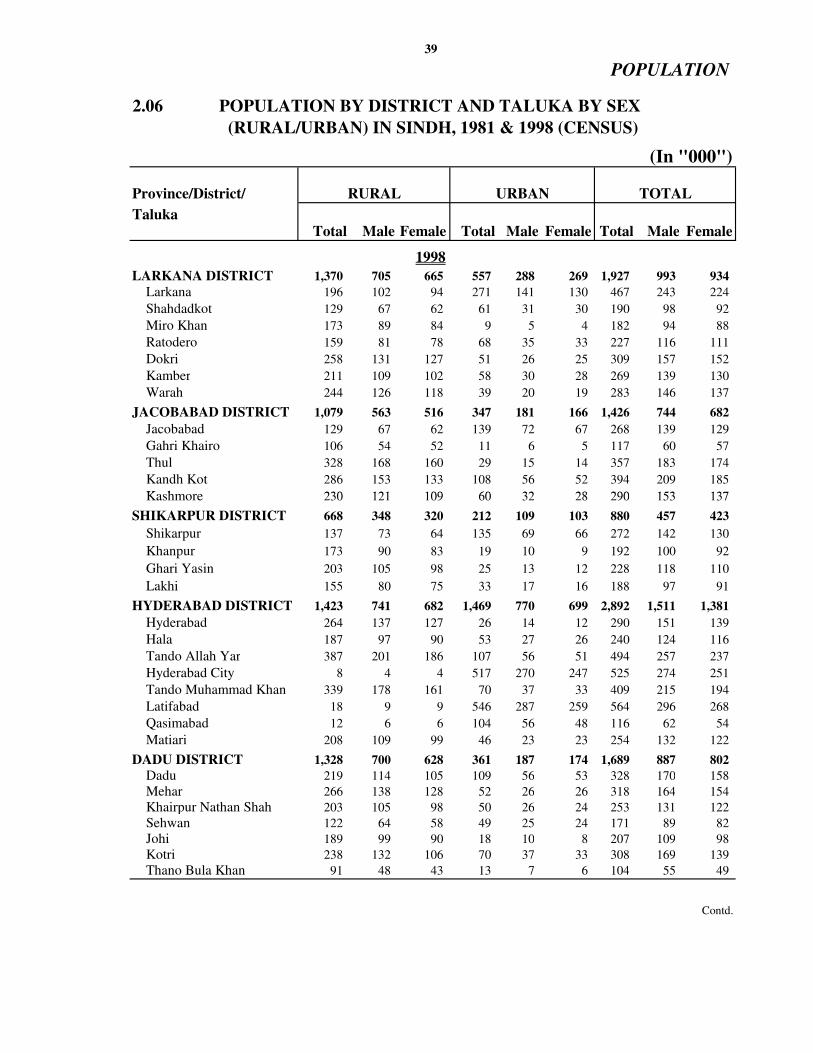
POPULATION
(RURAL/URBAN) IN SINDH, 1981 & 1998 (CENSUS)
(In "000")
Province/District/ RURAL URBAN TOTAL
Taluka
Total Male Female Total Male Female Total Male Female
1998
LARKANA DISTRICT 1,370 705 665 557 288 269 1,927 993 934
Larkana 196 102 94 271 141 130 467 243 224
Shahdadkot 129 67 62 61 31 30 190 98 92
Miro Khan 173 89 84 9 5 4 182 94 88
Ratodero 159 81 78 68 35 33 227 116 111
Dokri 258 131 127 51 26 25 309 157 152
Kamber 211 109 102 58 30 28 269 139 130
Warah 244 126 118 39 20 19 283 146 137
JACOBABAD DISTRICT 1,079 563 516 347 181 166 1,426 744 682
Jacobabad 129 67 62 139 72 67 268 139 129
Gahri Khairo 106 54 52 11 6 5 117 60 57
Thul 328 168 160 29 15 14 357 183 174
Kandh Kot 286 153 133 108 56 52 394 209 185
Kashmore 230 121 109 60 32 28 290 153 137
39
2.06 POPULATION BY DISTRICT AND TALUKA BY SEX
Kashmore 230 121 109 60 32 28 290 153 137
SHIKARPUR DISTRICT 668 348 320 212 109 103 880 457 423
Shikarpur 137 73 64 135 69 66 272 142 130
Khanpur 173 90 83 19 10 9 192 100 92
Ghari Yasin 203 105 98 25 13 12 228 118 110
Lakhi 155 80 75 33 17 16 188 97 91
HYDERABAD DISTRICT 1,423 741 682 1,469 770 699 2,892 1,511 1,381
Hyderabad 264 137 127 26 14 12 290 151 139
Hala 187 97 90 53 27 26 240 124 116
Tando Allah Yar 387 201 186 107 56 51 494 257 237
Hyderabad City 8 4 4 517 270 247 525 274 251
Tando Muhammad Khan 339 178 161 70 37 33 409 215 194
Latifabad 18 9 9 546 287 259 564 296 268
Qasimabad 12 6 6 104 56 48 116 62 54
Matiari 208 109 99 46 23 23 254 132 122
DADU DISTRICT 1,328 700 628 361 187 174 1,689 887 802
Dadu 219 114 105 109 56 53 328 170 158
Mehar 266 138 128 52 26 26 318 164 154
Khairpur Nathan Shah 203 105 98 50 26 24 253 131 122
Sehwan 122 64 58 49 25 24 171 89 82
Johi 189 99 90 18 10 8 207 109 98
Kotri 238 132 106 70 37 33 308 169 139
Thano Bula Khan 91 48 43 13 7 6 104 55 49
Contd.

(RURAL/URBAN) IN SINDH, 1981 & 1998 (CENSUS)
(In "000")
Province/District/ RURAL URBAN TOTAL
Taluka
Total Male Female Total Male Female Total Male Female
BADIN DISTRICT 950 499 451 186 99 87 1,136 598 538
Badin 270 142 128 86 46 40 356 188 168
Golarchi 180 96 84 19 10 9 199 106 93
Matli 227 118 109 56 29 27 283 147 136
Tando Bago 273 143 130 25 14 11 298 157 141
THATTA DISTRICT 988 524 464 125 65 60 1,113 589 524
Thatta 217 115 102 37 19 18 254 134 120
Mirpursakro 175 93 82 24 12 12 199 105 94
Keti Bunder 23 12 11 3 2 1 26 14 12
Gohra Bari 105 55 50 .. .. .. 105 55 50
Sujawal 104 55 49 23 12 11 127 67 60
Mirpur Bathero 135 72 63 17 9 8 152 81 71
Jati 116 62 54 8 4 4 124 66 58
Shah Bunder 87 46 41 13 7 6 100 53 47
Kharo Chan 26 14 12 .. .. .. 26 14 12
MIRPURKHAS DISTRICT 606 316 290 300 155 145 906 471 435
Mirpurkhas 228 119 109 200 103 97 428 222 206
Digri 216 113 103 83 43 40 299 156 143
Kot Ghulam Muhammad 162 84 78 17 9 8 179 93 86
Contd.
40
POPULATION
2.06 POPULATION BY DISTRICT AND TALUKA BY SEX
1998

POPULATION
(RURAL/URBAN) IN SINDH, 1981 & 1998 (CENSUS)
(In "000")
Province/District/
Taluka
Total Male Female Total Male Female Total Male Female
1998
SANGHAR DISTRICT 1,122 589 533 331 173 158 1,453 762 691
Sanghar 204 107 97 61 32 29 265 139 126
Khipro 302 160 142 25 13 12 327 173 154
Sinjhoro 163 86 77 36 18 18 199 104 95
Shahdadpur 250 130 120 91 48 43 341 178 163
Tando Adam 126 66 60 105 55 50 231 121 110
Jam Nawaz Ali 77 40 37 13 7 6 90 47 43
THARPARKAR DISTRICT 874 479 395 40 21 19 914 500 414
Mithi 211 113 98 30 16 14 241 129 112
Diplo 152 82 70 10 5 5 162 87 75
Chachro 358 202 156 .. .. .. 358 202 156
Nagarparkar 153 82 71 .. .. .. 153 82 71
UMERKOT DISTRICT 551 290 261 112 60 52 663 350 313
Umerkot 246 130 116 67 37 30 313 167 146
Kunri 130 68 62 28 14 14 158 82 76
Samaro 105 55 50 8 4 4 113 59 54
Pithoro 70 37 33 9 5 4 79 42 37
KARACHI 517 276 241 9,339 5,030 4,309 9,856 5,306 4,550
Karachi East .. .. .. 2,746 1,464 1,282 2,746 1,464 1,282
Karachi West 196 104 92 1,910 1,045 865 2,106 1,149 957
Karachi South .. .. .. 1,745 943 802 1,745 943 802
Karachi Central .. .. .. 2,278 1,201 1,077 2,278 1,201 1,077
Malir 321 172 149 660 377 283 981 549 432
Note: Total of Rural and Urban of Male & Female may not tally due to conversion of figures in "000".
RURAL URBAN TOTAL
41
2.06 POPULATION BY DISTRICT AND TALUKA BY SEX
Source: 'Population Census Reports 1981 & 1998, Population Census Organization Government of Pakistan.
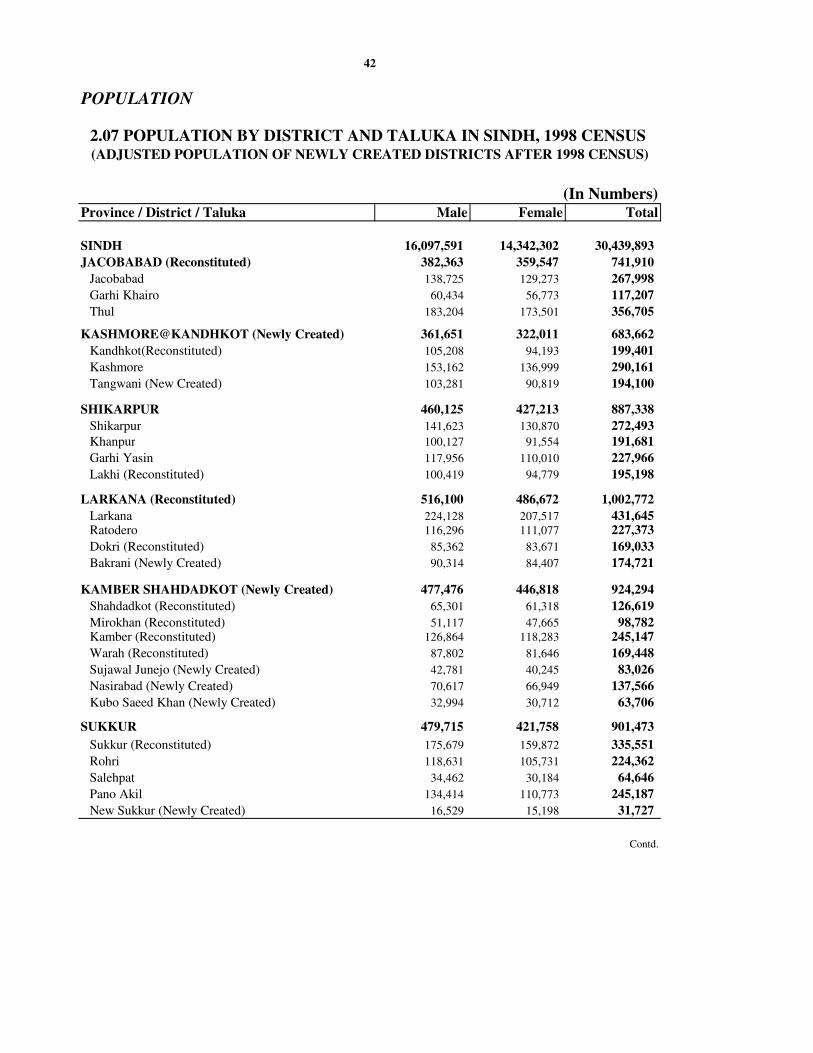
POPULATION
(In Numbers)Province / District / Taluka Male Female Total
SINDH 16,097,591 14,342,302 30,439,893
JACOBABAD (Reconstituted) 382,363 359,547 741,910
Jacobabad 138,725 129,273 267,998
Garhi Khairo 60,434 56,773 117,207
Thul 183,204 173,501 356,705
KASHMORE@KANDHKOT (Newly Created) 361,651 322,011 683,662
Kandhkot(Reconstituted) 105,208 94,193 199,401
Kashmore 153,162 136,999 290,161
Tangwani (New Created) 103,281 90,819 194,100
SHIKARPUR 460,125 427,213 887,338
Shikarpur 141,623 130,870 272,493
Khanpur 100,127 91,554 191,681
Garhi Yasin 117,956 110,010 227,966
Lakhi (Reconstituted) 100,419 94,779 195,198
LARKANA (Reconstituted) 516,100 486,672 1,002,772
Larkana 224,128 207,517 431,645 Ratodero 116,296 111,077 227,373
Dokri (Reconstituted) 85,362 83,671 169,033
Bakrani (Newly Created) 90,314 84,407 174,721
KAMBER SHAHDADKOT (Newly Created) 477,476 446,818 924,294
Shahdadkot (Reconstituted) 65,301 61,318 126,619
Mirokhan (Reconstituted) 51,117 47,665 98,782 Kamber (Reconstituted) 126,864 118,283 245,147
Warah (Reconstituted) 87,802 81,646 169,448
Sujawal Junejo (Newly Created) 42,781 40,245 83,026
Nasirabad (Newly Created) 70,617 66,949 137,566
Kubo Saeed Khan (Newly Created) 32,994 30,712 63,706
SUKKUR 479,715 421,758 901,473
Sukkur (Reconstituted) 175,679 159,872 335,551
Rohri 118,631 105,731 224,362
Salehpat 34,462 30,184 64,646
Pano Akil 134,414 110,773 245,187
New Sukkur (Newly Created) 16,529 15,198 31,727
Contd.
42
2.07 POPULATION BY DISTRICT AND TALUKA IN SINDH, 1998 CENSUS (ADJUSTED POPULATION OF NEWLY CREATED DISTRICTS AFTER 1998 CENSUS)

POPULATION
(In Numbers)
Province / District / Taluka Male Female Total
GHOTKI 511,363 459,186 970,549
Ghotki 156,453 142,181 298,634
Khangarh 58,012 51,175 109,187
Mirpur Mathelo 91,454 83,625 175,079
Ubauro 97,999 88,155 186,154
Daharki 107,445 94,050 201,495
KHAIRPUR 810,448 736,139 1,546,587
Khairpur 151,392 137,263 288,655
Kingri 111,081 102,985 214,066
Sobhodero 92,456 84,994 177,450
Gambat 90,734 82,518 173,252
Kotdiji 119,941 108,027 227,968
Mirwah 118,993 107,380 226,373
Faiz Ganj 76,534 69,902 146,436
Nara 49,317 43,070 92,387
NAUSHERO FEROZE 568,574 518,997 1,087,571
Kandiaro (Reconstituted) 115,473 107,056 222,529
Naushero Feroze 126,216 114,110 240,326
Bhiria (Reconstituted) 106,618 97,502 204,120
Moro 138,980 126,271 265,251
Mehrabpur (Newly Created) 81,287 74,058 155,345
S.B.ABAD 571,834 530,750 1,102,584
Sakrand 137,919 131,941 269,860
Nawabshah(Reconstituted) 146,292 135,010 281,302
Daulatpur 129,046 117,751 246,797
Daur (Newly Created) 158,577 146,048 304,625
DADU (Reconstituted) 574,487 532,230 1,106,717
Mehar 164,148 153,905 318,053
Khairpur Nathan Shah 131,194 122,115 253,309
Dadu 170,375 157,597 327,972
Johi 108,770 98,613 207,383
JAMSHORO (Newly Created) 312,574 269,520 582,094
Kotri (Reconstituted) 113,265 94,309 207,574
Sehwan 89,255 81,334 170,589
Thano Bula Khan 54,702 49,124 103,826
Manjhand (Newly Created) 55,352 44,753 100,105
Contd.
43
'2.07 POPULATION BY DISTRICT AND TALUKA IN SINDH, 1998 CENSUS
(ADJUSTED POPULATION OF NEWLY CREATED DISTRICTS AFTER 1998 CENSUS)

POPULATION
(In Numbers)
Province / District / Taluka Male Female Total
HYDERABAD (Reconstituted) 785,634 713,231 1,498,865
Hyderabad City 273,918 251,381 525,299
Latifabad 296,374 267,387 563,761
Hyderabad (Reconstituted) 153,647 140,784 294,431
Qasimabad 61,695 53,679 115,374
TANDO ALLAHYAR (Newly Created) 243,454 224,919 468,373
Tando Allahyar (Reconstituted) 107,538 99,123 206,661
Chambar (Newly Created) 65,332 60,226 125,558
Jhandomari (Newly Created) 70,584 65,570 136,154
TANDO M. KHAN (Newly Created) 231,418 209,621 441,039
T.M. Khan (Reconstituted) 87,304 78,886 166,190
Bulri (Newly Created) 82,729 74,954 157,683
Tando G.Haider (Newly Created) 61,385 55,781 117,166
MATIARI (Newly Created) 267,517 247,881 515,398
Matiari (Reconstituted) 124,676 114,543 239,219
Hala (Reconstituted) 83,940 78,041 161,981
Saeedabad (Newly Created) 58,901 55,297 114,198
BADIN (Reconstituted) 580,576 523,281 1,103,857
Talhar 54,991 50,496 105,487
Matli 147,060 136,213 283,273
Golarchi (Reconstituted) 97,155 85,536 182,691
Tando Bago (Reconstituted) 128,251 114,896 243,147
Badin (Reconstituted) 153,119 136,140 289,259
THATTA 589,341 523,853 1,113,194
Thatta 134,200 119,548 253,748
Mirpur Sakro 105,345 93,507 198,852
Keti Bunder 13,553 12,147 25,700
Ghorabari 55,527 49,955 105,482
Mirpur Bathoro 80,753 71,162 151,915
Sujawal 67,298 60,001 127,299
Jati 65,479 58,478 123,957
Shah Bunder 53,392 47,183 100,575
Kharo Chhan 13,794 11,872 25,666
Contd.
2.07 POPULATION BY DISTRICT AND TALUKA IN SINDH, 1998 CENSUS (ADJUSTED POPULATION OF NEWLY CREATED DISTRICTS AFTER 1998 CENSUS)
44
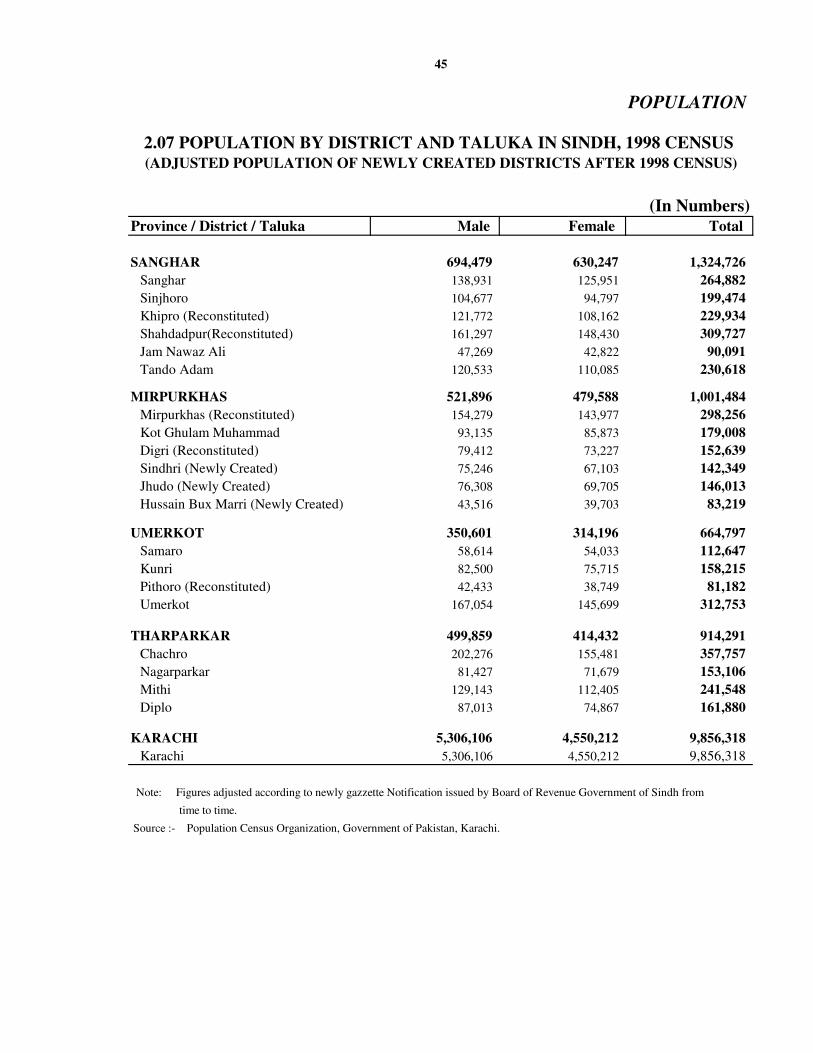
POPULATION
(In Numbers)
Province / District / Taluka Male Female Total
SANGHAR 694,479 630,247 1,324,726
Sanghar 138,931 125,951 264,882
Sinjhoro 104,677 94,797 199,474
Khipro (Reconstituted) 121,772 108,162 229,934
Shahdadpur(Reconstituted) 161,297 148,430 309,727
Jam Nawaz Ali 47,269 42,822 90,091
Tando Adam 120,533 110,085 230,618
MIRPURKHAS 521,896 479,588 1,001,484
Mirpurkhas (Reconstituted) 154,279 143,977 298,256
Kot Ghulam Muhammad 93,135 85,873 179,008
Digri (Reconstituted) 79,412 73,227 152,639
Sindhri (Newly Created) 75,246 67,103 142,349
Jhudo (Newly Created) 76,308 69,705 146,013
Hussain Bux Marri (Newly Created) 43,516 39,703 83,219
UMERKOT 350,601 314,196 664,797
Samaro 58,614 54,033 112,647
Kunri 82,500 75,715 158,215
Pithoro (Reconstituted) 42,433 38,749 81,182
Umerkot 167,054 145,699 312,753
THARPARKAR 499,859 414,432 914,291
Chachro 202,276 155,481 357,757
Nagarparkar 81,427 71,679 153,106
Mithi 129,143 112,405 241,548
Diplo 87,013 74,867 161,880
KARACHI 5,306,106 4,550,212 9,856,318
Karachi 5,306,106 4,550,212 9,856,318
Note: Figures adjusted according to newly gazzette Notification issued by Board of Revenue Government of Sindh from
time to time.
Source :- Population Census Organization, Government of Pakistan, Karachi.
2.07 POPULATION BY DISTRICT AND TALUKA IN SINDH, 1998 CENSUS
(ADJUSTED POPULATION OF NEWLY CREATED DISTRICTS AFTER 1998 CENSUS)
45

Male Female Male Female Male Female
All Ages 16,097,591 14,342,302 8,193,128 7,406,903 7,904,463 6,935,399
0 - 4 2,331,091 2,233,525 1,349,216 1,293,644 981,875 939,881
5 - 9 2,494,529 2,226,065 1,446,558 1,247,389 1,047,971 978,676
10 - 14 2,035,091 1,695,931 1,051,920 802,357 983,171 893,574
15 - 19 1,654,532 1,540,915 768,893 727,059 885,639 813,856
20 - 24 1,490,239 1,429,986 689,406 732,583 800,833 697,403
25 - 29 1,310,610 1,139,271 624,374 581,926 686,236 557,345
30 - 34 1,079,972 883,416 494,647 424,850 585,325 458,566
35 - 39 803,179 683,119 356,621 321,190 446,558 361,929
40 - 44 729,619 673,983 329,861 335,068 399,758 338,915
45 - 49 584,578 497,910 278,057 251,307 306,521 246,603
50 - 54 504,590 423,719 247,362 211,537 257,228 212,182
55 - 59 327,071 264,355 155,142 129,007 171,929 135,348
60 - 64 301,600 258,295 159,599 135,375 142,001 122,920
65 - 69 166,388 137,966 80,750 68,954 85,638 69,012
70 - 74 143,391 123,136 79,163 69,361 64,228 53,775
75 and Above 141,111 130,710 81,559 75,296 59,552 55,414
Source: Provincial Census Report of Sindh, 1998.
2.08 POPULATION BY AGE GROUP, SEX AND RURAL / URBAN
IN SINDH, 1998
46
Age in YearsTotal Rural Urban
POPULATION

POPULATION
Population Census1998 (In Numbers) 2011 2012
SINDH 30,439,893 43,586,662 44,807,089
Jacobabad 741,910 964,644 984,323
Kashmore @Kandhkot 683,662 930,552 952,886
Shikarpur 887,338 1,195,573 1,223,340
Larkana 1,002,772 1,498,839 1,545,902
Kamber Shahdadkot 924,294 1,381,538 1,424,918
Sukkur 901,473 1,303,933 1,341,486
Ghotki 970,549 1,472,770 1,520,783
Khairpur 1,546,587 2,189,474 2,248,809
Naushero Feroze 1,087,571 1,338,540 1,360,091
S.B.Abad 1,102,584 1,549,095 1,590,146
Dadu 1,106,717 1,554,902 1,596,107
Jamshoro 582,094 817,823 839,496
Hyderabad 1,498,865 2,004,185 2,049,479
Tando Allah Yar 468,373 626,278 640,432
Tando Mohammad Khan 441,039 589,729 603,057
Matiari 515,398 689,157 704,732
Badin 1,103,857 1,476,006 1,509,364
Thatta 1,113,194 1,488,491 1,522,131
Sanghar 1,324,726 1,882,523 1,934,104
Mirpurkhas 1,001,484 1,412,408 1,450,261
Umerkot 664,797 1,011,347 1,044,519
Tharparkar 914,291 1,364,865 1,407,585
Karachi 9,856,318 15,656,515 16,459,141
Contd.
all the districts projected using their growth rates .
2). Projected population of Sindh province may not match to projected total of all the districts as their groth rates are rounded
and each district has its own growth rate.
47
2.09 PROJECTED POPULATION BY DISTRICT OF SINDH2011 TO 2014
Province/DistrictProjected
Note:- 1) Population uptill 2013, of Sindh Province is projected on the basis of growth rate of 1998 Census i.e.(2.80)while populatin for
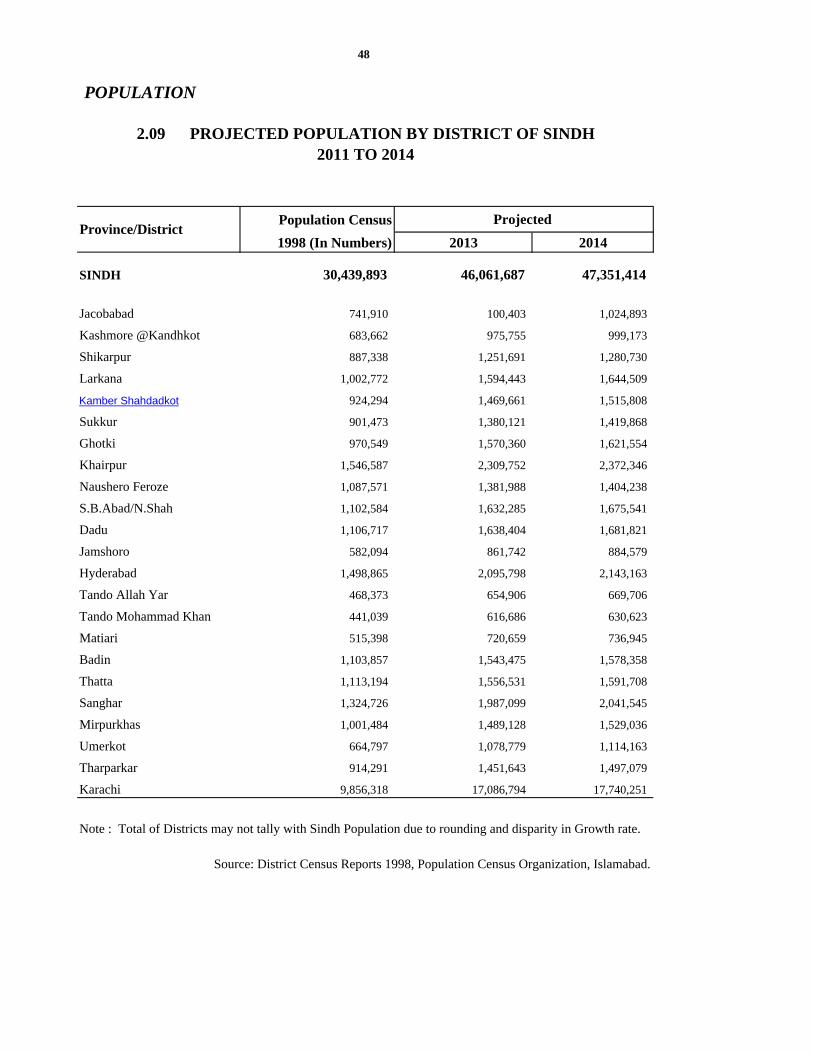
Population Census
1998 (In Numbers) 2013 2014
SINDH 30,439,893 46,061,687 47,351,414
Jacobabad 741,910 100,403 1,024,893
Kashmore @Kandhkot 683,662 975,755 999,173
Shikarpur 887,338 1,251,691 1,280,730
Larkana 1,002,772 1,594,443 1,644,509
Kamber Shahdadkot 924,294 1,469,661 1,515,808
Sukkur 901,473 1,380,121 1,419,868
Ghotki 970,549 1,570,360 1,621,554
Khairpur 1,546,587 2,309,752 2,372,346
Naushero Feroze 1,087,571 1,381,988 1,404,238
S.B.Abad/N.Shah 1,102,584 1,632,285 1,675,541
Dadu 1,106,717 1,638,404 1,681,821
Jamshoro 582,094 861,742 884,579
Hyderabad 1,498,865 2,095,798 2,143,163
Tando Allah Yar 468,373 654,906 669,706
Tando Mohammad Khan 441,039 616,686 630,623
Matiari 515,398 720,659 736,945
Badin 1,103,857 1,543,475 1,578,358
Thatta 1,113,194 1,556,531 1,591,708
Sanghar 1,324,726 1,987,099 2,041,545
Mirpurkhas 1,001,484 1,489,128 1,529,036
Umerkot 664,797 1,078,779 1,114,163
Tharparkar 914,291 1,451,643 1,497,079
Karachi 9,856,318 17,086,794 17,740,251
Projected
2011 TO 20142.09 PROJECTED POPULATION BY DISTRICT OF SINDH
Note : Total of Districts may not tally with Sindh Population due to rounding and disparity in Growth rate.
Source: District Census Reports 1998, Population Census Organization, Islamabad.
48
POPULATION
Province/District

Sindh23%
Punjab56%
Population by Province/Regions of Pakistan 1998
Khyber Pukhtoonkhwa
13%
Balochistan5%
F.A.TA.2%
Islamabad1%
Sindh Punjab
N.W.F.P Balochistan
F.A.TA. Islamabad
3.00 NATIONAL ACCOUNTS

( Million Rupees)
SECTOR 2009-10 2010-11 2011-12 2012-13 2013-14
AGRICULTURE 3,461,268 4,592,720 4,753,075 5,334,976 5,976,217
Crops 1,604,816 2,309,517 1,966,610 2,192,554 2,612,933
Livestock 1,717,446 2,131,579 2,610,408 2,933,384 3,129,682
Forestry 72,423 89,390 113,103 136,500 153,722
Fishing 66,583 62,234 62,954 72,538 79,880
INDUSTRIES 2,931,695 3,746,997 4,269,666 4,519,033 5,040,094
Mining and Quarrying 475,366 494,739 642,205 696,976 741,022
MANUFACTURING 1,943,839 2,527,651 2,809,684 3,030,650 3,408,468
Large scale 1,644,117 2,144,831 2,362,410 2,512,376 2,824,463
Small scale 167,383 208,611 241,951 283,107 327,030
Slaughtering 132,339 174,209 205,323 235,167 256,975
Electricity & Gas Distribution 209,936 406,156 439,637 368,040 406,192
Construction 302,554 318,451 378,140 423,367 484,412
SERVICES 7,855,579 9,307,836 10,338,770 11,642,671 13,012,586
Wholesale & Retail Trade 2,824,137 3,568,178 4,006,835 4,369,465 4,924,462
Transport, Storage & Communication 1,834,476 1,923,433 1,905,704 2,311,796 2,474,818
Finance and Insurance 474,733 536,345 570,503 522,327 584,074
Ownership of Dwellings 789,220 886,370 984,148 1,092,749 1,229,110
General Government Services 778,002 1,009,433 1,244,687 1,486,115 1,660,434
Other Private Services 1,155,011 1,384,077 1,626,893 1,860,219 2,139,688
Gross Domestic Product (FC) 14,248,547 17,647,553 19,361,511 21,503,341 24,028,897
Taxes 870,853 1,046,915 1,221,540 1,275,990 1,480,099
Subsidies 252,404 418,028 536,551 393,674 340,191
Gross Domestic Product (MP) 15,433,243 19,096,665 21,082,207 23,547,264 26,597,032
Net Factor Income from Abroad 566,247 820,225 1,035,707 1,161,607 1,428,227
Gross National Income 15,433,243 19,096,665 21,082,207 23,540,603 26,597,032
Population (In Million Numbers) 171.73 175.31 178.91 182.53 186.19
Per Capita Income 89,869 108,934 117,837 129,005 142,849
FC = Factor Cost. MP=Market Price F = Final.
53
Source:- Pakistan Statistical year book 2014, Pakistan Bureau of Statistics, Statistics Division, Government of Pakistan.
NATIONAL ACCOUNTS
3.01 GROSS DOMESTIC PRODUCT AT CURRENT FACTOR COST, 2009-10 TO 2013-2014
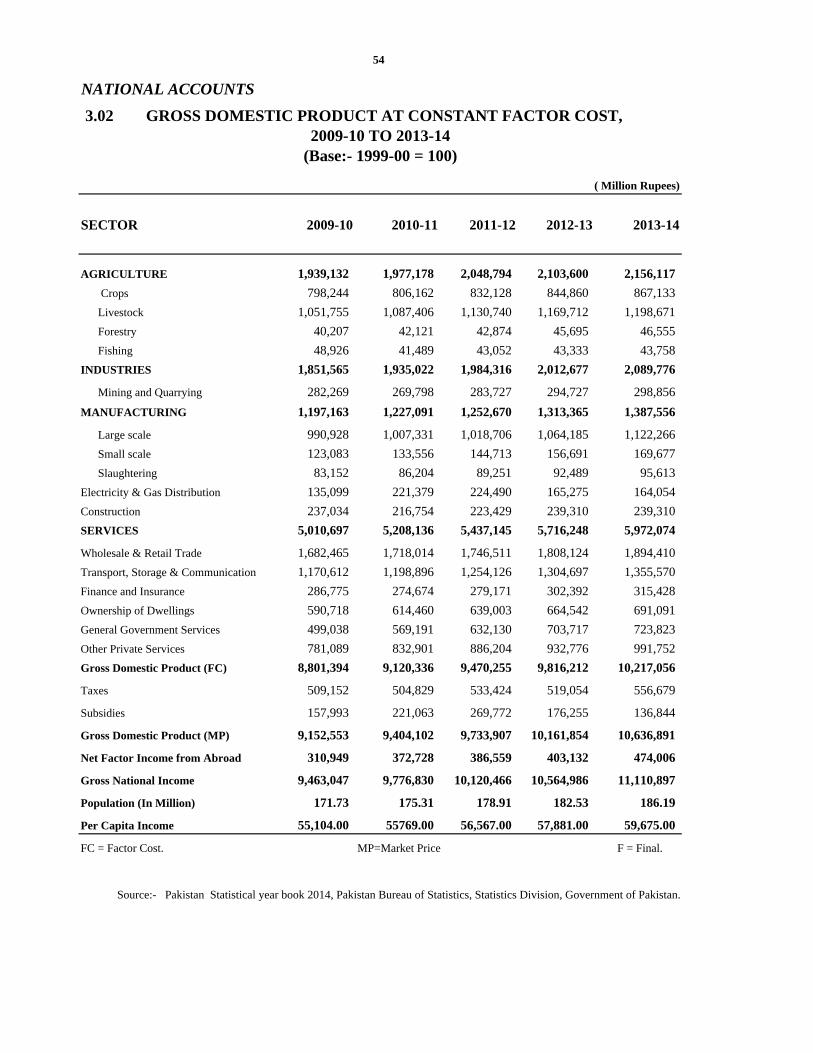
( Million Rupees)
SECTOR 2009-10 2010-11 2011-12 2012-13 2013-14
AGRICULTURE 1,939,132 1,977,178 2,048,794 2,103,600 2,156,117
Crops 798,244 806,162 832,128 844,860 867,133
Livestock 1,051,755 1,087,406 1,130,740 1,169,712 1,198,671
Forestry 40,207 42,121 42,874 45,695 46,555
Fishing 48,926 41,489 43,052 43,333 43,758
INDUSTRIES 1,851,565 1,935,022 1,984,316 2,012,677 2,089,776
Mining and Quarrying 282,269 269,798 283,727 294,727 298,856
MANUFACTURING 1,197,163 1,227,091 1,252,670 1,313,365 1,387,556
Large scale 990,928 1,007,331 1,018,706 1,064,185 1,122,266
Small scale 123,083 133,556 144,713 156,691 169,677
Slaughtering 83,152 86,204 89,251 92,489 95,613
Electricity & Gas Distribution 135,099 221,379 224,490 165,275 164,054
Construction 237,034 216,754 223,429 239,310 239,310
SERVICES 5,010,697 5,208,136 5,437,145 5,716,248 5,972,074
Wholesale & Retail Trade 1,682,465 1,718,014 1,746,511 1,808,124 1,894,410
Transport, Storage & Communication 1,170,612 1,198,896 1,254,126 1,304,697 1,355,570
Finance and Insurance 286,775 274,674 279,171 302,392 315,428
Ownership of Dwellings 590,718 614,460 639,003 664,542 691,091
General Government Services 499,038 569,191 632,130 703,717 723,823
Other Private Services 781,089 832,901 886,204 932,776 991,752
Gross Domestic Product (FC) 8,801,394 9,120,336 9,470,255 9,816,212 10,217,056
Taxes 509,152 504,829 533,424 519,054 556,679
Subsidies 157,993 221,063 269,772 176,255 136,844
Gross Domestic Product (MP) 9,152,553 9,404,102 9,733,907 10,161,854 10,636,891
Net Factor Income from Abroad 310,949 372,728 386,559 403,132 474,006
Gross National Income 9,463,047 9,776,830 10,120,466 10,564,986 11,110,897
Population (In Million) 171.73 175.31 178.91 182.53 186.19
Per Capita Income 55,104.00 55769.00 56,567.00 57,881.00 59,675.00
FC = Factor Cost. MP=Market Price F = Final.
54
Source:- Pakistan Statistical year book 2014, Pakistan Bureau of Statistics, Statistics Division, Government of Pakistan.
NATIONAL ACCOUNTS
3.02 GROSS DOMESTIC PRODUCT AT CONSTANT FACTOR COST, 2009-10 TO 2013-14
(Base:- 1999-00 = 100)
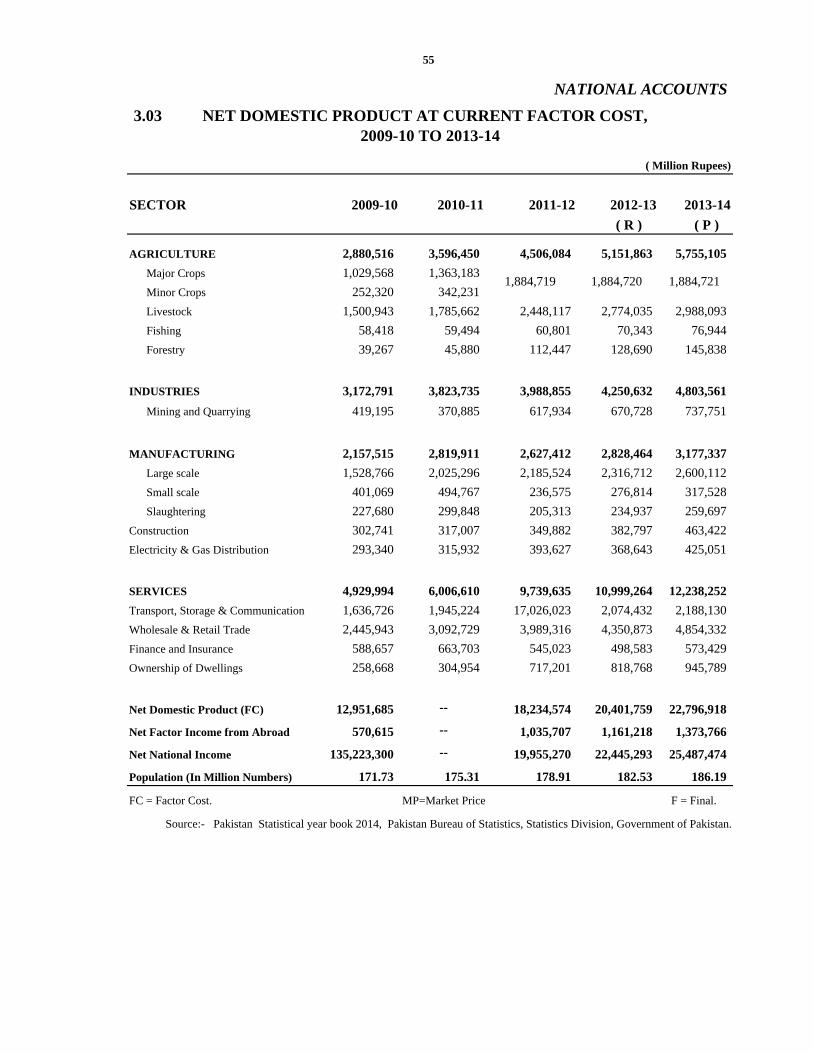
3.03 NET DOMESTIC PRODUCT AT CURRENT FACTOR COST,
SECTOR 2009-10 2010-11 2011-12 2012-13 2013-14
( R ) ( P )
AGRICULTURE 2,880,516 3,596,450 4,506,084 5,151,863 5,755,105
Major Crops 1,029,568 1,363,183
Minor Crops 252,320 342,231
Livestock 1,500,943 1,785,662 2,448,117 2,774,035 2,988,093
Fishing 58,418 59,494 60,801 70,343 76,944
Forestry 39,267 45,880 112,447 128,690 145,838
INDUSTRIES 3,172,791 3,823,735 3,988,855 4,250,632 4,803,561
Mining and Quarrying 419,195 370,885 617,934 670,728 737,751
MANUFACTURING 2,157,515 2,819,911 2,627,412 2,828,464 3,177,337
Large scale 1,528,766 2,025,296 2,185,524 2,316,712 2,600,112
Small scale 401,069 494,767 236,575 276,814 317,528
Slaughtering 227,680 299,848 205,313 234,937 259,697
Construction 302,741 317,007 349,882 382,797 463,422
Electricity & Gas Distribution 293,340 315,932 393,627 368,643 425,051
SERVICES 4,929,994 6,006,610 9,739,635 10,999,264 12,238,252
Transport, Storage & Communication 1,636,726 1,945,224 17,026,023 2,074,432 2,188,130
Wholesale & Retail Trade 2,445,943 3,092,729 3,989,316 4,350,873 4,854,332
Finance and Insurance 588,657 663,703 545,023 498,583 573,429
Ownership of Dwellings 258,668 304,954 717,201 818,768 945,789
Net Domestic Product (FC) 12,951,685 -- 18,234,574 20,401,759 22,796,918
Net Factor Income from Abroad 570,615 -- 1,035,707 1,161,218 1,373,766
Net National Income 135,223,300 -- 19,955,270 22,445,293 25,487,474
Population (In Million Numbers) 171.73 175.31 178.91 182.53 186.19
FC = Factor Cost. F = Final.
55
NATIONAL ACCOUNTS
2009-10 TO 2013-14
( Million Rupees)
MP=Market Price
Source:- Pakistan Statistical year book 2014, Pakistan Bureau of Statistics, Statistics Division, Government of Pakistan.
1,884,719 1,884,720 1,884,721

( Million Rupees)
SECTOR 2009-10 2010-11 2011-12 2012-13 2013-14
( R ) ( P )
AGRICULTURE 1,168,706 1,197,897 1,906,680 1,944,393 2,156,117
Major Crops 378,717 377,702
Minor Crops 121,854 125,201
Livestock 632,960 659,379 1,061,691 1,098,699 1,198,671
Fishing 20,981 21,459 40,991 41,269 46,555
Forestry 14,194 14,156 42,231 42,657 43,758
INDUSTRIES 1,312,743 1,323,596 1,756,530 1,778,977 2,198,027
Mining and Quarrying 130,690 128,508 263,464 273,971 313,707
MANUFACTURING 937,297 970,924 1,109,489 1,162,684 1,441,461
Large scale 598,694 609,634 879,620 917,980 1,159,052
Small scale 259,955 279,197 140,626 152,252 183,607
Slaughtering 78,648 82,093 89,243 92,452 98,802
Construction 124,146 114,810 197,532 193,942 186,174
Electricity & Gas Distribution 120,610 109,354 186,045 148,380 256,685
SERVICES 1,747,056 1,787,706 3,467,180 3,608,779 4,256,501
Transport, Storage & Communication 438,007 447,315 1,083,719 1,118,543 1,355,570
Wholesale & Retail Trade 949,784 983,332 1,732,203 1,790,633 1,894,410
Finance and Insurance 265,185 262,447 268,044 292,728 315,428
Ownership of Dwellings 94,080 94,612 383,214 406,875 691,093
Net Domestic Product (FC) 5,220,331 - 8,590,121 8,925,359 10,217,056
Net Factor Income from Abroad 193,711 - 386,559 402,084 474,006
Net National Income 5,414,042 - 9,240,332 9,670,242 11,110,897
Population (In Million) 171.73 175.31 178.91 182.53 186.19
FC = Factor Cost. MP=Market Price F = Final.
56
Source:- Pakistan Statistical year book 2014, Pakistan Bureau of Statistics, Statistics Division, Government of Pakistan.
NATIONAL ACCOUNTS
3.04 NET DOMESTIC PRODUCT AT CONSTANT FACTOR COST, 2009-10 TO 2013-14
761,767 761,768 867,133

4.00 AGRICULTURE
59
EXPLANATORY NOTE
AGRICULTURE This sector includes information on the following:
i) Land utilization.
ii) Agricultural inputs: canal withdrawals, sale of fertilizer, distribution of seeds
and Consumption ofpesticides.
iii) Tube wells, bulldozers, plant protection and private & government farms.
iv) Cropped area, un-irrigated and irrigated, by different modes of irrigation, total
area sown under various crops.
v) Area, production and yield per hectare of major crops, area & production of minor crops,
fruits, vegetables, condiments and pulses.
vi) Commanded& irrigated area by barrages.
Sources of collection of above data have been indicated in the bottom of the each table.
The method of collection and compilation of land utilization, crop acreage , area
& production of crops data are explained below.
1.LAND UTILIZATION
Land utilization statistics are compiled by the statistical wing of Directorate of
Agriculture Extension, Hyderabad, Agriculture Department, Government of Sindh on the
basis of district wise information supplied by Board of Revenue, Sindh.

60
Definitions of important terms used in the land utilization statistics are given below.
i) Total area reported: The total physical area of the village, deh or district etc. It
includes cultivated area (net area sown + current fallow), culturable waste,
unculturable land and forest area.
ii) Forestarea: The area of any land classed or administered as forest under any legal
enactment dealing with forests. Any cultivated area which may exist within such
forest should be excluded and shown under the heading cultivated area.
iii) Total cropped area : The sum of total area sown during Kharif and Rabi seasons
during a given year including ZaidKarif and Zaid Rabi.
iv) Not available for cultivation : The land absolutely barren, roads, canals, tanks, beds of
rivers, torrents and ravines, sites of villages, houses hills, mountains. Sand dunes and
all land devoted to uses alien to agriculture.
v) Culturablewaste: All cultivable land not actually cultivated. It should include all
grazing and other land not included under forest.
vi) Cultivated area: The land currently being used for agricultural purposes, included
land under crops, orchards as well as current fallow. It is the area net sown plus
current fallow.
vii) Current fallow: The part of the cultivated area which has not been used for cropping
during the year under reference but for which the total vacant period does not exceed
three crop seasons. The land remaining vacant for more than three successive seasons
should be shown under the head "cultivable waste".
viii) Net area sown: The area which has been sown at least once in a year. It will include
area under crops, fruit, vegetable etc.
ix) Area sown more than once: The difference between the total cropped area and net
sown.

61 2.CROP ACREAGE
Census of crop acreage is conducted by the field staff of Bureau of Statistics through
Revenue tapedars, in all about 6,000 dehs for Kharif and Rabi Seasons. The deh-wise
crop acreage returns (specific proforma) filled inbythePatwaries/Tapedars are collected
by the field staff of Bureau of Statistics. These returns are checked, edited, coded
and processed on computer and finally acreage statistics are disseminated for the
users.
3.AREA & PRODUCTION ESTIMATES OF MAJOR & MINOR CROPS
i)Area
Final estimates of area sown under wheat, cotton and rice crops are prepared through
sample surveys undertaken by statistical wing of Directorate of Agriculture Extension,
Hyderabad. For sugarcane farmer’s opinion survey is conducted by the extension staff of
Agriculture Department. The acreage data of other crops is collected from Board of Revenue
by extension staff of Agriculture Department. These estimates are examined by the
sub-committee comprising representatives of the Board of Revenue, Agriculture, Irrigation &
Bureau of Statistics. Finally, these estimates are discussed and approved by Agricultural
Statistical Co-ordination board headedby the Additional Chief Secretary (Dev.).
ii)Production
Final production estimates of wheat, cotton and rice are prepared through crop cutting
surveys undertaken by the extension staff of the Agriculture Department. Production of
remaining crops are based on subjective judgment of the staff of extension wing of Agriculture
Department. Consolidated major & minor crops estimates are checked/examined by the
sub-committee comprising the representatives of Agriculture, Board of Revenue, Irrigation &
Bureau of Statistics. Thereafter these estimates are discussed and cleared in the meeting of
Sindh Agricultural Statistics Co-ordination Board alongwith other information available on
fertilizer, pesticides, rainfall, water availability and agriculture credit.

62
QUANTUM INDEX OF AGRICULTURE PRODUCTION The quantum index number measures the tendency of crops in different period to
facilitate the comparison in different times.
The quantum index number of major crops is based on laspyre's formula which is.
100
Where;
I = Index of Industrial Production Qn = Current Year Quantity (Production) Po = Base Year Price. Qo = Base Year Quantity.
The data of crop production is collected from Provincial Agriculture Department, Government of Sindh.

(In "000" Hectares)
Barrages 2004-05 2005-06 2006-07 2007-08 2008-09
SINDH
Commanded Area 3,646 3,646 3,646 3,646 3,646
Irrigated Area 2,597 2,596 2,542 2,547 2,530
SUKKUR BARRAGE
Commanded Area 2,205 2,205 2,205 2,205 2,205
Irrigated Area 1768 1,771 1,758 1,760 1,766
GUDDU BARRAGE
Commanded Area 808 808 808 808 808
Irrigated Area 663 653 616 614 601
KOTRI BARRAGE
Commanded Area 633 633 633 633 633
Irrigated Area 166 172 168 173 163
Source:- Chief Engineer Sukkur, Guddu and Kotri Barrages.
63
4.01 COMMANDED AND IRRIGATED AREA BY BARRAGESIN SINDH, 2004-05 TO 2008-09
IRRIGATION

(In Million Acre Feet)
Kharif Rabi Total Kharif Rabi Total Kharif Rabi
2012 2012-13 2013 2013-14 2014 2014-15
SINDH TOTAL 25.4 13.5 38.8 28.9 13.3 42.2 30.8 14.2 45.1
GUDDU BARRAGE 4.9 1.1 6.0 5.1 1.6 6.7 5.9 1.4 7.3
Ghotki Feeder 1.805 0.998 2.803 2.211 1.182 3.393 2.454 1.040 3.494
Begari Feeder 2.221 0.052 2.273 2.031 0.224 2.255 2.538 0.192 2.730
Desert Pat Feeder 0.859 0.074 0.933 0.859 0.216 1.075 0.860 0.168 1.028
SUKKUR BARRAGE 13.6 8.7 22.4 15.5 8.8 24.3 16.0 8.9 24.9
Nara Canal 4.196 3.405 7.601 4.672 3.345 8.017 4.987 3.612 8.599
Rohri Canal 4.112 3.295 7.407 4.729 3.272 8.001 5.087 3.210 8.297
Khairpur West 0.447 0.291 0.738 0.477 0.329 0.806 0.510 0.286 0.796
Khairpur East 0.585 0.440 1.025 0.657 0.482 1.139 0.733 0.420 1.153
Dadu Canal 0.819 0.564 1.383 0.910 0.600 1.510 0.912 0.600 1.512
Rice Canal 2.390 0.297 2.687 2.798 0.253 3.051 2.742 0.285 3.027
North West Canal 1.099 0.433 1.532 1.212 0.530 1.742 1.007 0.487 1.494
KOTRI BARRAGE 6.8 3.6 10.5 8.4 2.8 11.2 9.0 3.9 12.9
K.B. Feeder 1.600 1.316 2.916 1.782 1.082 2.864 1.985 1.425 3.410
Fuleli Canal 2.859 1.101 3.960 3.708 0.709 4.417 4.005 1.205 5.210
Pinyari Canal 1.748 0.652 2.400 2.095 0.528 2.623 2.282 0.747 3.029
Akram Wah 0.641 0.544 1.185 0.777 0.520 1.297 0.734 0.562 1.296
(Lined Canal)
64
4.02 CANAL WITHDRAWLS (RABI AND KHARIF) IN SINDH,
Barrage/CanalTotal
2014-15
2012-13 TO 2014-15
IRRIGATION
2012-13 2013-14
Source:- Irrigation and Power Department, Government of Sindh, Karachi.

TUBE WELL
(In Numbers)
Electric Diesel Total Electric Diesel Total Electric Diesel Total
2008-09 .. .. .. 14 164 178 14 164 178
2009-10 2 3 5 4 149 153 6 152 158
2010-11 20 16 36 23 303 326 43 319 362
2011-12 11 7 18 12 290 302 23 297 320
2012-13 8 7 15 11 220 231 19 227 246
2013-14 1 4 5 24 328 352 25 332 357
Source:- Director General of Agriculture Extension Sindh, Hyderabad.
4.04 NUMBER OF TUBE WELLS INSTALLED BY DISTRICT
(In Numbers)
Electric Diesel Total Electric Diesel Total Electric Diesel Total
SINDH 11 7 18 12 290 302 23 297 320Khairpur .. .. .. .. 9 9 .. 9 9Jacobabad .. .. .. .. 67 67 .. 67 67Kashmore .. .. .. .. 41 41 .. 41 41Sukkur .. .. .. .. 18 18 .. 18 18Ghotki .. .. .. .. 11 11 .. 11 11Shikarpur .. .. .. .. 9 9 .. 9 9S.B. Abad .. .. .. .. .. .. .. .. ..Naushero Feroze .. .. .. 27 27 27 27Larkana .. .. .. .. 37 37 .. 37 37Kamber Shahdadkot .. .. .. .. 28 28 .. 28 28Sanghar .. .. .. .. .. .. .. .. ..Tharparkar .. .. .. .. .. .. .. .. ..Mirpurkhas .. .. .. .. .. .. .. .. ..Umerkot .. .. .. .. .. .. .. .. ..Dadu .. .. .. .. 34 34 .. 34 34Jamshoro .. .. .. 12 9 21 12 9 21Hyderabad 11 7 18 .. .. .. 11 7 18Matiari .. .. .. .. .. .. .. .. ..Badin .. .. .. .. .. .. .. .. ..Thatta .. .. .. .. .. .. .. .. ..Tando Allah Yar .. .. .. .. .. .. .. .. ..T. Mohd Khan .. .. .. .. .. .. .. .. ..Karachi .. .. .. .. .. .. .. .. ..
Cont.
2011-12
2008-09 TO 2013-14
PUBLIC PRIVATE TOTALProvince / District
IN SINDH, 2011-12 TO 2013-14
65
YEARPRIVATEPUBLIC TOTAL
4.03 NUMBER OF TUBEWELLS INSTALLED IN SINDH,

(In Numbers) PUBLIC PRIVATE TOTALElectric Diesel Total Electric Diesel Total Electric Diesel Total
SINDH 8 7 15 11 220 231 19 227 246Khairpur .. .. .. .. 8 8 .. 8 8Jacobabad .. .. .. .. 45 45 .. 45 45Kashmore .. .. .. .. 60 60 .. 60 60Sukkur .. .. .. .. 2 2 .. 2 2Ghotki .. .. .. .. .. .. .. .. ..Shikarpur .. .. .. 7 .. 7 7 .. 7S.B. Abad .. .. .. .. .. .. .. .. ..Naushero Feroze .. .. .. .. 20 20 .. 20 20Larkana .. .. .. .. 30 30 .. 30 30Kamber Shahdadkot .. .. .. .. 28 28 .. 28 28Sanghar .. .. .. .. .. .. .. .. ..Tharparkar .. .. .. .. .. .. .. .. ..Mirpurkhas .. .. .. .. .. .. .. .. ..Umerkot .. .. .. .. .. .. .. .. ..Dadu .. .. .. .. 24 24 .. 24 24Jamshoro .. .. .. 3 3 6 3 3 6Hyderabad 8 7 15 .. .. .. 8 7 15Matiari .. .. .. .. .. .. .. .. ..Badin .. .. .. .. .. .. .. .. ..Thatta .. .. .. .. .. .. .. .. ..Tando Allah Yar .. .. .. .. .. .. .. .. ..T. Mohd Khan .. .. .. .. .. .. .. .. ..Karachi .. .. .. 1 .. 1 1 .. 1
SINDH 1 4 5 24 328 352 25 332 357Khairpur .. .. .. .. 6 6 -- 6 6Jacobabad .. .. .. .. 98 98 -- 98 98Kashmore .. .. .. .. 98 98 -- 98 98Sukkur .. .. .. .. -- -- -- -- --Ghotki .. .. .. .. .. .. .. .. ..Shikarpur .. .. .. 7 4 11 7 4 11S.B. Abad .. .. .. .. .. .. .. .. ..Naushero Feroze .. .. .. .. -- -- -- -- --Larkana .. .. .. .. 44 44 -- 44 44Kamber Shahdadkot .. .. .. .. 38 38 -- 38 38Sanghar .. .. .. .. .. .. .. .. ..Tharparkar .. .. .. .. .. .. .. .. ..Mirpurkhas .. .. .. .. .. .. .. .. ..Umerkot .. .. .. .. .. .. .. .. ..Dadu .. .. .. 3 37 40 3 37 40Jamshoro .. .. .. 6 -- 6 6 -- 6Hyderabad 1 4 5 .. .. .. 1 4 5Matiari .. .. .. 2 1 3 2 1 3Badin .. .. .. .. .. .. .. .. ..Thatta .. .. .. .. .. .. .. .. ..Tando Allah Yar .. .. .. 3 2 5 3 2 5T. Mohd Khan .. .. .. 1 .. 1 1 -- 1Karachi .. .. .. 2 .. 2 2 -- 2
2013-14
Source:- Directorate General of Agriculture Extension Sindh, Hyderabad.
66
TUBE WELL
4.04 NUMBER OF TUBE WELLS INSTALLED BY DISTRICT IN SINDH, 2012-13 TO 2013-14
Province /District
2012-13

IRRIGATION
(In Hectare Metres) KHARIF & RABI
Fresh Saline Total Fresh Saline Total TOTAL
INSTALLED PUMPAGE (FRESH AND SALINE)
2002-03 38,487 41,616 80,103 38,067 41,161 79,228 159,331
2003-04 38,487 41,616 80,103 38,067 41,161 79,228 159,331
2004-05 38,487 41,616 80,103 38,067 41,161 79,228 159,331
2005-06 38,487 41,616 80,103 38,067 41,161 79,228 159,331
2006-07 38,487 41,616 80,103 38,067 41,161 79,228 159,331
2007-08 38,487 41,616 80,103 38,067 41,161 79,228 159,331
2008-09 38,487 41,616 80,103 38,067 41,161 79,228 159,331
2009-10 38,487 41,616 80,103 38,067 41,161 79,228 159,331
2010-11 38,487 41,616 80,103 38,067 41,161 79,228 159,331
2011-12 38,487 41,616 80,103 38,067 41,161 79,228 159,331
2012-13 38,487 41,616 80,103 38,067 41,161 79,228 159,331
2013-14 38,771 41,616 80,387 38,351 41,161 79,512 159,899
2014-15 38,771 41,616 80,387 38,351 41,161 79,512 159,899
ACTUAL PUMPAGE (FRESH AND SALINE)
2002-03 9,906 9,328 19,234 12,743 8,001 20,744 39,978
2003-04 16,737 8,450 25,187 16,739 8,070 24,809 49,996
2004-05 14,041 7,964 22,005 9,523 6,400 15,923 37,928
2005-06 13,397 7,968 21,365 12,942 8,149 21,091 42,456
2006-07 12,859 7,618 20,477 12,346 6,902 19,248 39,725
2007-08 12,965 7,228 20,193 12,456 7,249 19,705 39,898
2008-09 13,350 7,921 21,271 12,895 8,102 20,997 42,268
2009-10 12,160 7,721 19,881 11,553 7,961 19,514 39,395
2010-11 11,870 7,595 19,465 10,988 7,556 18,544 38,009
2011-12 11,298 7,188 18,486 10,321 7,436 17,757 36,243
2012-13 11,328 7,654 18,982 10,419 7,628 18,047 37,029
2013-14 11,335 7,760 19,095 10,546 7,722 18,241 37,336
2014-15 10,724 7,490 18,214 10,360 7,510 17,870 36,084
Source:- Project Director SCARP, Khairpur.
67
4.05 PUMPAGE CAPACITY AND ACTUAL PUMPAGE (FRESH ANDSALINE) SCARP TUBEWELLS BY SEASON IN KHAIRPUR DISTRICT,
2002-03 TO 2014-15
YEAR KHARIF RABI

(In Numbers)Province/District 2009-10 2010-11 2011-12 2012-13 2013-14
SINDH 132 131 146 162 186Khairpur 10 10 11 13 15Jacobabad .. .. .. .. --Sukkur 6 6 7 8 10Ghotki 6 6 6 7 13Shikarpur 7 7 9 11 11S.B.Abad 8 8 8 9 11Naushero Feroze 6 5 5 5 7Larkana 12 12 14 15 17Sanghar 4 4 5 7 7Tharparkar .. .. .. .. --Mirpurkhas 5 5 6 7 8Dadu 8 8 8 9 10Hyderabad 26 26 28 29 32Badin 13 13 14 16 16Thatta 8 8 9 9 10Kashmore 7 7 9 10 10Jamshoro 6 6 7 7 8Kmaber / Shahdadkot .. .. .. .. --Umerkot .. .. .. .. --Matiari .. .. .. .. --Tando M. Khan .. .. .. .. --Tando Allahyar .. .. .. .. --Karachi .. .. .. .. 1Sujawal .. .. .. .. ..
Source:- Directorate of Agricultural Engineering Sindh, Hyderabad.
(In "N" Tons) TYPE OF FERTILIZER
Y E A R Nitrogenous Phosphatic Potash TOTAL (N) (P) (K)
2002-03 539,489 131,390 3,986 674,865
2003-04 533,098 127,098 4,822 665,018
2004-05 616,952 170,425 6,752 794,129
2005-06 602,879 191,663 5,163 799,705
2006-07 559,594 215,733 8,053 783,380
2007-08 624,707 151,848 3,721 780,276
2008-09 676,609 149,977 5,367 831,953
2009-10 641,933 183,046 4,142 829,121
2010-11 593,693 162,251 5,369 761,313
2011-12 657,438 125,834 2,818 786,090
2012-13 522,756 122,770 3,380 648,906
2013-14 731,157 187,445 4,489 923,091
(ii) Fertilizer Review by NDFC, Govt. of Pakistan, Islamabad.
68
BULLDOZERS4.06 NUMBER OF BULLDOZERS BY DISTRICT IN SINDH,
2009-10 TO 2013-14
4.07 SALE OF FERTILIZER IN SINDH, 2002-03 TO 2013-14
Source:- i) Sindh Agricultural Supplies Organization, Karachi.

FERTILIZER
(In "N" Tons)Nitrogenous Phosphatic Potash TOTAL (N) (P) (K) (N+P+K)
TOTAL 549,035 150,648 5,065 704,748 Khairpur 43,341 12,139 359 55,839 Jacobabad 16,249 2,167 85 18,501 Kashmore@Kandhkot 18,363 3,789 40 22,192 Sukkur 20,527 4,366 159 25,052 Shikarpur 11,468 1,830 29 13,327 S.B.Abad 44,855 12,453 357 57,665 Naushero Feroze 44,978 12,135 398 57,511 Ghotki 59,094 9,421 221 68,736 Larkana 12,723 2,969 34 15,726 Sanghar 65,510 16,119 542 82,171 Umerkot 10,493 2,666 70 13,229 Dadu 22,991 4,163 27 27,181 Hyderabad 16,513 4,328 144 20,985 Mirpurkhas 63,915 15,890 377 80,182 Badin 35,037 7,799 281 43,117 Thatta 12,558 3,576 228 16,362 Tando Allah Yar 23,161 7,773 458 31,392 Karachi 17,323 6,135 48 23,506 New Distributors 9,936 20,930 1,208 32,074
TOTAL 657,438 125,834 2,818 786,090 Khairpur 51,499 9,791 91 61,389 Jacobabad 23,390 3,812 43 27,245 Kashmore@Kandhkot 14,057 3,062 21 17,134 Sukkur 48,178 6,106 92 54,376 Shikarpur 30,772 1,840 15 32,627 S.B.Abad 47,822 10,529 203 58,555 Naushero Feroze 55,028 11,101 321 66,449 Ghotki 72,851 14,126 101 87,079 Larkana 23,711 3,484 31 27,227 Sanghar 55,713 10,450 113 66,276 Umerkot 8,627 1,521 19 10,167 Dadu 22,947 4,555 32 27,534 Hyderabad 27,187 4,431 94 31,712 Mirpurkhas 47,029 9,766 193 5,698 Badin 37,158 5,243 147 42,548 Thatta 12,261 2,694 84 15,039 Tando Allah Yar 11,618 2,759 176 14,553 Karachi 19,719 2,610 86 22,414 Jamshsoro 1,683 281 9 1,972 Kambar Shahdadkot 17,622 3,042 25 20,689 Tharparkar -- -- -- --Matiari 14,379 4,009 110 18,498 T.M.Khan 10,565 1,704 49 12,318 New Distributors 3,629 8,908 764 13,301
Cont..
2011-12
Province/District
69
4.08 SALE OF FERTILIZER (INDIGENOUS AND IMPORTED)
BY DISTRICT IN SINDH, 2010-11 TO 2013-14
2010-11

(In "N" Tons)Nitrogenous Phosphatic Potash TOTAL
(N) (P) (K) (N+P+K)
TOTAL 522,758 122,770 3,381 648,909 Khairpur 25,879 5,783 210 31,872 Jacobabad 13,076 4,811 44 17,931 Kashmore@Kandhkot 12,890 4,057 130 17,077 Sukkur 18,502 3,795 48 22,345 Shikarpur 7,005 1,465 9 8,479 S.B.Abad 44,899 8,281 142 53,322 Naushero Feroze 46,676 8,906 123 55,705 Ghotki 39,722 8,872 128 48,722 Larkana 11,836 3,542 192 15,570 Sanghar 61,695 9,793 136 71,624 Umerkot 12,062 1,062 30 13,154 Dadu 18,845 3,958 52 22,855 Hyderabad 19,679 4,783 115 24,577 Mirpurkhas 51,656 10,509 241 62,406 Badin 37,067 5,873 184 43,124 Thatta 10,433 1,946 34 12,413 Tando Allah Yar 14,091 1,936 180 16,207 Karachi 26,338 8,336 246 34,920 Jamshsoro 4,682 3,840 77 8,599
Kambar Shahdadkot 17077 3924 38 21039Tharparkar - - - - - - - -Matiari 16,459 4,101 180 20,740 T.M.Khan 6,546 976 8 7,530 New Distributors 5,643 12,221 834 18,698
TOTAL 731,157 187,445 4,489 923,091 Khairpur 48,912 8,035 145 57,092 Jacobabad 17,068 2,848 54 19,970 Kashmore@Kandhkot 20,372 4,003 53 24,428 Sukkur 24,434 4,892 79 29,405 Shikarpur 13,277 1,565 7 14,849 S.B.Abad 54,614 9,522 212 64,348 Naushero Feroze 63,718 15,379 262 79,359 Ghotki 74,227 13,359 107 87,693 Larkana 17,915 2,969 63 20,947 Sanghar 73,929 12,276 249 86,454 Umerkot 9,104 2,201 18 11,323 Dadu 29,607 6,315 52 35,974 Hyderabad 27,912 8,398 183 36,493 Mirpurkhas 57,017 13,956 417 71,390 Badin 47,135 6,988 380 54,503 Thatta 11,648 2,363 189 14,200 Tando Allah Yar 16,621 3,252 458 20,331 Karachi 49,906 29,313 118 79,337 Jamshsoro 4,952 885 29 5,866
Kambar Shahdadkot 23034 3630 58 26,722 Tharparkar -- -- -- --Matiari 19,509 4,433 161 24,103 T.M.Khan 12,443 1,115 30 13,588 New Distributors 50,798 37,006 1,678 89,482
2013-14
Source: - National Fertilizer Development Centre, Planning & Development Division, Government of Pakistan, Islamabad.
Province / District
70
4.08 SALE OF FERTILIZER (INDIGENOUS AND IMPORTED) BY DISTRICT IN SINDH, 2010-11 TO 2013-14
FERTILIZER
2012-13

Name of Fertilizer 2009-10 2010-11 2011-12 2012-13 2013-14
UREA K.G. 800 1,035 1,719 1,700 1,827
DAP K.G. 2,267 3,236 4,054 3,902 3,640
NP 23:23 K.G. 1,452 2,108 2,691 2,524 2,513
TSP K.G. 1,659 2,418 3,096 3,091 --
SOP K.G. 2,370 2,807 3,797 3,945 4,233
4.09 PRICE OF VARIOUS TYPE OF FERTILIZER IN SINDH,2009-10 TO 2013-14
FERTILIZER71
Source:- National Fertilizer Development Centre, Planning & Development Division, Government of Pakistan, Islamabad.
Value in Rs. Per 50K.G

Pesticides 2008-09 2009-10 2010-11 2011-12 2012-13
TOTAL 7,816.51 8,090.86 8,673.263 8,452.356 8,544.585
Ch. Hydro Carbons 382.57 387.737 492.526 517.202 522.252
Carbomates 3,310.56 3,410.313 3,514.756 2,714.741 2,823.414
Fungicides ( Spray) 413.41 428.216 530.145 720.217 726.129
Pyrethroids 455.91 437.379 529.457 611.217 619.416
Others 3,254.06 3,427.211 3,606.379 3,888.979 3,853.374
72
PESTICIDES
4.10 QUANTITY OF PESTICIDES SOLD IN SINDH, 2008-09 TO 2012-13
(Qty. in M. Tons.)

(Spray in Hectares)
Wheat Cotton Rice Sugar- Oil- Fruits Vege- Other Total cane seed tables Crops
2001-02 93,788 908,687 16,354 26,143 .. .. .. 59,907 1,104,879
2002-03 97,106 524,492 31,022 22,806 .. .. .. 101,534 776,960
2003-04 103,790 1,289,929 39,237 6,561 .. 125,591 36,463 113,587 1,715,158
2004-05 38,986 1,428,492 35,931 10,940 .. .. .. 170,472 1,684,821
2005-06 42,157 1,602,985 47,532 14,786 .. .. .. 187,425 1,894,885
2006-07 140,114 1,624,655 47,748 17,697 .. .. .. 278,459 2,108,673
2007-08 154,687 1,791,606 93,290 19,165 .. .. .. 243,969 2,302,717
2008-09 233,426 6,738,972 288,366 73,194 .. .. .. 766,277 8,100,235
2009-10 341,725 6,997,104 292,442 88,313 .. .. .. 779,268 8,498,852
2010-11 371,454 5,778,869 365,947 124,316 .. .. .. 857,968 7,498,554
2011-12 442,179 1,756,000 1,022,198 189,698 .. .. .. 913,715 4,323,790
2012-13 447,715 1,586,268 1,175,054 192,289 .. .. .. 927,728 4,329,054
Source:- Directorate of Agriculture Extension Sindh, Hyderabad.
Y E A R
C R O P S
73
4.11 PLANT PROTECTION (CURATIVE MEASURES) BY CROPS IN SINDH, 2001-02 TO 2012-13
PLANT PROTECTION

(Area in "000" Hectares)Geogr- Repor- Total Curr- Net Area Total Forest Cul- Notaphical ted ent Area Sown tur- Availa- TOTALArea Area (5+6) Fallo- Sown More (6+7) able ble for (9+10+11)
(4+12) ws Than Waste Cultiv-Once ation
1 2 3 4 5 6 7 8 9 10 11 12
2001-02 14,091 14,091 5,865 3,429 2,436 726 3,162 835 1,271 6,120 8,226
2002-03 14,091 14,090 5,797 3,526 2,271 794 3,065 835 1,339 6,119 8,293
2003-04 14,091 14,091 5,714 2,951 2,763 877 3,640 835 1,415 6,127 8,377
2004-05 14,091 14,091 5,749 3,298 2,451 843 3,294 835 1,346 6,161 8,342
2005-06 14,091 14,091 5,718 3,075 2,643 873 3,516 835 1,365 6,173 8,373
2006-07 14,091 14,090 5,607 2,863 2,744 984 3,728 1,034 1,485 5,964 8,483
2007-08 14,091 14,091 4,878 2,008 2,870 1,005 3,875 1,034 1,437 6,742 9,213
2008-09 14,091 14,091 4,869 2,062 2,807 1,013 3,820 1,034 1,416 6,772 9,222
2009-10 14,091 14,091 4,894 2,076 2,818 1,016 3,834 1,034 1,375 6,787 9,196
2010-11 14,091 14,090 5,078 2,478 2,599 850 3,449 1,034 1,183 6,795 9,012
2011-12 14,091 14,091 5,029 2,859 2,169 851 3,020 1,034 1,472 6,556 9,062
2012-13 14,091 14,091 5,174 2,799 2,375 843 3,218 1,034 1,595 6,287 8,916
2013-14 14,091 14,091 5,212 2,667 2,545 943 3,488 1,032 1,603 6,244 8,879
Source:- Directorate of Agriculture Extension Sindh, Hyderabad.
74
Y E A R
4.12 LAND UTILIZATION IN SINDH, 2001-02 TO 2013-14
LAND UTILIZATION

(Area in "000" Hectares)
Province / Geograp- Reported Total Current Net
District hical Area 5+6 Fallows Area
Area 4+12 Sown
1 2 3 4 5 6
2011-12
SINDH 14,091 14,091 5,174 2,799 2,375
Khairpur 1,574 1,574 273 103 170
Sukkur 480 480 168 104 63
Naushero Feroze 302 302 210 53 157
S.B.Abad 451 451 390 229 162
Ghotki 629 629 253 120 133
Jacobabad 267 267 69 45 24
Kashmore@Kandhkot 261 261 71 25 46
Shikarpur 284 284 125 60 66
Larkana 201 201 54 9 45
Kamber Shahdadkot 541 541 326 258 67
Sanghar 1,018 1,018 410 185 225
Tharparkar 2,017 2,017 352 184 168
Mirpurkhas 353 353 314 150 164
Umerkot 501 501 334 248 86
Dadu 667 667 314 191 123
Jamshoro 1,235 1,235 97 30 67
Hyderabad 101 101 60 29 31
Matiari 142 142 87 18 69
T.Allahyar 173 173 120 51 69
T.M. Khan 195 195 145 95 50
Badin 612 612 584 374 209
Thatta 1,735 1,735 361 185 176
Karachi 353 353 59 54 5
Contd.
75
4.13 LAND UTILIZATION BY DISTRICT IN SINDH, 2012-13 TO 2013-14
Cultivated Area
LAND UTILIZATION
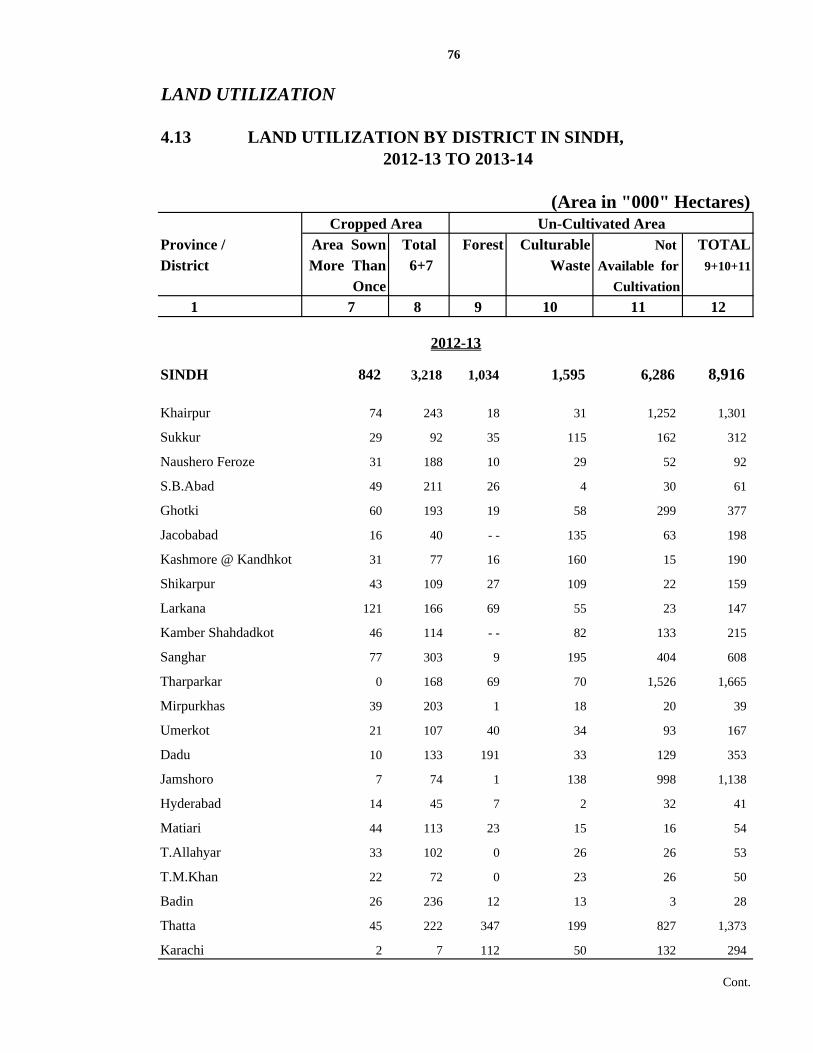
(Area in "000" Hectares)
Province / Area Sown Total Forest Culturable Not TOTALDistrict More Than 6+7 Waste Available for 9+10+11
Once Cultivation
1 7 8 9 10 11 12
SINDH 842 3,218 1,034 1,595 6,286 8,916
Khairpur 74 243 18 31 1,252 1,301
Sukkur 29 92 35 115 162 312
Naushero Feroze 31 188 10 29 52 92
S.B.Abad 49 211 26 4 30 61
Ghotki 60 193 19 58 299 377
Jacobabad 16 40 - - 135 63 198
Kashmore @ Kandhkot 31 77 16 160 15 190
Shikarpur 43 109 27 109 22 159
Larkana 121 166 69 55 23 147
Kamber Shahdadkot 46 114 - - 82 133 215
Sanghar 77 303 9 195 404 608
Tharparkar 0 168 69 70 1,526 1,665
Mirpurkhas 39 203 1 18 20 39
Umerkot 21 107 40 34 93 167
Dadu 10 133 191 33 129 353
Jamshoro 7 74 1 138 998 1,138
Hyderabad 14 45 7 2 32 41
Matiari 44 113 23 15 16 54
T.Allahyar 33 102 0 26 26 53
T.M.Khan 22 72 0 23 26 50
Badin 26 236 12 13 3 28
Thatta 45 222 347 199 827 1,373
Karachi 2 7 112 50 132 294
Cont.
Cropped Area Un-Cultivated Area
76
4.13 LAND UTILIZATION BY DISTRICT IN SINDH, 2012-13 TO 2013-14
LAND UTILIZATION
2012-13

(Area in "000" Hectares)
Province / Geograp- Reported Total Current Net District hical Area 5+6 Fallows Area
Area 4+12 Sown 1 2 3 4 5 6
2013-14
SINDH 14,090 14,090 5,212 2,667 2,545
Khairpur 1,574 1,574 276 113 163
Sukkur 480 480 165 96 69
Naushero Feroze 302 302 210 53 158
S.B.Abad 451 451 390 229 161
Ghotki 629 629 235 64 171
Jacobabad 267 267 114 39 74
Kashmore@Kandhkot 261 261 107 29 78
Shikarpur 284 284 109 19 91
Larkana 201 201 57 13 44
Kamber Shahdadkot 541 541 316 234 82
Sanghar 1,018 1,018 409 180 229
Tharparkar 2,017 2,017 352 217 135
Mirpurkhas 353 353 315 155 160
Umerkot 501 501 333 245 88
Dadu 667 667 313 178 135
Jamshoro 1,235 1,235 97 27 69
Hyderabad 101 101 61 34 27
Matiari 142 142 87 17 70
T.Allahyar 173 173 121 53 68
T.M. Khan 195 195 145 92 52
Badin 612 612 580 335 244
Thatta 1,735 1,735 362 188 174
Karachi 353 352 59 56 4
77
4.13 LAND UTILIZATION BY DISTRICT IN SINDH, 2012-13 TO 2013-14
Cultivated Area
LAND UTILIZATION

(Area in "000" Hectares)
Province / Area Sown Total Forest Culturable Not TOTALDistrict More Than 6+7 Waste Available for 9+10+11
Once Cultivation 1 7 8 9 10 11 12
SINDH 943 3,488 1,032 1,603 6,244 8,879
Khairpur 70 233 18 28 1,252 1,298
Sukkur 31 100 35 118 162 315
Naushero Feroze 31 188 10 29 52 92
S.B.Abad 49 211 25 5 30 61
Ghotki 77 249 19 117 258 394
Jacobabad 50 124 - 91 62 153
Kashmore @ Kandhkot 53 131 16 123 15 154
Shikarpur 59 150 27 125 22 175
Larkana 119 162 69 52 23 144
Kamber Shahdadkot 56 138 - 92 133 225
Sanghar 78 307 9 196 404 609
Tharparkar 0 135 68 71 1,526 1,665
Mirpurkhas 38 198 1 17 20 38
Umerkot 22 110 40 34 93 168
Dadu 11 146 191 35 128 354
Jamshoro 8 77 1 139 998 1,138
Hyderabad 12 40 7 0 32 39
Matiari 44 114 23 16 16 55
T.Allahyar 32 100 0 26 26 52
T.M.Khan 23 75 0 24 26 50
Badin 31 275 12 18 3 33
Thatta 45 219 347 199 827 1,373
Karachi 2 5 112 50 132 294
4.13 LAND UTILIZATION BY DISTRICT IN SINDH,
78
Cropped Area Un-Cultivated Area
2012-13 TO 2013-14
LAND UTILIZATION
2013-14

(Area in "000" Hectares)
%
ALL FARMS 1,070 .. 4,327 .. 3,256 ..
Government Farm .. .. 2 .. 2 ..
Private Farm Total 1,070 100 4,325 100 3,254 100
Under 01.0 11 1 2 .. 3 ..
01.0 to Under 02.5 201 19 139 3 132 4
02.5 to Under 05.0 279 26 404 9 375 11
05.0 to Under 07.5 198 19 460 11 413 13
07.5 to Under 12.5 193 18 739 17 608 19
12.5 to Under 25.0 102 10 711 16 514 16
25.0 to Under 50.0 58 5 765 18 542 17
50.0 to Under 100.0 20 2 509 12 318 10
100.0 to Under 150.0 4 .. 176 4 108 3
150.0 and above 4 -- 420 10 241 7
Contd.
79
Size of FarmFarm Farm Area Cultivated Area
4.14 NUMBER & AREA OF FARM BY SIZE IN SINDH, 2000 & 2010 CENSUS
FARM
Total
2000
No. % Total %
Source:- Agriculture census, 2000 & 2010

4.14 NUMBER & AREA OF FARM BY SIZE IN SINDH,
(Number in ''000'')
(Area in "000" Hectares)
No. % Total % Total %
2010
ALL FARMS 1,115 .. 3,993 .. 3,093 ..
Government Farm .. .. .. .. .. ..
Private Farm Total 1,115 100 3,993 100 3,093 100
Under 01.0 42 4 6 .. 5 ..
01.0 to Under 02.5 306 27 202 5 189 6
02.5 to Under 05.0 282 25 400 10 368 12
05.0 to Under 07.5 159 14 369 9 328 11
07.5 to Under 12.5 138 12 531 13 450 15
12.5 to Under 25.0 98 9 722 18 559 18
25.0 to Under 50.0 64 6 845 21 614 20
50.0 to Under 100.0 21 2 527 13 371 12
100.0 to Under 150.0 3 .. 142 4 92 3
150.0 and above 2 .. 249 6 117 4
Source:- Agriculture Census, 2000 & 2010.
80
Size of FarmFarm Farm Area Cultivated Area
2000 & 2010 CENSUS
FARM

4.15 PRIVATE FARM AND FARM AREA BY TENURE AND SIZE
Size of Farm(Hectares) Owner Owner
Total Owner Cum Tenant Total Owner Cum Tenant Tenant Tenant
TOTAL 1,070 704 43 323 4,325 3,285 298 742
Under 01.0 11 10 .. 1 2 2 .. ..
01.0 to Under 02.5 201 143 1 57 139 96 .. 43
02.5 to Under 05.0 279 150 7 122 404 215 11 178
05.0 to Under 07.5 198 118 9 71 460 272 23 165
07.5 to Under 12.5 193 124 12 57 739 482 48 209
12.5 to Under 25.0 102 81 9 12 711 567 57 87
25.0 to Under 50.0 58 52 4 2 765 687 47 31
50.0 to Under 100.0 20 18 1 1 509 466 28 15
100.0 to Under 150.0 4 4 .. .. 176 159 10 7
150.0 and above 4 4 .. .. 420 339 74 7
Source:- Agriculture Census, 1990 & 2000.
Number of Farms In "000" Farm Area In "000" Hectares
81
OF FARM IN SINDH, 2000 & 2010 CENSUS
FARM
2000

4.15 PRIVATE FARM AND FARM AREA BY TENURE AND SIZE
Size of Farm
(Hectares) Owner Owner
Total Owner Cum Tenant Total Owner Cum Tenant
Tenant Tenant
TOTAL 1,115 784 45 286 3,994 3,169 302 524
Under 01.0 42 32 1 9 6 5 .. ..
01.0 to Under 02.5 306 199 3 104 202 127 2 72
02.5 to Under 05.0 282 172 9 102 400 244 13 143
05.0 to Under 07.5 159 111 9 39 369 257 22 90
07.5 to Under 12.5 138 107 10 20 531 414 41 76
12.5 to Under 25.0 98 83 6 8 722 619 46 57
25.0 to Under 50.0 64 57 4 3 845 758 51 36
50.0 to Under 100.0 21 19 2 1 527 462 45 20
100.0 to Under 150.0 3 3 .. .. 142 112 23 6
150.0 and above 2 2 .. .. 249 169 58 22
Source:- Agriculture Census, 2000 & 2100.
82
Number of Farms In "000" Farm Area In "000" Hectares
OF FARM IN SINDH, 2000 & 2010 CENSUS
FARM
2010

CROPS 2010-11 2011-12 2012-13 2013-14
ALL CROPS 183.42 158.92 180.90 204.34
FOOD CROPS 155.32 162.78 148.25 177.83
Rice 114.80 210.89 172.05 244.22
Wheat 197.40 173.16 165.67 184.24
Barley 53.08 41.85 39.23 40.72
Jowar 17.62 25.75 20.74 20.75
Bajra 72.45 17.03 23.69 23.68
Maize 15.64 28.91 35.54 34.66
Gram 26.96 24.0 21.14 20.46
NON-FOOD CROPS 219.26 154.00 222.55 238.15
Cotton (Phutti) 243.91 162.54 234.51 242.99
Sugar-Cane 182.74 143.21 211.94 243.75
Rape Seed and Mustard 95.90 97.33 103.17 107.00
Seasamum 102.86 83.57 112.5 120.82
Note:- Base Year for 1985-86 = 100
83
INDEX NUMBERS
4.16 QUANTUM INDEX OF AGRICULTURE PRODUCTION OF SINDH, 2010-11 TO 2013-14
(Base: 1985-86 = 100)
Source:- Crop Reporting Service Centre ( C. R .S .C ) Government of Sindh, Hyderabad.

4.17 AREA, PRODUCTION AND YIELD OF MAJOR CROPS OF
Y E A R COTTON RICE SUGARCANE JOWAR BAJRA MAIZE SESAMUM
A R E A ("000" Hectares)
2001-02 547.4 461.1 240.7 89.2 100.3 5.5 2.52002-03 542.6 488.3 258.6 75.1 10.3 6.7 2.62003-04 561.4 551.2 259.9 113.8 189.6 8.9 4.62004-05 635.1 543.9 214.9 61.4 5.7 3.0 1.72005-06 637.1 593.2 183.2 66.0 73.3 3.5 3.42006-07 570.1 598.1 214.7 64.0 131.6 2.4 2.82007-08 607.4 594.0 308.8 58.7 155.2 2.8 7.32008-09 561.5 733.5 263.9 43.9 75.9 2.7 7.72009-10 634.7 707.7 233.9 31.7 74.8 3.1 8.82010-11 457.0 361.2 226.5 12.9 146.0 2.5 6.42011-12 259.2 635.9 189.7 14.5 41.1 2.5 5.72012-13 530.1 511.1 253.7 12.4 45.0 3.6 7.22013-14 568.0 745.5 297.6 12.8 44.8 3.5 7.2
2001-02 2,443.2 1,159.1 11,416.3 57.4 54.4 3.2 0.72002-03 2,411.8 1,299.7 13,797.6 47.6 5.3 3.6 0.92003-04 2,242.8 1,432.8 14,611.8 68.7 76.3 4.8 1.62004-05 3,016.7 1,499.7 9,357.4 38.8 3.2 1.6 0.62005-06 2,648.0 1,721.0 11,243.4 43.7 12.7 1.6 1.42006-07 2,398.2 1,761.8 12,529.2 44.1 18.0 1.4 1.32007-08 2,536.2 1,817.7 18,793.9 41.2 77.0 1.8 3.22008-09 2,978.3 2,537.1 13,304.3 33.0 45.0 1.7 3.52009-10 4270.7 2422.3 13505.4 24.8 44.6 1.9 3.82010-11 3536.8 1230.3 13766.4 10.2 71.2 1.6 2.92011-12 2356.8 2260.1 10788.3 14.9 16.7 2.9 2.32012-13 3400.4 1843.9 15966.2 12.0 23.3 3.6 3.32013-14 3523.4 2617.3 18362.5 12.0 23.3 3.5 3.4
2001-02 759 2,514 47,430 643 542 582 2802002-03 756 2,662 53,355 634 515 537 3462003-04 680 2,599 56,221 604 402 539 3482004-05 808 2,757 43,543 632 561 533 3532005-06 707 2,901 61,372 662 173 457 4122006-07 716 2,946 58,357 689 137 583 4642007-08 710 3,060 60,861 702 496 643 4382008-09 902 3,459 50,414 752 593 630 4552009-10 1,144 3,423 57,740 782 596 613 4322010-11 1,316 3,406 60,779 791 488 640 4532011-12 1,547 3,554 56,870 1,028 406 1,160 4042012-13 1,091 3,608 62,935 965 517 985 4582013-14 1,055 3,511 61,711 937 519 1,003 470
Source:- Crop Reporting Service Centre ( C. R .S .C ) Government of Sindh, Hyderabad.
84
CROPS
PRODUCTION ("000" M.Tons)
Y I E L D (Per Hectare in Kgs.)
(Cotton in "000" Bales)
KHARIF SEASON IN SINDH, 2001-02 TO 2013-14

RAPE SEED &
MUSTARD
A R E A ("000" Hectares)2001-02 875.2 14.1 38.5 0.1 64.52002-03 863.7 13.5 37.9 0.1 62.92003-04 878.2 10.3 61.7 0.1 60.32004-05 887.4 7.7 50.9 0.1 48.82005-06 933.2 6.5 51.4 0.1 46.32006-07 982.2 7.7 55.9 0.1 67.72007-08 989.9 8.2 48.2 0.3 49.12008-09 1,031.4 6.5 32.4 0.4 45.42009-10 1,092.3 7.5 29.3 0.2 38.52010-11 1,144.4 11.6 19.7 0.1 43.52011-12 1,049.2 9.1 20.0 0.1 43.82012-13 1,058.4 8.4 16.8 0.1 46.52013-14 1,122.0 8.7 15.9 0.1 48.3
2001-02 2,101.0 6.4 30.7 0.2 48.62002-03 2,109.2 5.8 32.5 0.1 49.82003-04 2,172.1 4.4 55.8 0.2 50.72004-05 2,508.6 3.4 45.0 0.2 43.22005-06 2,750.4 2.9 45.8 0.1 40.92006-07 3,409.1 4.2 58.1 0.2 67.02007-08 3,411.4 4.5 45.6 0.4 50.32008-09 3,540.2 3.6 31.6 0.5 48.52009-10 3,703.1 4.3 29.5 0.3 44.02010-11 4,287.9 6.9 20.5 0.2 46.02011-12 3,761.5 5.4 18.9 0.2 46.72012-13 3,598.7 5.1 16.1 0.2 49.52013-14 4,002.1 5.3 15.5 0.2 51.4
2001-02 2,401 456 799 1,198 7542002-03 2,442 433 858 1,164 7922003-04 2,473 427 904 2,000 8422004-05 2,827 436 886 1,136 8852005-06 2,947 446 891 1,000 8832006-07 3,471 549 1,040 1,266 9882007-08 3,446 537 946 1,333 1,0242008-09 3,432 554 975 1,250 1,0682009-10 3,390 568 1,007 1,500 1,1342010-11 3,747 595 1,041 2,000 1,0572011-12 3,585 593 945 2,000 1,0662012-13 3,400 610 957 1,544 1,0652013-14 3,567 612 975 1,476 1,063
85
4.18 AREA, PRODUCTION AND YIELD OF MAJOR CROPS OF RABI SEASON IN SINDH, 2001-02 TO 2013-14
CROPS
BARLEY GRAM
ii) Agriculture Statistics of Pakistan, 2012-13.
TOBACCOY E A R WHEAT
PRODUCTION ("000" M.Tons)
Y I E L D (Per Hectare in Kgs.)
Source:- crop Reporting Service Centre( C. R .S .C ) Government of Sindh, Hyderabad.

SINDH 635,819 511,091 745,539 2,260,088 1,843,881 2,617,338
Khairpur 9,422 5,659 6,058 29,268 18,805 18,356
Ghotki 21,640 13,248 54,795 61,409 37,248 195,803
Jacobabad 77,782 17,018 73,020 310,005 63,460 308,289
Kashmore 71,687 26,535 74,120 271,170 99,455 301,219
Sukkur 9,552 4,448 8,591 21,248 10,005 18,505
Shikarpur 127,800 65,840 107,171 463,438 201,158 362,573
S.B.Abad 1,640 8,153 10,355 4,336 27,961 33,114
Naushero Feroze 5,035 8,710 9,395 14,769 29,391 29,255
Larkana 98,935 93,944 98,009 388,447 362,100 322,418
Kamber Shahdadkot 84,678 67,974 80,929 309,340 250,495 268,009
Sanghar 3,926 6,047 6,449 7,734 18,661 17,597
Mirpurkhas 160 2,985 2,933 213 9,415 7,580
Umerkot - - - - - -
Tharparkar - - - - - -
Dadu 21,915 41,429 44,731 82,627 169,305 156,636
Jamshoro 109 124 441 382 371 1,597
Hyderabad 1,151 1,018 1,080 2,464 3,301 3,544
Matiari 672 1,507 1,569 1,554 4,300 3,995
Tando Allah Yar 44 872 906 98 2,223 2,256
T.M. Khan 9,162 12,907 15,488 15,937 53,415 50,753
Badin 16,324 62,757 79,381 25,141 266,118 329,620
Thatta 74,185 69,916 70,118 250,508 216,694 186,219
Karachi - - - - - -
2013-14
MAJOR CROPS
AREA (In Hectares) PRODUCTION (In M.Tons)
4.19 AREA AND PRODUCTION OF RICE BY DISTRICT
86
Source:- Crop Reporting Service Centre ( C. R .S .C ) Government of Sindh, Hyderabad.
Province/District2012-132011-12 2012-13 2013-14
IN SINDH, 2011-12 TO 2013-14
2011-12
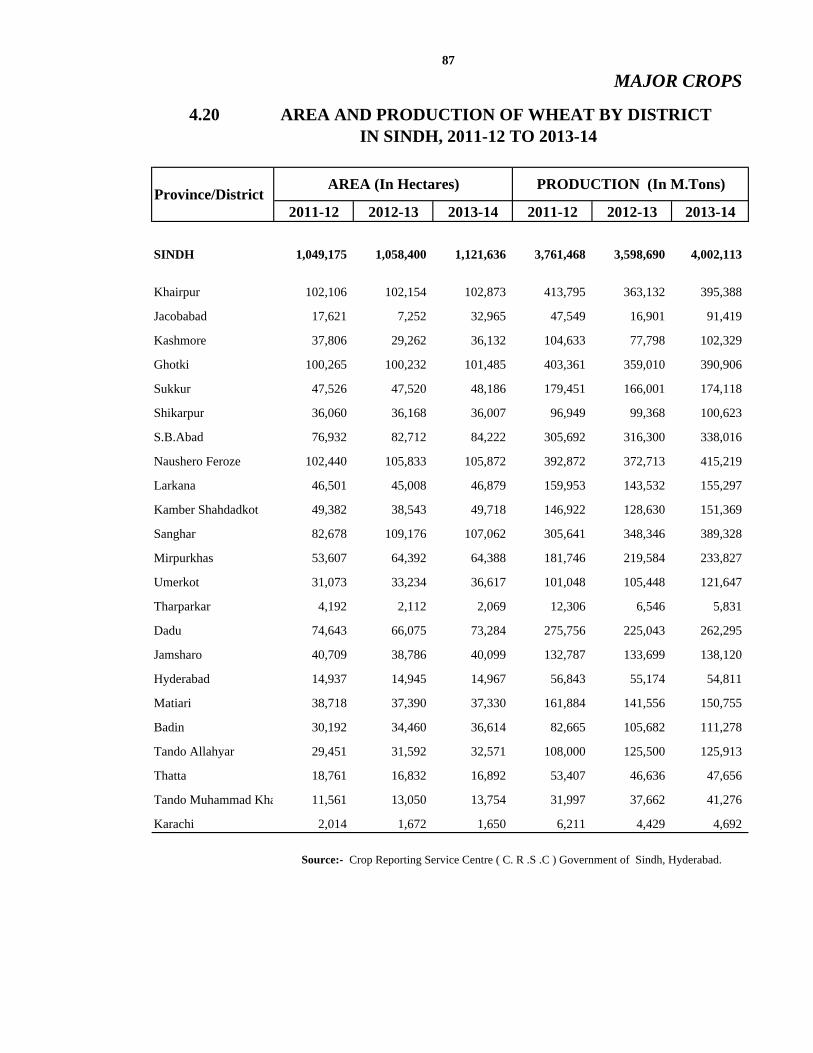
2011-12 2012-13 2013-14 2011-12 2012-13 2013-14
SINDH 1,049,175 1,058,400 1,121,636 3,761,468 3,598,690 4,002,113
Khairpur 102,106 102,154 102,873 413,795 363,132 395,388
Jacobabad 17,621 7,252 32,965 47,549 16,901 91,419
Kashmore 37,806 29,262 36,132 104,633 77,798 102,329
Ghotki 100,265 100,232 101,485 403,361 359,010 390,906
Sukkur 47,526 47,520 48,186 179,451 166,001 174,118
Shikarpur 36,060 36,168 36,007 96,949 99,368 100,623
S.B.Abad 76,932 82,712 84,222 305,692 316,300 338,016
Naushero Feroze 102,440 105,833 105,872 392,872 372,713 415,219
Larkana 46,501 45,008 46,879 159,953 143,532 155,297
Kamber Shahdadkot 49,382 38,543 49,718 146,922 128,630 151,369
Sanghar 82,678 109,176 107,062 305,641 348,346 389,328
Mirpurkhas 53,607 64,392 64,388 181,746 219,584 233,827
Umerkot 31,073 33,234 36,617 101,048 105,448 121,647
Tharparkar 4,192 2,112 2,069 12,306 6,546 5,831
Dadu 74,643 66,075 73,284 275,756 225,043 262,295
Jamsharo 40,709 38,786 40,099 132,787 133,699 138,120
Hyderabad 14,937 14,945 14,967 56,843 55,174 54,811
Matiari 38,718 37,390 37,330 161,884 141,556 150,755
Badin 30,192 34,460 36,614 82,665 105,682 111,278
Tando Allahyar 29,451 31,592 32,571 108,000 125,500 125,913
Thatta 18,761 16,832 16,892 53,407 46,636 47,656
Tando Muhammad Kha 11,561 13,050 13,754 31,997 37,662 41,276
Karachi 2,014 1,672 1,650 6,211 4,429 4,692
4.20 AREA AND PRODUCTION OF WHEAT BY DISTRICT IN SINDH, 2011-12 TO 2013-14
Source:- Crop Reporting Service Centre ( C. R .S .C ) Government of Sindh, Hyderabad.
87
MAJOR CROPS
Province/DistrictAREA (In Hectares) PRODUCTION (In M.Tons)

SINDH 14,465 12,445 12,822 14,908 12,014 12,015
Khairpur 2,885 2,895 2,898 3,194 2,947 2,816
Ghotki 3,310 2,267 2,246 4,057 2,465 2,369
Jacobabad 1,584 619 408 1,284 526 340
Kashmore 534 9 18 443 10 21
Sukkur 1,980 1,925 1,837 2,270 2,188 1,930
Shikarpur 72 2 39 73 2 40
S.B.Abad 181 145 156 129 123 123
Naushero Feroze 274 275 297 246 272 255
Larkana 215 219 227 225 225 213
Kamber Shahdadkot 532 541 549 515 492 470
Sanghar 200 581 587 83 413 480
Mirpurkhas 191 348 819 72 206 611
Umerkot 35 237 209 11 155 220
Tharparkar -- -- -- .. -- --
Dadu 852 410 540 825 365 468
Jamshoro 590 558 526 595 541 486
Hyderabad 51 37 38 41 36 33
Matiari 78 295 500 65 213 378
Badin 94 410 360 50 288 247
Tando Allah Yar 138 129 142 82 78 110
Thatta 149 277 222 121 219 217
T.M. Khan 18 16 13 11 10 8
Karachi 502 250 191 516 240 180
88
4.21 AREA AND PRODUCTION OF JOWAR BY DISTRICT IN SINDH, 2011-12 TO 2013-14
AREA (In Hectres) PRODUCTION (In M. Tons)
2013-14
MAJOR CROPS
2012-13 2011-12 2012-13Province / District
2011-12 2013-14

SINDH 41,068 45,001 44,808 16,723 23,255 23,250
Khairpur 175 167 170 138 94 112
Ghotki 22 9 10 18 6 7
Jacobabad -- -- -- -- -- --
Kashmore 6 -- -- 5 -- --
Sukkur 15 12 10 11 7 7
Shikarpur 2 3 -- 2 2 --
S.B.Abad 392 126 115 174 76 91
Naushero Feroze 32 31 23 20 18 14
Larkana -- -- -- -- -- --
Kamber Shahdadkot -- -- -- -- -- --
Sanghar 172 349 361 82 166 178
Mirpurkhas 493 958 958 205 521 532
Tharparkar 38,692 40,780 40,809 15,298 20,960 20,975
Umerkot 98 428 383 37 195 186
Dadu 2 35 44 2 21 32
Jamshoro 504 509 407 394 332 276
Hyderabad 14 15 15 9 10 9
Matiari 309 343 492 241 200 294
Badin -- 540 500 -- 310 232
Tando Allah Yar 127 390 421 78 189 254
Thatta 13 306 85 9 148 48
Tando Muhammad Khan -- -- -- -- -- --
Karachi -- -- 5 -- -- 3
IN SINDH, 2011-12 TO 2013-14
AREA (In Hectares) PRODUCTION (In M.Tons)
89
MAJOR CROPS
4.22 AREA AND PRODUCTION OF BAJRA BY DISTRICT
Source:- Crop Reporting Service Centre ( C. R .S .C ) Government of Sindh, Hyderabad.
2013-142011-12 2012-13Province / District
2011-12 2012-13 2013-14

SINDH 2,539 3,641 3,490 2,922 3,588 3,501
Khairpur 16 142 138 17 136 135
Ghotki 37 40 39 37 42 41
Jacobabad -- -- -- -- -- --
Kashmore 13 -- -- 11 -- --
Sukkur 122 121 122 133 128 130
Shikarpur 5 7 8 5 7 8
S.B.Abad 38 27 25 30 25 23
Naushero Feroze 177 208 212 180 204 210
Larkana -- -- -- -- -- --
Kamber Shahdadkot -- -- -- -- -- --
Sanghar -- 179 187 -- 156 169
Mirpurkhas 115 41 40 70 30 38
Umerkot 85 206 186 49 128 149
Tharparkar -- -- -- -- -- --
Dadu 23 91 149 24 73 134
Jamshoro 434 393 249 553 412 258
Hyderabad 36 20 21 45 22 23
Matiari 196 216 435 269 258 516
Badin 18 55 48 15 42 38
Tando Allah Yar 206 212 245 195 197 223
Thatta 780 1,478 1,257 1,018 1505 1267
Tando Muhammad Khan 96 90 54 101 97 57
Karachi 142 115 75 170 126 82
Source:- Crop Reporting Service Centre ( C. R .S .C ) Government of Sindh, Hyderabad.
Province / District AREA (In Hectares)
2013-14
PRODUCTION (In M.Tons)
90
MAJOR CROPS
4.23 AREA AND PRODUCTION OF MAIZE BY DISTRICT IN SINDH, 2011-12 TO 2013-14
2011-12 2012-13 2011-12 2012-13 2013-14

SINDH 20,015 16,792 15,889 18,853 16,070 15,549
Khairpur 413 435 444 371 426 435
Ghotki 155 158 168 138 158 168
Jacobabad 3,726 2,070 2,133 3,495 1,946 2,068
Kashmore 8,013 7,488 7,445 7,596 7,105 7,322
Sukkur 561 522 516 527 500 516
Shikarpur 3,763 3,031 1,818 3,526 2,906 1,743
S.B.Abad 207 190 118 186 190 117
Naushero Feroze 172 190 197 163 190 197
Larkana 926 840 838 888 813 811
Kamber Shahdadkot 137 146 154 123 144 152
Sanghar .. .. -- .. .. --
Mirpurkhas .. .. -- .. .. --
Umerkot .. .. -- .. .. --
Tharparkar .. .. -- .. .. --
Dadu 520 250 590 493 247 583
Jamshoro 807 971 927 758 950 907
Hyderabad .. .. -- .. .. --
Matiari 596 466 507 571 460 496
Badin 10 15 13 9 15 13
Tando Allah Yar .. .. -- .. .. --
Thatta .. .. -- .. .. --
Tando Muhammad Khan 9 20 21 9 20 21
Karachi .. .. -- .. .. --
AREA (In Hectares) PRODUCTION (In M.Tons)
2013-142013-14
Source:- Crop Reporting Service Centre ( C. R .S .C ) Government of Sindh, Hyderabad.
91
MAJOR CROPS
4.24 AREA AND PRODUCTION OF GRAM BY DISTRICTIN SINDH, 2011-12 TO 2013-14
2011-12 2012-13 2011-12 2012-13Province / District

SINDH 9,136 8,362 8,657 5,435 5,101 5,294
Khairpur 520 511 469 283 252 231
Ghotki 26 26 31 15 15 17
Jacobabad 413 353 411 277 244 284
Kashmore 437 352 432 281 226 277
Sukkur 27 22 19 14 11 10
Shikarpur 47 51 62 30 34 41
S.B.Abad 16 15 13 8 7 6
Naushero Feroze 14 13 24 7 7 13
Larkana 2,458 2,943 3,040 1,458 1,890 1,952
Kamber Shahdadkot 88 92 105 46 54 61
Sanghar -- -- -- -- -- --
Mirpurkhas 28 41 43 14 23 24
Tharparkar -- -- -- -- -- --
Umerkot -- -- -- -- -- --
Dadu 150 175 205 93 117 137
Jamshoro 131 143 135 75 84 79
Hyderabad -- -- -- -- -- --
Matiari -- -- -- -- -- --
Tando Allah Yar -- -- -- -- -- --
Tando Muhammad Khan 28 40 45 13 18 20
Badin 1,122 1,060 1,058 632 597 596
Thatta 3,631 2,525 2,565 2,189 1,522 1,546
Karachi -- -- -- -- -- --
2012-13 2013-14 2011-12 2012-13
Source:- Crop Reporting Service Centre ( C. R .S .C ) Government of Sindh, Hyderabad.
Province / District AREA (In Hectares) PRODUCTION (In M.Tons)
2013-14
92
MAJOR CROPS
4.25 AREA AND PRODUCTION OF BARLEY BY DISTRICTIN SINDH, 2011-12 TO 2013-14
2011-12

SINDH 43,774 46,518 48,330 46,719 49,521 51,358
Khairpur 1,420 1,345 1,415 1,544 1,436 1,525
Ghotki 199 195 208 216 212 226
Jacobabad 1,917 3,165 4,409 2,274 3,789 5,234
Kashmore 664 525 210 656 522 209
Sukkur 322 310 321 366 349 362
Shikarpur 743 865 995 778 863 1,043
S.B.Abad 3,640 3,815 4,082 4,138 4,156 4,640
Naushero Feroze 810 874 893 817 907 900
Larkana 10,873 4,845 3,998 12,789 5,699 4,703
Kamber Shahdadkot 649 401 409 757 467 473
Sanghar 9,192 8,105 8,441 9,267 8,027 8,510
Mirpurkhas 3,690 12,895 13,075 4,085 14,161 14,087
Umerkot 1,140 1,178 1,178 1,127 1,189 1,223
Tharparkar 780 781 780 771 777 810
Dadu 1,249 990 1,510 1,111 937 1,397
Jamshoro 560 371 257 526 350 241
Hyderabad 115 38 118 125 42 128
Matiari 652 571 668 644 593 675
Badin 1,240 1,279 1,385 1,311 1,365 1,465
Tando Allahyar 362 460 431 358 459 426
Thatta 3,411 3,400 3,415 2,900 3,092 2,937
Tando Muhammad Khan 146 110 132 159 129 144
Karachi -- -- -- -- -- --
2011-12 2012-13 2013-14 2013-14
Source:- Crop Reporting Service Centre ( C. R .S .C ) Government of Sindh, Hyderabad.
93
MAJOR CROPS
4.26 AREA AND PRODUCTION OF RAPESEED AND MUSTARD BY DISTRICT IN SINDH, 2011-12 TO 2013-14
2011-12 2012-13Province / District
AREA (In Hectares) PRODUCTION (In M.Tons)

SINDH 5,711 7,208 7,200 2,340 3,333 3,383
Khairpur 20 29 48 9 13 22
Ghotki 12 4 5 7 2 3
Jacobabad -- -- -- -- -- --
Kashmore -- -- -- -- -- --
Sukkur 5 3 5 3 2 3
Shikarpur 6 -- -- 3 -- --
S.B.Abad 526 444 408 208 201 193
Naushero Feroze 393 419 750 183 199 334
Larkana 152 163 87 74 76 52
Kamber Shahdadkot -- -- -- -- -- --
Sanghar -- 133 136 -- 66 71
Mirpurkhas -- 450 466 -- 236 233
Umerkot -- -- -- -- -- --
Tharparkar 2,946 2,865 2,879 903 1,189 1,283
Dadu 337 1,857 1,550 207 899 769
Jamshoro 1,130 681 679 670 384 342
Hyderabad -- -- -- -- -- --
Matiari -- -- -- -- -- --
Badin -- -- -- -- -- --
Tando Allah Yar 184 160 187 73 66 78
Thatta -- -- -- -- -- --
Tando Muhammad Khan -- -- -- -- -- --
Karachi -- -- -- -- -- --
2013-14
Source:- Crop Reporting Service centre ( C. R .S .C ) Government of Sindh, Hyderabad.
2012-132011-12
94
MAJOR CROPS
Province / DistrictAREA (In Hectares) PRODUCTION (In M.Tons)
4.27 AREA AND PRODUCTION OF SESAMUM BY DISTRICT IN SINDH, 2011-12 TO 2013-14
2011-12 2012-13 2013-14
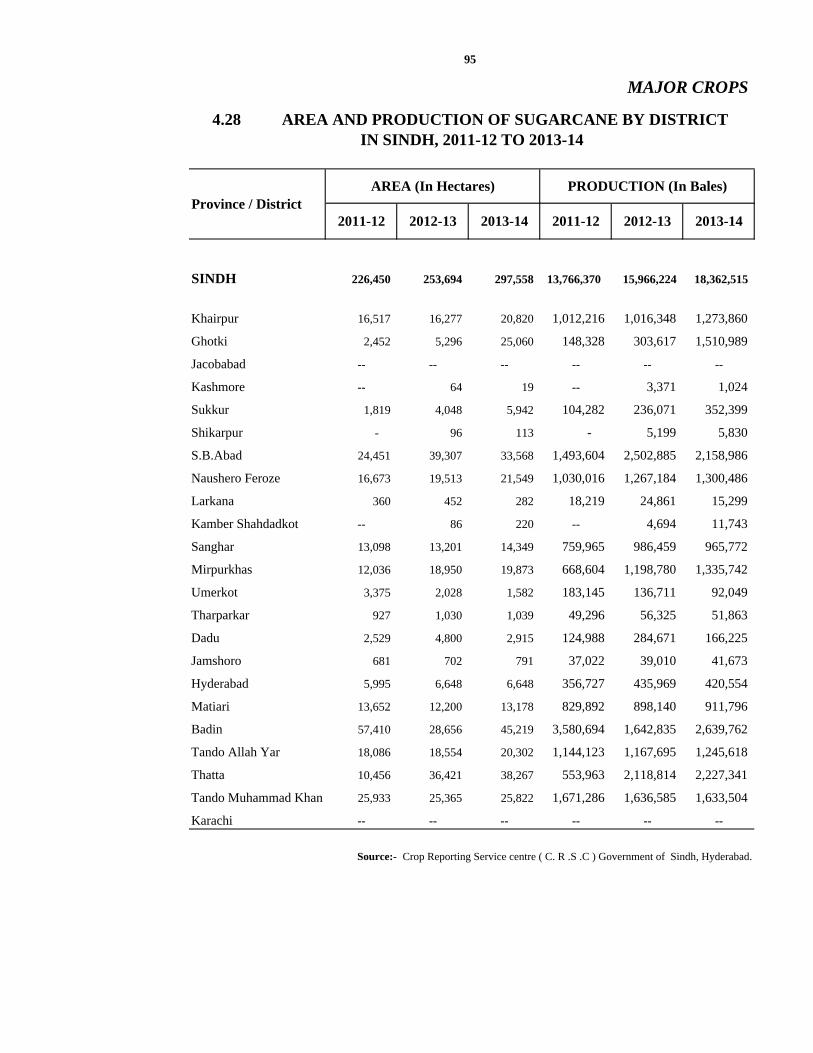
SINDH 226,450 253,694 297,558 13,766,370 15,966,224 18,362,515
Khairpur 16,517 16,277 20,820 1,012,216 1,016,348 1,273,860
Ghotki 2,452 5,296 25,060 148,328 303,617 1,510,989
Jacobabad -- -- -- -- -- --
Kashmore -- 64 19 -- 3,371 1,024
Sukkur 1,819 4,048 5,942 104,282 236,071 352,399
Shikarpur - 96 113 - 5,199 5,830
S.B.Abad 24,451 39,307 33,568 1,493,604 2,502,885 2,158,986
Naushero Feroze 16,673 19,513 21,549 1,030,016 1,267,184 1,300,486
Larkana 360 452 282 18,219 24,861 15,299
Kamber Shahdadkot -- 86 220 -- 4,694 11,743
Sanghar 13,098 13,201 14,349 759,965 986,459 965,772
Mirpurkhas 12,036 18,950 19,873 668,604 1,198,780 1,335,742
Umerkot 3,375 2,028 1,582 183,145 136,711 92,049
Tharparkar 927 1,030 1,039 49,296 56,325 51,863
Dadu 2,529 4,800 2,915 124,988 284,671 166,225
Jamshoro 681 702 791 37,022 39,010 41,673
Hyderabad 5,995 6,648 6,648 356,727 435,969 420,554
Matiari 13,652 12,200 13,178 829,892 898,140 911,796
Badin 57,410 28,656 45,219 3,580,694 1,642,835 2,639,762
Tando Allah Yar 18,086 18,554 20,302 1,144,123 1,167,695 1,245,618
Thatta 10,456 36,421 38,267 553,963 2,118,814 2,227,341
Tando Muhammad Khan 25,933 25,365 25,822 1,671,286 1,636,585 1,633,504
Karachi -- -- -- -- -- --
PRODUCTION (In Bales)
MAJOR CROPS
4.28 AREA AND PRODUCTION OF SUGARCANE BY DISTRICT IN SINDH, 2011-12 TO 2013-14
Source:- Crop Reporting Service centre ( C. R .S .C ) Government of Sindh, Hyderabad.
AREA (In Hectares)
2011-12 2012-132011-12
95
Province / District2013-14 2013-142012-13

SINDH 259,199 530,099 567,980 2,356,837 3,400,394 3,523,414
Khairpur 56,313 62,722 78,984 362,157 324,209 427,947
Ghotki 71,194 63,461 52,534 466,134 354,568 281,745
Jacobabad -- -- -- -- -- --
Kashmore 16 -- -- 85 -- --
Sukkur 30,125 25,315 28,676 190,237 136,822 148,933
Shikarpur 38 16 12 190 88 61
S.B.Abad 9,501 51,857 55,153 96,375 339,528 323,767
Naushero Feroze 32,829 30,804 31,480 207,630 169,710 167,594
Larkana 910 3,104 1,540 4,865 20,083 6,562
Kamber Shahdadkot -- -- -- -- -- --
Sanghar 13,370 121,468 123,487 447,511 899,296 879,799
Mirpurkhas 8,915 32,086 40,200 115,319 209,734 294,353
Umerkot 2,438 25,238 25,038 48,501 156,932 147,685
Tharparkar 57 1,036 1,126 1,805 5,862 6,762
Dadu 3,156 8,286 11,719 15,712 47,183 65,055
Jamshoro 5,508 16,216 17,013 57,612 94,160 110,143
Hyderabad 2,676 6,555 6,566 31,295 44,284 41,286
Matiari 17,642 36,835 40,387 194,000 274,137 283,126
Badin - 13,069 21,002 44,572 102,656 133,765
Tando Allah Yar 2,147 21,280 22,765 40,201 150,046 141,598
Thatta 1,559 6,868 5,292 21,094 42,276 32,161
Tando Muhammad Khan 235 3,315 4,378 13,075 25,365 27,774
Karachi 570 568 628 3,467 3,455 3,298
96
2011-12Province / District
2013-14 2013-14
AREA (In Hectares) PRODUCTION (In Bales)
MAJOR CROPS
2012-132012-132011-12
4.29 AREA AND PRODUCTION OF COTTON BY DISTRICT IN SINDH, 2011-12 TO 2013-14

SINDH 126 125 147 188 193 217
Khairpur 104 100 107 156 157 160
Ghotki 8 10 13 11 14 18
Jacobabad -- -- -- -- -- --
Kashmore -- -- -- -- -- --
Sukkur 4 6 10 6 8 13
Shikarpur -- -- -- -- -- --
S.B.Abad -- -- -- -- -- --
Naushero Feroze 10 9 12 15 14 19
Larkana -- -- -- -- -- --
Kamber Shahdadkot -- -- -- -- -- --
Sanghar -- -- -- -- -- --
Mirpurkhas -- -- -- -- -- --
Umerkot -- -- -- -- -- --
Tharparkar -- -- -- -- -- --
Dadu -- -- -- -- -- --
Jamshoro -- -- 5 -- -- 7
Hyderabad -- -- -- -- -- --
Matiari -- -- -- -- -- --
Badin -- -- -- -- -- --
Tando Allah Yar -- -- -- -- -- --
Thatta -- -- -- -- -- --
Tando Muhammad Khan -- -- -- -- -- --
Karachi -- -- -- -- -- --
97
MAJOR CROPS
4.30 AREA AND PRODUCTION OF TOBACCO BY DISTRICT IN SINDH, 2011-12 TO 2013-14
2013-14 2011-12 2012-13Province / District
AREA (In Hectares) PRODUCTION (In M.Tons)
Source:- Crop Reporting Service centre( C. R .S .C ) Government of Sindh, Hyderabad.
2011-12 2012-13 2013-14

CHIL- GINGER GARLIC FENNEL CORRI- SPER- TURM- OTHERSLIES ANDER IMENT ERIC
A R E A (In Hectares)
2008-09 63,707 195 2,778 680 3,370 209 134 1,071
2009-10 64,380 269 1,419 566 2,502 289 317 975
2010-11 52,732 247 870 1,013 2,569 238 280 901
2011-12 16,441 22 850 850 2,923 143 53 676
2012-13 52,256 249 1,143 788 2,726 101 255 978
2013-14 52,101 280 1,225 777 2,711 199 252 1,010
PRODUCTION (In M.Tons)
2008-09 172,171 95 14,309 430 1,446 151 170 483
2009-10 172,809 111 7,462 380 1,138 170 349 425
2010-11 158,195 115 4,644 701 1,270 141 311 420
2011-12 30,948 8 4,536 630 1,472 92 56 322
2012-13 129,894 113 6,097 577 1,437 64 264 471
2013-14 129,552 124 6,501 568 1,449 126 261 488
YEAR
98
4.31 AREA AND PRODUCTION OF CONDIMENTS IN SINDH, 2008-09 TO 2013-14
CONDIMENTS
Source:- Crop Reporting Service Centre ( C. R .S .C ) Government of Sindh, Hyderabad.

A R E A (In Hectares)
2008-09 828 6,399 63,017 12,682 923
2009-10 602 4,806 48,858 11,222 6,099
2010-11 547 3,294 53,263 10,776 6,357
2011-12 116 3,404 28,796 2,397 2,186
2012-13 233 1,723 20,274 2,112 314
2013-14 293 1,532 20,985 1,929 298
PRODUCTION (In M.Tons)
2008-09 340 3,558 36,662 5,833 383
2009-10 262 2,755 31,391 5,427 1,808
2010-11 255 1,954 34,747 4,429 1,900
2011-12 55 2,052 17,299 1,019 594
2012-13 99 1,030 12,410 918 123
2013-14 125 913 12,798 837 118Source:- Crop Reporting Service Centre ( C. R .S .C ) Government of Sindh, Hyderabad.
4.32 AREA AND PRODUCTION OF PULSES IN SINDH, 2008-09 TO 2013-14
PULSES
99
MATTER MUNG OTHERS YEAR MASH MASOOR

2008-09 33,445 1,139 32,405 9,483 55,836 696
2009-10 32,236 1,163 32,541 9,591 59,503 685
2010-11 26,821 1,185 32,737 9,805 59,215 663
2011-12 19,756 1,175 3,565 9,568 60,055 549
2012-13 25,032 1,175 32,424 9,972 60,467 546
2013-14 25,920 1,110 32,509 9,501 63,144 525
2008-09 128,888 4,053 261,946 70,470 390,486 3,566
2009-10 127,426 4,110 265,305 70,883 378,977 3,525
2010-11 113,410 4,275 268,576 75,382 381,269 3,264
2011-12 76,042 3,896 299,816 71,948 391,781 2,466
2012-13 96,211 4,032 268,920 74,579 396,137 2,544
2013-14 100,787 3,789 270,493 72,288 402,514 2,510
BANANA CHIKOO DATES
A R E A (In Hectares)
P R O D U C T I O N (In M.Tons)
100
4.33 AREA AND PRODUCTION OF FRUITS IN SINDH,2008-09 TO 2013-14
FRUITS
GUAVA MANGOES PAPAYA YEAR

YEAR ORANGE / LEMON GRAPE MOSS- KINO BER MULB- OTHERMALTA FRUIT AMBI ERRY FRUITS
A R E A (In Hectares)
2008-09 1,099 2,872 226 119 105 3,810 59 13,571
2009-10 1,038 2,984 222 112 93 4,043 46 13,572
2010-11 954 3,498 235 97 84 4,585 41 14,769
2011-12 911 3,520 265 89 88 4,537 55 6,120
2012-13 851 3,767 286 101 89 4,002 69 7,248
2013-14 804 3,798 299 90 81 3,998 68 7,585
P R O D U C T I O N (In M.Tons)
2008-09 14,118 13,484 1,254 682 727 17,813 145 107,784
2009-10 13,459 14,453 1,196 619 609 17,988 100 108,436
2010-11 12,662 15,783 1,230 556 546 19,492 93 120,655
2011-12 12,124 16,337 1,300 491 556 18,412 18 36,858
2012-13 11,332 17,440 1,362 562 557 16,068 154 41,317
2013-14 10,712 17,609 1,449 508 517 16,061 153 44,627
101
2008-09 TO 2013-144.33 AREA AND PRODUCTION OF FRUITS IN SINDH,
FRUITS
Source:- Crop Reporting Service centre ( C. R .S .C ) Government of Sindh, Hyderabad.
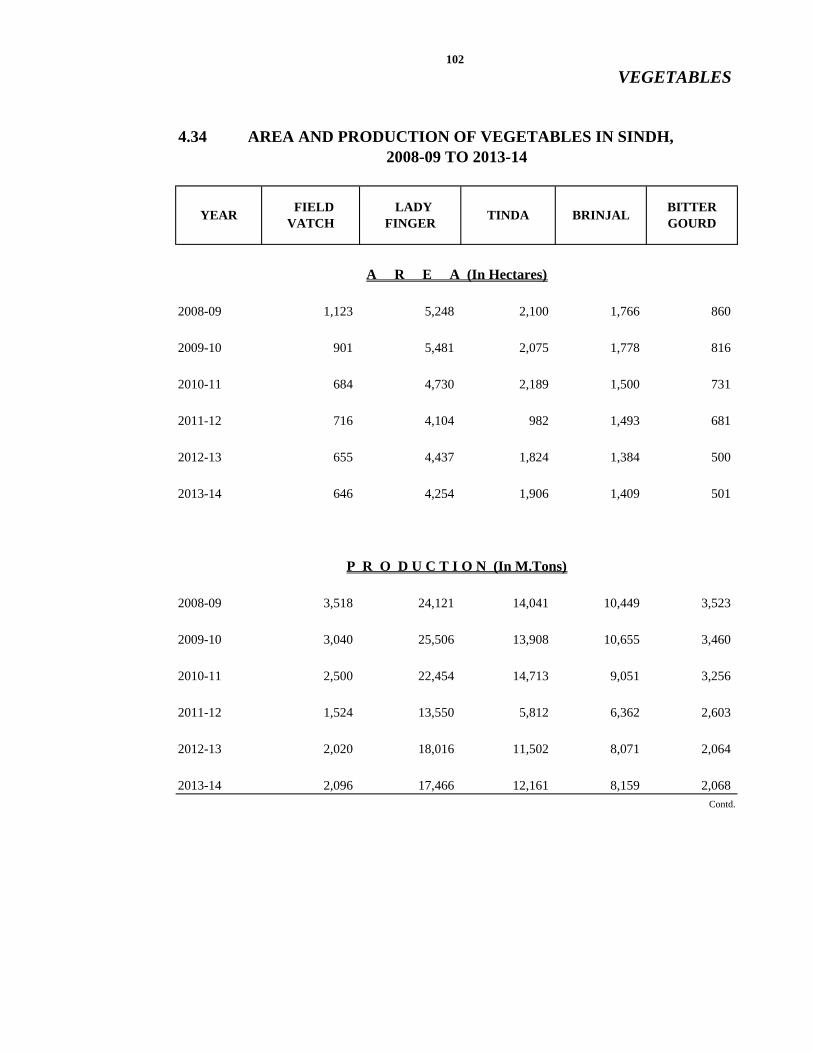
2008-09 1,123 5,248 2,100 1,766 860
2009-10 901 5,481 2,075 1,778 816
2010-11 684 4,730 2,189 1,500 731
2011-12 716 4,104 982 1,493 681
2012-13 655 4,437 1,824 1,384 500
2013-14 646 4,254 1,906 1,409 501
2008-09 3,518 24,121 14,041 10,449 3,523
2009-10 3,040 25,506 13,908 10,655 3,460
2010-11 2,500 22,454 14,713 9,051 3,256
2011-12 1,524 13,550 5,812 6,362 2,603
2012-13 2,020 18,016 11,502 8,071 2,064
2013-14 2,096 17,466 12,161 8,159 2,068Contd.
LADY FINGER
YEAR FIELD VATCH
BITTER GOURD
A R E A (In Hectares)
P R O D U C T I O N (In M.Tons)
102
4.34 AREA AND PRODUCTION OF VEGETABLES IN SINDH, 2008-09 TO 2013-14
VEGETABLES
BRINJALTINDA

2008-09 451 576 49,654 1,020 1,321
2009-10 418 537 42,328 1,108 1,219
2010-11 425 380 63,220 1,339 1,326
2011-12 449 344 46,505 1,579 1,235
2012-13 300 306 44,501 1,676 1,423
2013-14 286 308 52,908 1,603 1,404
2008-09 1,866 2,666 660,171 12,978 14,384
2009-10 1,753 2,515 565,659 13,706 13,401
2010-11 1,764 1,891 861,534 16,143 14,821
2011-12 1,625 1,291 745,395 18,495 13,916
2012-13 1,209 1,387 589,457 19,850 16,532
2013-14 1,187 1,398 697,276 18,990 16,332Contd.
ONIONLUFFA TURNIPS CARROT
A R E A (In Hectares)
P R O D U C T I O N (In M.Tons)
103
4.34 AREA AND PRODUCTION OF VEGETABLES IN SINDH, 2008-09 TO 2013-14
VEGETABLES
BOTTLE GOURD
YEAR

2008-09 12,346 1,221 1,298 352 460
2009-10 12,186 1,408 1,266 367 498
2010-11 14,578 1,608 1,302 426 718
2011-12 18,753 1,759 960 477 965
2012-13 22,479 2,082 1,027 474 886
2013-14 27,016 2,003 1,015 485 878
P R O D U C T I O N (In M.Tons)
2008-09 100,921 12,576 14,487 3,026 2,126
2009-10 100,351 14,048 13,466 3,308 2,318
2010-11 114,771 15,546 13,528 3,862 3,064
2011-12 141,586 17,554 10,151 4,369 3,887
2012-13 174,753 20,079 11,444 4,340 3,635
2013-14 200,572 19,922 11,158 4,402 3,540Contd.
CAULI-FLOWER
104
4.34 AREA AND PRODUCTION OF VEGETABLES IN SINDH, 2008-09 TO 2013-14
A R E A (In Hectares)
VEGETABLES
YEAR TOMATOES CABBAGE POTATO SWEET POTATO

YEAR
2008-09 1,249 1,161 298 303 563
2009-10 1,196 1,233 287 276 464
2010-11 1,135 1,519 242 264 3,605
2011-12 1,224 1,232 388 159 3,730
2012-13 1,519 1,146 493 173 4,561
2012-13 1,514 998 489 151 4,902
2008-09 5,667 6,861 677 801 1,490
2009-10 5,214 7,326 624 755 1,145
2010-11 4,644 8,722 509 748 13,778
2011-12 4,928 7,073 753 466 13,744
2012-13 6,168 6,934 966 510 17,252
2013-14 6,150 6,134 961 469 17,459Source:- Crop Reporting Service Centre ( C. R .S .C ) Government of Sindh, Hyderabad.
105
4.34 AREA AND PRODUCTION OF VEGETABLES IN SINDH, 2008-09 TO 2013-14
VEGETABLES
FENUE GREAK
OTHER VEGETABLES
GARDEN PEAS
RADISH PEAS
A R E A (In Hectares)
P R O D U C T I O N (In M.Tons)
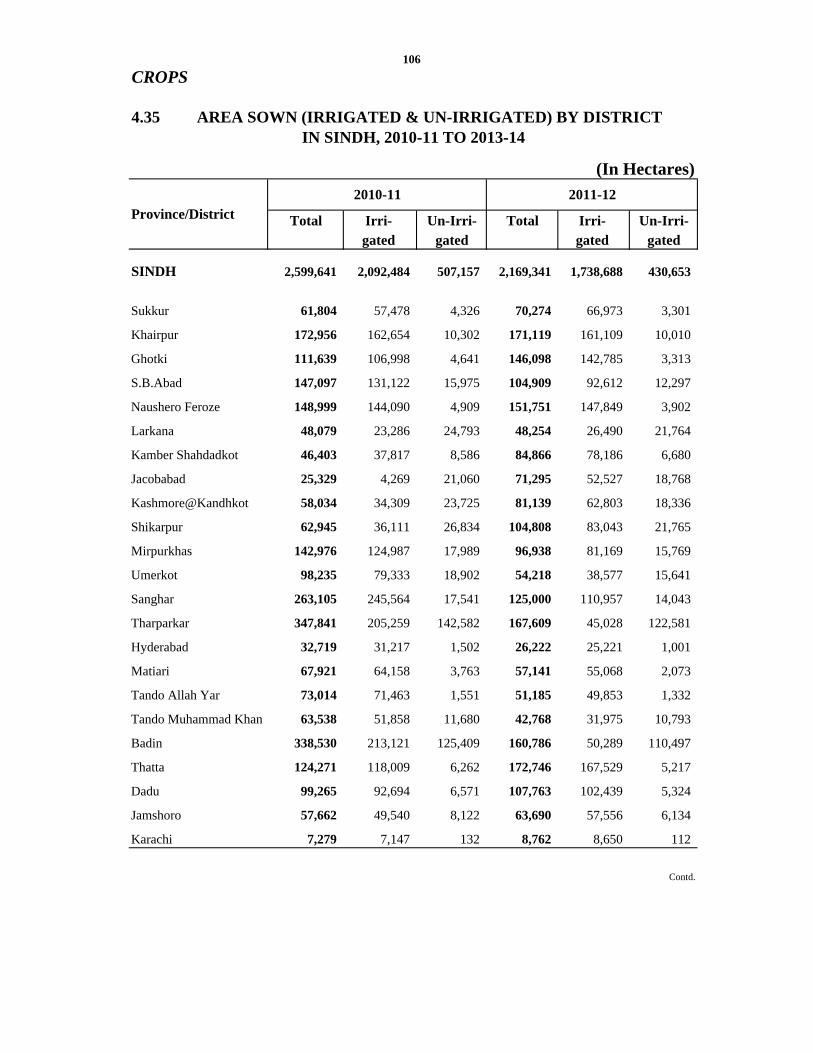
Total Irri- Un-Irri- Total Irri- Un-Irri-gated gated gated gated
SINDH 2,599,641 2,092,484 507,157 2,169,341 1,738,688 430,653
Sukkur 61,804 57,478 4,326 70,274 66,973 3,301
Khairpur 172,956 162,654 10,302 171,119 161,109 10,010
Ghotki 111,639 106,998 4,641 146,098 142,785 3,313
S.B.Abad 147,097 131,122 15,975 104,909 92,612 12,297
Naushero Feroze 148,999 144,090 4,909 151,751 147,849 3,902
Larkana 48,079 23,286 24,793 48,254 26,490 21,764
Kamber Shahdadkot 46,403 37,817 8,586 84,866 78,186 6,680
Jacobabad 25,329 4,269 21,060 71,295 52,527 18,768
Kashmore@Kandhkot 58,034 34,309 23,725 81,139 62,803 18,336
Shikarpur 62,945 36,111 26,834 104,808 83,043 21,765
Mirpurkhas 142,976 124,987 17,989 96,938 81,169 15,769
Umerkot 98,235 79,333 18,902 54,218 38,577 15,641
Sanghar 263,105 245,564 17,541 125,000 110,957 14,043
Tharparkar 347,841 205,259 142,582 167,609 45,028 122,581
Hyderabad 32,719 31,217 1,502 26,222 25,221 1,001
Matiari 67,921 64,158 3,763 57,141 55,068 2,073
Tando Allah Yar 73,014 71,463 1,551 51,185 49,853 1,332
Tando Muhammad Khan 63,538 51,858 11,680 42,768 31,975 10,793
Badin 338,530 213,121 125,409 160,786 50,289 110,497
Thatta 124,271 118,009 6,262 172,746 167,529 5,217
Dadu 99,265 92,694 6,571 107,763 102,439 5,324
Jamshoro 57,662 49,540 8,122 63,690 57,556 6,134
Karachi 7,279 7,147 132 8,762 8,650 112
Contd.
2010-11 2011-12
106
4.35 AREA SOWN (IRRIGATED & UN-IRRIGATED) BY DISTRICTIN SINDH, 2010-11 TO 2013-14
(In Hectares)
CROPS
Province/District

Total Irri- Un-Irri- Total Irri- Un-Irri-gated gated gated gated
SINDH 2,375,485 1,715,359 660,126 2,256,735 1,571,598 685,137
Sukkur 63,428 61,033 2,395 61,236 58,808 2,428
Khairpur 169,943 162,864 7,079 170,311 163,032 7,279
Ghotki 132,723 104,833 27,890 134,824 106,868 27,956
S.B.Abad 161,609 91,653 69,956 162,325 91,754 70,571
Naushero Feroze 157,089 147,169 9,920 156,341 146,042 10,299
Larkana 44,891 24,314 20,577 44,636 25,246 19,390
Kamber Shahdadkot 67,163 57,548 9,615 60,685 54,677 6,008
Jacobabad 24,063 8,030 16,033 22,364 9,066 13,298
Kashmore 45,892 34,353 11,539 37,861 33,119 4,742
Shikarpur 65,919 52,802 13,117 54,326 49,857 4,469
Mirpurkhas 164,312 132,724 31,588 154,726 126,781 27,945
Umerkot 85,963 49,605 36,358 76,926 48,576 28,350
Sanghar 225,310 126,409 98,901 216,589 125,145 91,444
Tharparkar 167,718 34,930 132,788 176,469 33,474 142,995
Hyderabad 30,841 26,178 4,663 30,448 26,035 4,413
Matiari 68,931 56,166 12,765 66,709 56,017 10,692
Tando Allah Yar 69,072 51,533 17,539 85,987 52,241 33,746
Tando Muhammad Khan 50,060 30,996 19,064 58,325 30,990 27,335
Badin 209,497 183,100 26,397 118,133 60,430 57,703
Thatta 176,411 165,671 10,740 180,170 163,907 16,263
Dadu 123,075 61,472 61,603 120,437 60,058 60,379
Jamshoro 67,005 48,418 18,587 61,762 46,242 15,520
Karachi 4,570 3,558 1,012 5,145 3,233 1,912
Source:- Crop Reporting Service Centre ( C. R .S .C ) Government of Sindh, Hyderabad.
2012-13 2013-14
107
4.35 AREA SOWN (IRRIGATED & UN-IRRIGATED) BY DISTRICTIN SINDH, 2010-11 TO 2013-14
(In Hectares)
CROPS
Province/District

(In Hectares)Total
CROPS Area Un- Sown Irrigated Total Canal Well Tubewell
SINDH 2,375,485 660,126 1,715,359 1,357,738 361 357,260
Sukkur 63,428 2,395 61,033 49,617 -- 11,416
Khairpur 169,943 7,079 162,864 136,233 -- 26,631
Ghotki 132,723 27,890 104,833 1,182 -- 103,651
S.B. Abad 161,609 69,956 91,653 80,021 -- 11,632
Nausheroferoze 157,089 9,920 147,169 134,263 -- 12,906
Larkana 44,891 20,577 24,314 17,369 -- 6,945
Jacobabad 24,063 16,033 8,030 4,773 9 3,248
Shikarpur 65,919 13,117 52,802 50,669 -- 2,133
Mirpurkhas 164,312 31,588 132,724 89,126 -- 43,598
Sanghar 225,310 98,901 126,409 123,560 -- 2,849
Umerkot 85,963 36,358 49,605 36,313 -- 13,292
Tharparkar 167,718 132,788 34,930 28,917 -- 6,013
Hyderabad 30,841 4,663 26,178 19,170 -- 7,008
Badin 209,497 26,397 183,100 182,365 -- 735
Thatta 176,411 10,740 165,671 159,133 -- 6,538
Dadu 123,075 61,603 61,472 54,407 215 6,850
Kashmore 45,892 11,539 34,353 26,708 16 7,629
Kambar Shahdadkot 67,163 9,615 57,548 55,676 -- 1,872
Jamshoro 67,005 18,587 48,418 40,165 121 8,132
Matari 68,931 12,765 56,166 15,749 -- 40,417
T.A Yar 69,072 17,539 51,533 28,517 -- 23,016
T.M Khan 50,060 19,064 30,996 21,346 -- 9,650
Karachi 4,570 1,012 3,558 2,459 -- 1,099
Cont.
108
2012-13
4.36 AREA SOWN (UN-IRRIGATED & IRRIGATED) BY DISTRICT AND MODE OF IRRIGATION IN SINDH, 2012-13 TO 2013-14
I R R I G A T E D
CROPS

(In Hectares)Total
CROPS Area Un- Sown Irrigated Total Canal Well Tubewell
SINDH 2,256,735 569,731 1,687,004 1,324,218 359 362,427
Sukkur 61,236 2,428 58,808 47,632 -- 11,176
Khairpur 170,311 7,279 163,032 135,672 -- 27,360
Ghotki 134,824 27,956 106,868 1,147 -- 105,721
S.B. Abad 162,325 70,571 91,754 80,021 -- 11,733
Nausheroferoze 156,341 10,299 146,042 132,920 -- 13,122
Larkana 44,636 19,390 25,246 16,674 -- 8,572
Jacobabad 22,364 13,298 9,066 4,582 9 4,475
Shikarpur 54,326 4,469 49,857 47,629 -- 2,228
Mirpurkhas 154,726 27,945 126,781 85,561 -- 41,220
Sanghar 216,589 91,444 125,145 122,324 -- 2,821
Umerkot 76,926 28,350 48,576 35,224 -- 13,352
Tharparkar 176,469 142,995 33,474 27,471 -- 6,003
Hyderabad 30,448 4,413 26,035 18,978 -- 7,057
Badin 233,539 57,703 175,836 175,070 -- 766
Thatta 180,170 16,263 163,907 157,064 -- 6,843
Dadu 120,437 60,379 60,058 52,231 214 7,613
Kashmore 37,861 4,742 33,119 25,373 16 7,730
Kambar Shahdadkot 60,685 6,008 54,677 52,892 -- 1,785
Jamshoro 61,762 15,520 46,242 38,558 120 7,564
Matari 66,709 10,692 56,017 15,592 -- 40,425
T.A Yar 85,987 33,746 52,241 28,232 -- 24,009
T.M Khan 58,325 27,335 30,990 21,133 -- 9,857
Karachi 5,145 1,912 3,233 2,238 -- 995
Source:- Crop Reporting Service centre ( C. R .S .C ) Government of Sindh, Hyderabad.
109
2013-14
4.36 AREA SOWN (UN-IRRIGATED & IRRIGATED) BY DISTRICT AND MODE OF IRRIGATION IN SINDH, 2012-13 TO 2013-14
I R R I G A T E D
CROPS

183.42
158.92
180.90
204.34
162.78
177.83
219.26
154.00
222.55
238.15
150 00
170.00
190.00
210.00
230.00
250.00
umbers
Quantum Index of Agriculture Production of Sindh, 2010‐11 to 2013‐14
(Base: 1985‐86 = 100)
155.32 148.25
50.00
70.00
90.00
110.00
130.00
150.00
2010‐11 2011‐12 2012‐13 2013‐14
Index Nu
Years
All Crops
Food Crops
Non Food Crops

2,260,088
1,843,881
2,617,338
1,500,000
2,000,000
2,500,000
3,000,000
Hectares
n in
M.Tons
Area and Production of Rice in Sindh, 2011‐12 to 2013‐14
635,819
511,091 745,539
‐
500,000
1,000,000
2011‐12 2012‐13 2013‐14
Area in H
Production
Years
Area
Production

3,761,468
3,598,690
4,002,113
2,500,000
3,000,000
3,500,000
4,000,000
4,500,000
Hectares
n in
M.Tons
Area and Production of Wheat in Sindh, 2011‐12 to 2013‐14
1,049,175
1,058,400
1,121,636
‐
500,000
1,000,000
1,500,000
2,000,000
2011‐12 2012‐13 2013‐14
Area in
Production
Years
Area Production
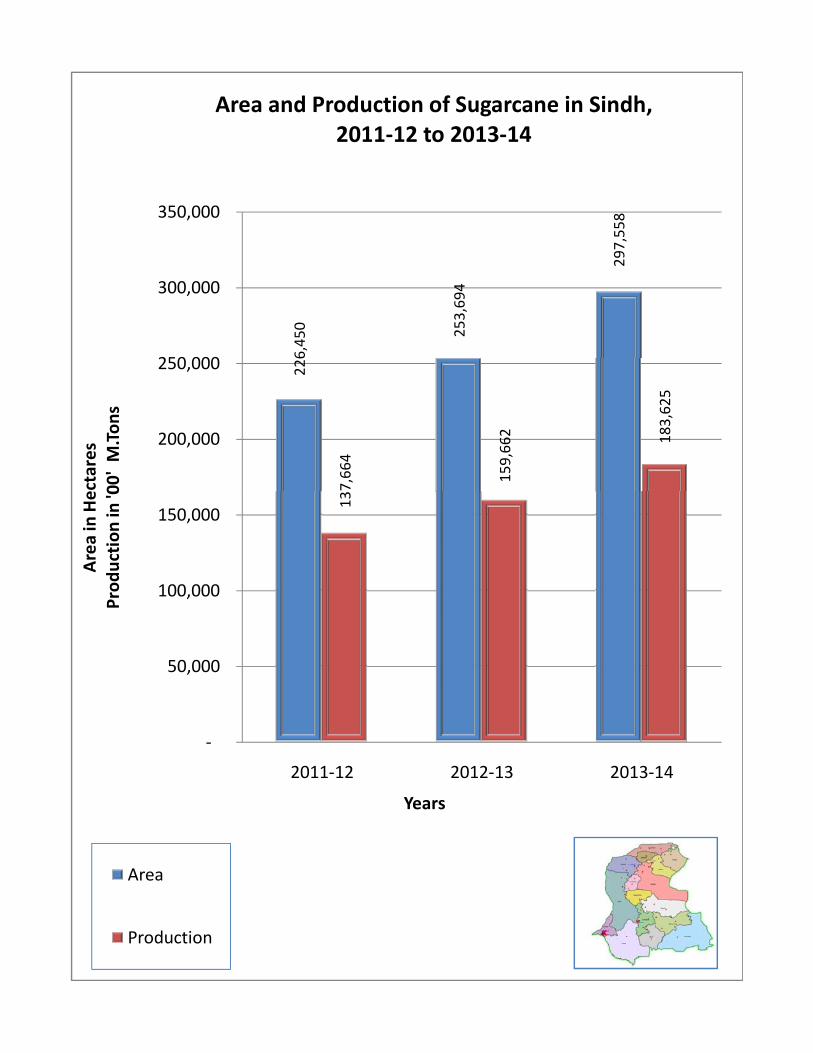
226,450
253,694
297,558
7,664
159,662
183,625
200,000
250,000
300,000
350,000
ectares
00' M.Tons
Area and Production of Sugarcane in Sindh, 2011‐12 to 2013‐14
13
‐
50,000
100,000
150,000
2011‐12 2012‐13 2013‐14
Area in He
Production in
'0
Years
Area
Production
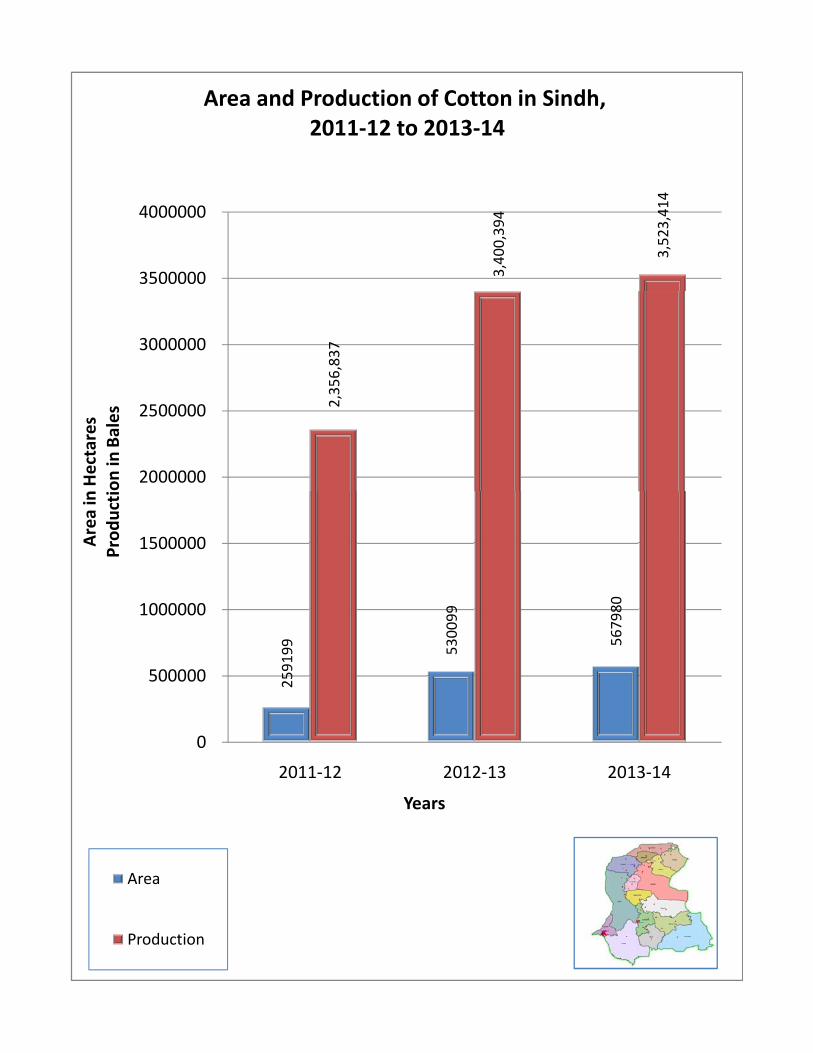
2,356,837
3,400,394
3,523,414
2000000
2500000
3000000
3500000
4000000
n Hectares
on in
Bales
Area and Production of Cotton in Sindh, 2011‐12 to 2013‐14
259199
530099
567980
0
500000
1000000
1500000
2011‐12 2012‐13 2013‐14
Area in
Producti
Years
Area
Production

5.00 FISHERY, FORESTRY
LIVESTOCK, FOOD GRAINS
AND STORAGE
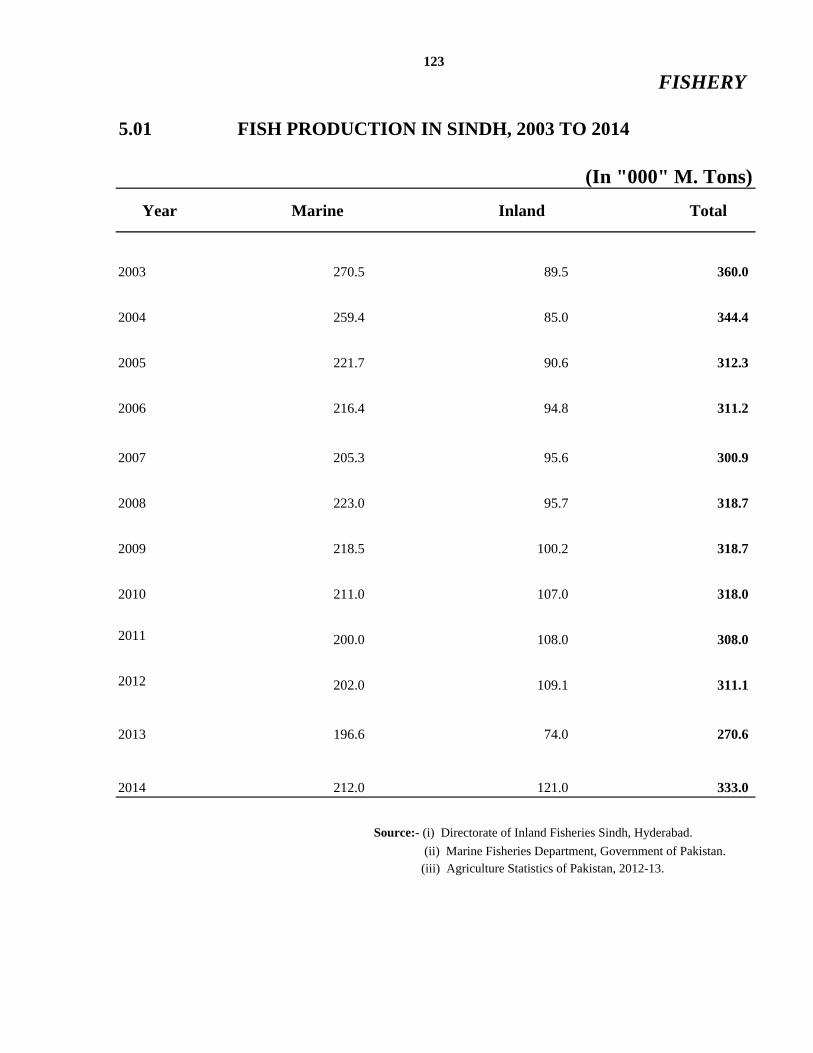
(In "000" M. Tons)
Year Marine Inland Total
2003 270.5 89.5 360.0
2004 259.4 85.0 344.4
2005 221.7 90.6 312.3
2006 216.4 94.8 311.2
2007 205.3 95.6 300.9
2008 223.0 95.7 318.7
2009 218.5 100.2 318.7
2010 211.0 107.0 318.0
2011 200.0 108.0 308.0
2012 202.0 109.1 311.1
2013 196.6 74.0 270.6
2014 212.0 121.0 333.0
123
5.01 FISH PRODUCTION IN SINDH, 2003 TO 2014
FISHERY
Source:- (i) Directorate of Inland Fisheries Sindh, Hyderabad.
(ii) Marine Fisheries Department, Government of Pakistan. (iii) Agriculture Statistics of Pakistan, 2012-13.
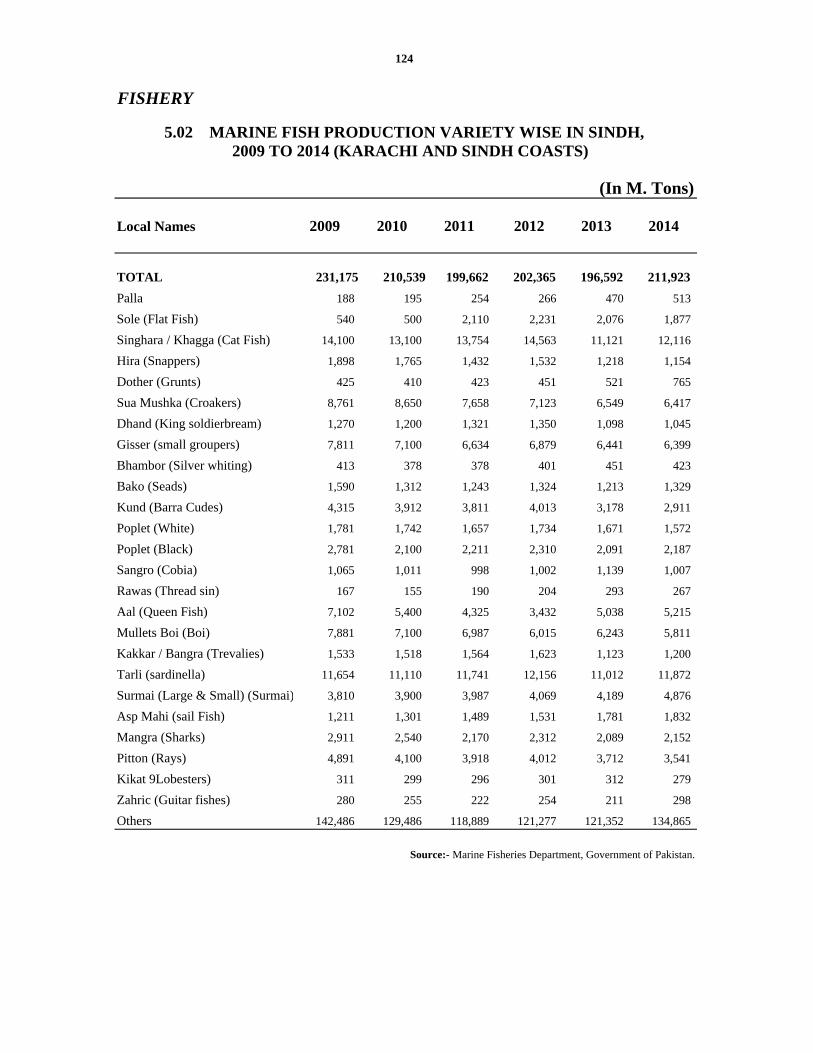
Local Names 2009 2010 2011 2012 2013 2014
TOTAL 231,175 210,539 199,662 202,365 196,592 211,923
Palla 188 195 254 266 470 513
Sole (Flat Fish) 540 500 2,110 2,231 2,076 1,877
Singhara / Khagga (Cat Fish) 14,100 13,100 13,754 14,563 11,121 12,116
Hira (Snappers) 1,898 1,765 1,432 1,532 1,218 1,154
Dother (Grunts) 425 410 423 451 521 765
Sua Mushka (Croakers) 8,761 8,650 7,658 7,123 6,549 6,417
Dhand (King soldierbream) 1,270 1,200 1,321 1,350 1,098 1,045
Gisser (small groupers) 7,811 7,100 6,634 6,879 6,441 6,399
Bhambor (Silver whiting) 413 378 378 401 451 423
Bako (Seads) 1,590 1,312 1,243 1,324 1,213 1,329
Kund (Barra Cudes) 4,315 3,912 3,811 4,013 3,178 2,911
Poplet (White) 1,781 1,742 1,657 1,734 1,671 1,572
Poplet (Black) 2,781 2,100 2,211 2,310 2,091 2,187
Sangro (Cobia) 1,065 1,011 998 1,002 1,139 1,007
Rawas (Thread sin) 167 155 190 204 293 267
Aal (Queen Fish) 7,102 5,400 4,325 3,432 5,038 5,215
Mullets Boi (Boi) 7,881 7,100 6,987 6,015 6,243 5,811
Kakkar / Bangra (Trevalies) 1,533 1,518 1,564 1,623 1,123 1,200
Tarli (sardinella) 11,654 11,110 11,741 12,156 11,012 11,872
Surmai (Large & Small) (Surmai) 3,810 3,900 3,987 4,069 4,189 4,876
Asp Mahi (sail Fish) 1,211 1,301 1,489 1,531 1,781 1,832
Mangra (Sharks) 2,911 2,540 2,170 2,312 2,089 2,152
Pitton (Rays) 4,891 4,100 3,918 4,012 3,712 3,541
Kikat 9Lobesters) 311 299 296 301 312 279
Zahric (Guitar fishes) 280 255 222 254 211 298
Others 142,486 129,486 118,889 121,277 121,352 134,865
Source:- Marine Fisheries Department, Government of Pakistan.
FISHERY
124
5.02 MARINE FISH PRODUCTION VARIETY WISE IN SINDH, 2009 TO 2014 (KARACHI AND SINDH COASTS)
(In M. Tons)
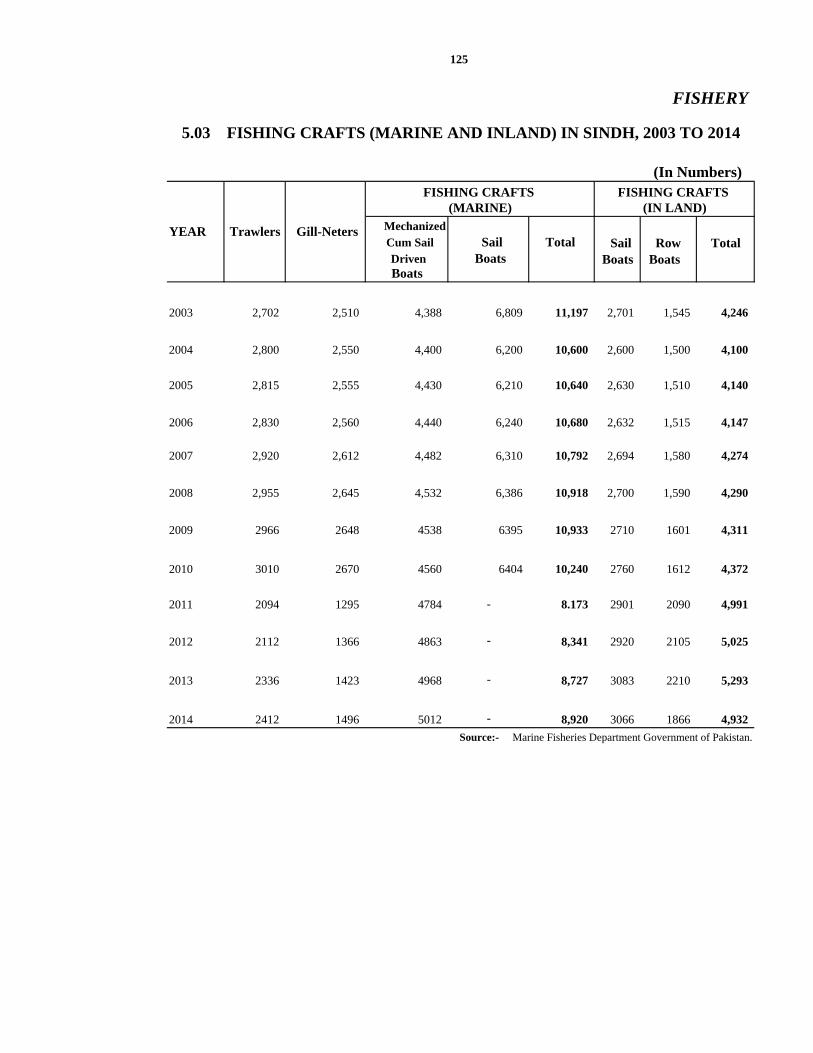
FISHERY
FISHING CRAFTS (IN LAND)
Mechanized Cum Sail Sail Total Sail Row Total
Driven Boats Boats BoatsBoats
2003 2,702 2,510 4,388 6,809 11,197 2,701 1,545 4,246
2004 2,800 2,550 4,400 6,200 10,600 2,600 1,500 4,100
2005 2,815 2,555 4,430 6,210 10,640 2,630 1,510 4,140
2006 2,830 2,560 4,440 6,240 10,680 2,632 1,515 4,147
2007 2,920 2,612 4,482 6,310 10,792 2,694 1,580 4,274
2008 2,955 2,645 4,532 6,386 10,918 2,700 1,590 4,290
2009 2966 2648 4538 6395 10,933 2710 1601 4,311
2010 3010 2670 4560 6404 10,240 2760 1612 4,372
2011 2094 1295 4784 - 8.173 2901 2090 4,991
2012 2112 1366 4863 - 8,341 2920 2105 5,025
2013 2336 1423 4968 - 8,727 3083 2210 5,293
2014 2412 1496 5012 - 8,920 3066 1866 4,932
Source:- Marine Fisheries Department Government of Pakistan.
FISHING CRAFTS
125
YEAR
5.03 FISHING CRAFTS (MARINE AND INLAND) IN SINDH, 2003 TO 2014
(In Numbers)
Trawlers Gill-Neters
(MARINE)

(In Metric Tons)
Fish NO. OF FISHERMEN NO. OF BOATS
Production
2003 89,523 29,274 17,103 46,377 2,155 2,291 4,446
2004 85,047 29,401 17,219 46,620 2,155 2,291 4,446
2005 90,575 30,151 17,653 47,804 2,312 2,182 4,494
2006 94,790 31,767 19,258 51,025 1,002 2,465 3,467
2007 95,565 25,711 10,017 35,728 2,360 2,085 4,445
2008 95,669 27,873 15,049 42,922 2,580 4,067 6,647
2009 100,227 27,873 15,049 42,922 2,580 4,067 6,647
2010 107,129 27,873 15,049 42,922 2,580 4,067 6,647
2011 108,129 23,650 22,560 46,210 1,704 4,874 6,578
2012 109,095 25,047 23,049 48,096 1,730 4,929 6,659
2013 73,981 27,726 26,002 53,728 2,586 4,957 7,543
2014 120,665 29,632 15,332 44,964 2,586 4,957 7,543
Source:- Directorate of Inland Fisheries Sindh, Hyderabad.
YEAR
126
5.04 INLAND FISHERIES STATISTICS IN SINDH, 2003 TO 2014
FISHERY
Full time Part time Total Sail Row Total

5.05 INLAND FISHERIES STATISTICS BY DISTRICT
(In Metric Tons) Fish NO. OF FISHERMEN NO. OF BOATS
Production Full time Part time Total Sail Row Total
SINDH 73,981 27,726 26,002 53,728 2,586 4,957 7,543 Khairpur 1030 190 189 379 6 38 44Jacobabad 3498 225 133 358 5 43 48Sukkur 6291 1570 580 2150 40 222 262Shikarpur 5550 770 530 1300 80 25 105S.B.Abad 1250 730 365 1095 410 200 610Naushero Feroze 410 1362 2271 3633 105 410 515Larkana 1218 428 1646 2074 166 375 541Sanghar 260 550 215 765 47 910 957Mirpurkhas 19 55 44 99 0 10 10Dadu 3290 6420 3180 9600 0 362 362Hyderabad 5407 365 675 1040 520 126 646Badin 4891 3080 120 3200 22 305 327Thatta 12321 8368 14108 22476 923 1178 2101Ghotki 5422 84 304 388 5 24 29Tharparkar 6 13 4 17 0 0 0Kashmore 5993 1613 326 1939 15 112 127Kamber Shahdadkot 5050 410 200 610 9 130 139Jamshoro 11182 1212 925 2137 223 381 604Matiari 510 96 134 230 0 86 86T.M. Khan 111 180 35 215 10 20 30T. Allahyar 270 0 10 10 0 0 0Umer Kot 2 5 8 13 0 0 0
SINDH 120,665 29,632 15,332 44,964 2,586 4,957 7,543 Khairpur 1838 190 160 350 6 38 44Jacobabad 1020 225 133 358 5 43 48Sukkur 17000 1370 465 1835 40 222 262Shikarpur 9130 770 280 1050 80 25 105S.B.Abad 4000 730 365 1095 410 200 610Naushero Feroze 1017 1050 800 1850 105 410 515Larkana 4500 428 970 1398 166 375 541Sanghar 3000 580 215 795 47 910 957Mirpurkhas 23 55 44 99 0 10 10Dadu 4015 6300 3200 9500 0 362 362Hyderabad 5812 415 675 1090 520 126 646Badin 6906 3650 120 3770 22 305 327Thatta 17204 8460 6109 14569 923 1178 2101Ghotki 9500 84 104 188 5 24 29Tharparkar 6 13 4 17 0 0 0Kashmore 8100 1800 326 2126 15 112 127Kamber Shahdadkot 5816 440 250 690 9 130 139Jamshoro 16300 2700 925 3625 223 381 604Matiari 5008 136 134 270 0 86 86T.M. Khan 167 230 35 265 10 20 30T. Allahyar 301 0 10 10 0 0 0Umer Kot 2 6 8 14 0 0 0
Source:- Directorate of Inland Fisheries Sindh, Hyderabad.
Province/District
2013
127
FISHERY
IN SINDH, 2013 TO 2014
2014

(In "000")
TYPE 1986 1996 2006
Cattele 3,874 5,464 6,925
Buffaloes 3,220 5,615 7,340
Sheep 2,616 3,710 3,959
Goats 6,755 9,734 12,572
Poultry 8,799 11,549 14,136
Camels 218 225 278
Horses 76 63 45
Mules 5 12 20
Asses 500 694 1,005
Source :- Agriculture Statistics of Pakistan.
128
5.06 NUMBER OF LIVESTOCK IN SINDH, 1986, 1996 & 2006 (CENSUS)
LIVESTOCK
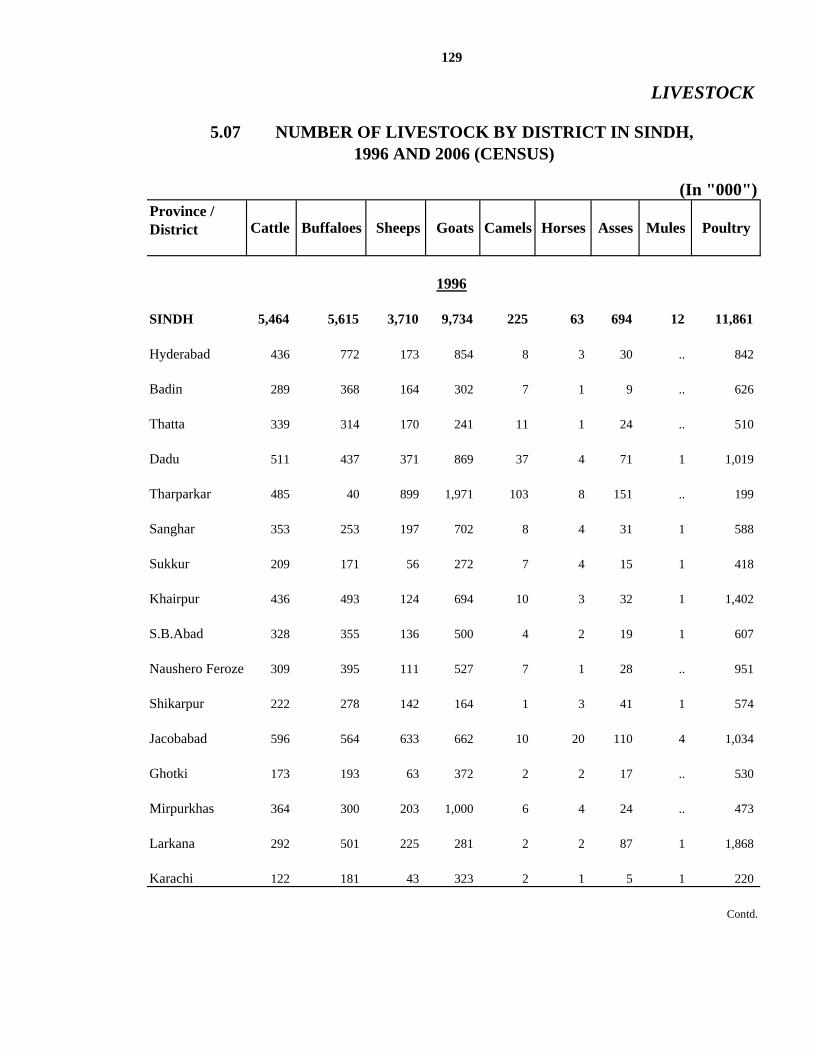
(In "000")Province / District
SINDH 5,464 5,615 3,710 9,734 225 63 694 12 11,861
Hyderabad 436 772 173 854 8 3 30 .. 842
Badin 289 368 164 302 7 1 9 .. 626
Thatta 339 314 170 241 11 1 24 .. 510
Dadu 511 437 371 869 37 4 71 1 1,019
Tharparkar 485 40 899 1,971 103 8 151 .. 199
Sanghar 353 253 197 702 8 4 31 1 588
Sukkur 209 171 56 272 7 4 15 1 418
Khairpur 436 493 124 694 10 3 32 1 1,402
S.B.Abad 328 355 136 500 4 2 19 1 607
Naushero Feroze 309 395 111 527 7 1 28 .. 951
Shikarpur 222 278 142 164 1 3 41 1 574
Jacobabad 596 564 633 662 10 20 110 4 1,034
Ghotki 173 193 63 372 2 2 17 .. 530
Mirpurkhas 364 300 203 1,000 6 4 24 .. 473
Larkana 292 501 225 281 2 2 87 1 1,868
Karachi 122 181 43 323 2 1 5 1 220
Contd.
Sheeps Goats Camels Horses
1996
Asses Mules Poultry
129
LIVESTOCK
5.07 NUMBER OF LIVESTOCK BY DISTRICT IN SINDH, 1996 AND 2006 (CENSUS)
Cattle Buffaloes
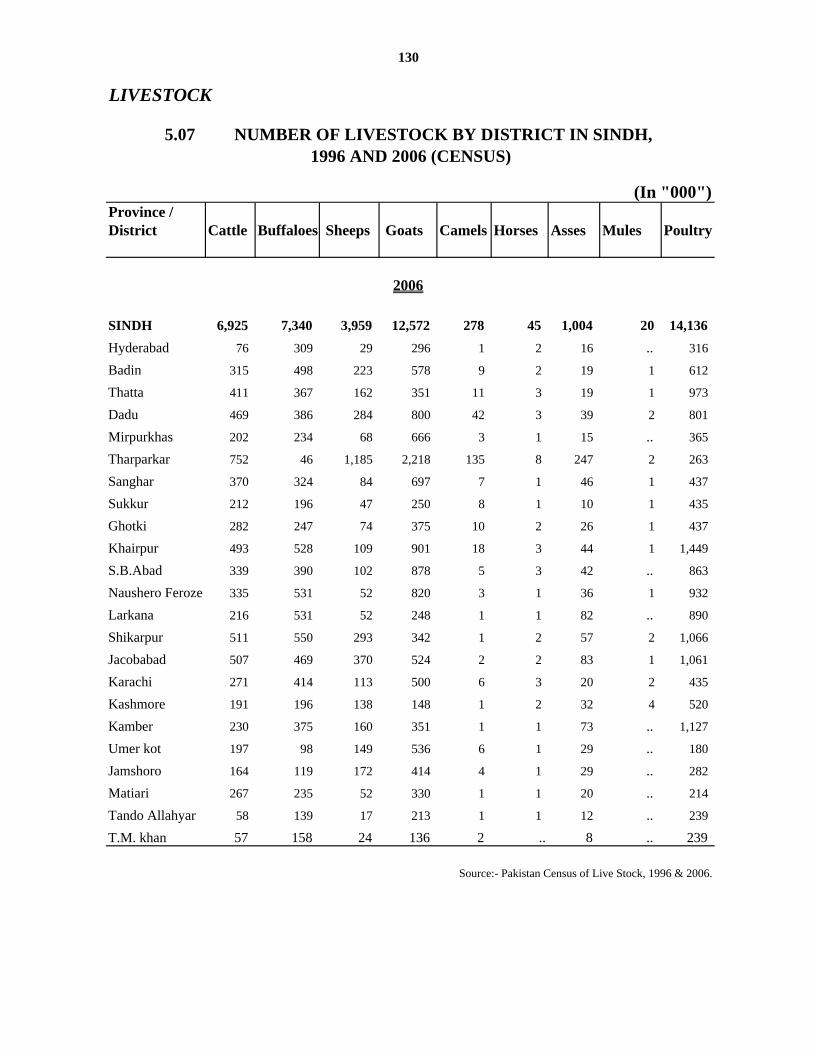
(In "000")Province / District Cattle Buffaloes Sheeps Goats Camels Horses Asses Mules Poultry
SINDH 6,925 7,340 3,959 12,572 278 45 1,004 20 14,136
Hyderabad 76 309 29 296 1 2 16 .. 316
Badin 315 498 223 578 9 2 19 1 612
Thatta 411 367 162 351 11 3 19 1 973
Dadu 469 386 284 800 42 3 39 2 801
Mirpurkhas 202 234 68 666 3 1 15 .. 365
Tharparkar 752 46 1,185 2,218 135 8 247 2 263
Sanghar 370 324 84 697 7 1 46 1 437
Sukkur 212 196 47 250 8 1 10 1 435
Ghotki 282 247 74 375 10 2 26 1 437
Khairpur 493 528 109 901 18 3 44 1 1,449
S.B.Abad 339 390 102 878 5 3 42 .. 863
Naushero Feroze 335 531 52 820 3 1 36 1 932
Larkana 216 531 52 248 1 1 82 .. 890
Shikarpur 511 550 293 342 1 2 57 2 1,066
Jacobabad 507 469 370 524 2 2 83 1 1,061
Karachi 271 414 113 500 6 3 20 2 435
Kashmore 191 196 138 148 1 2 32 4 520
Kamber 230 375 160 351 1 1 73 .. 1,127
Umer kot 197 98 149 536 6 1 29 .. 180
Jamshoro 164 119 172 414 4 1 29 .. 282
Matiari 267 235 52 330 1 1 20 .. 214
Tando Allahyar 58 139 17 213 1 1 12 .. 239
T.M. khan 57 158 24 136 2 .. 8 .. 239
Source:- Pakistan Census of Live Stock, 1996 & 2006.
130
LIVESTOCK
2006
1996 AND 2006 (CENSUS)5.07 NUMBER OF LIVESTOCK BY DISTRICT IN SINDH,

(In Numbers)
2004-05 301,674 253,150 351,505 547,629 298,621 214,341 551,360 878,654
2005-06 309,931 225,553 487,413 686,575 312,142 221,217 519,711 896,521
2006-07 248,587 191,062 422,838 604,366 316,626 251,742 516,828 931,217
2007-08 320,832 241,321 424,879 680,100 397,261 341,276 587,944 998,773
2008-09 351,655 248,469 492,694 780,242 372,941 321,637 602,991 996,926
2009-10 359,575 247,912 506,446 776,092 381,976 319,716 636,594 995,997
2010-11 316,425 227,421 524,128 859,051 402,716 381,605 661,211 966,932
2011-12 78,938 55,790 160,176 201,099 457,221 376,621 631,212 956,932
2012-13 189,711 98,685 283,930 506,487 -- -- -- --
2013-14 192,543 104,047 292,064 504,159 -- -- -- --
Source:- Directorate of Animal Husbandry Sindh, Hyderabad.
Buffaloes Sheeps
5.08 LIVESTOCK SLAUGHTERED IN SINDH, 2004-05 TO 2013-14
Goats Cattle Buffaloes Sheeps Goats YEAR
131
LIVESTOCK
ANIMAL SLAUGHTERED INSIDE ANIMAL SLAUGHTERED OUTSIDE
Cattle

Province/District Cattle Buffaloes Sheeps Goats
SINDH 189,711 98,685 283,930 506,487
Khairpur 8,096 5,459 14,524 30,940
Jacobabad 2,879 3,939 4,351 8,253
Kashmore 2,643 4,265 8,712 14,418
Sukkur 7,730 4,842 11,845 31,525
Ghotki 4,083 3,789 6,735 9,842
Shikarpur 3,045 3,929 6,196 8,362
S.B. Abad 6,936 5,805 7,185 23,553
Naushero Feroze 5,953 4,299 7,442 13,495
Larkana 7,037 4,333 10,985 28,502
Kamber Shahdadkot 2,782 4,297 10,762 17,695
Sanghar 8,402 4,292 7,648 20,545
Tharparkar @ Mithi -- 2,945 6,804 10,202
Mirpurkhas 10,610 5,201 7,095 32,438
Umer Kot 6,398 4,811 7,119 15,752
Dadu 6,113 4,219 52,845 33,325
Jamshoro 4,353 5,410 10,099 29,495
Hyderabad 65,973 4,687 8,019 45,352
Matiari 5,902 3,938 8,263 18,372
Badin 8,371 4,599 54,755 21,472
Tando Allah Yar 7,510 4,396 15,018 10,018
Thatta 10,109 4,919 10,253 22,908
Tando Mohd Khan 4,786 4,311 7,275 60,023
Karachi -- -- -- --
Note: Data of slaughtered inside and outside both included.
(-- ) Data not available
Source: -Directorate of Animal Husbandry Sindh, Hyderabad.
132
ANIMAL SLAUGHTERED
5.09 LIVESTOCK SLAUGHTERED BY DISTRICT IN SINDH, 2012-13 to 2013-14
2012-13
LIVESTOCK
(In Numbers)

Province/District Cattle Buffaloes Sheeps Goats
SINDH 192,543 104,047 292,064 504,151
Khairpur 9,120 5,630 15,125 31,810
Jacobabad 3,110 4,210 4,920 9,120
Kashmore 3,110 4,621 9,110 15,135
Sukkur 4,192 4,242 7,132 10,121
Ghotki 4,131 4,133 6,931 10,240
Shikarpur 3,190 4,323 6,510 8,910
S.B. Abad 7,110 6,120 7,831 24,135
Naushero Feroze 6,110 4,921 7,935 14,120
Larkana 7,140 4,532 11,310 29,120
Kamber Shahdadkot 3,121 4,390 11,255 18,410
Sanghar 8,910 4,610 8,120 21,610
Tharparkar @ Mithi - 3,120 7,130 11,350
Mirpurkhas 11,230 5,603 7,320 33,431
Umer Kot 6,790 5,110 7,830 16,120
Dadu 6,392 4,620 55,391 34,401
Jamshoro 4,510 5,920 11,230 32,110
Hyderabad 66,542 4,930 8,220 46,425
Matiari 6,130 4,220 8,940 19,340
Badin 8,630 4,620 55,229 22,341
Tando Allah Yar 7,615 4,535 16,030 11,321
Thatta 10,530 5,125 10,930 23,341
Tando Mohd Khan 4,930 4,512 7,635 61,240
Karachi - - - -
Note: Data of slaughtered inside and outside both included.
(-- ) Data not available
2013-14
Source: -Directorate of Animal Husbandry Sindh, Hyderabad.
133
LIVESTOCK
5.09 LIVESTOCK SLAUGHTERED BY DISTRICT IN SINDH, 2012-13 TO 2013-14
(In Numbers)ANIMAL SLAUGHTERED

6.00 MANUFACTURING

145
EXPLANATORY NOTE
MANUFACTURING INDUSTRIES This Sector covers the Statistics on the following. i) Annual Census of Manufacturing Industries (C.M.I).
ii) Monthly Survey of Industrial Production and Employment.
ANNUAL CENSUS OF MANUFACTURING INDUSTRIES (C.M.I.) In this sector industrial data relating to fixed assets, employment, employment cost,
industrial cost, value of production and gross census value added for registered manufacturing
establishments is provided.
Census of manufacturing industries is conducted annually as a regular feature under
industrial statistics act, 1942 through joint efforts of Pakistan Bureau of Statistics, Government
of Pakistan, Provincial Directorate of Industries and Provincial Bureau of Statistics, with the
following distribution of work.
Pakistan Bureau of Statistics
a) Planning of census in collaborationwith Provincial Bureaus of Statistics and
Directorates of Industries.
b) Preparation of questionnaire, tabulation plan and editing instructions. c) Preparation and publication of C.M.I tables on national level. DIRECTORATE OF INDUSTRIES, SINDH a) Printing of the questionnaire. b) Notification of the questionnaire in the government gazette. c) Mailing out of questionnaire. d) Collection of filled CMI returns.

146 e) Preliminary editing of CMI returns. f) Maintenance of up-to-date list of manufacturing establishments. Bureau of Statistics, Sindh a) Scrutiny, editing and coding of C.M.I returns. b) Data Processing of CMI returns. c) Preparation and publication of provincial summary tables. Scope & Coverage All establishments engaged in manufacturing or repairing activities whether for
whole or part of the year and registered under the factories Act,1934 are covered under the
Census. The Defence andGovernment workshopsthough engaged in manufacturing activities and
registered under said Act are excluded.
Definitions Definitions of important terms used in C.M.I. are as under. i)Registered Factories An establishment is said to be registered under section 2 (j) of factories act, 1934
(amendment of 1973) if ten or more workers are working on any day of the preceding
twelve months and in any part of which manufacturing process is being carried on with
the aid of power or is ordinarily so carried on but does not include mines subject, which
comes under the operation of mines act, 1923.
ii)Gross Value of Fixed Assets It includes the gross value of land, building, machinery and other fixed assets i.e.
equipment, vehicles, furniture etc. at the end of the year.
iii)Employment It includes average number of persons engaged in manufacturing activity during a
month of the census year.

147
iv)Employment Cost It includes wages and salaries, cash and non-cash benefits and the amount paid to employees. v)Industrial Cost It includes cost of raw materials, fuel and electricity consumed and payments to
others for work done and repair and maintenance of the equipment.
vi)Gross Value of Industrial Production It includes the value of products and by-products, receipt from industrial waste, receipts
from industrial work done and services rendered to others, sale of electricity and value of
"Net Work in Process." the value of products and by-products includes indirect taxes and
exclude transport cost outside the factory gate.
vii)Gross Value Added This is worked out by subtracting industrial cost from the gross value of industrial production. Limitations of C.M.I i) The mailing list used for the census may not be up-to-date. ii) Reported data suffers from reporting errors and inconsistencies which were corrected on
the basis of available supplementary information and past trends.
iii) Census results become available with a time lag of five years chiefly due to the time
taken in collection of filled-in returns from establishments.
iv) Size and nature of non-response varies from year to year.
MONTHLY SURVEY OF INDUSTRIAL PRODUCTION & EMPLOYMENT (M.I.P.E.)
Statistical tables included in this sector contain data on production in respect of 96
items manufactured by selected large-scale industries in Sindh. These industries accounted
for about 69% of "total value added" in manufacturing sector in the province.
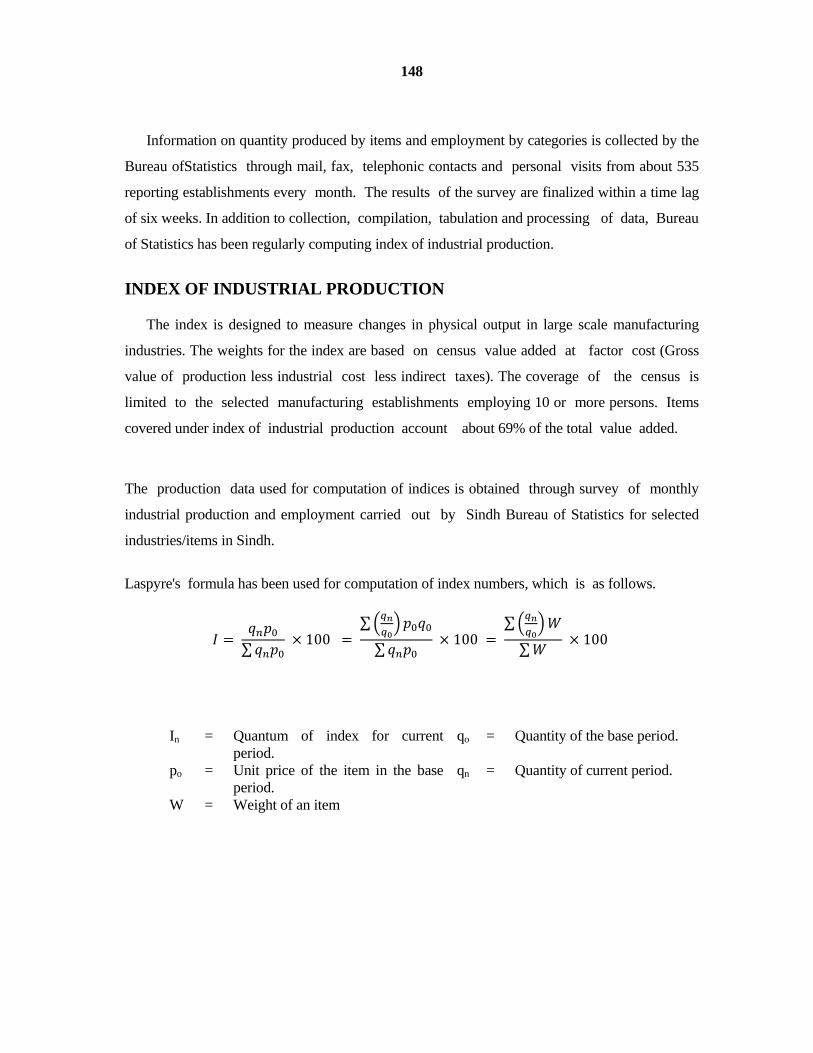
148 Information on quantity produced by items and employment by categories is collected by the
Bureau ofStatistics through mail, fax, telephonic contacts and personal visits from about 535
reporting establishments every month. The results of the survey are finalized within a time lag
of six weeks. In addition to collection, compilation, tabulation and processing of data, Bureau
of Statistics has been regularly computing index of industrial production.
INDEX OF INDUSTRIAL PRODUCTION The index is designed to measure changes in physical output in large scale manufacturing
industries. The weights for the index are based on census value added at factor cost (Gross
value of production less industrial cost less indirect taxes). The coverage of the census is
limited to the selected manufacturing establishments employing 10 or more persons. Items
covered under index of industrial production account about 69% of the total value added.
The production data used for computation of indices is obtained through survey of monthly
industrial production and employment carried out by Sindh Bureau of Statistics for selected
industries/items in Sindh.
Laspyre's formula has been used for computation of index numbers, which is as follows.
∑
100 ∑
∑ 100
∑
∑ 100
In = Quantum of index for current period.
qo = Quantity of the base period.
po = Unit price of the item in the base period.
qn = Quantity of current period.
W = Weight of an item
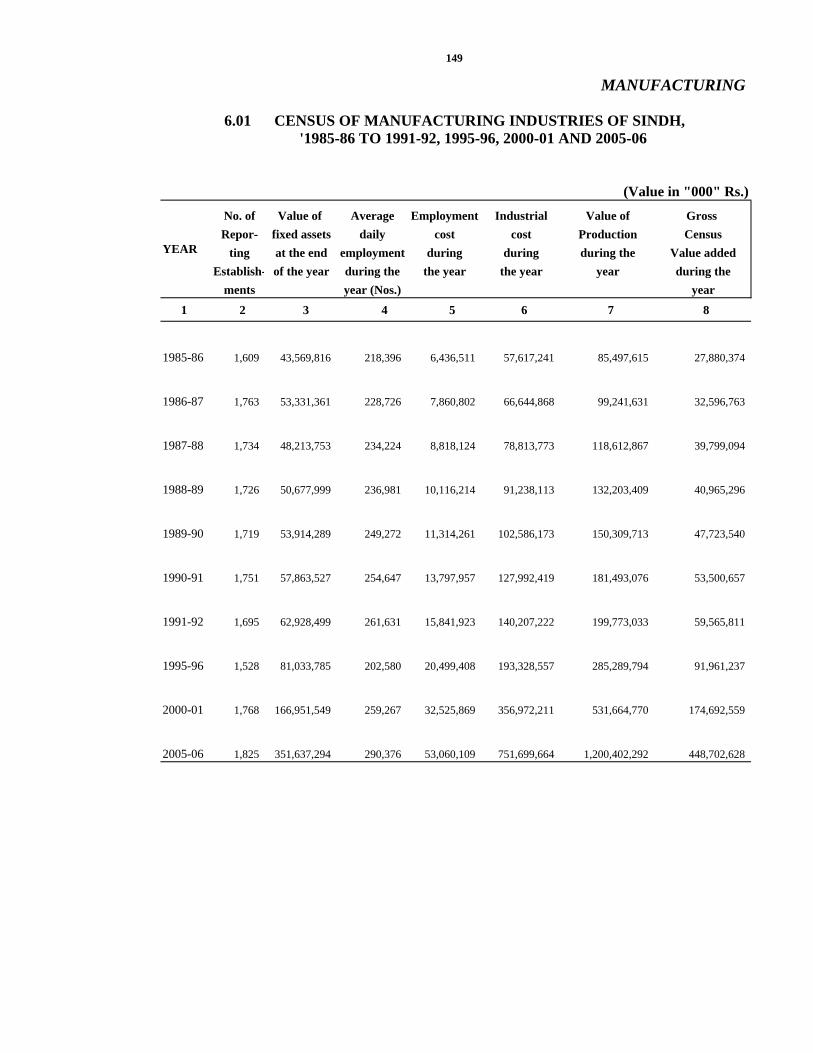
MANUFACTURING
(Value in "000" Rs.)
No. of Value of Average Employment Industrial Value of Gross
Repor- fixed assets daily cost cost Production Census
ting at the end employment during during during the Value added
Establish- of the year during the the year the year year during the
ments year (Nos.) year
1 2 3 4 5 6 7 8
1985-86 1,609 43,569,816 218,396 6,436,511 57,617,241 85,497,615 27,880,374
1986-87 1,763 53,331,361 228,726 7,860,802 66,644,868 99,241,631 32,596,763
1987-88 1,734 48,213,753 234,224 8,818,124 78,813,773 118,612,867 39,799,094
1988-89 1,726 50,677,999 236,981 10,116,214 91,238,113 132,203,409 40,965,296
1989-90 1,719 53,914,289 249,272 11,314,261 102,586,173 150,309,713 47,723,540
1990-91 1,751 57,863,527 254,647 13,797,957 127,992,419 181,493,076 53,500,657
1991-92 1,695 62,928,499 261,631 15,841,923 140,207,222 199,773,033 59,565,811
1995-96 1,528 81,033,785 202,580 20,499,408 193,328,557 285,289,794 91,961,237
2000-01 1,768 166,951,549 259,267 32,525,869 356,972,211 531,664,770 174,692,559
2005-06 1,825 351,637,294 290,376 53,060,109 751,699,664 1,200,402,292 448,702,628
YEAR
149
'1985-86 TO 1991-92, 1995-96, 2000-01 AND 2005-066.01 CENSUS OF MANUFACTURING INDUSTRIES OF SINDH,

(Value in "000" Rs.) No. of Value of Changes Average daily
Major Industry Reporting fixed assets in stocks employment
Groups Establish- at the end during during the
ments of the year the year year (Nos.)
1 2 3 4 5
ALL INDUSTRIES 1,825 351,637,294 26,047,117 290,376
Food Manufacturing 556 38,123,435 1,234,989 39,015
Beverages 13 1,595,885 262,486 2,319
Tobacco 3 1,382,842 217,926 1,376
Textile 447 100,494,868 3,403,887 106,761
Wearing Apparel (Except F.wr.) 165 5,518,169 1,080,207 25,746
Leather & Leather Products 30 961,505 41,351 3,937
including footwear
Wood & Wood Products 19 1,595,320 350,408 1,649
Furniture 17 439,366 150,082 1,671
Paper and Paper Products 29 1,629,627 - 6790 1,547
Printing, Pub. & Allied Ind. 37 6,634,007 95,067 3,490
Drugs and Pharma. Prod. 78 12,921,602 983,223 18,810
Industrial Chemicals 10 34,581,510 3,279,702 4,222
Other Chemical Products 56 2,593,329 259,567 6,626
Petroleum & Misc. Prod. of Petroleum 11 4,651,452 4,023,780 2,052
Rubber Product 5 969,119 - 443 817
Plastic Product (N.E.C) 46 5,539,829 980,702 2,695
Pottery China & Earthen-wear, 11 1,927,513 145,282 2,489
Glass and Glass Products
Other Non Metallic Mineral Prod. 35 31,508,805 548,065 5,720
Iron, Steel & Non-ferous Metal 44 18,411,691 796,856 20,183
Fabricated Metal Prod. Ex. Mach. 42 1,835,827 492,392 4,345
Non-Electrical Machinery 43 2,799,507 406,793 7,408
Electrical Machinery and Supplies 17 3,144,164 580,589 3,273
Transport and Equipments 69 16,284,266 5,078,838 10,994
Scientific, Potographic & Optical. 4 12,519 - 549 158
Handicrafts, Sports & Other 6 298,623 51,022 1,325
All others 32 55,782,514 1,591,685 11,748
Contd.
150
6.02 MAJOR INDUSTRY GROUPS FOR CENSUS OF MANUFACTURING INDUSTRIES (C.M.I) IN SINDH, 2005-06
MANUFACTURING
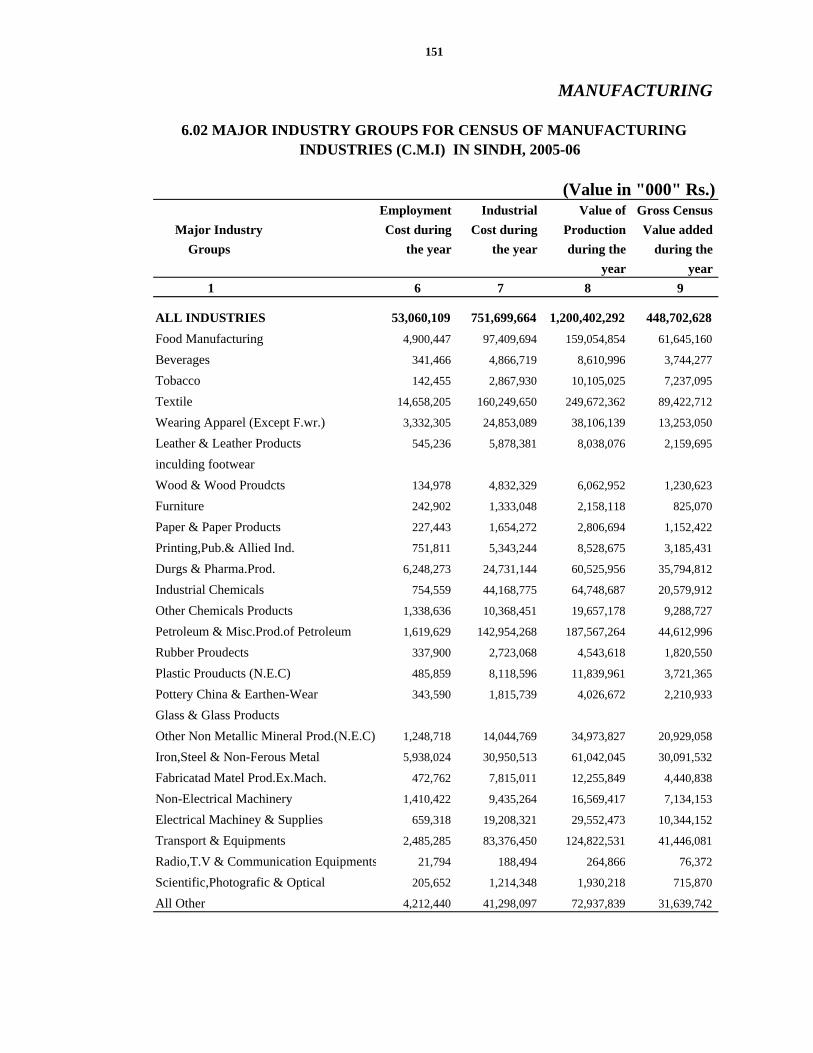
MANUFACTURING
(Value in "000" Rs.)Employment Industrial Value of Gross Census
Major Industry Cost during Cost during Production Value added
Groups the year the year during the during the
year year
1 6 7 8 9
ALL INDUSTRIES 53,060,109 751,699,664 1,200,402,292 448,702,628
Food Manufacturing 4,900,447 97,409,694 159,054,854 61,645,160
Beverages 341,466 4,866,719 8,610,996 3,744,277
Tobacco 142,455 2,867,930 10,105,025 7,237,095
Textile 14,658,205 160,249,650 249,672,362 89,422,712
Wearing Apparel (Except F.wr.) 3,332,305 24,853,089 38,106,139 13,253,050
Leather & Leather Products 545,236 5,878,381 8,038,076 2,159,695
inculding footwear
Wood & Wood Proudcts 134,978 4,832,329 6,062,952 1,230,623
Furniture 242,902 1,333,048 2,158,118 825,070
Paper & Paper Products 227,443 1,654,272 2,806,694 1,152,422
Printing,Pub.& Allied Ind. 751,811 5,343,244 8,528,675 3,185,431
Durgs & Pharma.Prod. 6,248,273 24,731,144 60,525,956 35,794,812
Industrial Chemicals 754,559 44,168,775 64,748,687 20,579,912
Other Chemicals Products 1,338,636 10,368,451 19,657,178 9,288,727
Petroleum & Misc.Prod.of Petroleum 1,619,629 142,954,268 187,567,264 44,612,996
Rubber Proudects 337,900 2,723,068 4,543,618 1,820,550
Plastic Prouducts (N.E.C) 485,859 8,118,596 11,839,961 3,721,365
Pottery China & Earthen-Wear 343,590 1,815,739 4,026,672 2,210,933
Glass & Glass Products
Other Non Metallic Mineral Prod.(N.E.C) 1,248,718 14,044,769 34,973,827 20,929,058
Iron,Steel & Non-Ferous Metal 5,938,024 30,950,513 61,042,045 30,091,532
Fabricatad Matel Prod.Ex.Mach. 472,762 7,815,011 12,255,849 4,440,838
Non-Electrical Machinery 1,410,422 9,435,264 16,569,417 7,134,153
Electrical Machiney & Supplies 659,318 19,208,321 29,552,473 10,344,152
Transport & Equipments 2,485,285 83,376,450 124,822,531 41,446,081
Radio,T.V & Communication Equipments 21,794 188,494 264,866 76,372
Scientific,Photografic & Optical 205,652 1,214,348 1,930,218 715,870
All Other 4,212,440 41,298,097 72,937,839 31,639,742
151
6.02 MAJOR INDUSTRY GROUPS FOR CENSUS OF MANUFACTURING INDUSTRIES (C.M.I) IN SINDH, 2005-06

(Value in "000" Rs.) No. of Value of Changes Average daily
Major Industry Reporting fixed assets in stocks employment
Groups Establish- at the end during during the
ments of the year the year year (Nos.)
1 2 3 4 5
SINDH 1,825 351,637,294 26,047,117 290,376
Karachi 1198 232,818,721 23,361,487 199,077
Hyderabad 98 31,644,994 1,101,538 24,160
Sanghar 43 1,628,601 15,313 2,767
Mirpurkhas 22 3,514,518 2,811 2,415
Dadu 83 42,608,071 109,728 35,211
Thatta 17 13,473,727 74,570 7,625
Badin 6 9,571,997 21,934 4,968
Khairpur 15 1,438,984 52,895 788
Sukkur 54 3,094,617 263,126 2,893
Nawabshah 24 2,581,071 - 85,642 1,500
Larkana 84 61,980 - 4,648 1,949
Jacobabad 97 425,182 - 6,119 3,435
Shikarpur 25 13,436 -- 572
Ghotki 41 7,523,119 1,042,361 2,115
Nausheroferoze 18 1,238,276 97,763 901
Contd.
152
6.03 MAJOR INDUSTRY GROUPS FOR CENSUS OF MANUFACTURING INDUSTRIES (C.M.I) IN SINDH, 2005-06
MANUFACTURING

MANUFACTURING
(Value in "000" Rs.)Employment Industrial Value of Gross Census
Major Industry Cost during Cost during Production Value added
Groups the year the year during the during the
year year
1 6 7 8 9
SINDH 53,060,109 751,699,664 1,200,402,292 448,702,628
Karachi 41,221,697 567,570,766 906,363,645 338,792,879
Hyderabad 5,140,113 47,445,709 75,766,880 28,321,171
Sanghar 450,772 11,107,227 17,737,325 6,630,098
Mirpurkhas 198,149 6,116,430 9,767,433 3,651,003
Dadu 3,643,965 56,553,728 90,311,633 33,757,905
Thatta 761,613 19,189,140 30,643,472 11,454,332
Badin 288,171 2,004,681 3,201,310 1,196,629
Khairpur 78,199 2,298,307 3,670,207 1,371,900
Sukkur 312,048 11,156,628 17,816,213 6,659,585
Nawabshah 262,740 7,647,232 12,211,998 4,564,766
Larkana 24,409 239,476 382,424 142,948
Jacobabad 88,737 1,573,373 2,512,547 939,174
Shikarpur 6,842 33,057 52,790 19,733
Ghotki 473,557 15,511,004 24,769,793 9,258,789
Nausheroferoze 109,097 3,252,906 5,194,622 1,941,716
153
INDUSTRIES (C.M.I) IN SINDH, 2005-06
'6.03 MAJOR INDUSTRY GROUPS FOR CENSUS OF MANUFACTURING

INDEX NUMBER
YEAR INDEX % Change Over Last Year
2001-02 178.12 1.88
2002-03 194.28 9.07
2003-04 213.64 9.96
2004-05 223.61 4.67
2005-06 247.17 10.54
2006-07 277.06 12.09
2007-08 314.51 13.52
2008-09 272.27 (-)13.43
2009-10 281.54 3.4
2010-11 279.81 (-) 0.61
2011-12 279.91 0.04
2012-13 310.66 10.98
2013-14 353.50 12.32
Contd.
154
6.04 INDEX OF INDUSTRIAL PRODUCTION OF SINDH,2001-02 TO 2013-14(Base:- 1980-81=100)

YEAR INDEX
July 255.32 1.06
August 301.36 18.03
September 301.85 0.16
October 284.52 (-)5.74
November 297.91 4.71
December 364.68 22.41
January 549.09 50.47
February 516.05 (-)6.02
March 412.06 (-)20.15
April 274.71 (-)33.33
May 349.56 27.25
June 346.23 (-)0.95
Source:- Monthly Survey of Industrial Production & Employment in Sindh, Bureau of Statistics, Government of Sindh, Karachi.
Last Month
2013-14
155
INDEX NUMBER
6.04 INDEX OF INDUSTRIAL PRODUCTION OF SINDH,2013-14
(Base:- 1980-81=100)
% Change Over
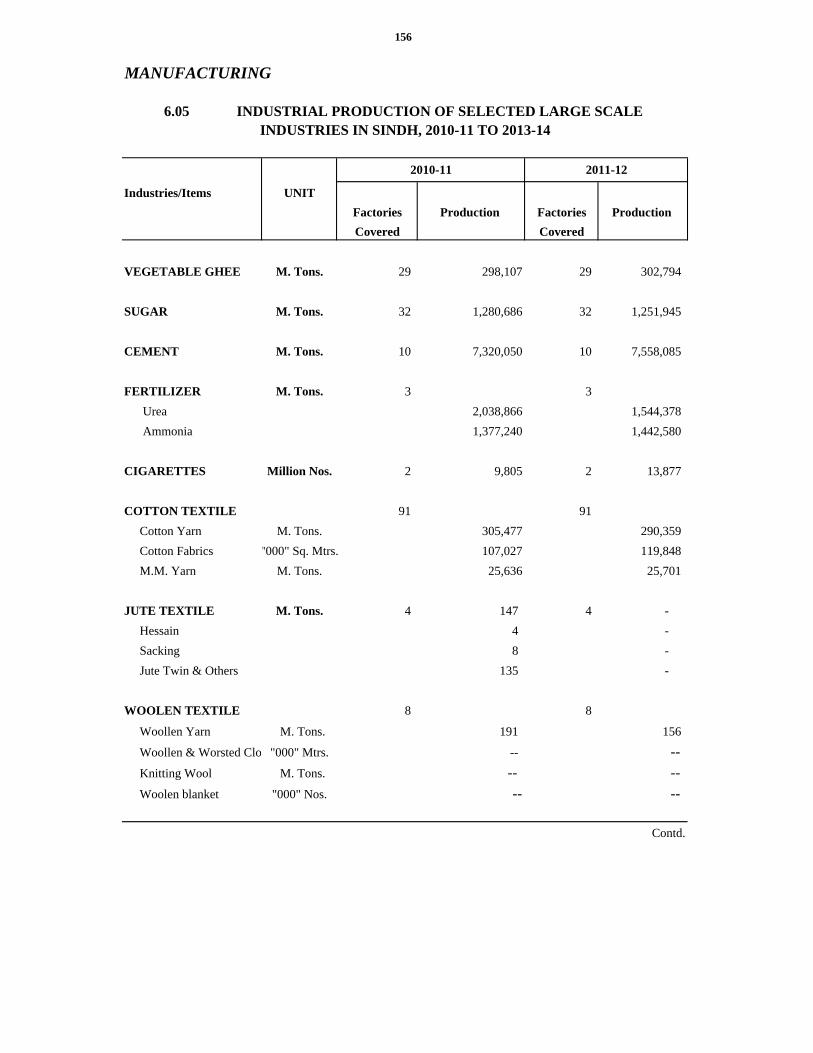
Industries/Items UNIT
Factories Production Production
Covered Covered
VEGETABLE GHEE M. Tons. 29 298,107 29 302,794
SUGAR M. Tons. 32 1,280,686 32 1,251,945
CEMENT M. Tons. 10 7,320,050 10 7,558,085
FERTILIZER M. Tons. 3 3
Urea 2,038,866 1,544,378
Ammonia 1,377,240 1,442,580
CIGARETTES Million Nos. 2 9,805 2 13,877
COTTON TEXTILE 91 91
Cotton Yarn M. Tons. 305,477 290,359
Cotton Fabrics "000" Sq. Mtrs. 107,027 119,848
M.M. Yarn M. Tons. 25,636 25,701
JUTE TEXTILE M. Tons. 4 147 4 -
Hessain 4 -
Sacking 8 -
Jute Twin & Others 135 -
WOOLEN TEXTILE 8 8
Woollen Yarn M. Tons. 191 156
Woollen & Worsted Clo "000" Mtrs. -- --
Knitting Wool M. Tons. -- --
Woolen blanket "000" Nos. -- --
Contd.
Factories
156
MANUFACTURING
INDUSTRIES IN SINDH, 2010-11 TO 2013-14
2010-11 2011-12
6.05 INDUSTRIAL PRODUCTION OF SELECTED LARGE SCALE

Industries/ItemsFactories Production Factories Production Covered Covered
VEGETABLE GHEE M. Tons. 29 320,913 29 338,603
SUGAR M. Tons. 32 1,519,128 32 1,816,304
CEMENT M. Tons. 10 8,235,562 10 8,752,667
FERTILIZER M. Tons. 3 3
Urea 1,677,108 1,768,896
Ammonia 1,487,959 1,530,301
CIGARETTES Million Nos. 2 14,666 2 15,825
COTTON TEXTILE 91 91
Cotton Yarn M. Tons. 321,124 343,022
Cotton Fabrics "000" Sq. Mtrs. 154,402 170,444
M.M. Yarn M. Tons. 26,168 27,622
JUTE TEXTILE M. Tons. 4 4
Hessain - -
Sacking - -
Jute Twin & Others - -
WOOLEN TEXTILE 8 8
Woollen Yarn M. Tons. 158 161
Woollen & Worsted Cloth "000" Mtrs. -- -- Knitting Wool M. Tons. -- -- Woolen blanket "000" Nos. -- --
6.05 INDUSTRIAL PRODUCTION OF SELECTED LARGE SCALE INDUSTRIES IN SINDH, 2010-11 TO 2013-14
MANUFACTURING
157
2013-142012-13
UNIT

6.05 INDUSTRIAL PRODUCTION OF SELECTED LARGE SCALE
Factories Production Factories Production
Covered Covered
PAPER AND PAPER BOARD M. Tons. 7 7
Printing Paper 1,415 1,660
Writing Paper 3,518 3,869
Packing & Other Paper 929 859
Chip Board 22,258 19,457
ACID, ALKALIES AND SALTS M. Tons. 5 5
Caustic Soda -- -- Soda Ash -- -- Sulphuric Acid 47,347 33,866
Hydrochloric Acid -- --
PHARMACEUTICALS 52 52
Tablets "000" Nos. 19,298,976 21,019,651
Liquids/Syrups "000" Ltrs. 62,558 67,208
Capsules "000" Nos. 1,966,884 1,971,638
Injections "000" Nos. 484,604 509,770
Ointment Kgs. 1,899,802 1,926,370
Galenicals "000" Ltrs.
TYRES AND TUBES Nos. 3 3
Cycle Tyres -- -- Cycle Tubes -- -- Motor Tyres 1,636,442 1,535,551
Motor Tubes 114,170 145,546
RADIO AND TELEVISION Nos. 8 8
Radio -- -- Television 27,198 27,724
ELECTRICAL APPLIANCES Nos. 10 10
Airconditioners 54,746 72,054
Refrigerators 527,317 552,724
Contd.
158
Industries/Items UNIT
2010-11 2011-12
INDUSTRIES IN SINDH, 2010-11 TO 2013-14
MANUFACTURING

Industries/Items UNIT
Factories Production Factories Production
Covered Covered
PAPER AND PAPER BOARD M. Tons. 7 7
Printing Paper 2,180 2,406
Writing Paper 3,090 3,512
Packing & Other Paper 936 685
Chip Board 18,836 12,768
ACID, ALKALIES AND SALTS M. Tons. 5 5
Caustic Soda -- -- Soda Ash -- -- Sulphuric Acid 39,426 38,309
Hydrochloric Acid -- --
PHARMACEUTICALS 52 52
Tablets "000" Nos. 21,947,766 22,685,572
Liquids/Syrups "000" Ltrs. 70,671 74,603
Capsules "000" Nos. 2,176,406 2,384,055
Injections "000" Nos. 598,093 646,268
Ointment Kgs. 2,143,800 2,342,765
Galenicals "000" Ltrs.
TYRES AND TUBES Nos. 3 3
Cycle Tyres -- -- Cycle Tubes -- -- Motor Tyres 1,459,600 1,519,359
Motor Tubes 30,705 44,341
RADIO AND TELEVISION Nos. 8 8
Radio -- -- Television 30,443 32,895
ELECTRICAL APPLIANCES Nos. 10 10
Airconditioners 53,012 93,539
Refrigerators 662,278 733,164
159
2013-142012-13
6.05 INDUSTRIAL PRODUCTION OF SELECTED LARGE SCALE INDUSTRIES IN SINDH, 2010-11 TO 2013-14
MANUFACTURING

6.05 INDUSTRIAL PRODUCTION OF SELECTED LARGE SCALE
Industries/Items UNITFactories Production Factories Production
Covered Covered
ELECTRIC LAMPS & TUBES 1 1 .. Lamps "000" Nos. -- .. Tubes "000" Mtrs. --
ELECTRIC FANS Nos. 2 54,757 2 55,445 Pedestal 515 726 Table 585 612 Ceiling 49,149 49,257 Others 4,508 4,850
M.S PRODUCTS M. Tons. 22 144,647 22 150,009
PAINT AND VARNISH 10 10
Paints M.Tons. 3,844 980
Varnish "000" Ltrs. 15,561 5,507
LEATHER TANNING 18 18
Upper Leather "000" Sq.Mtrs. 11,795 12,121
Sole Leather M. Tons. -- --
Wet Blue Tanned Leather"000" Sq.Mtrs. 947 796
PETROLEUM PRODUCT "000" Ltrs. 2 4,308,610 2 4,126,643
L.P.G 24,792 22,318
Naptha Solvent 643,385 555,165
Kerosene Oil 7,673 9,607
H.S.D 1,466,453 1,547,859
LDO (Diesel Oil) 36,130 10,864
Furnace Oil (Fuel Oil) 1,071,320 966,029
ASPHALT
(i) 80-100 78,282 93,674
(ii) 60-70 68,126 51,570
Motor Sprit 299,328 322,052
Jet Fuel 369,096 309,567
Speciality Oil -- --
Lubricating Oil 224,568 223,587
Others 19,457 14,351
Contd.
2010-11 2011-12
INDUSTRIES IN SINDH, 2010-11 TO 2013-14
MANUFACTURING
160

Industries/Items UNIT
Factories Production Factories Production
Covered Covered
ELECTRIC LAMPS & TUBES 1 1
Lamps "000" Nos. -- --
Tubes "000" Mtrs. -- --
ELECTRIC FANS Nos. 2 57,101 2 61,430
Pedestal 928 1,067
Table 689 791
Ceiling 50,448 54,177
Others 5,036 5,395
M.S PRODUCTS M. Tons. 22 170,257 22 181,044
PAINT AND VARNISH 10 10
Paints M.Tons. 1,053 1,185
Varnish "000" Ltrs. 5,807 6,187
LEATHER TANNING 18 18
Upper Leather "000" Sq.Mtrs. 12,709 12,976
Sole Leather M. Tons. -- --
Wet Blue Tanned Leather"000" Sq.Mtrs. 886 1,023
PETROLEUM PRODUCT "000" Ltrs. 2 3,957,336 2 4,336,044
L.P.G 20,706 20,746
Naptha Solvent 485,982 528,340
Kerosene Oil 3,657 2,851
H.S.D 1,467,493 1,632,225
LDO (Diesel Oil) 2,021 4,838
Furnace Oil (Fuel Oil) 991,994 1,015,152
ASPHALT
(i) 80-100 51,606 1,231
(ii) 60-70 57,493 101,893
Motor Sprit 350,609 372,669
Jet Fuel 287,653 414,923
Speciality Oil -- --
Lubricating Oil 223,306 222,097
Others 14,816 19,079
2013-14
161
MANUFACTURING
6.05 INDUSTRIAL PRODUCTION OF SELECTED LARGE SCALE INDUSTRIES IN SINDH, 2010-11 TO 2013-14
2012-13
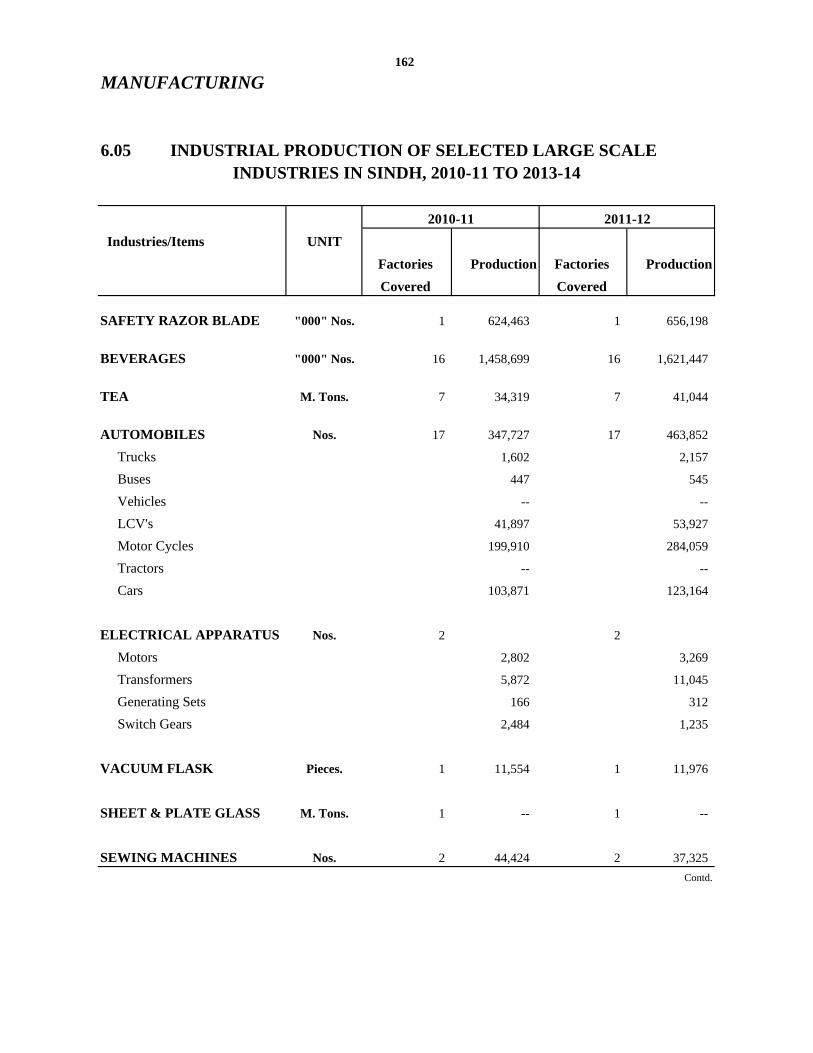
6.05 INDUSTRIAL PRODUCTION OF SELECTED LARGE SCALE
Industries/Items UNIT
Factories Production Factories Production
Covered Covered
SAFETY RAZOR BLADE "000" Nos. 1 624,463 1 656,198
BEVERAGES "000" Nos. 16 1,458,699 16 1,621,447
TEA M. Tons. 7 34,319 7 41,044
AUTOMOBILES Nos. 17 347,727 17 463,852
Trucks 1,602 2,157
Buses 447 545
Vehicles -- --
LCV's 41,897 53,927
Motor Cycles 199,910 284,059
Tractors -- --
Cars 103,871 123,164
ELECTRICAL APPARATUS Nos. 2 2
Motors 2,802 3,269
Transformers 5,872 11,045
Generating Sets 166 312
Switch Gears 2,484 1,235
VACUUM FLASK Pieces. 1 11,554 1 11,976
SHEET & PLATE GLASS M. Tons. 1 -- 1 --
SEWING MACHINES Nos. 2 44,424 2 37,325
Contd.
2010-11 2011-12
MANUFACTURING
INDUSTRIES IN SINDH, 2010-11 TO 2013-14
162

Industries/Items UNIT
Factories Production Factories Production
Covered Covered
SAFETY RAZOR BLADE "000" Nos 1 652,420 1 609,712
BEVERAGES "000" Nos 16 1,940,609 16 3,364,378
TEA M. Tons. 7 47,885 7 55,315
AUTOMOBILES Nos. 17 472,722 17 536,238
Trucks 1,802 1,812
Buses 611 686
Vehicles -- --
LCV's 49,872 124,199
Motor Cycles 307,948 311,496
Tractors -- --
Cars 112,489 98,045
ELECTRICAL APPARATUS Nos. 2 2
Motors 1,787 --
Transformers 7,821 2,187
Generating Sets 217 --
Switch Gears 1,179 1,661
VACUUM FLASK Pieces. 1 11,976 1 11,976
SHEET & PLATE GLASS M. Tons. 1 -- 1 --
SEWING MACHINES Nos. 2 30,512 2 17,699
2013-14
6.05 INDUSTRIAL PRODUCTION OF SELECTED LARGE SCALE INDUSTRIES IN SINDH, 2010-11 TO 2013-14
MANUFACTURING163
2012-13
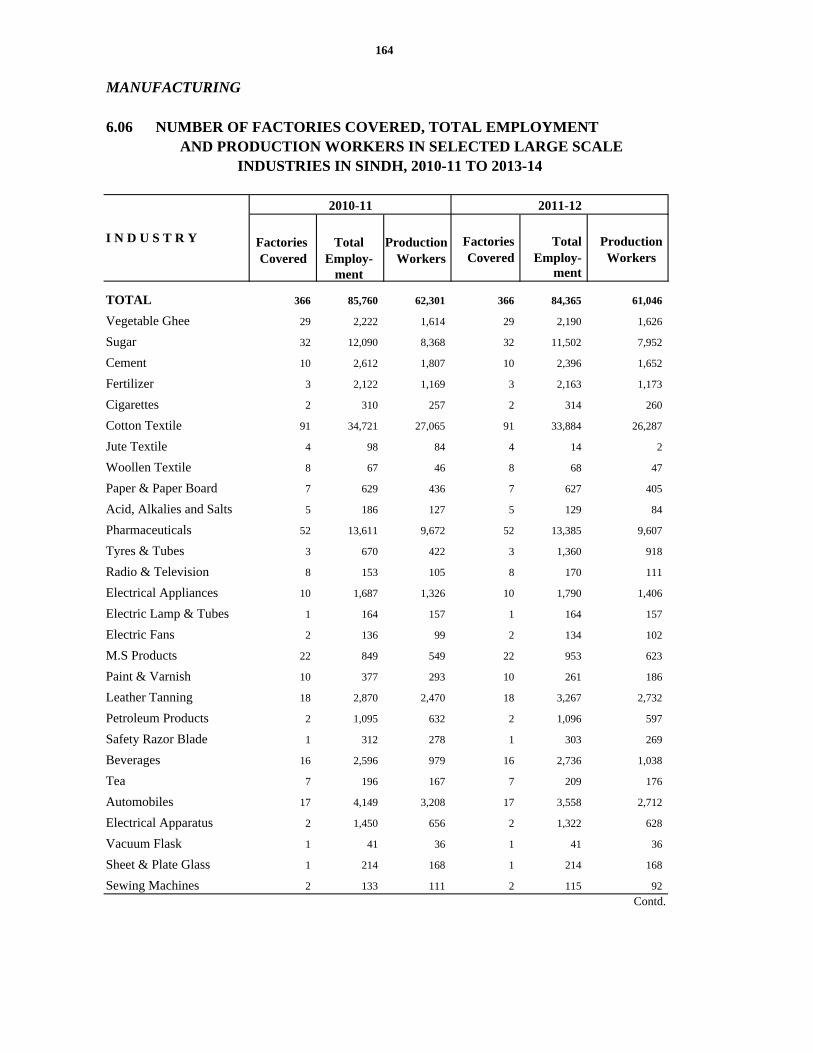
6.06 NUMBER OF FACTORIES COVERED, TOTAL EMPLOYMENT
Factories Total Production Factories Total Production Covered Employ- Workers Covered Employ- Workers
ment ment
TOTAL 366 85,760 62,301 366 84,365 61,046
Vegetable Ghee 29 2,222 1,614 29 2,190 1,626
Sugar 32 12,090 8,368 32 11,502 7,952
Cement 10 2,612 1,807 10 2,396 1,652
Fertilizer 3 2,122 1,169 3 2,163 1,173
Cigarettes 2 310 257 2 314 260
Cotton Textile 91 34,721 27,065 91 33,884 26,287
Jute Textile 4 98 84 4 14 2
Woollen Textile 8 67 46 8 68 47
Paper & Paper Board 7 629 436 7 627 405
Acid, Alkalies and Salts 5 186 127 5 129 84
Pharmaceuticals 52 13,611 9,672 52 13,385 9,607
Tyres & Tubes 3 670 422 3 1,360 918
Radio & Television 8 153 105 8 170 111
Electrical Appliances 10 1,687 1,326 10 1,790 1,406
Electric Lamp & Tubes 1 164 157 1 164 157
Electric Fans 2 136 99 2 134 102
M.S Products 22 849 549 22 953 623
Paint & Varnish 10 377 293 10 261 186
Leather Tanning 18 2,870 2,470 18 3,267 2,732
Petroleum Products 2 1,095 632 2 1,096 597
Safety Razor Blade 1 312 278 1 303 269
Beverages 16 2,596 979 16 2,736 1,038
Tea 7 196 167 7 209 176
Automobiles 17 4,149 3,208 17 3,558 2,712
Electrical Apparatus 2 1,450 656 2 1,322 628
Vacuum Flask 1 41 36 1 41 36
Sheet & Plate Glass 1 214 168 1 214 168
Sewing Machines 2 133 111 2 115 92
Contd.
I N D U S T R Y
2010-11
MANUFACTURING
164
AND PRODUCTION WORKERS IN SELECTED LARGE SCALE INDUSTRIES IN SINDH, 2010-11 TO 2013-14
2011-12

Factories Total Production Factories Total Production Covered Employ- Workers Covered Employ- Workers
ment ment
TOTAL 366 85,023 61,456 366 85,210 60,700
Vegetable Ghee 29 2,194 1,624 29 2,209 1,648
Sugar 32 11,447 7,940 32 11,479 8,242
Cement 10 2,444 1,689 10 2,476 1,717
Fertilizer 3 1,692 1,064 3 1,508 1,021
Cigarettes 2 337 274 2 344 274
Cotton Textile 91 34,625 26,615 91 34,827 25,971
Jute Textile 4 14 2 4 14 12
Woollen Textile 8 66 47 8 67 46
Paper & Paper Board 7 627 381 7 613 417
Acid, Alkalies and Salts 5 119 75 5 114 70
Pharmaceuticals 52 13,695 9,827 52 13,759 9,278
Tyres & Tubes 3 1,493 1,026 3 1,544 1,068
Radio & Television 8 168 107 8 154 92
Electrical Appliances 10 1,585 1,243 10 1,668 1,324
Electric Lamp & Tubes 1 164 157 1 164 157
Electric Fans 2 138 103 2 140 106
M.S Products 22 956 633 22 956 637
Paint & Varnish 10 277 187 10 298 191
Leather Tanning 18 3,483 2,897 18 3,799 3,153
Petroleum Products 2 1,099 600 2 1,162 601
Safety Razor Blade 1 305 272 1 296 264
Beverages 16 2,870 989 16 2,761 951
Tea 7 201 170 7 211 176
Automobiles 17 3,521 2,685 17 3,452 2,611
Electrical Apparatus 2 1,142 562 2 841 393
Vacuum Flask 1 41 36 1 41 36
Sheet & Plate Glass 1 214 168 1 214 168
Sewing Machines 2 106 83 2 99 76
2013-14
6.06 NUMBER OF FACTORIES COVERED, TOTAL EMPLOYMENT AND PRODUCTION WORKERS IN SELECTED LARGE SCALE
INDUSTRIES IN SINDH, 2010-11 TO 2013-14
165
MANUFACTURING
2012-13
INDUSTRIES

194.28
213.64 223.61
247.17
277.06
314.51
272.27 281.54 279.81 279.91
310.66
353.5
200
300
400
dex
Index of Industrial Production of Sindh 2001‐02 to 2013‐14
178.12
0
100
200
Ind
Years
Index

7.00 ELECTRICITY, GAS
AND
MINING

171
EXPLANATORY NOTE
ELECTRICITY AND GAS
This sector includes data on electricity consumption and number of consumers
by K-Electric Ltd& WAPDA. Number of new electricity connection given by WAPDA
along with installed generating capacity of power statistics, natural gas consumption and
its number of consumers in Sindh. K- Electric Ltd. (K.E) is responsible for generation
and distribution of electricity to Karachi division whereas Water and Power
Development Authority (WAPDA) generates electricity from national grid and supplies
electricity to all the areas of Sindh excluding Karachi. Therefore, it may be concluded
that totals of K-Electric Ltd and WAPDA figures represent Sindh figure.
The gas data is collected annually from SUI SOUTHERN Gas Company,
which was formerly consisted of two factions namely Karachi Gas Company and
Indus Gas Company. Karachi Gas Company is responsible for distribution of gas to
Karachi division whereas Indus Gas Company is responsible for distribution of gas to
interior Sindh (Excluding Karachi). The gas data given in table no. 7.09 and 7.10 includes
data of Karachi Gas as well as Indus Gas company.
DEFINITIONS OF IMPORTANT TERMS
i) Domestic Consumption and Number of Consumers of Electricity It includes the general consumption for lamps, fans and other single phase
house ware appliances. The rated capacity of any house-ware appliance should not
exceed 4 kilowatts.
ii) Commercial Consumption and Number of Consumers of Electricity
It includes the consumption for commercial use of lamps, fans, heaters, air
conditions, refrigerators, tube-wells (Non-agricultural) and all other single phase
appliances whose rated capacity should not exceed 4 Kilowatts.
172
iii) Industrial Consumption and Number of Consumers of Electricity
It includes the consumption for industrial purpose in factories and also for tube
wells and water pumps operating on three phase 400 volts. The supply given to the
offices of the factories are also included.
iv) Agriculture Consumption and Number of Consumers of Electricity It includes the consumption of electricity for agricultural purposes e.g. for irrigation pumps, tube wells etc. v) Others Others include public lighting and bulk supply. G A S i) Domestic Consumption & Number of Consumers of Gas
It includes residential colonies, mosques, other religious places, Government and semi Government offices, guest houses, armed forces messes, universities and other institutions.
ii) Commercial Consumption and number of consumer of Gas
It includes all establishment registered as commercial unit e.g. all shops, clubs, cinema houses and clinics.
iii) Industrial Consumption and number of consumers It includes all factories engaged in manufacturing process. iv) Others
Other includes consumption of gas by any other categories not mentioned above.

ELECTRICITY
7.01 ELECTRICITY CONSUMPTION AND NUMBER OF CONSUMERS
(Consumption in Million KWH)
No. of No. of No. of
Consumers Consumers Consumers
2005-06 17,342 3,244,273 5,873 2,533,645 1,276 641,027
2006-07 19,115 3,348,731 6,250 2,620,797 1,349 656,273
2007-08 18,745 3,425,445 6,515 2,683,449 1,400 669,867
2008-09 19,539 3,457,819 6,557 2,710,392 1,338 673,882
2009-10 20,048 3,532,997 6,638 27,741,714 1,425 685,908
2010-11 21,333 3,652,000 7,385 2,877,000 1,430 699,000
2011-12 22,006 3,712,919 7,903 2,930,303 1,522 705,810
2012-13 22,653 3,750,590 8,684 2,967,481 1,913 704,912
2013-14 23,280 3,775,353 9,208 3,000,354 1,943 695,700
cont..
173
IN SINDH, 2005-06 TO 2013-14
YEAR
TOTAL DOMESTIC COMMERCIAL
ConsumptionConsumptionConsumption

(Consumption in Million K W H)
No. of No. of No. of
Consumers Consumers Consumers
2005-06 4,304 42,383 697 24,588 5,192 2,630
2006-07 4,512 43,117 711 25,468 6,293 3,076
2007-08 4,583 42,869 790 26,053 5,457 3,207
2008-09 4,415 43,411 826 26,897 6,403 3,237
2009-10 4,516 42,661 829 27,016 6,484 3,238
2010-11 4,617 44,000 907 29,000 6,994 4,000
2011-12 4,526 44,656 910 29,880 7,145 2,270
2012-13 4,804 45,358 858 30,629 6,394 2,210
2013-14 4,983 46,140 848 31,016 6,343 2,143 * = Others include public and bulk supply lighting. KWH = Kilowatt Hours.
Consumption
7.01 ELECTRICITY CONSUMPTION AND NUMBER OF CONSUMERSIN SINDH, 2005-06 TO 2013-14
ELECTRICITY
Source:- (i) K- Electric
(ii) Statistical Wing, WAPDA, Lahor
174
YEAR
INDUSTRIAL AGRICULTURAL *OTHERS
Consumption Consumption

(Consumption in Million KWH)
MONTH Consump- No. of Consump- No. of Consump- No. oftion Consumers tion Consumers tion Consumers
TOTAL 22,653 3,750,590 8,684 2,967,481 1,913 704,912
July 2,013 3,717,619 799 2,933,003 174 707,282
August 2,050 3,723,031 842 2,936,691 174 708,861
September 1,975 3,728,930 799 2,942,547 173 709,157
October 1,997 3,724,852 788 2,942,532 166 704,896
November 1,972 3,728,079 781 2,945,846 170 704,830
December 1,738 3,727,902 621 2,946,530 145 703,532
January 1,636 3,734,253 537 2,952,825 125 703,481
February 1,568 3,740,267 522 2,956,620 128 704,370
March 1,685 3,747,124 581 2,962,990 136 706,142
April 1,840 3,748,601 668 2,967,786 159 702,732
May 1,996 3,749,450 821 2,966,158 172 705,149
June 2,183 3,750,590 925 2,967,481 191 704,912
TOTAL 23,280 3,775,353 9,208 3,000,354 1,943 695,700
July 2,129 3,749,659 901 2,968,763 177 702,495
August 2,077 3,749,480 888 2,969,936 173 701,007
September 2,068 3,759,077 841 2,978,920 174 701,569
October 2,112 3,743,542 867 2,968,409 176 696,625
November 1,904 3,750,074 752 2,975,213 163 696,390
December 1,792 3,748,519 651 2,975,581 144 694,242
January 1,680 3,754,472 572 2,980,567 129 695,188
February 1,610 3,755,214 562 2,980,994 128 695,310
March 1,661 3,755,317 560 2,984,414 135 691,981
April 1,861 3,761,306 704 2,988,004 161 694,382
May 2,104 3,766,506 888 2,992,525 188 694,888
June 2,282 3,775,353 1,022 3,000,354 195 695,700
TOTAL DOMESTIC COMMERCIAL
175
BY MONTH IN SINDH, 2012-13 TO 2013-14
ELECTRICITY
7.02 ELECTRICITY CONSUMPTION AND NUMBER OF CONSUMERS
2012-13
Cont.
2013-14
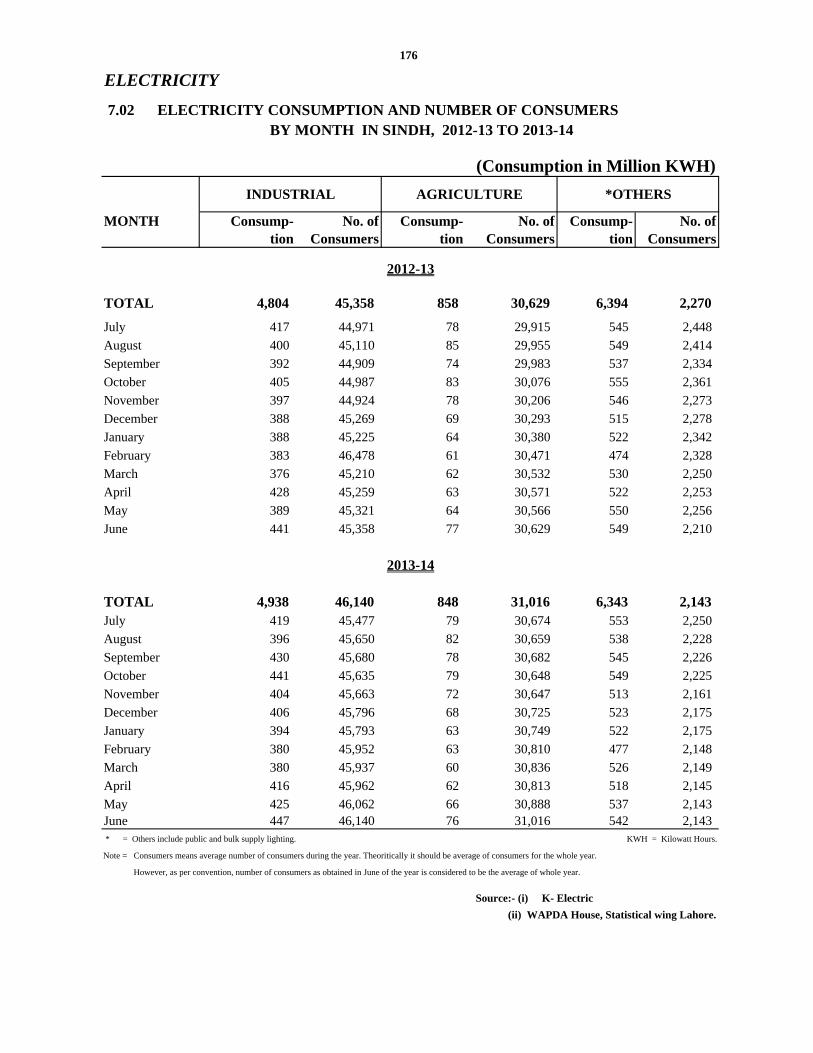
(Consumption in Million KWH)
MONTH Consump- No. of Consump- No. of Consump- No. oftion Consumers tion Consumers tion Consumers
TOTAL 4,804 45,358 858 30,629 6,394 2,270
July 417 44,971 78 29,915 545 2,448
August 400 45,110 85 29,955 549 2,414
September 392 44,909 74 29,983 537 2,334
October 405 44,987 83 30,076 555 2,361
November 397 44,924 78 30,206 546 2,273
December 388 45,269 69 30,293 515 2,278
January 388 45,225 64 30,380 522 2,342
February 383 46,478 61 30,471 474 2,328
March 376 45,210 62 30,532 530 2,250
April 428 45,259 63 30,571 522 2,253
May 389 45,321 64 30,566 550 2,256
June 441 45,358 77 30,629 549 2,210
TOTAL 4,938 46,140 848 31,016 6,343 2,143 July 419 45,477 79 30,674 553 2,250
August 396 45,650 82 30,659 538 2,228
September 430 45,680 78 30,682 545 2,226
October 441 45,635 79 30,648 549 2,225
November 404 45,663 72 30,647 513 2,161
December 406 45,796 68 30,725 523 2,175
January 394 45,793 63 30,749 522 2,175
February 380 45,952 63 30,810 477 2,148
March 380 45,937 60 30,836 526 2,149
April 416 45,962 62 30,813 518 2,145
May 425 46,062 66 30,888 537 2,143 June 447 46,140 76 31,016 542 2,143 * = Others include public and bulk supply lighting. KWH = Kilowatt Hours.
(ii) WAPDA House, Statistical wing Lahore.
2012-13
176
BY MONTH IN SINDH, 2012-13 TO 2013-14
Note = Consumers means average number of consumers during the year. Theoritically it should be average of consumers for the whole year.
7.02 ELECTRICITY CONSUMPTION AND NUMBER OF CONSUMERS
ELECTRICITY
INDUSTRIAL AGRICULTURE *OTHERS
However, as per convention, number of consumers as obtained in June of the year is considered to be the average of whole year.
2013-14
Source:- (i) K- Electric

ELECTRICITY
I - NUMBER OF CONSUMERS
2003-04 1,213,398 950,391
2004-05 1,264,594 995,326
2005-06 1,362,306 1,085,917
2006-07 1,409,766 1,132,389
2007-08 1,448,340 1,164,805
2008-09 1,480,714 1,191,748
2009-10 1,512,000 1,217,000
2010-11 1,542,000 1,244,000
2011-12 1,573,050 1,270,537
2012-13 1,613,982 1,306,713
2013-14 1,664,459 1,350,544
II - UNITS SOLD
2003-04 5,595 1,747
2004-05 6,483 1,858
2005-06 8,282 2,113
2006-07 9,748 2,386
2007-08 9,176 2,542
2008-09 10.143 2.568
2009-10 10,604 2,738
2010-11 11,263 3,128
2011-12 11,730 3,339
2012-13 11,712 3,603
2013-14 11,827 3,724
Contd.
177
YEAR TOTAL DOMESTIC
CATEGORIES WAPDA IN SINDH, 2003-04 TO 2013-14 7.03 CONSUMERS OF ELECTRICITY AND UNITS SOLD BY
(Consumption in Million KWH)

ELECTRICITY
(Consumption in Million KWH)
I - NUMBER OF CONSUMERS
2003-04 220,761 19,669 21,012 1,565
2004-05 226,002 20,001 21,677 1,588
2005-06 231,575 20,512 22,695 1,607
2006-07 231,247 21,015 23,494 1,621
2007-08 236,451 21,416 24,015 1,653
2008-09 240,466 21,958 24,859 1,683
2009-10 244,000 23,000 26,000 2,000
2010-11 246,000 23,000 27,000 2,000
2011-12 249,273 24,119 27,344 1,777
2012-13 252,583 24,896 28,013 1,777
2013-14 257,759 25,680 28,606 1,870
II - UNITS SOLD
2003-04 248 987 533 2,080
2004-05 269 1,027 587 2,742
2005-06 314 1,098 622 4,135
2006-07 363 1,148 632 5,219
2007-08 317 1,226 695 4,396
2008-09 334 1,189 726 5,326
2009-10 361 1,175 786 5,544
2010-11 386 1170 783 5796
2011-12 394 1184 777 6036
2012-13 405 1186 709 5809
2013-14 431 1187 689 5796
* = Others include public and bulk supply lighting including bulk supply to K.E
KWH = Kilowatt Hours.Source:- Statistical Wing, WAPDA, Lahore.
178
YEAR COMMERCIAL INDUSTRIAL AGRICULTURAL *OTHERS
7.03 CONSUMERS OF ELECTRICITY AND UNITS SOLD BY CATEGORIES WAPDA IN SINDH,2003-04 TO 2013-14

'7.04 CONSUMPTION AND NUMBER OF ELECTRICITY CONSUMERS
(Consumption in Million KWH)
TOTAL DOMESTIC COMMERCIALMONTH Consump- No. of Consump- No. of Consump- No. of
tion Consumers tion Consumers tion Consumers
TOTAL 11,712 1,613,982 3,603 1,306,713 405 252,583
July 1,030 1,575,758 331 1,272,910 35 249,540
August 1,088 1,578,343 374 1,275,258 37 249,702
September 1,019 1,582,413 325 1,279,045 36 249,913
October 1,058 1,583,083 346 1,279,300 34 250,152
November 1,046 1,587,825 344 1,283,367 37 250,605
December 923 1,592,475 257 1,287,404 32 251,049
January 892 1,598,557 229 1,292,877 28 251,470
February 813 1,603,184 211 1,297,063 29 251,766
March 871 1,606,959 226 1,300,503 30 251,999
April 907 1,609,851 260 1,303,075 33 252,208
May 1,001 1,611,894 327 1,304,876 35 252,409
June 1,064 1,613,982 373 1,306,713 39 252,583
TOTAL 11,827 1,664,459 3,724 1,350,544 431 257,759
July 1,089 1,616,875 390 1,309,207 38 252,814
August 1,081 1,621,306 374 1,313,081 41 253,241
September 1,078 1,626,432 357 1,317,602 40 253,743
October 1,085 1,630,957 362 1,321,560 38 254,202
November 969 1,636,280 296 1,326,255 37 254,702
December 949 1,639,882 268 1,329,323 33 255,071
January 905 1,643,223 239 1,332,170 31 255,481
February 846 1,647,117 239 1,335,529 30 255,877
March 836 1,652,377 200 1,340,098 29 256,452
April 915 1,655,785 273 1,343,035 34 256,863
May 980 1,659,402 321 1,346,101 38 257,300
June 1,094 4,664,459 405 1,350,544 42 257,759 * = Others include public and bulk supply lighting. KWH = Kilowatt Hours.
Note = Consumers means average number of consumers during the year. Theoritically it should be average of consumers for the whole year.
However, as per convention, number of consumers as obtained in June of the year is considered to be the average of whole year.
Source: (i) K- Electric
179
ELECTRICITY
2012-13
BY MONTH WAPDA IN SINDH, 2012-13 TO 2013-14
2013-14
(ii) WAPDA, WAPDA House,Statistical Wing Lahore.

(Consumption in Million KWH)
Consump- No. of Consump- No. of Consump- No. oftion Consumers tion Consumers tion Consumers
TOTAL 1,186 24,896 709 28,013 5,809 1,777
July 104 24,157 66 27,374 494 1,777
August 108 24,211 73 27,395 496 1,777
September 111 24,255 62 27,422 485 1,778
October 105 24,330 70 27,519 503 1,782
November 109 24,431 65 27,632 491 1,790
December 102 24,504 57 27,720 475 1,798
January 99 24,608 51 27,793 485 1,809
February 90 24,678 49 27,866 434 1,811
March 76 24,724 50 27,922 489 1,811
April 91 24,796 50 27,961 473 1,811
May 93 24,836 52 27,961 494 1,812
June 98 24,896 64 28,013 490 1,777
TOTAL 1,187 25,680 689 28,606 5,796 1,870
July 102 24,978 65 28,063 494 1,813
August 105 25,037 69 28,093 492 1,854
September 118 25,099 66 28,132 497 1,856
October 115 25,158 66 28,180 504 1,857
November 107 25,248 59 28,213 470 1,862
December 108 25,626 56 28,300 484 1,862
January 98 25,684 50 28,323 487 1,865
February 87 25,449 50 28,397 440 1,865
March 73 25,511 47 28,450 487 1,866
April 87 25,557 49 28,464 472 1,866
May 85 25,639 52 28,492 484 1,870
June 102 25,680 60 28,606 485 1,870
* = Others include public and bulk supply lighting.
Note = Consumers means average number of consumers during the year. Theoritically it should be average of consumers for the whole year.
However, as per convention, number of consumers as obtained in June of the year is considered to be the average of whole year.
Source:- Statistical Wing, WAPDA, Lahore.
180
ELECTRICITY
BY MONTH WAPDA IN SINDH, 2012-13 TO 2013-14
MONTHINDUSTRIAL AGRICULTURAL * OTHERS
KWH = Kilowatt Hours.
2013-14
2012-13
'7.04 CONSUMPTION AND NUMBER OF ELECTRICITY CONSUMERS
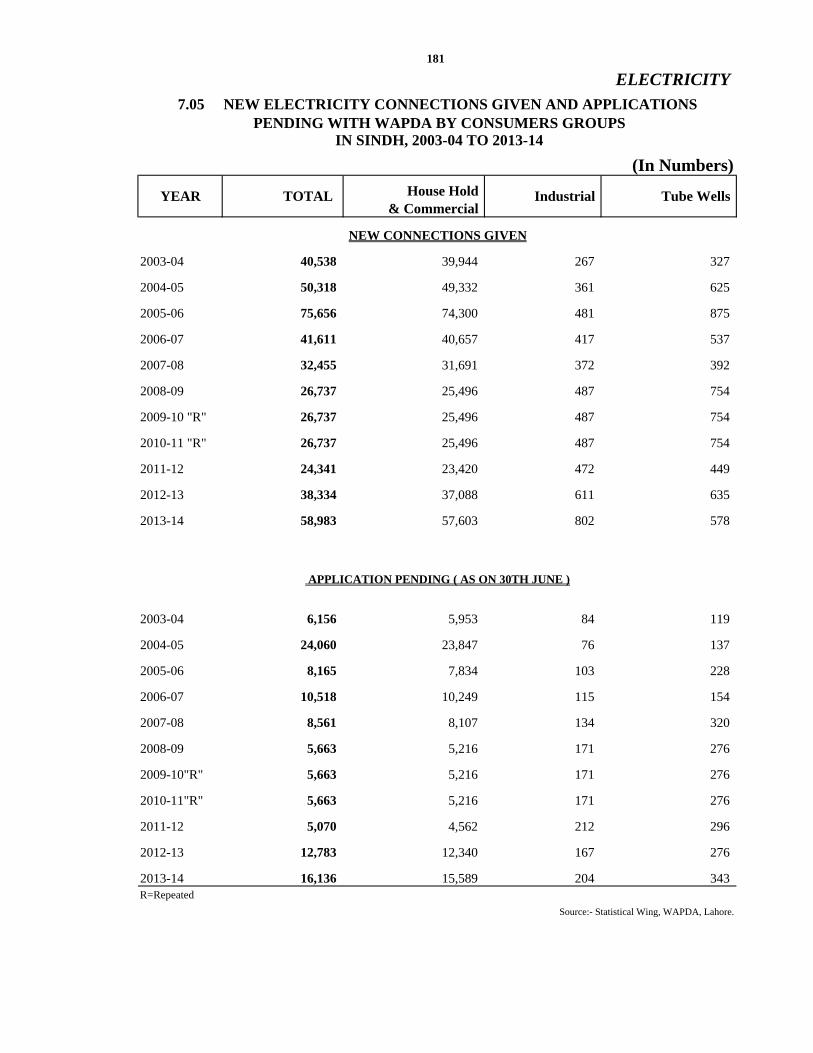
ELECTRICITY
(In Numbers)
House Hold & Commercial
NEW CONNECTIONS GIVEN
2003-04 40,538 39,944 267 327
2004-05 50,318 49,332 361 625
2005-06 75,656 74,300 481 875
2006-07 41,611 40,657 417 537
2007-08 32,455 31,691 372 392
2008-09 26,737 25,496 487 754
2009-10 "R" 26,737 25,496 487 754
2010-11 "R" 26,737 25,496 487 754
2011-12 24,341 23,420 472 449
2012-13 38,334 37,088 611 635
2013-14 58,983 57,603 802 578
2003-04 6,156 5,953 84 119
2004-05 24,060 23,847 76 137
2005-06 8,165 7,834 103 228
2006-07 10,518 10,249 115 154
2007-08 8,561 8,107 134 320
2008-09 5,663 5,216 171 276
2009-10"R" 5,663 5,216 171 276
2010-11"R" 5,663 5,216 171 276
2011-12 5,070 4,562 212 296
2012-13 12,783 12,340 167 276
2013-14 16,136 15,589 204 343R=Repeated
Source:- Statistical Wing, WAPDA, Lahore.
APPLICATION PENDING ( AS ON 30TH JUNE )
IN SINDH, 2003-04 TO 2013-14
181
YEAR TOTAL Industrial Tube Wells
7.05 NEW ELECTRICITY CONNECTIONS GIVEN AND APPLICATIONS PENDING WITH WAPDA BY CONSUMERS GROUPS

SINDH 2,829 2,829 2,829 2,829 3,546(WAPDA National Grid)
THERMAL 1,640 1,640 1,640 1,640 1,640
(i) Guddu ( 1 - 4 ) 640 640 640 640 640
(ii) Sukkur ( Retired ) .. .. .. - -
(iii) Jamshoro ( 1 - 4 ) 850 850 850 850 850
(iv) Lakhra (1 -3) 150 150 150 150 150
GAS TURBINE / 1,189 1,189 1,189 1,189 1,906
COMBINED CYCLE
(i) Kotri (Gas Turbine) 130 130 130 130 100
(ii) Guddu Combined Cycle 1,015 1,015 1,015 1,015 1,762
(iii) Kotri Combined Cycle 44 44 44 44 44Note: Installed generating capacity of Liberty Ltd. (235 Mege Watts) thermal power station is not included.
7.06 INSTALLED GENERATING CAPACITY OF POWER STATISTICS
Source:- Statistical Wing, WAPDA, Lahore.
182
2010-11 2011-12TYPE / POWER STATION
ELECTRICITY
NATIONAL GRID WAPDA IN SINDH, 2009-10 TO 2013-14
(In Mega Watts)
2012-13 2013-142009-10

ELECTRICITY
(Consumption in Million KWH)
Consump- No. of Consump- No. of Consump- No. oftion Consumers tion Consumers tion Consumers
2003-04 7,818 1,749,473 3,135 1,349,375 805 377,235
2004-05 8,416 1,818,237 3,508 1,398,576 888 395,719
2005-06 9,060 1,881,967 3,760 1,447,728 962 409,452
2006-07 9,367 1,938,965 3,864 1,488,408 986 425,026
2007-08 9,569 1,977,105 3,973 1,518,644 1,083 433,416
2008-09 9,396 1,977,105 3,989 1,518,644 1,004 433,416
2009-10 9,905 2,052,283 4,168 1,582,426 1,091 445,442
2010-11 10,070 2,109,623 4,257 1,632,604 1,044 452,667
2011-12 10,276 2,139,869 4,564 1,659,766 1,128 456,537
2012-13 10,941 2,136,608 5,081 1,660,768 1,508 452,329
2013-14 11,453 2,110,894 5,484 1,649,810 1,512 437,941
Contd.
183
YEAR
7.07 CONSUMPTION AND NUMBER OF CONSUMERS OF ELECTRICITY BY K-ELECTRIC IN SINDH, 2003-04 TO 2013-14
TOTAL DOMESTIC COMMERCIAL

7.07 CONSUMPTION AND NUMBER OF CONSUMERS OF
(Consumption in Million KWH)
Consump- No. of Consump- No. of Consump- No. oftion Consumers tion Consumers tion Consumers
2003-04 2,890 20,112 44 1,589 944 1,162
2004-05 3,023 21,220 66 1,775 931 947
2005-06 3,206 21,871 75 1,893 1,057 1,023
2006-07 3,364 22,102 79 1,974 1,074 1,455
2007-08 3,357 21,453 95 2,038 1,061 1,554
2008-09 3,226 21,453 100 2,038 1,077 1,554
2009-10 3,387 20,703 103 2,157 1,158 1,555
2010- 11 3,447 20,595 124 2,233 1,198 1,524
2011-12 3,342 20,537 133 2,536 1,109 493
2012-13 3,618 20,462 149 2,616 585 433
2013-14 3,751 20,460 159 2,410 547 273Note: Others include public and bulk supply lighting. KWH = Kilowatt Hours.
Source:- K-Electric
184
YEAR
ELECTRICITY BY K-ELECTRIC IN SINDH, 2003-04 TO 2013-14
ELECTRICITY
INDUSTRIAL AGRICULTURAL *OTHERS

ELECTRICITY
(Consumption in Million KWH)
Consump- No. of Consump- No. of Consump- No. of tion Consumers tion Consumers tion Consumers
TOTAL 10,941 2,136,608 5,081 1,660,768 1,508 452,329
July 983 2,141,861 468 1,660,093 139 457,742
August 962 2,144,688 468 1,661,433 137 459,159
September 956 2,146,517 474 1,663,502 137 459,244
October 939 2,141,769 442 1,663,232 132 454,744
November 926 2,140,254 437 1,662,479 133 454,225
December 815 2,135,427 364 1,659,126 113 452,483
January 744 2,135,696 308 1,659,948 97 452,011
February 755 2,137,083 311 1,659,557 99 452,604
March 814 2,140,165 355 1,662,487 106 454,143
April 933 2,138,750 408 1,664,711 126 450,524
May 995 2,137,556 494 1,661,282 137 452,740
June 1,119 2,136,608 552 1,660,768 152 452,329
TOTAL 11,453 2,110,894 5,484 1,649,810 1,512 437,941
July 1,040 2,132,784 511 1,659,556 139 449,681
August 996 2,128,174 514 1,656,855 132 447,766
September 990 2,132,645 484 1,661,318 134 447,826
October 1,027 2,112,585 505 1,646,849 138 442,423
November 935 2,113,794 456 1,648,958 126 441,688
December 843 2,108,637 383 1,646,258 111 439,171
January 775 2,111,249 333 1,648,397 98 439,707
February 764 2,108,097 323 1,645,465 98 439,433
March 825 2,102,940 360 1,644,316 106 435,529
April 946 2,105,521 431 1,644,969 127 437,519
May 1,124 2,107,104 567 1,646,424 150 437,588
June 1,188 2,110,894 617 1,649,810 153 437,941
Cont..
2012-13
2013-14
185
7.08 CONSUMPTION AND NUMBER OF CONSUMERS OF ELECTRICITYOF K-ELECTRIC BY MONTH IN SINDH, 2012-13 TO 2013-14
MONTHTOTAL COMMERCIALDOMESTIC

Consump- No. of Consump- No. of Consump- No. of tion Consumers tion Consumers tion Consumers
TOTAL 3,618 20,462 149 2,616 585 433
July 313 20,814 12 2,541 51 671
August 292 20,899 12 2,560 53 637
September 281 20,654 12 2,561 52 556
October 300 20,657 13 2,557 52 579
November 288 20,493 13 2,574 55 483
December 286 20,765 12 2,573 40 480
January 289 20,617 13 2,587 37 533
February 293 21,800 12 2,605 40 517
March 300 20,486 12 2,610 41 439
April 337 20,463 13 2,610 49 442
May 296 20,485 12 2,605 56 444
June 343 20,462 13 2,616 59 433
TOTAL 3,751 20,460 159 2,410 547 273
July 317 20,499 14 2,611 59 437
August 291 20,613 13 2,566 46 374
September 312 20,581 12 2,550 48 370
October 326 20,477 13 2,468 45 368
November 297 20,415 13 2,434 43 299
December 298 20,470 12 2,425 39 313
January 296 20,409 13 2,426 35 310
February 293 20,503 13 2,413 37 283
March 307 20,426 13 2,386 39 283
April 329 20,405 13 2,349 46 279
May 340 20,423 14 2,396 53 273
June 345 20,460 16 2,410 57 273
* : = Others include public and supply lighting
2012-13
OF K-ELECTRIC BY MONTH IN SINDH, 2012-13 TO 2013-14
2013-14
AGRICULTURAL *OTHERS
186
INDUSTRIAL
Source:- K-Electric
(Consumption in Million KWH)
ELECTRICITY
7.08 CONSUMPTION AND NUMBER OF CONSUMERS OF ELECTRICITY
MONTH

GAS
7.09 CONSUMPTION AND NUMBER OF CONSUMERS OF GAS BY GROUPS
(Consumption in Million Cubic Feet)
YEAR Consump- No. of Consump- No. of Consump- No. of Consump- No. of
tion Consumers tion Consumers tion Consumers tion Consumers
2003-04 246,041 2,594 6,669 16,670 48,422 1,572,406 301,132 1,591,670
2004-05 259,755 2,753 7,296 17,503 51,166 1,621,588 318,217 1,641,844
2005-06 274,146 2,939 7,909 18,298 52,223 1,683,092 334,278 1,704,329
2006-07 270,139 3,140 8,323 19,264 54,572 1,755,744 333,034 1,778,148
2007-08 288,261 3,515 9,793 20,671 59,352 1,866,585 357,406 1,890,771
2008-09 294,515 3,746 9,218 21,628 61,041 1,936,314 364,774 1,961,688
2009-10 292,410 3,809 9,545 22,138 65,466 2,018,175 367,422 2,044,122
2010-11 254,822 3,987 9,486 22,870 70,896 2,119,760 335,204 2,146,617
2011-12 252,538 4,073 9,769 22,969 83,029 2,231,536 338,283 2,257,905
2012-13 257,104 4,064 9,636 21,858 85,101 2,299,185 351,840 2,325,107
2013-14 254,437 4,100 9,531 21,380 71,748 2,360,021 335,716 2,385,501
IN SINDH 2003-04 TO 2013-14
187
Source:- Sui Southern Gas Co. Ltd. (Formerly Karachi and Indus Gas Company Limited).
INDUSTRIAL COMMERCIAL DOMESTIC TOTAL

Consump- No. of Consump- No.of Consump- No.of Consump- No.of
tion Consumers tion Consumers tion Consumers tion Consumers
TOTAL 7,281,324 4,064 272,888 21,858 2,410,101 2,299,185 9,964,313 2,325,107
July 672,314 4,076 21,665 22,271 146,882 2,233,262 840,861 2,259,609
August 350,259 4,077 21,065 22,182 147,510 2,239,164 818,834 2,265,423
September 601,342 4,080 21,821 22,162 146,991 2,245,762 770,154 2,272,004
October 631,193 4,081 23,158 22,154 143,686 2,251,959 798,037 2,278,194
November 566,840 4,076 21,789 22,100 169,973 2,256,247 758,602 2,282,423
December 559,190 4,066 23,791 22,022 293,139 2,264,243 876,120 2,290,331
January 532,575 4,069 24,096 22,026 305,175 2,271,031 861,846 2,297,126
February 533,606 4,066 21,998 22,023 274,511 2,273,001 830,115 2,299,090
March 627,096 4,068 23,050 22,005 219,278 2,280,102 869,424 2,306,175
April 620,077 4,065 23,236 21,930 210,805 2,286,173 854,118 2,212,168
May 631,004 4,064 23,009 21,954 229,376 2,291,566 883,389 2,317,584
June 655,828 4,064 24,210 21,858 122,775 2,299,185 802,813 2,325,107
TOTAL 7,205,798 4,100 269,925 21,380 2,031,957 2,360,021 9,507,680 2,385,501
July 666,715 4,068 18,987 21,814 145,508 2,301,091 830,210 2,326,973
August 675,139 4,069 21,484 21,727 155,124 2,302,924 851,747 2,328,720
September 607,327 4,075 23,637 21,652 151,476 2,305,884 782,440 2,331,611
October 603,322 4,077 21,484 22,013 157,915 2,309,432 782,721 2,335,522
November 584,252 4,084 21,442 21,574 161,565 2,315,200 767,259 2,340,858
December 558,293 4,086 23,107 21,549 113,739 2,321,015 695,136 5,346,650
January 494,115 4,096 24,097 21,523 239,710 2,328,076 757,922 2,353,695
February 467,497 4,099 21,863 21,499 216,059 2,334,162 705,419 2,359,760
March 590,533 4,096 22,947 21,440 188,513 2,340,800 801,993 2,366,336
April 630,180 4,098 23,298 21,400 181,422 2,349,456 834,900 2,374,954
May 667,298 4,095 22,764 21,381 161,161 2,354,538 851,223 2,380,014
June 661,127 4,100 24,815 21,380 159,768 2,360,021 845,710 2,385,501
Note = Consumers means average number of consumers during the year. Theoritically it should be average of consumers for the
whole year. However, as per convention, number of consumers as obtained in June of the year is considered to be the
average of whole year.
188
(Consumption in "000" Cubic Meters)
DOMESTIC TOTALCOMMERCIALINDUSTRIAL
2012-13
2013-14
Source: - Sui Southern Gas Company Limited (Formerly Karachi and Indus Gas Company Limited).
MONTH
GAS
7.10 CONSUMPTION AND NUMBER OF CONSUMERS OF GAS BY MONTH GROUP IN SINDH, 2012-13 TO 2013-14

GAS
INDUSTRIAL COMMERCIAL DOMESTIC TOTAL
MONTH Consump- No. of Consump- No. of Consump- No. of Consump- No. oftion Consumers tion Consumers tion Consumers tion Consumers
TOTAL 5,912,726 3,428 223,632 17,102 1,747,385 1,625,089 7,883,743 1,645,619
July 559,217 3448 17,775 17,402 108,030 1,593,123 685,022 1,613,973
August 532,859 3451 17,248 17,341 108,531 1,596,388 658,638 1,617,180
September 503,233 3451 18,023 17,333 107,948 1,601,608 629,204 1,622,392
October 516,589 3452 19,151 17,322 105,002 1,606,558 640,742 1,627,332
November 467,034 3445 17,982 17,276 126,793 1,610,077 611,809 1,630,798
December 459,504 3430 19,542 17,236 218,610 1,614,378 697,656 1,635,044
January 427,859 3432 19,551 17,236 220,324 1,616,323 667,734 1,636,991
February 407,260 3429 17,998 17,222 189,383 1,614,313 614,641 1,634,964
March 494,452 3429 18,907 17,210 154,444 1,616,745 667,803 1,637,384
April 491,353 3429 19,014 17,150 157,567 1,619,126 667,934 1,639,705
May 509,888 3429 18,645 17,170 160,449 1,621,403 688,982 1,642,002
June 543,478 3428 19,796 17,102 90,304 1,625,089 653,578 1,645,619
TOTAL 598,164 3,457 220,978 16,763 1,468,616 1,652,427 7,597,758 1,672,647
July 562,313 3433 15,494 17,088 106,847 1,624,743 684654 1,645,264
August 559,953 3434 17,740 17,009 113,857 1,624,385 691,550 1,644,828
September 503,966 3437 19,642 16,961 109,904 1,625,621 633,512 1,646,019
October 498,569 3439 17,602 16,948 117,650 1,626,311 633,821 1,646,698
November 482,874 3444 17,520 16,897 117,650 1,628,306 618,044 1,648,647
December 455,095 3446 18,901 16,880 86,843 1,629,642 560,839 1,649,968
January 391,775 3453 19,722 16,904 165,539 1,634,082 577,036 1,654,439
February 374,177 3453 17,725 16,852 151,642 1,636,710 543,544 1,657,015
March 474,884 3451 18,838 16,804 137,776 1,640,147 631,498 1,660,402
April 523,844 3452 19,077 16,772 128,027 1,645,047 670,948 1,665,271
May 546,299 3451 18,440 16,763 117,955 1,648,498 682,694 1,668,712
June 534,415 3457 20,277 16,763 114,926 1,652,427 669,618 1,672,647
Note = Consumers means average number of consumers during the year. Theoritically it should be average of consumers for the
whoel year.However, as per convention, number of consumers as obtained in June of the year is considered to be the average of
whole year.
Source: Sui Southern Gas Company Limited (Formerly Karachi and Indus Gas Company Limited).
189
BY MONTH/GROUPS IN SINDH, 2012-13 TO 2013-14
2013-14
7.11 CONSUMPTION AND NUMBER OF CONSUMERS OF KARACHI GAS
2012-13
(Consumption in "000" Cubic Metres)

7.12 CONSUMPTION AND NUMBER OF CONSUMERS OF INDUS GAS
INDUSTRIAL COMMERCIAL DOMESTIC TOTAL
MONTH Consump- No. of Consump- No. of Consump- No. of Consump- No. of
tion Consumers tion Consumers tion Consumers tion Consumers
TOTAL 1,368,598 636 49,256 4,756 662,716 674,096 2,080,570 679,488July 113,097 628 3,890 4,869 38,852 640,139 155,839 645,636August 117,400 626 3,817 4,841 38,979 642,776 160,196 648,243September 98,109 629 3,798 4,829 39,043 644,154 140,950 649,612October 114,604 629 4,007 4,832 38,684 645,401 157,295 650,862November 99,806 631 3,807 4,824 43,180 646,170 146,793 651,625December 99,686 636 4,249 4,786 74,529 649,865 178,646 655,287January 104,716 637 4,545 4,790 84,851 654,708 194,112 660,135February 126,346 637 4,000 4,801 85,128 658,688 215,474 664,126March 132,644 639 4,143 4,795 64,834 663,357 201,621 668,791April 128,724 636 4,222 4,780 53,238 667,047 186,184 672,463May 121,116 635 4,364 4,784 68,927 670,163 194,407 675,582June 112,350 636 4,414 4,756 32,471 674,096 149,235 679,488
TOTAL 1,297,634 643 48,947 4,617 563,341 707,594 1,909,922 712,854July 104,402 635 3,493 4,726 38,661 676,348 146,556 681,709August 115,186 635 3,744 4,718 41,267 678,539 160,197 683,892September 103,361 638 3,995 4,691 41,572 680,263 148,928 685,592October 104,753 638 3,882 5,065 40,265 683,121 148,900 688,824November 101,378 640 3,922 4,677 43,915 686,894 149,215 692,211December 103,198 640 4,206 4,669 26,893 691,373 134,297 696,682January 102,340 643 4,375 4,919 74,171 693,994 180,886 699,256February 93,320 646 4,138 4,647 64,417 697,452 161,875 702,745March 115,649 645 4,109 4,636 50,737 700,653 170,495 705,934April 106,336 646 4,221 4,328 53,395 704,409 163,952 709,683May 120,999 644 4,324 4,618 43,206 706,040 168,529 711,302June 126,712 643 4,538 4,617 44,842 707,594 176,092 712,854Note = Consumers means average number of consumers during the year. Theoritically it should be average of consumers for the whole
whole year. However, as per convention, number of consumers as obtained in June of the year is considered to be the average of
whole year.
Source:- Sui Southern Gas Company Limltied (Formerly Karachi and Indus Gas Company Limited).
190
GAS
2013-14
BY MONTH/GROUPS IN SINDH, 2012-13 TO 2013-14
2012-13
(Consumption in "000" Cubic Metres)

(In "000" Kgs.)
Bentonite 620 632 1,330 975 " -
Clay .. .. .. 35,414 174,236 16,207
China Clay 7282 11340 19,760 17,963 15,151 8,165
Clay (Shale) 557552 526074 1,384,097 440,560 567,443 500,955
Coal 827306 1241727 1,623,468 1,354,118 801,504 1,033,571
Chalk 6874 8719 1,599 2,909 1,747 1,570
Dolomite 23744 24202 34,327 37,664 34,671 26,866
Fuller's Earth 6541 25403 3,493 11,577 7,746 7,174
Ord.Sand .. .. .. 2,296 15,965 8,860
Q.Sand Stone .. .. .. 544 .. ..
Gravel 62,345 79925 51,585 46,767 553,730 178,930
Lake Salt 46484 178424 292,925 292,567 315,554 101,880
Lime Stone 6,603,277 6375438 6,492,329 4,772,049 7,035,275 4,608,292
Laterite 27880 133431 189577 35553 118858 106571
Marble 255 75 825 5,750 3,780 1,950
silica Sand 59818 149774 58,308 43,849 49,667 5,950
Trona 127 185 160 588 10 675
Ball Clay .. .. .. 185 135 -
Granite .. .. .. .. .. -
2009 20142012 2013
191
MINING
2009 TO 2014
2010 2011MINERAL
7.13 PRODUCTION OF SELECTED MINERALS IN SINDH,

8.00 PUBLIC FINANCE

2014-15SECTOR Budget Budget Revised Budget Revised Estimate Estimate Estimate Estimate Estimate
Agriculture 6,025.269 8,598.123 4,330.280 7,989.968 6,177.394
Forestry 2,111.234 2,345.923 502.630 955.000 396.413
Fuel and Energy 20,475.097 22,292.000 15,031.760 13,585.000 5,580.374
Mining and Manufacturing 404.978 562.469 129.612 1,859.000 180.241
Housing and Community Amenities 1,659.708 2,836.752 3,853.350 3,133.000 2,055.639
Construction and Transport 15,614.815 22,057.241 15,355.930 19,000.000 20,882.506
Education 10,889.200 13,735.000 5,836.575 12,550.000 6,129.543
Health 13,224.924 17,000.000 11,886.613 11,000.000 14,511.071
Promotion of Cultural Activities 756.000 1,257.943 370.834 800.000 693.610
Sports & Youth affairs .. 1,600.000 746.485 808.000 703.060
Auqaf .. 370.000 371.494 350.000 369.894
Information & Archives .. 335.338 264.642 362.000 249.300
Information Technology 3,571.756 8,910.838 2,335.752 4,860.530 1,573.960
Poverty Alleviation .. 12,025.338 .. .. 3,251.981
Women's Development 313.200 435.000 126.219 435.000 33.006
Special Projects .. .. .. 23,952.406 7,264.585
Antiquities .. 585.000 177.629 585.000 129.878
Special Packages 11,733.000 14,029.499 4,284.513 10,600.000 6,551.725
Population Welfare Programme .. 1,122.000 1,133.493 362.222 1,238.849
Human Rights .. 50.000 49.280 137.000 78.774
Enviornment Protection 2,218.504 2,402.887 1,693.909 1,395.000 2,535.824
Provincial Contribution-A 167,977.500 184,977.500 115,000.000 180,977.500 97,466.417
Federal Assistance-B - 22.500 - 22.500 33.583
Foreign Project Assistance-C 24,884.718 29,557.938 23,513.369 35,657.290 32,387.205
DERA- D -
Other Federal Grants-E 22,474.096 15,379.015 13,500.000 14,516.900 13,391.000
Total Development Expenditure( AtoE) 215,336.314 229,936.953 152,013.369 231,174.190 143,278.205
Contd.
195
8.01 SECTOR WISE DEVELOPMENT EXPENDITURE OF SINDH GOVERNMENT BUDGET, 2010-11 TO 2014-15
PUBLIC FINANCE
(Rs. in Million)2012-132013-14

SECTOR Budget Revised Budget Revised Estimate Estimate Estimate Estimate
Agriculture 5,075.980 8,096.008 2,916.629 5,926.795
Forestry & Wildlife 697.305 1,998.080 763.528 418.112
Fuel and Energy 3,718.973 5489.067 4,590.575 4,158.794
Mining and Manufacturing 1,358.000 1,317.138 1,412.211 635.097
Housing and Community Amenities 1,057.887 2,480.542 1,342.331 1,005.331
Construction and Transport 13,085.894 44,368.528 15,842.551 13,786.009
Education 8,237.627 11,006.093 6,939.912 5,963.053
Health 6,930.000 8,535.888 3,479.238 4,227.188
Promotion of Cultural Activities 591.840 324.385 468.633 397.100
Sports & Youth affairs 403.000 552.939 76.000 431.036
Auqaf 240.000 444.239 .. 173.215
Information & Archives .. .. 17.707 ..
Information Technology 1,396.350 1557.531 70.086 150.790
Poverty Alleviation 19,300.000 113.314 8,096.000 1,448.389
Women's Development 317.847 64.011 663.554 72.084
Special Projects 14,144.044 9,290.142 .. 3,708.314
Antiquities 427.000 246.157 100.376 94.432
Special Packages 10,000.000 7,798.333 69,034.947 9,487.816
Population Welfare Programme .. .. .. ..
Human Rights 100.000 33.421 .. 150.406
Enviornment Protection 918.612 175.212 1,406.287 196.343
Provincial Contribution-A 110,977.510 121,978.000 114,977.500 52,491.870
Federal Assistance-B 22.500 22.000 22.500 22.500
Foreign Project Assistance-C 20,156.667 22,837.000 4,760.000 3,879.592
DERA- D 172.167 23.085 892.771 148.395
Other Federal Grants-E 9,761.234 11,000.000 14,433.000 9,008.947
Total Development Expenditure( AtoE) 141,090.078 155,860.085 135,085.771 65,551.304
Source:- Annual Budget Statement, Finance Department, Government of Sindh.
2011-12
196
PUBLIC FINANCE
8.01 SECTOR WISE DEVELOPMENT EXPENDITURE OF SINDH GOVERNMENT BUDGET, 2010-11 TO 2014-15
(Rs.in Million)2010-11
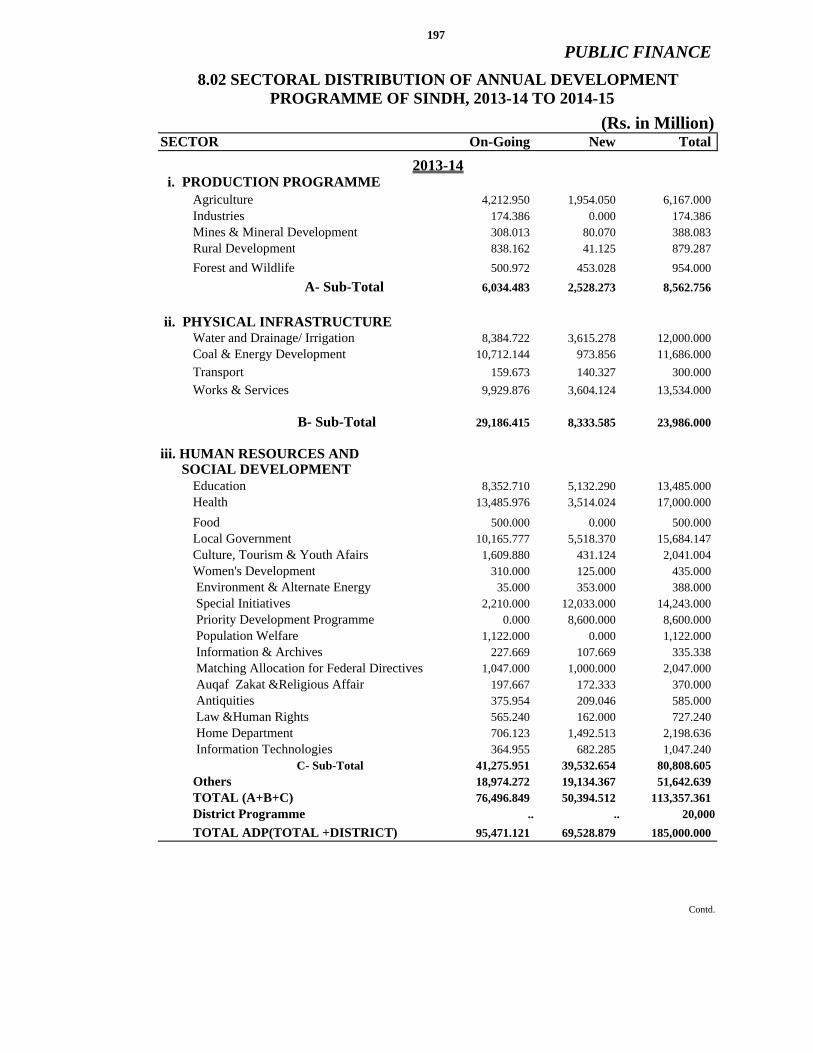
(Rs. in Million)SECTOR On-Going New Total
i. PRODUCTION PROGRAMME Agriculture 4,212.950 1,954.050 6,167.000
174.386 0.000 174.386 Mines & Mineral Development 308.013 80.070 388.083 Rural Development 838.162 41.125 879.287
Forest and Wildlife 500.972 453.028 954.000
A- Sub-Total 6,034.483 2,528.273 8,562.756
ii. PHYSICAL INFRASTRUCTURE Water and Drainage/ Irrigation 8,384.722 3,615.278 12,000.000 Coal & Energy Development 10,712.144 973.856 11,686.000
Transport 159.673 140.327 300.000
Works & Services 9,929.876 3,604.124 13,534.000
B- Sub-Total 29,186.415 8,333.585 23,986.000
iii. HUMAN RESOURCES AND SOCIAL DEVELOPMENT Education 8,352.710 5,132.290 13,485.000 Health 13,485.976 3,514.024 17,000.000
Food 500.000 0.000 500.000 Local Government 10,165.777 5,518.370 15,684.147 Culture, Tourism & Youth Afairs 1,609.880 431.124 2,041.004 Women's Development 310.000 125.000 435.000 Environment & Alternate Energy 35.000 353.000 388.000 Special Initiatives 2,210.000 12,033.000 14,243.000 Priority Development Programme 0.000 8,600.000 8,600.000 Population Welfare 1,122.000 0.000 1,122.000 Information & Archives 227.669 107.669 335.338 Matching Allocation for Federal Directives 1,047.000 1,000.000 2,047.000 Auqaf Zakat &Religious Affair 197.667 172.333 370.000 Antiquities 375.954 209.046 585.000 Law &Human Rights 565.240 162.000 727.240 Home Department 706.123 1,492.513 2,198.636 Information Technologies 364.955 682.285 1,047.240
C- Sub-Total 41,275.951 39,532.654 80,808.605 Others 18,974.272 19,134.367 51,642.639 TOTAL (A+B+C) 76,496.849 50,394.512 113,357.361 District Programme .. .. 20,000
TOTAL ADP(TOTAL +DISTRICT) 95,471.121 69,528.879 185,000.000
2013-14
197
8.02 SECTORAL DISTRIBUTION OF ANNUAL DEVELOPMENT PROGRAMME OF SINDH, 2013-14 TO 2014-15
PUBLIC FINANCE
Contd.
Industries
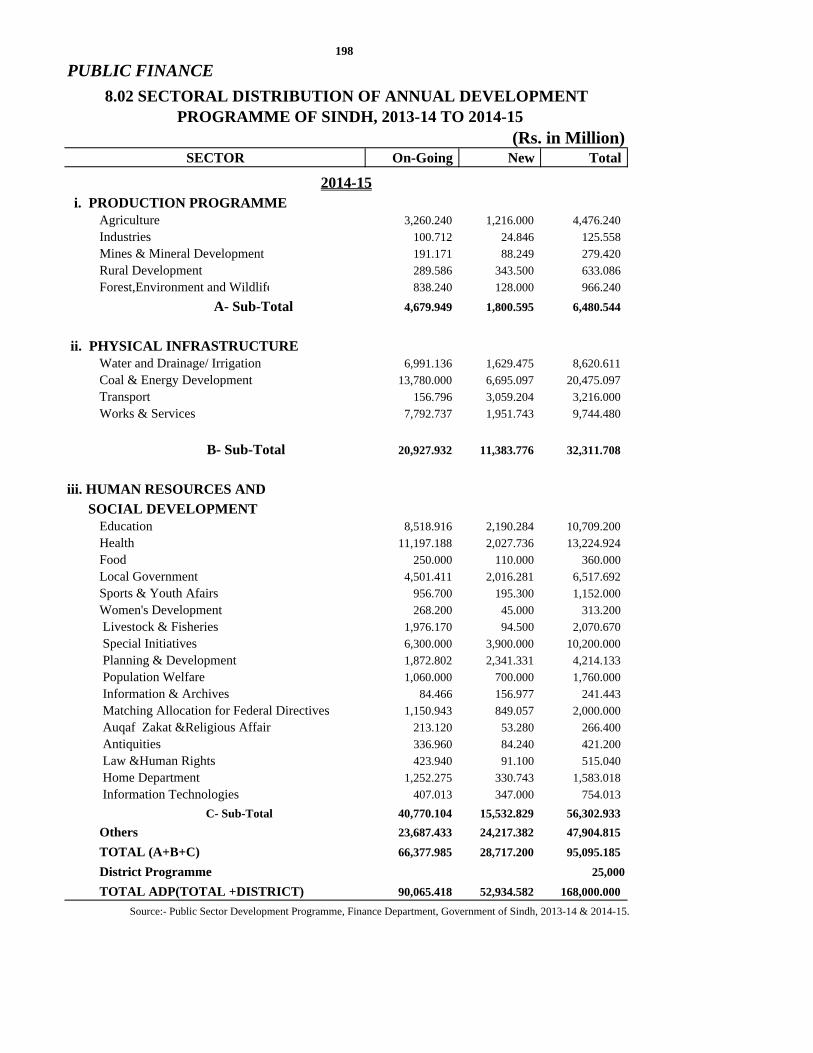
(Rs. in Million)On-Going New Total
i. PRODUCTION PROGRAMME Agriculture 3,260.240 1,216.000 4,476.240
100.712 24.846 125.558
Mines & Mineral Development 191.171 88.249 279.420
Rural Development 289.586 343.500 633.086
838.240 128.000 966.240
A- Sub-Total 4,679.949 1,800.595 6,480.544
ii. PHYSICAL INFRASTRUCTURE
Water and Drainage/ Irrigation 6,991.136 1,629.475 8,620.611
Coal & Energy Development 13,780.000 6,695.097 20,475.097
Transport 156.796 3,059.204 3,216.000
Works & Services 7,792.737 1,951.743 9,744.480
B- Sub-Total 20,927.932 11,383.776 32,311.708
iii. HUMAN RESOURCES AND
SOCIAL DEVELOPMENT Education 8,518.916 2,190.284 10,709.200
Health 11,197.188 2,027.736 13,224.924
Food 250.000 110.000 360.000
Local Government 4,501.411 2,016.281 6,517.692
Sports & Youth Afairs 956.700 195.300 1,152.000
Women's Development 268.200 45.000 313.200
Livestock & Fisheries 1,976.170 94.500 2,070.670
Special Initiatives 6,300.000 3,900.000 10,200.000
Planning & Development 1,872.802 2,341.331 4,214.133
Population Welfare 1,060.000 700.000 1,760.000
Information & Archives 84.466 156.977 241.443
Matching Allocation for Federal Directives 1,150.943 849.057 2,000.000
Auqaf Zakat &Religious Affair 213.120 53.280 266.400
Antiquities 336.960 84.240 421.200
Law &Human Rights 423.940 91.100 515.040
Home Department 1,252.275 330.743 1,583.018
Information Technologies 407.013 347.000 754.013
C- Sub-Total 40,770.104 15,532.829 56,302.933
Others 23,687.433 24,217.382 47,904.815
TOTAL (A+B+C) 66,377.985 28,717.200 95,095.185
District Programme 25,000
TOTAL ADP(TOTAL +DISTRICT) 90,065.418 52,934.582 168,000.000
Source:- Public Sector Development Programme, Finance Department, Government of Sindh, 2013-14 & 2014-15.
Industries
2014-15
198
PUBLIC FINANCE
8.02 SECTORAL DISTRIBUTION OF ANNUAL DEVELOPMENT PROGRAMME OF SINDH, 2013-14 TO 2014-15
SECTOR
Forest,Environment and Wildlife

PUBLIC FINANCE
8.03 SUMMARY STATEMENT OF REVENUE RECEIPTS OF SINDH,
(Rs. in Million)Budget Revised Budget Revised
Estimate Estimate Estimate Estimate
GENERAL REVENUE RECEIPTS
TAX REVENUE
Direct Taxes (Income & Wealth) 103,666.500 105,907.800 133,627.700 112287.1
Indirect Taxes 218,663.800 225,974.000 263,413.300 239,083.600
TOTAL TAX REVENUE 322,330.300 331,881.800 397,041.000 351,370.700
NON TAX RECEIPTS
Income from Property and Enterprise 2,773.691 2,772.190 2,716.097 2,026.402
Receipts from Civil Admn. and Other 2,277.700 1,986.435 2,649.260 2,461.393
Functions
Development Surcharge & Royalties 43,020.603 45,636.281 49,766.934 46,376.609
Miscellaneous Receipts 14,811.500 13,698.975 18,078.621 11,514.080
TOTAL NON TAX REVENUE 79,438.237 84,009.239 96,019.979 86,415.233
TOTAL GENERAL REVENUE 401,768.520 415,891.013 493,060.897 429,438.249
RECEIPTS
GENERAL REVENUE RECEIPTSTAX REVENUEDirect Taxes (Income & Wealth) 224,950.000 128,398.000 169,292.103 158,063.447
Indirect Taxes 291,956.100 276,480.900 326,714.625 121,699.444
TOTAL TAX REVENUE 516,906.100 404,878.900 496,006.728 279,762.891
NON TAX RECEIPTSIncome from Property and Enterprise 2,578.369 1229.515 1,193.935 ..
Receipts from Civil Admn. and Other 3,042.250 2497.623 3,443.584 3,245.821
Functions
Development Surcharge & Royalties 60,046.064 64601.843 74,931.801 51,559.828
Miscellaneous Receipts 23,192.150 7131.652 13,397.846 13,595.644
TOTAL NON TAX REVENUE 113,224.333 94578.184 125,694.339 96,349.707
TOTAL GENERAL REVENUE 544,610.427 499,538.712 621,795.009 568,240.983
RECEIPTS
199
2011-12 TO 2014-15
RECEIPT
Source:- Annual Budget Statements, Finance Department, Government of Sindh.
2012-13
2013-14
2011-12
2014-15

8.04 SUMMARY STATEMENT OF REVENUE EXPENDITURE OF SINDH, 2011-12 TO 2014-15
(Rs. in Million)Budget Revised Budget Revised
Estimate Estimate Estimate Estimate
General Public Service 179,826.394 125,094.246 96,811.332 96,962.914
Public Order & Safety Affairs 39,656.079 45,813.763 47,166.214 52,777.672
Economic Affairs 20,782.365 34,387.499 30,997.388 43,238.997
Environment Protection 480.262 151.063 390.438 167.682
Housing & Community Amenities 1,161.962 2,308.124 1,399.010 1,611.522
Health (Public Health Services) 13,890.718 24,176.139 34,727.070 34,132.447
Recreational, Cultural & Religion 1,108.346 1,714.986 2,626.586 3,419.500
Education Affairs & Services 25,711.886 56,247.442 99,357.903 105,444.982
Social Protection 529.557 19,565.684 1,825.362 4,354.741
TOTAL CURRENT REVENUE 283,147.569 309,458.946 315,301.303 342,110.457
EXPENDITURE
Revenue Surplus (+) / (-) Deficit 118,620.951 106,432.067 100,589.710 73,780.556
Total General Revenue Reciepts 401,768.520 415,891.013 415,891.013 415,891.013
General Public Service 103,397.605 112,641.388 130,006.389 138,411.020
Public Order and Safety Affairs 54,429.334 63,888.890 66,610.884 72,647.564
Economic Affairs 34,373.445 37,408.163 47,642.706 59,693.246
Environment Protection 413.697 357.526 1,777.914 1,058.145
Housing and Community Amenities 2,462.972 2,725.514 2,713.976 2,170.111
Health (Public Health Services) 36,400.538 36,209.568 43,583.916 43,824.043
Recreational, Culture and Religion 1,789.768 4,861.703 5,300.976 5,959.851
Education Affairs and Services 120,502.386 107,720.796 134,377.919 126,795.205
Social Protection 2,204.040 2,589.810 4,076.091 4,009.221
TOTAL CURRENT REVENUE 355,973.785 368,403.358 436,090.771 454,568.406
EXPENDITURE Revenue Surplus (+) / (-) Deficit 188,636.642 131,135.354 63,447.941 44,970.306
Total General Revenue Receipts 544,610.427 499,538.712 499,538.712 499,538.712
Source:- Annual Budget Statements Volume-I, Finance Department, Government of Sindh.
CURRENT REVENUE EXPENDITURE
2014-152013-14
200
2012-13
PUBLIC FINANCE
2011-12
CURRENT REVENUE EXPENDITURE
DISBURSEMENT

PUBLIC FINANCE
8.05 SUMMARY STATEMENT OF CAPITAL RECEIPTS OF SINDH,
(Rs. in Million) RECEIPT Budget Revised Budget Revised
Estimate Estimate Estimate Estimate
GENERAL CAPITAL RECEIPTS
CAPITAL RECEIPTS
Recoveries of Investment 105.000 105.000 105.000 0.000
Recoveries of Loans and Advances 6,776.745 6,744.545 6,828.077 10,962.377
Public Debt 20,121.875 9,543.875 21,266.441 9,771.000
TOTAL GENERAL 27,003.620 16,393.420 28,199.518 20,733.377CAPITAL RECEIPTS
GENERAL CAPITAL RECEIPTS
CAPITAL RECEIPTS
Recoveries of Investment 105.000 0.000 105.000 0.000
Recoveries of Loans and Advances 7,062.636 1,185.947 1,385.777 6,000.000
Public Debt 11,275.290 10,652.500 16,947.920 14,988.600
TOTAL GENERAL 18,442.926 11,838.447 18,438.697 20,988.600CAPITAL RECEIPTS
Source:- Annual Budget Statements, Finance Department, Government of Sindh.
201
2011-12 TO 2014-15
2014-152013-14
2011-12 2012-13
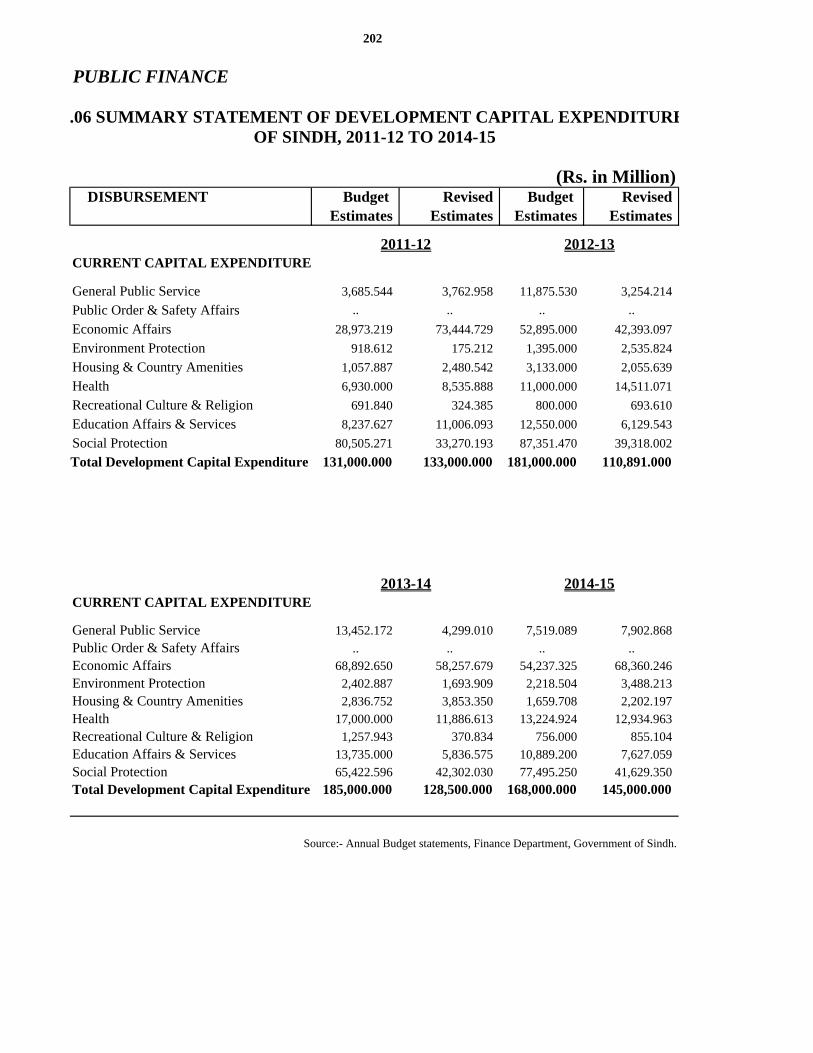
.06 SUMMARY STATEMENT OF DEVELOPMENT CAPITAL EXPENDITUREOF SINDH, 2011-12 TO 2014-15
(Rs. in Million) DISBURSEMENT Budget Revised Budget Revised
Estimates Estimates Estimates Estimates
CURRENT CAPITAL EXPENDITURE
General Public Service 3,685.544 3,762.958 11,875.530 3,254.214
Public Order & Safety Affairs .. .. .. ..
Economic Affairs 28,973.219 73,444.729 52,895.000 42,393.097
Environment Protection 918.612 175.212 1,395.000 2,535.824
Housing & Country Amenities 1,057.887 2,480.542 3,133.000 2,055.639
Health 6,930.000 8,535.888 11,000.000 14,511.071
Recreational Culture & Religion 691.840 324.385 800.000 693.610
Education Affairs & Services 8,237.627 11,006.093 12,550.000 6,129.543
Social Protection 80,505.271 33,270.193 87,351.470 39,318.002
131,000.000 133,000.000 181,000.000 110,891.000
CURRENT CAPITAL EXPENDITURE
General Public Service 13,452.172 4,299.010 7,519.089 7,902.868
Public Order & Safety Affairs .. .. .. ..Economic Affairs 68,892.650 58,257.679 54,237.325 68,360.246
Environment Protection 2,402.887 1,693.909 2,218.504 3,488.213
Housing & Country Amenities 2,836.752 3,853.350 1,659.708 2,202.197
Health 17,000.000 11,886.613 13,224.924 12,934.963
Recreational Culture & Religion 1,257.943 370.834 756.000 855.104
Education Affairs & Services 13,735.000 5,836.575 10,889.200 7,627.059
Social Protection 65,422.596 42,302.030 77,495.250 41,629.350
185,000.000 128,500.000 168,000.000 145,000.000
2013-14 2014-15
Source:- Annual Budget statements, Finance Department, Government of Sindh.
202
PUBLIC FINANCE
Total Development Capital Expenditure
Total Development Capital Expenditure
2012-132011-12

PUBLIC FINANCE
(Rs. in Million)Hyderabad Karachi
Region Region 1994-95 23,102.08 8,634.000 5,993.12 8,474.961995-96 18,059.13 7,174.000 6,927.08 9,358.051996-97 26,104.16 8,475.000 6,563.50 11,065.661997-98 21,090.10 .. 7,283.41 13,806.691998-99 23,662.31 .. 5,265.82 18,396.491999-00 23,162.26 .. 5,265.82 (R) 17,896.442000-01 42,904.03 28,241.345 5,265.82 (R) 9,397.872001-02 43,350.41 30,190.427 5,265.82 (R) 7,895.162002-03(R) 43,350.41 30,190.427 5,265.82 7,895.162003-04(R) 43,350.41 30,190.427 5,265.82 7,895.16
Source: Directorate of Central Excise and Land Customs Karachi / Hyderabad Government of Pakistan.
(Rs in "000")Type of Taxes 2009-10 2010-11 2011-12 2012-13 2013-14
TOTAL 16,557,902 19,998,816 28,784,588 24,747,815 31,696,609
Property & Betterment Tax 1,383,924 1,363,111 1,483,602 1,482,996 327,497
Entertainment Tax 27,519 28,289 284,497 27,549 47,709
Motor Vehicles Tax 2,370,852 1,672,890 3,190,503 1,734,440 4,871,218
Cotton Fees 167,086 162,722 98,574 143,948 308,291
Tax on Hotels 137,554 142,245 159,900 158,937 0
Excise Enactment 1,001,292 2,897,932 2,832,626 3,086,922 3,380,843
Professional Tax 219482 229,919 267,090 264,422 358,440
Tax on Vacant Plots/Arrears/ 11,250,193 13,501,708 20,467,796 17,848,601 22,402,611
Infrastructure Fee
Source:- Directorate of Excise & Texation Department, Government of Sindh, Karachi.
203
YEAR SINDH Sales Tax
2009-10 to 2013-14
8.07 CENTRAL EXCISE DUTY RECOVERED BY REGION IN SINDH,1994-95 TO 2003-04
8.08 PROVINCIAL EXCISE DUTY AND TAXES RECOVERED IN SINDH,

(Rs. in "000")
Type of Taxes SINDH Sukkur Khairpur S.B.Abad N. Feroze Ghotki Larkana Jacobabad
TOTAL 25,966,389 404,581 29,995 114,236 23,461 24,635 147,003 32,780
Property/Betterment Tax 1,482,996 19,844 3,199 5,283 .. 3,853 9,206 2,520
Entertainment Tax 27,549 64 37 40 25 6 .. 7
Motor Vehicles Tax 1,734,440 93,478 13,536 30,311 12,154 3,119 38,725 746
Cotton Fees 143,948 13,060 7,509 10,068 7,503 8,765 .. ..
Tax on Hotels 158,937 855 155 119 194 46 480 154
Excise Enactment 3,086,922 270,524 1,574 64,423 1,319 6,041 97,274 27,699
Professional Tax 1,482,996 6,756 3,985 3,992 2,266 2,805 1,318 1,654
Tax on Vacant Plots/Arrears/Infrastructure Fee
17,848,601 .. .. .. .. .. .. ..
Contd.
204
PUBLIC FINANCE
BY DISTRICT IN SINDH, 2012-13 to 2013-14
2012-13
8.09 PROVINCIAL EXCISE DUTY AND TAXES RECOVERED
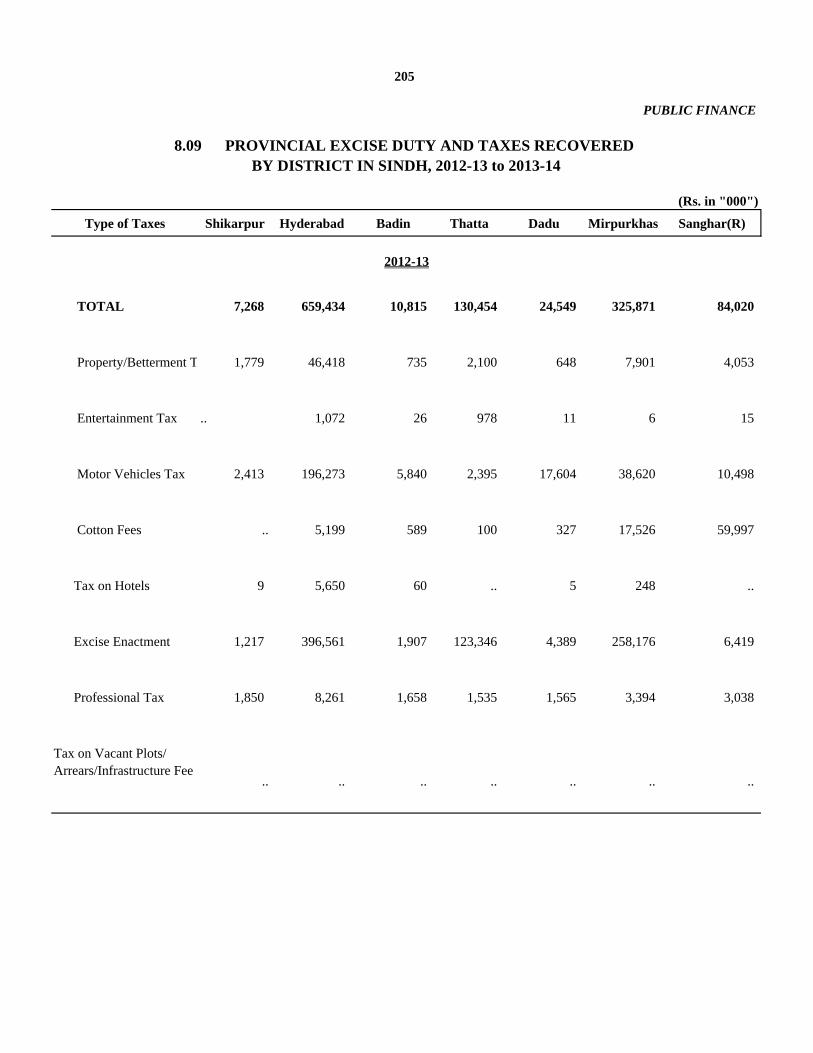
(Rs. in "000")
Type of Taxes Shikarpur Hyderabad Badin Thatta Dadu Mirpurkhas Sanghar(R)
TOTAL 7,268 659,434 10,815 130,454 24,549 325,871 84,020
Property/Betterment T 1,779 46,418 735 2,100 648 7,901 4,053
Entertainment Tax .. 1,072 26 978 11 6 15
Motor Vehicles Tax 2,413 196,273 5,840 2,395 17,604 38,620 10,498
Cotton Fees .. 5,199 589 100 327 17,526 59,997
Tax on Hotels 9 5,650 60 .. 5 248 ..
Excise Enactment 1,217 396,561 1,907 123,346 4,389 258,176 6,419
Professional Tax 1,850 8,261 1,658 1,535 1,565 3,394 3,038
Tax on Vacant Plots/Arrears/Infrastructure Fee
.. .. .. .. .. .. ..
205
PUBLIC FINANCE
BY DISTRICT IN SINDH, 2012-13 to 2013-14
2012-13
8.09 PROVINCIAL EXCISE DUTY AND TAXES RECOVERED

(Rs. in "000")
Tharparkar Umer- Jam- Mat- Tando T.M Kandhkot Kamber '@
@ Mithi Kot shoro iari Allahyar Khan @Kashmore ShahdadKot
TOTAL 5,818 22,537,134 47,266 30,456 10,944 4,653 8,321 79,392 4,729
Property/Betterment Tax .. 1,352,088 .. 16,828 916 646 1,207 1,259 2,513
Entertainment Tax .. 25,250 .. 3 .. 3 .. .. 6
Motor Vehicles Tax 2,310 1,256,480 2,814 2,113 220 1,322 1,362 1,366 741
Cotton Fees .. .. 206 5,639 5,004 1,063 1,393 .. ..
Tax on Hotels 30 150,893 39 .. .. .. .. .. ..
Excise Enactment 2,108 1,693,149 42,917 3,547 3,054 998 3,489 76,115 676
Professional Tax 1,370 210,673 1,290 2,326 1,750 621 870 652 793
Tax on Vacant Plots/Arrears/Infrastructure Fee
.. 17,848,601 .. .. .. .. .. .. ..
206
PUBLIC FINANCE
BY DISTRICT IN SINDH, 2012-13 to 2013-14
2012-13
Type of Taxes Karachi
8.09 PROVINCIAL EXCISE DUTY AND TAXES RECOVERED

(Rs. in "000")
Type of Taxes SINDH Sukkur Khairpur S.B.abad N. Feroze Ghotki Larkana Jacobabad
TOTAL 31,696,609 392,656 31,313 150,209 27,871 28,886 164,313 34,070
Property/Betterment Tax 327,497 21,544 3,551 4,709 - 7,166 11,079 2,791
Entertainment Tax 47,709 71 40 42 27 10 - 7
Motor Vehicles Tax 4,871,218 11,249 11,314 32,490 13,534 2,735 41,806 3,219
Cotton Fees 308,291 15,454 9,652 12,312 10,011 8,750 - -
Tax on Hotels - - - - - - - -
Excise Enactment 3,380,843 337,217 2,181 96,938 1,545 7,379 109,579 28,016
Professional Tax 358,440 7,121 4,575 3,718 2,754 2,846 1,849 37
Tax on Vacant Plots/ 22,402,611
Arrears/Infrastructure Fee - - - - - - -
*Hotel Tax has been obolished via finance bill 2013.Contd.
207
PUBLIC FINANCE
BY DISTRICT IN SINDH, 2012-13 TO 2013-14
2013-14
8.09 PROVINCIAL EXCISE DUTY AND TAXES RECOVERED

Type of Taxes Shikarpur Hyderabad Badin Thatta Dadu Mirpurkhas Sanghar Jam.Shoro
TOTAL 8,109 749,643 15,695 24,637 20,680 338,153 85,020 35,908
Property/Betterment Tax 1,753 53,298 692 1,534 843 8,219 4,208 18,020
Entertainment Tax 0 1,128 45 1,207 19 8 16 3
Motor Vehicles Tax 3,330 218,052 10,277 1,792 13,305 38,091 11,159 6,216
Cotton Fees 0 6,609 844 186 443 15,047 60,027 6,030
Tax on Hotels 0 - - - - - - -
Excise Enactment 1,458 462,350 2,112 17,972 4,971 273,905 5,952 2,790
Professional Tax 1,568 8,206 1,725 1,946 1,099 2,883 3,658 2,849
Tax on Vacant Plots/
Arrears/Infrastructure Fee 0 - - - - - - -
Contd.
PUBLIC FINANCE
2013-14
8.09 PROVINCIAL EXCISE DUTY AND TAXES RECOVERED BY DISTRICT IN SINDH, 2012-13 TO 2013-14
(Rs. in "000")
208
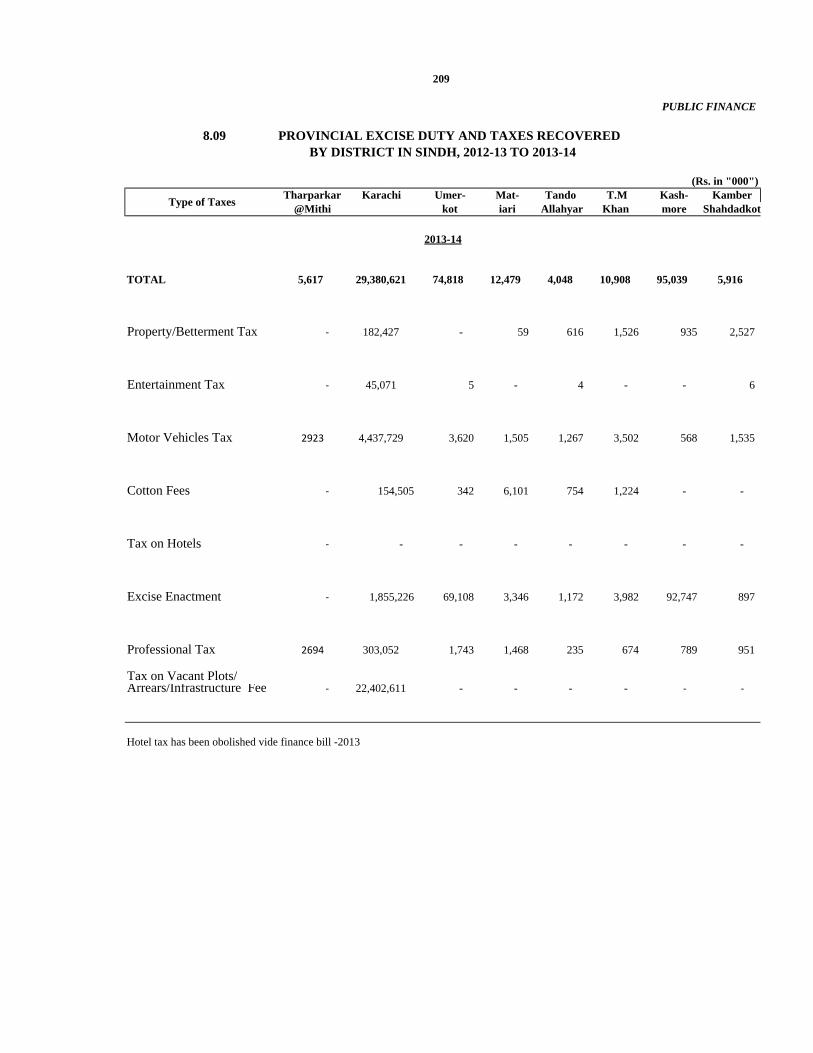
(Rs. in "000")Tharparkar Karachi Umer- Mat- Tando T.M Kash- Kamber
@Mithi kot iari Allahyar Khan more Shahdadkot
TOTAL 5,617 29,380,621 74,818 12,479 4,048 10,908 95,039 5,916
Property/Betterment Tax ‐ 182,427 - 59 616 1,526 935 2,527
Entertainment Tax ‐ 45,071 5 - 4 - - 6
Motor Vehicles Tax 2923 4,437,729 3,620 1,505 1,267 3,502 568 1,535
Cotton Fees ‐ 154,505 342 6,101 754 1,224 - -
Tax on Hotels ‐ - - - - - - -
Excise Enactment ‐ 1,855,226 69,108 3,346 1,172 3,982 92,747 897
Professional Tax 2694 303,052 1,743 1,468 235 674 789 951
Tax on Vacant Plots/Arrears/Infrastructure Fee ‐ 22,402,611 - - - - ‐ ‐
Hotel tax has been obolished vide finance bill -2013
2013-14
209
PUBLIC FINANCE
BY DISTRICT IN SINDH, 2012-13 TO 2013-14
Type of Taxes
8.09 PROVINCIAL EXCISE DUTY AND TAXES RECOVERED
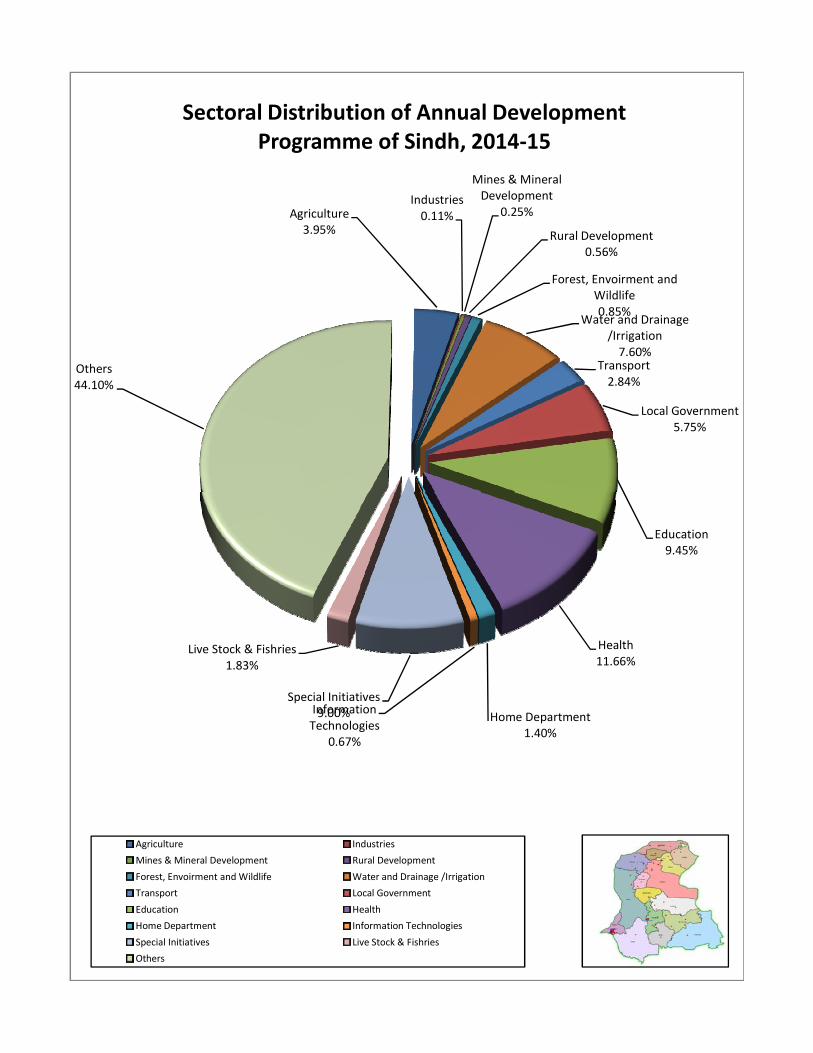
Agriculture3.95%
Industries 0.11%
Mines & Mineral Development
0.25%
Rural Development0.56%
Forest, Envoirment and Wildlife0.85%
Water and Drainage /Irrigation7.60%
Transport 2.84%
Local Government5.75%
Others44.10%
Sectoral Distribution of Annual Development Programme of Sindh, 2014‐15
Education9.45%
Health11.66%
Home Department1.40%
Information Technologies
0.67%
Special Initiatives9.00%
Live Stock & Fishries1.83%
Agriculture Industries
Mines & Mineral Development Rural Development
Forest, Envoirment and Wildlife Water and Drainage /Irrigation
Transport Local Government
Education Health
Home Department Information Technologies
Special Initiatives Live Stock & Fishries
Others

9.00 FINANCIAL INSTITUTIONS

FINANCIAL INSTITUTIONS
(Rs. in Million)
2001-02 -- 5,864.90 6,042.83
2002-03 -- 4,731.79 5,165.18
2003-04 -- 4,247.81 4,696.46
2004-05 -- 5,206.13 5,516.58
2005-06 -- 6,002.53 5,993.15
2006-07 -- 7,065.59 7,172.52
2007-08 38,063 8,461.51 7,751.48
2008-09 42,128 9,266.19 8,305.94
2009-10 44,233 9941.34 9148.64
2010-11 35,327 8093.51 8496.16
2011-12 32,058 7616.7 7625.23
2012-13 34636 8559214 8778522
2013-14 39797 10668.061 10166.82Source:- Zarai Taraqiati Bank Limited.
215
9.01 ZARAI TARAQIATI BANK LIMITED FINANCING IN SINDH,
YEAR
2001-02 TO 2013-14
DISBURSED RECOVEREDNUMBERS

(Rs. in Million)LOANS RECOVERED
Number Amount Amount
SINDH 34,636 8,559,214 8778522Jacobabad 557 164603 151,452Kashmore@Kandhkot 571 165,954 165,716Shikarpur 1,049 255,375 269,710Larkana 1,361 214,468 250,815Kamber Shahdadkot 1,878 468,338 515,692Sukkur 1,632 362,025 350,364Ghotki 4119 1056183 1,117,567Khairpur 5,890 1,767,914 1,827,170Naushero Feroze 1,341 304,322 348,820S.B. Abad 1,690 393,450 407,730Dadu 784 161,845 190,668Jamshoro 275 49,004 56,953Hyderabad 742 145,578 139,618Matiari 1,080 211,412 223,981Tando Muhammad Khan 603 133,693 131,276Tando Allah Yar 1,067 207,995 215,919Thatta 1,721 370,874 356,853Badin 2,197 297,690 290,924Sanghar 3,829 819,130 837,149Mirpurkhas 1,554 390,578 405,622Umerkot 768 249,663 247,766Tharparkar@Mithi 127 25,963 22,288Karachi 691 343,157 254,469
SINDH 39,797 106,668.061 10166.828Jacobabad 1091 418.013 400.035Kashmore@Kandhkot 795 279.605 226.078Shikarpur 1,366 365.791 346.049Larkana 1,425 260.763 268.064Kamber Shahdadkot 2,418 644.552 618.877Sukkur 1,668 415.19 410.406Ghotki 4359 1270.18 1259.505Khairpur 6,699 2097.511 1785.33Naushero Feroze 1,608 399.989 399.945S.B. Abad 2,053 504.009 492.653Dadu 935 202.117 222.168Jamshoro 394 76.442 73.978Hyderabad 883 188.434 169.805Matiari 1,215 274.258 271.145Tando Muhammad Khan 753 168.283 159.568Tando Allah Yar 1,175 255.673 258.782Thatta 2,145 493.506 456.628Badin 1,836 450.217 399.36Sanghar 3,822 876.681 899.606Mirpurkhas 1,514 417.883 417.278Umerkot 771 232.66 259.445Tharparkar@Mithi 149 29.575 26.48Karachi 723 346.729 345.643
Source:- Zarai Taraqiati Bank Limited.
2013-14
2012-13
District/Province
216
9.02 ZARAI TARAQIATI BANK LIMITED FINANCING BY DISTRICT IN SINDH, 2012-13 TO 2013-14
FINANCIAL INSTITUTIONS
LOANS DISBURSED
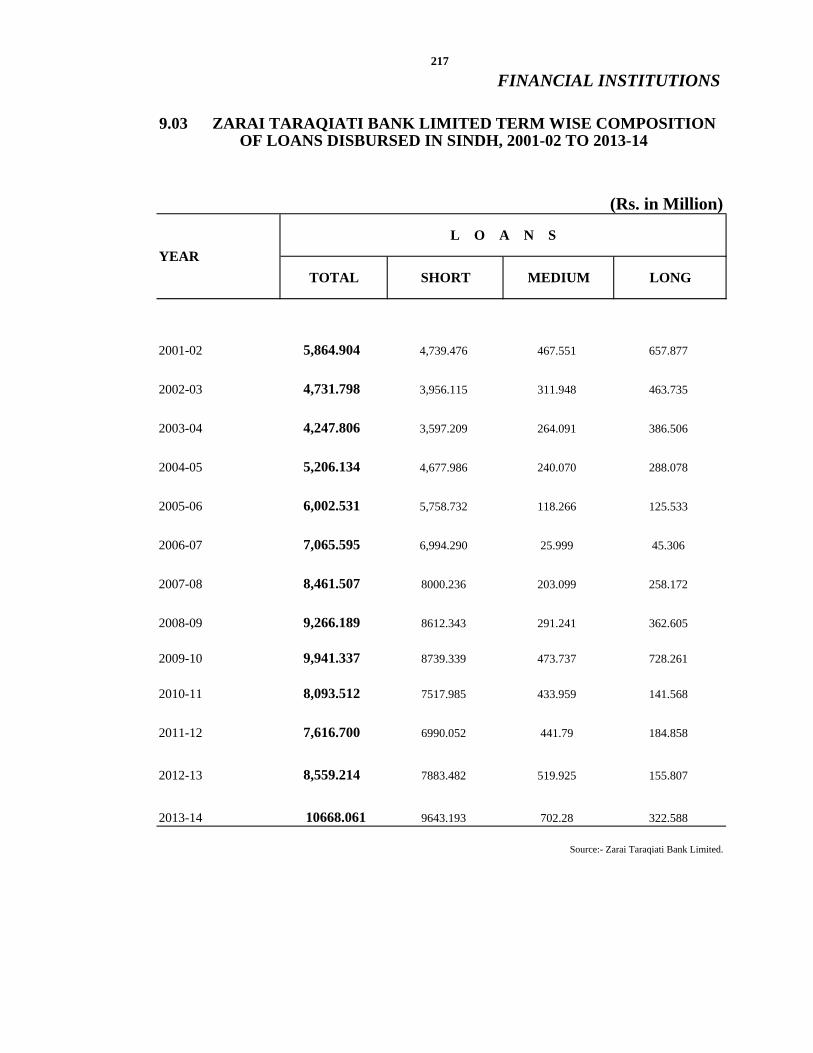
FINANCIAL INSTITUTIONS
(Rs. in Million)
2001-02 5,864.904 4,739.476 467.551 657.877
2002-03 4,731.798 3,956.115 311.948 463.735
2003-04 4,247.806 3,597.209 264.091 386.506
2004-05 5,206.134 4,677.986 240.070 288.078
2005-06 6,002.531 5,758.732 118.266 125.533
2006-07 7,065.595 6,994.290 25.999 45.306
2007-08 8,461.507 8000.236 203.099 258.172
2008-09 9,266.189 8612.343 291.241 362.605
2009-10 9,941.337 8739.339 473.737 728.261
2010-11 8,093.512 7517.985 433.959 141.568
2011-12 7,616.700 6990.052 441.79 184.858
2012-13 8,559.214 7883.482 519.925 155.807
2013-14 10668.061 9643.193 702.28 322.588
Source:- Zarai Taraqiati Bank Limited.
YEAR
217
OF LOANS DISBURSED IN SINDH, 2001-02 TO 2013-149.03 ZARAI TARAQIATI BANK LIMITED TERM WISE COMPOSITION
L O A N S
TOTAL SHORT MEDIUM LONG
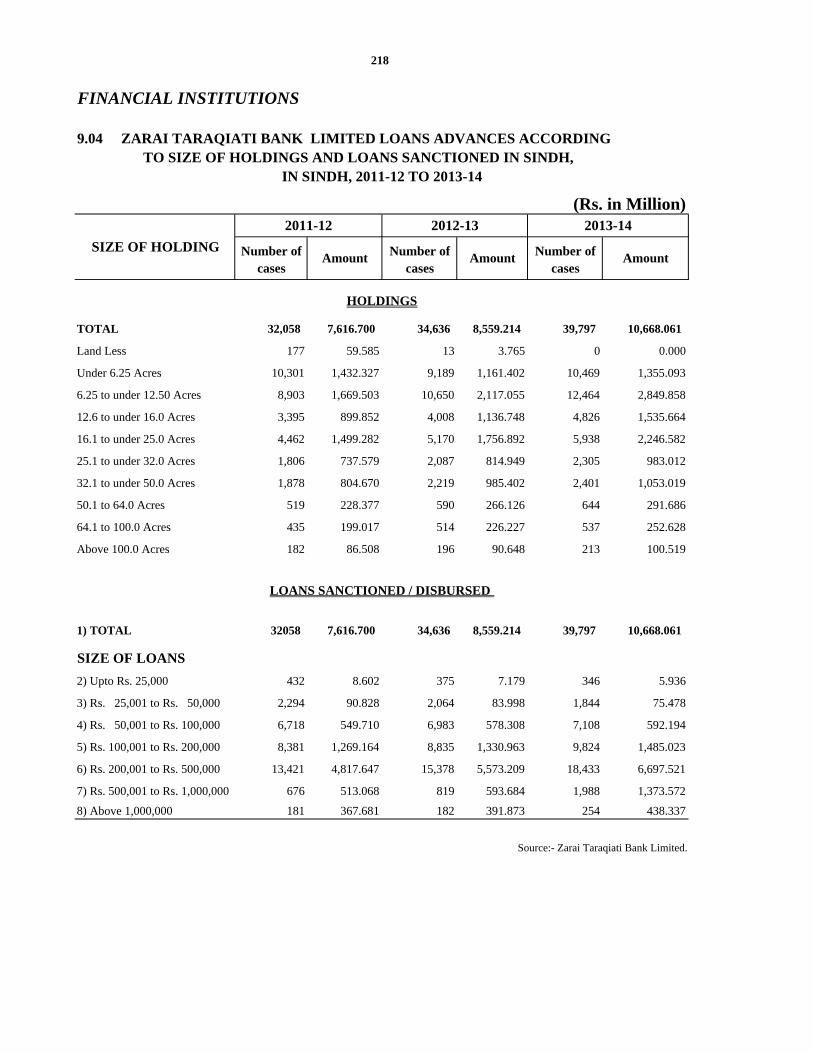
9.04 ZARAI TARAQIATI BANK LIMITED LOANS ADVANCES ACCORDING TO SIZE OF HOLDINGS AND LOANS SANCTIONED IN SINDH,
Number of Number of Number ofcases cases cases
TOTAL 32,058 7,616.700 34,636 8,559.214 39,797 10,668.061
Land Less 177 59.585 13 3.765 0 0.000
Under 6.25 Acres 10,301 1,432.327 9,189 1,161.402 10,469 1,355.093
6.25 to under 12.50 Acres 8,903 1,669.503 10,650 2,117.055 12,464 2,849.858
12.6 to under 16.0 Acres 3,395 899.852 4,008 1,136.748 4,826 1,535.664
16.1 to under 25.0 Acres 4,462 1,499.282 5,170 1,756.892 5,938 2,246.582
25.1 to under 32.0 Acres 1,806 737.579 2,087 814.949 2,305 983.012
32.1 to under 50.0 Acres 1,878 804.670 2,219 985.402 2,401 1,053.019
50.1 to 64.0 Acres 519 228.377 590 266.126 644 291.686
64.1 to 100.0 Acres 435 199.017 514 226.227 537 252.628
Above 100.0 Acres 182 86.508 196 90.648 213 100.519
1) TOTAL 32058 7,616.700 34,636 8,559.214 39,797 10,668.061
SIZE OF LOANS
2) Upto Rs. 25,000 432 8.602 375 7.179 346 5.936
3) Rs. 25,001 to Rs. 50,000 2,294 90.828 2,064 83.998 1,844 75.478
4) Rs. 50,001 to Rs. 100,000 6,718 549.710 6,983 578.308 7,108 592.194
5) Rs. 100,001 to Rs. 200,000 8,381 1,269.164 8,835 1,330.963 9,824 1,485.023
6) Rs. 200,001 to Rs. 500,000 13,421 4,817.647 15,378 5,573.209 18,433 6,697.521
7) Rs. 500,001 to Rs. 1,000,000 676 513.068 819 593.684 1,988 1,373.572
8) Above 1,000,000 181 367.681 182 391.873 254 438.337
Source:- Zarai Taraqiati Bank Limited.
LOANS SANCTIONED / DISBURSED
IN SINDH, 2011-12 TO 2013-14
218
(Rs. in Million)
HOLDINGS
2012-13
Amount
FINANCIAL INSTITUTIONS
2013-14
Amount Amount
2011-12
SIZE OF HOLDING

9.05 ZARAI TARAQIATI BANK LIMITED PURPOSE WISE AGRICULTURE CREDIT DEVELOPMENT AND PRODUCTION LOANS DISBURSEMENT IN SINDH,
SIZE OF HOLDING Number Number Numberof Cases of Cases of Cases
SINDH 32,058 7,616,700 34,636 8,559.214 39,797 10,668.061
Total 3,098 544.330 3,695 675.732 4,267 1,024.868
Tractors 16 7.874 12 6.829 21 14.175
Farm Equipments 15 6.171 24 14.507 29 18.466
Dairy Farming 2,084 403.305 2,193 335.631 2,467 523.398
Tube Wells 221 83124 306 120.528 543 288.011
Live Stock 616 83.124 720 101.282 760 143.294
Poultary Farming 0 0 0 0.000 0 0.000
Orchards 75 40.310 200 74.210 129 14.211
Land Development 3 0.194 0 0.000 2 0.397
Fisheries -- 0.130 0 0.000 1 0.200
Farm Transportation -- -- 0.000 0.000 0.000 0.000
Godown/Coldstorage -- -- 0.000 0.000 0.000 0.050
Others 68 3.222 240 22.745 315 22.666
2011-12 TO 2013-14
Amount
DEVELOPMENT LOANS
(Rs.in Million)
219
Contd.
Amount
2011-12
FINANCIAL INSTITUTIONS
2012-13 2013-14
Amount

SIZE OF HOLDING Number Number Numberof Cases of Cases of Cases
PRODUCTION LOANS
TOTAL 28,960 6,990.052 30,941.000 7,883.482 35,530 9,643.20
Fertilizer 13,900 3,355.225 14,851 3,784.089 17,054 4,628.733
Pesticides 5,502 1,328.110 5,879 1,497.862 675 1,832.207
Seeds 8,108 1,957.215 8,663 2,207.375 9,948 2,700.094
Labour hire/ Other Charges -- -- 0.000 0.000 3.000 0.094
Working capital poultry 205 42.631 225 62.937 723 245.921
Working Capital Dairy 1.000 0.200 4.000 0.504 32.000 4.935
Working Capital Live Stock 0.000 0.000 0.000 0.000 0.000 0.000
Working Capital Fisheries 0 0.000 0 0.000 0 0.000
Others 1,244 306.671 1,319 330.715 7,095 231.213
Source:- Zarai Taraqiati Bank Limited.
FINANCIAL INSTITUTIONS
2012-13 2013-14
Amount
IN SINDH, 2011-12 TO 2013-14
Amount Amount
2011-12
220
CREDIT DEVELOPMENT & PRODUCTION LOANS DISBURSEMENT9.05 ZARAI TARAQIATI BANK LIMITED PURPOSE WISE AGRICULTURE
(Rs. In Million)

YEAR
No. Amount
2001-02 313 54.60 14.50 --
2002-03 2,129 444.83 335.82 --
2003-04 3,617 1,411.13 1,206.83 --
2004-05 3,619 1,436.00 1,418.00 1530
2005-06 2,480 1,061.00 1,054.00 1952
2006-07 2,458 1,221.00 1,131.00 1688
2007-08 2,500 1,513.00 1,512.00 1916
2008-09 1106 689.00 823.00 1472
2009-10 136 80.21 146.89 1,605.90
2010-11 409 340.72 338.57 1605.57
2011-12 136 80.21 394.99 1605.90
2012-13 406 417 431 1554.00
2013-14 675 821 825.76 1447.00
Note:- Approval of investment was suspended during the year, 2000-01 by the order of Shariat appellate Bench of
Supereme Court of Pakistan.
Source:- House Building Finance Corporation.
Sanctioned
L O A N S
221
FINANCIAL INSTITUTIONS
IN SINDH, 2001-02 TO 2013-149.06 H.B.F.C LOANS SANCTIONED, DISBURSED AND RECOVERED
(Rs. in Million)
Disbursed AmountRecovered Amount

(Rs. in Million)
SanctionedNo. Amount
SINDHTOTAL 406.00 417.00 430.46 1,553.00
Jacobabad 2.00 1.00 0.46 10.00
Kashmore@Kandhkot -- -- -- --
Shikarpur -- -- -- --
Larkana 13.00 7.00 6.00 31.00
Kamber Shahdadkot - -- -- --
Sukkur 25.00 15.00 19.00 70.00
Ghotki -- -- -- --
Khairpur 9.00 4.00 4.00 21.00
Naushero Feroze -- -- -- --
S.B.Abad 17.00 11.00 10.00 62.00
Dadu -- 0.00 -- 16.00
Jamshoro -- -- -- --
Hyderabad 51.00 51.00 62.00 253.00
Matiari -- -- -- --
Tando Muhammad Khan -- -- -- --
Tando Allah Yar -- -- -- --
Thatta 10.00 5.00 5.00 14.00
Badin -- -- -- --
Sanghar 5.00 3.00 3.00 22.00
Mirpurkhas 11.00 10.00 8.00 23.00
Umerkot -- -- -- --
Tharparkar@Mithi -- -- -- --
Karachi 263.00 310.00 313.00 1,031.00
Contd.
222
FINANCIAL INSTITUTIONS
9.07 H.B.F.C LOANS SANCTIONED, DISBURSED AND RECOVERED BY DISTRICT IN SINDH, 2012-13 TO 2013-14
Disbursed Amount
Recovered Amount
Province/District L O A N S
2012-13

(Rs. in Million)
No. Amount
SINDH 675.00 821.00 825.75 1,448.00
Jacobabad 4.00 2.00 1.84 5.00
Kashmore@Kandhkot 0.00 0.00 0.00 0.00
Shikarpur 0.00 0.00 0.00 0.00
Larkana 30.00 38.00 39.31 26.00
Kamber Shahdadkot 0.00 0.00 0.00 0.00
Sukkur 47.00 52.00 47.55 72.00
Ghotki 0.00 0.00 0.00 0.00
Khairpur 23.00 24.00 20.89 21.00
Naushero Feroze 0.00 0.00 0.00 0.00
S.B.Abad 26.00 21.00 20.13 63.00
Dadu 0.00 0.00 0.00 16.00
Jamshoro 0.00 0.00 0.00 0.00
Hyderabad 73.00 93.00 89.45 212.00
Matiari 0.00 0.00 0.00 0.00
Tando Muhammad Khan 0.00 0.00 0.00 0.00
Tando Allah Yar 0.00 0.00 0.00 0.00
Thatta 6.00 6.00 3.93 19.00
Badin 0.00 0.00 0.00 0.00
Sanghar 20.00 11.00 10.39 20.00
Mirpurkhas 22.00 21.00 22.41 22.00
Umerkot 0.00 0.00 0.00 0.00
Tharparkar@Mithi 0.00 0.00 0.00 0.00
Karachi 424.00 553.00 569.85 972.00
Source:- House Building Finance Corporation.
Province/District L O A N S
2013-14
223
FINANCIAL INSTITUTIONS
9.07 H.B.F.C LOANS SANCTIONED, DISBURSED AND RECOVERED BY DISTRICT IN SINDH, 2012-13 TO 2013-14
Sanctioned Disbursed Amount
Recovered Amount

10.00 BANKING

BANKING
(Million Rupees)
LIABILITIES / ASSETS 2010-11 2011-12 2012-13 2013-14
i. Liabilities
1. Notes in Banking Department 154.6 160.2 143.3 110.9
2. Notes in Circulation 1,599,833.5 1,776,962.4 2,041,361.3 2,309,127.0
Total liabilities / Assets 1,599,988.1 1,777,122.6 2,041,504.6 2,309,237.9
ii. Assets Gold and Foregin 676,054.3 681,130.9 347,085.7 608,296.3 Assests
1. Gold Coins & Bullion (a) 267,969.4 313,077.4 246,096.8 269,307.9
2. Approved Foreign Exchange (b) 407,257.4 367,326.8 100,265.4 338,280.8
3. Indian Notes (c) 827.5 726.7 723.4 707.6
iii. Domestic Assets 919,108.3 1,090,406.8 1,689,905.7 1,695,782.3
1. Rupee Coins Notes 2,225.3 1,814.2 925.0 417.9
2. Government of Pakistan 916,804.5 1,088,514.1 1,688,902.2 1,695,364.5 Securities
3. Internal Bills of Exchange and 78.5 78.5 78.5 --
other Commercial Papers
iv. With Reserve Bank of India 4,825.4 5,584.8 4,513.2 5,159.3 pending transfer to Pakistan Total
(a) Gold is valued at the end of Financial year on the basis of closing London Bullion Market Rate.
(b) Including SDR held with IMF.
(c) Representing Assets Receivable from Reserve Bank of India.
227
ISSUE DEPARTMENT, 2010-11 TO 2013-1410.01 LIABILITIES AND ASSETS OF THE STATE BANK OF PAKISTAN
Source:- "Annual Report, 2013-14" State Bank of Pakistan.

YEAR Total GoldCash
ForeignCurrency
With SBPDrawingRights
Nostro *
WithBanks
2008-09 14,010 1,966 417 152 8,966 2,509
2009-10 17,921 2,575 154 1,259 11,699 2,234
2010-11 20,941 3,117 878 1,189 13,595 2,162
2011-12 16,489 3,311 53 966 9,833 2,326
2012-13 10,831 2,469 39 855 5,153 2,315
2013-14 14,407 2,726 75 830 8,267 2,509
* Excluding FE-13/CRR sinking fund and including pending transfers.
Source:- Annual Report,"2013-14" State Bank of Pakistan.
10.02 GOLD AND FOREIGN EXCHANGE RESERVES OF PAKISTAN, 2008-09 TO 2013-14
BANKING228

Size of Account 2010 2011 2012 2013 2014
TOTAL 3,154.1 3,197.2 3,412.1 3,519.7 3,936.1
Less than Rs 10,000 252.8 0.3 0.2 0.2 0.1
Rs. 10,000 to Rs. 50,000 1153.8 22.2 21.2 20.5 20.1
Rs. 50,000 to Rs.1,00,000 826.3 39.2 31.4 15.6 11.4
Rs. 1,00,000 to Rs.5,00,000 710.1 170.6 177.9 208.6 222.9
Rs. 5,00,000 to Rs.10,00,000 68.1 50.6 58 73.8 97.1
Rs. 10,00,000 to Rs.50,00,000 102.2 222.3 192.4 186.9 220.3
Rs. 50,00,000 to Rs.10,000,000 16.1 118.9 122.8 108.3 184.5
Rs. 10,000,000 and Over 24.7 2,573.1 2808.2 2905.8 3179.7* As on 30th June.
Size of Account 2010 2011 2012 2013 2014
TOTAL 4,693.1 5,489.4 6,231.4 7,134.5 8,051.6
Less than Rs 10,000 17 17.3 19.9 21 21.5
Rs. 10,000 to Rs. 50,000 269.7 278.6 310.6 330 360.1
Rs. 50,000 to Rs.1,00,000 448.7 496.0 546.2 608.1 625.1
Rs. 1,00,000 to Rs.5,00,000 1153.7 1,393.6 1474.7 1852.3 2002.3
Rs. 5,00,000 to Rs.10,00,000 323.1 412.9 525.2 515.2 620.1
Rs. 10,00,000 to Rs.50,00,000 569 695.0 840.6 946.6 1106.5
Rs. 50,00,000 to Rs.10,000,000 198.6 272.3 262.5 332.5 379.9
Rs. 10,000,000 and Over 1713.3 1,923.7 2251.7 2528.8 2936.1
* As on 30th June.
2010 TO 2014
10.04 SCHEDULE BANKS DEPOSITS DISTRIBUTED BY SIZE OF ACCOUNTS OF PAKISTAN, 2010 TO 2014
(Billion Rupees)
229
(Billion Rupees)
Source:- "Annual Report, 2013-14" State Bank of Pakistan.
Source:- "Annual Report, 2013-14" State Bank of Pakistan.
BANKING
10.03 CLASSIFICATION OF SCHEDULED BANKS ADVANCES BY SIZE
SIZE OF ACCOUNTS OF COMMERCIAL BANKS OF PAKISTAN,
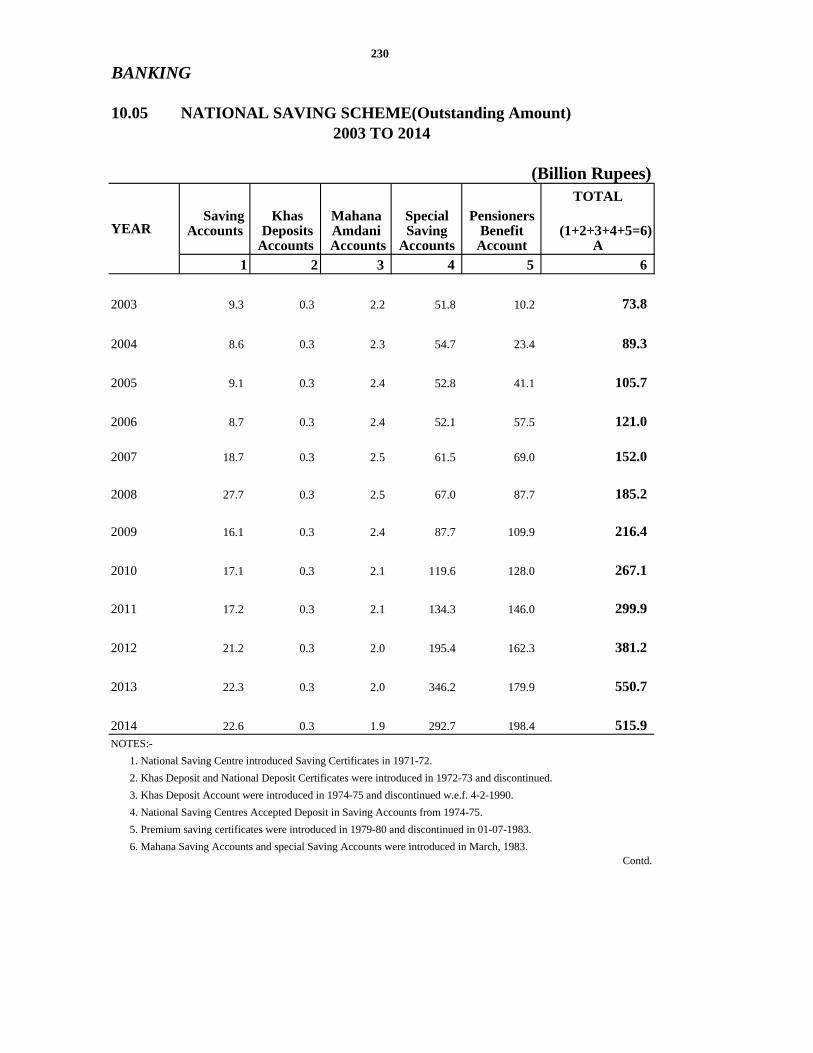
(Billion Rupees)TOTAL
Saving Khas Mahana Special PensionersAccounts Deposits Amdani Saving Benefit (1+2+3+4+5=6)
Accounts Accounts Accounts Account A 1 2 3 4 5 6
2003 9.3 0.3 2.2 51.8 10.2 73.8
2004 8.6 0.3 2.3 54.7 23.4 89.3
2005 9.1 0.3 2.4 52.8 41.1 105.7
2006 8.7 0.3 2.4 52.1 57.5 121.0
2007 18.7 0.3 2.5 61.5 69.0 152.0
2008 27.7 0.3 2.5 67.0 87.7 185.2
2009 16.1 0.3 2.4 87.7 109.9 216.4
2010 17.1 0.3 2.1 119.6 128.0 267.1
2011 17.2 0.3 2.1 134.3 146.0 299.9
2012 21.2 0.3 2.0 195.4 162.3 381.2
2013 22.3 0.3 2.0 346.2 179.9 550.7
2014 22.6 0.3 1.9 292.7 198.4 515.9NOTES:-
1. National Saving Centre introduced Saving Certificates in 1971-72.
2. Khas Deposit and National Deposit Certificates were introduced in 1972-73 and discontinued.
3. Khas Deposit Account were introduced in 1974-75 and discontinued w.e.f. 4-2-1990.
4. National Saving Centres Accepted Deposit in Saving Accounts from 1974-75.
5. Premium saving certificates were introduced in 1979-80 and discontinued in 01-07-1983.
6. Mahana Saving Accounts and special Saving Accounts were introduced in March, 1983.Contd.
YEAR
10.05 NATIONAL SAVING SCHEME(Outstanding Amount)
230
2003 TO 2014
BANKING

BANKING
(Billion Rupees)Defence National Khas Special SavingSaving Deposit Deposit Others Certificate
Certificate Certificate Certificate (Reg. & Bearer)8 9 10 11 12
2003 309.0 .. .. 0.3 294.4
2004 312.3 .. .. 0.3 281.2
2005 303.5 .. .. 0.3 197.9
2006 295.9 .. .. 0.3 140.1
2007 289.0 .. .. 0.3 146.8
2008 284.6 .. .. 0.3 160.6
2009 257.6 .. .. 0.3 289.3
2010 224.9 .. .. 0.3 351.1
2011 234.5 .. .. 0.3 294.9
2012 241.8 .. .. 0.3 342.1
2013 271.7 .. .. 4.3 388.5
2014 284.7 .. .. 1.6 445.88. Regular income Certificates were introduced w.e.f. 02-02-1993.
9. Pensioner's Benefit Accounts introduced on 11-01-2010.
10. National Saving Bonds introduced on 11-01-2010.
10. National Saving Bonds introduced on 11-01-2010. Contd.
231
YEAR
2003 TO 2014
10.05 NATIONAL SAVING SCHEME(Outstanding Amount)

(Billion Rupees)Regular Bebood Total Prize Grand
Income Saving Bonds Total
Certificate Certificate (8+9+10+11+12+13+14) (A+B+C)
B C
13 14 15 16 17
2003 175.0 .. 778.7 130.0 982.5
2004 125.9 22.7 742.4 152.8 984.5
2005 85.2 83.3 775.9 164.1 940.0
2006 69.7 143.0 770.0 165.5 935.5
2007 51.3 190.2 829.6 174.5 1,000.1
2008 51.0 229.0 910.7 182.7 1,093.4
2009 91.0 307.5 1,162.1 197.4 1,359.5
2010 135.6 366.8 1,078.7 236.0 1,577.4
2011 182.6 428.5 1,140.8 277.1 1,647.8
2012 226.6 480.8 1,291.6 333.4 2,006.2
2013 262.6 528.4 1,451.5 389.6 2,391.8
2014 325.4 582.4 1,639.9 446.6 2,602.4
232
BANKING
YEAR
2003 TO 2014
Source:- Annual Report, 2013-14, State Bank of Pakistan.
10.05 NATIONAL SAVING SCHEME(Outstanding Amount)

11.00 FOREIGN TRADE

YEAR Exports Re-Exports Imports Re-Imports Balance
2008-09 1,383,717.4 21,927.1 2,695,802.7 1,567.4 (-) 1,319,567.9
2009-10 1,617,457.5 23,469.9 2,876,163.3 14.2 (-) 1,235,250.7
2010-11 2,120,846.6 30,576.1 3,410,624.0 2,072.5 (-) 1,261,273.8
2011-12 2,110,605.4 18,570.2 4,009,093.0 3,181.7 (-) 1,883,099.0
2012-13 2,366,477.8 9,946.3 4,349,879.5
--
(-) 1,973,455.4
2013-14 2583463.2 16,369.1 4,630,520.8 1855.7 (-) 2,032,544.2Import)
Source:- Statistical Year book 2014, Pakistan Bureau of Statistics, Statistics Division, Government of Pakistan.
Note :- Balance of Trade = (Exports + Re-Exports) - (Imports + Re-Imports)
235
11.01 TOTAL FOREIGN TRADE OF PAKISTAN
FOREIGN TRADE
(Million Rupees)
2008-09 to 2013-14

2008-09 1,383,717.5 1,273,519.5 110,197.9 21,927.2 21,311.3 615.9
2009-10 1,617,457.6 1,485,564.0 131,893.5 23,469.9 22,509.8 960.1
2010-11 2,120,846.6 1,914,819.8 206,026.8 30,576.1 29,603.9 972.2
2011-12 2,110,605.4 1,676,377.7 209,819.5 18,570.2 3,099.2 2,565.9
2012-13 2,366,477.8 1,831,213.6 218,125.7 13,966.3 9,946.3 40.5
2013-14 2,583,463.18 2,124,591,837.00 202,220,874.00 26,611.05 16,369.06 225.10
2008-09 2,723,569.0 2,882,706.3 27,767.0 1,642.8 1,567.4 75.4
2009-10 2,644,368.2 2,609,556.9 34,811.3 14.2 1.5 12.7
2010-11 3,151,228.1 3,106,567.4 44,660.7 2,072.6 2,072.6 --
2011-12 4,009,493.0 3,609,392.7 56,239.0 3,131.8 18.5 --
2012-13 4,349,879.5 3,819,792.8 11,175.0 -- -- --
2013-14 5,189,188.025 4,630,520.790 109,676.300 2,071.704 1,855.737 --
Note:- Export and import from Air Borne included inTotal. Total doesn't reflect sum of sea & land route.
Total
(Million Rupees)
236
11.02 FOREIGN TRADE OF PAKISTAN BY ROUTES, 2008-09 TO 2013-14
FOREIGN TRADE
EXPORTS RE-EXPORTS
Source:- Statistical Year book 2014, Pakistan Bureau of Statistics, Statistics Division, Government of Pakistan.
* Sea Land Total * Sea Land
IMPORTS RE-IMPORTS
YEAR
YEARTotal * Sea Land Total * Sea Land
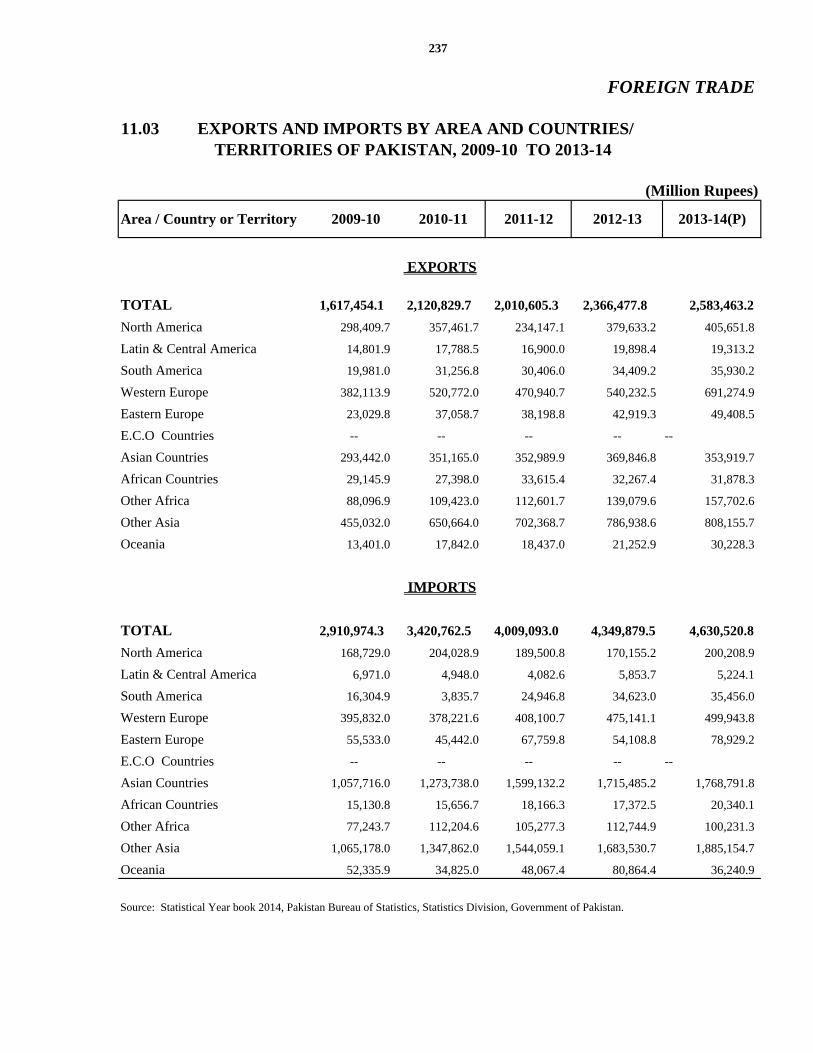
TOTAL 1,617,454.1 2,120,829.7 2,010,605.3 2,366,477.8 2,583,463.2
North America 298,409.7 357,461.7 234,147.1 379,633.2 405,651.8
Latin & Central America 14,801.9 17,788.5 16,900.0 19,898.4 19,313.2
South America 19,981.0 31,256.8 30,406.0 34,409.2 35,930.2
Western Europe 382,113.9 520,772.0 470,940.7 540,232.5 691,274.9
Eastern Europe 23,029.8 37,058.7 38,198.8 42,919.3 49,408.5
E.C.O Countries -- -- -- -- --
Asian Countries 293,442.0 351,165.0 352,989.9 369,846.8 353,919.7
African Countries 29,145.9 27,398.0 33,615.4 32,267.4 31,878.3
Other Africa 88,096.9 109,423.0 112,601.7 139,079.6 157,702.6
Other Asia 455,032.0 650,664.0 702,368.7 786,938.6 808,155.7
Oceania 13,401.0 17,842.0 18,437.0 21,252.9 30,228.3
TOTAL 2,910,974.3 3,420,762.5 4,009,093.0 4,349,879.5 4,630,520.8
North America 168,729.0 204,028.9 189,500.8 170,155.2 200,208.9
Latin & Central America 6,971.0 4,948.0 4,082.6 5,853.7 5,224.1
South America 16,304.9 3,835.7 24,946.8 34,623.0 35,456.0
Western Europe 395,832.0 378,221.6 408,100.7 475,141.1 499,943.8
Eastern Europe 55,533.0 45,442.0 67,759.8 54,108.8 78,929.2
E.C.O Countries -- -- -- -- --
Asian Countries 1,057,716.0 1,273,738.0 1,599,132.2 1,715,485.2 1,768,791.8
African Countries 15,130.8 15,656.7 18,166.3 17,372.5 20,340.1
Other Africa 77,243.7 112,204.6 105,277.3 112,744.9 100,231.3
Other Asia 1,065,178.0 1,347,862.0 1,544,059.1 1,683,530.7 1,885,154.7
Oceania 52,335.9 34,825.0 48,067.4 80,864.4 36,240.9
IMPORTS
Source: Statistical Year book 2014, Pakistan Bureau of Statistics, Statistics Division, Government of Pakistan.
2012-13 2010-11Area / Country or Territory 2009-10 2011-12 2013-14(P)
237
FOREIGN TRADE
11.03 EXPORTS AND IMPORTS BY AREA AND COUNTRIES/ TERRITORIES OF PAKISTAN, 2009-10 TO 2013-14
(Million Rupees)
EXPORTS

Export Import Export Import
TOTAL 2,120,846 3,455,285 2,110,602 4,009,088
Food and Live Animals 373,957 214,132 356,596 179,555
Beverages and Tobacco 4,165 2,285 4,926 2,383
Crude Material Inedible Except Fuels 81,276 294,186 111,081 274,468
Mineral Fuels Lubricants and Related Materials 115,647 1,084,765 80,046 1,420,173
Animal and Vegetable Oil and Fats 10,529 190134 19,913 228731
Chemicals 78,902 528,989 96,008 637,824
Manufactured Goods Classified Chiefly by 922,992 369,322 877,515 402,498
Materials .. .. .. ..
Machinery and Transport Equipments 21,873 639,389 24,727 699,993
Miscellaneous Manufactured Articles 511,437 101,192 539,762 105,785
Commodities and Transactions not Classified 68 30,891 28 57,678
According to Kind
Contd.
238
FOREIGN TRADE
11.04 EXPORT AND IMPORT BY COMMODITY GROUPS OF PAKISTAN 2010-11 To 2013-14
(Million Rupees)2011-12
Commodity Group2010-11
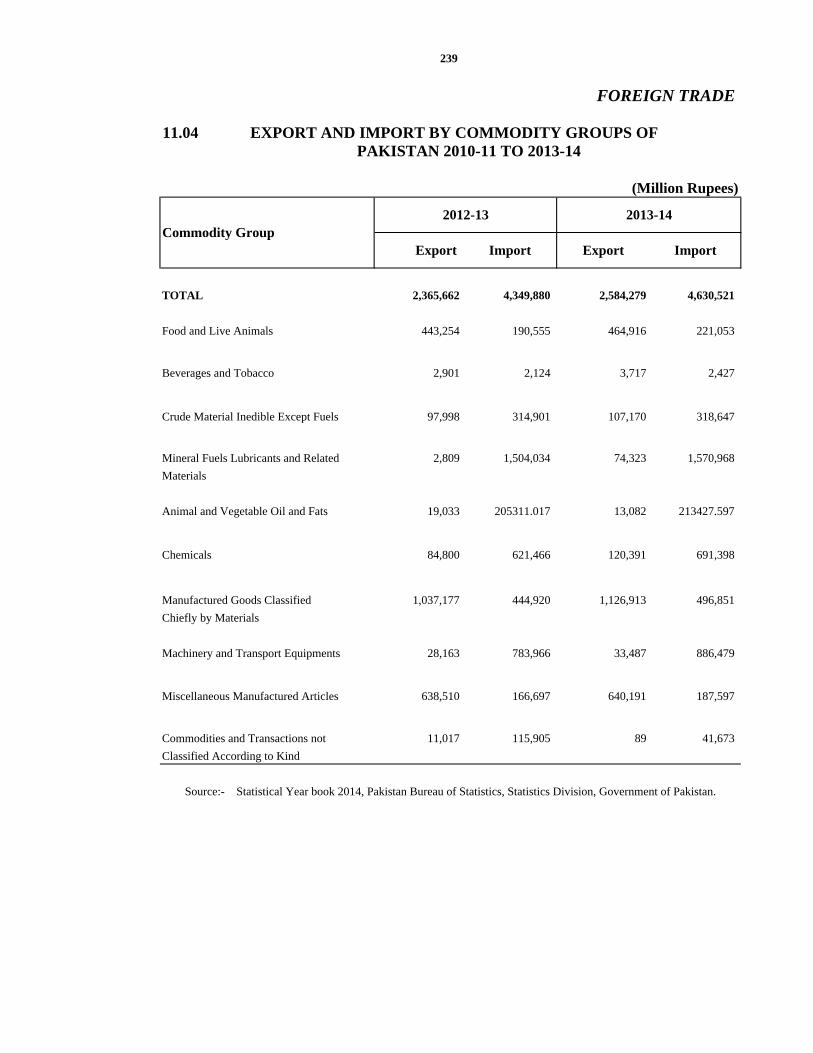
TOTAL 2,365,662 4,349,880 2,584,279 4,630,521
Food and Live Animals 443,254 190,555 464,916 221,053
Beverages and Tobacco 2,901 2,124 3,717 2,427
Crude Material Inedible Except Fuels 97,998 314,901 107,170 318,647
Mineral Fuels Lubricants and Related 2,809 1,504,034 74,323 1,570,968
Materials
Animal and Vegetable Oil and Fats 19,033 205311.017 13,082 213427.597
Chemicals 84,800 621,466 120,391 691,398
Manufactured Goods Classified 1,037,177 444,920 1,126,913 496,851
Chiefly by Materials
Machinery and Transport Equipments 28,163 783,966 33,487 886,479
Miscellaneous Manufactured Articles 638,510 166,697 640,191 187,597
Commodities and Transactions not 11,017 115,905 89 41,673
Classified According to Kind
239
FOREIGN TRADE
2012-13 2013-14
Export Import Export Import
Source:- Statistical Year book 2014, Pakistan Bureau of Statistics, Statistics Division, Government of Pakistan.
11.04 EXPORT AND IMPORT BY COMMODITY GROUPS OF
(Million Rupees)
Commodity Group
PAKISTAN 2010-11 TO 2013-14

Food & Live Beverages Crude Mineral,
YEAR General Animals and Material in- Fuels &
Tobacco edible Except Lubricants
Fuels
2007-08 187.89 207.64 291.57 181.66 571.26
2008-09 178.00 206.61 233.15 140.65 393.57
2009-10 191.74 259.95 271.16 198.39 348.10
2010-11 198.41 286.92 314.18 199.10 333.36
2011-12 167.36 264.12 367.35 282.00 410.62
2012-13 202.86 242.21 238.64 343.79 37.89
2013-14 229.80 280.96 175.45 447.47 409.09
2007-08 279.04 215.32 472.93 634.62 235.18
2008-09 287.17 250.08 357.04 611.41 219.07
2009-10 273.50 161.65 372.35 535.52 228.17
2010-11 191.60 164.44 279.53 372.91 154.15
2011-12 256.47 321.01 371.65 473.88 197.46
2012-13 234.02 186.86 275.65 413.29 190.89
2013-14 249.40 162.10 370.18 491.04 185.66
Cont.
EXPORTS
IMPORT
(Base:- 1990-91=100)
240
FOREIGN TRADE
11.05 QUANTUM INDEX NUMBER OF EXPORTS AND IMPORTS BY GROUP OF PAKISTAN, 2007-08 TO 2013-14

FOREIGN TRADE
Machinery
& Transport
Equipments
2007-08 -- 942.99 173.88 714.23 198.98
2008-09 -- 1054.11 170.86 1848.54 174.14
2009-10 -- 963.70 185.42 1307.03 173.53
2010-11 -- 1033.09 180.52 2806.15 198.34
2011-12 -- 1301.40 157.00 2077.59 164.87
2012-13 -- 992.45 191.87 2014.32 181.50
2013-14 -- 1010.41 189.96 2056.66 226.38
IMPORTS
2007-08 115.03 244.40 221.28 371.00 340.31
2008-09 118.96 209.42 197.29 472.81 272.85
2009-10 154.83 257.08 228.29 263.58 283.04
2010-11 90.93 202.59 180.73 232.67 194.23
2011-12 121.87 290.29 241.91 280.01 288.73
2012-13 141.68 240.54 249.49 266.44 261.26
2013-14 182.37 253.03 312.32 283.06 286.91
Source:- Statistical Year Book 2014, Pakistan Bureau of Statistics, Statistics Division, Government of Pakistan.
Miscellaneous Manufactured
GoodsChemicals
Manufactured Goods
Animal & Vegetable Oil
and FatsYEAR
EXPORTS
241
11.05 QUANTUM INDEX NUMBER OF EXPORTS AND IMPORTS BY GROUP OF PAKISTAN, 2007-08 TO 2013-14
(Base:- 1990-91 = 100)
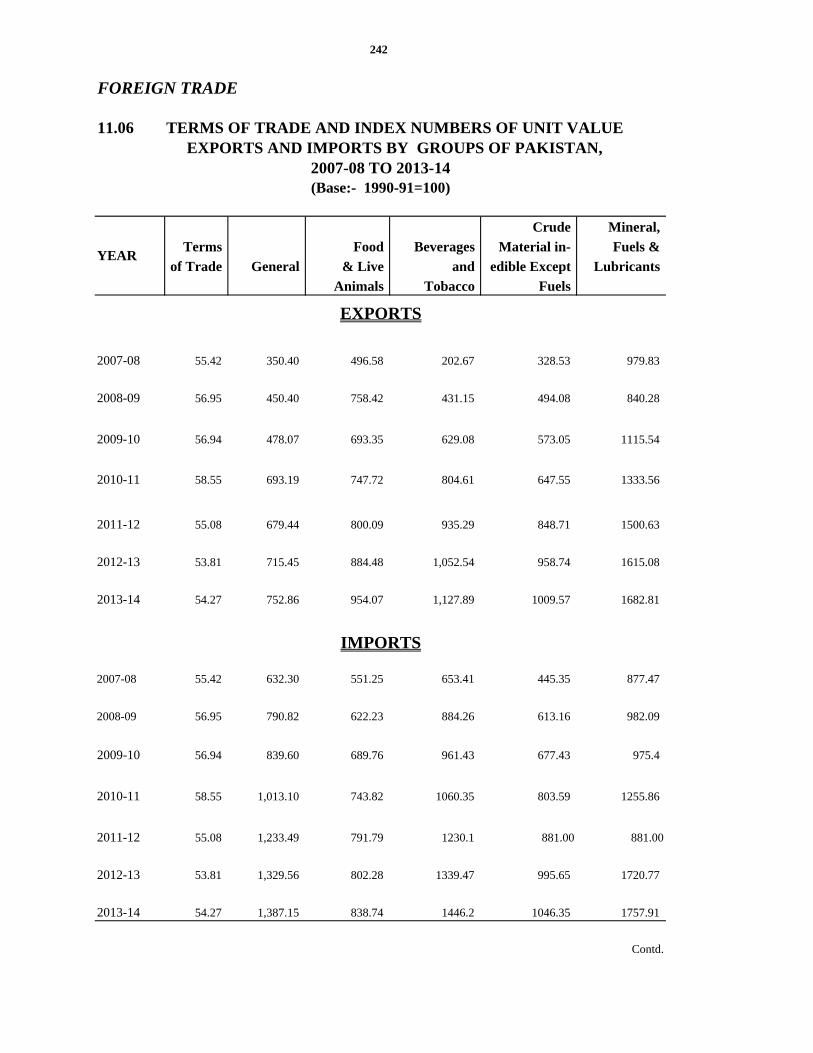
(Base:- 1990-91=100)
Crude Mineral,
Terms Food Beverages Material in- Fuels &
of Trade General & Live and edible Except Lubricants
Animals Tobacco Fuels
2007-08 55.42 350.40 496.58 202.67 328.53 979.83
2008-09 56.95 450.40 758.42 431.15 494.08 840.28
2009-10 56.94 478.07 693.35 629.08 573.05 1115.54
2010-11 58.55 693.19 747.72 804.61 647.55 1333.56
2011-12 55.08 679.44 800.09 935.29 848.71 1500.63
2012-13 53.81 715.45 884.48 1,052.54 958.74 1615.08
2013-14 54.27 752.86 954.07 1,127.89 1009.57 1682.81
2007-08 55.42 632.30 551.25 653.41 445.35 877.47
2008-09 56.95 790.82 622.23 884.26 613.16 982.09
2009-10 56.94 839.60 689.76 961.43 677.43 975.4
2010-11 58.55 1,013.10 743.82 1060.35 803.59 1255.86
2011-12 55.08 1,233.49 791.79 1230.1 881.00 881.00
2012-13 53.81 1,329.56 802.28 1339.47 995.65 1720.77
2013-14 54.27 1,387.15 838.74 1446.2 1046.35 1757.91
Contd.
IMPORTS
EXPORTS
YEAR
242
2007-08 TO 2013-14 EXPORTS AND IMPORTS BY GROUPS OF PAKISTAN,
11.06 TERMS OF TRADE AND INDEX NUMBERS OF UNIT VALUE
FOREIGN TRADE

Animal & Chemicals Manufactured Machinery Miscellaneous
Vegetable Goods & Transport Manufactured
Oil and Fats Equipments Goods
EXPORTS
2007-08 .. 397.29 318.97 518.62 351.77
2008-09 .. 480.24 387.90 806.33 442.60
2009-10 .. 534.75 411.00 988.72 498.40
2010-11 .. 620.91 559.56 1,286.13 558.25
2011-12 .. 739.66 641.15 1,517.96 650.31
2012-13 .. 876.11 689.62 1,603.48 657.15
2013-14 .. 939.50 698.49 1,650.17 700.75
IMPORTS
2007-08 647.28 471.77 427.60 639.86 605.34
2008-09 793.22 659.24 559.24 897.86 763.29
2009-10 881.02 726.54 612.77 965.15 964.44
2010-11 1,005.72 796.89 747.32 1183.62 1174.99
2011-12 1,240.29 897.56 823.33 1407.29 1274.46
2012-13 1,103.29 994.5 887.02 1738.91 1342.66
2013-14 1,054.13 1098.6 899.66 1866.32 1458.63
.
YEAR
243
FOREIGN TRADE
11.06 TERMS OF TRADE AND INDEX NUMBERS OF UNIT VALUE EXPORTS AND IMPORTS BY GROUPS OF PAKISTAN,
2007-08 TO 2013-14(Base:- 1990-91=100)

12.00 TRANSPORT
AND
COMMUNICATION
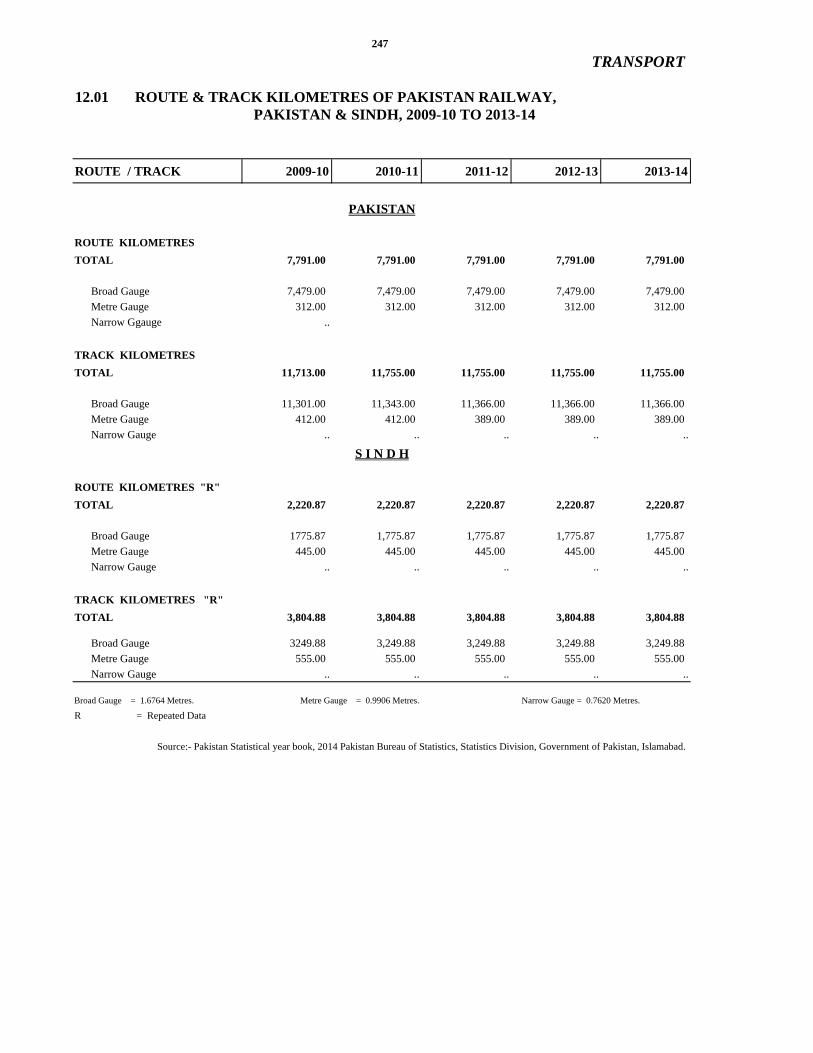
ROUTE / TRACK 2009-10 2010-11 2011-12 2012-13 2013-14
ROUTE KILOMETRES
TOTAL 7,791.00 7,791.00 7,791.00 7,791.00 7,791.00
Broad Gauge 7,479.00 7,479.00 7,479.00 7,479.00 7,479.00
Metre Gauge 312.00 312.00 312.00 312.00 312.00
Narrow Ggauge ..
TRACK KILOMETRES
TOTAL 11,713.00 11,755.00 11,755.00 11,755.00 11,755.00
Broad Gauge 11,301.00 11,343.00 11,366.00 11,366.00 11,366.00
Metre Gauge 412.00 412.00 389.00 389.00 389.00
Narrow Gauge .. .. .. .. ..
ROUTE KILOMETRES "R"
TOTAL 2,220.87 2,220.87 2,220.87 2,220.87 2,220.87
Broad Gauge 1775.87 1,775.87 1,775.87 1,775.87 1,775.87
Metre Gauge 445.00 445.00 445.00 445.00 445.00
Narrow Gauge .. .. .. .. ..
TRACK KILOMETRES "R"
TOTAL 3,804.88 3,804.88 3,804.88 3,804.88 3,804.88
Broad Gauge 3249.88 3,249.88 3,249.88 3,249.88 3,249.88
Metre Gauge 555.00 555.00 555.00 555.00 555.00
Narrow Gauge .. .. .. .. ..
Broad Gauge = 1.6764 Metres. Metre Gauge = 0.9906 Metres. Narrow Gauge = 0.7620 Metres.
Source:- Pakistan Statistical year book, 2014 Pakistan Bureau of Statistics, Statistics Division, Government of Pakistan, Islamabad.
247
TRANSPORT
12.01 ROUTE & TRACK KILOMETRES OF PAKISTAN RAILWAY, PAKISTAN & SINDH, 2009-10 TO 2013-14
PAKISTAN
S I N D H
R = Repeated Data

Number of Passengers Freight carried Gross earningsPassengers Kilometres (Millions Tones) (Millions Rupees)
carried (Millions)
(Millions) (Millions)
2002-03 72 22,306 6 4,820 14,810
2003-04 76 23,045 6 4,796 14,478
2004-05 78 24,238 6 5,014 17,827
2005-06 81 25,621 6 4,971 18,182
2006-07 83 26,446 6 5,454 19,192
2007-08 80 24,731 7 6,187 19,972
2008-09 83 25,702 7 5,896 23,159
2009-10 75 23,522 6 4,847 21,887
2010-11 65 20,619 3 1,757 18,612
2011-12 41 16,093 1 4,025 15,444
2012-13 42 17,388 1 4,192 18,070
2013-14 48 16,323 2 1,090 22,800
Source:- Pakistan Statistical Year book 2014,Pakistan Bureau of Statistics, Statistics Division, Government of Pakistan, Islamabad.
YEAR
248
TRANSPORT
FREIGHT AND EARNING, 2002-03 TO 2013-1412.02 PAKISTAN RAILWAY MOVEMENT OF PASSENGERS,
Net FreightMetric TonsKilometres
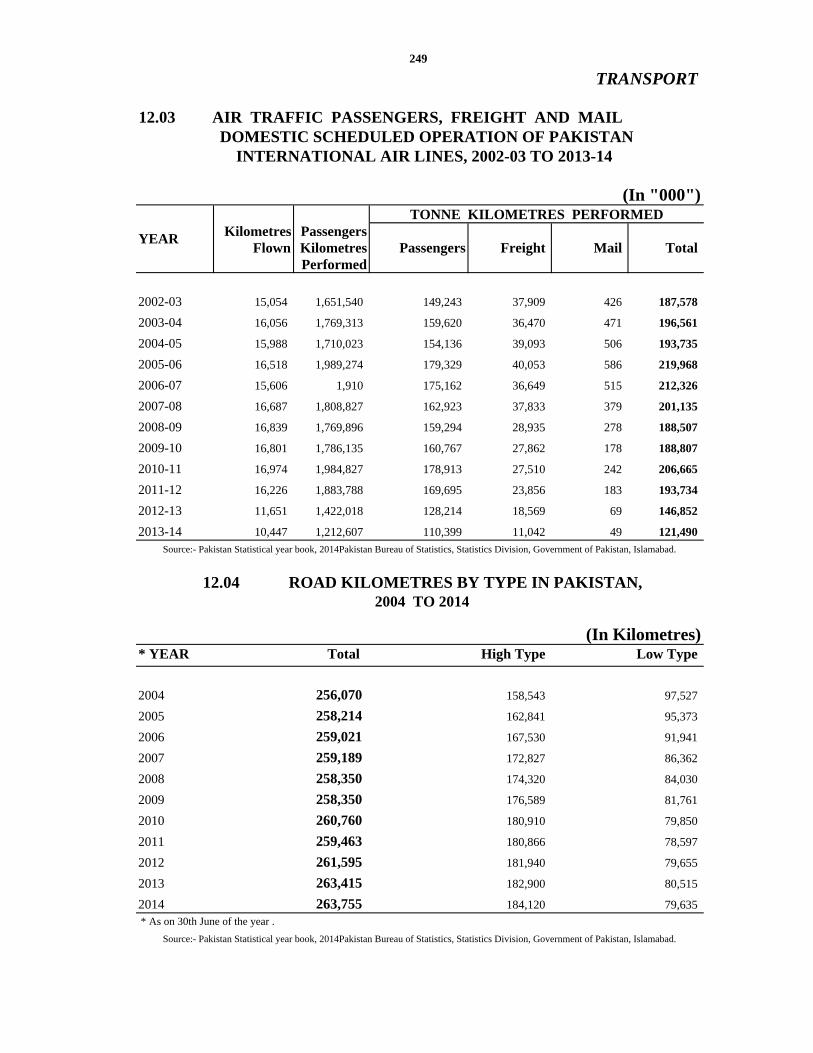
TRANSPORT
(In "000")TONNE KILOMETRES PERFORMED
Kilometres Passengers Flown Kilometres
Performed
2002-03 15,054 1,651,540 149,243 37,909 426 187,578
2003-04 16,056 1,769,313 159,620 36,470 471 196,561
2004-05 15,988 1,710,023 154,136 39,093 506 193,735
2005-06 16,518 1,989,274 179,329 40,053 586 219,968
2006-07 15,606 1,910 175,162 36,649 515 212,326
2007-08 16,687 1,808,827 162,923 37,833 379 201,135
2008-09 16,839 1,769,896 159,294 28,935 278 188,507
2009-10 16,801 1,786,135 160,767 27,862 178 188,807
2010-11 16,974 1,984,827 178,913 27,510 242 206,665
2011-12 16,226 1,883,788 169,695 23,856 183 193,734
2012-13 11,651 1,422,018 128,214 18,569 69 146,852
2013-14 10,447 1,212,607 110,399 11,042 49 121,490
12.04 ROAD KILOMETRES BY TYPE IN PAKISTAN,
(In Kilometres)* YEAR Total High Type Low Type
2004 256,070 158,543 97,527
2005 258,214 162,841 95,373
2006 259,021 167,530 91,941
2007 259,189 172,827 86,362
2008 258,350 174,320 84,030
2009 258,350 176,589 81,761
2010 260,760 180,910 79,850
2011 259,463 180,866 78,597
2012 261,595 181,940 79,655
2013 263,415 182,900 80,515
2014 263,755 184,120 79,635 * As on 30th June of the year .
Source:- Pakistan Statistical year book, 2014Pakistan Bureau of Statistics, Statistics Division, Government of Pakistan, Islamabad.
INTERNATIONAL AIR LINES, 2002-03 TO 2013-14
Source:- Pakistan Statistical year book, 2014Pakistan Bureau of Statistics, Statistics Division, Government of Pakistan, Islamabad.
2004 TO 2014
249
Total YEAR
Passengers Freight Mail
12.03 AIR TRAFFIC PASSENGERS, FREIGHT AND MAIL DOMESTIC SCHEDULED OPERATION OF PAKISTAN

High Low Type Type
2009-10 13,697 13,697 ..
2010-11 16,868 16,868 ..
2011-12 17,631 17,631 ..
2012-13 10,918 10,918 ..
2013-14 18,793 18,793 ..
SINDH 17,632 10,963 18,856 17,632 10,918 18,793 - - -
Khairpur 2,548 - 2,353 2,548 - 2,353 - - -
Jacobabad 455 - 486 455 - 486 - - -
Shikarpur 555 - 580 555 - 580 - - -
Ghotki 729 - 840 729 - 840 - - -
Sukkur 586 - 763 586 - 763 - - -
S.B.Abad 761 864 881 761 864 881 - - -
Naushero Feroze 718 - 673 718 - 673 - - -
Larkana 899 - 1,081 899 - 1,018 - - -
Sanghar 1,508 1,527 1,555 1,508 1,527 1,555 - - -
Mirpurkhas 862 877 883 862 877 883 - - -
Thartparkar @ Mithi 1,044 1,089 1,134 1,044 1,089 1,134 - - -
Umerkot 924 974 985 924 974 985 - - -
Dadu 816 961 971 816 916 971 - - -
Hyderabad 329 356 359 329 356 359 - - -
Tando Muhammad Khan 534 543 544 534 543 544 - - -
Tando Allah Yar 382 399 401 382 399 401 - - -
Matiari 285 285 295 285 285 295 - - -
Jamshoro 407 425 455 407 425 455 - - -
Kamber Shahdadkot 553 - 586 553 - 586 - - -
Kashmore@Kandhkot 259 - 280 259 - 280 - - -
Badin 1,156 1,280 1,307 1,156 1,280 1,307 - - -
Thatta 1,063 1,105 1,161 1,063 1,105 1,161 - - -
Karachi 259 278 283 259 278 283 - - -
12.05 ROAD KILOMETRES BY TYPE IN SINDH, 2009-10 TO 2013-14
TRANSPORT
2013-142013-14 2011-122012-13
Low Type
2012-13
Source:- High Ways, Communication & Works Department, Government of Sindh.
Note :- Road maintained by High ways Department only.
2012-13
Total High Type
2013-14 2011-12
TotalYEAR
Province / District2011-12
250
Source:- High Ways, Communication & Works Department, Government of Sindh.
(In Kilometres)
12.06 ROAD KILOMETRES BY DISTRICT IN SINDH, 2011-12 TO 2013-14
(In Kilometres)

TRANSPORT
(In Numbers)
TOTAL 1,905,304 1,838,792 190,024 350,490 3,179,721 370,308
Motor Cars, Jeeps and Wagons 661,567 653,268 40,221 52,873 968,803 1,048,603
Motor Cycle 940,649 888,229 115,027 254,261 1,799,862 2,186,109
Taxies 37,567 38,520 77 -- 50,516 50,735
Motor Rickshaws 73,445 73,558 22,738 31,642 117,780 150,160
Buses/M.Buses 26,748 26,583 1,158 251 29,675 29,942
Trucks 33,371 32,703 1,201 1,127 34,753 34,161
Tractors 55,791 53,810 5,092 4,232 69,506 81,716
Pickups, D.Vans. & Others 76,166 74,121 4,510 6,094 108,826 121,657
Type of Vehicles
TOTAL 1,550,870 1,168,898 509,748 404,010 3,785,273 4,098,593
Motor Cars, Jeeps and Wagons 466,181 407,881 60,860 199,639 1,049,390 1,582,294
Motor Cycle 908,016 496,250 377,263 170,742 2,262,714 2,012,747
Taxies 21,260 22,997 127 - 50,735 52,070
Motor Rickshaws 54,955 77,542 35,818 27,096 151,663 169,806
Buses/M.Buses 10,878 23,226 2,009 785 29,972 33,311
Trucks 13,649 22,882 2,536 1,059 34,117 35,849
Tractors 22,660 69,806 23,311 3,339 85,021 88,313
Pickups, D.Vans. & Others 53,271 48,314 7,824 1,350 121,661 124,203
2011-12
2013-14
251
12.07 MOTOR VEHICLES "ON ROAD", "REGISTERED" & "STOOD REGISTERED" IN SINDH, 2010-11 TO 2013-14
2010-11
REGISTEREDDURING
Type of Vehicles
2010-11
ON ROADDURING
THE YEAR
STOOD REGISTERED
CUMMULATIVE
FIGURES
Source:- Excise and Taxation Department, Government of Sindh, Karachi.
2012-13 2013-14
THE YEAR
2012-13 2013-14 2012-13
2011-122011-12 2010-11

(In Numbers)Motor Cars, Motor Buses/
Province/District Jeeps & Station Cycles M.BusesWagons
SINDH 466,181 908,016 21,260 54,955 10,878
Khairpur 636 20,986 10 660 122
Ghotki 0 1,020 0 0 0
Jacobabad 0 0 0 0 0
* Kashmore@Kandhkot 0 250 0 0 0
* Sukkur 50 18,000 0 560 0
Shikarpur 519 0 18 45 330
S.B.Abad 54 6,232 0 2 26
Naushero Feroze 0 4,851 0 0 0
Larkana 0 12,513 0 14 0
Kamber Shahdadkot 0 0 0 0 0
Sanghar 1,750 0 0 1,200 195
* Mirpurkhas 0 6,508 0 30 0
Umerkot 0 0 0 0 0
* Tharparkar@Mithi 0 271 0 0 0
* Dadu 419 43,670 0 0 85
* Jamshoro 0 169,000 0 0 0
Hyderabad 0 0 0 0 0
Matiari 0 63 0 0 0
Tando Allah yar 5 0 0 0 5
Tando Muhammad Khan 0 24 0 0 0
* Badin 0 0 0 0 0
Thatta 229 779 0 0 66
Karachi 462,519 623,849 21,232 52,444 10,049
.. = Data Not available Contd.
* Newly created districts.
252
TRANSPORT
12.08 MOTOR VEHICLES " ON ROAD " BY TYPE AND DISTRICTIN SINDH, 2012-13 TO 2013-14
2012-13
RickshawsTaxies

(In Numbers) Pickups/
D.Vans& Others
SINDH 13,649 22,660 53,271 1,550,870
Khairpur 100 5,982 30 28,526
Ghotki 0 68 0 1,088
Jacobabad 0 0 0 0
* Kashmore@Kandhkot 0 0 0 250
* Sukkur 0 800 0 19,410
Shikarpur 54 218 97 1,281
S.B.Abad 0 226 4 6,597
Naushero Feroze 0 441 0 5,292
Larkana 0 643 0 13,161
Kamber Shahdadkot 0 0 0 0
Sanghar 325 4,100 875 8,445
* Mirpurkhas 0 748 0 7,286
Umerkot 0 0 0 0
* Tharparkar@Mithi 0 0 0 271
* Dadu 45 2,711 108 47,038
* Jamshoro 0 3,000 0 172,000
Hyderabad 0 0 0 0
Matiari 0 0 0 63
Tando Allah yar 15 204 0 229
Tando Muhammad Khan 0 47 0 71
* Badin 0 90 0 90
Thatta 53 1,777 105 3,009
Karachi 13,004 1,614 52,052 13,004
2012-13
Contd.
253
TRANSPORT
12.08 MOTOR VEHICLES " ON ROAD " BY TYPE AND DISTRICT IN SINDH, 2012-13 TO 2013-14
Province/District Trucks Tractors Total
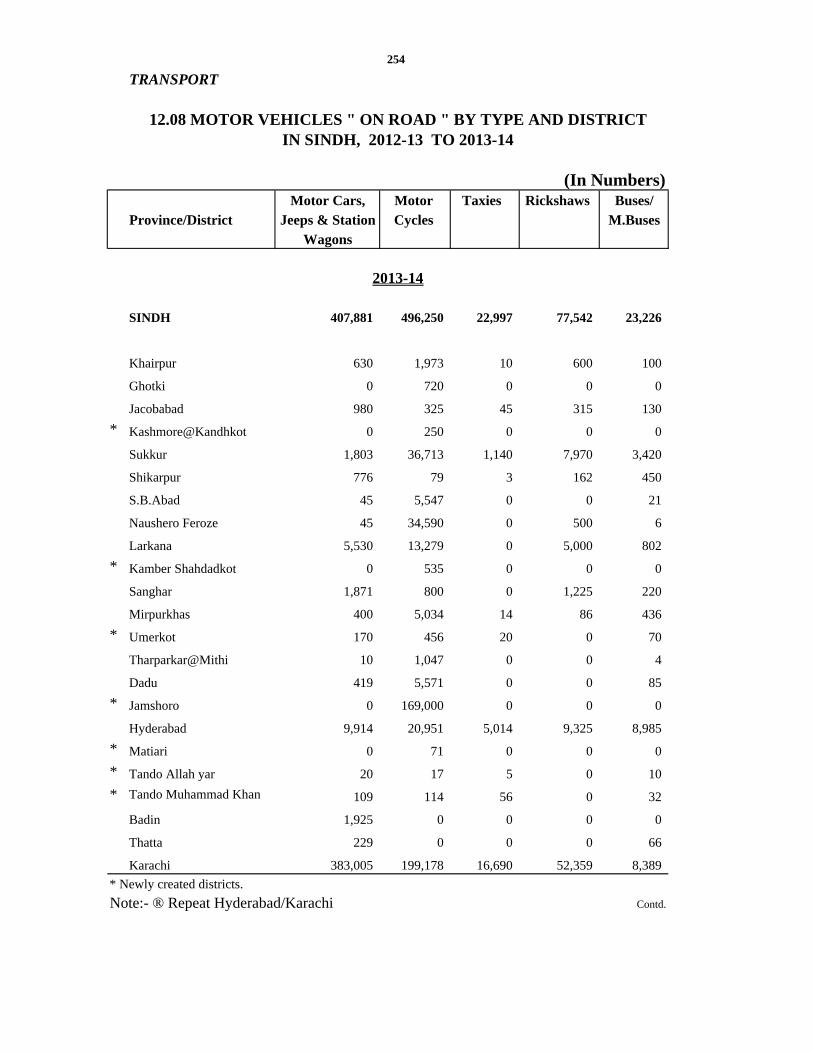
(In Numbers)Motor Cars, Motor Taxies Rickshaws Buses/
Province/District Jeeps & Station Cycles M.BusesWagons
SINDH 407,881 496,250 22,997 77,542 23,226
Khairpur 630 1,973 10 600 100
Ghotki 0 720 0 0 0
Jacobabad 980 325 45 315 130
* Kashmore@Kandhkot 0 250 0 0 0
Sukkur 1,803 36,713 1,140 7,970 3,420
Shikarpur 776 79 3 162 450
S.B.Abad 45 5,547 0 0 21
Naushero Feroze 45 34,590 0 500 6
Larkana 5,530 13,279 0 5,000 802
* Kamber Shahdadkot 0 535 0 0 0
Sanghar 1,871 800 0 1,225 220
Mirpurkhas 400 5,034 14 86 436
* Umerkot 170 456 20 0 70
Tharparkar@Mithi 10 1,047 0 0 4
Dadu 419 5,571 0 0 85
* Jamshoro 0 169,000 0 0 0
Hyderabad 9,914 20,951 5,014 9,325 8,985
* Matiari 0 71 0 0 0
* Tando Allah yar 20 17 5 0 10
* Tando Muhammad Khan 109 114 56 0 32
Badin 1,925 0 0 0 0
Thatta 229 0 0 0 66
Karachi 383,005 199,178 16,690 52,359 8,389
Contd.Note:- ® Repeat Hyderabad/Karachi * Newly created districts.
254
TRANSPORT
12.08 MOTOR VEHICLES " ON ROAD " BY TYPE AND DISTRICTIN SINDH, 2012-13 TO 2013-14
2013-14
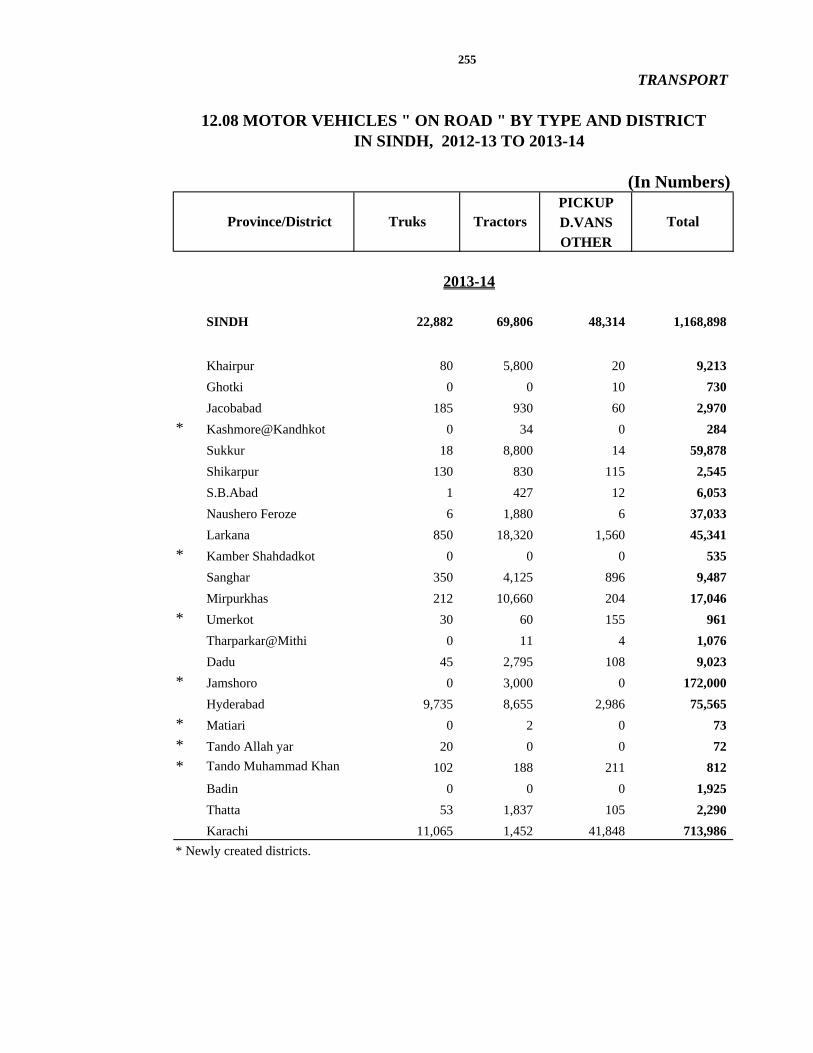
(In Numbers)PICKUPD.VANSOTHER
SINDH 22,882 69,806 48,314 1,168,898
Khairpur 80 5,800 20 9,213
Ghotki 0 0 10 730
Jacobabad 185 930 60 2,970
* Kashmore@Kandhkot 0 34 0 284
Sukkur 18 8,800 14 59,878
Shikarpur 130 830 115 2,545
S.B.Abad 1 427 12 6,053
Naushero Feroze 6 1,880 6 37,033
Larkana 850 18,320 1,560 45,341
* Kamber Shahdadkot 0 0 0 535
Sanghar 350 4,125 896 9,487
Mirpurkhas 212 10,660 204 17,046
* Umerkot 30 60 155 961
Tharparkar@Mithi 0 11 4 1,076
Dadu 45 2,795 108 9,023
* Jamshoro 0 3,000 0 172,000
Hyderabad 9,735 8,655 2,986 75,565
* Matiari 0 2 0 73
* Tando Allah yar 20 0 0 72
* Tando Muhammad Khan 102 188 211 812
Badin 0 0 0 1,925
Thatta 53 1,837 105 2,290
Karachi 11,065 1,452 41,848 713,986
255
TRANSPORT
IN SINDH, 2012-13 TO 2013-14
2013-14
Truks
12.08 MOTOR VEHICLES " ON ROAD " BY TYPE AND DISTRICT
Tractors TotalProvince/District
* Newly created districts.

(In Numbers)
1993-94 117,083 105,144 11,939
1994-95 87,045 80,449 6,596
1995-96 91,652 82,999 8,653
1996-97 84,081 - -
1997-98 74,923 - -
1998-99 74,650 - -
1993-94 558,519 553,324 5,195
1994-95 603,360 597,327 6,033
1995-96 625,396 618,903 6,493
1996-97 709,968 - -
1997-98 786,797 - -
1998-99 900,826 - -
1999-00 957,408 - -
2000-01 978,907 - -
2001-02 1,019,479 - -
2002-03 1,288,745 - -
2003-04 1,327,413 1,300,865 26,548
2004-05 1,160,803 - -
2005-06 1,561,448 - -
2006-07 1,782,439 - -
2007-08 1,931,215 - -
2008-09 2,057,476 - -
2009-10 2,154,397 - -
2010-11 2,250,401 - -
2011-12 2,527,788 - -
2012-13 2,561,376 - -
2013-14 2,662,871 - -
256
COMMUNICATION
TOTAL DOMESTIC COMMERCIAL
TYPE OF USERS
12.09 RADIO AND TELEVISION LICENCES ESTIMATED IN SINDH, 1993-94 TO 2013-14
Source:- i) Post Master General, Southern Metropolitan Circle.
ii). Pakistan Television Corporation, Islamabad.
RADIO
TELEVISION
YEAR
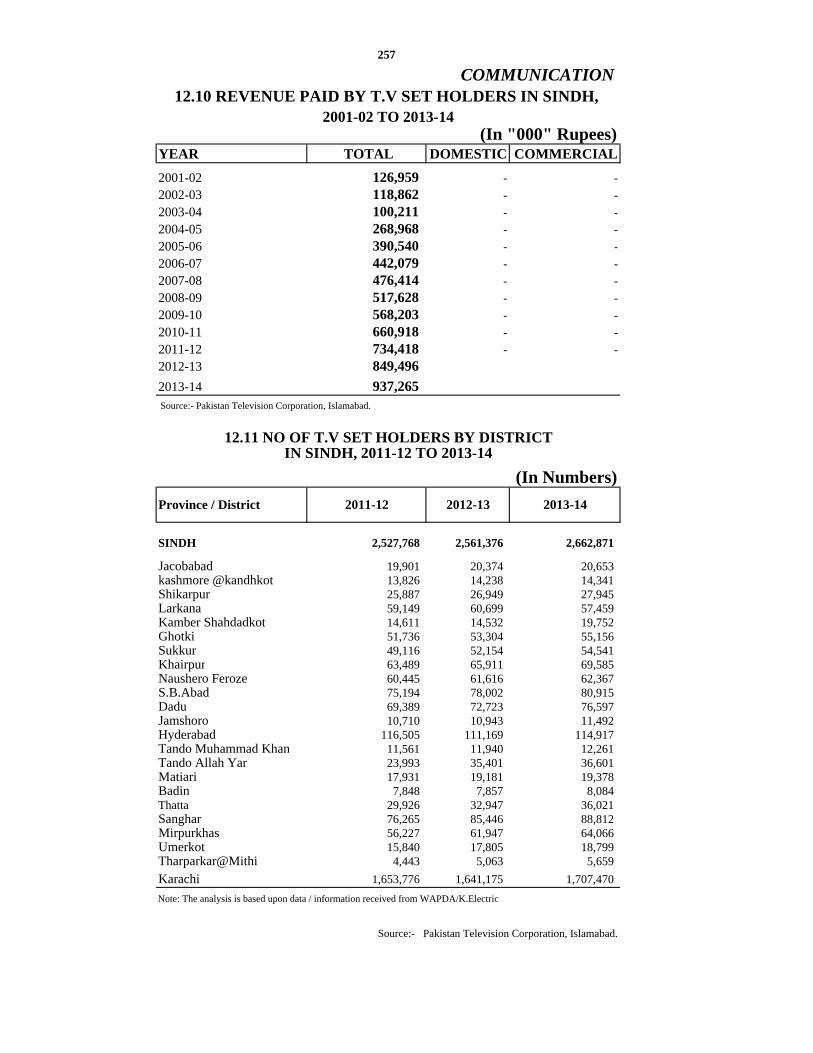
YEAR TOTAL DOMESTIC COMMERCIAL
2001-02 126,959 - -
2002-03 118,862 - -
2003-04 100,211 - -
2004-05 268,968 - -
2005-06 390,540 - -
2006-07 442,079 - -
2007-08 476,414 - -
2008-09 517,628 - -
2009-10 568,203 - -
2010-11 660,918 - -
2011-12 734,418 - -
2012-13 849,496
2013-14 937,265 Source:- Pakistan Television Corporation, Islamabad.
SINDH 2,527,768 2,561,376 2,662,871
Jacobabad 19,901 20,374 20,653 kashmore @kandhkot 13,826 14,238 14,341 Shikarpur 25,887 26,949 27,945 Larkana 59,149 60,699 57,459 Kamber Shahdadkot 14,611 14,532 19,752 Ghotki 51,736 53,304 55,156 Sukkur 49,116 52,154 54,541 Khairpur 63,489 65,911 69,585 Naushero Feroze 60,445 61,616 62,367 S.B.Abad 75,194 78,002 80,915 Dadu 69,389 72,723 76,597 Jamshoro 10,710 10,943 11,492 Hyderabad 116,505 111,169 114,917 Tando Muhammad Khan 11,561 11,940 12,261 Tando Allah Yar 23,993 35,401 36,601 Matiari 17,931 19,181 19,378 Badin 7,848 7,857 8,084 Thatta 29,926 32,947 36,021 Sanghar 76,265 85,446 88,812 Mirpurkhas 56,227 61,947 64,066 Umerkot 15,840 17,805 18,799 Tharparkar@Mithi 4,443 5,063 5,659
Karachi 1,653,776 1,641,175 1,707,470
Note: The analysis is based upon data / information received from WAPDA/K.Electric
2011-12 2012-13
Source:- Pakistan Television Corporation, Islamabad.
Province / District 2013-14
(In Numbers)
IN SINDH, 2011-12 TO 2013-14
257
COMMUNICATION
2001-02 TO 2013-1412.10 REVENUE PAID BY T.V SET HOLDERS IN SINDH,
(In "000" Rupees)
12.11 NO OF T.V SET HOLDERS BY DISTRICT

940649 653268
908016
496250
37567
38520
21260
22997
73445 73558
54955
77542
26748 26583
10878
23226
33371 32703
13649
22882
55791 53810
22660
69806
76166 74121 53271 48314
50%
60%
70%
80%
90%
100%
s in Numbers
Motor Vehicles "On Road" in Sindh during the Year 2010‐11 to 2013‐14
661567
653268
466181
407881
0%
10%
20%
30%
40%
2010‐11 2011‐12 2012‐13 2013‐14
Motor Vehicles
Years Pickups, D.Vans and Others
Tractors
Trucks
Buses/M.Buses
Motor Rickshaws
Taxies
Motor Cycle
Motor Cars, Jeeps and Wagons

13.00 EDUCATION

263
EXPLANATORY NOTE
EDUCATION
This sector covers three years data of the following categories.
A. Schools
B. Colleges / Institutions
C. Universities
A. SCHOOL
The categories of Schools and respondents are as under:-
Category of Institutions. Respondents
Primary, Middle & Secondary.
The data processing cell of Sindh Education Management Information system (SEMIS) consolidate data with the help of 23 district SEMIS cells in Sindh.
Level of Schooling
Primary Level. Middle Level. Secondary Level. Primary Level covers. Middle Level covers. Secondary Level covers. Higher Secondary Level Covers.
Primary Schools. Middle & Elementary Schools. Secondary &Higher Secondary Schools. Grades 1 to 5 Grades 1 to 8 (Elementary: Grade 6 to 8) Grades 6 to 10 or Grades1 to 10 Grades 6 to 12or Grades 1 to 12
Scope & Coverage
The information covers number of institutions, enrolment and teaching staff of
Primary, Middle, and Secondary and Higher Secondary Schools by sex and by districts. SEMIS
has covered only those institutions which are running under the Administrative control of
Education Department, Government of Sindh. Due to non-response from a number of Private
Schools, SEMIS has not compiled & published report. However, efforts will continue to cover
the non responding private / autonomous schools by SEMIS.
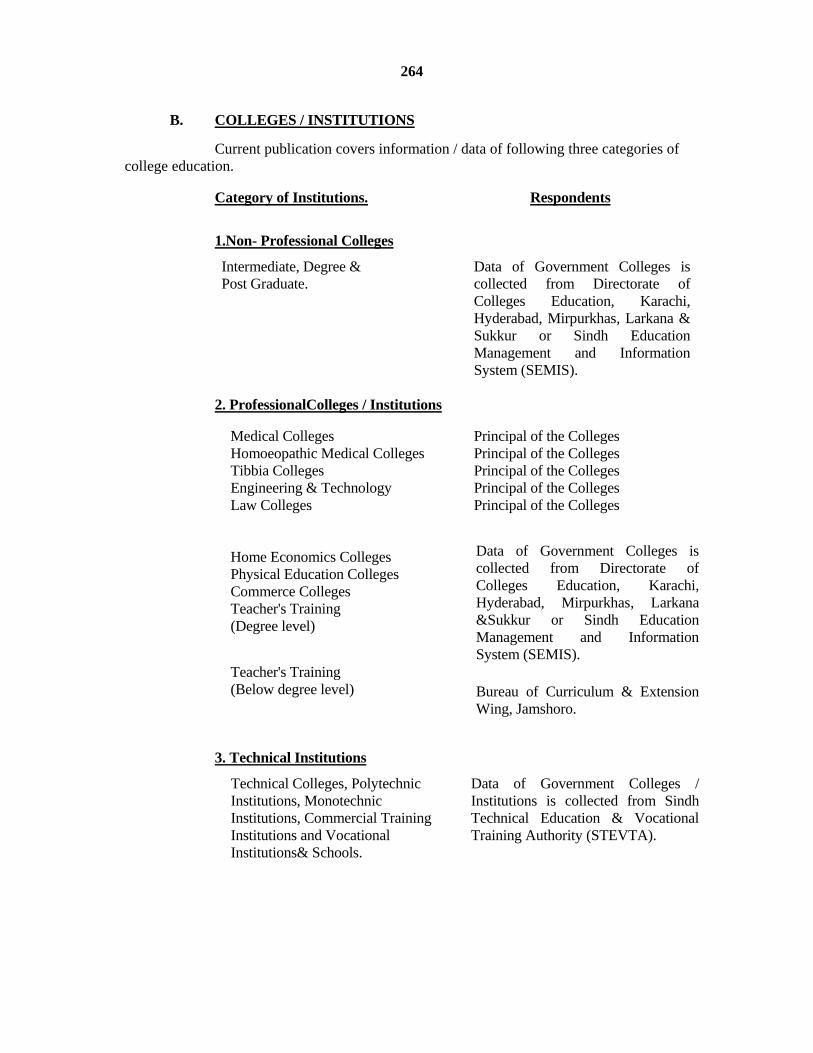
264
B. COLLEGES / INSTITUTIONS
Current publication covers information / data of following three categories of college education.
Category of Institutions. Respondents
1.Non- Professional Colleges
Intermediate, Degree & Post Graduate.
Data of Government Colleges is collected from Directorate of Colleges Education, Karachi, Hyderabad, Mirpurkhas, Larkana & Sukkur or Sindh Education Management and Information System (SEMIS).
2. ProfessionalColleges / Institutions
Medical Colleges
Homoeopathic Medical Colleges Tibbia Colleges Engineering & Technology Law Colleges Home Economics Colleges Physical Education Colleges Commerce Colleges Teacher's Training (Degree level)
Teacher's Training (Below degree level)
Principal of the Colleges Principal of the Colleges Principal of the Colleges Principal of the Colleges Principal of the Colleges
Data of Government Colleges is collected from Directorate of Colleges Education, Karachi, Hyderabad, Mirpurkhas, Larkana &Sukkur or Sindh Education Management and Information System (SEMIS).
Bureau of Curriculum & Extension Wing, Jamshoro.
3. Technical Institutions
Technical Colleges, Polytechnic Institutions, Monotechnic Institutions, Commercial Training Institutions and Vocational Institutions& Schools.
Data of Government Colleges / Institutions is collected from Sindh Technical Education & Vocational Training Authority (STEVTA).

265 Scope & Coverage (Professional & Non Professional) The data of Intermediate, Degree and Post Graduate Colleges (Non-Professional
Colleges) such as no. of institutions, enrolment, teaching staff by sex and by district pertaining
to Government colleges is given in current issue.
In Professional side data of Private / Autonomous Homoeopathic and Tibbia
colleges registered with Federal Government is also collected and incorporated in this
publication, whereas rest of the categories of colleges / institutions pertains to Government
sectors.
On Technical institutions side information about no. of institutions, enrolment
and teaching staff by sex and by district pertains to Government institutions only.
C. UNIVERSITIES
Category of Institutions. Respondents
General Engineering Agriculture
i) Pakistan Bureau of Statistics, Government of Pakistan, Islamabad.
The information given in this publication covers total no. of Universities, total
enrolment and total teaching staff by sex of Government sector Universities& Private Sectors.

NO. OF
INSTITUTIONS
Total Female Total Female Total Female
SCHOOLS 47,394 7,592 4,249,033 1,759,177 142,639 44,350
Primary 42,900 6,264 2,963,622 1,209,592 96,401 26,398
Middle 2,429 695 263,910 134,677 10,755 4,551
Secondary* 2,065 633 1,021,501 414,908 35,483 13,401
NON PROFESSIONAL COLLEGES 246 98 332,811 141,153 6,803 2,602
Intermediate 41 21 25,201 11,361 553 218
Degree 192 72 279,516 118,002 5,435 2,093
Post Graduate 13 5 28,094 11,790 815 291
PROFESSIONAL COLLEGES 63 13 31,450 13,904 1,332 423
Medical 3 .. 3,420 2,280 359 78
Homoeopathic 9 .. 2,535 1,441 83 49
Tibbia 4 .. 337 22 38 ..
Engineering & Technology 2 .. 1,124 55 65 4
Law 8 .. 5,731 1,116 125 15
Home Economics 2 .. 1,174 1,174 91 91
Physical Education 2 .. 163 40 8 ..
Commerce 2 .. 9,531 4,709 54 16
Teacher's Training (Degree level) 3 .. 1,761 998 86 20
Teacher's Training (Below degree level)** 28 11 5,674 2,069 423 160
TECHNICAL INSTITUTIONS 237 94 33,621 4,714 2,308 564
Polytechnic/Monotechnic Institutions
and Technical Colleges
Commercial Training Institutes 39 .. 2,194 .. 242 1
Vocational Training Institutes/school & centrse** 125 86 6,082 3,798 757 383
UNIVERSITIES **** 44 1 134,754 41,853 9,525 3,643
GOVT. SECTOR 18 1 76,150 21,465 4,632 1,468
Private Sector 26 1 58,604 20,388 4,893 2,175 ** = Including Degree awarding Institutes (Public sector)
*** = Technical Centres Merged with Commercial Institutes
Source:- i) Sindh Education Management Information System (SEMIS).
8 91625,345 180
iii) Sindh Technical Education & Voccational Traning Authority (STEVTA)
ii) Concerned Colleges.
iii) Concerned Directorate of Colleges Education.
1,30973
267EDUCATION
13.01 NUMBER OF INSTITUTIONS, ENROLMENT AND TEACHING STAFF
ENROLMENT TEACHING STAFF
2012-13
IN SINDH, 2012-13 TO 2013-14
INSTITUTIONS
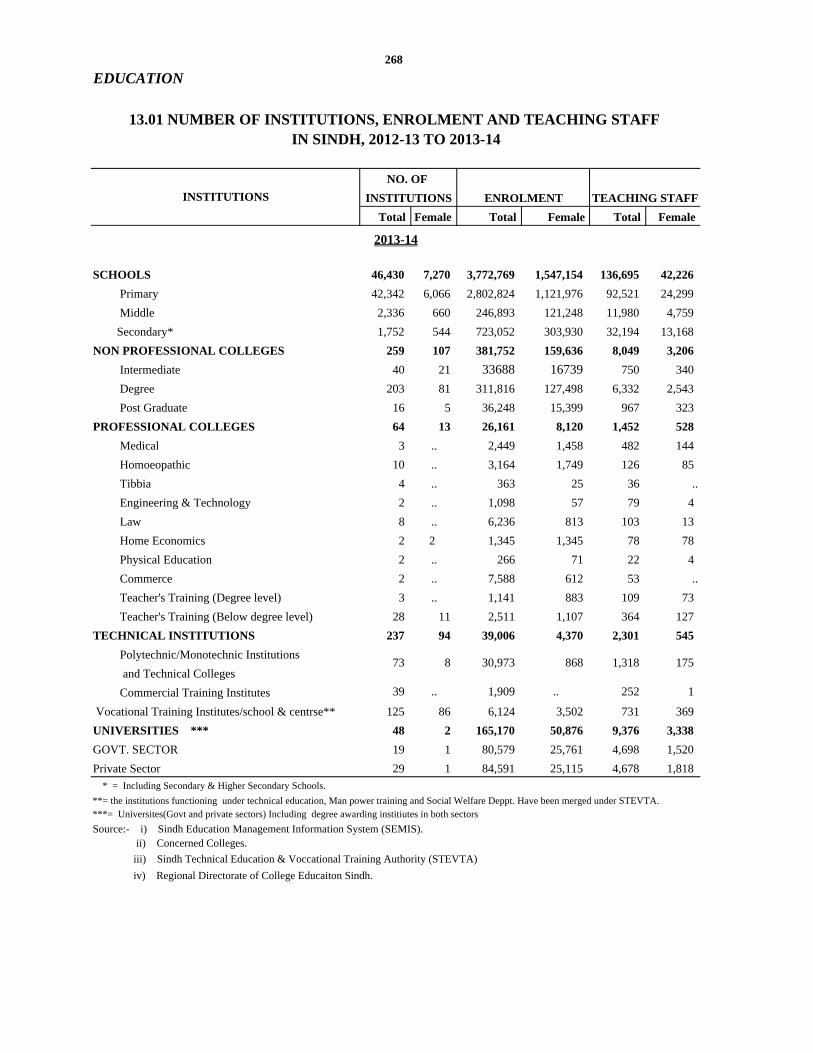
NO. OF
INSTITUTIONS
Total Female Total Female Total Female
SCHOOLS 46,430 7,270 3,772,769 1,547,154 136,695 42,226
Primary 42,342 6,066 2,802,824 1,121,976 92,521 24,299
Middle 2,336 660 246,893 121,248 11,980 4,759
Secondary* 1,752 544 723,052 303,930 32,194 13,168
NON PROFESSIONAL COLLEGES 259 107 381,752 159,636 8,049 3,206
Intermediate 40 21 33688 16739 750 340
Degree 203 81 311,816 127,498 6,332 2,543
Post Graduate 16 5 36,248 15,399 967 323
PROFESSIONAL COLLEGES 64 13 26,161 8,120 1,452 528
Medical 3 .. 2,449 1,458 482 144
Homoeopathic 10 .. 3,164 1,749 126 85
Tibbia 4 .. 363 25 36 ..
Engineering & Technology 2 .. 1,098 57 79 4
Law 8 .. 6,236 813 103 13
Home Economics 2 2 1,345 1,345 78 78
Physical Education 2 .. 266 71 22 4
Commerce 2 .. 7,588 612 53 ..
Teacher's Training (Degree level) 3 .. 1,141 883 109 73
Teacher's Training (Below degree level) 28 11 2,511 1,107 364 127
TECHNICAL INSTITUTIONS 237 94 39,006 4,370 2,301 545
Polytechnic/Monotechnic Institutions
and Technical Colleges
Commercial Training Institutes 39 .. 1,909 .. 252 1
Vocational Training Institutes/school & centrse** 125 86 6,124 3,502 731 369
UNIVERSITIES *** 48 2 165,170 50,876 9,376 3,338
GOVT. SECTOR 19 1 80,579 25,761 4,698 1,520
Private Sector 29 1 84,591 25,115 4,678 1,818
**= the institutions functioning under technical education, Man power training and Social Welfare Deppt. Have been merged under STEVTA.
iv) Regional Directorate of College Educaiton Sindh.
86873
ii) Concerned Colleges.Source:- i) Sindh Education Management Information System (SEMIS).
2013-14
8 30,973
* = Including Secondary & Higher Secondary Schools.
***= Universites(Govt and private sectors) Including degree awarding institiutes in both sectors
268
EDUCATION
175
13.01 NUMBER OF INSTITUTIONS, ENROLMENT AND TEACHING STAFF
iii) Sindh Technical Education & Voccational Training Authority (STEVTA)
IN SINDH, 2012-13 TO 2013-14
INSTITUTIONS
1,318
ENROLMENT TEACHING STAFF
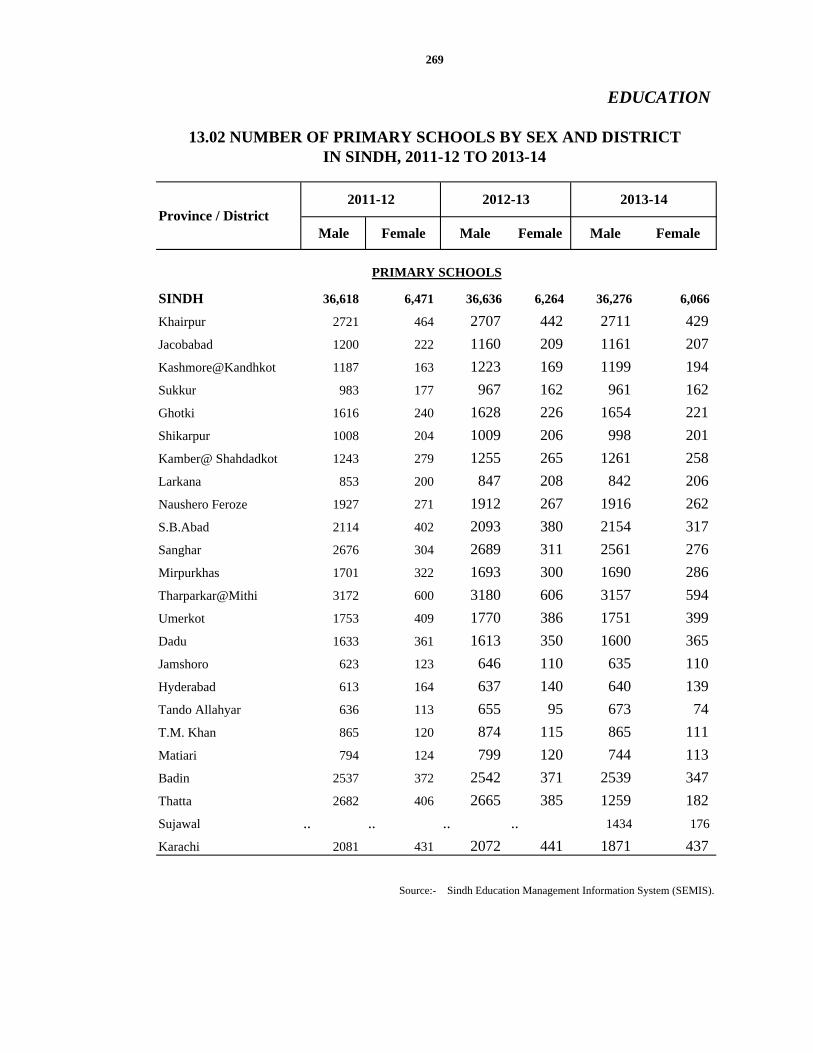
SINDH 36,618 6,471 36,636 6,264 36,276 6,066
Khairpur 2721 464 2707 442 2711 429
Jacobabad 1200 222 1160 209 1161 207
Kashmore@Kandhkot 1187 163 1223 169 1199 194
Sukkur 983 177 967 162 961 162
Ghotki 1616 240 1628 226 1654 221
Shikarpur 1008 204 1009 206 998 201
Kamber@ Shahdadkot 1243 279 1255 265 1261 258
Larkana 853 200 847 208 842 206
Naushero Feroze 1927 271 1912 267 1916 262
S.B.Abad 2114 402 2093 380 2154 317
Sanghar 2676 304 2689 311 2561 276
Mirpurkhas 1701 322 1693 300 1690 286
Tharparkar@Mithi 3172 600 3180 606 3157 594
Umerkot 1753 409 1770 386 1751 399
Dadu 1633 361 1613 350 1600 365
Jamshoro 623 123 646 110 635 110
Hyderabad 613 164 637 140 640 139
Tando Allahyar 636 113 655 95 673 74
T.M. Khan 865 120 874 115 865 111
Matiari 794 124 799 120 744 113
Badin 2537 372 2542 371 2539 347
Thatta 2682 406 2665 385 1259 182
Sujawal .. .. .. .. 1434 176
Karachi 2081 431 2072 441 1871 437
PRIMARY SCHOOLS
Province / District
EDUCATION
269
13.02 NUMBER OF PRIMARY SCHOOLS BY SEX AND DISTRICT IN SINDH, 2011-12 TO 2013-14
Source:- Sindh Education Management Information System (SEMIS).
2011-12 2012-13 2013-14
Male Female Male Female Male Female

SINDH 1,748,862 1,231,584 1,754,030 1,209,592 1,680,848 1,121,976
Khairpur 114,161 81,110 116,672 82,251 114,503 78,680
Jacobabad 83,011 60,851 79,887 61,128 75,495 62,587
Kashmore@Kandhkot 58,572 27,086 60,882 28,699 57,365 26,208
Sukkur 55,130 36,657 57,729 37,137 58,582 36,674
Ghotki 100,213 47,265 97,446 45,171 103,114 46,323
Shikarpur 60,684 37,751 59,943 36,804 60,043 38,428
Kamber @Shahdadkot 92,260 64,049 85,208 61,213 85,753 57,061
Larkana 82,609 58,873 83,994 62,927 83,343 60,776
Naushero Feroze 93,647 64,073 93,543 63,385 92,730 63,825
S.B.Abad 91,047 55,785 91,833 55,649 91,959 55,897
Sanghar 108,799 65,402 111,879 67,391 108,611 60,705
Mirpurkhas 70,243 40,624 68,768 37,579 67,482 34,482
Tharparkar@Mithi 92,231 74,910 88,698 70,526 76,019 56,634
Umerkot 52,414 32,794 51,655 30,589 48,320 26,050
Dadu 121,727 89,030 120,568 85,925 115,853 83,507
Jamshoro 30,664 22,900 32,773 23,462 32,485 20,748
Hyderabad 40,977 34,927 41,161 34,707 40,282 34,951
Tando Allah Yar 28,710 16,989 30,789 18,098 32,000 17,674
T.M. Khan 27,944 16,999 28,431 17,749 26,452 15,302
Matiari 37,516 24,279 39,961 25,496 36,920 23,529
Badin 85,266 58,581 89,047 54,609 83,595 47,151
Thatta 77,798 62,504 81,111 59,437 36,812 24,554
Sujawal* - - - - 40,005 26,355
Karachi 143,239 158,145 142,052 149,660 113125 123875
* New district developed in 2013-14
Source:- Sindh Education Management Information System (SEMIS).
ENROLMENT
270
EDUCATION
IN SINDH, 2011-12 TO 2013-14
Province / District2011-12
13.03 ENROLMENT OF PRIMARY SCHOOLS BY SEX AND DISTRICT
2012-13 2013-14
Male Female Male Female Male Female

SINDH 71,832 27,422 70,003 26,398 68,222 24,299
Khairpur 4,594 1,379 4,461 1,243 4,373 1,148
Jacobabad 3,055 774 2,877 762 2,930 754
Kashmore@Kandhkot 1,845 316 1,901 305 1,810 252
Sukkur 2,446 657 2,425 642 2,375 618
Ghotki 3,295 527 3,194 510 3,246 507
Shikarpur 2,699 682 2,613 675 2,582 629
Kamber@ Shahdadkot 2,523 584 2,478 609 2,830 811
Larkana 3,485 1,106 3,358 1,123 3,300 1,107
Naushero Feroze 4,053 1,111 3,920 1,064 3,929 1,071
S.B.Abad 3,930 1,103 3,753 1,059 3,707 1,022
Sanghar 5,747 1,352 5,537 1,281 5,313 1,123
Mirpurkhas 2,913 1,226 2,817 1,062 2,712 891
Tharparkar@Mithi 3,908 557 3,885 544 3,649 508
Umerkot 2,471 644 2,374 563 2,306 480
Dadu 4,212 1,083 3,992 998 3,977 920
Jamshoro 1,313 374 1,352 411 1,287 400
Hyderabad 2,122 1,562 2,082 1,571 2,073 1,578
Tando Allah Yar 1,097 344 1,079 311 1,074 260
T.M. Khan 1,469 279 1,368 266 1,249 208
Matiari 2,099 538 2,050 471 1,878 445
Badin 3,924 736 3,887 694 3,702 633
Thatta 3,740 771 3,706 698 1,605 425
Sujawal* .. .. .. .. 2,005 238
Karachi 4,892 9,717 4,894 9,536 4,310 8,271
* New district developed in 2013-14.
TEACHING STAFF
Source:- Sindh Education Management Information System (SEMIS).
271
EDUCATION
DISTRICT IN SINDH, 2011-12 TO 2013-14
Province / District2011-12
13.04 TEACHING STAFF IN PRIMARY SCHOOLS BY SEX AND
2012-13 2013-14
Male Female Male Female Male Female

Male Female Male Female Male Female
SINDH 1,823 731 1734 695 1676 660
Khairpur 132 56 129 55 142 49Jacobabad 45 22 35 21 35 22Kashmore@Kandhkot 41 15 38 15 39 13Sukkur 59 22 56 19 60 23Ghotki 77 25 77 27 55 28Shikarpur 44 27 42 24 46 17Kamber@ Shahdadkot 43 18 39 16 35 21Larkana 47 24 39 22 48 24Naushero Feroze 122 49 102 48 111 51S.B.Abad 82 33 96 39 90 28Sanghar 82 47 69 39 62 43Mirpurkhas 66 31 86 32 65 39Tharparkar@Mithi 243 20 232 15 232 15Umerkot 70 21 71 21 70 17Dadu 53 28 56 33 42 17Jamshoro 25 8 15 5 23 7Hyderabad 45 24 51 18 56 15Tando Allahyar 40 12 34 8 43 9T. M. Khan 25 7 22 6 23 6Matiari 33 5 19 2 19 2Badin 98 34 84 29 82 25Thatta 63 31 65 30 34 18Sujawal* .. .. .. .. 17 12Karachi 288 172 277 171 247 159
* New district developed in 2013-14
Source:- Sindh Education Management and Information System (SEMIS).
MIDDLE SCHOOLS
2012-13 2013-14
272
EDUCATION
13.05 NUMBER OF MIDDLE SCHOOLS BY SEX AND DISTRICTIN SINDH, 2011-12 TO 2013-14
2011-12Province / District

13.06 ENROLMENT OF MIDDLE SCHOOLS BY SEX AND DISTRICT
Male Female Male Female Male Female
SINDH 141,300 138,828 129,233 134,677 125,645 121,248
Khairpur 21,060 17,286 20,016 16,494 16,481 12,513
Jacobabad 2,958 4,260 1,976 4,043 2,628 4,130
Kashmore@Kandhkot 3,710 2,321 3,079 3,873 3,145 3,175
Sukkur 7,410 6,620 7,450 7,281 8,227 6,959
Ghotki 6,043 5,324 5,850 5,194 4,471 3,870
Shikarpur 1,645 2,760 1,574 2,447 1,970 2,281
Kamber@ Shahdadkot 2,762 2,545 2,040 2,189 2,209 2,776
Larkana 5,416 6,109 3,738 4,927 5,963 6,099
Naushero Feroze 10,988 9,991 8,055 8,086 9,423 8,991
S.B.Abad 4,087 3,594 5,724 5,017 6,486 4,958
Sanghar 5,097 5,184 3,926 4,711 3,993 5,347
Mirpurkhas 4,510 2,610 4,310 2,619 4,182 1,926
Tharparkar@Mithi 8,417 6,636 8,283 6,635 8,374 6,231
Umerkot 2,696 1,872 1,935 1,493 2,273 1,482
Dadu 3,651 3,355 5,603 5,162 3,791 3,642
Jamshoro 3,636 2,117 2,267 1,560 2,946 1,552
Hyderabad 10,408 10,547 10,913 10,893 9,637 9,989
Tando Allah Yar 2,570 2,056 1,461 1,074 1,554 1,387
T.M. Khan 2,012 863 1,997 883 1,987 986
Matiari 1,683 1,044 715 378 1,573 763
Badin 6,897 5,310 4,907 4,625 4,600 2,841
Thatta 1,900 2,684 1,899 2,934 1,669 1,505
Sujawal 484 970
Karachi 21,744 33,740 21,515 32,159 17,579 26,875
Source:- Sindh Education Management and Information System (SEMIS).
ENROLMENT
273
EDUCATION
IN SINDH, 2011-12 TO 2013-14
2011-12 2012-13 2013-14Province / District

Male Female Male Female Male Female
SINDH 7,012 5,051 6,204 4551 7,221 4759
Khairpur 822 366 685 329 754 307Jacobabad 260 172 182 134 239 141
Kashmore@Kandhkot 248 42 155 36 165 33
Sukkur 372 256 371 212 420 237
Ghotki 234 55 258 55 233 70
Shikarpur 140 105 121 87 159 86
Kamber@ Shahdadkot 139 37 136 33 176 72
Larkana 213 128 140 103 232 138
Naushero Feroze 506 208 386 169 477 195
S.B.Abad 205 97 251 157 298 165
Sanghar 294 230 264 176 270 230
Mirpurkhas 220 74 205 60 222 82
Tharparkar@Mithi 369 17 345 19 451 35
Umerkot 117 16 90 14 138 19
Dadu 273 87 287 99 239 63
Jamshoro 159 41 99 33 136 32
Hyderabad 661 741 614 614 702 722
Tando Allah Yar 94 29 51 19 106 45
T.M. Khan 103 13 122 11 128 15
Matiari 132 13 71 2 160 15
Badin 341 86 241 46 240 35
Thatta 161 64 153 75 141 72
Sujawal* - - - - 77 49
Karachi 949 2,174 977 2068 1,058 1901* New district developed in 2013-14
Source:- Sindh Education Management and Information System (SEMIS).
2011-12 2012-13 2013-14
TEACHING STAFF
274
EDUCATION
13.07 TEACHING STAFF IN MIDDLE SCHOOLS BY SEX AND DISTRICT IN SINDH, 2011-12 TO 2013-14
Province / District

Male Female Male Female Male Female
SINDH 1,315 599 1,432 633 1,208 544
Khairpur 92 25 101 32 85 33
Jacobabad 30 6 34 10 28 7
Kashmore@Kandhkot 28 4 39 10 30 8
Sukkur 51 19 52 18 45 13
Ghotki 36 4 35 5 31 2
Shikarpur 44 12 44 14 35 18
Kamber@Shahdadkot 37 11 43 13 38 8
Larkana 42 20 49 21 41 15
Naushero Feroze 53 18 69 19 47 10
S.B.Abad 63 21 65 22 56 20
Sanghar 62 17 63 17 50 11
Mirpurkhas 52 23 57 27 48 23
Tharparkar@Mithi 38 8 41 7 33 7
Umerkot 43 13 46 15 33 15
Dadu 49 11 67 16 51 15
Jamshoro 29 12 33 11 28 8
Hyderabad 55 36 58 33 51 27
Tando Allah Yar 21 5 27 8 24 8
T.M Khan 26 12 26 12 24 12
Matiari 24 10 37 13 33 12
Badin 46 13 55 15 49 13
Thatta 54 18 54 18 26 12
Sujawal* - - - - 17 3
Karachi 340 281 337 277 305 244
* New district developed in 2013-14
2013-14
Note:- Higher Secondary Schools are included in Secondary Schools.
IN SINDH, 2011-12 TO 2013-14
SECONDARY SCHOOLS
Source:- Sindh Education Management and Information System (SEMIS).
EDUCATION
275
13.08 NUMBER OF SECONDARY SCHOOLS BY SEX AND DISTRICT
Province / District2011-12 2012-13
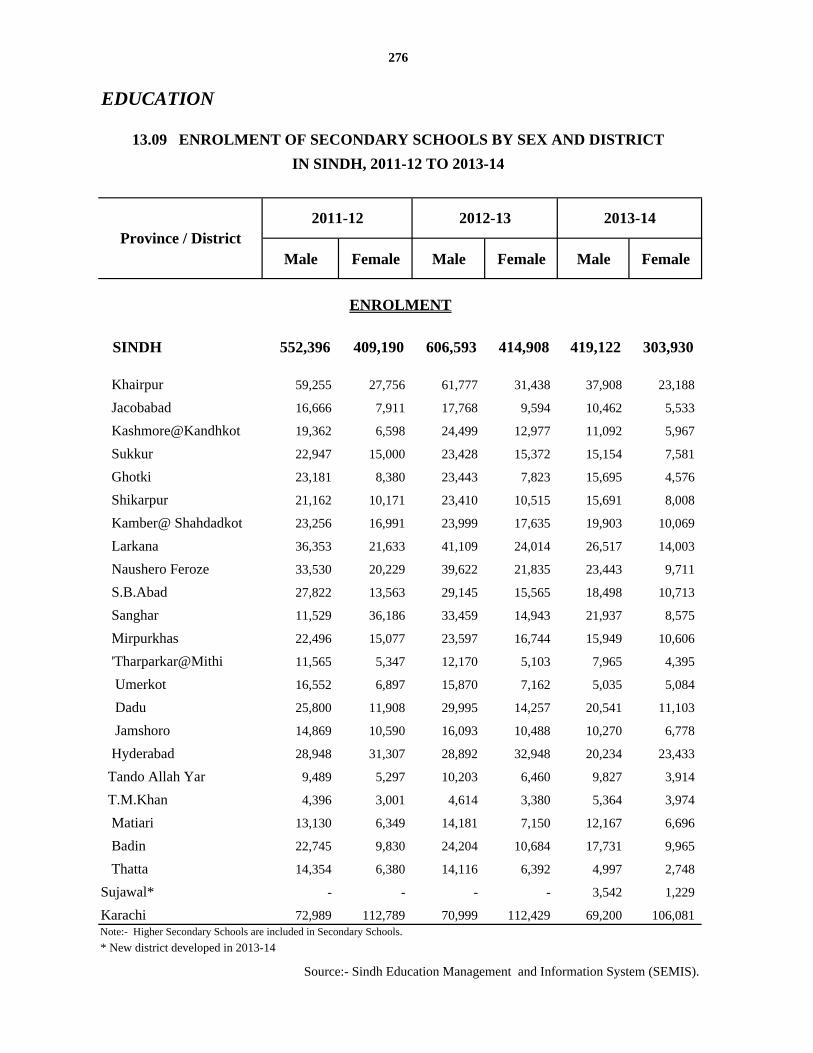
Male Female Male Female Male Female
SINDH 552,396 409,190 606,593 414,908 419,122 303,930
Khairpur 59,255 27,756 61,777 31,438 37,908 23,188
Jacobabad 16,666 7,911 17,768 9,594 10,462 5,533
Kashmore@Kandhkot 19,362 6,598 24,499 12,977 11,092 5,967
Sukkur 22,947 15,000 23,428 15,372 15,154 7,581
Ghotki 23,181 8,380 23,443 7,823 15,695 4,576
Shikarpur 21,162 10,171 23,410 10,515 15,691 8,008
Kamber@ Shahdadkot 23,256 16,991 23,999 17,635 19,903 10,069
Larkana 36,353 21,633 41,109 24,014 26,517 14,003
Naushero Feroze 33,530 20,229 39,622 21,835 23,443 9,711
S.B.Abad 27,822 13,563 29,145 15,565 18,498 10,713
Sanghar 11,529 36,186 33,459 14,943 21,937 8,575
Mirpurkhas 22,496 15,077 23,597 16,744 15,949 10,606
'Tharparkar@Mithi 11,565 5,347 12,170 5,103 7,965 4,395
Umerkot 16,552 6,897 15,870 7,162 5,035 5,084
Dadu 25,800 11,908 29,995 14,257 20,541 11,103
Jamshoro 14,869 10,590 16,093 10,488 10,270 6,778
Hyderabad 28,948 31,307 28,892 32,948 20,234 23,433
Tando Allah Yar 9,489 5,297 10,203 6,460 9,827 3,914
T.M.Khan 4,396 3,001 4,614 3,380 5,364 3,974
Matiari 13,130 6,349 14,181 7,150 12,167 6,696
Badin 22,745 9,830 24,204 10,684 17,731 9,965
Thatta 14,354 6,380 14,116 6,392 4,997 2,748
Sujawal* - - - - 3,542 1,229
Karachi 72,989 112,789 70,999 112,429 69,200 106,081
* New district developed in 2013-14
2013-14
Source:- Sindh Education Management and Information System (SEMIS).
ENROLMENT
Note:- Higher Secondary Schools are included in Secondary Schools.
276
EDUCATION
13.09 ENROLMENT OF SECONDARY SCHOOLS BY SEX AND DISTRICT
IN SINDH, 2011-12 TO 2013-14
Province / District2011-12 2012-13

Male Female Male Female Male Female
SINDH 21,076 13,710 22,082 13,401 19,026 13,168
Khairpur 2,175 599 2,153 554 1,617 466
Jacobabad 684 129 713 152 456 110
Kashmore@Kandhkot 751 93 809 111 478 92
Sukkur 1,048 485 1,006 393 791 239
Ghotki 678 88 702 92 608 36
Shikarpur 833 203 877 209 679 193
Kamber@ Shahdadkot 775 217 877 231 915 115
Larkana 1,107 541 1,255 523 845 341
Naushero Feroze 944 321 1,109 344 738 176
S.B.Abad 838 250 836 255 634 224
Sanghar 1,206 407 1,194 364 847 198
Mirpurkhas 800 472 845 500 771 429
Tharparkar@Mithi 394 75 427 74 390 90
Umerkot 389 91 408 117 281 118
Dadu 1,020 237 1,101 254 896 236
Jamshoro 494 280 558 268 508 198
Hyderabad 1,518 1,615 1,584 1,739 1,403 1,475
Tando Allah Yar 303 68 343 76 338 103
T.M. Khan 247 90 239 86 360 190
Matiari 469 135 553 155 665 182
Badin 789 237 781 211 662 221
Thatta 664 242 678 207 327 166
Sujawal* - - - - 187 38
Karachi 2,950 6,835 3,034 6,486 3,630 7,532
2012-13 2013-14
* New district developed in 2013-14
DISTRICT IN SINDH, 2011-12 TO 2013-14
TEACHING STAFF
Source:- Sindh Education Management and Information System (SEMIS).
277
EDUCATION
13.10 TEACHING STAFF IN SECONDARY SCHOOLS BY SEX AND
Province / District2011-12
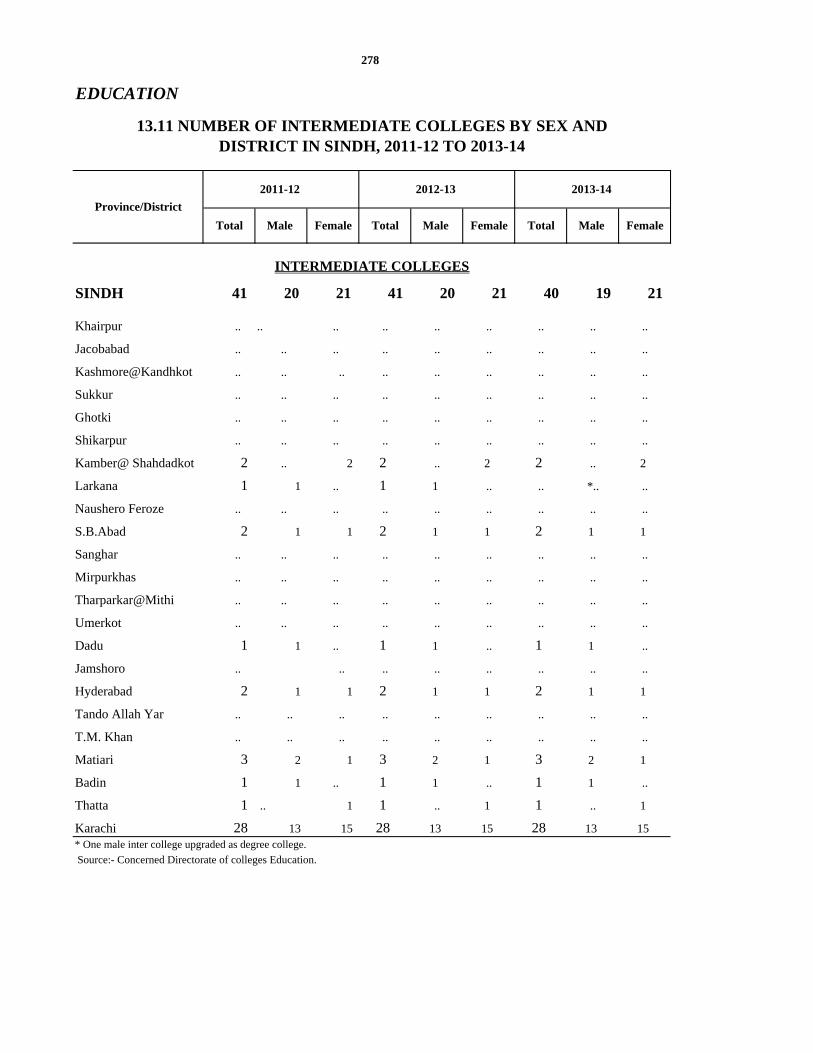
SINDH 41 20 21 41 20 21 40 19 21
Khairpur .. .. .. .. .. .. .. .. ..
Jacobabad .. .. .. .. .. .. .. .. ..
Kashmore@Kandhkot .. .. .. .. .. .. .. .. ..
Sukkur .. .. .. .. .. .. .. .. ..
Ghotki .. .. .. .. .. .. .. .. ..
Shikarpur .. .. .. .. .. .. .. .. ..
Kamber@ Shahdadkot 2 .. 2 2 .. 2 2 .. 2
Larkana 1 1 .. 1 1 .. .. *.. ..
Naushero Feroze .. .. .. .. .. .. .. .. ..
S.B.Abad 2 1 1 2 1 1 2 1 1
Sanghar .. .. .. .. .. .. .. .. ..
Mirpurkhas .. .. .. .. .. .. .. .. ..
Tharparkar@Mithi .. .. .. .. .. .. .. .. ..
Umerkot .. .. .. .. .. .. .. .. ..
Dadu 1 1 .. 1 1 .. 1 1 ..
Jamshoro .. .. .. .. .. .. .. ..
Hyderabad 2 1 1 2 1 1 2 1 1
Tando Allah Yar .. .. .. .. .. .. .. .. ..
T.M. Khan .. .. .. .. .. .. .. .. ..
Matiari 3 2 1 3 2 1 3 2 1
Badin 1 1 .. 1 1 .. 1 1 ..
Thatta 1 .. 1 1 .. 1 1 .. 1
Karachi 28 13 15 28 13 15 28 13 15
Total Male
2012-13
Female
* One male inter college upgraded as degree college.
INTERMEDIATE COLLEGES
Province/District
Source:- Concerned Directorate of colleges Education.
FemaleMale Total
2013-14
Male
2011-12
278
EDUCATION
13.11 NUMBER OF INTERMEDIATE COLLEGES BY SEX ANDDISTRICT IN SINDH, 2011-12 TO 2013-14
Total Female

Total Male Female Total Male Female Total Male Female
SINDH 24,476 13,435 11,041 25,201 13,840 11,361 33,688 16,949 16,739
Khairpur .. .. .. .. .. .. .. .. ..
Jacobabad .. .. .. .. .. .. .. .. ..
Kashmore@Kandhkot .. .. .. .. .. .. .. .. ..
Sukkur .. .. .. .. .. .. .. .. ..
Ghotki .. .. .. .. .. .. .. .. ..
Shikarpur .. .. .. .. .. .. .. .. ..
Kamber@Shahdadkot 811 .. 811 835 .. 835 1,172 .. 1,172
Larkana 1,103 1,103 .. 1,137 1,137 .. .. .. ..
Naushero Feroze .. .. .. .. .. .. .. .. ..
S.B.Abad 1,099 748 351 1,129 770 359 1,160 776 384
Sanghar .. .. .. .. .. .. .. .. ..
Mirpurkhas .. .. .. .. .. .. .. .. ..
Tharparkar@Mithi .. .. .. .. .. .. .. .. ..
Umerkot .. .. .. .. .. .. .. .. ..
Dadu 680 517 163 699 532 167 846 679 167
Jamshoro .. .. .. .. .. .. ..
Hyderabad 1,721 1,435 286 1,775 1,480 295 1,960 1,635 325
Tando Allah Yar .. .. .. .. .. .. .. .. ..
T.M.Khan .. .. .. .. .. .. .. .. ..
Matiari 1,149 644 505 1,180 663 517 1,408 1,199 209
Badin 25 25 .. 25 25 .. 116 116 ..
Thatta 212 .. 212 218 .. 218 216 .. 216
Karachi 17,676 8,963 8,713 18,203 9,233 8,970 26,810 12,544 14,266
2012-13 2013-14
Source:- Concerned Directorate of colleges Education.
279
EDUCATION
13.12 ENROLMENT OF INTERMEDIATE COLLEGES BY SEX ANDDISTRICT IN SINDH, 2011-12 TO 2013-14
ENROLMENT
Province/District
2011-12

.
Total Male Female Total Male Female Total Male Female
SINDH 542 329 213 553 335 218 750 410 340
Khairpur .. .. .. .. .. .. .. .. ..
Jacobabad .. .. .. .. .. .. .. .. ..
Kashmore@Kandhkot .. .. .. .. .. .. .. .. ..
Sukkur .. .. .. .. .. .. .. .. ..
Ghotki .. .. .. .. .. .. .. .. ..
Shikarpur .. .. .. .. .. .. .. .. ..
Kamber@ Shahdadkot 23 7 16 23 7 16 27 1 26
Larkana 19 19 .. 19 19 .. .. .. ..
Naushero Feroze .. .. .. .. .. .. .. .. ..
S.B.Abad 4 4 .. 4 4 . 46 35 11
Sanghar .. .. .. .. .. .. .. .. ..
Mirpurkhas .. .. .. .. .. .. .. .. ..
Tharparkar@Mithi .. .. .. .. .. .. .. .. ..
Umerkot .. .. .. .. .. .. .. .. ..
Dadu 12 12 .. 12 12 .. 13 13 ..
Jamshoro .. .. .. .. .. .. .. .. ..
Hyderabad 61 31 30 63 32 31 58 31 27
Tando Allah Yar .. .. .. .. .. .. .. .. ..
T.M. Khan .. .. .. .. .. .. .. .. ..
Matiari 59 38 21 61 40 21 58 41 17
Badin 13 13 .. 13 13 .. 37 37 ..
Thatta 9 .. 9 9 .. 9 9 .. 9
Karachi 342 205 137 349 208 141 502 252 250
2011-12
Source:- Concerened Directorate of College Education
2012-13 2013-14
TEACHING STAFF
280
EDUCATION
13.13 TEACHING STAFF OF INTERMEDIATE COLLEGES BY SEX AND
DISTRICT IN SINDH, 2011-12 TO 2013-14
Province/District
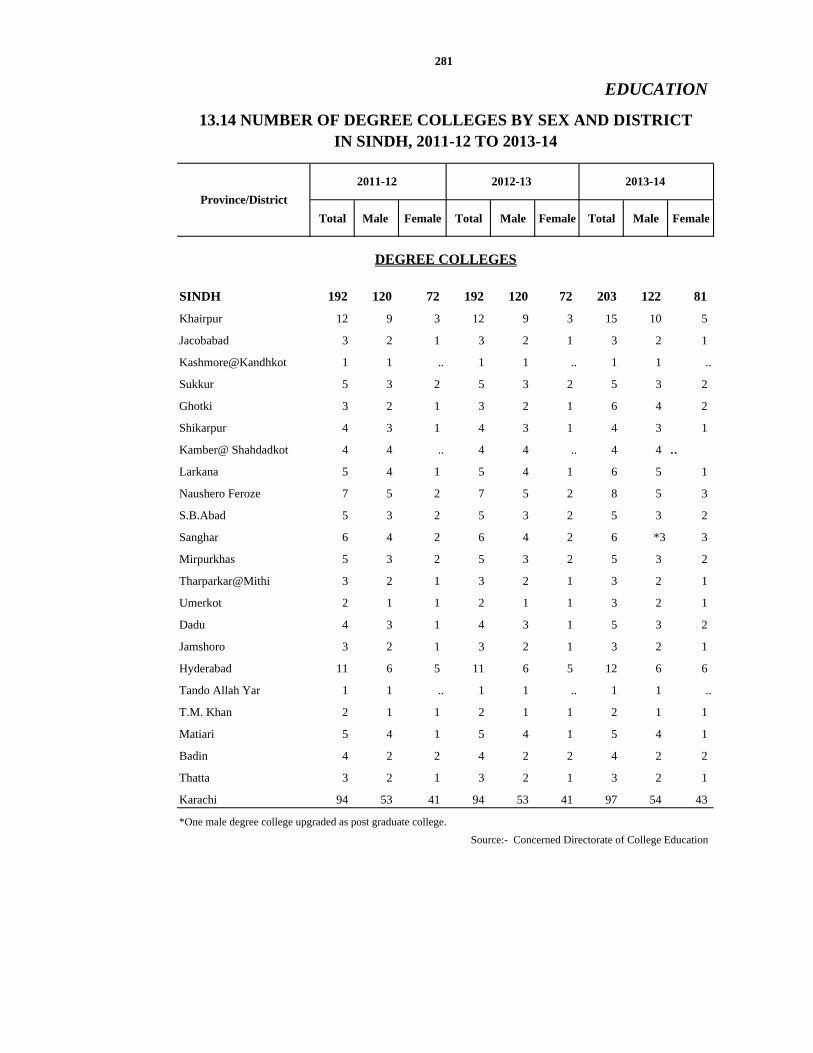
Total Male Female Total Male Female Total Male Female
SINDH 192 120 72 192 120 72 203 122 81
Khairpur 12 9 3 12 9 3 15 10 5
Jacobabad 3 2 1 3 2 1 3 2 1
Kashmore@Kandhkot 1 1 .. 1 1 .. 1 1 ..
Sukkur 5 3 2 5 3 2 5 3 2
Ghotki 3 2 1 3 2 1 6 4 2
Shikarpur 4 3 1 4 3 1 4 3 1
Kamber@ Shahdadkot 4 4 .. 4 4 .. 4 4 ..
Larkana 5 4 1 5 4 1 6 5 1
Naushero Feroze 7 5 2 7 5 2 8 5 3
S.B.Abad 5 3 2 5 3 2 5 3 2
Sanghar 6 4 2 6 4 2 6 *3 3
Mirpurkhas 5 3 2 5 3 2 5 3 2
Tharparkar@Mithi 3 2 1 3 2 1 3 2 1
Umerkot 2 1 1 2 1 1 3 2 1
Dadu 4 3 1 4 3 1 5 3 2
Jamshoro 3 2 1 3 2 1 3 2 1
Hyderabad 11 6 5 11 6 5 12 6 6
Tando Allah Yar 1 1 .. 1 1 .. 1 1 ..
T.M. Khan 2 1 1 2 1 1 2 1 1
Matiari 5 4 1 5 4 1 5 4 1
Badin 4 2 2 4 2 2 4 2 2
Thatta 3 2 1 3 2 1 3 2 1
Karachi 94 53 41 94 53 41 97 54 43
Source:- Concerned Directorate of College Education
*One male degree college upgraded as post graduate college.
281
IN SINDH, 2011-12 TO 2013-14
DEGREE COLLEGES
EDUCATION
13.14 NUMBER OF DEGREE COLLEGES BY SEX AND DISTRICT
Province/District
2011-12 2012-13 2013-14

Total Male Female Total Male Female Total Male Female
SINDH 271,436 156,843 114,593 279,516 161,514 118,002 311,816 184,318 127,498
Khairpur 11,895 8,741 3,154 12,240 8,998 3,242 14,651 10,175 4,476
Jacobabad 2,334 1,534 800 2,403 1,579 824 2,997 2,032 965
Kashmore@Kandhkot 772 614 158 795 632 163 795 632 163
Sukkur 8,140 4,748 3,392 8,382 4,891 3,491 10,905 7,011 3,894
Ghotki 3,887 3,042 845 4,003 3,135 868 9,585 8,198 1,387
Shikarpur 2,882 1,002 1,880 2,968 1,032 1,936 4,884 3,070 1,814
Kamber@ Shahdadkot 5,112 4,769 343 5,262 4,909 353 5,049 4,571 478
Larkana 13,097 8,671 4,426 13,490 8,931 4,559 15,307 10,343 4,964
Naushero Feroze 8,084 6,528 1,556 8,323 6,723 1,600 10,777 8,272 2,505
S.B.Abad 6,029 4,223 1,806 6,208 4,349 1,859 9,012 4,948 4,064
Sanghar 9,937 6,514 3,423 10,236 6,708 3,528 10,725 6,055 4,670
Mirpurkhas 8,935 5,606 3,329 9,201 5,773 3,428 11,219 7,206 4,013
Tharparkar@Mithi 2,151 1,620 531 2,214 1,668 546 2,665 2,154 511
Umerkot 3,047 2,423 624 3,139 2,495 644 3,832 2,707 1,125
Dadu 7,042 5,496 1,546 7,255 5,662 1,593 7,785 5,961 1,824
Jamshoro 3,770 2,255 1,515 3,880 2,321 1,559 3,852 2,474 1,378
Hyderabad 19,702 7,532 12,170 20,290 7,757 12,533 20,989 6,287 14,702
Tando Allah Yar 1,563 1,481 82 1,609 1,525 84 2,548 2,464 84
T.M. Khan 2,532 1,608 924 2,605 1,655 950 2,701 1,688 1,013
Matiari 4,390 3,269 1,121 4,518 3,365 1,153 5,911 4,847 1,064
Badin 3,146 2,051 1,095 3,240 2,113 1,127 3,411 2,480 931
Thatta 3,673 2,655 1,018 3,782 2,735 1,047 2,545 1,591 954
Karachi 139,316 70,461 68,855 143,473 72,558 70,915 149,671 79,152 70,519
Source:- Concerned Directorate of College Education
2011-12 2012-13 2013-14
282
EDUCATION
ENROLMENT
13.15 ENROLMENT OF DEGREE COLLEGES BY SEX AND DISTRICTIN SINDH, 2011-12 TO 2013-14
Province/District

Total Male Female Total Male Female Total Male Female
SINDH 23698 13743 9955 5,435 3,342 2,093 6,332 3,789 2,543
Khairpur 406 313 93 422 326 96 391 248 143
Jacobabad 83 69 14 86 72 14 94 83 11
Kashmore@Kandhkot 25 21 4 26 22 4 26 22 4
Sukkur 209 121 88 218 126 92 259 166 93
Ghotki 11 106 11 121 110 11 128 107 21
Shikarpur 133 91 42 139 95 44 140 102 38
Kamber@ Shahdadkot 105 105 .. 109 109 .. 103 103 ..
Larkana 298 233 65 310 243 67 314 220 94
Naushero Feroze 0 122 24 151 127 24 186 153 33
S.B.Abad 49 54 49 105 55 50 116 67 49
Sanghar 146 94 52 150 96 54 135 82 53
Mirpurkhas 193 113 80 201 117 84 178 111 67
Tharparkar@Mithi 34 31 3 35 32 3 33 30 3
Umerkot 43 34 9 44 35 9 47 38 9
Dadu 127 102 25 133 107 26 145 83 62
Jamshoro 103 69 34 107 72 35 98 67 31
Hyderabad 474 172 302 496 179 317 516 198 318
Tando Allah Yar 33 29 4 34 30 4 40 40 ..
T.M. Khan 22 1 21 23 1 22 48 21 27
Matiari 93 73 20 96 75 21 105 82 23
Badin 89 54 35 93 56 37 93 51 42
Thatta 85 70 15 88 73 15 67 39 28
Karachi 2,168 1,143 1,025 2,248 1,184 1,064 3,070 1,676 1,394
Source:- Concerned Directorate of College Education
283
13.16 TEACHING STAFF IN DEGREE COLLEGES BY SEX AND DISTRICT IN SINDH, 2011-12 TO 2013-14
EDUCATION
TEACHING STAFF
Province/District
2011-12 2012-13 2013-14

Total Male Female Total Male Female Total Male Female
SINDH 13 8 5 13 8 5 16 11 5
Khairpur .. .. .. .. .. .. .. .. ..
Jacobabad .. .. .. .. .. .. .. .. ..
Kashmore@Kandhkot .. .. .. .. .. .. .. .. ..
Sukkur 2 2 .. 2 2 .. 2 2 ..
Ghotki .. .. .. .. .. .. .. .. ..
Shikarpur .. .. .. .. .. .. .. .. ..
Kamber@ Shahdadkot .. .. .. .. .. .. .. .. ..
Larkana .. .. .. .. .. .. .. .. ..
Naushero Feroze .. .. .. .. .. .. .. .. ..
S.B.Abad 1 1 .. 1 1 .. 1 1 ..
Sanghar .. .. .. .. .. .. 1 1 ..
Mirpurkhas .. .. .. .. .. .. .. .. ..
Tharparkar@Mithi .. .. .. .. .. .. .. .. ..
Umerkot .. .. .. .. .. .. .. .. ..
Dadu .. .. .. .. .. .. .. .. ..
Jamshoro .. .. .. .. .. .. .. .. ..
Hyderabad 6 5 1 6 5 1 8 7 1
Tando Allah Yar .. .. .. .. .. .. .. .. ..
T.M. Khan .. .. .. .. .. .. .. .. ..
Matiari .. .. .. .. .. .. .. .. ..
Badin .. .. .. .. .. .. .. .. ..
Thatta .. .. .. .. .. .. .. .. ..
Karachi * 4 .. 4 4 .. 4 4 .. 4
* Note:One Post Graduate College/ functioning and other three Post Graduate Colleges approved but in their colleges classes of Post Graduate are not started.
2012-13 2013-14
284
EDUCATION
13.17 NUMBER OF POST GRADUATE COLLEGES BY SEX ANDDISTRICT IN SINDH, 2011-12 TO 2013-14
Source:- Concerned Directorate of Colleges Education.
POST GRADUATE COLLEGES
Province/District
2011-12

Total Male Female Total Male Female Total Male Female
SINDH 27,278 15,833 11,445 28,094 16,304 11,790 36,248 20,849 15,399
Khairpur .. .. .. .. .. .. .. .. ..
Jacobabad .. .. .. .. .. .. .. .. ..
Kashmore@Kandhkot .. .. .. .. .. .. .. .. ..
Sukkur 3,670 3,488 182 3,780 3,592 188 3,103 2,974 129
Ghotki .. .. .. .. .. .. .. .. ..
Shikarpur .. .. .. .. .. .. .. .. ..
Kamber@ Shahdadkot .. .. .. .. .. .. .. .. ..
Larkana .. .. .. .. .. .. .. .. ..
Naushero Feroze .. .. .. .. .. .. .. .. ..
S.B.Abad 1,569 1,569 .. 1,615 1,615 .. 1,615 1,615 ..
Sanghar .. .. .. .. .. .. 2,714 2,714 ..
Mirpurkhas .. .. .. .. .. .. .. .. ..
Tharparkar@Mithi .. .. .. .. .. .. .. .. ..
Umerkot .. .. .. .. .. .. .. .. ..
Dadu .. .. .. .. .. .. .. .. ..
Jamshoro .. .. .. .. .. .. .. .. ..
Hyderabad 13,817 10,776 3,041 14,229 11,097 3,132 17,158 13,546 3,612
Tando Allah Yar .. .. .. .. .. .. .. .. ..
T. M. Khan .. .. .. .. .. .. .. .. ..
Matiari .. .. .. .. .. .. .. .. ..
Badin .. .. .. .. .. .. .. .. ..
Thatta .. .. .. .. .. .. .. .. ..
Karachi 8,222 .. 8,222 8,470 .. 8,470 11,658 .. 11,658
285
DISTRICT IN SINDH, 2011-12 TO 2013-14
Province/District
2011-12 2012-13 2013-14
13.18 ENROLMENT OF POST GRADUATE COLLEGES BY SEX AND
Source:- Concerned Directorate of Colleges Education.
EDUCATION
ENROLMENT

Total Male Female Total Male Female Total Male Female
SINDH 775 497 278 815 524 291 967 644 323
Khairpur .. .. .. .. .. .. .. .. ..
Jacobabad .. .. .. .. .. .. .. .. ..
Kashmore@Kandhkot .. .. .. .. .. .. .. .. ..
Sukkur 706 103 3 112 109 3 107 105 2
Ghotki .. .. .. .. .. .. .. .. ..
Shikarpur .. .. .. .. .. .. .. .. ..
Kamber@ Shahdadkot .. .. .. .. .. .. .. .. ..
Larkana .. .. .. .. .. .. .. .. ..
Naushero Feroze .. .. .. .. .. .. 26 26 ..
S.B.Abad 25 25 .. 26 26 .. .. .. ..
Sanghar .. .. .. .. .. .. 39 39 ..
Mirpurkhas .. .. .. .. .. .. .. .. ..
Tharparkar@Mithi .. .. .. .. .. .. .. .. ..
Umerkot .. .. .. .. .. .. .. .. ..
Dadu .. .. .. .. .. .. .. .. ..
Jamshoro .. .. .. .. .. .. .. .. ..
Hyderabad 525 361 164 553 381 172 656 474 182
Tando Allha Yar .. .. .. .. .. .. .. .. ..
T.M. Khan .. .. .. .. .. .. .. .. ..
Matiari .. .. .. .. .. .. .. .. ..
Badin .. .. .. .. .. .. .. .. ..
Thatta .. .. .. .. .. .. .. .. ..
Karachi 119 8 111 124 8 116 139 .. 139
Source:-Concerned Directorate of Colleges Education.
2011-12 2012-13 2013-14
286
EDUCATION
13.19 TEACHING STAFF IN POST GRADUATE COLLEGES BY SEX
AND DISTRICT IN SINDH, 2011-12 TO 2013-14
Province/District
TEACHING STAFF

Total Male Female Total Male Female Total Male Female
SINDH 74 65 9 73 65 8 73 65 8
Khairpur 4 4 .. 4 4 .. 4 4 ..
Jacobabad 1 1 .. 1 1 .. 1 1 ..
Kashmore@Kandhkot 1 1 .. 1 1 .. 1 1 ..
Sukkur 3 2 1 3 2 1 3 2 1
Ghotki 2 2 .. 2 2 .. 2 2 ..
Shikarpur 2 2 .. 2 2 .. 2 2 ..
Kamber@ Shahdadkot 2 2 .. 3 3 .. 3 3 ..
Larkana 2 2 .. 2 2 .. 2 2 ..
Naushero Feroze 4 4 .. 3 3 .. 3 3 ..
S.B.Abad 3 2 1 3 2 1 3 2 1
Sanghar 4 4 .. 5 5 .. 5 5 ..
Mirpurkhas 1 1 .. 1 1 .. 1 1 ..
Tharparkar@Mithi 1 1 .. 1 1 .. 1 1 ..
Umerkot 1 1 .. 1 1 .. 1 1 ..
Dadu 3 3 .. 2 2 .. 2 2 ..
Jamshoro 1 1 .. 1 1 .. 1 1 ..
Hyderabad 5 4 1 5 4 1 5 4 1
Tando Allay Yar 1 1 .. 1 1 .. 1 1 ..
T. M. Khan 1 1 .. 1 1 .. 1 1 ..
Matiari 2 2 .. 2 2 .. 2 2 ..
Badin 4 4 .. 4 4 .. 4 4 ..
Thatta 2 2 .. 2 2 .. 2 2 ..
Karachi 24 18 6 23 18 5 23 18 5
Province/District
2011-12 2012-13 2013-14
Source:- Sindh Technical and Education Vocational Training Authority (HTEVTA)
287
EDUCATION
13.20 NUMBER OF TECHINICAL COLLEGES AND POLYTECHNIC /
MONOTECHNIC INSTITUTIONS BY SEX AND DISTRICT
IN SINDH, 2011-12 TO 2013-14
INSTITUTIONS

Total Male Female Total Male Female Total Male Female
SINDH 20,429 19,686 743 25,345 24,429 916 30,633 29,765 868
Khairpur 1,658 1,658 .. 2,093 2,093 .. 1,841 1,841 ..
Jacobabad 216 216 .. 417 417 .. 417 417 ..
Kashmore@Kandhkot 31 31 .. 114 114 .. 114 114 ..
Sukkur 690 649 41 1,185 1,123 62 1,320 1,274 46
Ghotki 336 336 .. 821 821 .. 724 724 ..
Shikarpur 95 95 .. 163 163 .. 163 163 ..
Kamber@ Shahdadkot 150 150 .. 182 182 .. 182 182 ..
Larkana 289 289 .. 481 481 .. 1,086 1,086 ..
Naushero Feroze 329 329 .. 764 764 .. 421 421 ..
S.B.Abad 253 228 25 775 747 28 701 701 ..
Sanghar 595 595 .. 489 489 .. 635 635 ..
Mirpurkhas 200 200 .. 88 88 .. 561 561 ..
Tharparkar@Mithi 114 114 .. 328 328 .. 392 392 ..
Umerkot 60 60 .. 161 161 .. 275 275 ..
Dadu 560 560 .. 789 789 .. 1,155 1,155 ..
Jamshoro 60 60 .. 75 75 .. 188 188 ..
Hyderabad 1,637 1,512 125 2,600 2,441 159 4,713 4,530 183
Tand Allah Yar 52 52 .. 139 139 .. 214 214 ..
T.M. Khan .. .. .. 98 98 .. 182 182 ..
Matiari 296 296 .. 373 373 .. 606 606 ..
Badin 128 128 .. 553 553 .. 789 789 ..
Thatta 299 299 .. 324 324 .. 591 591 ..
Karachi 12,381 11,829 552 12,333 11,666 667 13,363 12,724 639
'Source:- Sindh Technical Education Voacational Training Authority (STEVTA)
Province/District
EDUCATION
288
2011-12 2012-13 2013-14
ENROLMENT
13.21 ENROLMENT OF TECHNICAL COLLEGES AND POLYTECHNIC/
MONOTECHNIC INSTITUTIONS BY SEX AND DISTRICT
IN SINDH, 2011-12 TO 2013-14

Total Male Female Total Male Female Total Male Female
SINDH 1,125 960 165 1,309 1,129 180 1,318 1,143 175
Khairpur 78 78 - 78 78 - 87 87 -
Jacobabad 22 22 - 22 22 - 22 22 -
Kashmore@Kandhkot 4 4 - 4 4 - 4 4 -
Sukkur 39 31 8 38 30 8 36 31 5
Ghotki 10 10 - 7 7 - 14 14 -
Shikarpur 8 8 - 8 8 - 8 8 -
Kambar shahdadkot 6 6 - 6 6 - 6 6 -
Larkana 22 22 - 24 24 - 24 24 -
Naushero Feroze 15 15 - 15 15 - 10 10 -
S.B.Abad 16 14 2 20 18 2 26 25 1
Sanghar 16 16 - 22 22 - 13 13 -
Mirpurkhas 11 11 - 5 4 1 8 8 -
Tharparkar@Mithi 6 6 - 9 9 - 8 8 -
Umerkot 2 2 - 3 3 - 4 4 -
Dadu 16 16 - 51 51 - 51 51 -
Jamshoro 4 4 - 8 8 - 8 8 -
Hyderabad 117 111 6 168 148 20 168 148 20
Tando Allah Yar 1 1 - 8 8 - 8 8 -
T. M. Khan 2 2 - 8 8 - 8 8 -
Matiari 8 8 - 28 28 - 28 28 -
Badin 10 10 - 42 42 - 42 42 -
Thatta 5 5 - 28 28 - 28 28 -
Karachi 707 558 149 707 558 149 707 558 149
289
13.22 TEACHING STAFF IN TECHNICAL COLLEGES AND POLY-
TECHNIC/MONOTECHNIC INSTITUTIONS BY SEX AND
DISTRICT IN SINDH, 2011-12 TO 2013-14
Province/District
2011-12 2012-13 2013-14
Source:- Sindh Technical Education and Vocational Training Authority (STEVTA)
EDUCATION
TEACHING STAFF

Total Male Female Total Male Female Total Male Female
SINDH 39 39 .. 39 39 .. 39 39 ..
Khairpur 2 2 .. 2 2 .. 2 2 ..
Jacobabad 1 1 .. 1 1 .. 1 1 ..
Kashmore@Kandhkot 1 1 .. 1 1 .. 1 1 ..
Sukkur 2 2 .. 2 2 .. 2 2 ..
Ghotki 1 1 .. 1 1 .. 1 1 ..
Shikarpur 2 2 .. 2 2 .. 2 2 ..
Kamber@ Shahdadkot 2 2 .. 2 2 .. 2 2 ..
Larkana 1 1 .. 1 1 .. 1 1 ..
Naushero Feroze 2 2 .. 2 2 .. 2 2 ..
S.B.Abad 2 2 .. 2 2 .. 2 2 ..
Sanghar 3 3 .. 3 3 .. 3 3 ..
Mirpurkhas 2 2 .. 2 2 .. 2 2 ..
Tharparkar@Mithi 1 1 .. 1 1 .. 1 1 ..
Umerkot 1 1 .. 1 1 .. 1 1 ..
Dadu 2 2 .. 2 2 .. 2 2 ..
Jamshoro 1 1 .. 1 1 .. 1 1 ..
Hyderabad 2 2 .. 2 2 .. 2 2 ..
Tando Allah Yar 1 1 .. 1 1 .. 1 1 ..
T.M.Khan .. .. .. .. .. .. .. .. ..
Matiari 1 1 .. 1 1 .. 1 1 ..
Badin 1 1 .. 1 1 .. 1 1 ..
Thatta 3 3 .. 3 3 .. 3 3 ..
Karachi 5 5 .. 5 5 .. 5 5 ..
2011-12
Source:- Sindh Technical Education Vocational Training Authority (STEVTA)
2012-13 2013-14
COMMERCIAL INSTITUTIONS
290
EDUCATION
13.23 NUMBER OF COMMERCIAL TRAINING INSTITUTIONS BY
SEX AND DISTRICT IN SINDH, 2011-12 TO 2013-14
Province/District

EDUCATION
291
Total Male Female Total Male Female Total Male Female
2012-13 2013-14
13.24 ENROLMENT OF COMMERCIAL TRAINING INSTITUTIONS BY
SEX AND DISTRICT IN SINDH, 2011-12 TO 2013-14
Province/District
2011-12
Total Male Female Total Male Female Total Male Female
SINDH 2,511 2,495 16 2,194 2,194 .. 1,909 1,909 ..
Khairpur 127 111 16 109 109 .. 112 112 ..
ENROLMENT
p
Jacobabad 45 45 .. 46 46 .. 46 46 ..
Kashmore@Kandhkot 35 35 .. 19 19 .. 19 19 ..
Sukkur 515 515 .. 41 41 .. 74 74 ..
Ghotki 131 131 .. 25 25 .. 36 36 ..
Shikarpur 26 26 .. 38 38 .. 38 38 ..
Kamber@ Shahdadkot 60 60 66 66 66 66Kamber@ Shahdadkot 60 60 .. 66 66 .. 66 66 ..
Larkana 93 93 .. 107 107 .. 107 107 ..
Naushero Feroze 100 100 .. 76 76 .. 79 79 ..
S.B.Abad 61 61 .. 23 23 .. 68 68 ..
Sanghar 117 117 .. 161 161 .. 109 109 ..
Mirpurkhas 114 114 .. 120 120 .. 71 71 ..
Tharparkar@Mithi 181 181 .. 29 29 .. 21 21 ..
Umerkot 20 20 .. 21 21 .. 19 19 ..
Dadu 94 94 .. 127 127 .. 126 126 ..
Jamshoro 17 17 .. 26 26 .. 43 43 ..
Hyderabad 46 46 .. 115 115 .. 21 21 ..
Tando Allah Yar 23 23 .. 10 10 .. 8 8 ..Tando Allah Yar 23 23 .. 10 10 .. 8 8 ..
T.M. Khan .. .. .. .. .. .. .. .. ..
Matiari 16 16 .. 32 32 .. 4 4 ..
Badin 50 50 .. 37 37 .. 4 4 ..
Thatta 70 70 .. 95 95 .. 101 101 ..
Karachi 570 570 .. 871 871 .. 737 737 ..
Source:- Sindh Technical Education Vocational and Training Authority (STEVTA)

Total Male Female Total Male Female Total Male Female
SINDH 185 184 1 242 241 1 252 251 1
Khairpur 6 6 .. 6 6 .. 11 11 ..
Jacobabad 4 4 .. 5 5 .. 5 5 ..
Kashmore@Kandhkot 3 3 .. 2 2 .. 2 2 ..
Sukkur 9 9 .. 9 9 .. 9 9 ..
Ghotki 7 7 .. 7 7 .. 2 2 ..
Shikarpur 12 12 .. 11 11 .. 11 11 ..
Kamber@ Shahdadkot 11 11 .. 14 14 .. 14 14 ..
Larkana 9 9 .. 8 8 .. 8 8 ..
Naushero Feroze 6 6 .. 6 6 .. 7 7 ..
S.B.Abad 4 3 1 4 3 1 10 9 1
Sanghar 8 8 .. 8 8 .. 7 7 ..
Mirpurkhas 2 2 .. 2 2 .. 4 4 ..
Tharparkar@Mithi 3 3 .. 2 2 .. 3 3 ..
Umerkot 3 3 .. 2 2 .. 3 3 ..
Dadu 10 10 .. 18 18 .. 18 18 ..
Jamshoro 1 1 .. 9 9 .. 9 9 ..
Hyderabad 13 13 … 18 18 .. 18 18 ..
Tando Allah Yar 3 3 .. 9 9 .. 9 9 ..
T.M. Khan .. .. .. .. .. .. .. .. ..
Matiari 3 3 .. 9 9 .. 9 9 ..
Badin 2 2 .. 9 9 .. 9 9 ..
Thatta 9 9 .. 27 27 .. 27 27 ..
Karachi 57 57 .. 57 57 .. 57 57 ..
2011-12 2012-13 2013-14
TEACHING STAFF
Source:- Sindh Technical Education Vocational Training Authority (STEVTA)
292
13.25 TEACHING STAFF IN COMMERCIAL TRAINING INSTITUTIONS
EDUCATION
BY SEX AND DISTRICT IN SINDH, 2011-12 TO 2013-14
Province/District

Total Male Female Total Male Female Total Male Female
SINDH 82 13 69 125 39 86 125 39 86
Khairpur 5 .. 5 6 1 5 6 1 5
Jacobabad 4 1 3 4 1 3 4 1 3
Kashmore @ Kandhkot 2 1 1 2 1 1 2 1 1
Sukkur 5 1 4 7 2 5 7 2 5
Ghotki 1 .. 1 1 .. 1 1 .. 1
Shikarpur 6 2 4 7 3 4 7 3 4
Kamber@ Shahdadkot 4 1 3 4 1 3 4 1 3
Larkana 12 4 8 12 4 8 12 4 8
Naushero Feroze 2 .. 2 4 2 2 4 2 2
S.B.Abad 3 1 2 4 1 3 4 1 3
Sanghar 3 .. 3 5 1 4 5 1 4
Mirpurkhas 2 .. 2 5 2 3 5 2 3
Tharparkar@Mithi 1 .. 1 2 1 1 2 1 1
Umerkot 1 .. 1 2 1 1 2 1 1
Dadu 7 1 6 9 2 7 9 2 7
Jamshoro 3 .. 3 4 1 3 4 1 3
Hyderabad 3 .. 3 6 2 4 6 2 4
Tando Allah Yar 1 .. 1 2 1 1 2 1 1
T.M.Khan 1 .. 1 1 .. 1 1 .. 1
Matiari 2 .. 2 3 1 2 3 1 2
Badin 3 .. 3 6 2 4 6 2 4
Thatta 2 .. 2 5 2 3 5 2 3
Karachi 9 1 8 24 7 17 24 7 17
* = Including Vocational Schools.
293
13.26 NUMBER OF VOCATIONAL INSTITUTIONS BY SEX AND DISTRICT IN SINDH, 2011-12 TO 2013-14
Province/District
2011-12 2012-13 2013-14
*VOCATIONAL INSTITUTIONS
Source:- Sindh Technical Educcation Vocational Training Authority (STEVTA)
EDUCATION

Total Male Female Total Male Female Total Male Female
SINDH 3,885 892 2,993 6,082 2,284 3,798 6,124 2,622 3,502
Khairpur 405 158 247 235 25 210 240 64 176
Jacobabad 135 53 82 177 78 99 177 78 99
Kashmore@Kandhkot 89 45 44 81 45 36 81 45 36
Sukkur 200 62 138 216 92 124 339 193 146
Ghotki 32 .. 32 25 .. 25 52 .. 52
Shikarpur 213 121 92 131 47 84 131 47 84
Kamber@ Shahdadkot 325 14 311 335 100 235 335 100 235
Larkana 481 183 298 311 30 281 311 30 281
Naushero Feroze 27 .. 27 138 39 99 170 121 49
S.B.Abad .. .. .. 88 34 54 138 106 32
Sanghar 117 .. 117 210 96 114 128 41 87
Mirpurkhas 94 .. 94 185 45 140 172 45 127
Tharparkar@Mithi 34 .. 34 49 10 39 0 .. ..
Umerkot 58 .. 58 31 16 15 35 20 15
Dadu 201 15 186 372 122 250 333 117 216
Jamshoro 142 .. 142 448 342 106 414 288 126
Hyderabad 193 .. 193 352 117 235 378 172 206
Tando Allah Yar .. .. .. 53 30 23 72 54 18
T.M. Khan 80 .. 80 9 .. 9 35 .. 35
Matiari 23 .. 23 97 50 47 105 61 44
Badin 310 .. 310 275 44 231 209 51 158
Thatta 25 .. 25 148 73 75 131 89 42
Karachi 701 241 460 2,116 849 1,267 2,138 900 1,238
ENROLMENT
Source:-Sindh Technical Education Vocational Training Authority (STEVTA)
2012-13 2013-14
294
EDUCATION
13.27 ENROLMENT OF VOCATIONAL INSTITUTIONS BY SEX
AND DISTRICT IN SINDH, 2011-12 TO 2013-14
Province/District
2011-12
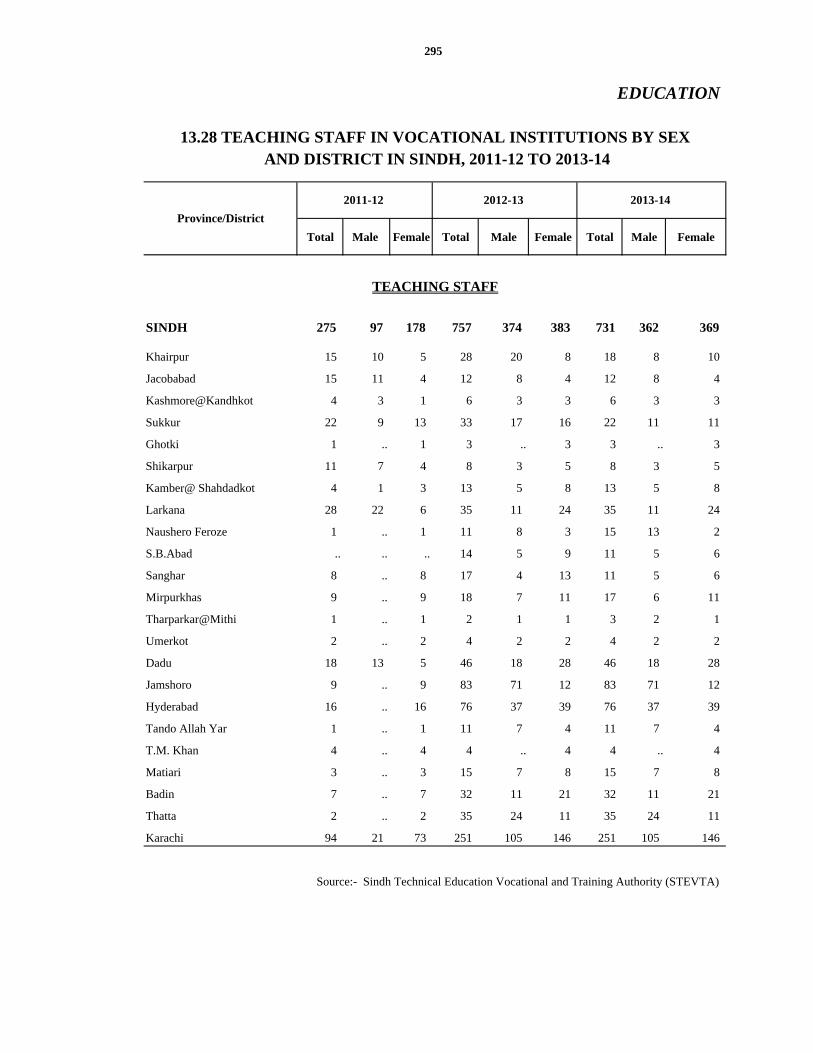
Total Male Female Total Male Female Total Male Female
SINDH 275 97 178 757 374 383 731 362 369
Khairpur 15 10 5 28 20 8 18 8 10
Jacobabad 15 11 4 12 8 4 12 8 4
Kashmore@Kandhkot 4 3 1 6 3 3 6 3 3
Sukkur 22 9 13 33 17 16 22 11 11
Ghotki 1 .. 1 3 .. 3 3 .. 3
Shikarpur 11 7 4 8 3 5 8 3 5
Kamber@ Shahdadkot 4 1 3 13 5 8 13 5 8
Larkana 28 22 6 35 11 24 35 11 24
Naushero Feroze 1 .. 1 11 8 3 15 13 2
S.B.Abad .. .. .. 14 5 9 11 5 6
Sanghar 8 .. 8 17 4 13 11 5 6
Mirpurkhas 9 .. 9 18 7 11 17 6 11
Tharparkar@Mithi 1 .. 1 2 1 1 3 2 1
Umerkot 2 .. 2 4 2 2 4 2 2
Dadu 18 13 5 46 18 28 46 18 28
Jamshoro 9 .. 9 83 71 12 83 71 12
Hyderabad 16 .. 16 76 37 39 76 37 39
Tando Allah Yar 1 .. 1 11 7 4 11 7 4
T.M. Khan 4 .. 4 4 .. 4 4 .. 4
Matiari 3 .. 3 15 7 8 15 7 8
Badin 7 .. 7 32 11 21 32 11 21
Thatta 2 .. 2 35 24 11 35 24 11
Karachi 94 21 73 251 105 146 251 105 146
2011-12 2012-13 2013-14
295
EDUCATION
13.28 TEACHING STAFF IN VOCATIONAL INSTITUTIONS BY SEX AND DISTRICT IN SINDH, 2011-12 TO 2013-14
TEACHING STAFF
Source:- Sindh Technical Education Vocational and Training Authority (STEVTA)
Province/District

60 000
80,000
100,000
120,000
ons (In Numbers)
'00' N
umbers
f (In Numbers)
No. of Institutions, Enrolment and Teaching Staff of Primary Schools in Sindh
2011‐12 to 2013‐14
43,089
42,900
42,342
29,804
29,636
28,028
99,254
96,401
92,521
‐
20,000
40,000
60,000
2011‐12 2012‐13 2013‐14
No. o
f Institutio
Enrolm
ent in
Teaching Staff
YearsNo. of Institutions
Enrolment
Teaching Staff
14.00 HEALTH

301
EXPLANATORY NOTE
HEALTH
Annual data in respect of the following items is presented in this section:
1. Number of Health institutions.
2. Number of Beds in Health institutions.
3. Medical & Para-medical Personnel.
Coverage
These statistics relate to Hospitals, Dispensaries, T.B Clinics, Rural Health Centers, Basic
Health Units and Maternity & Child Health Centers located in the Sindh and administrated by
Directorate General Health Services, Govt. of Sindh.
The Health institutions belonging to the Federal Govt., Defense Services and Private
Doctors are not being covered.
Data Collection System
The Health institutions belonging to Directorate General Health Services in the Province
maintain the record of number of beds and outdoor and indoor Patients. All type of Health
institutions supply annual statistical returns to the District Health Officers containing information
of number of Patients treated for various diseases, number and type of operations performed etc..
The District Health officers submit consolidated returns to the Directorate General of Health
Services where the information is tabulated and consolidated at the Provincial level.
Definition:
Health Institution
A health institution is defined as an institution, which provides health services i.e.
curative and preventive to all/specific class of public as out-door/in-door patients.
Hospital
Hospital is an institution having ten or more than ten beds. This definition is however not
applicable to the institutions specially named by Government e.g. Rural Health Center Adilpur
District Ghotki having twenty beds.
Dispensary
A dispensary is an institution having less than ten beds.

HOSPITALS
Teaching 6 6 6 6 6
Civil, Major Specilized and Taluka 82 82 82 86 86
HOSPITAL BEDS
Teaching 5,799 5,799 5,799 5,799 5,799
Civil, Major Specilized and Taluka 5,878 5,878 5,878 6,123 6,123
DISPENSARIES
Numbers 420 444 520 520 520
Beds 6 6 6 6 6
RURAL HEALTH CENTRES
Numbers 106 106 108 124 124
Beds 1,582 1,580 1,600 1,625 1,625
T.B CLINICS
Numbers 186 186 186 186 186
Beds .. .. .. .. 0
BASIC HEALTH UNITS
Numbers 772 773 308 789 790
Beds 1,586 1,588 1,648 1,580 1,582
MOTHER CHILD HEALTH CENTRES Numbers 40 40 40 40 40
Beds 20 20 20 20 20
Notes: (i) Some Dispensaries have been Converted into Rural Health Centres / Basic Health Units.
(ii) Data of Institutions Run by different Departments and Armed Forces not included.
(iii) Data reported as on 1st January of each year.
Source:- Directorate General of Health Services, Hyderabad.
2010ITEMS 2011 2012 2013 2014
303
HEALTH
14.01 GOVERNMENT HOSPITALS, DISPENSARIES, RURAL HEALTH CENTRES, T.B CLINICS, BASIC HEALTH UNITS AND MOTHER CHILD HEALTH CENTRES WITH BED CAPACITY IN SINDH,
2010 TO 2014

Civil, Specialized Teaching Civil, Specialized
and Taluka and Taluka
SINDH 6 86 5,799 6,123 520 6
Sukkur 1 4 305 100 17 2
Ghotki .. 5 .. 220 10 ..
Khairpur .. 3 .. 284 32 ..
S.B.Abad 1 1 875 20 40 ..
Naushero Feroze .. 3 .. 157 33 ..
Larkana 1 5 1,250 405 24 4
* Kamber Shahdadkot .. 4 .. 132 28 ..
Shikarpur .. 5 .. 262 14 ..
Jacobabad .. 3 .. 216 7 ..
* Kashmore@Kandhkot .. 2 .. 50 19 ..
Hyderabad 1 7 1,316 939 17 ..
* Matiari .. 1 .. 30 15 ..
* Tando Muhammad Khan .. 1 .. 30 2 ..
* Tando Allah Yar .. 1 .. 100 32 ..
Thatta .. 5 .. 348 20 ..
Badin .. 5 .. 190 29 ..
Dadu .. 4 .. 263 16 ..
* Jamshoro .. 6 .. 336 15 ..
Mirpurkhas .. 3 .. 346 32 ..
* Umerkot .. 1 .. 55 13 ..
Tharparkar@Mithi .. 4 .. 164 40 ..
Sanghar .. 5 .. 380 28 ..
Karachi 2 8 2,053 1,096 37 ..
* Created new districts.
Contd.
304
HEALTH
14.02 GOVERNMENT HOSPITALS, DISPENSARIES, RURAL HEALTH CENTRES,
T.B CLINICS, BASIC HEALTH UNITS & MOTHER CHILD HEALTH
2013
CENTRES WITH BED CAPACITY BY DISTRICT IN SINDH,
HOSPITALS BEDS
2013 TO 2014
Province/District
HOSPITALS DISPENSARIES
Teaching No. Beds
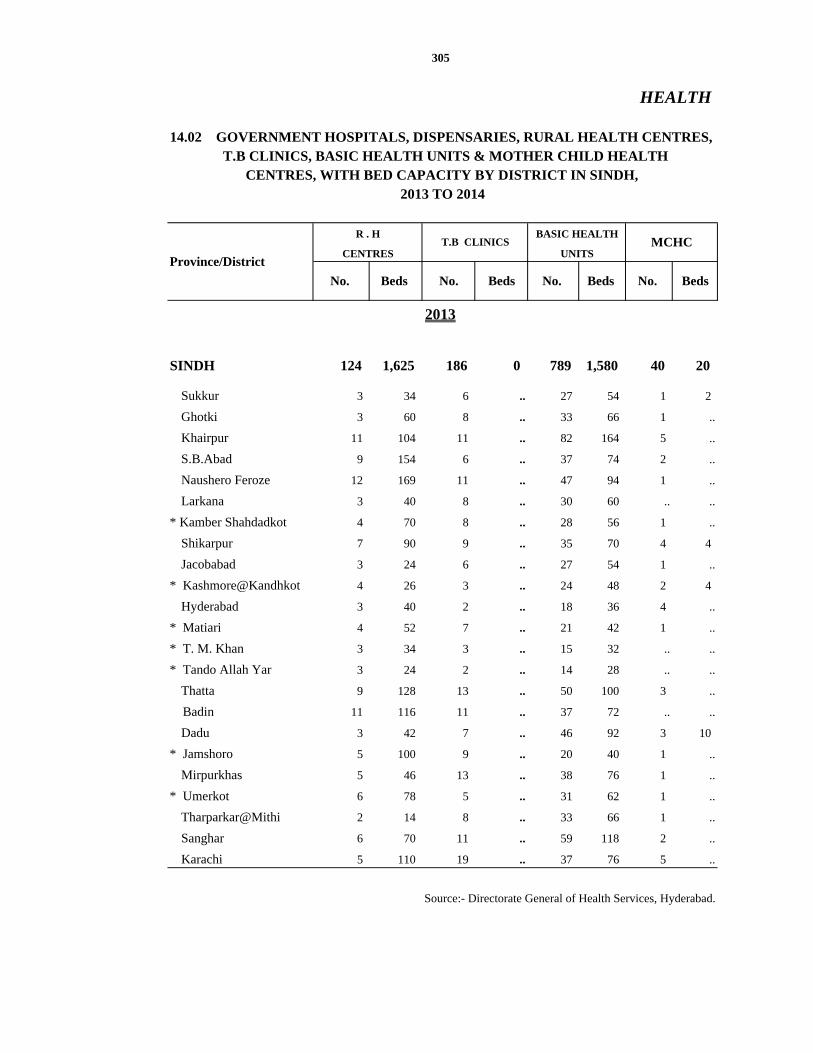
HEALTH
R . H
CENTRES
SINDH 124 1,625 186 0 789 1,580 40 20
Sukkur 3 34 6 .. 27 54 1 2
Ghotki 3 60 8 .. 33 66 1 ..
Khairpur 11 104 11 .. 82 164 5 ..
S.B.Abad 9 154 6 .. 37 74 2 ..
Naushero Feroze 12 169 11 .. 47 94 1 ..
Larkana 3 40 8 .. 30 60 .. ..
* Kamber Shahdadkot 4 70 8 .. 28 56 1 ..
Shikarpur 7 90 9 .. 35 70 4 4
Jacobabad 3 24 6 .. 27 54 1 ..
* Kashmore@Kandhkot 4 26 3 .. 24 48 2 4
Hyderabad 3 40 2 .. 18 36 4 ..
* Matiari 4 52 7 .. 21 42 1 ..
* T. M. Khan 3 34 3 .. 15 32 .. ..
* Tando Allah Yar 3 24 2 .. 14 28 .. ..
Thatta 9 128 13 .. 50 100 3 ..
Badin 11 116 11 .. 37 72 .. ..
Dadu 3 42 7 .. 46 92 3 10
* Jamshoro 5 100 9 .. 20 40 1 ..
Mirpurkhas 5 46 13 .. 38 76 1 ..
* Umerkot 6 78 5 .. 31 62 1 ..
Tharparkar@Mithi 2 14 8 .. 33 66 1 ..
Sanghar 6 70 11 .. 59 118 2 ..
Karachi 5 110 19 .. 37 76 5 ..
Beds No. Beds
305
14.02 GOVERNMENT HOSPITALS, DISPENSARIES, RURAL HEALTH CENTRES, T.B CLINICS, BASIC HEALTH UNITS & MOTHER CHILD HEALTH
CENTRES, WITH BED CAPACITY BY DISTRICT IN SINDH, 2013 TO 2014
T.B CLINICS MCHC
Beds No. Beds No.
Source:- Directorate General of Health Services, Hyderabad.
2013
Province/District
BASIC HEALTH
UNITS
No.

Civil, Specialized Civil, Specialized
and Taluka and Taluka
SINDH 6 61 5,799 4,363 520 6Sukkur 1 2 305 40 17 2
Ghotki 0 4 0 170 10 0
Khairpur 0 3 0 284 32 0
S.B.Abad 1 1 875 20 40 0
Naushero Feroze 0 3 0 157 33 0
Larkana 1 3 1,250 160 24 4
* Kamber Shahdadkot 0 4 0 132 28 0
Shikarpur 0 2 0 200 14 0
Jacobabad 0 3 0 216 7 0
* Kashmore@Kandhkot 0 2 0 50 19 0
Hyderabad 1 1 1,316 496 17 0
* Matiari 0 1 0 30 15 0
* Tando Muhammad Khan 0 1 0 30 2 0
* Tando Allah Yar 0 1 0 100 32 0
Thatta 0 4 0 308 20 0
Badin 0 4 0 170 29 0
Dadu 0 4 0 263 16 0
* Jamshoro 0 4 0 274 15 0
Mirpurkhas 0 3 0 346 32 0
* Umerkot 0 1 0 55 13 0
Tharparkar@Mithi 0 4 0 164 40 0
Sanghar 0 4 0 298 28 0
Karachi 2 2 2,053 400 37 0
* Created New Districts
Contd.
306
HEALTH
14.02 GOVERNMENT HOSPITALS, DISPENSARIES, RURAL HEALTH CENTRES, T.B CLINICS, BASIC HEALTH UNITS & MOTHER CHILD HEALTH CENTRES
2014
WITH BED CAPACITY BY DISTRICT IN SINDH, 2013 TO 2014
HOSPITALS BEDS
Teaching
HOSPITALS DISPENSARIES
Province/DistrictTeaching No. Beds
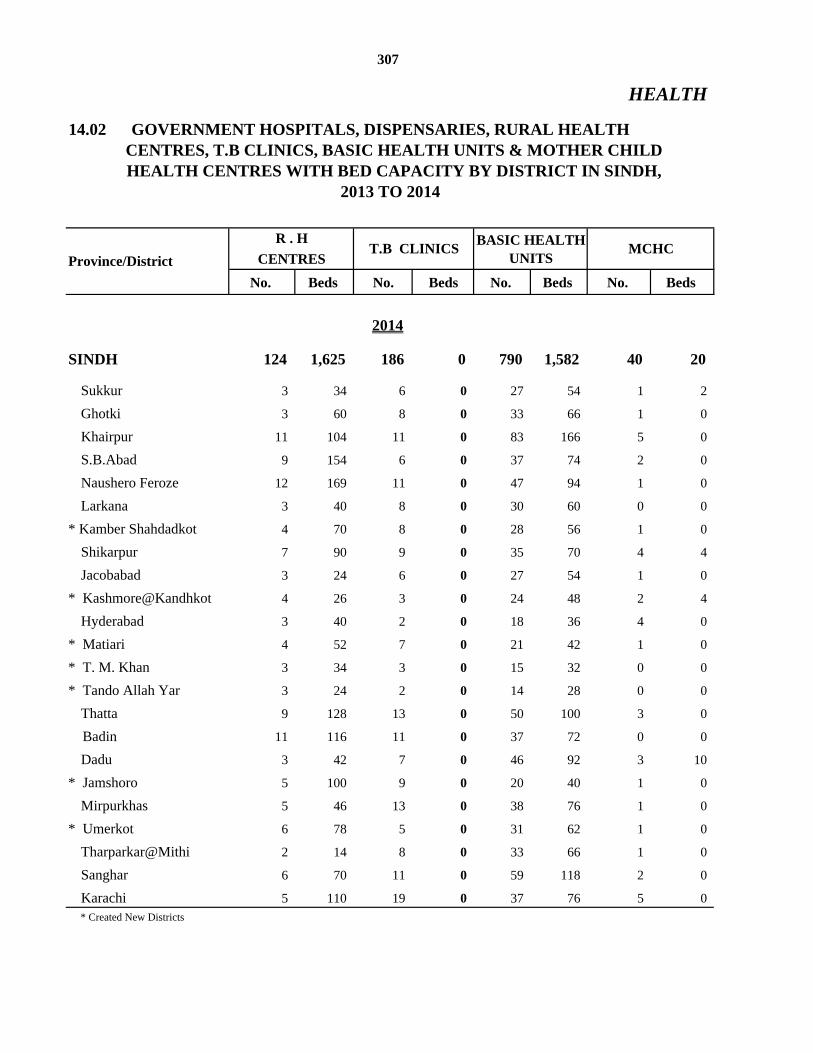
HEALTH
No. Beds No. Beds No. Beds No. Beds
SINDH 124 1,625 186 0 790 1,582 40 20
Sukkur 3 34 6 0 27 54 1 2
Ghotki 3 60 8 0 33 66 1 0
Khairpur 11 104 11 0 83 166 5 0
S.B.Abad 9 154 6 0 37 74 2 0
Naushero Feroze 12 169 11 0 47 94 1 0
Larkana 3 40 8 0 30 60 0 0
* Kamber Shahdadkot 4 70 8 0 28 56 1 0
Shikarpur 7 90 9 0 35 70 4 4
Jacobabad 3 24 6 0 27 54 1 0
* Kashmore@Kandhkot 4 26 3 0 24 48 2 4
Hyderabad 3 40 2 0 18 36 4 0
* Matiari 4 52 7 0 21 42 1 0
* T. M. Khan 3 34 3 0 15 32 0 0
* Tando Allah Yar 3 24 2 0 14 28 0 0
Thatta 9 128 13 0 50 100 3 0
Badin 11 116 11 0 37 72 0 0
Dadu 3 42 7 0 46 92 3 10
* Jamshoro 5 100 9 0 20 40 1 0
Mirpurkhas 5 46 13 0 38 76 1 0
* Umerkot 6 78 5 0 31 62 1 0
Tharparkar@Mithi 2 14 8 0 33 66 1 0
Sanghar 6 70 11 0 59 118 2 0
Karachi 5 110 19 0 37 76 5 0* Created New Districts
2014
R . HMCHC
2013 TO 2014
CENTRES
307
14.02 GOVERNMENT HOSPITALS, DISPENSARIES, RURAL HEALTH CENTRES, T.B CLINICS, BASIC HEALTH UNITS & MOTHER CHILD HEALTH CENTRES WITH BED CAPACITY BY DISTRICT IN SINDH,
BASIC HEALTH
Province/District UNITST.B CLINICS

Doctors 8,804 7,405 7,549 7,577 7,788
Nurses 2,388 1,565 1,587 1,619 1,669
L.H.V. Technicians 589 464 675 705 740
Dispenser/Dresser 3,935 1,669 1,681 1,768 1,843
X-Ray Technicians 276 238 249 265 279
Lab Technicians 342 242 243 257 266
O.T. Technicians 282 218 228 233 241
X-Ray Assistant 74 66 64 67 69
Lab. Assistant 303 254 250 261 283
O.T. Assistant 199 147 146 159 164
Mid Wives 1,241 915 1020 1097 1138
Note: (i) Data for Medical & Para Medical Personnel is as on 1st January of each year.
'(ii) Medical & Para Medical staff of private sector not included.
308
2012 2013CATEGORIES 2010 2011 2014
Source:- Directorate General of Health Services, Hyderabad.
14.03 MEDICAL & PARAMEDICAL PERSONNEL(GOVERNMENT) BY
CATEGORY IN SINDH, 2010 TO 2014
HEALTH
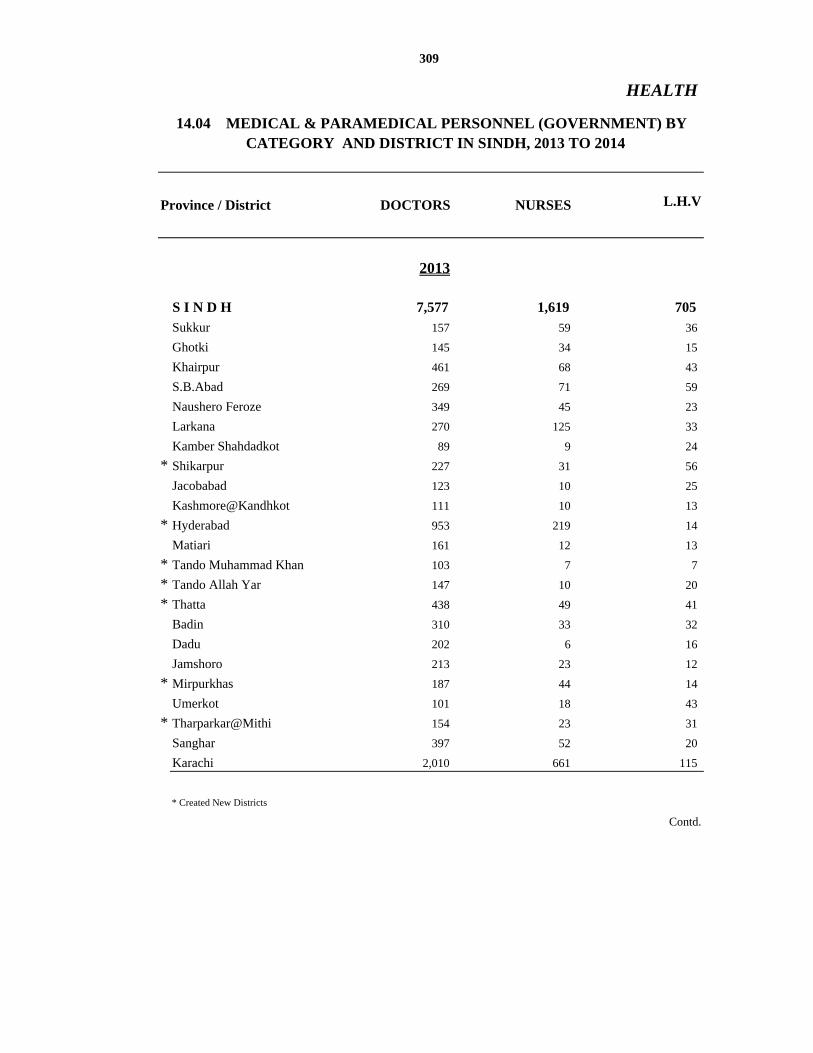
L.H.V
S I N D H 7,577 1,619 705
Sukkur 157 59 36
Ghotki 145 34 15
Khairpur 461 68 43
S.B.Abad 269 71 59
Naushero Feroze 349 45 23
Larkana 270 125 33
Kamber Shahdadkot 89 9 24
* Shikarpur 227 31 56
Jacobabad 123 10 25
Kashmore@Kandhkot 111 10 13
* Hyderabad 953 219 14
Matiari 161 12 13
* Tando Muhammad Khan 103 7 7
* Tando Allah Yar 147 10 20
* Thatta 438 49 41
Badin 310 33 32
Dadu 202 6 16
Jamshoro 213 23 12
* Mirpurkhas 187 44 14
Umerkot 101 18 43
* Tharparkar@Mithi 154 23 31
Sanghar 397 52 20
Karachi 2,010 661 115
* Created New Districts
Contd.
2013
Province / District DOCTORS NURSES
309
HEALTH
14.04 MEDICAL & PARAMEDICAL PERSONNEL (GOVERNMENT) BY CATEGORY AND DISTRICT IN SINDH, 2013 TO 2014

DISPENSER X-RAY LAB O.T.
DRESSERS TECHNICIANS TECHNICIANS TECHNICIANS
S I N D H 1,768 265 257 233Sukkur 73 6 10 8
Ghotki 64 12 12 8
Khairpur 52 18 13 7
S.B.Abad 70 13 8 10
Naushero Feroze 89 13 5 3
Larkana 64 16 7 18
Kamber Shahdadkot 42 8 6 7
* Shikarpur 71 6 6 5
Jacobabad 44 6 3 2
Kashmore@Kandhkot 37 5 5 3
* Hyderabad 57 16 28 15
Matiari 49 6 7 1
* Tando Muhammad Khan 18 5 4 1
* Tando Allah Yar 25 4 4 3
* Thatta 107 14 8 10
Badin 84 17 13 4
Dadu 72 7 7 7
Jamshoro 60 11 6 6
* Mirpurkhas 70 10 9 6
Umerkot 52 8 6 6
* Tharparkar@Mithi 69 9 8 4
Sanghar 102 9 7 9
Karachi 397 46 75 90
* Created New Districts
Contd.
2013
Province / District
310
HEALTH
14.04 MEDICAL & PARAMEDICAL PERSONNEL (GOVERNMENT) BY
CATEGORY AND DISTRICT IN SINDH, 2013 TO 2014
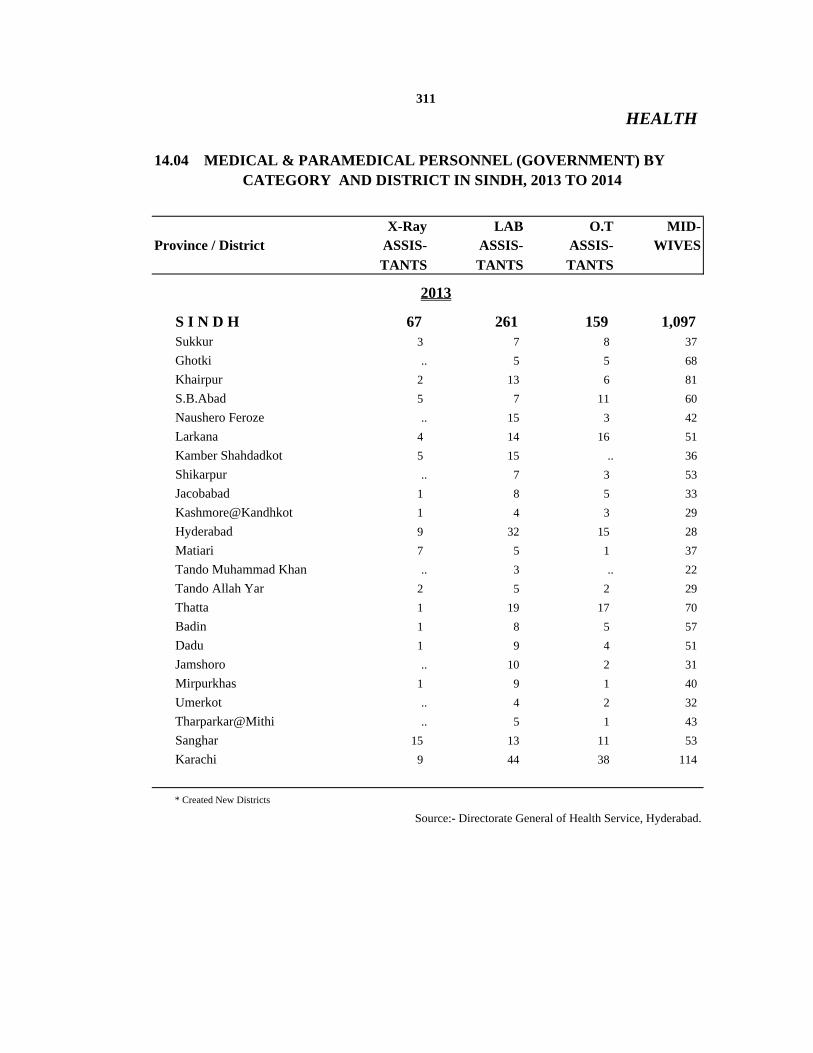
X-Ray LAB O.T MID-ASSIS- ASSIS- ASSIS- WIVES
TANTS TANTS TANTS
S I N D H 67 261 159 1,097Sukkur 3 7 8 37
Ghotki .. 5 5 68
Khairpur 2 13 6 81
S.B.Abad 5 7 11 60
Naushero Feroze .. 15 3 42
Larkana 4 14 16 51
Kamber Shahdadkot 5 15 .. 36
Shikarpur .. 7 3 53
Jacobabad 1 8 5 33
Kashmore@Kandhkot 1 4 3 29
Hyderabad 9 32 15 28
Matiari 7 5 1 37
Tando Muhammad Khan .. 3 .. 22
Tando Allah Yar 2 5 2 29
Thatta 1 19 17 70
Badin 1 8 5 57
Dadu 1 9 4 51
Jamshoro .. 10 2 31
Mirpurkhas 1 9 1 40
Umerkot .. 4 2 32
Tharparkar@Mithi .. 5 1 43
Sanghar 15 13 11 53
Karachi 9 44 38 114
* Created New Districts
Source:- Directorate General of Health Service, Hyderabad.
Province / District
311
HEALTH
14.04 MEDICAL & PARAMEDICAL PERSONNEL (GOVERNMENT) BY CATEGORY AND DISTRICT IN SINDH, 2013 TO 2014
2013

L.H.V
S I N D H 7,788 1,669 740
Sukkur 183 83 38
Ghotki 153 34 17
Khairpur 473 70 42
S.B.Abad 274 73 59
Naushero Feroze 354 43 23
Larkana 277 125 32
* Kamber Shahdadkot 96 9 27
Shikarpur 239 34 58
Jacobabad 129 10 23
* Kashmore@Kandhkot 119 10 15
Hyderabad 962 227 17
* Matiari 172 13 13
* Tando Muhammad Khan 109 7 8
* Tando Allah Yar 154 12 22
Thatta 448 50 43
Badin 321 35 34
Dadu 213 8 17
* Jamshoro 210 23 14
Mirpurkhas 195 47 13
* Umerkot 109 18 45
Tharparkar@Mithi 172 25 38
Sanghar 401 52 23
Karachi 2,025 661 119
* Created New Districts
Contd.
Province / District DOCTORS NURSES
2014
312
HEALTH
14.04 MEDICAL & PARAMEDICAL PERSONNEL (GOVERNMENT) BY
CATEGORY AND DISTRICT IN SINDH, 2013 TO 2014

DISPEN- X-RAY LAB. O.TSERS/ TECHNI- TECHNI- TECHNI-
DRESSERS CIANS CIANS CIANS
S I N D H 1,843 279 266 241
Sukkur 73 9 10 8
Ghotki 68 13 11 9
Khairpur 57 18 13 9
S.B.Abad 67 14 8 10
Naushero Feroze 89 13 5 4
Larkana 64 17 7 18
* Kamber Shahdadkot 45 8 6 7
Shikarpur 74 7 6 5
Jacobabad 50 7 4 2
* Kashmore@Kandhkot 38 5 5 4
Hyderabad 67 16 31 15
* Matiari 53 6 7 2
* Tando Muhammad Khan 21 5 4 1
* Tando Allah Yar 29 4 4 3
Thatta 110 16 8 12
Badin 89 16 15 5
Dadu 77 8 6 7
* Jamshoro 65 11 6 6
Mirpurkhas 66 12 11 6
* Umerkot 57 8 6 6
Tharparkar@Mithi 77 9 8 5
Sanghar 106 11 8 9
Karachi 401 46 77 88
* Created New Districts
Contd.
2014
Province / District
313
HEALTH
14.04 MEDICAL & PARAMEDICAL PERSONNEL (GOVERNMENT) BY CATEGORY AND DISTRICT IN SINDH, 2013 TO 2014

X-RAY LAB. O.T.ASSIS- ASSIS- ASSIS- MIDWIVESTANTS TANTS TANTS
S I N D H 69 283 164 1,138
Sukkur 4 8 10 39
Ghotki 0 5 6 68
Khairpur 2 14 6 84
S.B.Abad 5 9 10 62
Naushero Feroze 0 17 3 45
Larkana 4 14 17 54
* Kamber Shahdadkot 5 17 0 36
Shikarpur 0 8 3 53
Jacobabad 1 8 5 33
* Kashmore@Kandhkot 0 4 3 32
Hyderabad 9 33 16 28
* Matiari 7 6 1 40
* Tando Muhammad Khan 0 3 0 25
* Tando Allah Yar 2 5 2 33
Thatta 1 21 17 70
Badin 1 10 5 57
Dadu 1 9 5 55
* Jamshoro 0 12 2 33
Mirpurkhas 1 9 1 40
* Umerkot 0 5 2 34
Tharparkar@Mithi 0 7 1 48
Sanghar 15 13 11 55
Karachi 11 46 38 114
* Created New Districts
Contd.
2014
Province / District
314
HEALTH
14.04 MEDICAL & PARAMEDICAL PERSONNEL (GOVERNMENT) BY CATEGORY AND DISTRICT IN SINDH, 2013 TO 2014

15.00 CRIMES

ALL REPORTED CRIMES 96,599 80,790 75,805 69,880 70,177
Murder 3,289 3,548 3,594 3,859 3,290
Attempted Murder 4,125 3,890 3,596 3,530 3,108
Highway Dacoity 59 39 59 61 66
Other Dacoity * 1,750 1,478 1,282 1,289 1,281
Highway Robery 64 63 67 76 78
Other Robery * 4,591 4,535 4,253 3,976 3,379
Burglary 2,336 2,033 1,680 1,640 1,413
Cattle Theft 719 720 630 480 512
Vehicle Theft ** 10,939 11,432 12,269 9,752 5,824
Other Theft 3,612 3,008 2,291 1,986 1,938
Recovery of Stolen Property 302 269 179 156 139
Kidnapping / Abduction 2,926 2,955 3,093 2,922 2,781
Child Lifting 169 190 147 140 116
Rape/Zina Ordinance 239 219 194 221 194
Rioting 4,093 3,600 3,527 3,142 2,933
Simple Hurt Cases 1,945 1,735 1,523 1,462 1,591
Attempt to Suicide 48 48 54 48 62
Assault on Public Servant 2,715 3,537 3,466 3,519 4,470
Fatal Accident 787 717 650 616 555
Non-Fatal Accident 605 415 350 365 297
Arms Ordinance 12,022 14,030 11,975 9,854 12,241
Excise & Opium Act - - - - -
Gambling Ordinance 1,022 802 784 650 819
Prohibition Ordinance 6,538 6,818 5,925 4,723 7,040
Other Local and Special Law 513 407 373 700 930
Miscellaneous Cases 31,191 14,302 13,844 14,713 15,120
Note: Larkana and Mirpurkhas Regions abolished and merged in Hyderabad and Sukkur Region from the year, 2001.
2010 to 2014
2010HEADS
317
CRIMES
15.01 CRIMES UNDER DIFFERENT HEADS IN SINDH
Source: Police Department Sindh.
2014
* = Included bank, petrol pump and other Dacoity / Robery
** = Included Snatch / Theft of Motor Cycle and other Vehicles.
2011 2012 2013

ALL REPORTED CRIMES 57,684 41,793 41,506 40,391 36,172
Murder 1,482 1,789 2,137 2,265 1,640
Attempted Murder 1,250 1,229 1,274 1,207 892
Highway Dacoity 5 7 18 17 9
Other Dacoity * 379 335 372 321 300
Highway Robery 40 41 40 41 42
Other Robery * 3,105 3,268 3,149 2,762 2,229
Burglary 1,154 1,002 864 819 609
Cattle Theft 26 17 41 12 11
Vehicle Theft ** 8,998 9,586 10,570 8,078 4,965
Other Theft 1,863 1,507 1,214 1,001 1,058
Recovery of Stolen Property 107 127 77 59 55
Kidnapping / Abduction 1,346 1,431 1,599 1,656 1,468
Child Lifting 87 128 96 97 73
Rape/Zina Ordinance 51 70 64 65 47
Rioting 1,231 920 968 719 617
Simple Hurt Cases 477 452 294 265 287
Attempt to Suicide 28 30 41 28 46
Assault on Public Servant 931 1,017 1,203 1,465 1,748
Fatal Accident 508 512 472 437 368
Non-Fatal Accident 402 304 249 256 203
Arms Ordinance 5,950 7,321 7,030 7,292 7,750
Excise & Opium Act .. .. .. .. 0
Gambling Ordinance 530 291 186 244 298
Prohibition Ordinance 3,979 3,385 2,888 3,400 4,082
Other Local and Special Law 395 265 245 608 675
Miscellaneous Cases 23,360 6,759 6,415 7,277 6,700
* = Included bank, petrol pump and other Dacoity / Robery.
Source:- Police Department Sindh.
** = Included Snatch / Theft of Motor Cycle and other Vehicles.
2010 TO 2014
318
HEADS 2012 20132010 2011 2014
CRIMES
15.02 CRIMES UNDER DIFFERENT HEADS IN KARACHI REGION,

15.03 CRIMES UNDER DIFFERENT HEADS IN HYDERABAD REGION,
ALL REPORTED CRIMES 19,720 16,389 14,021 12,056 11,280
Murder 538 724 474 504 443
Attempted Murder 1,513 1,701 1,135 1,058 761
Highway Dacoity 24 32 27 30 38
Other Dacoity * 432 548 335 365 255
Highway Robery 21 9 18 29 26
Other Robery * 772 906 552 627 466
Burglary 588 621 354 268 216
Cattle Theft 339 370 176 97 121
Vehicle Theft ** 904 1,088 804 847 413
Other Theft 699 755 420 368 242
Recovery of Stolen Property 114 130 68 58 53
Kidnapping / Abduction 641 581 504 496 426
Child Lifting 41 35 33 19 20
Rape/Zina Ordinance 87 99 57 67 51
Rioting 1,925 1,223 1,223 1,128 1,099
Simple Hurt Cases 443 217 114 276 194
Attempt to Suicide 12 3 7 9 4
Assault on Public Servant 587 586 1,306 457 675
Fatal Accident 162 97 67 83 52
Non-Fatal Accident 138 40 49 51 39
Arms Ordinance 2,941 2,250 1,927 1,482 1,553
Excise & Opium Act 9 .. .. .. 0
Gambling Ordinance 210 142 139 212 160
Prohibition Ordinance 1,946 1,455 1,213 1,036 1,432
Other Local and Special Law 40 30 24 35 93
Miscellaneous Cases 4,594 2,747 2,995 2,454 2,448* = Included bank, petrol pump and other Dacoity / Robery.
*** = Figures of defunct Mirpurkhas division from the year 2001 and onward included in Hyderabad Region.
CRIMES
319
** = Included Snatch / Theft of Motor Cycle and other Vehicles.
HEADS 2014
Source:- Police Department Sindh.
2010 2011 2012 2013
2010 TO 2014

ALL REPORTED CRIMES 17,966 11,613 9,456 8,360 7,416
Murder 1,083 557 483 382 316
Attempted Murder 1,174 655 601 480 346
Highway Dacoity 22 11 0 3 2
Other Dacoity * 823 337 160 138 217
Highway Robery 5 10 1 0 1
Other Robery * 580 314 221 230 203
Burglary 561 311 237 226 209
Cattle Theft 323 176 143 124 82
Vehicle Theft ** 853 547 333 347 139
Other Theft 994 542 329 280 232
Recovery of Stolen Property 65 41 39 17 13
Kidnapping / Abduction 656 469 383 281 319
Child Lifting 30 7 6 4 9
Rape/Zina Ordinance 89 38 42 32 36
Rioting 937 431 338 358 409
Simple Hurt Cases 1,043 630 592 568 469
Attempt to Suicide 8 4 2 1 2
Assault on Public Servant 1,197 1,003 888 720 702
Fatal Accident 117 49 37 30 37
Non-Fatal Accident 65 31 25 14 14
Arms Ordinance 3,131 2,174 1,291 996 855
Excise & Opium Act .. .. .. .. 0
Gambling Ordinance 282 171 222 166 144
Prohibition Ordinance 613 839 661 443 512
Other Local and Special Law 78 31 40 23 53
Miscellaneous Cases 3,237 2,235 2,382 2,497 2,095
* = Included bank, petrol pump and other Dacoity / Robery.
*** = Figures of defunct Larkana Division from the year 2001 and onward included in Sukkur Region.
320
2012 2013HEADS 2010 2011
Source:- Police Department Sindh.
CRIMES
2014
** = Included Snatch / Theft of Motor Cycle and other Vehicles.
2010 TO 201415.04 CRIMES UNDER DIFFERENT HEADS IN SUKKUR REGION,

Province/District MurderAttempt to
MurderKidnapping Cases
SINDH 3,859 3,530 228
KARACHI REGION 2,265 1,207 109
HYDERABAD REGION 437 877 19
Hyderabad 124 167 8
Matiari 29 59 4
Tando Mohammad Khan 18 23 0
Tando Allah Yar 30 30 0
Thatta 58 116 1
Badin 34 118 1
Dadu 85 225 1
Jamshoro 59 139 4
MIRPURKHAS REGION 186 276 2
Mirpurkhas 49 108 1
Umerkot 38 34 0
Tharparkar@Mithi 16 51 0
Sanghar 83 83 1
SUKKUR REGION 449 661 39
Sukkur 63 136 1
Ghotki 83 108 4
Khairpur 130 131 13
Naushero Feroze 106 105 17
S.B.Abad 67 181 4
LARKANA REGION 522 509 59
Larkana 117 136 13
Kamber Shahdadkot 114 94 13
Shikarpur 142 109 19
Jacobabad 70 77 7
Kashmore@Kandhkot 79 93 7
Cont..
2013
321
15. 05 DISTRICT WISE BREAKUP OF CRIMES IN SINDH 2013 TO 2014
CRIMES
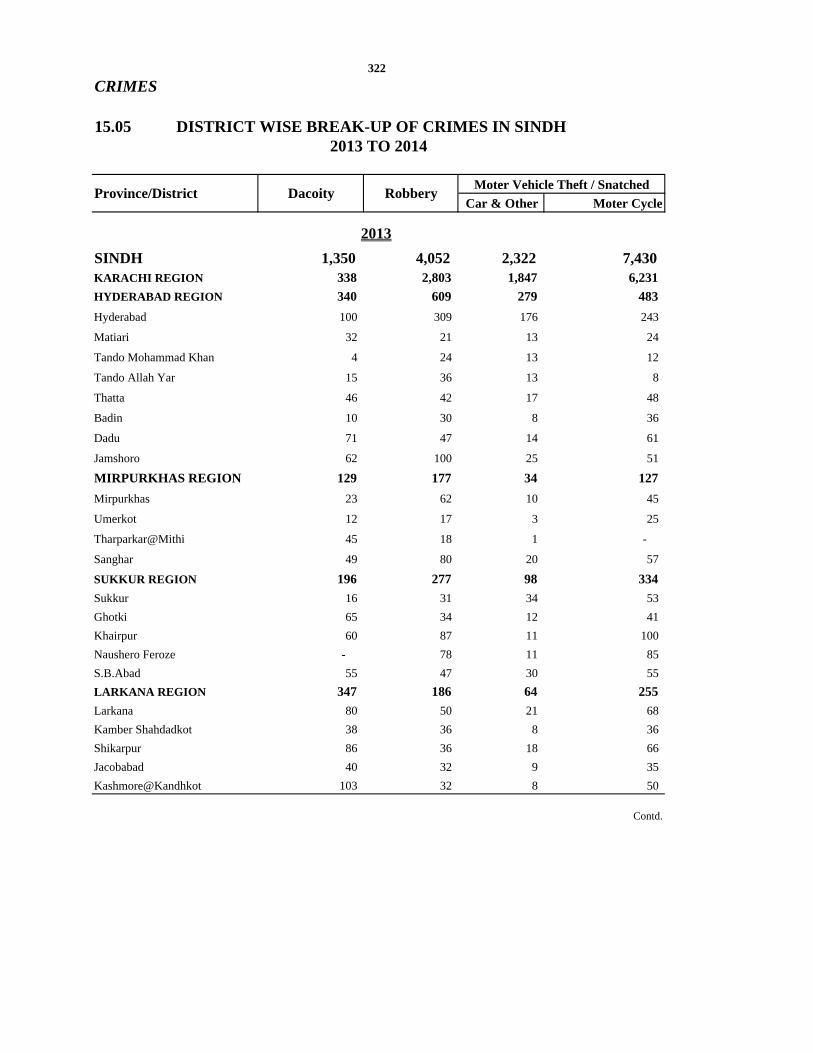
Car & Other Moter Cycle
SINDH 1,350 4,052 2,322 7,430 KARACHI REGION 338 2,803 1,847 6,231
HYDERABAD REGION 340 609 279 483
Hyderabad 100 309 176 243
Matiari 32 21 13 24
Tando Mohammad Khan 4 24 13 12
Tando Allah Yar 15 36 13 8
Thatta 46 42 17 48
Badin 10 30 8 36
Dadu 71 47 14 61
Jamshoro 62 100 25 51
MIRPURKHAS REGION 129 177 34 127
Mirpurkhas 23 62 10 45
Umerkot 12 17 3 25
Tharparkar@Mithi 45 18 1 -
Sanghar 49 80 20 57
SUKKUR REGION 196 277 98 334
Sukkur 16 31 34 53
Ghotki 65 34 12 41
Khairpur 60 87 11 100
Naushero Feroze - 78 11 85
S.B.Abad 55 47 30 55
LARKANA REGION 347 186 64 255
Larkana 80 50 21 68
Kamber Shahdadkot 38 36 8 36
Shikarpur 86 36 18 66
Jacobabad 40 32 9 35
Kashmore@Kandhkot 103 32 8 50
Contd.
2013
322
CRIMES
15.05 DISTRICT WISE BREAK-UP OF CRIMES IN SINDH2013 TO 2014
Province/District Dacoity RobberyMoter Vehicle Theft / Snatched
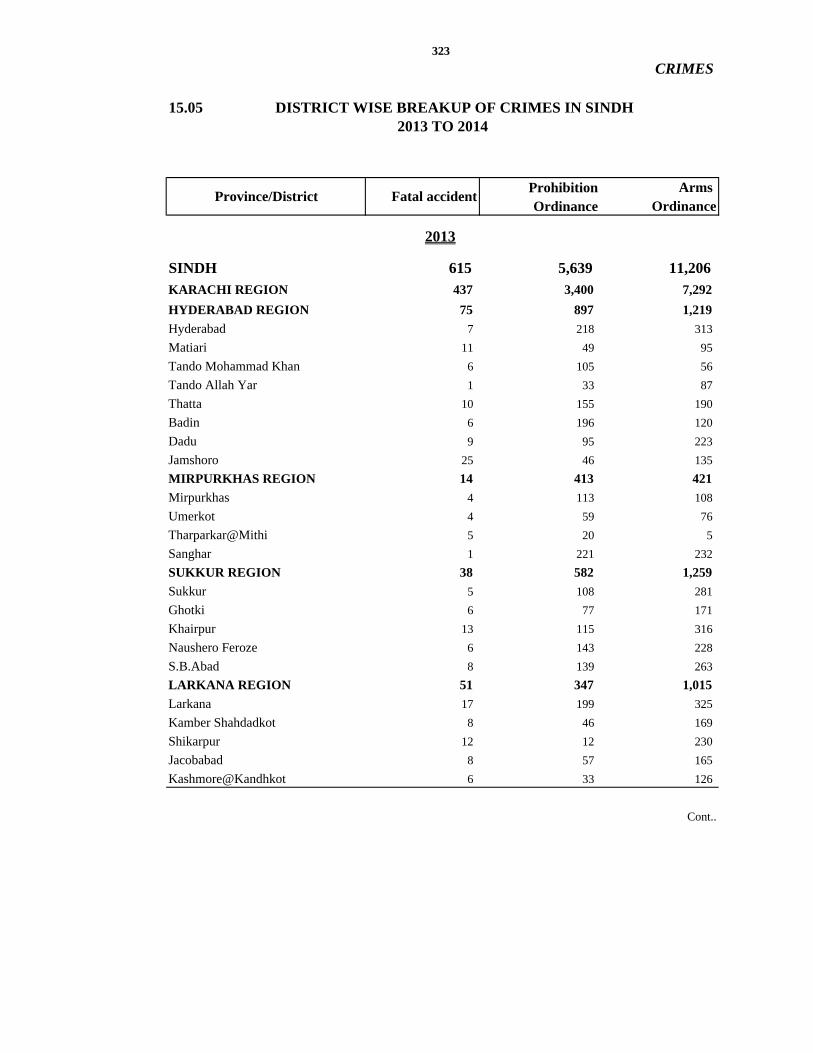
15.05 DISTRICT WISE BREAKUP OF CRIMES IN SINDH
Prohibition Arms Ordinance Ordinance
SINDH 615 5,639 11,206KARACHI REGION 437 3,400 7,292
HYDERABAD REGION 75 897 1,219
Hyderabad 7 218 313
Matiari 11 49 95
Tando Mohammad Khan 6 105 56
Tando Allah Yar 1 33 87
Thatta 10 155 190
Badin 6 196 120
Dadu 9 95 223
Jamshoro 25 46 135
MIRPURKHAS REGION 14 413 421
Mirpurkhas 4 113 108
Umerkot 4 59 76
Tharparkar@Mithi 5 20 5
Sanghar 1 221 232
SUKKUR REGION 38 582 1,259
Sukkur 5 108 281
Ghotki 6 77 171
Khairpur 13 115 316
Naushero Feroze 6 143 228
S.B.Abad 8 139 263
LARKANA REGION 51 347 1,015
Larkana 17 199 325
Kamber Shahdadkot 8 46 169
Shikarpur 12 12 230
Jacobabad 8 57 165
Kashmore@Kandhkot 6 33 126
Cont..
2013
323
Fatal accident
2013 TO 2014
CRIMES
Province/District

SINDH 851 734KARACHI REGION 244 608
HYDERABAD REGION 176 21
Hyderabad 55 8
Matiari 22 4
Tando Mohammad Khan 13 1
Tando Allah Yar 9 0
Thatta 18 1
Badin 13 7
Dadu 33 0
Jamshoro 13 0
MIRPURKHAS REGION 86 4
Mirpurkhas 16 1
Umerkot 1 2
Tharparkar@Mithi 2 0
Sanghar 67 1
SUKKUR REGION 202 37
Sukkur 72 9
Ghotki 42 3
Khairpur 26 10
Naushero Feroze 26 1
S.B.Abad 36 14
LARKANA REGION 143 64
Larkana 29 0
Kamber Shahdadkot 23 1
Shikarpur 54 63
Jacobabad 11 0
Kashmore@Kandhkot 26 0
Cont.
2013
324
15.06 DISTRICT WISE BREAK-UP OF CRIMES IN SINDH,2013 TO 2014
Province/District Gambling OrdinanceOther Local & Special Laws
CRIMES

Attempt to Kidnapping Murder for Ransom
SINDH 3,267 3,078 192
KARACHI REGION 1,640 892 97
HYDERABAD REGION 420 731 16
Hyderabad 129 142 7
Matiari 22 36 2
Tando Mohammad Khan 16 15 0
Tando Allah Yar 19 25 1
Thatta 33 52 0
Badin 27 114 0
Dadu 118 220 3
Jamshoro 56 127 3
MIRPURKHAS REGION 177 262 2
Mirpurkhas 57 130 1
Umerkot 25 53 1
Tharparkar@Mithi 16 36 0
Sanghar 79 43 0
SUKKUR REGION 498 657 28
Sukkur 75 96 5
Ghotki 66 93 3
Khairpur 175 157 18
Naushero Feroze 83 139 0
S.B.Abad 99 172 2
LARKANA REGION 532 536 49
Larkana 142 157 8
Kamber Shahdadkot 102 93 9
Shikarpur 143 103 19
Jacobabad 59 79 3
Kashmore@Kandhkot 86 104 10
2014
CRIMES325
15.05 DISTRICT WISE BREAK-UP OF CRIMES IN SINDH,2013 TO 2014
Province/District Murder

Car & Other Moter Cycle
SINDH 1,333 3,432 1,924 6,427
KARACHI REGION 309 2,271 1,508 5,080
HYDERABAD REGION 279 467 204 434
Hyderabad 79 253 127 259
Matiari 15 10 11 8
Tando Mohammad Khan 3 11 5 18
Tando Allah Yar 8 13 5 15
Thatta 13 23 12 17
Badin 4 22 12 26
Dadu 66 62 6 63
Jamshoro 91 73 26 28
MIRPURKHAS REGION 84 148 42 120
Mirpurkhas 30 73 18 44
Umerkot 4 16 6 14
Tharparkar@Mithi 7 11 - 4
Sanghar 43 48 18 58
SUKKUR REGION 309 327 104 473
Sukkur 63 46 22 57
Ghotki 80 39 7 114
Khairpur 76 119 29 131
Naushero Feroze 25 63 12 110
S.B.Abad 65 60 34 61
LARKANA REGION 352 219 66 320
Larkana 61 68 25 124
Kamber Shahdadkot 40 25 4 36
Shikarpur 155 66 21 69
Jacobabad 35 27 2 52
Kashmore@Kandhkot 61 33 14 39
Contd.
2014
326
CRIMES
15.05 DISTRICT WISE BREAK-UP OF CRIMES IN SINDH2013 TO 2014
Province/District Dacoity RobberyMoter Vehicle Theft / Snatched
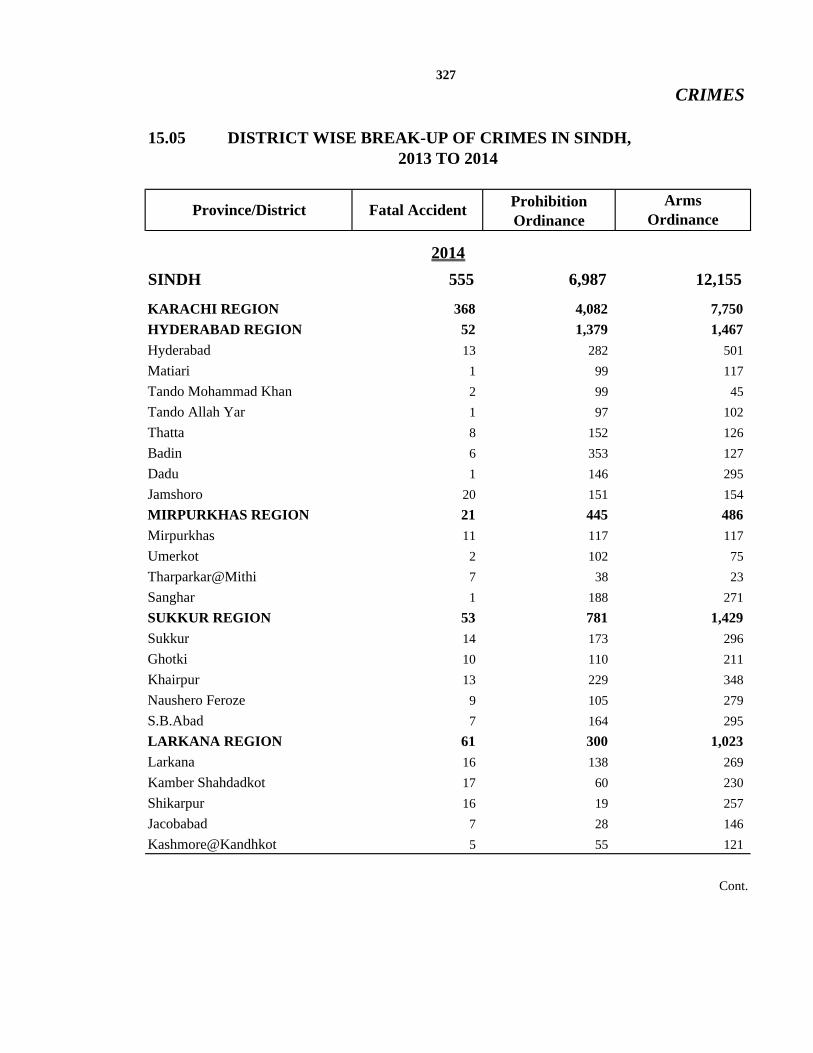
15.05 DISTRICT WISE BREAK-UP OF CRIMES IN SINDH,
SINDH 555 6,987 12,155
KARACHI REGION 368 4,082 7,750
HYDERABAD REGION 52 1,379 1,467
Hyderabad 13 282 501
Matiari 1 99 117
Tando Mohammad Khan 2 99 45
Tando Allah Yar 1 97 102
Thatta 8 152 126
Badin 6 353 127
Dadu 1 146 295
Jamshoro 20 151 154
MIRPURKHAS REGION 21 445 486
Mirpurkhas 11 117 117
Umerkot 2 102 75
Tharparkar@Mithi 7 38 23
Sanghar 1 188 271
SUKKUR REGION 53 781 1,429
Sukkur 14 173 296
Ghotki 10 110 211
Khairpur 13 229 348
Naushero Feroze 9 105 279
S.B.Abad 7 164 295
LARKANA REGION 61 300 1,023
Larkana 16 138 269
Kamber Shahdadkot 17 60 230
Shikarpur 16 19 257
Jacobabad 7 28 146
Kashmore@Kandhkot 5 55 121
Cont.
2014
327
2013 TO 2014
Province/District Fatal AccidentProhibition Ordinance
Arms Ordinance
CRIMES

15.05 DISTRICT WISE BREAK-UP OF CRIMES IN SINDH,
SINDH 812 929
KARACHI REGION 298 675
HYDERABAD REGION 153 92
Hyderabad 69 41
Matiari 2 8
Tando Mohammad Khan 0 0
Tando Allah Yar 0 0
Thatta 7 11
Badin 24 32
Dadu 33 0
Jamshoro 18 0
MIRPURKHAS REGION 55 11
Mirpurkhas 3 7
Umerkot 2 1
Tharparkar@Mithi 0 0
Sanghar 50 3
SUKKUR REGION 168 65
Sukkur 45 29
Ghotki 72 23
Khairpur 27 1
Naushero Feroze 16 0
S.B.Abad 8 12
LARKANA REGION 138 86
Larkana 28 0
Kamber Shahdadkot 27 0
Shikarpur 44 86
Jacobabad 11 0
Kashmore@Kandhkot 28 0
2014
328
2013 TO 2014
Province/District Gambling OrdinanceOther Local & Special Laws
CRIMES

16.00 MISCELLANEOUS
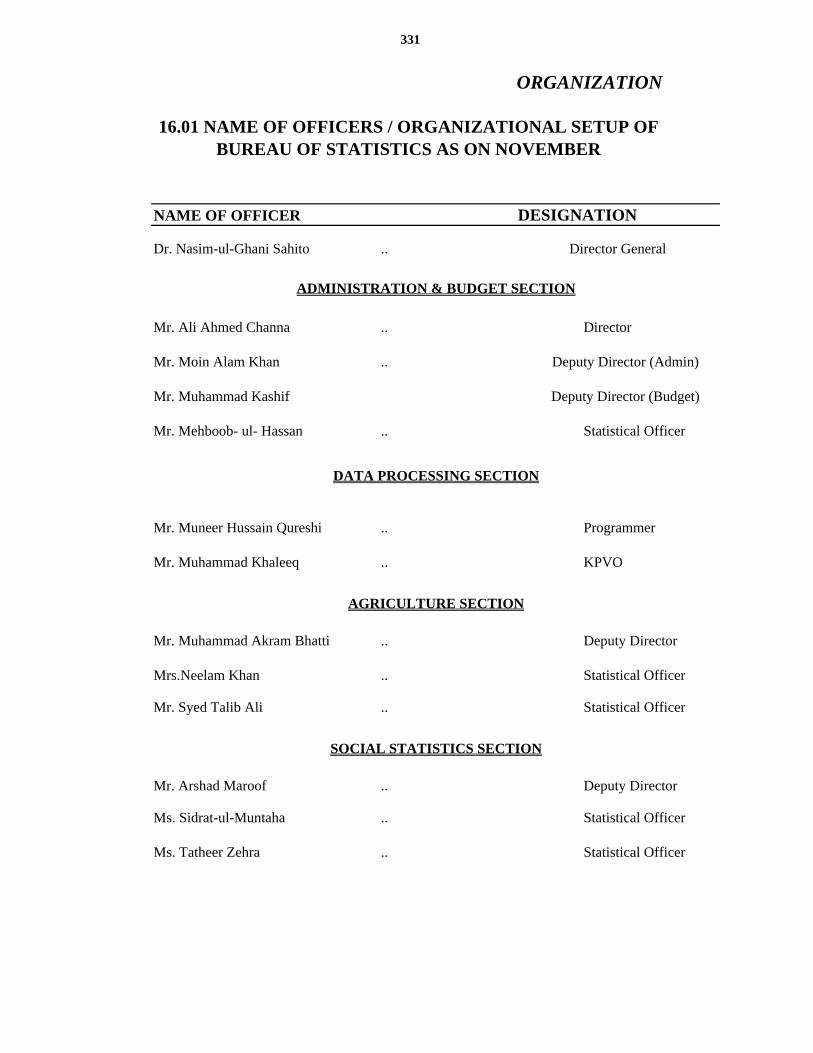
NAME OF OFFICER DESIGNATION
Dr. Nasim-ul-Ghani Sahito ..
Mr. Ali Ahmed Channa .. Director
Mr. Moin Alam Khan .. Deputy Director (Admin)
Mr. Muhammad Kashif Deputy Director (Budget)
Mr. Mehboob- ul- Hassan .. Statistical Officer
Mr. Muneer Hussain Qureshi .. Programmer
Mr. Muhammad Khaleeq .. KPVO
Mr. Muhammad Akram Bhatti .. Deputy Director
Mrs.Neelam Khan .. Statistical Officer
Mr. Syed Talib Ali .. Statistical Officer
Mr. Arshad Maroof .. Deputy Director
Ms. Sidrat-ul-Muntaha .. Statistical Officer
Ms. Tatheer Zehra .. Statistical Officer
AGRICULTURE SECTION
DATA PROCESSING SECTION
ADMINISTRATION & BUDGET SECTION
SOCIAL STATISTICS SECTION
331
ORGANIZATION
16.01 NAME OF OFFICERS / ORGANIZATIONAL SETUP OF BUREAU OF STATISTICS AS ON NOVEMBER
Director General

Mr. Muhammad Kazim Jafri .. Deputy Director
Mr. Mazhar Hussain Shaikh Statistical Officer
Ms. Rukhsana Aziz .. Statistical Officer
Mr. Mumtaz Ahmed Hingorjo .. Caretaker
Mr. Muhammad Nasir Khan .. Statistical Officer
Mr. Muhammad Kazim Jafri Deputy Director
Mr. Izat Ali Chachar .. Statistical Officer
Ms. Rukhsana Aziz Statistical Officer
Mr. Abdul Rab Gopang .. Statistical Officer
Mr. Moeen Alam Khan Deputy Director
Mr. Izat Ali Chachar .. Statistical Officer
Miss. Beenish .. Librarian
Mr. Mumtaz Ali Lashari .. Technical Assistant
16.01 NAME OF OFFICERS / ORGANIZATIONAL SETUP OF
INDUSTRIES SECTION
332
ORGANIZATION
NAME OF OFFICER DESIGNATION
PUBLICATION SECTION
FIELD OPERTION SECTION
REGIONAL ACCOUNTS / GDP
MULTIPLE INDICATOR CLUSTER SURVEY (M I C S)
BUREAU OF STATISTICS AS ON NOVEMBER
GENERAL SECTION
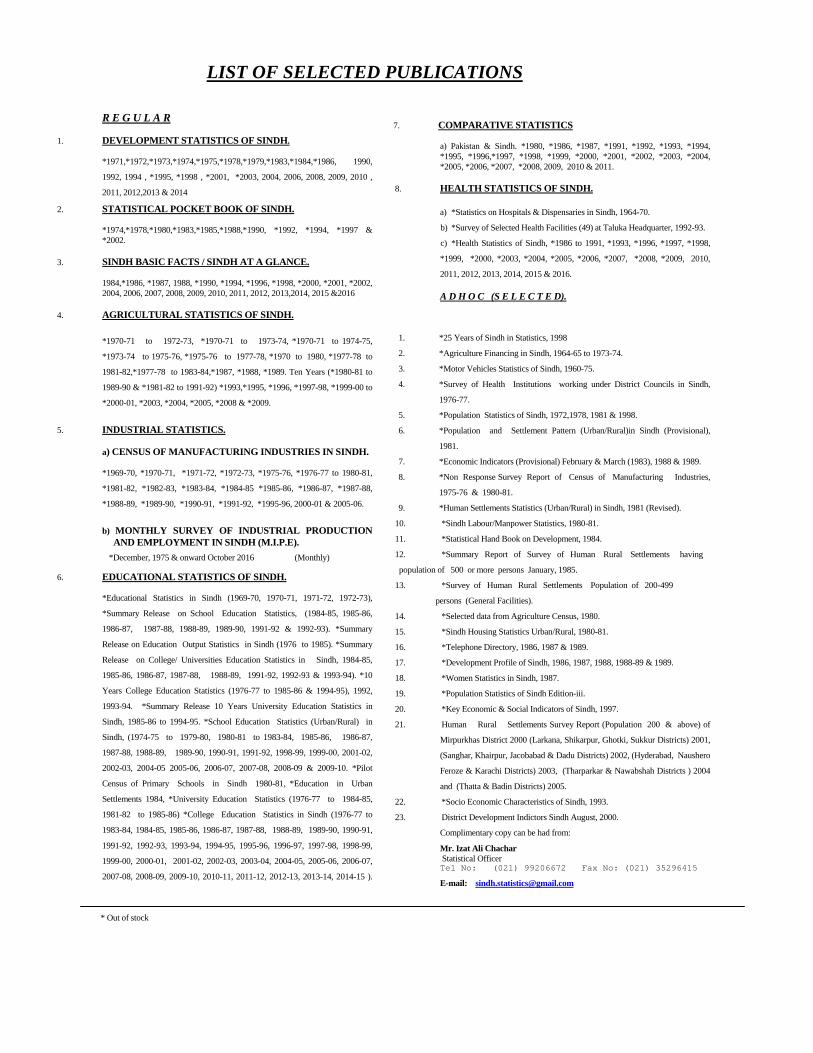
R E G U L A R 1. DEVELOPMENT STATISTICS OF SINDH.
*1971,*1972,*1973,*1974,*1975,*1978,*1979,*1983,*1984,*1986, 1990,
1992, 1994 , *1995, *1998 , *2001, *2003, 2004, 2006, 2008, 2009, 2010 ,
2011, 2012,2013 & 2014
2. STATISTICAL POCKET BOOK OF SINDH.
*1974,*1978,*1980,*1983,*1985,*1988,*1990, *1992, *1994, *1997 & *2002.
3. SINDH BASIC FACTS / SINDH AT A GLANCE.
1984,*1986, *1987, 1988, *1990, *1994, *1996, *1998, *2000, *2001, *2002, 2004, 2006, 2007, 2008, 2009, 2010, 2011, 2012, 2013,2014, 2015 &2016
4. AGRICULTURAL STATISTICS OF SINDH.
*1970-71 to 1972-73, *1970-71 to 1973-74, *1970-71 to 1974-75,
*1973-74 to 1975-76, *1975-76 to 1977-78, *1970 to 1980, *1977-78 to
1981-82,*1977-78 to 1983-84,*1987, *1988, *1989. Ten Years (*1980-81 to
1989-90 & *1981-82 to 1991-92) *1993,*1995, *1996, *1997-98, *1999-00 to
*2000-01, *2003, *2004, *2005, *2008 & *2009.
5. INDUSTRIAL STATISTICS.
a) CENSUS OF MANUFACTURING INDUSTRIES IN SINDH.
*1969-70, *1970-71, *1971-72, *1972-73, *1975-76, *1976-77 to 1980-81,
*1981-82, *1982-83, *1983-84, *1984-85 *1985-86, *1986-87, *1987-88,
*1988-89, *1989-90, *1990-91, *1991-92, *1995-96, 2000-01 & 2005-06.
b) MONTHLY SURVEY OF INDUSTRIAL PRODUCTION
AND EMPLOYMENT IN SINDH (M.I.P.E).
*December, 1975 & onward October 2016 (Monthly)
6. EDUCATIONAL STATISTICS OF SINDH.
*Educational Statistics in Sindh (1969-70, 1970-71, 1971-72, 1972-73),
*Summary Release on School Education Statistics, (1984-85, 1985-86,
1986-87, 1987-88, 1988-89, 1989-90, 1991-92 & 1992-93). *Summary
Release on Education Output Statistics in Sindh (1976 to 1985). *Summary
Release on College/ Universities Education Statistics in Sindh, 1984-85,
1985-86, 1986-87, 1987-88, 1988-89, 1991-92, 1992-93 & 1993-94). *10
Years College Education Statistics (1976-77 to 1985-86 & 1994-95), 1992,
1993-94. *Summary Release 10 Years University Education Statistics in
Sindh, 1985-86 to 1994-95. *School Education Statistics (Urban/Rural) in
Sindh, (1974-75 to 1979-80, 1980-81 to 1983-84, 1985-86, 1986-87,
1987-88, 1988-89, 1989-90, 1990-91, 1991-92, 1998-99, 1999-00, 2001-02,
2002-03, 2004-05 2005-06, 2006-07, 2007-08, 2008-09 & 2009-10. *Pilot
Census of Primary Schools in Sindh 1980-81, *Education in Urban
Settlements 1984, *University Education Statistics (1976-77 to 1984-85,
1981-82 to 1985-86) *College Education Statistics in Sindh (1976-77 to
1983-84, 1984-85, 1985-86, 1986-87, 1987-88, 1988-89, 1989-90, 1990-91,
1991-92, 1992-93, 1993-94, 1994-95, 1995-96, 1996-97, 1997-98, 1998-99,
1999-00, 2000-01, 2001-02, 2002-03, 2003-04, 2004-05, 2005-06, 2006-07,
2007-08, 2008-09, 2009-10, 2010-11, 2011-12, 2012-13, 2013-14, 2014-15 ).
* Out of stock
7. COMPARATIVE STATISTICS
a) Pakistan & Sindh. *1980, *1986, *1987, *1991, *1992, *1993, *1994, *1995, *1996,*1997, *1998, *1999, *2000, *2001, *2002, *2003, *2004, *2005, *2006, *2007, *2008, 2009, 2010 & 2011.
8. HEALTH STATISTICS OF SINDH.
a) *Statistics on Hospitals & Dispensaries in Sindh, 1964-70.
b) *Survey of Selected Health Facilities (49) at Taluka Headquarter, 1992-93.
c) *Health Statistics of Sindh, *1986 to 1991, *1993, *1996, *1997, *1998,
*1999, *2000, *2003, *2004, *2005, *2006, *2007, *2008, *2009, 2010,
2011, 2012, 2013, 2014, 2015 & 2016.
A D H O C (S E L E C T E D).
1. *25 Years of Sindh in Statistics, 1998
2. *Agriculture Financing in Sindh, 1964-65 to 1973-74.
3. *Motor Vehicles Statistics of Sindh, 1960-75.
4. *Survey of Health Institutions working under District Councils in Sindh,
1976-77.
5. *Population Statistics of Sindh, 1972,1978, 1981 & 1998.
6. *Population and Settlement Pattern (Urban/Rural)in Sindh (Provisional),
1981.
7. *Economic Indicators (Provisional) February & March (1983), 1988 & 1989.
8. *Non Response Survey Report of Census of Manufacturing Industries,
1975-76 & 1980-81.
9. *Human Settlements Statistics (Urban/Rural) in Sindh, 1981 (Revised).
10. *Sindh Labour/Manpower Statistics, 1980-81.
11. *Statistical Hand Book on Development, 1984.
12. *Summary Report of Survey of Human Rural Settlements having
population of 500 or more persons January, 1985.
13. *Survey of Human Rural Settlements Population of 200-499
persons (General Facilities).
14. *Selected data from Agriculture Census, 1980.
15. *Sindh Housing Statistics Urban/Rural, 1980-81.
16. *Telephone Directory, 1986, 1987 & 1989.
17. *Development Profile of Sindh, 1986, 1987, 1988, 1988-89 & 1989.
18. *Women Statistics in Sindh, 1987.
19. *Population Statistics of Sindh Edition-iii.
20. *Key Economic & Social Indicators of Sindh, 1997.
21. Human Rural Settlements Survey Report (Population 200 & above) of
Mirpurkhas District 2000 (Larkana, Shikarpur, Ghotki, Sukkur Districts) 2001,
(Sanghar, Khairpur, Jacobabad & Dadu Districts) 2002, (Hyderabad, Naushero
Feroze & Karachi Districts) 2003, (Tharparkar & Nawabshah Districts ) 2004
and (Thatta & Badin Districts) 2005.
22. *Socio Economic Characteristics of Sindh, 1993.
23. District Development Indictors Sindh August, 2000.
Complimentary copy can be had from:
Mr. Izat Ali Chachar Statistical Officer Tel No: (021) 99206672 Fax No: (021) 35296415
E-mail: [email protected]
LIST OF SELECTED PUBLICATIONS