
Planning Curses: How to deliver long term investment in infrastructure
64
Planning Curses How to deliver long-term investment in infrastructure Bridget Rosewell
-
Upload
policy-exchange -
Category
Documents
-
view
214 -
download
0
description
By Bridget Rosewell Planning Curses shows how despite efforts to streamline planning, vital projects are not going ahead because of over-elaborate and unrealistic economic predictions. Planners waste too much time looking for a “perfect” solution while using deeply-flawed tools to make predictions. According to the original business plan, London Underground’s Victoria Line should still not be full while the Jubilee Line extension failed to pass any conventional tests but has been a stunning success. Planning has become captured by experts and vested interests who use language that only bureaucrats understand and excludes everybody else.
Transcript of Planning Curses: How to deliver long term investment in infrastructure

Planning CursesHow to deliver long-term investment in infrastructure
Bridget Rosewell
£10.00ISBN: 978-1-906097-92-9
Policy ExchangeClutha House10 Storey’s GateLondon SW1P 3AY
www.policyexchange.org.uk
Policy Exchange
Planning Curses
Planning Curses examines the reasons why the
UK often fails so abysmally to deliver long-term
investment in infrastructure. It explains how
expert analysis has become a substitute for real
understanding. This has generated decisions made
by the politics of prejudice rather than rational
debate.
Economic forecasts underpin key decisions. But
these have low reliability. Worse, the values of
projects are presented in terms of theoretical costs
and benefits which are not only impossible for
participants to understand but are intellectually
dubious. The gains arise from the dynamic
transformation of economic possibilities and not
from the purely static confines of conventional
economic theory. The result is that short term
considerations become dominant and regulation
takes over from comprehension.
To deliver better outcomes, it is not enough to
have yet another plan. Rather we need to ask
more demanding and direct questions and engage
financial and business interests. A framework for
making decisions would be more use than a plan
based on hidden assumptions, unproven forecasts
and funny money.
Planning CursesHow to deliver long-term investmentin infrastructure
Bridget Rosewell
Policy Exchange is an independent think tank whose mission is to develop and promote new policy
ideas which will foster a free society based on strong communities, personal freedom, limited
government, national self-confidence and an enterprise culture. Registered charity no: 1096300.
Policy Exchange is committed to an evidence-based approach to policy development. We work in
partnership with academics and other experts and commission major studies involving thorough
empirical research of alternative policy outcomes. We believe that the policy experience of other
countries offers important lessons for government in the UK. We also believe that government has
much to learn from business and the voluntary sector.
Trustees
Charles Moore (Chairman of the Board), Theodore Agnew, Richard Briance, Simon Brocklebank-Fowler,
Richard Ehrman, Robin Edwards, Virginia Fraser, George Robinson, Andrew Sells, Tim Steel, Alice
Thomson, Rachel Whetstone and Simon Wolfson.
© Policy Exchange 2010
Published by
Policy Exchange, Clutha House, 10 Storey’s Gate, London SW1P 3AY
www.policyexchange.org.uk
ISBN: 978-1-906097-92-9
Printed by Heron, Dawson and Sawyer
Designed by SoapBox, www.soapboxcommunications.co.uk
Contents
About the Author 4
Acknowledgements 5
Executive Summary 6
1 The Issues 12
2 Examples 13
3 Themes 41
4 How to Improve Things 56
5 Conclusion 61
About the Author
Bridget Rosewell is one of the UK’s most influential economists,
with a twenty year track record in advising public and private sector
clients on key strategic issues. Her specialist expertise includes
economic development, transport and agglomeration economics,
development, evaluation, infrastructure, forecasting, industry
dynamics and competition as well as policy analysis related to these
areas.
She was responsible for developing innovative arguments for
transport infrastructure in London and for analysing the process of
innovation in Manchester. She is currently advising on London’s
prospects over the next 30 years as part of the forthcoming London
Plan.
Bridget is one of the founding directors and Chairman ofVolterra
Consulting, established in 1998 to apply leading-edge mathematical
and statistical techniques to solve economic and business problems.
Bridget is currently the Chief Economic Adviser to the Greater
London Authority advising Mayor Boris Johnson. From 2002 to
2008 she also advised the previous Mayor.
She was one of the so-called Seven Wise Men who advised Ken
Clarke when he was Chancellor.

Acknowledgements
This pamphlet has been made possible by all the people with whom
I have worked over the years but has been particularly helped by Paul
Ormerod and Andrew Barry Purssell. However, they are not
responsible for my views.
Executive Summary
Why does the UK seem perennially unable to take long-term
decisions on infrastructure investment? This is a hugely important
question, especially in times of financial constraint when the pressure
to make cuts is intense. Notoriously, it is easier to cut investment
than current spending, since the risks in doing this always seem
smaller than the risks and political difficulties in facing up to current
vested interests. Although a variety of efforts have been made over
the past few decades to try to take politics out of long-term decision
making and investment decisions, none of them have yet worked.
The Coalition government’s National Infrastructure Plan is the
latest attempt to improve the planning, prioritisation and
implementation of infrastructure investment and development. But
this is only one small step. Without clearer structures to decide the
detail, execution and financing of long-term infrastructure projects,
we will be back to the same round of delays and hesitations which
have blighted decision making for decades.
This paper outlines how and why this failure to invest has
occurred and suggests changes to the planning and policy
environment that could make a difference. It draws on examples of
recent infrastructure projects, large developments and regional
economic and spatial plans to illustrate the problem and its roots.
Fundamentally these lie in the way in which an edifice of
technocratic analysis based on complicated economic models
bearing little relation to the real life impact of infrastructure
investment has undermined the ability to debate decisions and build
consensus around contentious projects. The vested interests of
experts have obscured debate around practical issues and trade-offs
by couching decisions in inaccessible, bureaucratic language which
has singularly failed to engage local communities or interest groups,
in particular around the potential benefits of such investment.
There are four main elements to the problems currently faced:
First, economists have persuaded us to give too much credence
to their forecasts and forecasting models. In spite of a poor track
record, complicated, arcane models are still used to underpin crucial
planning decisions. Economists present their models as accurate
descriptions of how the world works, or at times as accurate
descriptions of how the world ought to work. Yet modern
developments and actual experience of the impact of previous
infrastructure decisions are increasingly showing that such models
are much more imperfect than previously thought. Advances in
understanding economic psychology, growth, herd behaviour and
innovation have all combined to undermine previous certainties
about the assumptions that underlie such models.
Current assumptions, based on models of rational decision
making, undermine the role of investment, growth and change in
decisions. Instead, such activities become automatically assumed and
bureaucratically calculated rather than being
understood as a consequence of the projects
and decisions. When all opportunities are
always taken as a given, nothing can ever be
additional. It becomes impossible to prove the
value that a new railway, road, bridge or
development, can provide.
Project after project has faced this problem.
In the case of the Crossrail evaluation model
for instance, no additional journeys were
presumed to be generated by the new line at
all – something in practical terms we know is nonsense. With the
failedThames Gateway Bridge project, the interdependence between
the investment in the Bridge and the ability to achieve desired
growth stood outside the approved guidance on assessments so was
Execu3ve Summary | 7
““An edifice of technocraticanalysis based on complicatedeconomic models bearing littlerelation to the real life impact ofinfrastructure investment hasundermined the ability to debatedecisions and build consensusaround contentious projects””
never considered as part of the case for the development. Where a
project has been allowed to go ahead it has often done so in spite of
the forecasts rather than thanks to them – the existence of Canary
Wharf, for instance, is owed to the vision and imagination of some
developers and the then Prime Minister, Mrs Thatcher. No economic
forecasts backed its development and its transport infrastructure
failed the forecasting tests, yet the reality is that it has been hugely
successful.
A second consequence of the current approach to evaluating new
infrastructure developments is that economists and experts couch the
conclusions of their modelling in terms which make little sense
outside their rarefied world. Economists talk in terms of welfare
analysis and cost-benefit calculations. Returns on investment thus
become based on welfare benefits (an invented valuation) which have
been given a notional monetary value and frankly mean nothing to
anyone, rather than on actual returns – be they financial or practical
improvements to quality of living etc – which can be understood by
businesses, investors and consumers. The benefits of transport projects,
for example, are based entirely on time savings – that is, the number
of minutes saved on a journey as a result of the new infrastructure
investment – which is then turned through some complicated
calculation into a monetary value in order to establish the worth of the
scheme. It is little wonder that people, perhaps sceptical about new
investment and how it will impact them, are not convinced when the
benefits are presented to them in such a convoluted matter.
The debate on Crossrail, for instance, turned on the treatment of
the benefits of people working near each other and the extent to which
transport benefits based on the value of time captured them. Such
arguments were complex, academic and yet hugely important in terms
of the debate around whether the line should be built. The simple
case that Crossrail was being proposed to make it easier for people to
get into central London which is busy, productive and essential to the
economy of the UK, yet has a gridlocked transport system which is
8 | Planning Curses
harming its competiveness and the quality of life of its residents and
commuters, was never addressed in the technical models. Similarly,
the debate on the Thames Gateway Bridge became dominated by the
interpretation of official guidance and the need for ever more complex
modelling to prove the unprovable and to set out in ever more detail
a ‘do nothing’ picture of increasing complexity.
Thirdly, the way in which models, forecasts and their assumptions
are presented has had the consequence, perhaps paradoxically, of
focusing attention on the short term. Under the assumptions of these
models it seems that so much is going to happen anyway that it becomes
easy to take the long-term for granted. Short term expediency rules as
political considerations come to the fore.
The most notorious short term, politically motivated decision about
a major investment related to the Humber Bridge. The decision to
ensure that the local people would, as Barbara Castle promised, ‘have
your Humber Bridge’ was announced just before the Hull North by-
election of 1966, which was subsequently won by Labour and ensured
they hung on to their small Commons majority. The abandonment of
Crossrail in the early 1990s was regretted within just a few years when
overcrowding on the Underground system once more became a
significant problem. Despite the fact that a long-term vision for East
London which requires more connectivity and Thames crossings had
been developed and accepted by the local planning authorities which
gave permission for the Thames Gateway Bridge, the imminent 2005
general election meant that the project was put on ice by the calling
of an Inquiry – an expensive and lengthy process which has eventually
meant the abandonment of the project, at least for the time being.
Fourthly, the current short term focus leads in turn to inadequate
decision mechanisms. The technocratic process provides an
apparently objective analysis but one which is outside the
understanding of the participants and which does not create any
mechanisms to debate and resolve differences of opinion or
differences of interest.
Execu3ve Summary | 9
As a result differences are fought out in the political arena, the cockpit
of Inquiries or sometimes in court. All of these forums entrench positions
and encourage adversarial attitudes and confrontation. The analysis gets in
the way of rational debate because of the way in which the experts are
given control of the underlying assumptions.
Crossrail finally got permission because of
a concerted campaign by a collection of
organisations which worked together to
articulate a clear and shared vision of the
benefits of Crossrail and the role it would play
in delivering more workers to highly
productive central London locations. The size
of the project and its importance to such a
range of businesses, communities and stakeholders, meant that time
and energy was spent getting across the technical issues to the wider
public and politicians in a clear way. But this is very unusual. In the
Thames Gateway Bridge Inquiry, positions of opposition in principle
were translated into technical language with models presented as
generating firmer conclusions than they could really support, causing
confusion, resentment and ultimately leading to the abandonment of
the project. This was in contrast to the successful Jubilee Line
Extension decision which was made outside all the formal decision
rules and in spite of the modelled analysis.
An inevitable consequence of inadequate decision making
mechanisms is a reliance on regulation and central dictat as a substitute
for debate and decision. The man from Whitehall becomes the expert
who knows what level of investment is right and who enforces more and
more onerous requirements to ensure proper standards of behaviour.
This report sets out four suggestions for improving the system.
They are not panaceas – creating a new way of thinking about the
future takes time and adjustment. The new government, like many of
its predecessors, recognises the importance of infrastructure but
without embedding a new attitude to deciding on individual projects,
10 | Planning Curses
““An inevitable consequenceof inadequate decision makingmechanisms is a reliance onregulation and central dictat asa substitute for debate anddecision””
we will simply end up with yet more plans but with just as little
implementation. A new approach will require the following elements:
� Pursue projects on the basis of their contribution to the
economy, not their contribution to ‘welfare’. This will produce
measures of output which can be easily understood and which can
create a payback in financial terms which will pay back the debt.
� Start with business cases which engage business. Measuring the
outputs in money terms is one way of doing this but another
important element is to devise project descriptions which can be
understood and invested by the private sector. This is more
revolutionary than it sounds. What is called a business case in public
projects would not be recognised as a business case anywhere else.
From the description of project objectives to the consideration of
value for money, a fundamental bottom up reworking is required.
� Use long-term frameworks and forget about plans. All activities
take place within frameworks for decisions. From families to
markets, from cabinets to boardrooms there are rules for thinking
about next steps, trade-offs and managing preferences. Of course
activities also get planned – for anticipation, for implementation.
However, the kind of plans which get incorporated into public
decision making are like creating blueprints before the purpose of
the building has been decided. We know the world is ever
changing and yet behave as if we know what is going to happen
in 20 years time. What we need is a framework for how we want
to shape that future and how we will react to the buffeting of
reality, not a set of inflexible instructions.
� Let local areas keep local taxes which are used to finance
investment. The complexities of the world and how it changes
cannot be dealt with at national level. Moreover, innovation
requires variety and experiment. Creating a real localism can
help to free areas to make such experiments and to work with
innovators to invest and to create new business cases.
Execu3ve Summary | 11
1. The Issues
Policy Exchange has previously argued that there is a shortfall in
infrastructure investment in the UK of some £500 billion.1 This
comprises a need for more transport infrastructure, energy
generation, water supply and waste management just for starters.
Yet developers continually complain that the planning system for
any kind of development is complicated, arcane and hard to manage,
adding substantially to the costs of any investment.
The UK public decision system is thus geared against making a
positive decision, particularly those which have long-term
consequences, both when they are privately financed and when
public money is involved. However, when public money is involved,
the hurdles are more complicated and more likely to lead to delay or
even failure to act.
The previous government attempted to deal with this by setting
up more institutions and targets which were to overcome the hurdles
but not to dismantle them. The present government has kept some
of these institutions and is trying to develop a longer term plan. But
this will not remove the hurdles to action. There must be a better and
more effective way.
To find it, we first need to identify the nature of the hurdles if
they are to be swept away. Some case studies can help.
1. D Helm, J Wardlaw,
Delivering a 21st
Infrastructure for Britain,
Policy Exchange, 2009
2. Examples
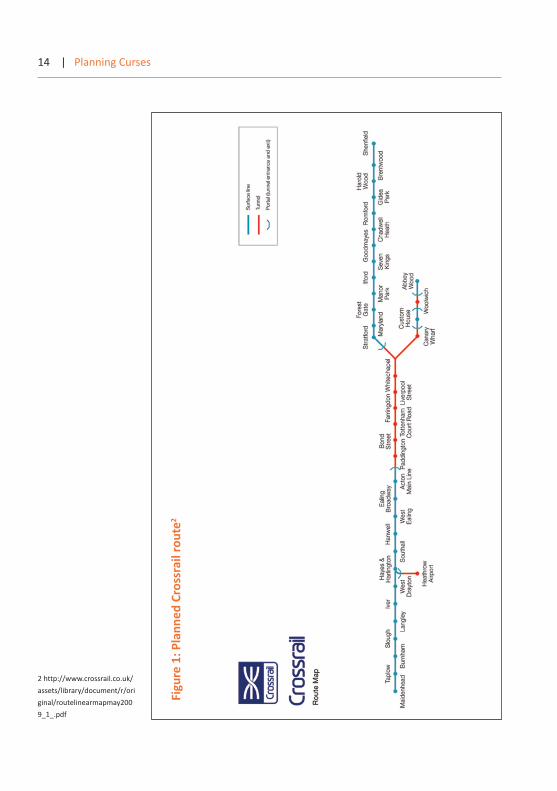
CrossrailCrossrail is the name that has been given to a railway to provide
additional capacity across London from east to west. The link
between Paddington and Liverpool Street is a key element but so too
is how the railway connects outside the central area. The current
scheme connects Maidenhead and Heathrow in the west to Shenfield
and Abbey Wood in the east. It reduces the travel time from Canary
Wharf to Paddington to 17 minutes and provides additional access
to the busy central business districts with large trains similar to those
on overground networks. Parliamentary consent to the plan was
given in 2008 (a process which took three years), and works started
in 2009, based on a plan finalised in 2004. It is now planned to
open in 2018 and the finances seem to have finally been signed off
by the Coalition government.
The first plans for Crossrail were formulated nearly 50 years ago
and the current route was identified in a review in 1989 entitled the
Central London Rail Study. The project was agreed and went for
permission via a hybrid bill in Parliament in 1991. However, this did
not get government support to allow it parliamentary time and by
1994 it had been withdrawn. By this time both the route for
Crossrail and Crossrail 2 (otherwise known as the ‘Chelsea Hackney
line’ had been safeguarded). Safeguarding puts limits on the ability
to put in place other developments which require special permission
and generally deter investors. It has taken a further 20 years from the
time the routes were decided for construction to begin. Even now,
there is no timescale for when Crossrail 2 is likely to be decided. In
the meantime, the planning blight along the proposed route remains
in place.
14 | Planning Curses
2 http://www.crossrail.co.uk/
assets/library/document/r/ori
ginal/routelinearmapmay200
9_1_.pdf
Figure 1: Planned Crossrail route2
Not only do delays such as these blight areas and slow down
regeneration, but at the same time costs escalate. In 1980 an
equivalent scheme to Crossrail (but Victoria to Euston) was costed at
£330 million (1980 prices). By the time of the Central London Rail
Study the cost had increased to £1.4 billion (1990 prices). In 1994
the cost had risen to £1.55 billion, and by 2004 had risen again to
about £10 billion (including a large allowance for “optimism bias”).
The current budget is £16 billion in cash over the construction life
of the project. Changing standards and requirements, re-engineering
of old designs and general increases in construction costs all add to
the expense.3
Between 1992 and 1994 there were no less than three technical
reviews, by Bechtel, by Bovis and Sir Alexander Gibb and Partners,
and by Ove Arup. Although their briefs were slightly different, they
all reached similar conclusions. Each cost several million pounds.
They seem largely to have been commissioned to support a process
rather than a decision.4
Government has not generally recognised that re-engineering can
cost more money than it saves. Delays of implementation of more
than a year would require a major re-engineering exercise potentially
costing in excess of £100 million. To get some idea of the scale here,
it has been estimated that there are some 800,000 square metres of
development space currently being delayed by Crossrail. That space
could reasonably accommodate some 50,000 jobs, and its value
might be in excess of £8 billion (assuming an average value of
£10,000 per square metre) with an annual rental income of £400
million (assuming a 5% yield).5
It is not just development schemes that are affected by delays to
the implementation of Crossrail; there are also a number of transport
projects that need to be fitted around it such as the redevelopment
of Tottenham Court Road station, works at Whitechapel and around
the former East London Line, and other station and signalling works
which will need to be carefully integrated into the improvements to
Examples | 15
3 Crossrail, Costs of Delay,
Colin Buchanan and Volterra
Consulting, Feb 2007
4 House of Commons,
RESEARCH PAPER 05/38,
Crossrail Bill, 1 JUNE 2005
5 Crossrail, Costs of Delay,
Colin Buchanan and Volterra
Consulting, Feb 2007
the London Underground system. Uncertainties about programmes
and timetables can badly affect the costs of these schemes and ability
to deliver them. In a crowded and busy network decisions have
knock on effects – for example if Crossrail were not to go ahead,
then other schemes would have different costs and benefits from
those that accrue in its presence.
Here we have a significant and complicated project, which has
been promoted for many years as a necessary investment. It is
instructive to understand why getting to a decision on it has taken
so long, even though leading figures in the transport, business and
planning worlds have supported it.
Of course, it is ‘large’, which always makes for hesitation. On the
other hand it is by no means enormous. The largest spend is
estimated to be £5 billion in 2013 which is associated with the
major tunnelling works. Other large costs are associated with
particular stations at depth, which can cost up to half a billion apiece
partly because of regulatory standards. The abandonment of the
project in 1994 was partly in response to a sense that London had
ceased to grow – the recession of the early 1990s was still live in
people’s minds. By 2000 it was apparent that it was still business as
usual on the crowded and ageing Underground.
A fear of making the wrong investment is certainly behind some
of these worries. So it must be important to have a clear,
comprehensive and comprehensible evaluation of such a project, and
its risks.
However, the evaluation of transport projects is an arcane art
conducted with large and complicated models by a priesthood of
experts skilled in their use. Outsiders can find it hard to judge the
results and unable to penetrate the conclusions.
Here are some parameters. In order to judge a transport project it
is of course necessary to assess how many will use it. Over the last 30
years London has developed a model to produce these results. The
model takes as inputs pre-existing forecasts of employment and
16 | Planning Curses
population changes which have been allocated to a large number of
transport zones (1,700 at the latest count). These zones are very small
in the centre and tend to get larger as you move outwards and indeed
include commuter zones outside London. These forecasts are used to
predict the use of the network of roads, rail, bus and underground,
given the costs of this use. Costs include the time taken as well as
money spent and include adjustments for difficulties such as having to
make a change of train. The model is solved on the assumption that
people will minimise the cost of making the trips they need given the
distribution of where they work and where they live.
In order then to understand the effects of new transport
investment, we create a new solution of the model having made the
changes to the cost of the network that new linkages imply. We still
have the same number of trips, but now they are being made more
easily as a result of the new investment, which means crowding can
go down and trips take less time. This is the key measured benefit
of any transport scheme.
Of course time savings are made in minutes, while the cost of the
scheme is in money. So time savings need to be turned into money
in order to establish the value of the scheme. The establishment of
a value for time is a non-trivial question, as some introspection
should quickly show. It will vary by person, by income, by kind of
trip and so on. The most recent review of this question was
undertaken in 2003,6 and its conclusions are the basis for the current
levels which have been set by the Department for Transport.
An hour of leisure time is currently valued at £4.46 per hour, and
an hour of work at an average of £26.73.7 The studies on which
these values are based are not uncontroversial. Much of it used
experimental studies which give people options of various trips.
Answers can be inconsistent but this can be ignored because rational
economics suggests that they ‘ought’ to be. Such values are therefore
part of the whole edifice of rational, expert, cost-benefit analysis
which rests on an intellectual construct which is increasingly under
Examples | 17
6 Values of Travel Time Saving
in the UK, ITS, Leeds
University, 2003
7 WebTAG, Unit 3.5.6,
http://www.dft.gov.uk/webta
g/documents/expert/pdf/unit
3.5.6.pdf
challenge. The value of working time is perhaps less controversial as
it essentially rests on wage rates – these are at least directly
observable. However, for most studies they provide a relatively small
proportion of benefits. Even in the Crossrail case, where a value of
work time of £55 per hour was applied for trips to Heathrow, the
contribution was only 30% of the total time savings.
These basic calculations are used to
compare all UK road and rail projects where
there is public investment. The approach is
based on wanting to capture all the benefits
of improving people’s welfare when
considering the costs.
These are the calculations that have been at
the heart of an assessment of whether
Crossrail is good value for money yet it
seemed not only difficult to understand but
also not really to address why we wanted Crossrail. This railway is
designed to make it easier for people to get into central London.
Central London is busy and productive and more people could work
there, but the transport system is too crowded and such expansion
could cause gridlock on stations and the trains. Where was this
addressed in the models? It simply wasn’t. The models assume that
trips will be made according to the external forecast, and so they
will always happen. No-one gets crowded off, even though the
numbers suggested we would need Japanese style pushers to get
everyone on and maybe not even then.
Maps of where crowding could appear suggested that there might
well be stations which had to have queuing systems to get people
onto the platform most of the time or where the length of time taken
to get people on and off the train meant that there would have to be
fewer trains.
Investment in Crossrail could prevent these problems emerging.
Although these issues could well be illustrated by the transport
18 | Planning Curses
““Central London is busy andproductive, but the transportsystem is too crowded and suchexpansion could cause gridlockon stations and the trains. Wherewas this addressed in themodels? It simply wasn’t””
models, the existing models could not really deal with these crunch
problems nor did they estimate how many people might simply
choose not to travel and go somewhere else.
Indeed this seems to be the nub of the problem. London was
growing and could continue to grow, creating more jobs and more
activity. These jobs had value, but the modelling took no account of
such value. All of these points were put before the Treasury to show
that we needed to think seriously about the value of Crossrail and not
just look at some notional time savings.
Thus was the Wider Benefits Working Group born, and delving
further into the research papers and the rules governing the
priesthood, it was discovered that such issues had been addressed
before in the context of roads and the concern that new roads
seemed to fill up in due course and negate the time savings that the
models had predicted.
Readers will be pleased to know that in economic theory it is
possible to argue that time savings are the same thing as new users
– it all depends on the relative benefit of higher wages and time
saved. However, there are some stringent assumptions surrounding
this conclusion and the most important one in this context was that
it ignores agglomeration.
Agglomeration is the reason we choose to live in cities. Things
work better there: there are larger sources of jobs, more effective
competition, spillover effects of knowledge and networks. We can
show that London is more productive and hence allowing people to
work in London would permit the expansion of employment which
is going to create more value (and more tax revenues) than
elsewhere. Moreover, this larger size can also create additional output
from the people already there.
This was a challenge to the traditional methodology but was one
which could be supported by everyone as adding to the existing
analysis – hence the ‘Wider Benefits’ title. The remaining calculations
still used the standard analysis and values of time retained their hold
Examples | 19
on decision making. The process of reaching this conclusion was
lengthy and painful. It required considerable analysis and argument
and lots of meetings.
Even when the principle of ‘wider benefit’ was accepted, there
were still hurdles of method and measurement. What exactly is the
extra productivity? If people with high skill levels didn’t work in
London, would they still be more productive than others? Where
would they work? How should we capture any such effects?
Officials needed to produce their own research and definitions,
rather than relying on those created by the Crossrail team.
And the point here is that the answer is not trivial. The benefits
of Crossrail, even on the most cautious assumption, were doubled by
our research which took account of this effect. This means that we
have been underestimating the benefits of new transportation
schemes in cities by a phenomenal amount and therefore under-
investing. And the assumptions are cautious. If we take the view that
over 50 years or so, the rest of the system will still be as busy as it is
today, while Crossrail is also full, we will be delivering around
80,000 more people to this highly productive place. That additional
productivity is worth around £70 billion in today’s prices. Crossrail
will be good value even if the costs over-run.
20 | Planning Curses
Values of time and the value of the economySaving 3me can be considered the welfare benefit of an investment.
It can be defined as the willingness of an individual to pay for
something – in this case for an extra minute of 3me. The approach
is described in the official guidance as follows:
“The basic strategy of the willingness-to-pay (WTP) calculus
is to arrive at a money measure of the net welfare change
for each individual that is brought about by the project
under considera3on, and then to sum these. The welfare
Examples | 21
change for any individual is measured by the compensa�ng
varia�on, i.e. the individual's WTP for benefits or the
nega3ve of his/her willingness to accept compensa3on for
disbenefits. The principle behind this calculus is the Kaldor-
Hicks compensa�on test: a move from one state of affairs to
another passes this test if, in principle, those who benefits
from the move could fully compensate those who lose
(without themselves becoming losers). When the cost-
benefit accounts are presented in this way, there o#en are
items which appear as benefits for one person and equally-
valued costs for someone else: such items are transfer
payments or pecuniary externali�es. Items which do not
cancel out in this way are social costs or benefits
(some3mes called resource or real resource costs or
benefits). The word 'social' is used to signify that these are
costs or benefits which fall on 'society as a whole',
understood as the aggregate of all individuals.
“The calculus of social costs and benefits seeks to
measure the value of the 'resources' used by, and the
benefits created by, a project. This approach dis3nguishes
between social costs/benefits and transfer payments at the
outset, and takes account only of the former. For example,
consider a straigh2orward market transac3on: a person
buys and consumes a can of beer. In the calcula3on of social
costs and benefits, the marginal cost of producing the beer
is a social cost, while the consumer's enjoyment of the beer
is a social benefit; the actual payment made for the beer' is
a transfer payment, and is ignored. (In contrast, the calculus
of WTP would record a benefit to the consumer equal to the
consumer's surplus on the beer, i.e. the excess of WTP over
the price paid, and it would record a benefit to the producer
22 | Planning Curses
8 WebTAG, Unit 3.5.4, Box 2,
http://www.dft.gov.uk/webta
g/documents/expert/pdf/unit
3.5.4.pdf
9 SACTRA Final Report, para
24, 1991
of the beer equal to the producer's surplus, i.e. the excess
of price received over marginal cost.) Because the calculus
of social costs and benefits nets out transfer payments, this
approach does not allow the net social benefit of a project
to be disaggregated into impacts on different economic
interest groups.”8
This willingness to pay is clearly an individual ma4er based on the
enjoyment of individual benefits. It takes no account of broader
economic benefits or indeed the impact of one individual’s
enjoyment on another.
A major study of the analysis of road schemes inves3gated the
rela3onship between 3me savings and economic benefits, was
published in 1999. The report showed that economic theory
suggested that 3me savings and economic benefits were two sides
of the same coin. In principle, and in a compe33ve economy, 3me
savings could be converted into economic ac3vity as trips increased
and 3me savings were competed away. As the Standing Advisory
Commi4ee for Trunk Road Assessment (SACTRA) concluded: “If
these condi3ons hold, we concur that the value of the es3mated
costs and benefits to transport users (notably 3me savings,
opera3ng costs and accident reduc3on), and to nonusers (notably
environmental impacts – provided that they have all been iden3fied
and a money value a4ributed to them) would give a full and
unbiased es3mate of the value of the overall economic impact. This
is equivalent to the statement that no 'addi3onal' economic value
exists.”9
Of course, there are many reasons why these condi3ons will not
hold. First, there is the ques3on of whether all costs and benefits
have been correctly valued. Second, there is the ques3on of
whether the assump3ons of perfect compe33on hold.
Examples | 23
10 Transport and the
Economy, RTPI and TPS
evidence to the House of
Commons Transport Select
Committee Inquiry, 22nd
September 2010
11 Prioritising investment to
support our economy,
Network Rail, 2010
The SACTRA commi4ee inves3gated both of these. It concluded
that further work was jus3fied on the measurement issues and that
some adjustment for imperfect compe33on should be made. This
was set at 10% in subsequent guidance, although the report itself
recommended a more case by case approach.
At that 3me, however, the general approach which had been
established was given con3nued support. More recently, this has
come under more scru3ny.
First, SACTRA took no account of agglomera3on effects. These
operate outside the condi3ons for perfect compe33on which
require that no firm has interac3ons with other firms outside the
price system. Agglomera3on means that one firm’s produc3vity is
supported by the existence of other firms nearby and thus
undermines these assump3ons.
Recently, the Royal Town Planning Ins3tute and the Transport
Planning Ins3tute’s evidence to the Transport Select Commi4ee
said, “We conclude that current methods are not a reliable means
of direc3ng the very limited transport resources now available
towards economic purposes, par3cularly regarding the balance
between road and rail, and between large-scale capital schemes and
the smaller kinds of scheme o#en financed by revenue”.10
A further report from Network Rail, prepared by KPMG and
supported by the CBI is summarised as follows: “This paper argues
that a new methodology is needed to help priori3se investment
decisions and that this approach should focus on assessing the
impact of investment on the economy. It does not advocate doing
away with welfare based appraisal altogether, but instead that the
current approach should be run in parallel to one that focuses
exclusively on the real economy and that facilitates level playing field
assessments across closely related strategies such as regenera3on
and housing.”11
There is a much simpler way to consider the benefits of an
investment such as Crossrail than a focus on valuing time or some
extra productivity. It is possible to use the transport models in a
different way to ask what fare revenue can be generated and how
that might grow over time. The extent of constraints on that
growth can be assessed and whether people will move over from
other forms of transport or other train lines. That is one source on
investment support. A second source is the tax revenues generated
as the economy is enabled to grow. Both of these were estimates
that were produced as part of the case for Crossrail and which
made sense to ordinary decision makers. But they were not part
of the ‘official’ business case. Moreover, the use of the value of
time raises some questions too. It is taken as a constant everywhere
on the grounds that this makes comparisons fair across the
country. All projects are judged by the same standard. But of
course the value of time is almost certainly not the same. If this
is the case how these values translate into changes in the real
economy which ultimately needs to pay for the investment will
also differ so there is no reason to think that we are capturing the
real benefits.
Finally it needs to be mentioned that all of the models used in
determining time savings are based on people choosing efficient
solutions and an equilibrium emerging. In practice of course this is
not reality, and indeed the transport systems themselves contribute
to that changing reality with all the messy responses over time that
reality engenders.
The lessons of the campaign to get the Crossrail project approved
are not just about the analytical framework that is used. It is also
about how many forces had to be mobilised to generate the ability
to make this decision, how long it took and how many attempts.
In part the need to make so many attempts reflects an inability
to see the importance of the benefits in terms of the official
24 | Planning Curses
decision machine. In part it also reflects a risk-averse culture in
the decision environment which required the agreement to a
special levy on business, and contributions from developers along
the route.
The battle to make the case for Crossrail illustrates the reliance on
arcane models, on equilibrium approaches, and a decision process
which inevitably became highly politicised.
Thames Gateway Bridge This proposal for a bridge across the Thames in East London only
costs around £500 million rather than the £16 billion of Crossrail.
Nonetheless it faced even stiffer hurdles on both the political and
policy fronts. In part this was because this project was a road bridge
which drew opposition across a variety of interest groups, many of
which had no local connections or interests.
Rather like Crossrail, for many people a project to improve river
crossings to the east of London is a no-brainer. The river is a huge
barrier and there are no bridges between Tower Bridge and the
Dartford Crossing. Lorries use the Woolwich Ferry with long
queues. However, a previous attempt to solve this problem and
link the North and South Circulars, known as the East London River
Crossing, had generated serious opposition, focused particularly
on the loss of some ancient woodland, and was subsequently
cancelled. Thus the Thames Gateway Bridge needed to provide a
more local service and did not link the North and South Circular.
But the policy on which it was based in the London Plan of 2004
imposed significant constraints on road schemes. Any scheme
which increased net traffic capacity could only go ahead if
“benefits in other areas very substantially outweigh any
disbenefits”.12 A contribution to regeneration and development was
also required. The definitions of ‘substantial’ and a ‘contribution’
can clearly be disputed.
Examples | 25
12 Policy 3C.15, London Plan,
2004
Such a question was not something that the transport models
could answer, and so a new way of thinking about the change in
accessibility that the bridge offered and what effect this could have
was needed. Looking at London data, obviously many factors
generate changes in where people live and work, and so innovative
techniques to try and separate out the effect of changing accessibility
were needed. It also turned out that in outer areas the major
regeneration effect was on housing rather than employment. In other
words, increased accessibility had a bigger impact on people’s
willingness to live in an area than on their willingness to invest in
new workplaces. Regeneration based on improving an area as a
residential location had not previously been part of the standard tool
kit. In official guidance regeneration is thought of largely as job
related.
However, the analysis and the political support was sufficient to
persuade the Transport for London board to support the project,
albeit only on the casting vote of the Mayor and with some
opposition, apparently based on the proposition that the economy of
Richmond had been damaged by having a bridge. The local
authorities on both sides of the river, Greenwich and Newham gave
permission and everything was set in early 2005.
Then national politics got in the way. So far as it is possible to
judge, there were concerns that the bridge might affect some voting
behaviour in the general election. The project was therefore called
in by the Secretary of State to be determined at a Public Inquiry. The
elections also changed the complexion of the London Assembly and
in order to get his Budget approved, Mayor Livingstone had to
promise funding to those opposing the Bridge.
The Inquiry opened in June 2005 with the case for the Bridge,
but then adjourned until the autumn so that those opposing it
could spend their funds on additional research. The resulting
Inquiry lasted over a year, with heated exchanges on several
occasions, particularly from those who saw roads as intrinsically
26 | Planning Curses
evil. Some of this centred around using tolls to reduce the use of
the bridge and hence congestion. However, of course reducing use
also reduced the benefit and increase in accessibility. Moreover the
argument was made that the congestion problems were largely
focused on Bexley, rather than Greenwich, where the bridge itself
was to be sited.
However, the biggest difficulty was to meet
the apparent requirements of the policy
alongside changing guidance. The original
evidence on which the decision had been
based used new techniques of analysis in
order to capture the accessibility effect for
London. Critics wanted to be able to make comparisons with other
locations – both in the UK (the Humber) and internationally (in
Sweden) – where they said bridges had not created economic
development. These seemed to be wholly different but this was also
hard to ‘prove’ in any formal sense.
Critics also raised concerns about the extent to which a road
could suck development out of an area, about how increased traffic
would reduce time savings, and about the extent of public transport
use of the bridge. In addition, changing guidance made the task
of meeting the policy requirement still harder for those who were
arguing for the construction of the bridge. As outlined earlier
transport guidance is encapsulated in WebTAG – web based
transport assessment guidance.13 This huge compendium of ‘how
we do things around here’ sets standards for models and lays out
the tests that must be met in particular areas. Guidance on
regeneration tests was published during the interregnum between
work being done and the Inquiry kicking off.
The guidance had two aspects which were impossible to meet.
First, it stated that regeneration could only be focused on the
employment of currently unemployed people. Second, it suggests
that the best evidence of additional jobs for such people is the
Examples | 27
13 The WebTAG guidance can
be found here:
http://www.dft.gov.uk/webtag/
““The biggest difficulty was tomeet the apparentrequirements of the policyalongside changing guidance””
commitment of current employers to take them on, followed by
survey evidence and with statistical evidence as a poor third. While
in draft these narrow views were challenged, but this had no impact
at all.
For the Thames Gateway Bridge, this guidance meant that the
impact on improving residential use (and the potential for
supporting employment) carried no weight. Moreover, since the
bridge was not planned to open until 2016 at the earliest, finding
employers prepared to commit to increasing job numbers some ten
years hence was impossible. And finally, if statistical evidence was to
be admitted, the Department for Transport had become keen on a
particular approach – so called Land Use Transport Interaction
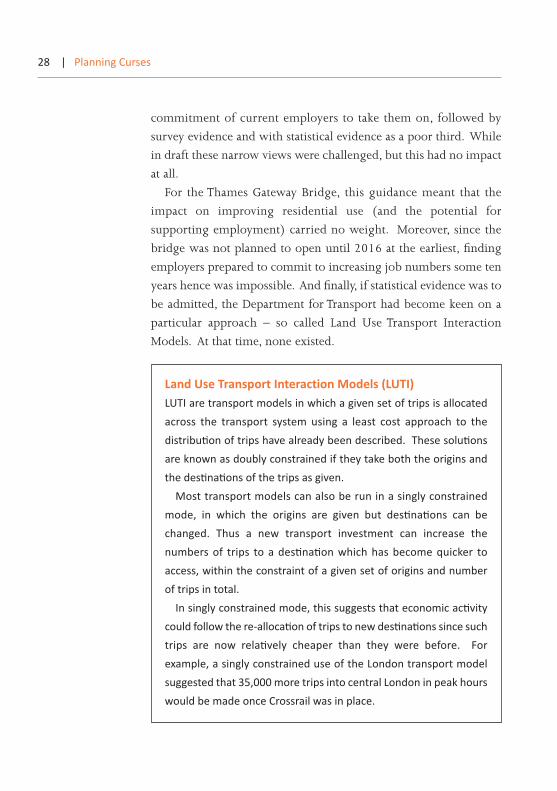
Models. At that time, none existed.
28 | Planning Curses
Land Use Transport Interaction Models (LUTI)LUTI are transport models in which a given set of trips is allocated
across the transport system using a least cost approach to the
distribu3on of trips have already been described. These solu3ons
are known as doubly constrained if they take both the origins and
the des3na3ons of the trips as given.
Most transport models can also be run in a singly constrained
mode, in which the origins are given but des3na3ons can be
changed. Thus a new transport investment can increase the
numbers of trips to a des3na3on which has become quicker to
access, within the constraint of a given set of origins and number
of trips in total.
In singly constrained mode, this suggests that economic ac3vity
could follow the re-alloca3on of trips to new des3na3ons since such
trips are now rela3vely cheaper than they were before. For
example, a singly constrained use of the London transport model
suggested that 35,000 more trips into central London in peak hours
would be made once Crossrail was in place.
What had started as a scientific hurdle – how to provide a
sensible assessment of the likelihood and likely scale of economic
improvements in Greenwich, Newham and other nearby
boroughs – had become an administrative nightmare of legalistic
guidance and debate over the appropriateness of tests. One of the
Inspectors, an engineer, was hopelessly befuddled by the various
statistical battles. He asked where the certainties were in social
science to match those he was used to in engineering in deciding
whether the bridge would stand and how many times a piece of
metal could be hit before breaking. The honest answer was that
no such certainties exist in social science. It is a judgement of
Examples | 29
14 Modelling Transport and
the Economy in London
Framework and Literature
Review, October 2007,
Volterra Consulting and Colin
Buchanan for TfL.
Of course, the origins of trips, or where people live if we think of
origins and des3na3ons as the travel to work trip, remain fixed. The
earliest models of land use interac3on therefore focused on
residen3al choice. Indeed, the implementa3on of models such as
LASER held employment fixed and looked at the costs of residen3al
choice, allowing people to move to reduce their travel costs subject
to residen3al costs.14 Subsequent developments added in a local
employment crea3on mechanism to reflect the impact of changed
residen3al choice.
A further development, named DELTA, has included step by step
change to try and escape the equilibrium analysis of previous
strategies.
All of these extensions include the transport models as a star3ng
point however. They therefore have fiendish amounts of detail and
require heroic assump3ons about the behaviour of very local
economies for which there is no data available on which to base a
calibra3on. Once again we rest on assump3ons about how
economic man (and woman) behaves by making ra3onal trade-offs
across many variables.
probabilities informed by statistical analysis and buttressed by
some imperfect theories.
Policy guidance however is couched in a way which makes it look
as if such certainties are there if only the tests are properly executed.
It is perhaps no surprise that the Inspectors concluded that the case
had not been made with sufficient force to meet the policy test that
the bridge could only be built if regeneration were sufficiently large.
They left the door open however for reopening the Inquiry and
preparations were made for this.
In particular, it was decided to go down the expensive route of
trying to construct a LUTI model for London. Such a model starts
with the transport models outlined earlier and adds on top of them
further models at the same level of geographical detail. To do this,
it is necessary to estimate how businesses trade with one another
and the effect of changes in accessibility; the extent to which housing
developers are attracted to sites with different levels of accessibility;
the extent to which population is attracted to the houses; the extent
to which commercial property is developed as transport changes;
and the extent to which the population will have skills and attributes
to take jobs. This is all incredibly complicated. Moreover, it is
necessary to track these decisions through time as different kinds of
change will operate to different time scales and respond to different
factors.
Both a steering group and a peer review group oversaw this
process, and both essentially concluded that the modelling was
interesting but that it was impossible to know whether it properly
captured what had happened in the past, let alone that it could
show what would happen if changes were made. The process of
validating a model to see whether it captures the key features of
reality is clearly an important test. No-one could see how to
properly undertake this. Moreover, there were many areas where
there was no real data that could be used to make such a test. For
example, there is no data to speak of on how businesses trade with
30 | Planning Curses
each other across regions, let alone across smaller areas. And there
is little information on the speed with which people react to
different changes. The transport models assume that people will
always find and use the least costly methods; in practice they almost
certainly do not if only because the time involved in
experimentation is too costly.
It was my conclusion that the policy test that had been devised
was simply too hard to meet. It would never be possible to ‘prove’
that the Thames Gateway Bridge would create ‘sufficient’ jobs. Since
moreover the concerns about congestion at the southern end of the
Bridge put on continued pressure to raise tolls and reduce the
number of people using it, it became apparent that it would be
necessary to think again about how to solve the lack of connection
between the north and south parts of East London.
This process is still ongoing, with proposals for swing bridges,
ferries and cable cars being made for various parts of the river.
Regional spatial plans and forecastsThe edifice of regional spatial planning has begun to be unpicked.
Yet there are many who still have faith in such plans and the necessity
of taking a rational view on what is needed in their region or
community. It is clear that planning control leads to wanting to take
a view on how things ‘should’ develop. To this end, there is a huge
reliance on the views of experts. There are several specialist firms
who will prepare a forecast for employment and output, and will
identify growth sectors to help guide policy.15
But there is a big problem. Such forecasts are inherently
uncertain and become more difficult at smaller areas of geography.
They may be interesting but cannot be a sure guide for many
reasons. First, the only guide we have to the future is the past.
Clearly the future will not be like the past, but it is a judgement call,
not a scientific exercise, to decide in what ways the future may be
Examples | 31
15 I formed one of these
myself back in the late 1980s.
different. Thus the most rational view of the long-term future is to
examine the past trends. This is what underlies, for example, the
London Plan. Incidentally this also requires long-term data – a plan
for the next ten years should be based ideally on at least 30 years
of past data.
Such data is not generally available in anything like a truly reliable
form. We now have 40 years of London data, but this has been
constructed from a number of sources and surveys which do not use
the same method of data collection. Moreover some years are
interpolated between years in which data was actually collected to
provide an estimate. It is unknowable what the scale of errors is
here, but this data is the best we have.
This data must be used to construct a forecast on which to base a
plan. This is of course essential for any activity. Businesses as well
as spatial planners need to take a view of the future in order to make
decisions. The trick is to create the right framework and to have an
idea of the robustness of your views and the risks of being wrong.
A top down planning system lacks these controls because there is
never any bottom up check. As more detail is added the scope for
error is buried under detail.
The process generally works as follows. The most common way of
thinking about the prospects for a local economy is to take a national
view, sector by sector, and break this down into a regional view – say
for the South East. The South East will then acquire its share of UK
growth, probably adjusted for its past changes in share. This is
known as shift share. Many models will have more local drivers, but
generally the adding up process will moderate such local effects. For
more local economies, where often the data has a lot of noise which
makes for big variations, a straight share will be taken.
There are two significant problems here. First, any forecast based
on a model implies that what we are interested in – for example
output – is driven by some underlying factors. So to provide the
forecast, we need first to forecast these drivers. By a process of
32 | Planning Curses
recursion, we arrive at the drivers that the model does not forecast.
These become the assumptions which create the drivers to create the
variable of interest. These assumptions are both crucial and a matter
of judgement – clearly since they are outside the model. What they
are and how they are made is the most important aspect of the
forecast and yet these assumptions are normally hidden or unclear
and lack transparency. Even when they are clearly set out, it is a moot
point who is best placed to make them and what the range of
potential assumptions ought to be.
Moreover, this whole process equally relies on the correct
interpretation of ‘drivers’. In any forecasting model there are
errors. Not all the history of the variable we are interested in is
explained by those drivers we have managed to identify. So even
if we have a reliable forecast of the drivers, there is still something
– and potentially quite a lot – missing. Indeed in many cases,
exchange rates are a notable example, the best forecast of
tomorrow’s exchange rate is simply today’s. On occasion this will
be blindingly wrong, but it still the most reliable best guess. In
other words, it is the history of the variable itself which provides
the best method of thinking where it might be going, regardless of
worrying about what drives it and how to forecast the drivers of
the drivers and so on.
This approach has been used for the past eight years in London,
by identifying long-term productivity trends and using these to
identify likely employment growth, in spite of the big swings in
total employment. This procedure has abstracted from the cyclical
impacts and has therefore both under and over predicted for
particular years. However, it has provided a stable base for
forecasting which has moved in only a narrow band as the London
economy has evolved over the last eight years. In the first
incarnation of the analysis, data was only available for 2000; it is
now available for 2008. Note that detailed data for 2009 will only
become available at the end of 2010.
Examples | 33
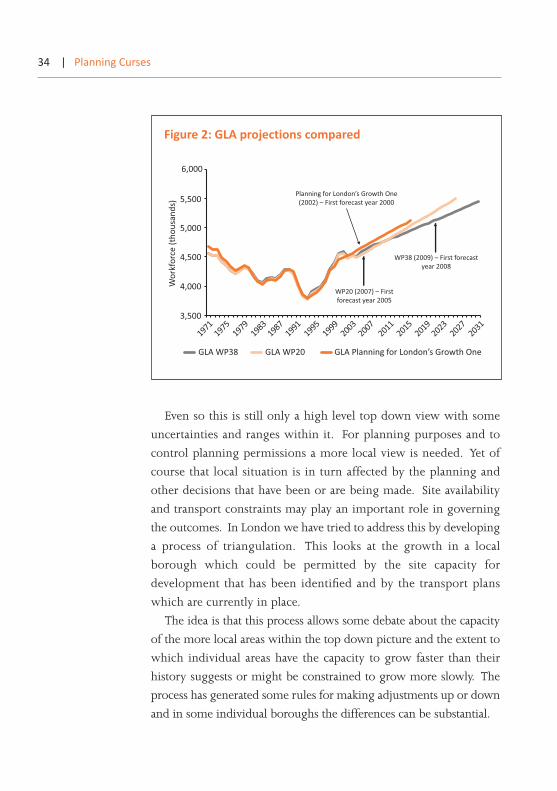
Even so this is still only a high level top down view with some
uncertainties and ranges within it. For planning purposes and to
control planning permissions a more local view is needed. Yet of
course that local situation is in turn affected by the planning and
other decisions that have been or are being made. Site availability
and transport constraints may play an important role in governing
the outcomes. In London we have tried to address this by developing
a process of triangulation. This looks at the growth in a local
borough which could be permitted by the site capacity for
development that has been identified and by the transport plans
which are currently in place.
The idea is that this process allows some debate about the capacity
of the more local areas within the top down picture and the extent to
which individual areas have the capacity to grow faster than their
history suggests or might be constrained to grow more slowly. The
process has generated some rules for making adjustments up or down
and in some individual boroughs the differences can be substantial.
34 | Planning Curses
Planning for London’s Growth One (2002) – First forecast year 2000
WP38 (2009) – First forecast year 2008
WP20 (2007) – First forecast year 2005
6,000
5,500
5,000
4,500
4,000
3,500
Wor
kfor
ce (t
hous
ands
)
GLA WP38 GLA WP20 GLA Planning for London’s Growth One
19711975
19791983
19871991
19951999
20032007
20112015
20192023
20272031
Figure 2: GLA projections compared
For example, the trend in employment in Croydon has been
downward for some years. But it has transport capacity and site
availability. The overall judgement is that this should make it possible
for Croydon to reverse its past trend over the next 20 years. The rules
which bring the three pictures together however are exactly that –
and we do not really know whether it will be possible for Croydon
to buck its past trend and whether the investment to make it happen
will actually come forward.
This makes it particularly worrying when such analysis can be
taken down to even more local level. An arithmetical exercise can be
used to produce a share for any local area. It requires only a small
step to say this is the ‘need’ for employment in this area. Such
analysis can be used to refuse a planning permission or to restrict
future development. This is what often happens once the projections
have been prepared.
At one sub-regional Planning Inquiry the challenge to the
projections being used to restrict local plans was met by the defence that
the projections were the best available as there had been a competitive
tender to provide them. At another, the defence of the projections was
that they had been reviewed at a previous Inquiry. The process clearly
becomes entirely circular. The outcomes for growth in any area will
depend on investment by developers, employers and others. But when
such investors come forward for planning permission they are quite
likely to be told that the planning process has not identified demand for
investment in this area and so such growth cannot be permitted. If not
exactly a Catch-22, it can certainly feel Kafkaesque.
Even the attempt to open up the local projection process to
triangulation does not always help to open up the discussion – the
developers for Earls Court are concerned that the London numbers
apparently suggest that there is only a ‘need’ for 7,000 jobs there,
based on the projections for financial and business services and the
local triangulation process. This illustrates how hard it is to escape
the belief that we can correctly plan.
Examples | 35
Only the best will do – cement productionThe protection of the Green Belt comes pretty high on most people’s
list of priorities. The desire to prevent urban sprawl is one aspect
and so too is a focus on the need for ‘green space’. Of course, the
protection is not absolute. Though the Green Belt was designed to
limit the suburban spread and the intrusion of individual gardens
into the general greenness, there are permitted activities. A
racecourse is fine, though a visitor stand is not. Extraction of
minerals is fine, so long as it fits in with a previous plan, but building
in a worked out quarry is not.
This gives rise to some dilemmas. The Bluewater shopping centre
in North Kent is built in a worked out chalk quarry – Western Quarry
– while Eastern Quarry next door is to become a new residential
settlement. Next door to that is Ebbsfleet, now a station on the
Channel Tunnel Rail Link to the continent and where you can catch
a commuter train to St Pancras which takes 20 minutes. All of these
sites are in the general area of the Green Belt. Indeed the entire M25
runs in and around the Metropolitan Green
Belt, since this provided an unbuilt up area in
which to build it. Purists argue that it should
be sacrosanct, but the areas on the edge of
cities are not virgin forest but need continued
management and to be economically
supported. The worked out quarries in Kent
have been able to support replacement activity
and new opportunities. The difficulty was not just what to do with
the worked out quarries but also how to ensure that there was a
continuing supply of the raw material being mined there.
Planners did identify this requirement and had designated areas
for extraction of chalk somewhat further east on the Medway. All
fine, as such extraction is permitted, and indeed there were further
proposals for how the quarry could be reinstated as green space once
it had been worked out.
36 | Planning Curses
““We argued at the Inquiry thatwithout this plant, cement wouldprobably be imported fromGreece. That is now whathappens ””
But the raw material is only part of the story. A plan for this is no
use without a plan for how to use the raw material which is the main
element in cement production. North Kent has been a traditional
source of Portland cement for the South East and London because of
its chalk supply. The company, Blue Circle, proposed to close the
Northfleet plant which used the Eastern Quarry chalk once it had
been exhausted and to build a new, state of the art, plant near the
new permitted supplies on the Medway.
While extraction is permitted, however, a cement plant is a
different matter. Extensive plans were drawn up in the mid 1990s
for a cement plant which would take minimum space, which could
be removed at the end of its life and which would minimise its
impact. Alongside this, proposals for the redevelopment of Northfleet
– a large, crumbling, old Thamesside location – were drawn up.
The company tried to focus on the best potential use of its assets
for the whole of North Kent and established partnerships with local
councils and community groups. This was the wrong approach in
planning terms. The Inquiry into this proposal required that the
production of cement should be reviewed on a regional basis and
the plant in this location could only be permitted if it could show it
was superior to all other potential locations in the region. This was
to apply regardless of ownership of the sites, or whether the mineral
resources had been given permission for extraction.
Those who had been working on this project were devastated. They
had been thinking both for the region and the communities in which
they operated and in the context of the regional need for the product.
Now the rules gave a different slant and produced a test that was hard
to meet. There is lots of chalk in the South East. Its geological
description and potential for access had to be mapped; likely sites for
cement production identified and transport routes assessed. Inevitably
this could only be done at a relatively high level and there was a
continuous risk that more analysis would be required or that the policy
test that the development had to pass would be changed again.
Examples | 37
Eventually, after a process that took some seven years, permission
was finally granted. But by this time, the company had been taken
over. The new owners could probably see how difficult production
in the UK is. We argued at the Inquiry that without this plant,
cement would probably be imported from Greece. That is now what
happens, as the new owners did not proceed with the previous
owners plans.
Canary WharfLondon’s Docklands started to decline after the Second World War,
when the Dock Labour Scheme designed to keep workers in the
docks turned into a set of practices which made it hard for London’s
docks to compete with unregistered ports. The advent of
containerisation and the need to house larger ships provided the kiss
of death; most of London’s docks had closed by 1970. The Isle of
Dogs was particularly hard hit as its communities lay on a spur
between the Indies’ docks and the river. Proposals for regeneration
and redevelopment were the subject of as many rows as plans.
Finally in 1981 the London Docklands Development Commission
was given planning powers and tax breaks to make possible
redevelopment across the dock areas. The original plan for the Isle
of Dogs was for light industrial use, supported by a small scale light
railway – the Docklands Light Railway (DLR).
This was a low-rise plan at low density – with the aim of
generating lower skill level jobs. In other words, it was to continue
the Docklands in industrial use. Some of the buildings erected in
pursuit of this plan are in still in existence.
So the implementation of a completely different scheme rested
on the vision of private sector developers. Canadian developers came
along with a high tech, high density, high value scheme to create a
business district on a North American model. Now we are all used
to the existence of Canary Wharf, and indeed its sibling buildings in
38 | Planning Curses
the City, it is hard to remember just how shocking this idea was and
how revolutionary. Even as the buildings went up, it remained hard
to believe that this was actually in London, it seemed so alien.
Construction work started in 1988 on Canada Square and Canary
Wharf, even as negotiations continued about how to get people in
and out. The DLR was not going to be adequate and the developers,
Olympia and York, proposed a railway from Waterloo to Canary Wharf
and Greenwich via London Bridge which they would finance at a cost
of £400 million. However, London Transport wanted something
more ambitious and proposals for extensions to the Jubilee line had
been floating around for some while. The compromise was that O&Y
would still contribute £400 million to a much more expensive
railway which would extend west from Waterloo to Green Park and
east to Stratford from Greenwich at a cost of £2 billion. This was
agreed in 1990, even though the project passed no cost benefit tests.
The official models suggested that the spend would generate fewer
benefits than its costs and it was only the intervention of the Prime
Minister, Margaret Thatcher that pushed it through.
The rest is history. The recession of the early 1990s bankrupted
O&Y and the state bought in the project, privatising it again later.
The Jubilee line’s access to Greenwich became part of the
Millennium Dome project which gave it a deadline which it
struggled to meet alongside massive cost overruns which nearly
doubled the budget to £3.5 billion. O&Y paid less than half of their
agreed financial contribution.
Nevertheless this chapter of accidents, mismanagement and poor
benefit ratios is a great success. More recent reworking of the
numbers, with what we know about the costs, and know about the
uses shows that it would now pass the official tests – which require
benefits to be at least twice the costs. London has gained a new
business centre, generating incomes, profits and tax revenues. Many
also think it shook up the City of London itself to be more flexible
in allowing the kind of buildings that occupiers want.
Examples | 39
Banks, lawyers, accountants, regulators have all occupied this new
business district. Like railways, the occupiers have seen greater
benefit than the investors. Most investors in the railways lost their
money. But the creation of the infrastructure and the network made
possible the boom in trade that fostered the first industrial nation.
The intense competition meant it was consumers – railways travellers
and occupiers of business space – who benefited. Real rents in the
City have barely risen over the last two decades and from being more
expensive than Westminster are now beneath it. This has helped
support the growth of London’s employment and UK GDP. None of
it would have happened unless the Prime Minister of the day had
been prepared to break the rules and allow the transport
infrastructure needed to support the investment.
40 | Planning Curses
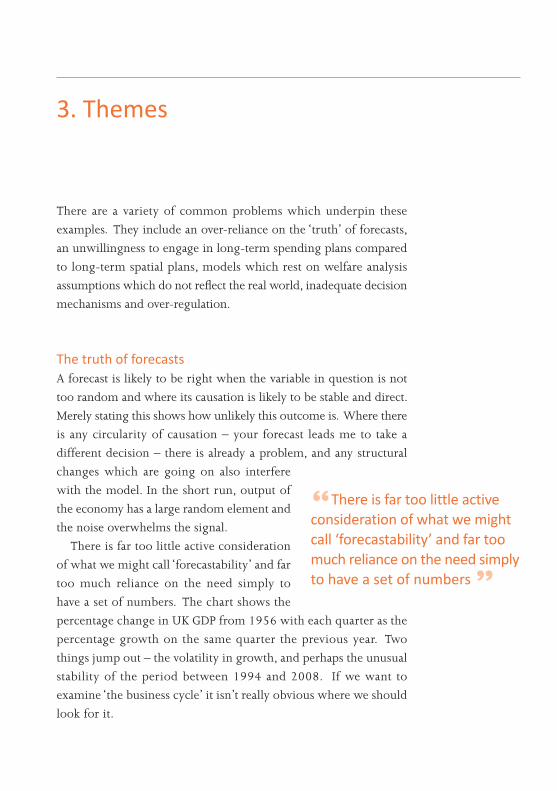
3. Themes
There are a variety of common problems which underpin these
examples. They include an over-reliance on the ‘truth’ of forecasts,
an unwillingness to engage in long-term spending plans compared
to long-term spatial plans, models which rest on welfare analysis
assumptions which do not reflect the real world, inadequate decision
mechanisms and over-regulation.
The truth of forecastsA forecast is likely to be right when the variable in question is not
too random and where its causation is likely to be stable and direct.
Merely stating this shows how unlikely this outcome is. Where there
is any circularity of causation – your forecast leads me to take a
different decision – there is already a problem, and any structural
changes which are going on also interfere
with the model. In the short run, output of
the economy has a large random element and
the noise overwhelms the signal.
There is far too little active consideration
of what we might call ‘forecastability’ and far
too much reliance on the need simply to
have a set of numbers. The chart shows the
percentage change in UK GDP from 1956 with each quarter as the
percentage growth on the same quarter the previous year. Two
things jump out – the volatility in growth, and perhaps the unusual
stability of the period between 1994 and 2008. If we want to
examine ‘the business cycle’ it isn’t really obvious where we should
look for it.
““There is far too little activeconsideration of what we mightcall ‘forecastability’ and far toomuch reliance on the need simplyto have a set of numbers ””
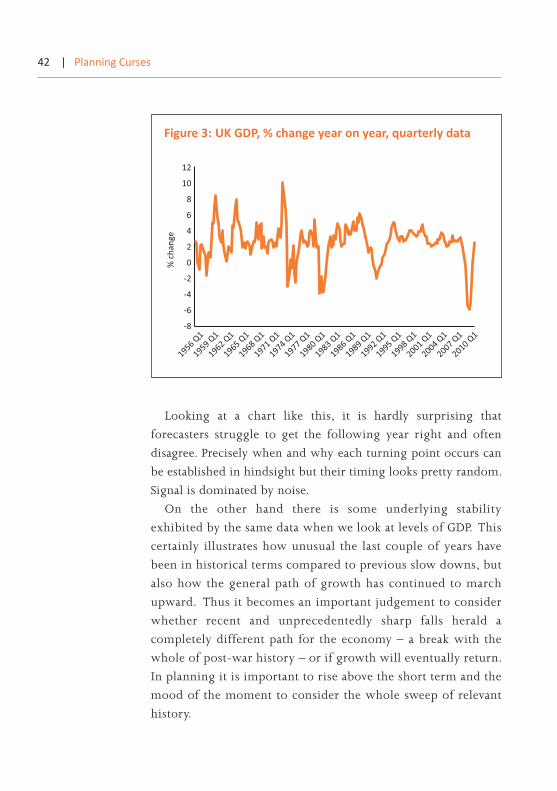
Looking at a chart like this, it is hardly surprising that
forecasters struggle to get the following year right and often
disagree. Precisely when and why each turning point occurs can
be established in hindsight but their timing looks pretty random.
Signal is dominated by noise.
On the other hand there is some underlying stability
exhibited by the same data when we look at levels of GDP. This
certainly illustrates how unusual the last couple of years have
been in historical terms compared to previous slow downs, but
also how the general path of growth has continued to march
upward. Thus it becomes an important judgement to consider
whether recent and unprecedentedly sharp falls herald a
completely different path for the economy – a break with the
whole of post-war history – or if growth will eventually return.
In planning it is important to rise above the short term and the
mood of the moment to consider the whole sweep of relevant
history.
42 | Planning Curses
12
10
8
6
4
2
0
-2
-4
-6
-8
1956 Q1
1959 Q1
1962 Q1
1965 Q1
1968 Q1
1971 Q1
1974 Q1
1977 Q1
1980 Q1
1983 Q1
1986 Q1
1989 Q1
1992 Q1
1995 Q1
1998 Q1
2001 Q1
2004 Q1
2007 Q1
2010 Q1
% c
hang
e
Figure 3: UK GDP, % change year on year, quarterly data
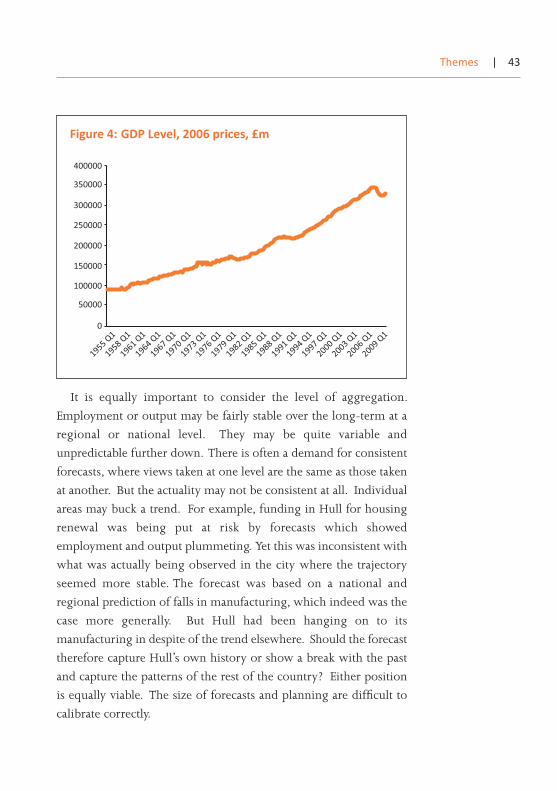
It is equally important to consider the level of aggregation.
Employment or output may be fairly stable over the long-term at a
regional or national level. They may be quite variable and
unpredictable further down. There is often a demand for consistent
forecasts, where views taken at one level are the same as those taken
at another. But the actuality may not be consistent at all. Individual
areas may buck a trend. For example, funding in Hull for housing
renewal was being put at risk by forecasts which showed
employment and output plummeting. Yet this was inconsistent with
what was actually being observed in the city where the trajectory
seemed more stable. The forecast was based on a national and
regional prediction of falls in manufacturing, which indeed was the
case more generally. But Hull had been hanging on to its
manufacturing in despite of the trend elsewhere. Should the forecast
therefore capture Hull’s own history or show a break with the past
and capture the patterns of the rest of the country? Either position
is equally viable. The size of forecasts and planning are difficult to
calibrate correctly.
Themes | 43
400000
350000
300000
250000
200000
150000
100000
50000
0
1955 Q1
1958 Q1
1961 Q1
1964 Q1
1967 Q1
1970 Q1
1973 Q1
1976 Q1
1979 Q1
1982 Q1
1985 Q1
1988 Q1
1991 Q1
1994 Q1
1997 Q1
2000 Q1
2003 Q1
2006 Q1
2009 Q1
Figure 4: GDP Level, 2006 prices, £m
Another example is Hounslow, which lost 40,000 jobs between
the late 1980s and the mid 1990s and then gained 30,000 back
again by the turn of the century. Should this strong variability be
part of a future projection, or should we try and abstract from this
over the longer term? There is no right answer – planning for
variability is extremely hard to do in spatial terms, but on the
other hand its existence would lead you to foreground a need for
flexibility.
Calculating the benefits of any scheme where such variability
exists becomes quite problematic. How fast a development fills up
is crucial to the finances of a scheme, and it was the recession of the
early 1990s which created large scale bankruptcies as developers
who had counted on early occupation found themselves with no
cash. The public sector runs out of cash with more difficulty, but
equally deals struck on affordable housing with developers suffered
a similar fate over the last few years as developers simply did not
have the cash.
Welfare analysis assumptionsPublic investment criteria are based on the principles of economic
welfare analysis. This method of analysis is not to be confused with
welfare as it might more normally be thought of as helping people
out. The concept here is more subtle. In economics, your welfare
is the benefit that you get from consuming something over and
above what you paid for it. Of course, for you it might be marginal
– you are only just willing to pay £1 for an ice cream. £1.01 would
put you off altogether. So the benefit to you of the ice cream is
exactly the price. But there might be many people who would have
been willing to pay £1.01, or even as much as £2. But they only
had to pay £1. The difference is a welfare benefit which comes
from paying less than you would actually have been prepared to
pay.
44 | Planning Curses
It is clear that if the ice cream seller could identify the different
prices that different customers were willing to pay, his profits
might be a lot higher, and the consumer benefit would be less.
The total amount of benefit would still be the same but it would
be distributed differently. The next time you check out an airline
web site, remember that this is what they are trying to do. They
have an aeroplane making a particular flight but many reasons
why individual passengers want to fly and prices they are willing
to fly at. Most aeroplanes end up flying a group of people who
have all paid different prices for their flight. However, the welfare
might be larger still. It is entirely possible that those who have
paid a lot would have paid more, while those who paid hardly
anything could have been very easily put off with even a small
price rise. It is not necessarily unfair that some pay more than
others.
This concept of a welfare benefit obviously comes into its own
when we consider products for which there is no price but which
nonetheless cost something to provide. It is not surprising that this
approach gained currency in considering road usage when people
wanted a way of judging whether a project was valuable or not. They
used the concept of welfare or consumer surplus to form such
judgements, trying to estimate the price people would be willing to
pay to use the road. This is where the value of time comes in. The
willingness to pay reflects the value that you might put on being able
to use the new road compared to an existing one.
A private sector investor could only afford the investment if they
could be sure of a monetary return. The public sector investor needs
no such requirement. Instead they can work on the implied benefit
of the consumer surplus without worrying about the cash. We are
investing our funds to improve the quality of life.
So here is the justification of the methodologies which we
observed earlier in which we compare equilibrium outcomes of
different situations – do nothing versus do something – and ask who
Themes | 45
will be better off and by how much. In transport terms this is based
on time savings, with trips given by the underlying forecasts. Time
savings are ascribed a value with no consideration of whether these
trips will actually be made and what their value to the economy in
monetary terms might be. This applies whether or not there is an
actual price to be paid.
And there is always a price. To use the roads one must have a
vehicle, must maintain, fuel and insure it, and pay probably to park
it as well. To use the trains or buses, one must buy a ticket and
also get to the station or bus stop. Of course in the first instance,
the costs do not get passed onto the provider of roads – except
there is road tax, fuel duty and sales tax on vehicles. Bizarrely, one
rule of appraisal has until very recently stated that investment in rail
projects must account for the loss of tax revenue on fuel duty if it
results in a shift away from the car to rail. The idea that the rail
investment might generate new jobs, and hence new taxes, was
absent however.
The assumptions required to define the ‘do nothing’ case are
quite onerous and it is exceptionally hard to prove that any
investment is actually ‘needed’. The role of agglomeration and
other processes that happen over time are easily ignored, while the
equilibrium assumptions imply that the status quo is somehow
desirable.
Feedbacks, time steps and the disequilibrium of the real world are
all ignored, while analysis rests on ‘funny money’ rather than the
real stuff which will pay for the investments. These criticisms
particularly apply to transport assessments but also to all the
principles of judging ‘need’.
Unwillingness to spend long-termIt is often said that government is able to take a longer term view
than individuals or businesses. The Treasury Green Book is the bible
46 | Planning Curses
for those assessing public sector projects. It takes a 60 year view of
projects and has a correspondingly low discount rate. The discount
rate measures how much less valuable the future is than the present.
In one sense it can measure how we value future generations
compared to those alive now. One of the major criticisms of the
Stern report on Climate Change is that it took such a low discount
rate that future generations, who would be richer, were given more
weight than poor people now. This is a result of setting a discount
rate lower than the long-term average growth rate and it means that
poor people need to pay now to prevent damage to rich people in
future generations.
A 60 year view is certainly rare among businesses when they are
doing investment appraisal. Generally the discount rate for a
business will reflect its cost of funds which are higher than those in
government. The Treasury has set a discount rate of 3.5% falling to
3% after 30 years. A business is unlikely to go below 10%. At 3.5%,
£100 has lost half its value in 20 years. At 7.5%, it only takes ten. If
this is the cost of finance, then payback needs to happen over the
first ten years – this is not short termism, it is just how private
finance operates.
However, considerations of payback are only part of thinking
about investment. Although the state is permanent, governments
are not and mostly they do not expect to be. Businesses on the
other hand work to ensure their continuous existence. However
it is true that most of the giant companies at the beginning of
the 20th century no longer exist. Even if their names still resonate
– like General Electric for example – what they do has completely
changed. The rail companies and the steel companies have long
gone. The oil companies have survived so far but again they
depend for their continued long-term existence on the ability to
invest. While individual projects may be assessed to pay back in
the short term, they are part of a plan to help guarantee continued
existence of the business in the longer term. Government on the
Themes | 47
other hand does not often have to fight for its actual existence.
The states of the developed world have got used to their
guaranteed existence and their ability to tax and spend. This is of
course in turn why their cost of finance is low and their credit
ratings high. Lenders too expect states to continue to exist and
to pay their bills.
Governments on the other hand have a much shorter horizon
and find it hard to make long-term decisions where part of the
payback generating incomes and taxes will occur after the political
careers of the protagonists are long gone. Short term
considerations can particularly dominate when you are spending
other people’s money. Notoriously, the decision to build the
Humber Bridge was taken in order to support a by-election Labour
candidate in 1966. The decision to ensure that the local people
would, as Barbara Castle promised, ‘have your Humber Bridge’ was
announced just before the Hull North by-election of 1966, which
was subsequently won by Labour and ensured they clung on to
their small Commons majority. Crossrail too has been bedevilled
by different political cross currents and the recent change of
government has meant that the numbers are being looked at yet
again. It seems impossible to take a decision and then stick to it
amidst the political cut and thrust. Yet it is not inevitable that
politics imposes short term decision making. It seems to be partly
the result of the particular political process in the UK, because
other countries appear to be able to take a longer term view which
survives changes in government. Even in the UK, the plan to
construct the motorway network managed to survive changes in
government, even if details were redefined as the process went
along. The recent report on High Speed 2 – the proposed railway
line from London to Birmingham – reprinted the hand drawn map
of the motorway network a group prepared back in the 1940s. On
the other hand, it certainly took decades to deliver and is still
incomplete.
48 | Planning Curses
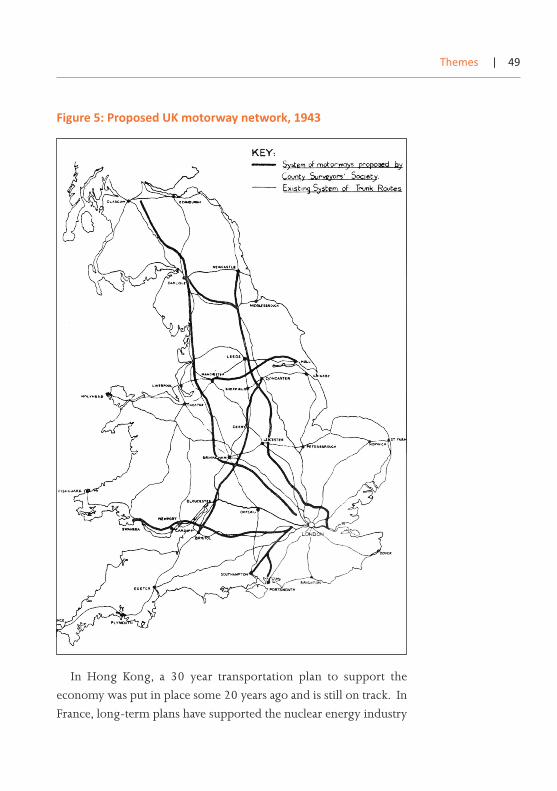
In Hong Kong, a 30 year transportation plan to support the
economy was put in place some 20 years ago and is still on track. In
France, long-term plans have supported the nuclear energy industry
Themes | 49
Figure 5: Proposed UK motorway network, 1943
and high speed networks. In the UK, spending priorities have been
based more squarely on a narrowly defined definition of ‘need’ with
faster growing areas squeezed for cash and deprived of the
investment which can help grow the tax base. Crossrail has been
recommended by numerous strategic studies over the years, but is
still to be implemented. It remains to be seen whether the same
issues will bedevil the High Speed Network.
Inadequate decision mechanismsInvestment decisions by the public sector are generally taken in an
ad-hoc fashion. This seems to be the result of the tension between
technocratic processes and political pressure. The existence of
technical models which purport to give priorities to projects but
which need a priesthood to understand means that in reality
decisions become political. A good example is the decision to build
the Jubilee line extension, which was taken despite of the
technocracy and on the basis of a judgement of economic prospects
which had no place in the formal modelling.
On the other hand the politics can get in the way of any
economic rationality. Crossrail has required a huge coalition of
partners in order to generate the necessary political support. This
has been both very costly and time consuming. The Thames
Gateway Bridge on the other hand had a more mixed set of
supporters and opponents and so a Public Inquiry was required to
resolve the decision to have such a crossing. Arcane models battled
with technocrats arguing the case on both sides, while the political
process had only a tangential role in creating the parameters which
set up the whole Inquiry.
The Inquiry process itself creates an atmosphere of confrontation,
with lawyers, cross-examinations and oppositional tactics which can
last a long time. That for the Thames Gateway Bridge lasted a year;
the Heathrow Terminal 5 Inquiry five years. Often by the time the
50 | Planning Curses
Inquiry is over, circumstances have changed and opportunities lost,
as happened with the cement plant in North Kent.
Between political negotiation and technocratic decision making
there is a big gap. If the models were only seen as exploratory and
partial, it would be much easier to use them as tools to play with
rather than tools for answers and this would give much more
potential for processes to help create consensus rather than
processes to create divisions which can only be resolved by direct
intervention.
A case in point is the current debate over High Speed Rail. The
case for High Speed Rail rests on some interesting assertions. One
is that the UK must have such railways, since we must keep up with
the Joneses – everyone else already does. Another is that we are
running out of capacity on the existing network so that more is
essential, and it should therefore also be high speed. A third is that
reducing the effective distance between cities will increase
economic growth. These arguments are all different and create
different bases for both cases and their routes. We have not yet really
tested the third argument. The existing guidance on agglomeration
for example is essentially based on increasing commuter networks.
It is not at all obvious you can apply it to bringing cities closer
together.
If we are running out of capacity, then more is clearly an option,
but then there is the question of speed. High speed trains do not
stop often. If they do, they cannot get up to speed. A high speed
train to Scotland should not stop more than twice on the way if it
is really to maximise the advantage of speed. This means that places
now getting intercity services would only remain on the older
network. What are the advantages and disadvantages of this?
Maintaining more connections is more expensive of course, and
this still needs debate. However, this debate is not very visible or
clear. Instead it has focused simply on whether or not we can
afford it.
Themes | 51
This is risible. The UK is one of the largest economies in the
world, but often behaves as if it were quite small. While of course
investments should be carefully appraised, the scale of such
investments is small in comparison to much of government
spending. The maximum investment in Crossrail for example is
around £5 billion in a single year. This is less than 1% of government
spending and moreover generates a financial
payback. Of course we should be able to
afford it.
The issue at stake is much more about why
we might want to do something and therefore
what it achieves. A comprehensible decision
process operates in stages, from decisions in principle to decisions
about methods and of detail. By contrast, the technocratic method
delivers a take it or leave it package in which all of the options have
been resolved inside the expert bureaucratic machine. This is
generally confusing for ordinary mortals whose lives will be affected
as they cannot easily separate out the levels of decision making. Yet
it is perfectly possible to unpack these elements if we are prepared
to present more strategic analysis.
An example is the way in which high speed rail has been
presented, where the only choice on offer is whether to build a
railway to Birmingham or not, and some detail on the route. The
options of how near this should go to city centres, or whether other
cities are equally important is outside the scope of discussion. The
project is presented as a single package, even though different
principles apply to different segments. For example, sending a
railway line to the outskirts of a city is relatively straightforward. The
benefits are distributed across the whole economy, so the public
sector should pay. Sending lines into the centre of a city is a much
more complicated proposition. This is why London’s mainline
stations were placed on the edge of the central city of the day. It was
much too expensive to pull down valuable real estate.
52 | Planning Curses
““Splitting large projects intocomponent parts enables a muchmore effective debate aboutwhat the country wants ””
Each city centre access, to Birmingham, Manchester, or anywhere
else should therefore be separately evaluated rather than part of a
take it or leave it package. Trains of course pay for themselves –
people buy tickets. The private sector can bid for franchises, and buy
or lease the rolling stock. Splitting large projects into component
parts enables a much more effective debate about what the country
wants. It creates projects which make it much clearer who should
pay for them.
A further example of an area where debate is badly served by the
technocracy is aviation. The assessment of future demand is
surrounded by hard to understand assumptions while the role of
aviation in the economy is nowhere evaluated. When communities
understandably set their face against new runways at either Heathrow
or Gatwick airports, there is no place where a debate about the trade-
offs between noise, congestion and pollution, leisure and business
need to fly, and the cost of associated infrastructure can take place.
Over-regulationThere is great reliance in the UK system on the ability of the man
from Whitehall (or some quango) to know best. He or she will have
models, expert knowledge and will believe that the public’s or
business’ preferences are somehow imperfect and shortsighted. I
frequently hear that information should not be given to the public
because they might draw the wrong conclusions. If people knew
how much they got back for the taxes they pay, they might be less
willing to pay it, goes the argument. This is not only antidemocratic
but also rather demeaning.
If the only route by which people can be persuaded to support the
poor and needy is by lying to them about how much it costs, this is
not a good basis for social cohesion. It also privileges the role of
the expert. This is not to say that nothing should be confidential,
but it is also to say that citizens do have the capacity to engage in the
Themes | 53
strategic debate. The duty to present such debate potentially lies with
all of us, but especially with those who have access to the data.
However, a system that believes in experts and their ability to
know best has a strong incentive to create small groups which focus
on setting closer and closer supervisory rules to reflect their expert
knowledge and understanding. At one level this produces an over-
reliance on models, largely because experts like models. In some
regulatory areas, this creates disbelief and even despair. For example,
in most privatised industries there is a regular review at which price
controls are set. These reviews are based on the regulator’s views of
what the industry ought to charge and these in turn are based on
economic models of rates of return. Often these can bear little
relation to the industry as it appears to the practitioner. At one level
we have created a whole new industry here. There are several
consultancies which have been created entirely around the need to
develop models for both the regulator and the business to enable
this negotiation to take place. But the battle of the models is not a
transparent or accessible way to debate.
The battle of the models also creates a desire to produce the
perfect answer – even when this is entirely impracticable or
impossibly expensive. In the Crossrail case, larger and larger benefits
could in theory be created with larger and larger projects. The
likelihood of these being agreed to was close to infinitesimal but
much time was spent nonetheless.
A possibility of a perfect answer implies the possibility of a perfect
world. Perfect worlds are static because risk and uncertainty have
disappeared. These are not the worlds we live in and indeed risk and
change are essential to improvement and growth. Regulation is
always searching for the answer that will remove risk and prevent
mistakes. Yet if risk is to be managed rather than removed, regulation
has to allow risks to be taken. When risks are apparently the
concern of the regulator they are no longer the concern of the
practitioner. Saying no is much easier than taking responsibility for
54 | Planning Curses

saying yes. Moreover, once something is permitted, it has then to be
managed on the ground and in real time. All of this becomes more
difficult when regulations get in the way. Northern Rock went bust,
but its regulator had looked at all its policies and processes and
declared them sound. Their models for measuring risk had been
signed off at an early stage. But the strategic risk required a more
strategic management and it was this that was missing.
Themes | 55
4. How to Improve Things
A perennial problem does not have a silver bullet answer. There is no
wand that can be waved to change the British system from one of
centralised bureaucracy and technocratic decision making to a more
nuanced and effective one.
However, there are a number of changes in process that would
help us along the way. Underlying all these suggestions is a bigger
plea – to liberate us from the expert. I am an expert. I give expert
witness statements at Planning Inquiries, I have represented
businesses in competition cases and I have been making forecasts for
many years. I have learnt that experts can only know part of the story
and the challenge is to include everybody’s expertise.
It is heartening that louder criticisms are being heard of the
appraisal mechanisms that are currently used. Network Rail has
published a very helpful study which also outlines some of the same
issues as outlined in this report. However, their recommendation
for a new framework has some of same weaknesses as its
predecessors in terms of creating a different global framework as
reliant on outdated modelling approaches.
We have to learn to get more flexible – and here are four
suggestions for how to do this:
Ask the right question A focus on the real and monetary benefits which projects bring will
produce business cases which make sense to more people,
particularly in business. Starting with the real money benefits will
allow investors, voters and decision makers to be clear about what
the investment is intended to achieve and how it will or will not pay
back on the investment. Business cases would then reflect good
private sector practice and ask what output and taxes will (probably)
be generated. Cases prepared in this way will be more familiar to
more people who will then be able to debate them more sensibly.
The same applies to plans for development and for zoning. An
understanding of the fiscal benefits of allowing for growth – and
who gets them – will enable a much more reasoned debate on
housing, employment and other forms of development.
Of course there are other benefits apart from monetary ones.
These too need to be identified and to be assigned to the groups that
will likely receive them. We already have plenty of tools to do such
studies – but we must accept that they will be more strategic and
probabilistic than the current cases.
Engage business and business concepts The introduction of PFI, PPP and their various relatives was of course
intended to engage business. However, they have recently got a bad
name and are presented as continuing and unnecessary calls on the
public purse. So commentators write of the revenues from the M6
Toll Road as if they were money for old rope. Of course, now the
project is up and running it can seem like that. But at the beginning
the risks of planning and implementation were huge. Even now the
rate of return is not high but it has the benefit of being stable and
certain and a good long-term investment for a pension fund. There
should be nothing wrong with this. The return at the outset was
uncertain and is even now only OK.
Although using these mechanisms as a version of sleight of hand
to move assets to someone else’s balance sheet is not a good basis for
decision making, the identification of sensible projects with
manageable finance streams offers real opportunities for better
project management and delivery. This means that project design,
implementation and output delivery can be well defined and carried
How to Improve Things | 57
out if there is clear understanding of where the boundary between
public and private is set. For example, Canary Wharf Group is
undertaking the construction of the new Canary Wharf Crossrail
station, offering a lower fixed price than the general contractors and
building on the group’s experience in building in disused docks.
Breaking up contracts into constituent parts and allowing value-
based engineering to refine project requirements can all improve
value for money.
Project delivery and management are massively important in cost
control and investment management. There is no reason why private
investors cannot own trains and run train services. Private investors
already run major activities of all kinds. They sometimes do it better
than at other times, but certainly do so no less reliably than the public
sector and private sector operators actually are subject to far more
controls.
Developing partnerships which operate from the inception of
infrastructure and other developments can deliver better design,
cheaper projects and outputs which are closer to consumer needs.
Create long-term frameworks rather than plans Eisenhower apparently said that planning was indispensable but plans
were useless. A planning framework recognises this. This is not the
same as creating endless complex scenarios but about creating a
vision and direction of travel into which individual projects can fit
over time. It is more about the abolition of structure plans, economic
development strategies and local development frameworks.
It is also about the fear of over-capacity which dogs planners.
Competition requires over-capacity to work. It is additional capacity
which drives innovation and improvement as investors and operators
search for return. We can only get capacity spot on in a static world
– a world in which we know how many boots are required of what
colour and kind. A world in which preferences are known and
58 | Planning Curses
knowable. In fact all we know is that such a world does not work and
reduces not just the welfare but also the freedoms of its citizens.
At the same time, freedom is not unlimited. All markets and
developments require frameworks in which to act. Outer limits need
to be imposed but at a quite general level and should not be
frequently revised. A framework would set priorities for a local area
but need not be specific about sites or zoning. Individual proposals
would then only need to fit into the priorities. No longer would it
be necessary to argue whether the capacity of a site fulfilled a ‘need’
identified in an unreliable forecasting exercise. Rather projects could
respond to local desire – whether for high quality houses, for
regeneration, or for environmental improvements. This should lead
to fewer appeals and Inquiries, which are hugely expensive in
resources on all sides.
Allow local areas to keep local taxesNimbyism will always exist but can be minimised by allowing local
areas to hang on to the revenues raised by new development and
indeed potentially capturing more of them. The proposal to
implement Tax Increment Financing is a step in this direction in
allowing localities to borrow against future additional revenue to
implement the infrastructure which can make such revenues
possible. At present this is limited to capturing stamp duty and
business rates, but could be widened.
On residential property the inflexibility of council tax and the
political barriers to re-rating limit the scope to reflect the benefits of
improvements which raise house prices in local taxes. Instead these
have rested on specific negotiations to deliver community facilities,
schools, surgeries and so on. The links between development and the
provision of desirable facilities including their running costs needs
to be made much clearer to existing residents than they are now and
community decision making should also be encouraged.
How to Improve Things | 59
Increasing the degree of self help in which communities can
engage is a key element in the long-term reduction of public sector
dependency. A climate which understands that allowing investment
is essential to continued growth, and that the benefits can be shared,
is one in which innovation can flourish.16
This is both the riskiest and the most important recommendation.
It will need to be a direction of travel rather than a one-off change
and negotiating a successful path to devolution will be tricky.
Nevertheless it is at a local level and a city level that planning,
infrastructure and regeneration all come together. It is here that it
is sensible to make trade-offs between development, the revenues
gained and the infrastructure that can be paid for. It is here that the
case for some subsidy from other parts of the country can be made
on a case by case basis.
60 | Planning Curses
16 Some similar points about
the negative consequences of
current attitudes to new
development are made in: A
Morton, ‘Making Housing
Affordable: A new vision for
housing policy’, Policy
Exchange, 2010
5. Conclusion
Twenty years of experience in planning and infrastructure has
convinced me that the UK has a poor record in getting things going.
The models used to inform planning and infrastructure development
have failed to think about how the economy develops and is affected
by investment. It is often almost impossible to show how an
investment would improve the situation because so much is captured
by an underlying growth assumption. Because we always live in the
best of all possible worlds there is no need for further additional
investment to ensure that this growth actually materialises.
Investment then rests on a welfare analysis of the willingness to
pay more than you actually did rather than an analysis of the real
revenues and tax benefits that can be generated. In many countries,
transport investments are paid for with a mixture of fares paid by
passengers and the development of air rights above stations. In Hong
Kong for example, this has usually been sufficient to pay for
development of new lines – and fares there are not high. Where this
would be insufficient then it is the government’s right to make a
judgement about the additional cost which is not covered.
Such a decision then clearly becomes a political judgement and is
not part of the business case. The business case can be recognised as
such by private sector partners, while the government case can take
into account any other benefits that are important to it. These can
then escape the technocratic stranglehold and be seen and debated
for what they are. Thus it is quite clear what a normal business
responsibility is and what is not.
In the UK we pride ourselves on our capacity to set priorities in
a clear analytical framework. Unfortunately, only a few actually
understand how this framework operates or the weaknesses and
strengths of its assumptions. Its guardians tend to see themselves as
a priesthood of analysts but this means that actual decisions,
particularly when important, become dominated by political
considerations and the analysis becomes more like a set of
incantations.
Of course analysis is important, not to say crucial. It would be
much better if we concentrated analysis on those aspects which are
most amenable to such treatment. This means those where we are
clear about the assumptions and can present the risks most clearly. It
means downgrading analysis by mechanisms where we cannot
sensibly judge the correct assumptions – for example when we assess
the value of time.
Moreover, we should not expect criteria to be globally relevant.
For many projects, the financial return is very relevant and there may
well be a concentration on output generated and taxes that can be
used to pay back investment. But these do not have to be the only
criteria. What is important is that case by case we know why
investments are being made or planning frameworks set.
We will also know who is expected to benefit and why and
whether those who are funding the investment or seeing their village
expand will get the revenues and the benefits. This is the foundation
for good decision making.
62 | Planning Curses
Planning CursesHow to deliver long-term investment in infrastructure
Bridget Rosewell
£10.00ISBN: 978-1-906097-92-9
Policy ExchangeClutha House10 Storey’s GateLondon SW1P 3AY
www.policyexchange.org.uk
Policy Exchange
Planning Curses
Planning Curses examines the reasons why the
UK often fails so abysmally to deliver long term
investment in infrastructure. It explains how
expert analysis has become a substitute for real
understanding which has generated decisions made
by the politics of prejudice rather than rational
debate.
Economic forecasts underpin key decisions. But
these have low reliability. Worse, the values of
projects are presented in terms of theoretical costs
and benefits which are not only impossible for
participants to understand but are intellectually
dubious. The gains arise from the dynamic
transformation of economic possibilities and not
from the purely static confines of conventional
economic theory. The result is that short term
considerations become dominant and regulation
takes over from comprehension.
This report argues that to deliver better outcomes,
it is not enough to have yet another plan. Rather
more demanding and direct questions need to be
asked and there must be better engagement with
financial and business interests. A framework for
making decisions would be more use than a plan
based on hidden assumptions, unproven forecasts
and funny money.